
Architectural Simulation of Hybrid Energy Harvesting: A Design Experiment in Lanzarote Island


Department of Architecture, Gachon University, Seongnam-si 13120, Gyeonggi-do, Korea
Appl. Sci. 2021, 11(24), 12146; https://0-doi-org.brum.beds.ac.uk/10.3390/app112412146
Submission received: 17 November 2021
/
Revised: 14 December 2021
/
Accepted: 16 December 2021
/
Published: 20 December 2021
(This article belongs to the Special Issue New Type Solar Energy Materials and Devices)
Abstract
:This study conducts research on an architectural design based on energy harvesting technology. The research subject is a pergola-style structure to be built in a square in Arrecife, the Spanish territory of Lanzarote Island. The architectural design based on the energy harvesting technology developed in this research utilizes solar energy. To install a solar panel on the roof of the pergola, the optimal tilt angle from January to December was derived by using a function that considered the latitude and solar declination value of the study site, and the amount of renewable energy generation was calculated. The architectural design based on energy harvesting also utilizes wind power. To transform wind power into renewable energy, piezoelectric materials that trigger renewable energy with the micro-vibrations generated by wind power are applied to the architectural design. The amount of energy generation was calculated considering the wind power and wind direction in the location where the pergola should be built; in addition, this calculation used information from prior studies on piezoelectric materials. This article is significant, as it has developed an architectural design where hybrid energy harvesting technology that utilizes two types of natural energy (solar and wind) is applied to a building façade.
1. Introduction
According to the US Energy Information Administration statistics, architecture consumes 20.1% of the total energy consumption worldwide [1]. In particular, because an architectural structure, once built, lasts more than forty years, it consumes energy over a long period of time, and energy consumption increases over time due to problems such as building decay [2].
Thus, the field of architecture must not only seek a solution to reduce its energy consumption in the face of the serious problem of pollution but also actively respond to the generation of renewable energy. The UK, an active player in energy policy, provided an architectural model to maximize renewable energy generation with the completion of the BedZED (Beddington Zero Energy Development) energy-independent housing complex in Beddington, a town in south London, in 2002 [3]. Later, the UK government announced that, by 2050, all the energy needed in the UK will be replaced by renewable energy [4].
Renewable energy is generated with energy harvesting technology, which transforms natural energy sources into electric energy. Energy harvesting sources can be broadly categorized into two groups: The first group comprises macro-energy sources, which include wind, water, and solar energy. The second group comprises micro-energy sources, which include vibrations, magnetic fields, and waves [5,6]. Architecture relies largely on macro-energy sources to generate renewable energy, with solar energy being the best known. Even though solar energy harvesting technology is widely utilized, the amount of solar-generated electricity constitutes less than 0.4% of world electricity consumption [7]. Integrated energy harvesting technology should be developed through the diversification of natural energy sources to improve the currently low level of renewable energy generation.
In the field of architecture, a great deal of research has been carried out on renewable energy generation. Some research works have planned a joint residential complex and a college campus instead of a single building from an urban planning standpoint to maximize the production of renewable energy from solar energy [8,9,10,11]. These papers selected a specific site topic and analyzed the building layout for optimal installation of solar panels, the amount of renewable energy, and its economic feasibility. As for research on a single architectural structure, there is a study that applies the technology of energy harvesting to the exterior design of architecture [12]. By installing solar panels three-dimensionally onto the surface of a building, this technology not only produces renewable energy from the solar source but also from the fluid vibration generated from the solar panels [13,14]. This study is significant in that it proposes the micro-energy sources of tiny vibrations generated by the airflow as a source of renewable energy in a reality where the main sources of renewable energy in today’s architecture are solar and wind. In addition, microorganisms, such as algae, are used as micro-energy sources for elements of architectural design [15]. In addition, diverse technological development is also needed to extend energy harvesting technology, currently limited to macro-energy sources, such as solar and wind, to micro-energy sources. Currently, for research on the utilization of renewable energy generated from micro-energy sources in the field of architecture, active research is underway on architectural facilities associated with wireless heating, ventilation, and air conditioning (HVAC) in a building [16,17]. However, there is little research on architectural design based on energy harvesting technology utilizing micro-energy sources [18,19,20]. Therefore, this study aims to develop an architectural design that generates renewable energy using not only macro-energy sources but also micro-energy sources. Piezoelectric materials that generate renewable energy from micro-energy sources of tiny vibrations of wind power are used as an element of architectural design. Ultimately, this study aims to calculate the renewable energy yield that can be generated by the architectural design based on the hybrid energy harvesting technology developed via this process and to investigate the implications and application plans of the architectural design based on the hybrid energy harvesting technology for future architectural design.
2. Research Scope and Subjects
The object of this study is Lanzarote Dynamic Square located in the city of Arrecife (28.9° N, 13.4° E, UTC+1), the capital of the Spanish territory of Lanzarote island (this research subject is a project with which the researcher has won the Honorable Mention at the Lanzarote Dynamic Square Architecture Competition hosted by Cabildo de Lanzarote in 2018 [21]). The location of the research object to be installed in the square is currently used as a parking lot, and the goal is to create a versatile space where residents can freely entertain themselves. The research object has the shape of a square with a side width of 38 m. There is a four-story building to the south of the research object, a three-story building to the east, and a three-story and a one-story building to the north (Figure 1). Notably, there are roads on all sides of the study object, except for the east side, so it has excellent accessibility. In the year of 2020, Lanzarote Island had the lowest temperature of 14 °C in January and the highest temperature of 24 °C in August.
The average annual temperature is 20 °C. The average annual rainfall is 16.25 mm, with the precipitation in October, November, and December constituting 40% of the total annual precipitation. The average annual wind speed is 6.6 m−1·s−1 [22]. An analysis of the climate shows that the research area, surrounded by the North Atlantic and under the influence of the oceanic climate, tends to have warm temperatures, low precipitation, and high wind speeds throughout the year.
In recognition of the value of the magnificent natural environments of the island of Lanzarote, it was registered as a World Heritage Site in 1993 by UNESCO. This study aims to plan a green building design for future Lanzarote Dynamic Squares to preserve the excellent natural environments of Lanzarote Island. Specifically, a green building design applies energy harvesting technology to architectural design to generate renewable energy. This study attempts to create a new, future-oriented concept of a place. Since the energy consumption of buildings accounts for 40% of the total energy consumption, it is a legal requirement in the European Union to reduce the energy consumption of architectural structures and to generate renewable energy with these buildings [23]. In that sense, this study, which develops an architectural design based on the generation of renewable energy in Europe, is a very timely piece for the reality of architecture in many European countries, where buildings consume a high energy level.
3. Design Concept
3.1. Plan of Open Space with Good Accessibility to the Square
The main purpose of Lanzarote Dynamic Square is to be a communal space where citizens can freely take a rest. With the ultimate goal being to plan a space where all citizens can freely gather around, this square design has the following specific concepts: First, the square has to be an open square that induces free accessibility. There are buildings only to the north of this place; easy accessibility is available to pedestrians from the south, west, and north of the location with open roads. The ease of access from around the site must be naturally connected to the site itself, and it was designed so that the new building being constructed on the site would be organically connected to the surrounding traffic. This architectural intention is reflected in the construction plan of the building to be built on the square. Thus, 300 mm high piers are provided instead of a masonry structure (Figure 2). A plaza without a wall separating the site’s surroundings will naturally direct traffic to the plaza from all directions except the north, providing an open space for citizens moving between the building’s columns. In addition, as an open space, the square fits well with the climate of the island of Lanzarote, which is warm all year round, and will be a space that any citizen can freely use at any time. Second, the beautiful natural landscape of the island of Lanzarote is reflected in the architectural design. The square must play the role of a refuge, where people can come at any time to take a break. In particular, the users of the square must be protected from rain, wind, and sunlight, so it must have a roof. The new building to be erected in the square is designed as a pergola, with a roof placed over the pillars that generate traffic. The clouds above Lanzarote Island inspire the roof of the pergola. The cloud-shaped roof that hovers over the square not only plays a functional role but also becomes a landmark symbolizing Lanzarote Dynamic Square (Figure 3).
3.2. Plan of Energy Self-Sufficient Architecture
In the design of a new future space, different from the existing common spaces, this study considers the energy consumption in the architectural space. As mentioned in the Introduction, nowadays, in architecture, due to serious environmental problems, it is obligatory to reduce energy consumption and to produce renewable energy again. However, there is the limitation that more commercialization is needed for the currently limited renewable energy technology in architecture, and, as of now, renewable energy technology is not widely applicable to architectural design. Therefore, the present study aims to plan an energy self-sufficient community space with Lanzarote Dynamic Squares, and the detailed planning objectives are as follows: First, to diversify renewable energy sources to increase the energy self-sufficiency of the structure to be built in the square. This study aims to utilize micro-energy sources, such as the tiny vibrations of wind, in addition to macro-energy sources, such as solar energy, which are commonly used to generate renewable energy. Second, this study develops an architectural design based on energy harvesting technology. It attempts to go beyond using solar and wind from the roof of a building as renewable energy sources and proposes an architectural design that uses energy harvesting technology from the surface of a building. An architectural design with energy harvesting technology proposes a creative model for architectural design. With the increase in buildings with more creative and diverse architectural designs, the original urban space would undergo a lot of changes, resulting in a novel urban landscape.
4. Design Development
4.1. Architectural Design Based on Energy Harvesting Technology with Macro-Energy Sources
The public architectural structure to be installed in the research subject of this study is a pergola with a square-shaped roof. A pergola with a minimal structure that can keep out direct sunlight and rainfall was designed for the architectural structure that forms the space to allow easy access to the research subject and easy mobility of citizens in the space. The location with the low-roofed pergola and low buildings creates optimal conditions for the generation of renewable energy through solar energy. This study takes advantage of such a location and the shape of the building to install solar panels on the roof of the pergola to generate renewable energy (Figure 4). The width of the panels is 1.5 m and the length is 1 m. The basic module of 5 m × 2.5 m on the ground of the square is equipped with six panels, and a maximum of 504 panels are installed on the roof, which is equivalent to 1050 m−2. When installing solar panels on the roof of the pergola, it is important to avoid shadow interference between the solar panels. To achieve this, this study analyzes the meridian height of Lanzarote in 2018 and installs the solar panels considering that the average meridian height in July and December, when it is the highest and the lowest in the year, is 85° and 39°, respectively [24]. As a result, the rays of the sun directly reach the solar panels throughout the year. Assuming that a certain level of sunlight reaches the solar panels without any shadow interference on the roof of the building, this study, first, analyzes the shadow interference generated by the surrounding buildings, which affects the solar panels installed on the roof of the pergola, and, second, analyzes the optimal tilt angle of the solar panels tilted from the surface of the roof when installed to maximize the solar energy generation.
4.1.1. Analysis of Shadow Inference Generated by the Buildings Surrounding Lanzarote Dynamic Square
South of Lanzarote Dynamic Square stand a three-story building and a four-story building. The pergola roof, designed to protect the square, is 9 m above the ground and was designed to create an open space within the pergola, giving the effect of a floating roof. In order to apply solar energy harvesting technology, a shadow analysis was performed using Sketchup Pro 2018 software to learn what disturbance would be caused by the shadows of the surrounding buildings when solar panels were installed on the pergola roof [25]. The shadow simulation was performed for January, when the solar altitude is lowest in Lanzarote (28.9° N, 13.4° E, UTC+1). Figure 5, a simulated image of the shadow of the buildings from 9 a.m. to 3 p.m. on January 1, shows that when the roof is 9 m above the ground, it is not affected by the shadow of the surrounding buildings. We decided to cover the entire pergola roof with solar panels to maximize solar energy generation, as the shadow simulation revealed that the pergola roof will be exposed to sunlight all year around.
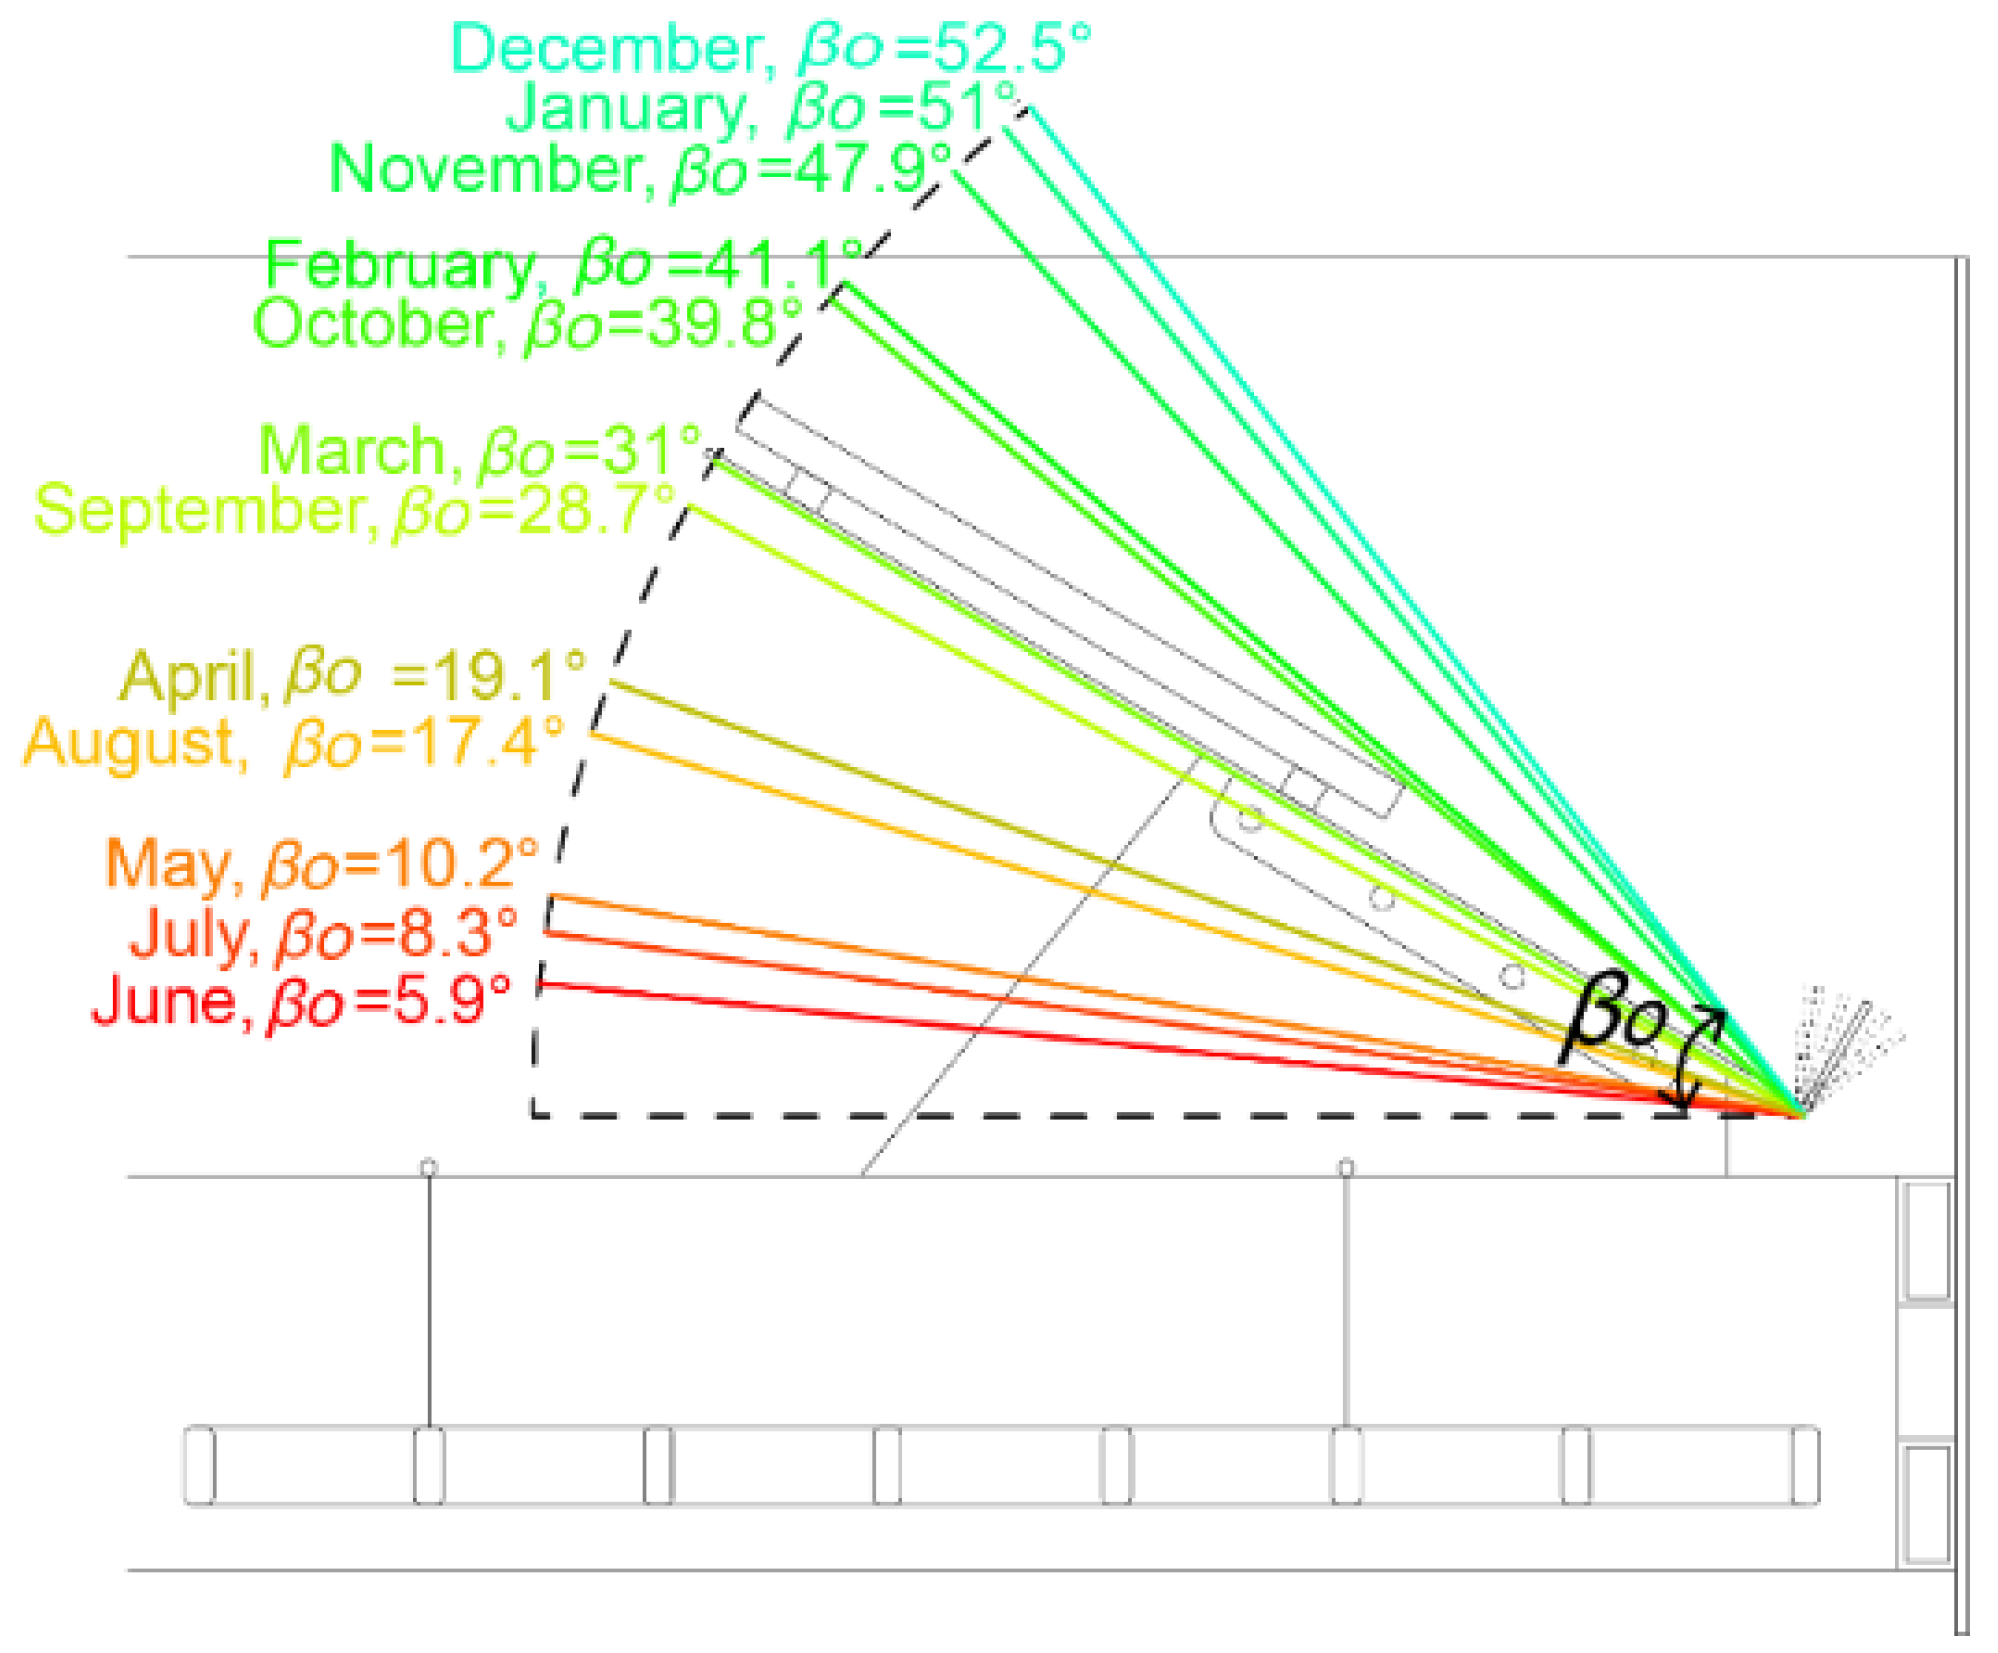
4.1.2. Optimal Tilt Angle (βo) Setting for the Installation of Solar Panels
To improve the efficiency of solar energy, it is important to maintain a certain angle between the solar panel and the ground surface. The angle that allows the maximum efficiency of energy production of a solar module varies depending on the location and the time of the installation of the module [26]. This study applies a function that yields the optimal tilt angle of a solar panel using the latitude of the research subject and the solar declination to calculate the optimal tilt angle (βo) of the solar panels to be installed in the research subject location in Lanzarote (Equation (1)) [27].
βo = a1 + a2φ
In Equation (1), βo is the optimal tilt angle; φ is the latitude of the research subject, Lanzarote (28.9° N); and a1 and a2 are the coefficients generated from the solar declination, the precise figures of which can be found in Table 1. As such, when solar panels are installed according to the optimal tilt angle (βo) from January to December, the generation efficiency of the solar panels is at its maximum point.
4.1.3. Calculation of Generation of Solar Energy According to the Optimal Tilt Angle (βo)
Solar energy generation is calculated with Revit 2019 and its plug-in program, Insight by Autodesk [28,29]. Revit is representative software of Building Information Modeling (BIM), digital software in the field of architecture. Revit can be implemented in a three-dimensional virtual architecture under various environmental conditions, so it is used especially for green building design in the field of architecture [30,31,32,33]. Figure 6 is an example where the annual solar energy generation of 1254 Wh was calculated using Insight, assuming a prototype of 1.5 m−2 solar panels and a tilt angle of 51° using Revit software.
For the solar panel model, the Hanwha Q. CELLS’ Q.PEAK.DUO L–G7.4 390-405 model was chosen (Table 2). The reason is that the Hanwha Q. CELLS’ Q.PEAK.DUO model occupies the first place in the US residential and commercial building sector in 2020 [34]; thus, the product performance was judged to be excellent. In addition, this model has the advantage of its size (2.0 m × 1.0 m), is suitable for the production of the solar panel module of this study, and has strong power generation efficiency (20.3%) and capacity (390–405 Wp).
The 35 m × 30 m pergola roof to be installed in Lanzarote Dynamic Square with a total of 504 solar panels (1 m × 1.5 m module) is simulated in three dimensions using the Revit software. Then, to maximize solar energy generation, the optimal tilt angle (βo) value from January to December is applied to the Insight software to generate the monthly solar energy generation (Figure 7).
Table 3 shows the optimal tilt angle (βo) from January to December and the monthly generation amount of solar energy according to the optimal tilt angle (βo). In a year, the solar energy generation is the highest in May at 140,935 kWh·m−2; in January, a total of 53,200 kWh·m−2 solar energy is generated, which is the lowest recording of the year. Eventually, a total of 504 (756 m−2) solar panels to be installed on the pergola roof at the research subject location will be able to generate 1,150,198 kWh energy in a year.
In this study, the optimal tilt angle (βo) for the solar panels to be installed on the pergola roof from January to December was determined to maximize the generation of solar energy by the solar panels in Lanzarote, and the annual generation of solar energy corresponding to the optimal tilt angle (βo) of the solar panels was calculated. Figure 8 explains a system where the solar modules were flexibly installed according to the optimal tilt angle (βo) for each month from January to December. This research methodology could resolve the limitations of the existing buildings, in which solar panels are fixed on the roof or another surface at a particular angle, such that energy generation cannot be maximized. In addition, a flexible solar panel installation system allows for an installation on the building surface. It can be used to develop a green building design based on the generation of renewable energy.
4.2. Architectural Design Based on Energy Harvesting Using Micro-Energy Sources
The definition of micro-energy generation technology, which generates renewable energy from micro-energy sources, is broken down by the amount of electricity generated and the unit of renewable energy generated in microwatts (µW). Furthermore, the meaning of ‘micro’ is not limited to the unit of electricity. It means the size of the electricity production facility: the size of micro-energy harvesters is measured in the unit of millimeters or centimeters [35]. This study selects, among the various micro-energy sources, the tiny vibrations of wind as a source of renewable energy. This is because, firstly, this study aims to develop an architectural design that utilizes piezoelectric materials, which convert minute vibrations into energy [36]. Secondly, the wind power in Lanzarote is sufficient to generate renewable energy. A small-sized wind turbine, a typical energy harvesting facility based on wind, requires a minimum of 3 m−1·s−1 cut-in speed to operate [37]. An analysis of wind resources in the research subject location shows that the average wind speed in 2020 in Lanzarote was 6.5 m−1·s−1, which is sufficient to generate wind-based renewable energy. Moreover, an analysis of the wind direction in the study location shows that the dominant wind direction tends to be north east (NE) and north–northeast (NNE) from January to December (Table 4).
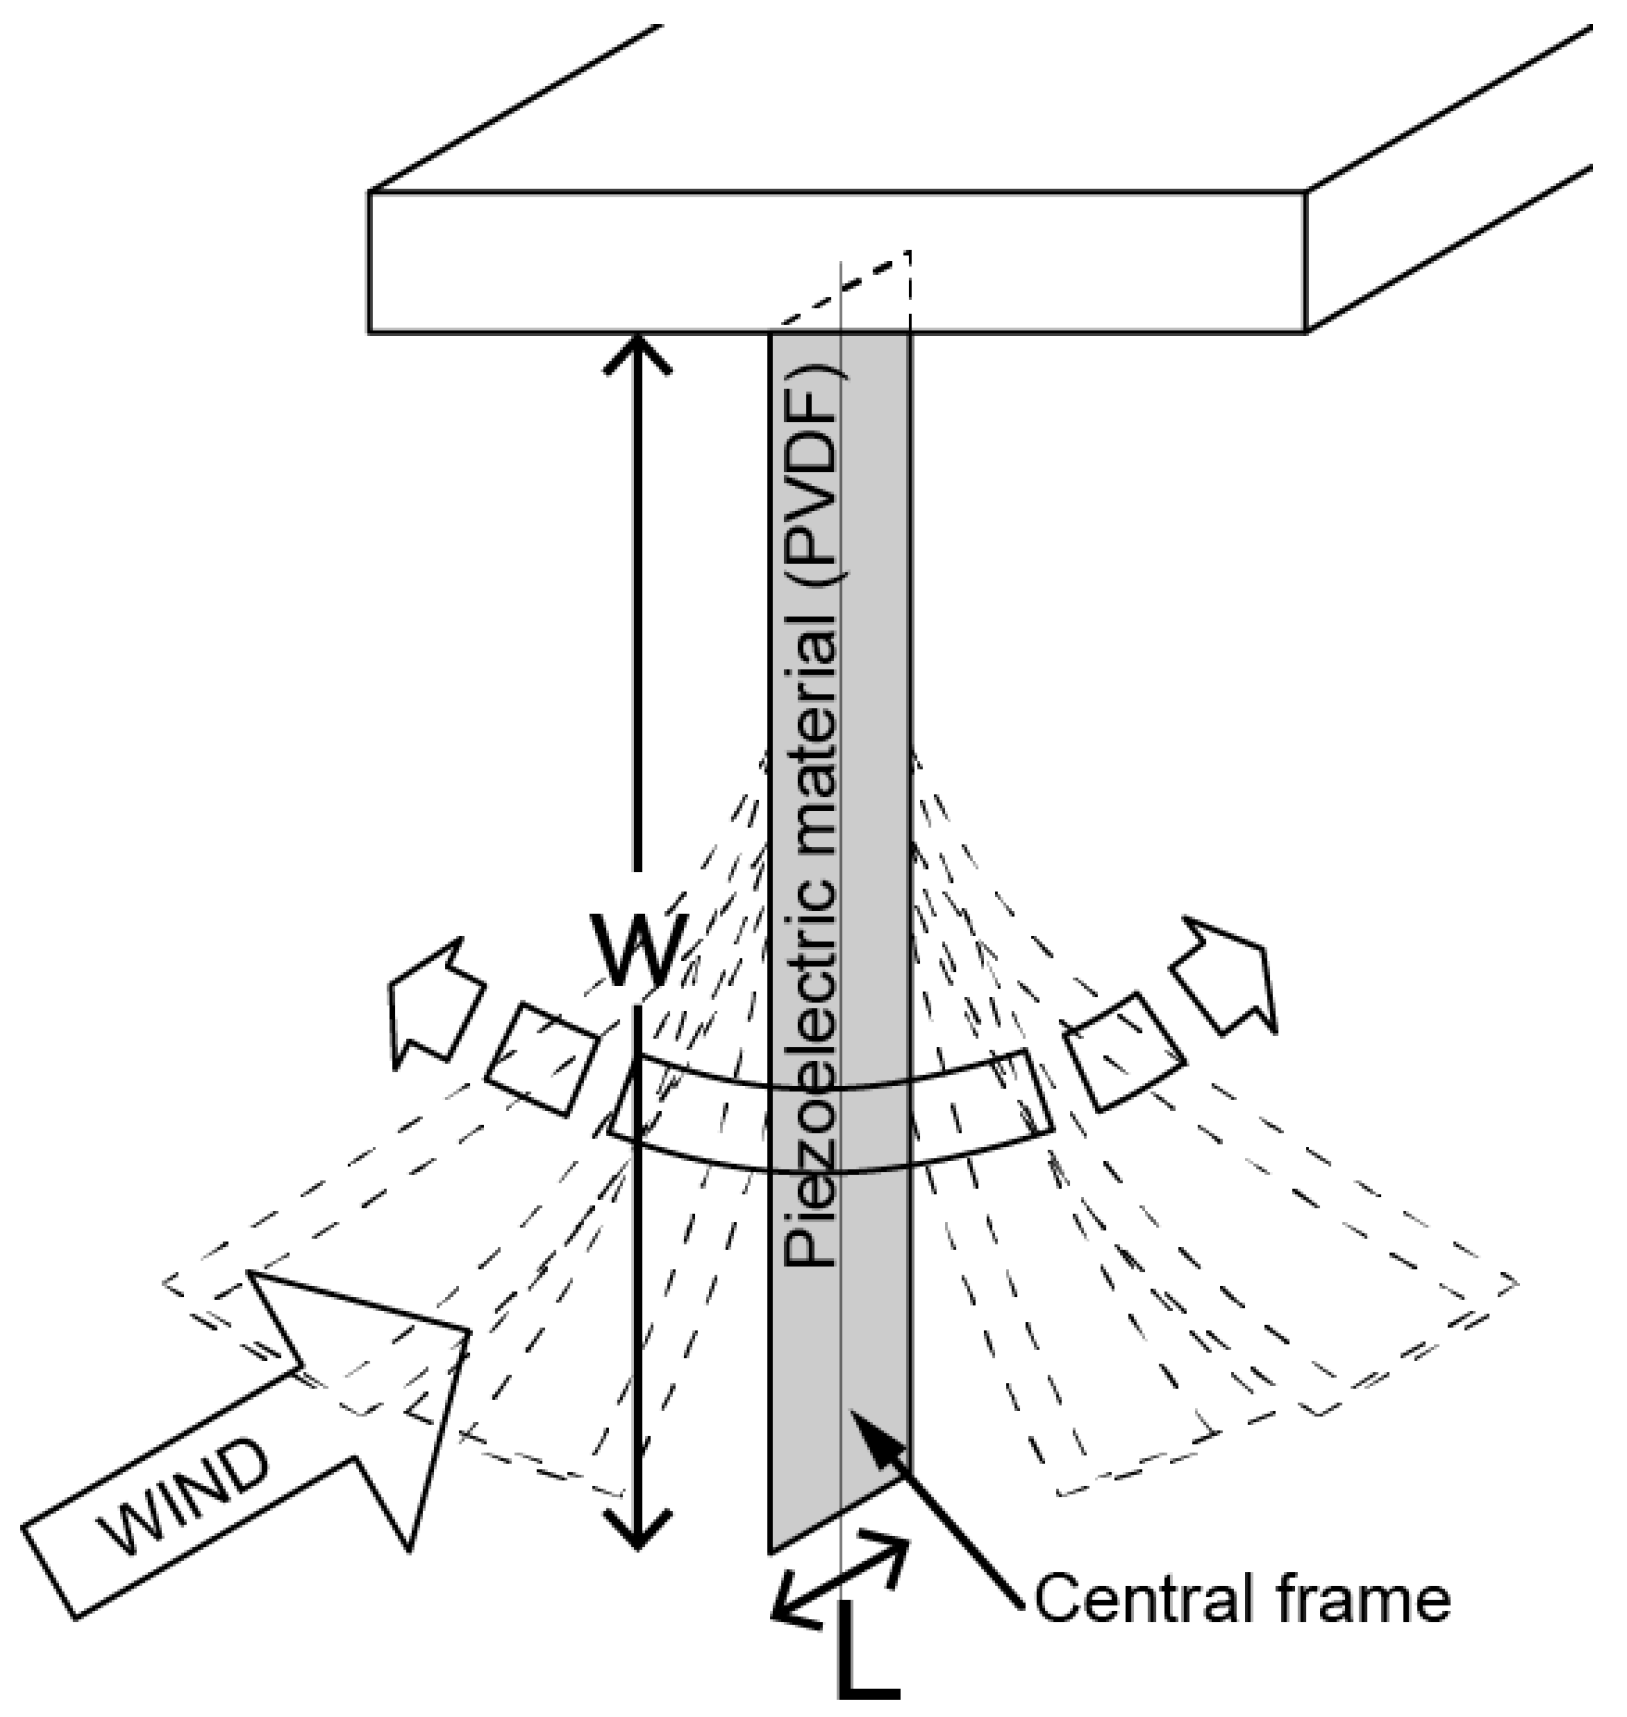
There are prior studies related to this study that use wind as a source to produce renewable energy and utilize piezoelectric materials. Studies on the relationship between piezoelectric materials and wind direction focused on optimizing the energy generation efficiency of wind when installing piezoelectric materials. It has been found that to maximize the energy production of piezoelectric materials, it is optimal to install them so that they are perpendicular to the wind direction. The purpose of such an installation plan for piezoelectric materials is to maximize the vibrations generated by wind to the piezoelectric materials, thereby maximizing energy generation [38]. Research has also been carried out on the development of fans that rotate by the wind and on the installation of piezoelectric materials on the blades of these fans [39]. Piezoelectric materials are placed on the blades of the fans. In order to measure the energy generation as a function of wind strength, three piezoelectric materials (PVDF, polyvinylidene fluoride) with a length of 30 mm, a width of 12.5 mm, and a thickness of 0.02 mm are placed on three separate blades. They are made to rotate by a certain level of wind power. As a result, when wind power of 14 m−1·s−1 is applied, the rotation of the fan blade produces a maximum of 2566.4 µW output power. When a higher level of wind power is applied, the output power drops precipitously [40]. Research has been conducted on the creation of piezoelectric flags. Piezoelectric flags are created with the size of piezoelectric materials (LDT4-028 K/L) limited to 60 mm, 75 mm, and 100 mm on each side and with the ratio between the width and the length (W−1·L−1) set to 2, 1.5, 1, and 0.5. Each piezoelectric flag created is measured for the amount of energy produced at varying wind speeds. As a result, when a piezoelectric material is 60 mm long, 120 mm wide, and 0.2 mm thick, that is, when the ratio between the width and the length (W−1·L−1) is 2, the energy generation efficiency is the highest. Energy is created from the point where the wind speed is 4.2 m−1·s−1, and when the maximum wind speed is at 9 m−1·s−1, 5 µW·cm−3 energy is generated [41]. Prior studies showed that when installing piezoelectric materials to convert minute vibrations created by wind power to renewable energy, one should design piezoelectric materials such that the width is longer than the length, and they must be installed in a way that is perpendicular to the wind direction (Figure 9).
4.2.1. Wind Direction Analysis of the Research Subject Location, Lanzarote Dynamic Square
To install piezoelectric materials on the pergola on Lanzarote Dynamic Square, it is important to analyze the wind direction of the site. According to prior studies, piezoelectric materials must be installed in a manner that is perpendicular to the wind direction to maximize energy generation efficiency. Figure 10 is a visualization of the average annual wind direction and wind speed of the study area using Autodesk’s Formit [42], wind direction and speed analysis software. The analysis of the average annual wind direction shows that the predominant wind direction at this site is north–northeast (NNE), north (N), and northeast (NE), in that order. According to this analysis of wind direction and wind speed, the piezoelectric materials to be installed on the pergola on Lanzarote Dynamic Squares must run in their longitudinal direction from south to north and cover the entire pergola roof.
4.2.2. Installation Plan for Piezoelectric Materials (PVDF, Polyvinylidene Fluoride)
The piezoelectric materials (PVDF, polyvinylidene fluoride) to be installed on the pergola are of the model LDT4-028 K/L [43]. This model is a multi-purpose, piezoelectric sensor for detecting physical phenomena, such as vibrations and impact. The piezo film produces a useable electrical signal output when forces are applied to the sensing area. For installation on the pergola, the piezoelectric materials (LDT4-028 K/L) are 60 mm long, 120 mm wide, and 0.2 mm thick and are installed under the roof of the pergola. The width of the PVDF is based on the prevailing wind direction of the study site, which is north–northeast (NNE) and north (N), and the distance between the PVDFs is 0.25 m to account for their radius of motion so that they do not bump into each other when vibrated by the wind. The basic module of a pergola roof (2.5 m × 2.5 m) can fit a total of ten PVDFs (one prototype volume = 0.144 cm−3); therefore, 168 modules (14 × 12) constituting the pergola roof fit a total of 1680 (241.92 cm−3) PVDFs (Figure 11).
4.2.3. Measuring Energy Generation by Vibration of PVDF Driven by Wind
The wind speed in 2020 at Lanzarote Dynamic Square was the highest in July at 8.6 m−1·s−1 and the lowest in November at 5.3 m−1·s−1. One prototype of PVDF (LDT4-028 K/L) is installed under the pergola roof at the research subject location. The energy generated by the wind-induced vibration of the PVDFs from January to December is derived from the research results of the wind simulation [41] (Table 5).
At the research location, the annual energy amount generated by one prototype of PVDF (LDT4-028 K/L) is 27.8 µW·cm−3·year−1, adding all energy amounts generated by different wind speeds from January to December. A total of 1680 (241.92 cm−3) PVDFs have been planned under the roof of the planned pergola; therefore, it is estimated that an annual total of 6725.376 µW·year−1 energy will be produced from all piezoelectric materials. As the expected image of the pergola in Figure 12 shows, the PVDFs installed under the pergola roof will move with the wind, simulating a cloud; thus, they are a design element that creates the effect of a floating pergola roof.
5. Results and Discussion
This study develops an energy self-sufficient architectural design for a building that will be built in Arrecife, the capital of the Spanish territory of Lanzarote Island, to create a square design. In order to improve the energy self-sufficiency of the building, energy harvesting technology, which generates energy from natural energy sources, is used in the architecture.
The architectural design based on energy harvesting technology developed in this study primarily uses solar energy-based energy harvesting. To harvest energy from sunlight, solar panels are installed on the roof of the pergola. In order to improve the efficiency of the solar modules in energy harvesting, they are installed at a certain tilt angle to the roof surface. In this study, the optimal tilt angle is calculated for each month from January to December. A function that takes into account the latitude of the location of the research subject and the declination of the sun is used to select an installation angle for the solar panels. Measuring all solar panels on the pergola roof to which each optimal tilt angle calculated is applied using Revit and Insight for the total renewable energy produced yields the result that a total of 504 (756 m−2) solar panels could generate a total of 1,150,198 kWh·year−1 energy. Furthermore, this study develops an architectural design based on wind energy. To convert wind into renewable energy, this study uses piezoelectric materials to convert tiny vibrations caused by the wind into renewable energy. This study analyzes the monthly wind speed and direction at the study site from January to December to collect data on wind resources at the study site. Then, this study analyzes previous studies on piezoelectric materials that convert tiny vibrations caused by the wind into renewable energy. Based on prior studies, this study decides the wind direction and the location selection when it comes to the form of the piezoelectric materials and their installation. As a result, when a total of 1680 (241.92 cm−3) prototypes of piezoelectric materials (LDT4-028 K/L), which are each 60 mm long, 120 mm wide, and 0.2 mm thick, are installed under the pergola roof, an annual total of 6725.376 µW·year−1 energy is expected to be generated by the wind power at the research subject location.
This study is significant, as the architectural design proposed here based on energy production is a hybrid technology that uses two natural energy sources: the sun and wind. Energy harvesting technology has been used as an important element in architectural design. Solar panels flexibly installed according to the optimal monthly tilt angle to maximize solar energy harvesting and piezoelectric materials installed on the building surface to harvest energy from wind can be used as important elements in green building design. Such hybrid energy harvesting technology applied to building surfaces can play an important role in the development of diverse and creative architectural design and can promote active research on architectural materials that aim to generate renewable energy from the perspective of green building design.
The flexible solar panel mounting system is attached to building façades, unlike traditional fixed solar panels, and can play an important role in developing diverse and creative architectural designs. Moreover, in the case of piezoelectric materials, it can stimulate active research in the field of building materials for building façade design. Therefore, this study on hybrid energy harvesting technology is of great significance, as it is different from previous studies that focus on energy harvesting with a single energy source. Unlike existing green building design, this study’s novelty lies in the possibility of using a kinetic roof and piezoelectric materials. However, this study did not assess the final electricity production of renewable energy generation and its economic feasibility. This aspect will need to be further investigated in collaboration with electric energy engineers. In addition, computer science engineers should be involved to implement the kinetic roof.
The electricity produced in this study will be used for lighting around Pagoda Square, giving direct benefits to citizens, and will also be used to supply power to the kinetic roof.
6. Conclusions
This study combined hybrid energy harvesting technology and architectural design through the use of solar panels and piezoelectric materials. First, the energy harvesting technology using solar energy is of significance, as it maximized the production efficiency of renewable energy by proposing a flexible solar panel corresponding to the optimal tilt angle every month. In addition, a flexible solar panel system is a kinetic element of an architectural elevation; it can be developed into a creative architectural design that is different from the existing fixed architectural elevation. Second, in this study, piezoelectric material was applied to the building façade to use micro-wind power as an energy source. Since this piezoelectric material not only produces renewable energy but is also used as an element of building design, it can inspire creative architectural design and guide further studies in the field of building materials.
Funding
This research was supported by the Basic Science Research Program through the National Research Foundation of Korea (NRF) and funded by the Ministry of Education, grant number NRF-2018R1D1A1B07045279.
Institutional Review Board Statement
Not applicable.
Informed Consent Statement
Not applicable.
Acknowledgments
This work was supported by the Gachon University research fund of 2020(GCU-202008470009).
Conflicts of Interest
The author declares no conflict of interest.
References
- U.S. Energy Information Administration, International Energy Outlook. 2016. Available online: https://www.eia.gov/outlooks/ieo/pdf/0484(2016).pdf (accessed on 24 May 2021).
- Smith, I.F.C. Intelligent Computing in Engineering and Architecture; Springer: Berlin/Heidelberg, Germany, 2006; p. 566. [Google Scholar]
- Chance, T. Towards sustainable residential communities; the Beddington Zero Energy Development (BedZED) and beyond. Environ. Urban. 2009, 21, 527–543. [Google Scholar] [CrossRef]
- The Secretary of State for Business, Energy and Industrial Strategy; Command of Her Majesty. In The Energy White Paper, Powering Our Net Zero Future; GM Government: London, UK, 2020; p. 9.
- Harb, A. Energy harvesting: State-of-the art. Renew. Energy 2011, 36, 2641–2654. [Google Scholar] [CrossRef]
- Elvin, N.; Erturk, A. Advances in Energy Harvesting Methods; Springer: New York, NY, USA, 2013; pp. 3–4. [Google Scholar]
- Smith, C.L. The energy challenge. Appl. Petrochem. Res. 2012, 2, 3–6. [Google Scholar] [CrossRef] [Green Version]
- Kim, S.Y.; Choi, H.S.; Eum, J.H. Energy-Independent Architectural Models for Residential Complex Plans through Solar Energy in Daegu Metropolitan City, South Korea. Sustainability 2018, 10, 482. [Google Scholar] [CrossRef] [Green Version]
- Mohammad, I.A.; Saad, S.A. Design of a solar photovoltaic system to cover the electricity demand for the faculty of Engineering- Mu’tah University in Jordan. Resour.-Effic. Technol. 2017, 3, 440–445. [Google Scholar] [CrossRef] [Green Version]
- Reinberg, G.W. Architecture for a Solar Future; Birkhauser: Basel, Switzerland, 2021; pp. 160–163. [Google Scholar]
- Kanters, J.; Horvat, M. Solar energy as a design parameter in urban planning. Energy Procedia 2012, 30, 1143–1152. [Google Scholar] [CrossRef] [Green Version]
- De Luca, F.; Dogan, T. A novel solar envelope method based on solar ordinances for urban planning. Build. Simul. 2019, 12, 817–834. [Google Scholar] [CrossRef]
- Zeadally, S.; Shaikh, F.K.; Talpur, A.; Sheng, Q.Z. Design architectures for energy harvesting in the Internet of Things. Renew. Sust. Energy Rev. 2020, 128, 109901. [Google Scholar] [CrossRef]
- Cimmino, M.C.; Miranda, R.; Sicignano, E.; Ferreira, A.J.M.; Skelton, R.E.; Fraternali, F. Composite solar façades and wind generators with tensegrity architecture. Compos. Part B 2017, 115, 275–281. [Google Scholar] [CrossRef]
- Worldwide First Façade System to Cultivate Micro-Algae to Generate Heat and Biomass as Renewable Energy Sources. Available online: https://www.arup.com/projects/solar-leaf (accessed on 16 November 2021).
- Zhou, X.; Zhang, R.; Ho, C.K. Wireless Information and Power Transfer: Architecture Design and Rate-Energy Tradeoff. IEEE Trans. Commun. 2013, 61, 4754–4767. [Google Scholar] [CrossRef] [Green Version]
- Kim, H.J.; Jin, G.N.; Park, J.Y.; Kang, M.S.; Noh, M.H. A Basic and Practical Use Study on the Energy Harvesting Technology to Apply in Housing & Urban Structures (2); Korea Land & Housing Corporation: Daejeon, Korea, 2014; pp. 1–88. [Google Scholar]
- Jayathissa, P.; Luzzatto, M.; Schmidli, J.; Hofer, J. Optimising building net energy demand with dynamic BIPV shading. Appl. Energy 2017, 202, 726–735. [Google Scholar] [CrossRef]
- High Performance Low Emissions. Available online: https://www.empa.ch/web/nest/hilo-opening (accessed on 16 November 2021).
- Solaripedia. Available online: https://www.solaripedia.com/13/285/solar_ivy_uses_pvs_and_piezoelectrics.html (accessed on 16 November 2021).
- Lanzarote Dynamic Square. Available online: https://rethinkingcompetitions.com/previous-competitions/015-lanzarote-dynamic-square (accessed on 25 May 2021).
- World Weather Online. 2020. Available online: https://www.worldweatheronline.com/lanzarote-weather-averages/canarias/es.aspx (accessed on 20 May 2021).
- The European Parliament and the Council of the European Union. Directive 2010/31/EU of the European Parliament and of the Council of 19 May 2010 on the Energy Performance of Buildings; Official Journal of the European Union: Brussels, Belgium, 2010; p. 13.
- Time and Date. 2018. Available online: https://www.timeanddate.com/sun/spain/arrecife?month=7&year=2018 (accessed on 20 May 2021).
- Sketchup Pro 2018 Building Performance Analysis Software. Available online: https://www.sketchup.com/products/sketchup-for-web (accessed on 10 May 2021).
- Gaur, A.; Tiwari, G.N. Performance of Photovoltaic Modules of Different Solar Cells. J. Sol. Energy 2013, 2013, 734581. [Google Scholar] [CrossRef]
- Calabrò, E. An algorithm to determine the optimum tilt angle of a solar panel from global horizontal solar radiation. J. Renew. Energy 2013, 2013, 307547. [Google Scholar] [CrossRef] [Green Version]
- Revit Software. Available online: https://www.autodesk.com/products/revit/overview?plc=RVT&term=1-YEAR&support=ADVANCED&quantity=1 (accessed on 22 June 2021).
- Insight Software. Available online: https://www.autodesk.com/products/insight/overview (accessed on 22 June 2021).
- Bott, H.; Grassl, G.C.; Anders, S. Sustainable Urban Planning; Edition Detail: Munich, Germany, 2019; pp. 200–217. [Google Scholar]
- Bu, S.; Shen, G.; Anumba, C.J.; Wong, A.K.D.; Liang, X. Literature review of green retrofit design for commercial buildings with BIM implication. Smart Sustain. Built Environ. 2014, 4, 188–208. [Google Scholar] [CrossRef]
- Utkucu, D.; Sözer, H. Interoperability and data exchange within BIM platform to evaluate building energy performance and indoor comfort. Autom. Constr. 2020, 116, 103225. [Google Scholar] [CrossRef]
- Mahiwal, S.G.; Bhoi, M.K.; Bhatt, N. Evaluation of energy use intensity (EUI) and energy cost of commercial building in India using BIM technology. Asian J. Civ. Eng. 2021, 22, 877–894. [Google Scholar] [CrossRef]
- Hanwha Q CELLS’. Available online: https://www.hanwha.com/en/news_and_media/press_release/hanwha-q-cells-maintains-no-one-market-share-in-us-residential-and-commercial-solar-sectors.html (accessed on 16 November 2021).
- Briand, D.; Yeatman, E.; Roundy, S. Micro Energy Harvesting; Wiley-VCH Verlag GmbH & Co. KGaA: Weinheim, Germany, 2015; pp. 1–5. [Google Scholar]
- Safaei, M.; Sodano, H.A.; Anton, S.R. A review of energy harvesting using piezoelectric materials: State-of-the-art a decade later (2008–2018). Smart Mater. Struct. 2019, 28, 113001. [Google Scholar] [CrossRef]
- Park, Y.H.; Park, J.H.; Park, J.C.; Rhee, E.K. A Study on the Application of Small Wind Turbine System in Super High-rise Building. Korean J. Air-Cond. Refrig. Eng. 2013, 25, 188–189. [Google Scholar] [CrossRef] [Green Version]
- Li, S.; Yuan, J.; Lipson, H. Ambient wind energy harvesting using cross-flow fluttering. J. Appl. Phys. 2011, 109, 026104. [Google Scholar] [CrossRef] [Green Version]
- Rezaei-Hosseinabadi, N.; Tabesh, A.; Dehghani, R.; Aghili, A. An Efficient Piezoelectric Windmill Topology for Energy Harvesting from Low-Speed Air Flows. IEEE Trans. Ind. Electron. 2015, 62, 3576–3583. [Google Scholar] [CrossRef]
- Zhang, J.; Fang, Z.; Shu, C.; Zhang, J.; Zhang, Q.; Li, C. A rotational piezoelectric energy harvester for efficient wind energy harvesting. Sens. Actuators A 2017, 262, 123–129. [Google Scholar] [CrossRef]
- Orrego, S.; Shoele, K.; Ruas, A.; Doran, K.; Caggiano, B.; Mittal, R.; Kang, S.H. Harvesting ambient wind energy with an inverted piezoelectric flag. Appl. Energy 2017, 194, 212–222. [Google Scholar] [CrossRef]
- Formit Software. Available online: https://app.formit.autodesk.com/ (accessed on 30 June 2021).
- TE Connectivity. Available online: https://www.te.com/commerce/DocumentDelivery/DDEController?Action=srchrtrv&DocNm=LDT_with_Riveted_Leads&DocType=DS&DocLang=English (accessed on 16 November 2021).
Figure 1.
Surroundings of the research subject and its physical size.

Figure 2.
Concept image and roof plan of Lanzarote Dynamic Square.

Figure 3.
Square roof design, which symbolizes the clouds around Lanzarote Island.

Figure 4.
Conceptual diagram of solar panels to be installed on the roof of the pergola.

Figure 5.
Shadow analysis conducted on 1 January on a 9 m pergola structure to be built on the research subject location (28.9° N, 13.4° E, UTC+1).
Figure 5.
Shadow analysis conducted on 1 January on a 9 m pergola structure to be built on the research subject location (28.9° N, 13.4° E, UTC+1).

Figure 6.
An example of measuring solar energy using Revit and Insight, a plug-in software.

Figure 7.
An example of measurement of solar energy generation in June using Revit and plug-in software, Insight.
Figure 7.
An example of measurement of solar energy generation in June using Revit and plug-in software, Insight.

Figure 8.
Flexible installation system according to the optimal tilt angle (βo) of solar panels from January to December, maximizing the solar energy generation.
Figure 8.
Flexible installation system according to the optimal tilt angle (βo) of solar panels from January to December, maximizing the solar energy generation.

Figure 9.
Piezoelectric material (PVDF) installation conceptual diagram.

Figure 10.
Average annual wind direction and wind rose of the research subject location.

Figure 11.
Installation plan of piezoelectric materials to be installed under the roof of the pergola at Lanzarote Dynamic Square.
Figure 11.
Installation plan of piezoelectric materials to be installed under the roof of the pergola at Lanzarote Dynamic Square.

Figure 12.
The expected image of piezoelectric materials to be installed under the roof of the pergola at Lanzarote Dynamic Square.
Figure 12.
The expected image of piezoelectric materials to be installed under the roof of the pergola at Lanzarote Dynamic Square.


Table 1.
Coefficients (a1, a2) according to the solar declination and the optimal tilt angle (βo).
| N. | Month | Solar Declination (deg) | Coefficients | Optimal Tilt Angle (deg) βo | |
|---|---|---|---|---|---|
| a1 | a1 | ||||
| 1 | January | d1 = −21.269 | 31.33 | 0.68 | 51.0 |
| 2 | February | d2 = −13.289 | 16.25 | 0.86 | 41.1 |
| 3 | March | d3 = −2.819 | 6.80 | 0.84 | 31.0 |
| 4 | April | d4 = 9.415 | −6.07 | 0.87 | 19.1 |
| 5 | May | d5 = 18.792 | −14.95 | 0.87 | 10.2 |
| 6 | June | d6 = 23.314 | −19.27 | 0.87 | 5.9 |
| 7 | July | d7 = 21.517 | −15.65 | 0.83 | 8.3 |
| 8 | August | d8 = 13.784 | −4.23 | 0.75 | 17.4 |
| 9 | September | d9 = 2.217 | 6.42 | 0.77 | 28.7 |
| 10 | October | d10 = −9.599 | 15.84 | 0.83 | 39.8 |
| 11 | November | d11 = −19.148 | 23.61 | 0.84 | 47.9 |
| 12 | December | d12 = −23.335 | 30.56 | 0.76 | 52.5 |
Table 2.
Solar panel, Hanwha Q. CELLS’ Q.PEAK.DUO L–G7.4 390-405 model.
| Type | Parameter | Value |
|---|---|---|
| Solar panel module | Model | Q.PEAK.DUO L–G7.4 |
| Length (mm) | 2000 | |
| Width (mm) | 1000 | |
| Power capacity (kW/unit) | 390–405 Wp | |
| Efficiency (%) | 20.3% |
Table 3.
Monthly solar energy generations by solar panels using the optimal tilt angle (βo).
| N. | Month | Optimal Tilt Angle (deg) βo | Solar Energy Generation (kWh·m−2·Month−1) |
|---|---|---|---|
| 1 | January | 51.0 | 53,200 |
| 2 | February | 41.1 | 60,728 |
| 3 | March | 31.0 | 105,107 |
| 4 | April | 19.1 | 115,625 |
| 5 | May | 10.2 | 140,935 |
| 6 | June | 5.9 | 125,662 |
| 7 | July | 8.3 | 132,661 |
| 8 | August | 17.4 | 116,094 |
| 9 | September | 28.7 | 105,767 |
| 10 | October | 39.8 | 84,129 |
| 11 | November | 47.9 | 54,844 |
| 12 | December | 52.5 | 55,446 |
| Total | 1,150,198 | ||
Table 4.
Annual average wind speed in Lanzarote in 2020 [21].
Table 4.
Annual average wind speed in Lanzarote in 2020 [21].
| N. | Month | Average Wind Speed (m−1·s−1·month−1) | Dominant Wind Direction |
|---|---|---|---|
| 1 | January | 5.7 | NE |
| 2 | February | 6.6 | NE |
| 3 | March | 7.2 | NNE |
| 4 | April | 5.6 | NNE |
| 5 | May | 6.4 | NNE |
| 6 | June | 6.4 | NNE |
| 7 | July | 8.1 | NNE |
| 8 | August | 8.6 | NNE |
| 9 | September | 6.0 | NNE |
| 10 | October | 6.3 | NE |
| 11 | November | 5.3 | NE |
| 12 | December | 6.3 | NE |
Table 5.
Energy generation of a prototype (volume = 0.144 cm−3) of PVDF (LDT4-028 K/L), which is (L) 60 mm × (W) 120 mm × (t) 0.2 mm, according to the monthly wind speed.
Table 5.
Energy generation of a prototype (volume = 0.144 cm−3) of PVDF (LDT4-028 K/L), which is (L) 60 mm × (W) 120 mm × (t) 0.2 mm, according to the monthly wind speed.
| N. | Month | Average Wind Speed (m−1·s−1·Month−1) | Energy Generation (µW·cm−3·Month−1) |
|---|---|---|---|
| 1 | January | 5.7 | 1.1 |
| 2 | February | 6.6 | 2.3 |
| 3 | March | 7.2 | 3.2 |
| 4 | April | 5.6 | 1.1 |
| 5 | May | 6.4 | 2.1 |
| 6 | June | 6.4 | 2.1 |
| 7 | July | 8.1 | 4.3 |
| 8 | August | 8.6 | 4.8 |
| 9 | September | 6.0 | 1.8 |
| 10 | October | 6.3 | 2.1 |
| 11 | November | 5.3 | 0.8 |
| 12 | December | 6.3 | 2.1 |
| Total | 27.8 | ||
Publisher’s Note: MDPI stays neutral with regard to jurisdictional claims in published maps and institutional affiliations. |
© 2021 by the author. Licensee MDPI, Basel, Switzerland. This article is an open access article distributed under the terms and conditions of the Creative Commons Attribution (CC BY) license (https://creativecommons.org/licenses/by/4.0/).
Share and Cite
MDPI and ACS Style
Choi, H.S. Architectural Simulation of Hybrid Energy Harvesting: A Design Experiment in Lanzarote Island. Appl. Sci. 2021, 11, 12146. https://0-doi-org.brum.beds.ac.uk/10.3390/app112412146
AMA Style
Choi HS. Architectural Simulation of Hybrid Energy Harvesting: A Design Experiment in Lanzarote Island. Applied Sciences. 2021; 11(24):12146. https://0-doi-org.brum.beds.ac.uk/10.3390/app112412146
Chicago/Turabian StyleChoi, Ho Soon. 2021. "Architectural Simulation of Hybrid Energy Harvesting: A Design Experiment in Lanzarote Island" Applied Sciences 11, no. 24: 12146. https://0-doi-org.brum.beds.ac.uk/10.3390/app112412146
Note that from the first issue of 2016, this journal uses article numbers instead of page numbers. See further details here.