
Effects of Sleep Deprivation on the Brain Electrical Activity in Mice
by
 , , and
Alexey N. Pavlov
1,* ,
,
Alexander I. Dubrovskii
2,
Olga N. Pavlova
2 and
Oxana V. Semyachkina-Glushkovskaya
3 1
Faculty of Nonlinear Processes, Saratov State University, Astrakhanskaya Str. 83, 410012 Saratov, Russia
2
Physics Department, Saratov State University, Astrakhanskaya Str. 83, 410012 Saratov, Russia
3
Biology Department, Saratov State University, Astrakhanskaya Str. 83, 410012 Saratov, Russia
*
Author to whom correspondence should be addressed.
Appl. Sci. 2021, 11(3), 1182; https://0-doi-org.brum.beds.ac.uk/10.3390/app11031182
Submission received: 28 November 2020
/
Revised: 20 January 2021
/
Accepted: 25 January 2021
/
Published: 28 January 2021
(This article belongs to the Special Issue Advances in Neuroimaging Data Processing)
Abstract
:Sleep plays a crucial role in maintaining brain health. Insufficient sleep leads to an enhanced permeability of the blood–brain barrier and the development of diseases of small cerebral vessels. In this study, we discuss the possibility of detecting changes in the electrical activity of the brain associated with sleep deficit, using an extended detrended fluctuation analysis (EDFA). We apply this approach to electroencephalograms (EEG) in mice to identify signs of changes that can be caused by short-term sleep deprivation (SD). Although the SD effect is usually subject-dependent, analysis of a group of animals shows the appearance of a pronounced decrease in EDFA scaling exponents, describing power-law correlations and the impact of nonstationarity as a fairly typical response. Using EDFA, we revealed an SD effect in 9 out of 10 mice (Mann–Whitney test, ) that outperforms the DFA results (7 out of 10 mice). This tool may be a promising method for quantifying SD-induced pathological changes in the brain.
1. Introduction
Sleep plays a critical role in maintaining the health of the central nervous system and resisting small vessel disease in the brain. Over the past decades, there has been a better understanding of the effects of sleep on the body [1,2,3,4]. Sleep is important for attention and learning and affects long-term memory, decision-making, etc. [5,6]. It is vital to maintain good overall brain health, and prolonged periods of the absence of sleep can have serious consequences. Good sleep reduces the risk of neurodegenerative disorders, and insufficient sleep leads to sterile inflammation in the absence of infection [7,8,9] and an enhanced permeability of the blood–brain barrier (BBB) [8,10]. Total sleep deprivation (SD) of rats resulted in their death [11]. In humans, the longest wakefulness time (11 days) is accompanied by hallucinations and various cognitive impairments [12]. Thus, it seems clear that sleep plays an important role in restoring brain function. Sleep is a biomarker of BBB permeability, and electroencephalography (EEG) is an important informative platform for analyzing BBB leakage, especially in amyloid lesions of small vessels of the brain [13]. It is interesting to note that the opening of the BBB and deep sleep are accompanied by similar activation of toxins clearance from the brain [13]. Thus, nighttime EEG patterns also hide information about lymphatic drainage and cleansing functions of the brain. Detecting such information requires techniques that deal with nonstationary signal processing, and one such tool is the detrended fluctuation analysis (DFA).
Since its appearance [14,15], DFA has attracted considerable attention in many areas of research, where correlation features of experimental datasets are used to characterize the complex dynamics of natural systems [16,17,18,19,20,21,22]. The traditional correlation function has two main restrictions, the first of which is the decay of with increasing time lag , which is fast for broadband random processes. The latter limits the ability to compute the scaling exponent describing long-range power-law correlations, because approaches zero and becomes comparable to computational errors for noisy datasets. The second restriction arises for time-varying dynamics, when the value of C is determined by two time moments , . Only for stationary processes there is a dependence on their difference = − , and the correlation function is described by one variable. Many natural processes do not satisfy this requirement, and the traditional approach is used under the assumption of quasistationarity for short segments of the dataset or after excluding the trend due to data filtering. The origin of nonstationarity differs. It can be caused by recording equipment failures or by transients between various system states. Otherwise, it appears due to internal slow dynamics with time scales comparable to the duration of the available datasets. In the latter case, we interpret part of the internal dynamics of a system with time-varying components as a trend. The advantage of DFA is the inclusion of data filtering (detrending) in the signal processing algorithm [14]. Moreover, this detrending is carried out for each time scale separately, which is important for inhomogeneous datasets. Another advantage is the transformation of the decreasing correlation function into a growing dependence of the root mean square (RMS) fluctuations of the signal profile around the local trend on the time scale, and the scaling exponent describing its power-law features is easier to estimate, especially in the region of long-range correlations [15]. The DFA has some limitations that were discussed in earlier studies [23,24,25,26]. Despite the detrending procedure, nonstationarity influences the results, and data preprocessing is still important for analyzing complex systems using experimentally recorded signals [27].
In its original version [14,15], the DFA considers one basic type of nonstationarity, namely, slow variations in the local mean value (trend). However, natural processes can include other types of time-varying behavior, e.g., repeated regular or random switching between system states, variations in energy, etc. The application of DFA can lead to misinterpretation of scaling exponents for inhomogeneous datasets, where segments with small and large RMS fluctuations can coexist, and their number affects the results. Several attempts have been made to modify the conventional method, such as multifractal DFA, which introduces a number of quantities instead of a single scaling exponent [28,29]. Recently, we proposed another modification that takes into account local RMS fluctuations and estimates two scaling exponents describing the features of power-law correlations and the impact of nonstationarity [30]. This approach, extended DFA (EDFA) [31,32], has been applied to various types of physiological processes to improve the diagnostic capabilities of the conventional method. The main idea of EDFA is to take into account the difference between the maximum and minimum local RMS fluctuations of the signal profile (random walk) around the trend depending on the time scale. Here, we perform some modification of the EDFA to provide a more stable computation algorithm, and consider the standard deviation of the local RMS fluctuations. Such improvement allows us to avoid or at least reduce the effect of artifacts in experimental measurements, when localized artifacts or short-term instabilities strongly influence the RMS fluctuations within the conventional DFA and alter the quantitative measures of long-range correlations.
To illustrate the EDFA’s ability to characterize effects of SD on the brain electrical activity, here we analyze EEGs acquired in awake mice in two different states—background electrical brain activity and activity after SD [33,34,35,36,37], when the animals did not sleep for a day. Unlike prolonged SD, the effects of short-term SD are less obvious. Here, we study how one-day SD alters long-range power-law correlations in electrical activity in the brain. The manuscript is organized as follows. In Section 2, we describe the subjects, experimental procedures, and data measurements used in this work. We also provide a brief description of DFA and its modified version, EDFA. The results of EEG studies in mice during background activity and after sleep deprivation are presented in Section 3. Section 4 summarizes the main findings of the study.
2. Methods and Experiments
2.1. DFA
DFA is a variant of the correlation analysis of experimental datasets originally proposed by Peng et al. [14,15]. It is based on RMS analysis of signal profile and includes the following steps:
(1) Transition from signal to its profile
(2) Segmentation of the profile into parts of length n (n < N).
(3) Computation of the local trend for each segment using a least-squares straight-line fit.
(4) Estimation of the standard deviation,
(5) Implementation steps 2–4 over a wide range of n.
(6) Computation of the scaling exponent ,
Power-law dependence (3) is observed for various random processes, but many real-world datasets with an inhomogeneous structure often exhibit different local slopes of vs. , and may differ for short-range and long-range correlations. DFA is usually applied to reveal the features of complex dynamics related to the region of long-range correlations. Specific values of , associated with < , = , and < < 1, describe, respectively, anti-correlated behavior (alternation of large and small values of ), lack of correlations (e.g., white noise), and positive power-law correlations (large values of tend to follow large values, and vice versa) [15]. Positive correlations, which may differ from power-law behavior, are associated with > 1.
2.2. EDFA
Signal properties can vary strongly between different parts of a dataset. This is observed, e.g., for transients from one state to another, when well-pronounced variations in the local mean value affect the scaling exponent. Considering datasets with and without such transients can lead to distinct results of DFA. In a recent study [27], we illustrated the effects of nonstationarity for several cases: low-frequency trend, intermittent dynamics, and nonstationarity in energy. Besides the case when time-varying dynamics occurs throughout the signal, the exponent is also influenced by short-term failures of the recording equipment or artifacts. Such data segments provide distinct local standard deviations (2) compared to the averaged quantities. In order to characterize the differences in nonstationarity across the entire signal, we have proposed the following modification of the method, called EDFA [31,32]. Within this approach, a new measure
is introduced, where are the local standard deviations of the profile from the trend, which are estimated for each segment. The difference contains information about the impact of signal inhomogeneity. If the properties of the signal vary insignificantly, takes values close to zero. Otherwise, a wide distribution of appears, and varies with n, exhibiting power-law behavior characterized by the scaling exponent
In this definition, becomes highly sensitive to artifacts in experimental recordings. The existence of a single artifact can lead to a large associated with , and the latter reduces the stability of the EDFA method. In particular, the dependence can show strong fluctuations with n. A more stable algorithm is based on the statistical analysis of , and the use of the standard deviation () as a measure of the signal inhomogeneity. Thus, here we propose to consider the dependence
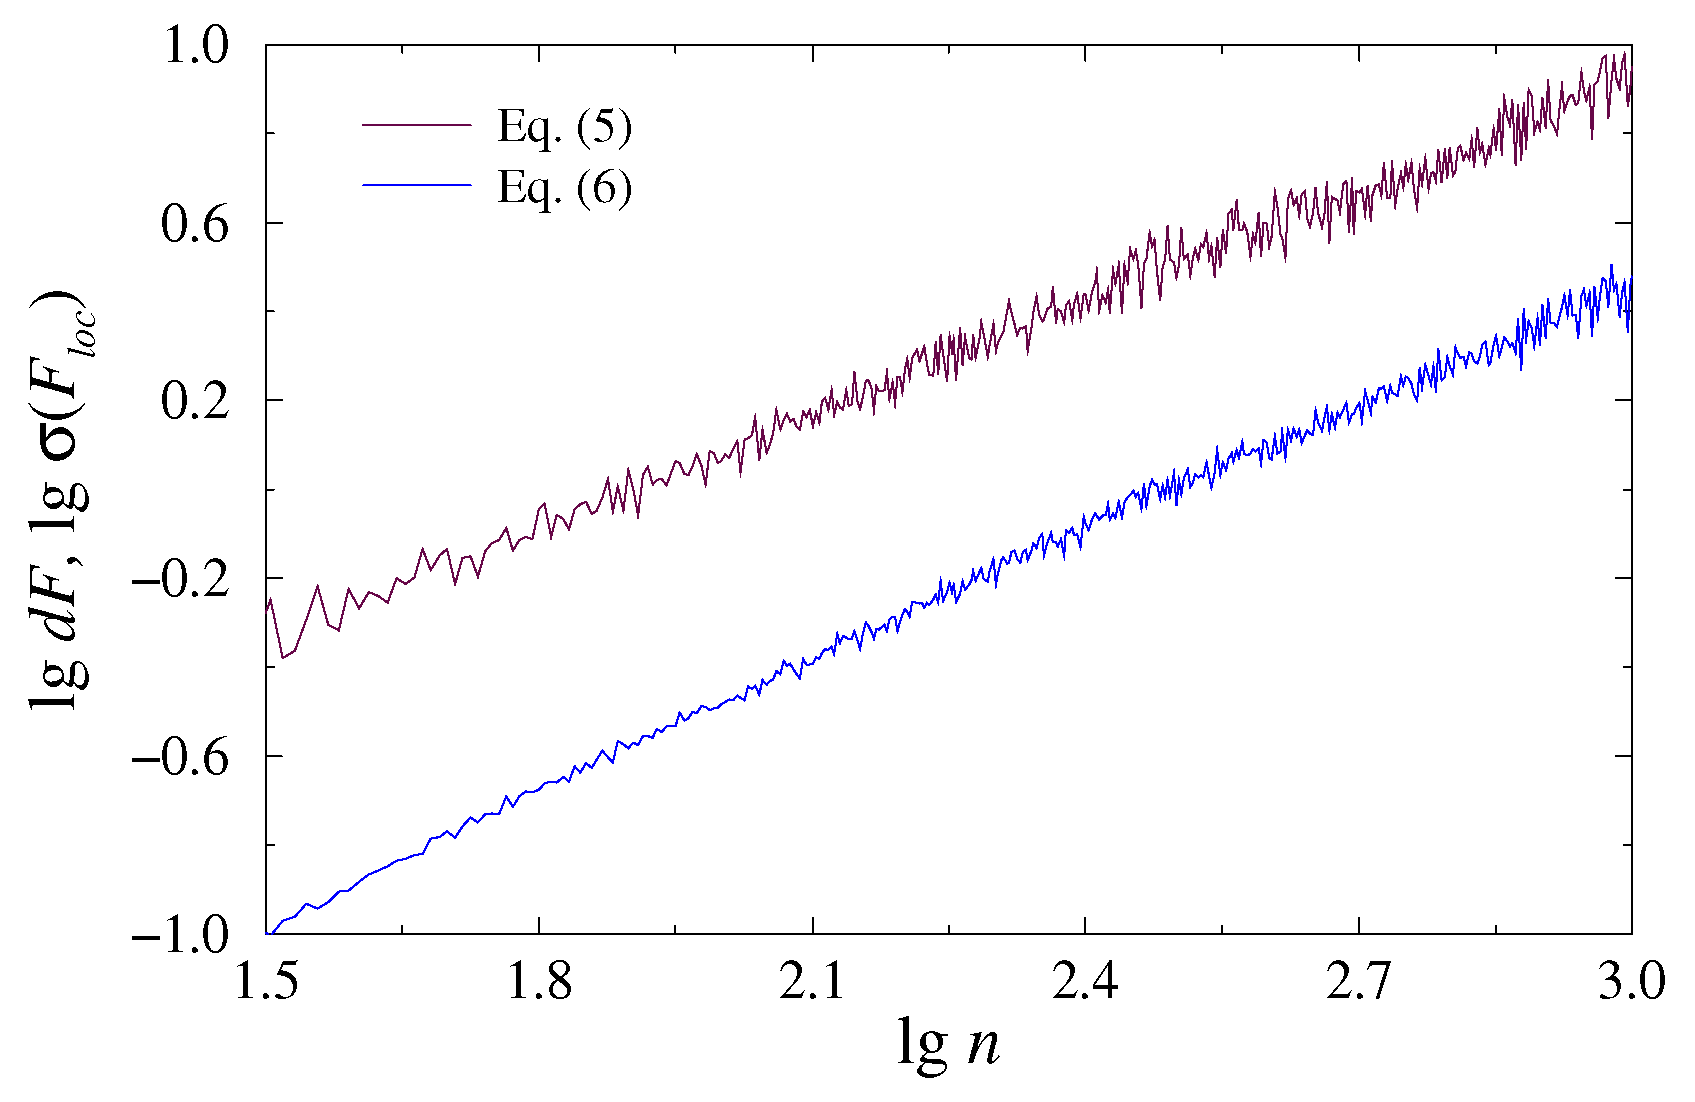
Figure 1 shows both dependences (5) and (6) in a lg–lg plot for the case of 1/f-noise used as a simple example of a homogeneous process with power-law correlations. This figure confirms that the latter definition provides reduced variability in the estimated values. Thus, standard error of the estimates decreases from 0.0038 for the definiton (5) to 0.0023 for the definiton (6).
For physiological datasets, differences are usually larger. Although the exponents in Equations (5) and (6) may differ, we use the same designation () to quantify the impact of nonstationarity and a more stable algorithm based on () for its evaluation. The exponent can take as positive, as negative values [30]. Both and exponents describe different signal properties and are independent quantities.
2.3. Subjects and Experiments
Experiments were carried out on ten C57BL/6 male mice (20–25 g) in accordance with the Guide for the Care and Use of Laboratory Animals (8th ed., The National Academies Press, Washington, 2011). The protocols were approved by the Local Bioethics Commission of the Saratov State University. The mice were kept in a light/dark environment with the lights on from 8:00 to 20:00 and fed ad libitum with standard rodent food and water. The ambient temperature and humidity were maintained at 24.5 ± 0.5 °C and 40–60%, respectively.
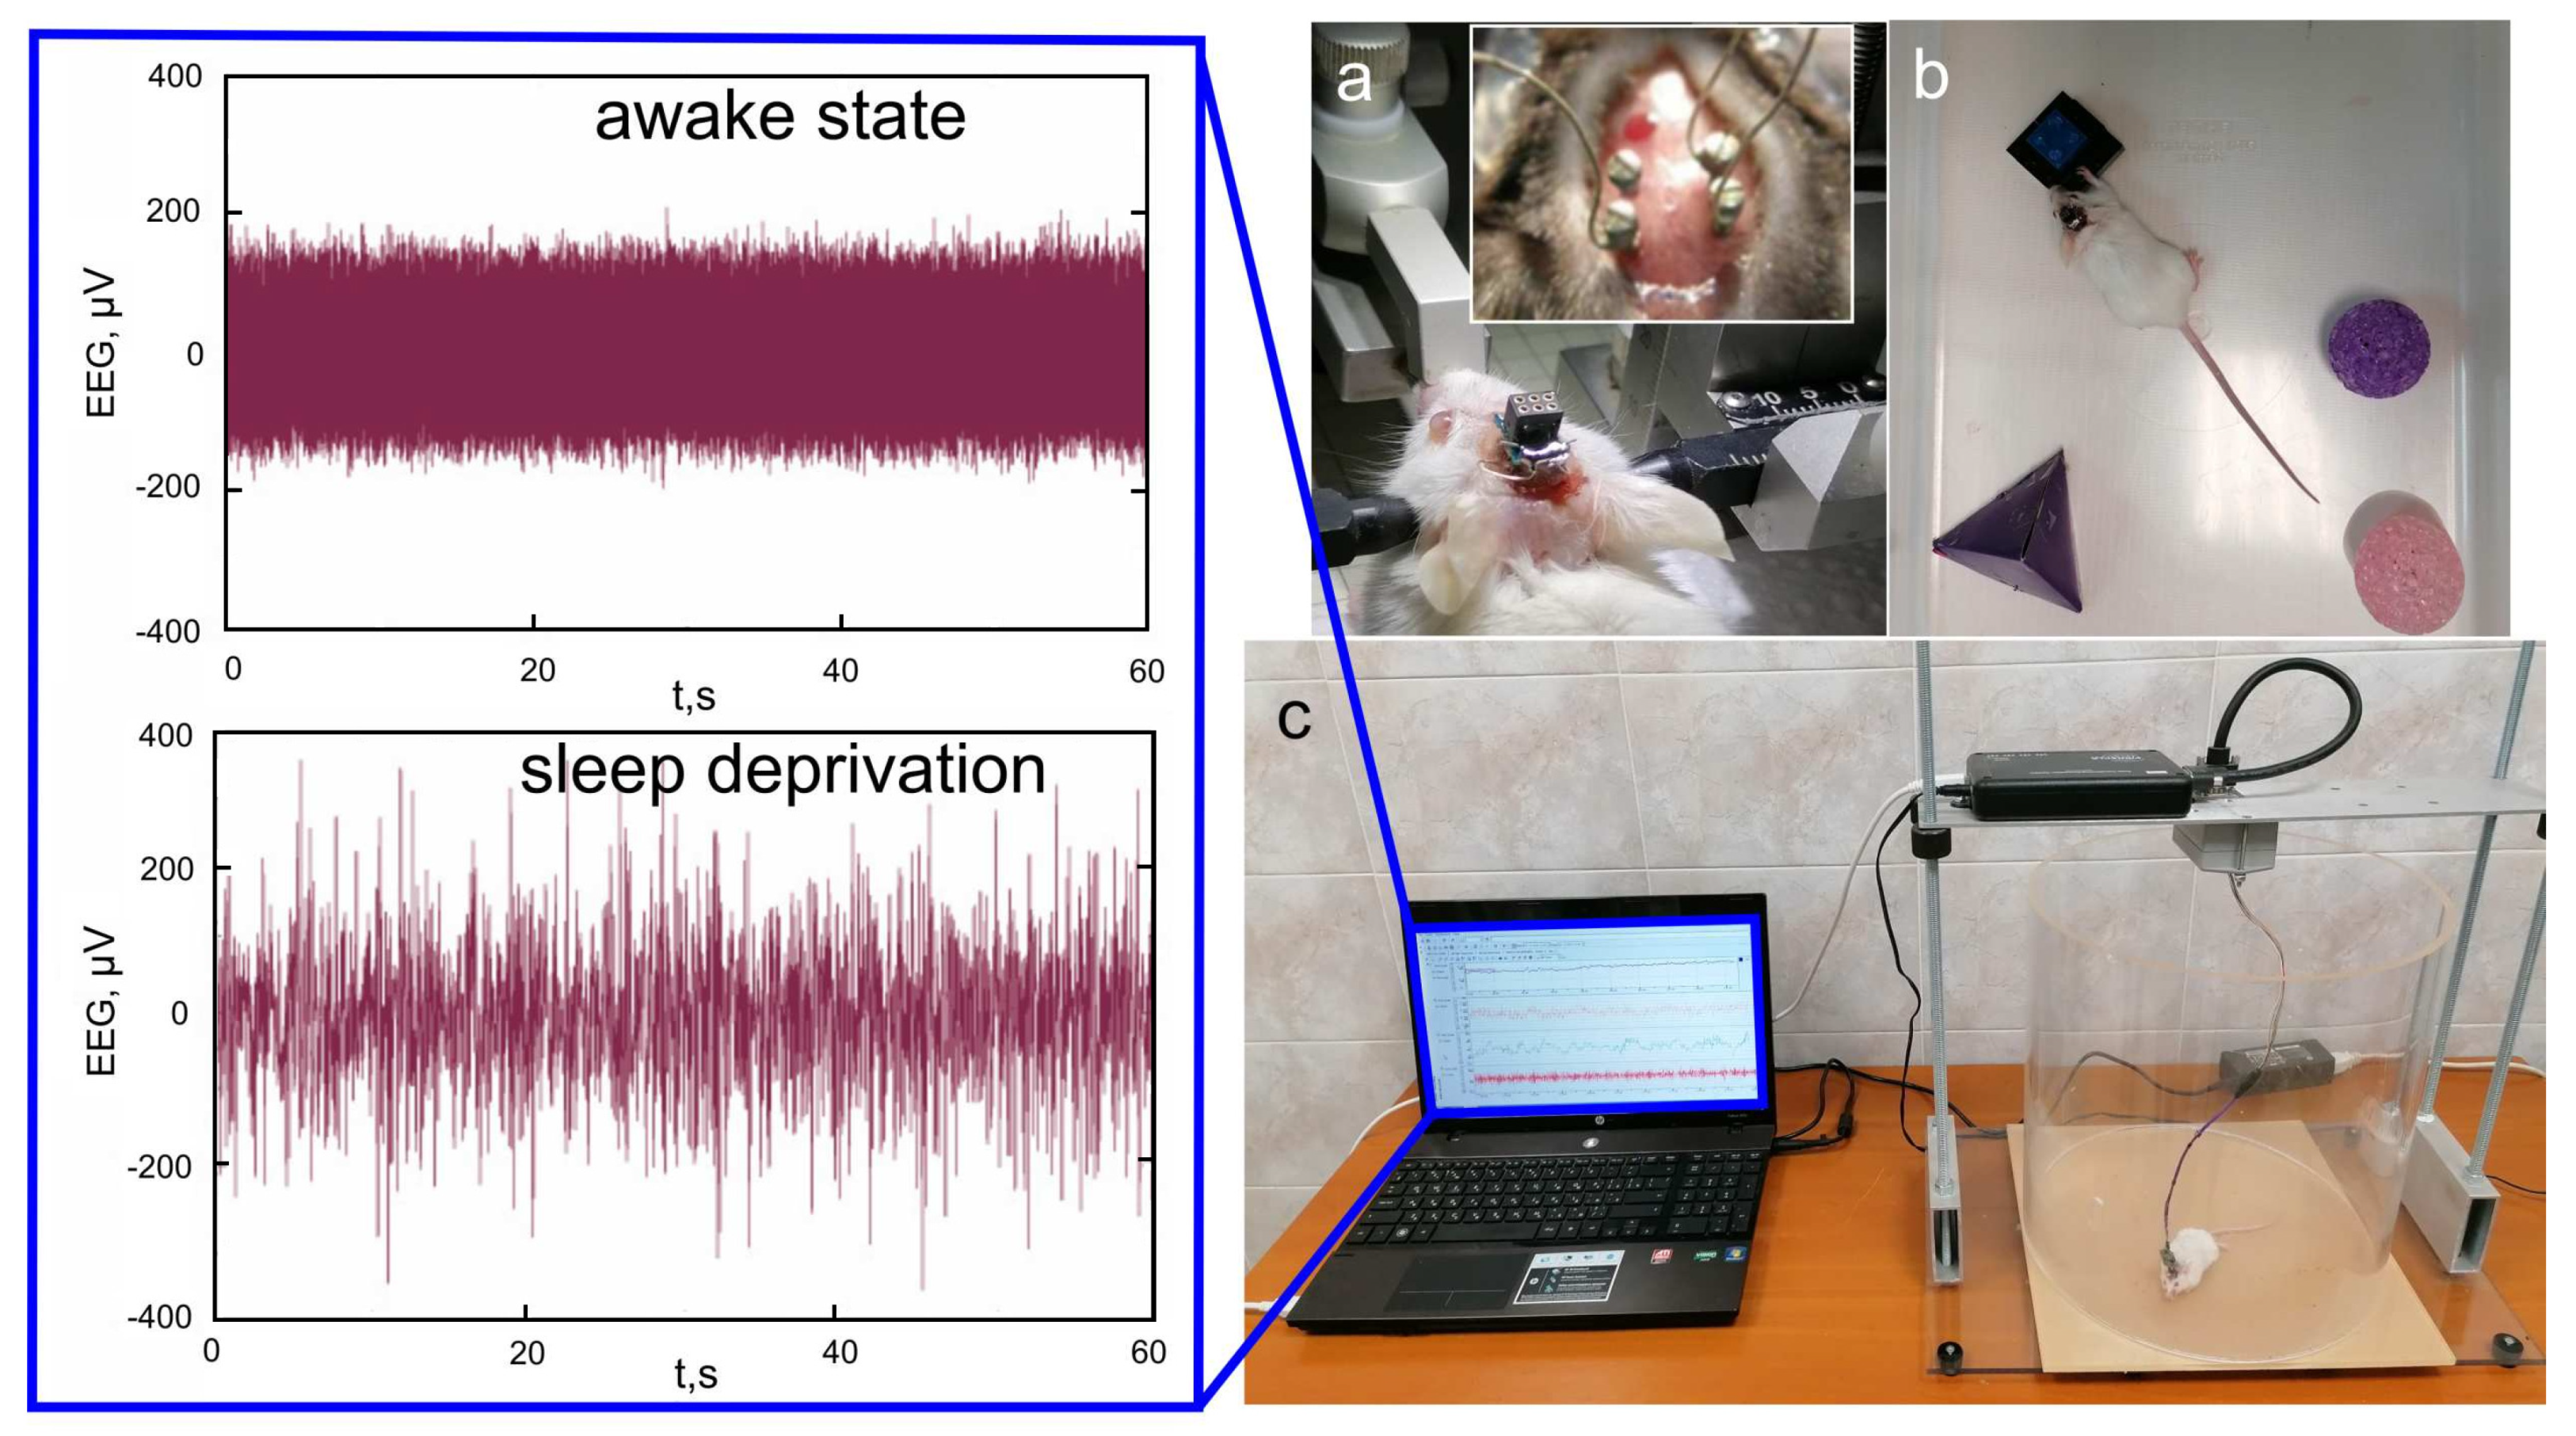
A two-channel cortical EEG (Pinnacle Technology, Taiwan) was recorded (Figure 2) using two silver electrodes (tip diameter 2–3 m) located at a depth of 150 m in coordinates (L: 2.5 mm and D: 2 mm) from Bregma on either sides of the midline under inhalation anesthesia with 2% isoflurane at 1 L/min O/—70:30. The head plate was mounted and small burr holes were drilled. Thereafter, wire EEG leads were inserted into burr holes on one side of the midline between the skull and the underlying dura mater. EEG leads were fixed with dental acrylic. Ibuprofen (15 mg/kg) for relief of postoperative pain was provided in water supply for two to three days before surgery and for three or more days after surgery. Before starting the experiment, the mice were given 10 days to recover from surgery.
As standard sleep staging rules for mice are not currently available, we referred to the visual assessment criteria from the studies [1,38]. Sleep deprivation was carried out according to the method described in [39], with adaptation to the vivarium regime. The mice were deprived of sleep from 8:00 pm to 8:00 am and were immediately used for the experiment. Sleep deprivation was maintained by bringing new objects and sounds into the experiment room [40]. The mice were constantly monitored to make sure they were actually studying objects.
Signals were measured in awake and sleeping mice (day 1, 10-h recording), and after SD (day 2, 4-h recording). This study compares two states: (1) awake mice, background EEG activity, and (2) awake mice after SD. All recordings were done with a sampling rate of 2 kHz. At the stage of preprocessing, twelve 5-min segments with a quite homogeneous structure and less distorted by artifacts were selected for each EEG channel. Every 5-min segment was analyzed with EDFA to evaluate () and the exponent. The results for each mouse state were averaged over all selected segments and both channels.
3. Results and Discussion
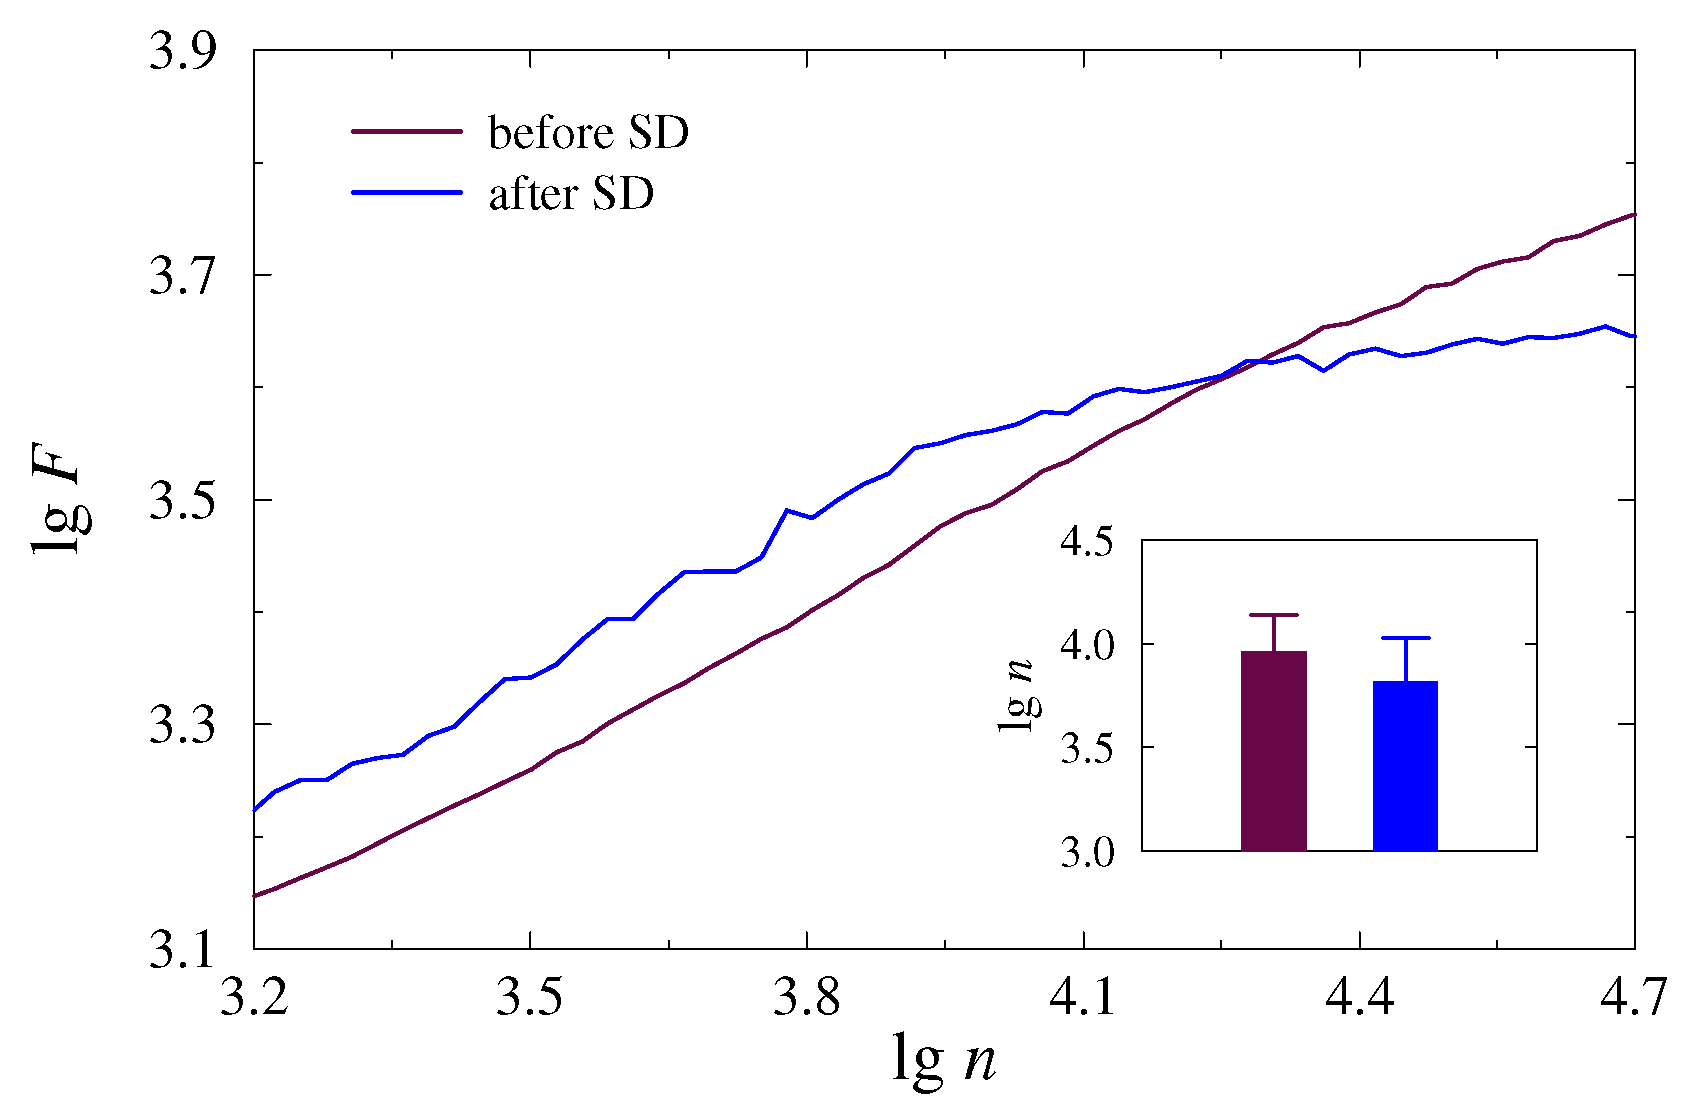
According to earlier studies [31,32], the slopes of the dependences (3) and (5) on the lg–lg plot vary with the segment length, which characterizes the range of power-law correlations. Often, significant differences between the properties of long-range and short-range correlations are observed in many types of physiological signals, which was demonstrated in pioneering works [14,15]. Knowledge of the features of power-law dependences (3) and (5) is important for establishing informative markers that quantify changes caused by transitions between different physiological states. In the case of the rat EEG, noticeable changes in correlation properties during sleep were found in the region of slow-wave dynamics associated with the > 3.3 range, which refers to frequencies below 1 Hz. To specify this range for the current study, we performed a preliminary visual analysis of the EDFA results. By analogy with the works in [31,32], transitions between distinct physiological states (dynamics before or after SD) can be observed in the area of long-range correlations, but changes between slopes, quantitatively determined by the exponents and , are usually subject-dependent and may also vary throughout a single recording for the same animal. In some cases, the range > 3.3 is appropriate to illustrate the effect of sleep deprivation. In other cases, lower frequencies associated with larger values of seem preferable. Thus, Figure 3 shows two examples of the dependence vs. for individual 5-min EEG segments measured in awake mice before and after SD. They illustrate the most pronounced differences between the states for > 3.9. As decreases, the distinctions in slopes are still observed, but they become weaker. Insert show the results of statistical analysis performed to select an appropriate range of scales (the values of related to changes in the slopes of vs. ).
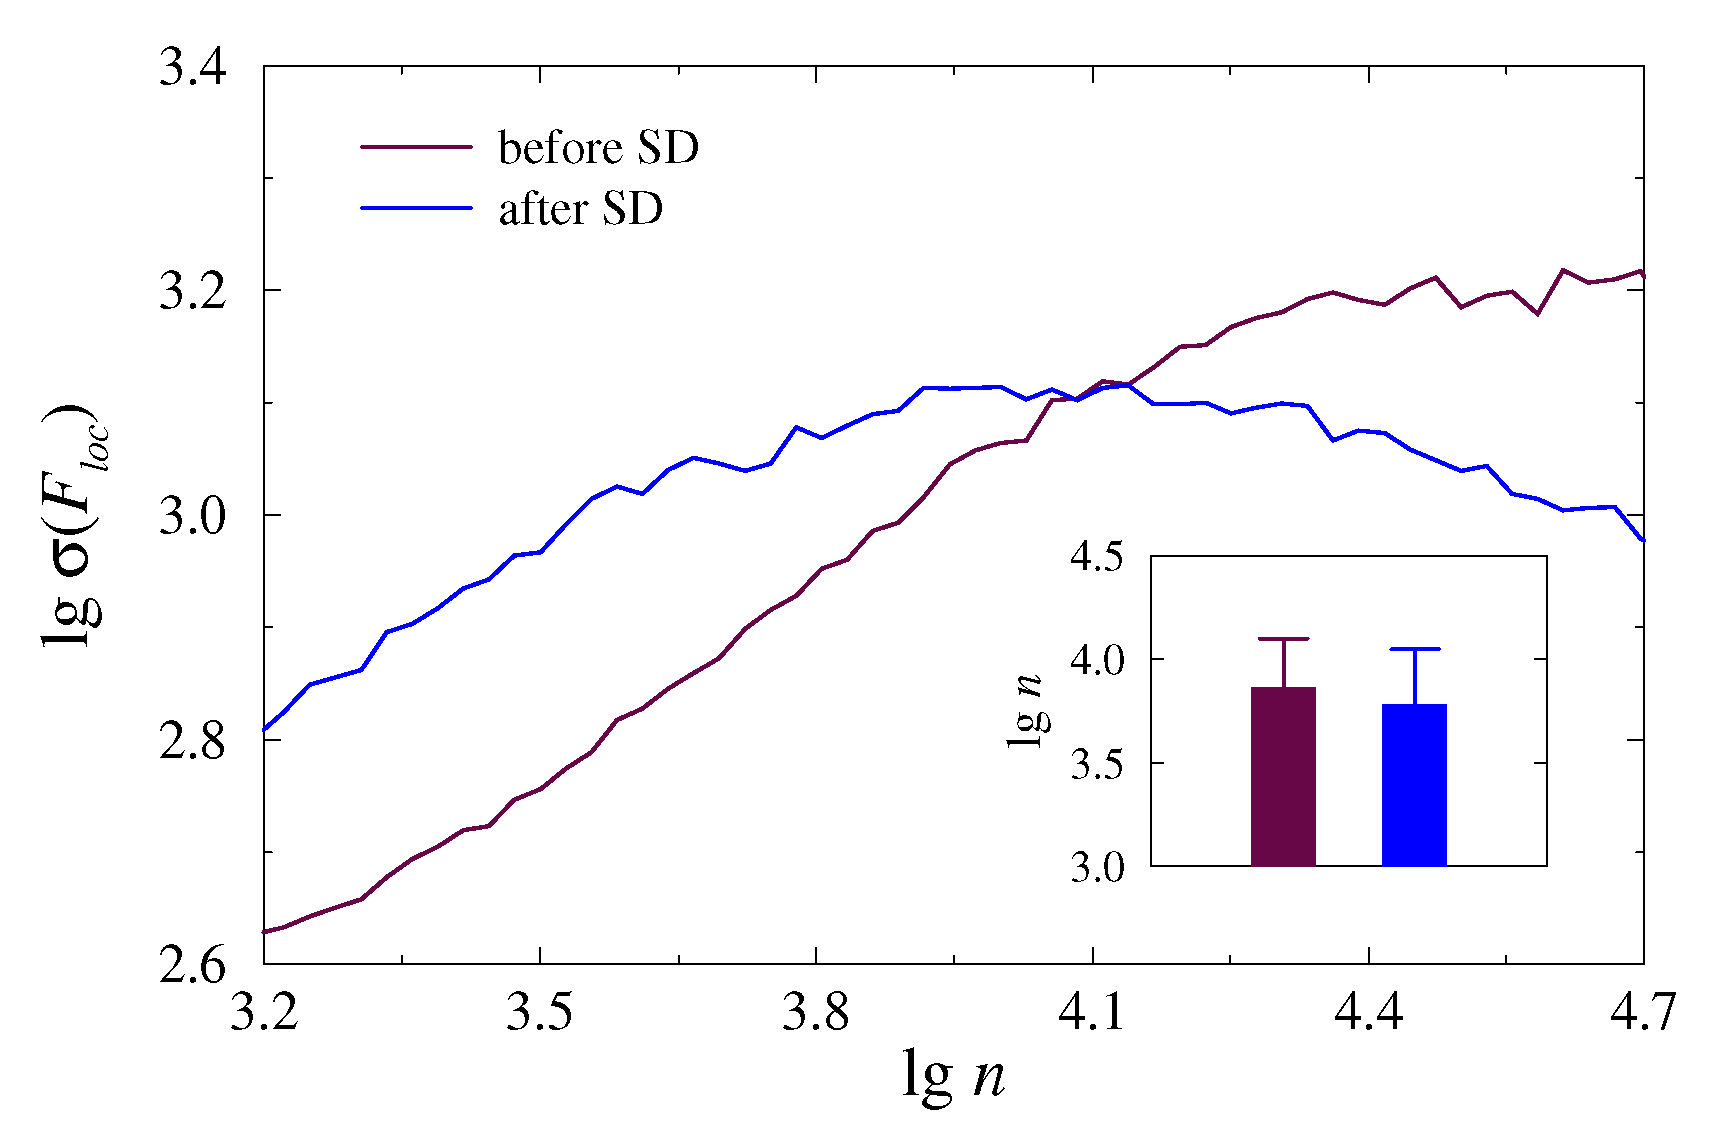
For the -exponent, the effect can be more pronounced, as this exponent can change its sign upon transition to another physiological state. This is illustrated in Figure 4 for the same measurements as in Figure 3. Again, the range > 3.9 is better suited for quantifying the distinctions caused by SD. Analogous visual analysis performed on other animals or data segments allowed us to capture this range of scales for further statistical analysis of the groups.
When conducting statistical analysis, several important points should be mentioned. First, there is a significant variability in the measures , within each state, due to the individual peculiarities of animals. The latter complicates comparison of the states based on absolute values of the scaling exponents, and accounting for differences between exponents , related to state 1 (awake mice before SD) and , associated with state 2 (awake mice after SD) seems to be a more promising approach. Thus, we introduce two measures
for a quantitative description of SD effects.
Another circumstance is the significant variability in scaling exponents between different parts of each recording. On the one hand, we can take longer datasets (e.g., several hours), estimate the corresponding values of and , and then compare these quantities for the two states under consideration. However, this way is accompanied by time-varying dynamics and several types of nonstationary behavior that can change the expected values of the scaling exponents. On the other hand, we can select fairly homogeneous (more stationary) segments, analyze them with EDFA, and then average the results for each animal and each condition. Our preliminary analysis of the simulated datasets [27] showed that this way gives more stable and reliable estimations, and we use it here for EEG processing.
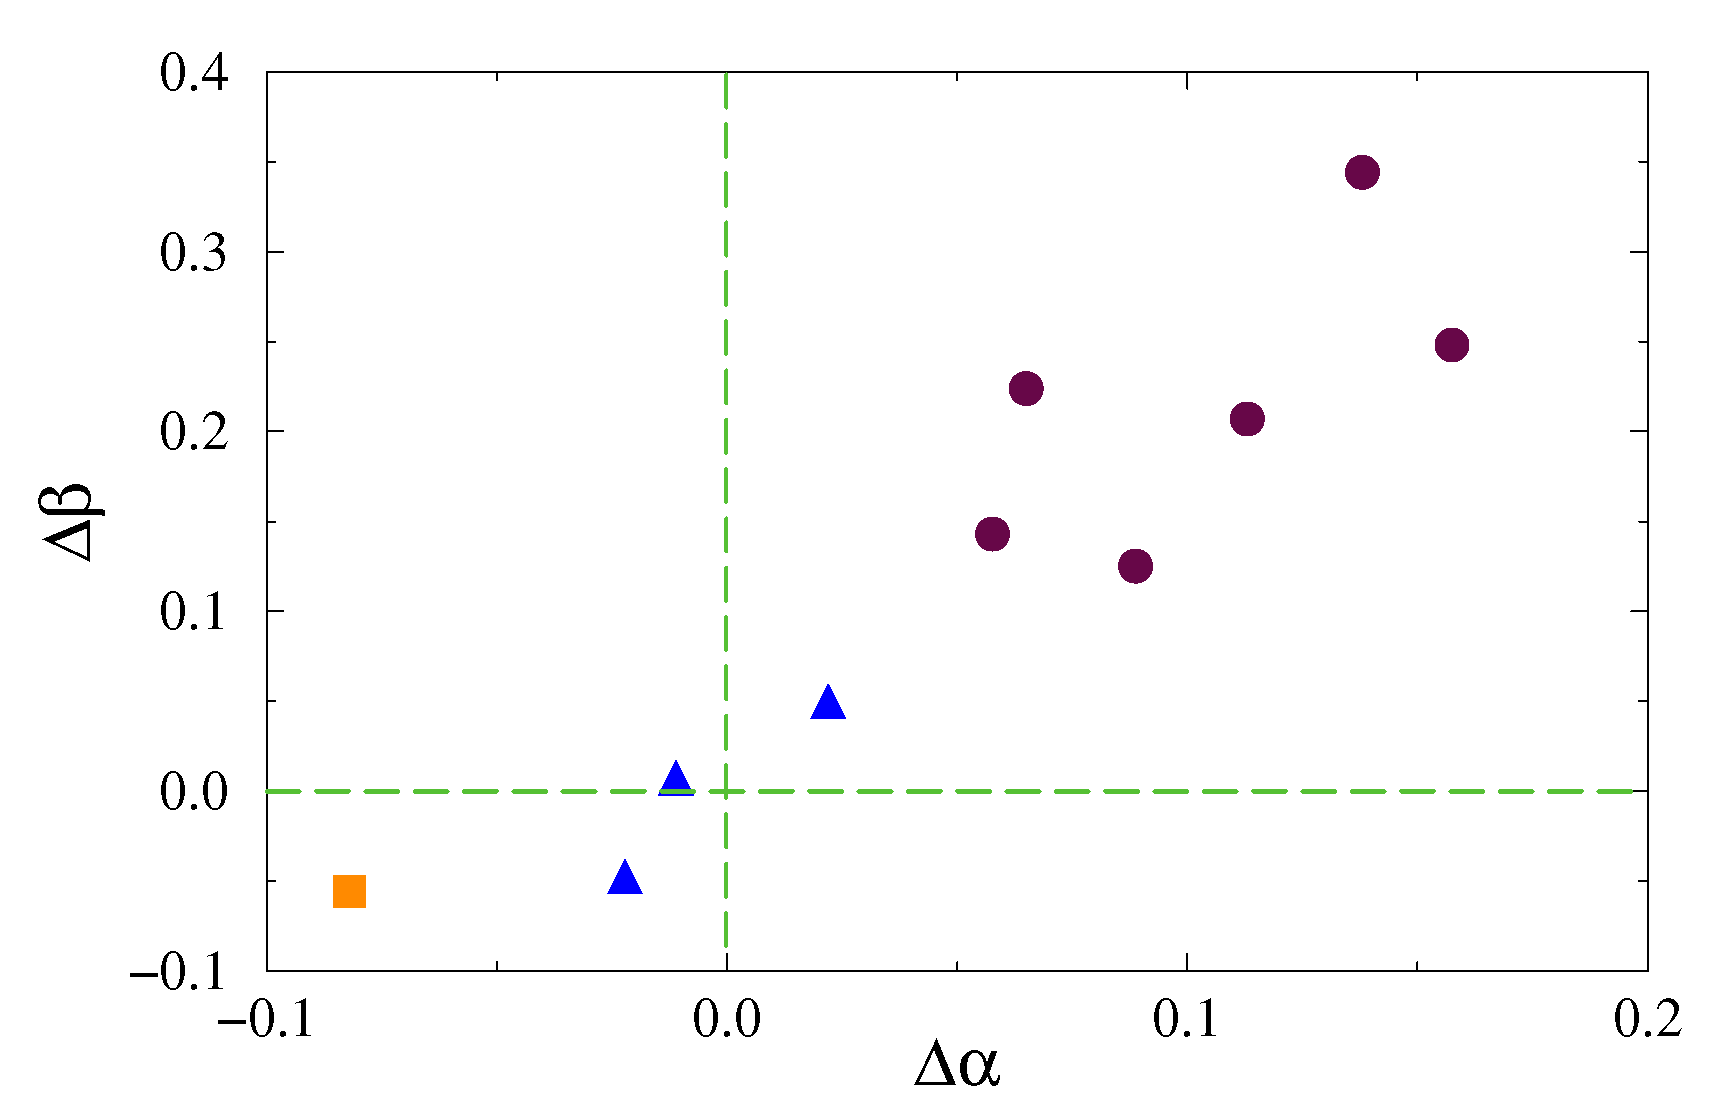
The established distinctions caused by SD for the entire group of animals are given in Figure 5, where different symbols indicate distinct responses, and in Table 1. For six out of 10 mice, a pronounced effect of SD is observed, characterized by a decrease in the and exponents, i.e., positive values of and (Figure 5, circles). Several animals (three out of 10 mice) demonstrated relatively subtle signs of SD-induced changes (Figure 5, triangles), although these changes are significant according to the Mann–Whitney test (p < 0.05). In this study, only one day of sleep deprivation was used. Longer SD periods are expected to elicit stronger responses; however, our goal was to examine the effects of short-term SD when sleep deprivation is not associated with neurodegenerative disorders. According to Figure 5, one mouse showed a different reaction (square), but this behavior can be treated atypical compared to other animals. Our results indicate that short-term effects of SD can be detected in EEG recordings, although the strength of the response is subject-dependent. Moreover, accounting for the exponent of the proposed EDFA can surpass the exponent of the standard DFA—the range is about twice as large as the range ( versus ). Consequently, the changes in the features of nonstationarity caused by SD are more pronounced than the changes in the properties of long-range correlations associated with them.
Thus, in this study we show that EDFA sensitively reflects the changes induced by SD. The sleep is a natural factor of activation of the lymphatic clearing and drainage functions of the brain [1,13]. The SD causes significant suppression of the clearance of toxins from the brain [1]. There are animal data suggesting that sleep deficit leads to sterile inflammation [7,8,9], an increase in the BBB permeability [8,10], and long SD is accompanied by hallucination and various cognitive deficiencies [12]. We hypothesized that sleep is a biomarker of the BBB permeability and EEG is an important informative platform for the analysis of BBB leakage and the cerebral lymphatic functions [20]. We show that EDFA may be applied to study changes in the electrical brain activity after SD.
4. Conclusions
The scaling features of long-range power-law correlations are important markers of the complex dynamics of many real-world systems that can be used to diagnose the state of a system based on experimentally measured datasets. We have discussed a modified approach to the fluctuation analysis of inhomogeneous processes, in which the nonstationarity varies over the entire signal. This approach, EDFA, computes two scaling exponents that quantify power-law correlations and nonstationarity features. To provide a more stable computational procedure and reduce the impact of localized artifacts, we consider the standard deviation of the local RMS fluctuations of the signal profile around the trend, rather than the difference of extreme values. The benefits of the latter procedure are illustrated using simulated datasets.
We then applied this approach to EEG signals in mice to reveal signs of changes in electrical activity of the brain that could be caused by a day’s sleep deprivation. These signs can be fairly subtle, in contrast to the effects of prolonged SD, taking into account the significant variability of characteristics during long-term EEG recordings. Using a group of 10 mice, we found quite strong reductions in and scaling exponents in six animals, with only one mouse showing a pronounced opposite effect. In these animals, the exponent provided stronger responses than the exponent of the conventional DFA. Thus, the proposed modified version of the method can be a useful prognostic tool for the evaluation of SD-mediated suppression of the clearance of toxins from the brain that is in accordance with the work [1]. Important open questions that could be further analyzed are the role of SD duration and the factor of age.
Author Contributions
Conceptualization, A.N.P. and O.V.S.-G.; methodology, A.N.P.; data curation, A.I.D.; software, O.N.P.; formal analysis, A.I.D., O.N.P.; investigation, A.N.P., O.N.P.; writing—original draft preparation, A.N.P. and O.V.S.-G.; writing—review and editing, A.N.P. and O.V.S.-G.; visualization, A.N.P.; supervision, A.N.P. and O.V.S.-G.; project administration, O.V.S.-G.; funding acquisition, O.V.S.-G. All authors have read and agreed to the published version of the manuscript.
Funding
This work was supported by the grant of the Government of the Russian Federation No. 075-15-2019-1885 in the part of experimental studies and numerical analysis. A.P. acknowledges the support by the grant of the Russian Science Foundation (Agreement 19-12-00037) in the part of theoretical studies (the development of EDFA method).
Institutional Review Board Statement
The study was carried out in accordance with the Guide for the Care and Use of Laboratory Animals (8th ed., The National Academies Press, Washington, 2011), and approved by the Local Bioethics Commission of the Saratov State University (protocol No. 12, 17.02.2020).
Informed Consent Statement
Not applicable.
Data Availability Statement
The data that support the findings of this study are available from the corresponding author upon reasonable request.
Conflicts of Interest
The authors declare no conflict of interest.
Abbreviations
The following abbreviations are used in this manuscript:
| DFA | Detrended fluctuation analysis |
| EDFA | Extended detrended fluctuation analysis |
| EEG | Electroencephalogram |
| SD | Sleep deprivation |
| RMS | Root mean square |
References
- Xie, L.; Kang, H.; Xu, Q.; Chen, M.J.; Liao, Y.; Thiyagarajan, M.; O’Donnell, J.; Christensen, D.J.; Nicholson, C.; Iliff, J.J.; et al. Sleep drives metabolite clearance from the adult brain. Science 2013, 342, 373–377. [Google Scholar] [CrossRef] [Green Version]
- Depner, C.M.; Stothard, E.R.; Wright, K.P., Jr. Metabolic consequences of sleep and circadian disorders. Curr. Diabetes Rep. 2014, 14, 507. [Google Scholar] [CrossRef]
- Fultz, N.E.; Bonmassar, G.; Setsompop, K.; Stickgold, R.A.; Rosen, B.R.; Polimeni, J.R.; Lewis, L.D. Coupled electrophysiological, hemodynamic, and cerebrospinal fluid oscillations in human sleep. Science 2019, 366, 628–631. [Google Scholar] [CrossRef] [PubMed]
- Foster, R.G. Sleep, circadian rhythms and health. Interface Focus 2020, 10, 20190098. [Google Scholar] [CrossRef] [PubMed] [Green Version]
- Duclos, C.; Beauregard, M.P.; Bottari, C.; Ouellet, M.C.; Gosselin, N. The impact of poor sleep on cognition and activities of daily living after traumatic brain injury: A review. Aust. Occup. Ther. J. 2015, 62, 2–12. [Google Scholar] [CrossRef] [PubMed] [Green Version]
- Van Someren, E.J.; Cirelli, C.; Dijk, D.J.; Van Cauter, E.; Schwartz, S.; Chee, M.W. Disrupted sleep: From molecules to cognition. J. Neurosci. 2015, 35, 13889–13895. [Google Scholar] [CrossRef]
- Mullington, J.M.; Simpson, N.S.; Meier-Ewert, H.K.; Haack, M. Sleep loss and inflammation. Best Pract. Res. Clin. Endocrinol. Metab. 2010, 24, 775–784. [Google Scholar] [CrossRef] [Green Version]
- Hurtado-Alvarado, G.; Pavón, L.; Castillo-Garcia, S.A.; Hernández, M.E.; Dominguez-Salazar, E.; Velázquez-Moctezuma, J.; Gómez-González, B. Sleep loss as a factor to induce cellular and molecular inflammatory variations. Clin. Dev. Immunol. 2013, 2013, 801341. [Google Scholar] [CrossRef]
- Lahtinen, A.; Puttonen, S.; Vanttola, P.; Viitasalo, K.; Sulkava, S.; Pervjakova, N.; Joensuu, A.; Salo, P.; Toivola, A.; Hármá, M.; et al. A distinctive DNA methylation pattern in insufficient sleep. Sci. Rep. 2019, 9, 1–9. [Google Scholar] [CrossRef] [Green Version]
- He, J.; Hsuchou, H.; He, Y.; Kastin, A.J.; Wang, Y.; Pan, W. Sleep restriction impairs blood-brain barrier function. J. Neurosci. 2014, 34, 14697–14706. [Google Scholar] [CrossRef] [Green Version]
- Everson, C.A.; Bergmann, B.M.; Rechtschaffen, A. Sleep deprivation in the rat: III. Total sleep deprivation. Sleep 1989, 12, 13–21. [Google Scholar] [CrossRef] [PubMed]
- Ross, J.J. Neurological findings after prolonged sleep deprivation. Arch. Neurol. 1965, 12, 399–403. [Google Scholar] [CrossRef] [PubMed]
- Semyachkina-Glushkovskaya, O.; Postnov, D.; Penzel, T.; Kurths, J. Sleep as a novel biomarker and a promising therapeutic target for cerebral small vessel disease: A review focusing on Alzheimer’s disease and the blood-brain barrier. Int. J. Mol. Sci. 2020, 21, 6293. [Google Scholar] [CrossRef]
- Peng, C.-K.; Buldyrev, S.V.; Havlin, S.; Simons, M.; Stanley, H.E.; Goldberger, A.L. Mosaic organization of DNA nucleotides. Phys. Rev. E 1994, 49, 1685–1689. [Google Scholar] [CrossRef] [Green Version]
- Peng, C.-K.; Havlin, S.; Stanley, H.E.; Goldberger, A.L. Quantification of scaling exponents and crossover phenomena in nonstationary heartbeat time series. Chaos 1995, 5, 82–87. [Google Scholar] [CrossRef] [PubMed]
- Stanley, H.E.; Amaral, L.A.N.; Goldberger, A.L.; Havlin, S.; Ivanov, P.C.; Peng, C.-K. Statistical physics and physiology: Monofractal and multifractal approaches. Phys. A 1999, 270, 309–324. [Google Scholar] [CrossRef]
- Ivanova, K.; Ausloos, M. Application of the detrended fluctuation analysis (DFA) method for describing cloud breaking. Phys. A 1999, 274, 349–354. [Google Scholar] [CrossRef]
- Heneghan, C.; McDarby, G. Establishing the relation between detrended fluctuation analysis and power spectral density analysis for stochastic processes. Phys. Rev. E 2000, 62, 6103–6110. [Google Scholar] [CrossRef] [PubMed] [Green Version]
- Talkner, P.; Weber, R.O. Power spectrum and detrended fluctuation analysis: Application to daily temperatures. Phys. Rev. E 2000, 62, 150–160. [Google Scholar] [CrossRef] [Green Version]
- Kantelhardt, W.; Koscielny-Bunde, E.; Rego, H.H.A.; Havlin, S.; Bunde, A. Detecting long-range correlations with detrended fluctuation analysis. Phys. A 2001, 295, 441–454. [Google Scholar] [CrossRef] [Green Version]
- Frolov, N.S.; Grubov, V.V.; Maksimenko, V.A.; Lüttjohann, A.; Makarov, V.V.; Pavlov, A.N.; Sitnikova, E.; Pisarchik, A.N.; Kurths, J.; Hramov, A.E. Statistical properties and predictability of extreme epileptic events. Sci. Rep. 2019, 9, 7243. [Google Scholar] [CrossRef] [PubMed] [Green Version]
- Pavlov, A.N.; Runnova, A.E.; Maksimenko, V.A.; Pavlova, O.N.; Grishina, D.S.; Hramov, A.E. Detrended fluctuation analysis of EEG patterns associated with real and imaginary arm movements. Phys. A 2018, 509, 777–782. [Google Scholar] [CrossRef]
- Hu, K.; Ivanov, P.C.; Chen, Z.; Carpena, P.; Stanley, H.E. Effect of trends on detrended fluctuation analysis. Phys. Rev. E 2001, 64, 011114. [Google Scholar] [CrossRef] [PubMed] [Green Version]
- Chen, Z.; Ivanov, P.C.; Hu, K.; Stanley, H.E. Effect of nonstationarities on detrended fluctuation analysis. Phys. Rev. E 2002, 65, 041107. [Google Scholar] [CrossRef] [Green Version]
- Bryce, R.M.; Sprague, K.B. Revisiting detrended fluctuation analysis. Sci. Rep. 2012, 2, 315. [Google Scholar] [CrossRef] [Green Version]
- Shao, Y.H.; Gu, G.F.; Jiang, Z.Q.; Zhou, W.X.; Sornette, D. Comparing the performance of FA, DFA and DMA using different synthetic long-range correlated time series. Sci. Rep. 2012, 2, 835. [Google Scholar] [CrossRef] [Green Version]
- Pavlov, A.N.; Pavlova, O.N.; Semyachkina-Glushkovskaya, O.V.; Kurths, J. Extended detrended fluctuation analysis: Effects of nonstationarity and application to sleep data. Eur. Phys. J. Plus 2021, 136, 10. [Google Scholar] [CrossRef]
- Kantelhardt, J.W.; Zschiegner, S.A.; Koscielny-Bunde, E.; Havlin, S.; Bunde, A.; Stanley, H.E. Multifractal detrended fluctuation analysis of nonstationary time series. Phys. A 2002, 316, 87–114. [Google Scholar] [CrossRef] [Green Version]
- Castiglioni, P.; Faini, A. A fast DFA algorithm for multifractal multiscale analysis of physiological time series. Front. Physiol. 2019, 10, 115. [Google Scholar] [CrossRef] [Green Version]
- Pavlov, A.N.; Abdurashitov, A.S.; Koronovskii, A.A., Jr.; Pavlova, O.N.; Semyachkina-Glushkovskaya, O.V.; Kurths, J. Detrended fluctuation analysis of cerebrovascular responses to abrupt changes in peripheral arterial pressure in rats. Commun. Nonlinear Sci. Numer. Simul. 2020, 85, 105232. [Google Scholar] [CrossRef]
- Pavlov, A.N.; Dubrovsky, A.I.; Koronovskii, A.A., Jr.; Pavlova, O.N.; Semyachkina-Glushkovskaya, O.V.; Kurths, J. Extended detrended fluctuation analysis of electroencephalograms signals during sleep and the opening of the blood-brain barrier. Chaos 2020, 30, 073138. [Google Scholar] [CrossRef] [PubMed]
- Pavlov, A.N.; Dubrovsky, A.I.; Koronovskii, A.A., Jr.; Pavlova, O.N.; Semyachkina-Glushkovskaya, O.V.; Kurths, J. Extended detrended fluctuation analysis of sound-induced changes in brain electrical activity. Chaos Solitons Fractals 2020, 139, 109989. [Google Scholar] [CrossRef]
- Reynolds, A.C.; Banks, S. Total sleep deprivation, chronic sleep restriction and sleep disruption. Prog. Brain Res. 2010, 185, 91–103. [Google Scholar] [PubMed]
- Meerlo, P.; Sgoifo, A.; Suchecki, D. Restricted and disrupted sleep: Effects on autonomic function, neuroendocrine stress systems and stress responsivity. Sleep Med. Rev. 2008, 12, 197–210. [Google Scholar] [CrossRef]
- Evans, J.A.; Davidson, A.J. Health consequences of circadian disruption in humans and animal models. Prog. Mol. Biol. Transl. Sci. 2013, 119, 283–323. [Google Scholar]
- Potter, G.D.; Skene, D.J.; Arendt, J.; Cade, J.E.; Grant, P.J.; Hardie, L.J. Circadian rhythm and sleep disruption: Causes, metabolic consequences, and countermeasures. Endocr. Rev. 2016, 37, 584–608. [Google Scholar] [CrossRef] [Green Version]
- Medic, G.; Wille, M.; Hemels, M.E. Short- and long-term health consequences of sleep disruption. Nat. Sci. Sleep 2017, 9, 151–161. [Google Scholar] [CrossRef] [Green Version]
- Hablitz, L.M.; Vinitsky, H.S.; Sun, Q.; Stκger, F.F.; Sigurdsson, B.; Mortensen, K.N.; Lilius, T.O.; Nedergaard, M. Increased glymphatic influx is correlated with high EEG delta power and low heart rate in mice under anesthesia. Sci. Adv. 2019, 5, eaav5447. [Google Scholar] [CrossRef] [Green Version]
- Achariyar, T.M.; Li, B.; Peng, W.; Verghese, P.B.; Shi, Y.; McConnell, E.; Benraiss, A.; Kasper, T.; Song, W.; Takano, T.; et al. Glymphatic distribution of CSF-derived apoE into brain is isoform specific and suppressed during sleep deprivation. Mol. Neurodegener. 2016, 11, 74. [Google Scholar] [CrossRef] [Green Version]
- Zhang, J.; Zhu, Y.; Zhan, G.; Fenik, P.; Panossian, L.; Wang, M.M.; Reid, S.; Lai, D.; Davis, J.G.; Baur, J.A.; et al. Extended wakefulness: Compromised metabolics in and degeneration of locus ceruleus neurons. J. Neurosci. 2014, 34, 4418–4431. [Google Scholar] [CrossRef] [Green Version]
Figure 1.
Dependences described by Equations (5) and (6) in the lg–lg plot for 1/f-noise. The -exponent is estimated with the standard errors 0.0038 and 0.0023, respectively.
Figure 1.
Dependences described by Equations (5) and (6) in the lg–lg plot for 1/f-noise. The -exponent is estimated with the standard errors 0.0038 and 0.0023, respectively.

Figure 2.
Experiment design: (a) implantation of a two–channel cortical EEG, (b) SD by presenting new objects to the mouse, and (c) EEG recording in an awake mouse. Insert shows experimental EEG signals—voltages (V) vs. time (seconds).
Figure 2.
Experiment design: (a) implantation of a two–channel cortical EEG, (b) SD by presenting new objects to the mouse, and (c) EEG recording in an awake mouse. Insert shows experimental EEG signals—voltages (V) vs. time (seconds).

Figure 3.
Examples of the dependence (3) in the lg–lg plot for 5-min EEG segments acquired in an awake mice before and after SD. Insert shows the results of statistical analysis over different EEG segments.
Figure 3.
Examples of the dependence (3) in the lg–lg plot for 5-min EEG segments acquired in an awake mice before and after SD. Insert shows the results of statistical analysis over different EEG segments.

Figure 4.
Examples of the dependence (6) in the lg–lg plot for 5-min EEG segments acquired in an awake mice before and after SD. Insert shows the results of statistical analysis over different EEG segments.
Figure 4.
Examples of the dependence (6) in the lg–lg plot for 5-min EEG segments acquired in an awake mice before and after SD. Insert shows the results of statistical analysis over different EEG segments.

Figure 5.
Individual responses of mice from the entire group to one-day SD quantified with the differences between the scaling exponents (7) before and after SD ( and ). Maroon circles show pronounced effects of SD, blue triangles indicate relatively subtle signs of SD-induced changes, and an orange square marks atypical response.


Table 1.
Characterization of SD effects with measures (7). The results are given as mean values ± SE. Asterisks indicate statistically significant changes according to the Mann–Whitney test (p < 0.05). EDFA shows significant changes for 9 out of 10 animals (), while DFA provides significant distinctions for 7 out of 10 mice (). The last column indicates that changes in are stronger in 8 mice (>).
| Experiment | DFA | EDFA | / |
|---|---|---|---|
| 1 | 0.14 ± 0.02 | 0.34 ± 0.03 | 2.4 |
| 2 | 0.06 ± 0.02 | 0.22 ± 0.02 | 3.7 |
| 3 | −0.01 ± 0.01 | 0.01 ± 0.01 | 1.0 |
| 4 | 0.06 ± 0.02 | 0.14 ± 0.02 | 2.3 |
| 5 | 0.11 ± 0.02 | 0.21 ± 0.02 | 1.9 |
| 6 | 0.02 ± 0.01 | 0.05 ± 0.01 | 2.5 |
| 7 | −0.03 ± 0.01 | −0.04 ± 0.01 | 1.3 |
| 8 | 0.09 ± 0.02 | 0.13 ± 0.02 | 1.4 |
| 9 | −0.08 ± 0.02 | −0.06 ± 0.02 | 0.8 |
| 10 | 0.16 ± 0.03 | 0.25 ± 0.04 | 1.6 |
Publisher’s Note: MDPI stays neutral with regard to jurisdictional claims in published maps and institutional affiliations. |
© 2021 by the authors. Licensee MDPI, Basel, Switzerland. This article is an open access article distributed under the terms and conditions of the Creative Commons Attribution (CC BY) license (http://creativecommons.org/licenses/by/4.0/).
Share and Cite
MDPI and ACS Style
Pavlov, A.N.; Dubrovskii, A.I.; Pavlova, O.N.; Semyachkina-Glushkovskaya, O.V. Effects of Sleep Deprivation on the Brain Electrical Activity in Mice. Appl. Sci. 2021, 11, 1182. https://0-doi-org.brum.beds.ac.uk/10.3390/app11031182
AMA Style
Pavlov AN, Dubrovskii AI, Pavlova ON, Semyachkina-Glushkovskaya OV. Effects of Sleep Deprivation on the Brain Electrical Activity in Mice. Applied Sciences. 2021; 11(3):1182. https://0-doi-org.brum.beds.ac.uk/10.3390/app11031182
Chicago/Turabian StylePavlov, Alexey N., Alexander I. Dubrovskii, Olga N. Pavlova, and Oxana V. Semyachkina-Glushkovskaya. 2021. "Effects of Sleep Deprivation on the Brain Electrical Activity in Mice" Applied Sciences 11, no. 3: 1182. https://0-doi-org.brum.beds.ac.uk/10.3390/app11031182
Note that from the first issue of 2016, this journal uses article numbers instead of page numbers. See further details here.