Article

Ultrasonic Imaging of Thick Carbon Fiber Reinforced Polymers through Pulse-Compression-Based Phased Array

1
Dipartimento di Ingegneria, Università di Perugia, 06123 Perugia, Italy
2
Dipartimento di Ingegneria Informatica, Modellistica, Elettronica e Sistemistica, Università della Calabria, 87036 Arcavacata, Italy
3
SIEMENS AG Corporate Technology, 81739 Munich, Germany
*
Author to whom correspondence should be addressed.
Submission received: 14 January 2021 / Revised: 30 January 2021 / Accepted: 2 February 2021 / Published: 7 February 2021

Abstract

:
The use of pulse-compression in ultrasonic non-destructive testing has assured, in various applications, a significant improvement in the signal-to-noise ratio. In this work, the technique is combined with linear phased array to improve the sensitivity and resolution in the ultrasonic imaging of highly attenuating and scattering materials. A series of tests were conducted on a 60 mm thick carbon fiber reinforced polymer benchmark sample with known defects using a custom-made pulse-compression-based phased array system. Sector scan and total focusing method images of the sample were obtained with the developed system and were compared with those reconstructed by using a commercial pulse-echo phased array system. While an almost identical sensitivity was found in the near field, the pulse-compression-based system surpassed the standard one in the far-field producing a more accurate imaging of the deepest defects and of the backwall of the sample.

1. Introduction

Ultrasonic testing (UT) is the most widespread non-destructive testing (NDT) technique for the assessment of the structural integrity of highly attenuating and scattering materials, such as carbon fiber reinforced polymers (CFRP), both during manufacturing and in service [1,2]. However, the multi-layered structure of the material poses a challenge for the sensitivity and resolution of the testing system, especially when the sample is thick and/or it has complex geometry [3]. The signal-to-noise ratio (SNR) achievable for the echo signal of a defect or the backwall is strongly limited by the multiple reflections due to the ply interfaces, a fact that limits the minimum detectable defect size. Hence, the minimum detectable defect size guaranteed by the testing system is not as small as required.
To overcome this problem, the sensitivity of a UT system can be improved by exploiting hardware or software approaches and/or tools [4,5]. Among them, one of the most effective solutions is using phased array (PA) techniques that allow the shape and position of the sound field in the sample under test (SUT) to be manipulated electronically [6,7,8]. In pulse-echo mode, transmitting and receiving elements coincide, while in pitch–catch configuration, transmitting and receiving elements are distinct, usually grouped in two separated probes as in the present case of a pulse-compression-based system [9]. Using a PA transducer, the UT beam can be steered or focused on multiple angles/positions in the SUT by simply applying proper time delay patterns to the transmitting elements. Thus, all the elements are fired together, and a unique resulting beam is produced with the desired shape or orientation from the coherent superposition of the singular ultrasonic fields [7]. The response of the sample to this excitation is acquired separately for each receiving element. A proper delay pattern is applied on the digitalized output signals that are then summed to produce the total output signal for the specific angle/focusing law. By collecting measurement signals for a set of angles or focusing positions, not only the SNR of the single 1D measurement can be enhanced, but 2D or 3D images of the SUT can be retrieved [10,11].
For instance, a real-time sector scan image of the sample can be reconstructed by exploiting the full aperture of a linear array transducer and by steering the beam in the desired range of angles. Thanks to the developments of digital signal generation, acquisition, and processing systems in the last few decades, sector scan images can be produced in real-time with quite high rates, as in medical UT [12]. However, ultrasonic images with even better spatial resolution and SNR can be obtained by post-processing techniques such as full matrix capture (FMC), where each transmitting element is fired alone, and the responses of all the receiving elements are collected and stored. Starting from these data, the total focusing method (TFM) is used to generate 2D or 3D images [13,14]: for the pixels of the image, a specific delay is calculated and applied to all the possible pairs of transmitting and receiving elements and then the signals from all the pairs are summed to calculate the pixel intensity. TFM images provide a better sensitivity than steering or dynamically focusing images for the detection of small defects [15,16]. In addition, time reversal and multiple signal classification (MUSIC) algorithms were proposed for their ability to resolve closely spaced scatterers [17].
In addition to PA techniques, many other efforts have been made to define signal processing protocols capable of increasing the sensitivity and resolution of the various UT inspection methods. An example of such techniques is pulse compression (PuC). The core of the procedure is to exploit time and frequency domain signal modulation techniques [18]. The technique is well established in the NDT community and has been proven to improve SNR in a wide span of applications.
PuC is extensively used in air-coupled UT [19,20], medical sonography [21,22], and for the UT inspection of high-attenuating materials [23,24]. PuC is also used in guided waves [25,26], thermography [27,28,29], and it has been also successfully applied to eddy current testing [30].
In this work, PuC is combined with PA ultrasonic testing to inspect a thick CFRP sample. The main contribution of this paper is neither pulse-compression, nor PA-based imaging—both being well known—but their contextual use for the NDT of composites and the comparison of the sensitivity and resolution obtained with those of a standard, commercial pulse-echo system. To our knowledge, while PuC-based PA imaging is widely used in medical ultrasound, its use in NDT is still almost unknown. We hope that the results reported here will stimulate more investigations on the potentialities of such a technique.
The paper is organized as follows: Section 2 briefly resumes the PuC theory, while Section 3 describes the hardware system used for driving the PuC-PA system and the imaging procedures implemented. In Section 4, the experimental results collected on a 60 mm thick CFRP sample are reported for both the PuC-based system and a standard commercial one. Analysis of the results and conclusions are presented in Section 5.

2. Pulse-Compression

PuC was initially introduced in radar systems with the purpose of improving the inspection range and/or the range resolution of the system by using swept frequency “chirps” excitation and related modulated signals [31,32]. The successful application in radar lead to the use of PuC in many other fields, such as ultrasonic inspections, sonar, and audio. F. Lam and J. Szilard were among the first to implement PuC in ultrasonic NDT, and they demonstrated that the sensitivity of the inspection system can be increased without compromising the resolution [33]. Pollakowski and Ermert showed the high flexibility of chirp signals to cope with the measurement system [34], while Misaridis and Jensen analyzed the performance of PuC for UT medical imaging [18].
The basic principle of PuC lies in the convolution of a pair of signals s ( t ) and Ψ ( t ) , such that δ ^ ( t ) = [ s * Ψ ] ( t ) , where the symbol * denotes the convolution operator. This pair is used to estimate the impulse response of a linear time invariant (LTI) system, with the estimation quality being better as long as the δ ^ ( t ) is close to a Dirac’s delta function δ ( t ) .
Under this assumption, if s ( t ) is the excitation signal and { } the operator describing the sample’s response, the PuC output h ^ ( t ) estimated impulse response, is nothing but the convolution between the system’s output y ( t ) = { s ( t ) } and the so-called matched filter Ψ ( t ) :
h ^ ( t ) = [ y * Ψ ] ( t ) = [ [ s * h ] * Ψ ] ( t ) = [ [ s * Ψ ] * h ] ( t ) = [ δ ^ * h ] ( t )
It was found that the SNR of the estimated impulse response is maximized when the matched filter is the time reversed replica of the excitation, as established by matched filter theory [35]. This means that Ψ ( t ) = s ( t ) , and hence, δ ^ ( t ) is the autocorrelation of s ( t ) . At the same time, as mentioned above, the closer the δ ^ ( t ) to the Dirac’s delta, the better is the estimation accuracy. It can be argued, therefore, that suitable signals for PuC must have a δ -like autocorrelation function. Chirp signals with proper bandwidth and phase-modulated signals, such as pseudo-noise binary sequences, are therefore suitable candidates for PuC [36]. Equation (1) is indeed valid in the general case and not only for frequency modulated signals.
In practice, when using bandpass chirp signals, some sidelobes are always present in δ ^ ( t ) . To mitigate this effect, which could generate artifacts in the images, the matched filter amplitude is usually tapered by a proper window function w ( t ) that reduces the sidelobe level at the cost of a reduced range resolution, Ψ ( t ) = w ( t ) s ( t ) [20,21]. The results reported in this manuscript were obtained by using a linear chirp signal and reactance-Tukey window, as defined in [37].
Chirp signals are more flexible in terms of frequency and time domains shaping compared to the binary coded sequences, and they are the best choice when using single-shot excitation, see [20] for details. In the experiments, the bandwidth of the chirp signal was optimized according to the resulting spectral characteristics of the measurement setup, consisting of the employed transducers and the SUT, to attain the best possible sensitivity and resolution. The duration of the excitation signal was the maximum possible for the given measurement condition, i.e., beam steering or full matrix capture.

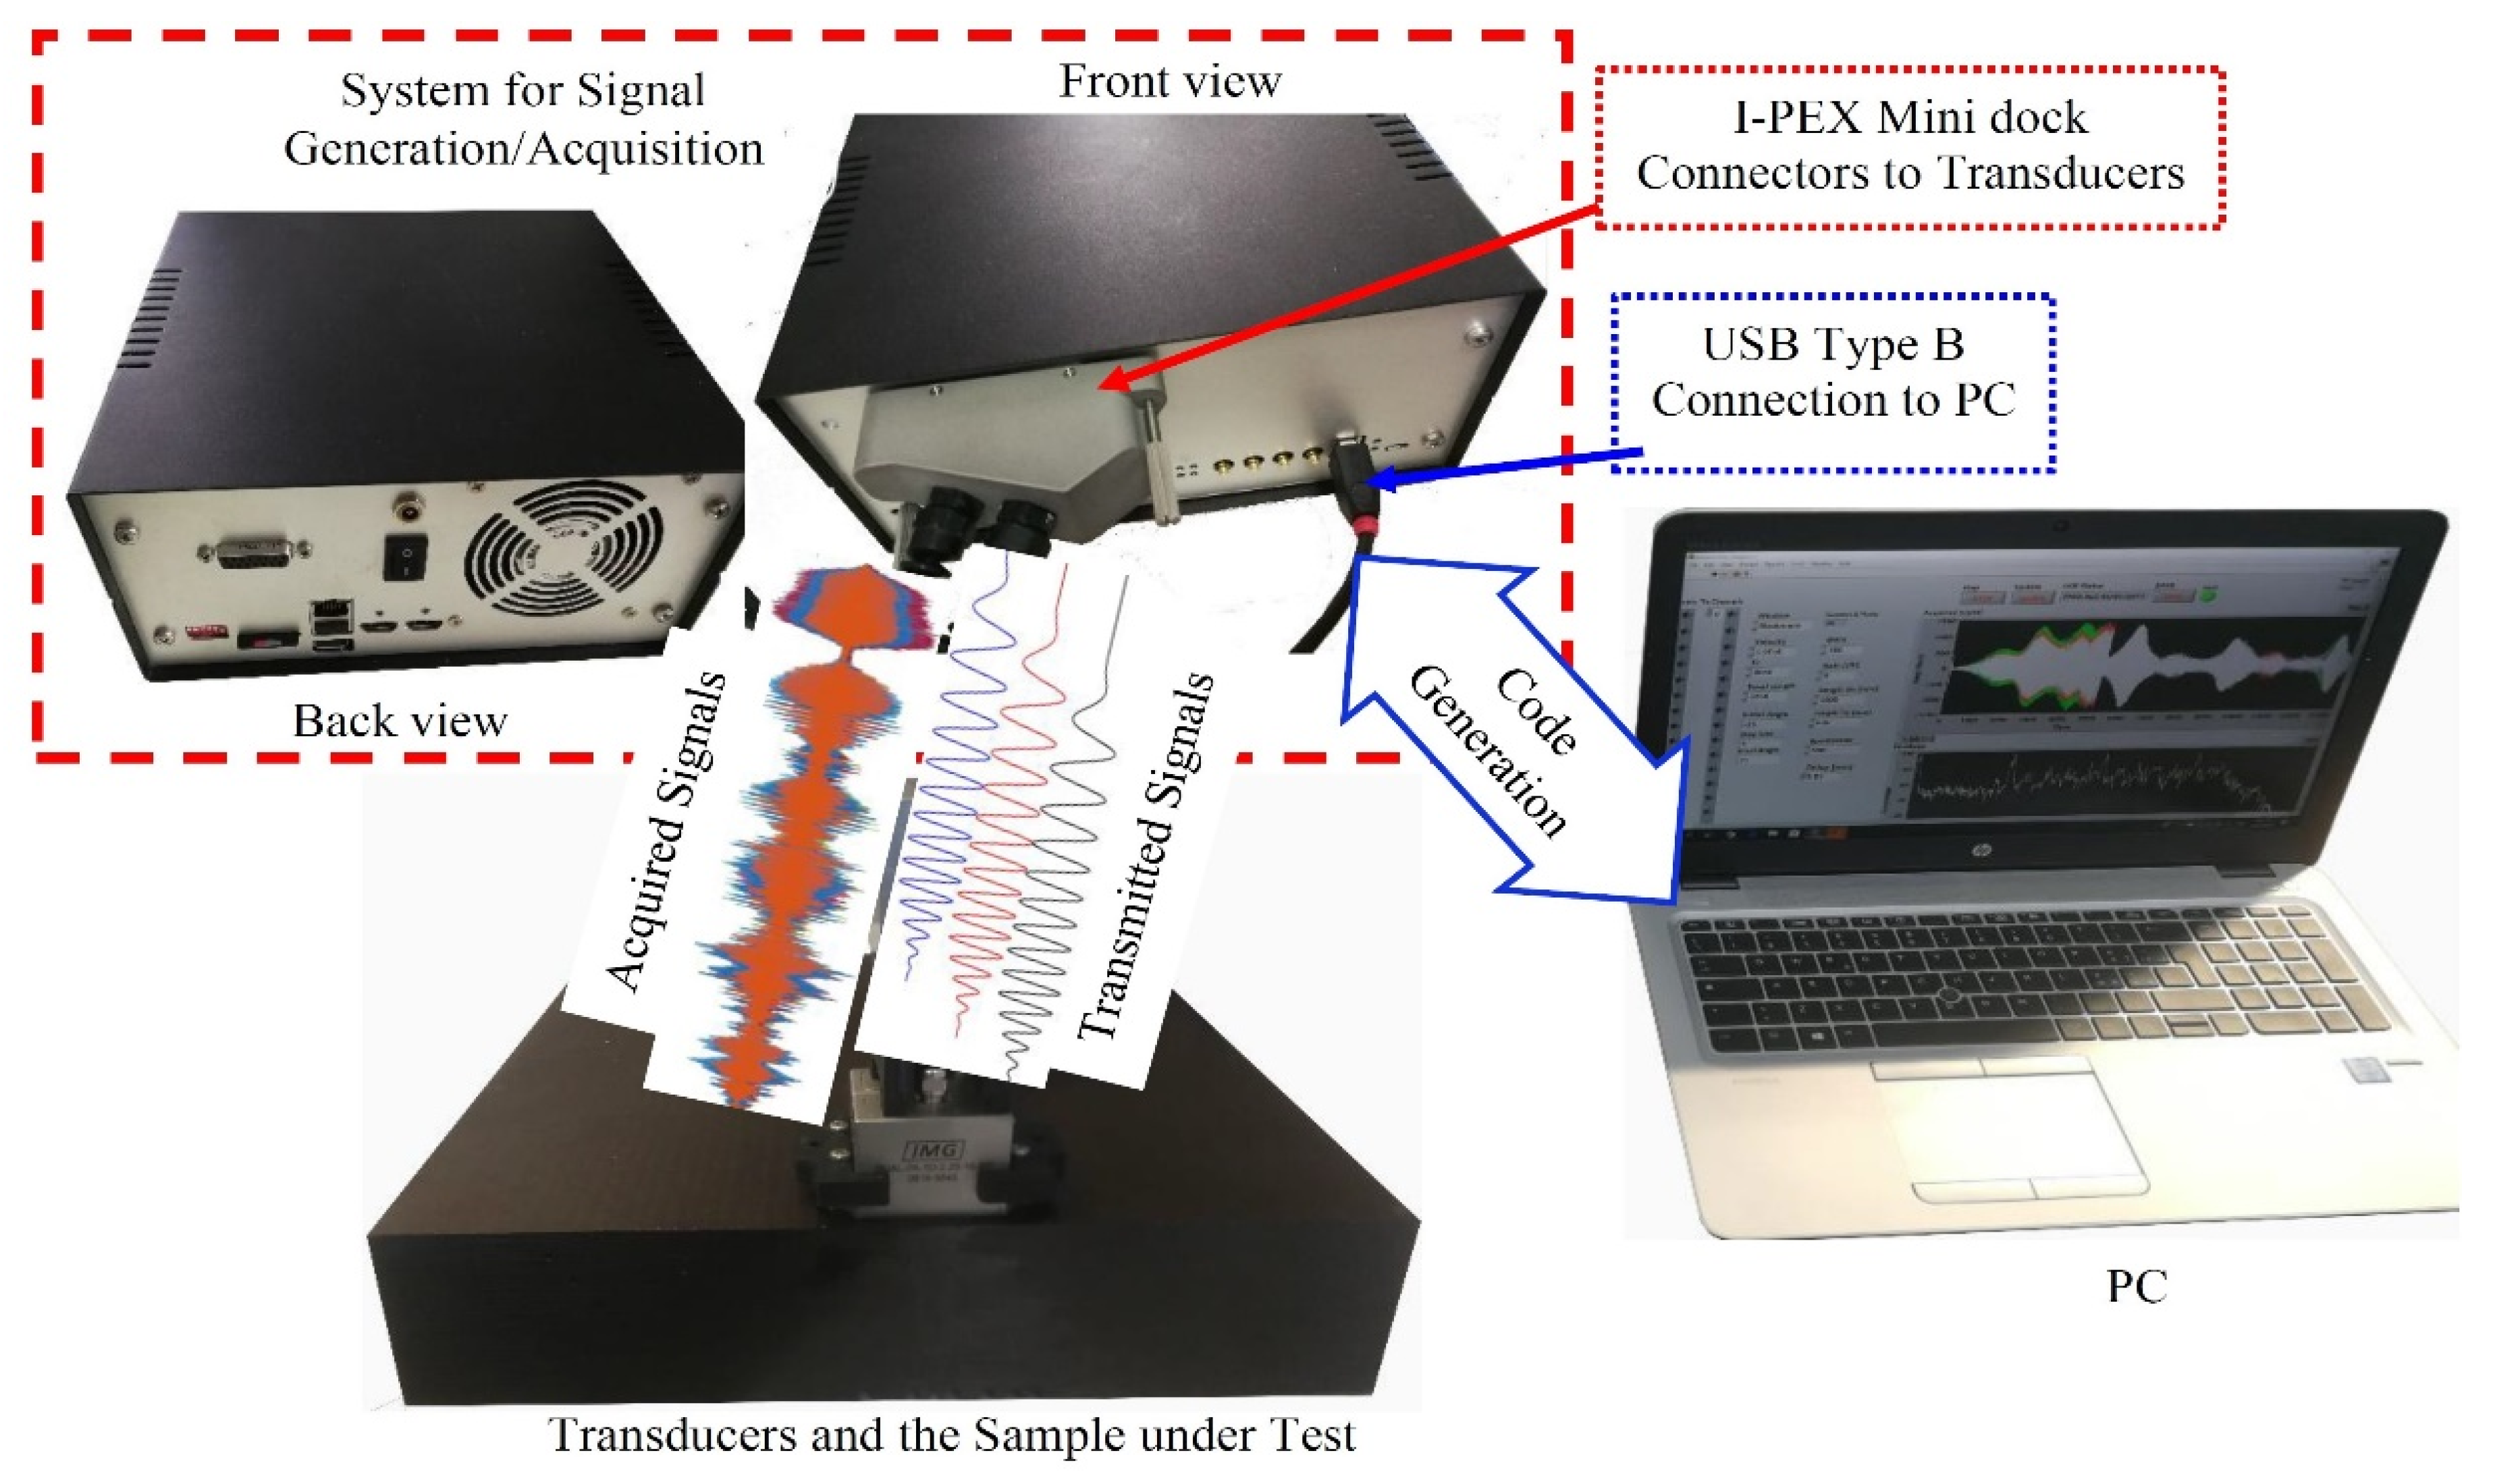
3. Pulse-Compression-Based Phased Array Setup and Imaging Procedures

The implementation of the PuC in PA ultrasonic testing requires a hardware system capable of generating an independent arbitrary waveform for each transmitting element, even with long duration. This is to generate the desired coded excitation, as well as for applying both variable time and phase shift delays to each channel (beamforming) and amplitude modulation among the elements (apodization) [9]. Moreover, to fully exploit the PuC features, the time–bandwidth product of the coded signal should be the largest possible, so the signal generation and acquisition system should have a flat operating bandwidth, at least constant over the bandwidth of the transducer. For this purpose, a specific hardware system was designed and realized by X-Phase s.r.l. (Sesto Fiorentino, Italy) for driving a pair of 16 linear array transducers in pitch–catch mode. The system contains 16 arbitrary waveform generators based on a 500 MS/s Delta-sigma modulator and 16 ADC with 12-bit resolution. Each generator can transmit a coded signal up to 100 ms duration with a maximum amplitude of 158 Vp-p. The maximum length of the acquired signals can be up to 500 ms with a constant sampling rate of 50 Mbps. This depends on the on-board memory.
The overall PuC-based measurement setup consists of:
  • The hardware system for signal generation and acquisition;
  • A desktop computer where the code for PuC is generated, including all the signal manipulation processes required for the UT image reconstruction (time delay laws, apodization, etc.);
  • A pair of 16-element linear array transducers working in pitch–catch configuration.
The PuC-based measurement setup is illustrated in Figure 1, where the transmitting and receiving array transducers are placed adjacent to each other, so as to maintain a measurement configuration which is as close as possible to the standard pulse-echo setup. In order to construct the ultrasonic images of the sample, the transmitted beam of the array transducer is manipulated (steered and focused, etc.) by applying the time delays law to the generated chirp signals of each element before the transmission, in full analogy with the standard pulse-echo PA testing [9]. On the other hand, in reception, the acoustic beam is manipulated by applying time delays to the acquired signal after the PuC process. Note that for the linearity of the overall processing, the outcome is the identical if the time delays were applied before the PuC process [38]. Other beam manipulation techniques such as apodization work exactly in the same manner for pulsed or chirp excitations.
Two types of PA imaging procedures were adopted in this work.
(i)
Sector and focused scan imaging: in this method, the full aperture of the array transducer is exploited where the UT beam is focused at a specific depth and steered by applying time delays to both the transmitted and received signals at the array elements. A 2D image of the sample is reconstructed by sweeping the sound beam of the array transducer through a discrete set of directions within the sample [8].
(ii)
The total focusing method (TFM): the method is typically used when a better resolution and sensitivity is required, especially for the detection of smaller defects. The image is reconstructed from the post-processing of FMC data. FMC is an information matrix obtained by exciting a single transmitting element at a time while the echo from the sample is captured through all the receiving elements of the array, and the process is repeated for all the transmitting elements [15,16]. Thus, the matrix consists of N T x × N R x A-scan signals where N T x is the number of transmitting elements and N R x that of receiving elements. Henceforth, we assume N T x = N R x = 16 in the case of the PuC-PA custom system, and N T x = N R x = 43 for the pulse-echo system. Since the transducers used with the PuC and pulse echo systems were different, with different element sizes, the number of elements was chosen so as to achieve the same overall aperture of the transducer in the two cases.
In TFM imaging, the inspection plane/volume to be visualized is subdivided into a grid of pixels/voxels and the UT beam is virtually focused on each point of the grid, both in transmission and reception, by processing the FMC. It is important to mention that for the PuC-PA system where separate transducers are used, the imaging plane is considered in between and equidistant from the transmission and reception transducers; see diagram in Figure 2.

4. Results and Discussion

A comparison of the sensitivity and resolution of the PuC-based system with those of a standard PA ultrasonic testing [39] was carried out by doing measurements on a thick, quasi-isotropic CFRP sample. The sample had 59 layers of carbon fiber fabric with a fiber orientation of 0°/90° and −45°/45° degrees in the successive plies. The matrix material was a standard Epoxy resin. The volumetric density of the material was 1.14 g/cm3, while its compression and tensile modulus were 3.2 GPa and 3.0 GPa, respectively, measured at a temperature of 23 °C. The total thickness of the sample was 60 mm, with known standard defects, which were basically a series of side drilled holes.
There were seven side drilled holes, 2 mm diameter each, drilled 20 mm deep to the side surface and 10 mm apart from each other while changing in depth from the surface of inspection, as depicted in the picture and sketch of the sample in Figure 3.
The pulse-echo measurements were performed using a commercial system from Advanced OEM Solutions in combination with a linear array transducer “2.25L64-A2” from Olympus. The transducer had the central frequency of 2.25 MHz and a total number of 64 elements. The pitch and length of a single element were 0.75 mm and 12 mm, respectively. To maintain an equivalent aperture in the transducer system used for the PuC-based method, only 43 out of 64 active elements of the array transducer were used.
For the PuC measurements, a pair of 16-element linear array transducers manufactured by IMG Ultrasounds with a central frequency of 2.25 MHz were used. The pitch and length of an element were 2 mm and 16 mm, respectively. The transmission and reception transducers were placed in a pitch–catch configuration and aligned side-by-side along the array direction to obtain a configuration as close as possible to that used for pulse-echo measurements. For the excitation, a linear chirp signal ranging from 150 kHz to 2.85 MHz was used, corresponding to a central frequency of 1.5 MHz and a relative bandwidth equal to 180% of the central frequency.
No window function, i.e., envelope amplitude modulation, was applied to the excitation signal s ( t ) . On the other hand, the acquired signal at each channel of the array was convolved with a windowed matched filter to retrieve the impulse response, i.e., an A-scan echo signal, while reducing the sidelobe levels. An example of the typical signals in a PuC measurement is presented in Figure 4, where the input signal is a linear chirp with approximately 0.54 ms of duration and the same frequency range as indicated above. The impulse response is then retrieved from the convolution of the acquired signal with the matched filter, where a reactance-Tukey window function w ( t ) was used, as explained in Section 2. In the case of the sector scan, due to limitations in the on-board memory and data throughput, the excitation chirp was approximately five times shorter, i.e. corresponding to a 1 ms duration. The shown envelope of the echo signal is obtained by exploiting the Hilbert transform of the impulse response.
The sector and focused scan images were obtained by sweeping the ultrasonic beam in the SUT in a field of view of ± 22 ° with a step size of 0.5 ° and focused on a focal length of 60 mm from the transducer surface, approximately corresponding to the backwall distance. The obtained sector and focused scan images from the PuC-based system and the standard pulse-echo system are presented in Figure 5. It can be observed in the images that the PuC method demonstrates a higher sensitivity than pulse-echo for the deeper defects and a clearer visualization of the backwall. This could be better noticed by looking at the surface images of the deeper defects, i.e., defects no. 3 and no. 4, as reported in Figure 6. The sensitivity of the pulse-echo image rapidly decreases with the distance from the surface, as expected [40]. On the other hand, this effect is significantly less prominent for PuC. We believe this is mainly due to this reason: in the proximity of the transducers, the PuC system suffers a reduction of sensitivity as the transmitting and receiving beams do not overlap completely (in elevation direction). As long as the distance from the transducer increases, this effect decreases, which then improves the gain of the SNR provided by PuC-PA method. We note also that the defect shape is better reconstructed in the PuC images, even if a smaller number of elements were used.
Additionally, the FMC data were acquired by using both systems. For PuC measurements, in addition to the linear array transducers used for the sector scan, a pair of 16-element linear array transducers was used as well, with a central frequency of 4 MHz, and the pitch and length of the element equal to 2 mm and 16 mm, respectively. The FMC data consisted of 16 × 16 and 43 × 43 A-scan signals for the PuC and the pulse-echo data. The TFM images were constructed by considering a square spatial grid with a mesh size of 0.1 mm in both directions. The delay-and-sum (DAS) method was utilized in the frequency domain for the TFM image reconstruction [15,16]. The A-scan signals were first converted to the frequency domain through the fast Fourier transform (FFT), then phase-shifted with the required time delays, summed up at the corresponding spatial location, and converted back to the time domain. However, the summation of all the possible A-scan signals contributes to the appearance of the artifacts in the images, especially near to the surface of the transducer. This was filtered out by considering a generated/received field with an angular aperture between +60° and −60° for each element.
Figure 7 reports the TFM images obtained from the PuC procedure by using the 2.25 MHz pair of transducers and chirp signal with a central frequency of 1.5 MHz and a bandwidth of 180% of the central frequency, while the TFM image obtained with the pulse-echo system is presented in Figure 8.
The images are represented in three different ways: the amplitude of the full wave field and its energy in both linear and dB scales have been visualized.
It can be observed that the two measurement setups exhibit a very similar sensitivity for detecting the defects, i.e., defect no. 1 to no. 4. However, the PuC-based method demonstrates, as for the sector scan, a better sensitivity for the deepest defects. Figure 9 shows a zoom of the image around defects 3 and 4. Further, also in the case of the TFM, in the PuC images, the defect shapes are closer to the real ones than in the pulse-echo images.
The TFM images were obtained by processing the FMC PuC data acquired with different chirp excitation signals and with the second pair of linear transducers. The results are presented in Figure 10, Figure 11 and Figure 12. The results reported in Figure 7 and Figure 10 are very similar, even though the upper limit of the chirp bandwidth passed from ~3 MHz to ~4 MHz. This is because the high-frequency components are highly attenuated inside the sample. The results in Figure 11 instead show a slight decrease in the sensitivity with respect to the deepest defects, but even larger than that of the pulse-echo images. Note that the transducers employed to obtain these results in Figure 11 are designed to operate at 4 MHz, but the chirp excitation center frequency was 2.5 MHz, so the transducers did not work in the bandwidth of the highest sensitivity.
Moreover, the improvement in the SNR achieved in the PuC-based system can be better understood by looking at the intensity of defects in the TFM images. For this reason, cross-section lines through the position of defects in the TFM images of Figure 7 and Figure 8 are presented in Figure 13. Obviously, the higher amplitude of the deepest defects no. 4 and no. 5 in the PuC-based TFM image compared with the one in the standard TFM image is an indicator of the better SNR and sensitivity of the proposed system.

5. Conclusions

The pulse-compression technique was successfully implemented in combination with a linear phased array system to inspect a 60 mm thick CFRP sample with artificial defects. This was achieved through the development of a custom hardware–software platform for signal generation/acquisition, together with the complementary tools for the ultrasonic phased array image reconstruction. A series of ultrasonic tests were carried out with the pulse-compression-based system and with a commercial pulse-echo one, and the results were compared. Both the sector scan and the total focusing method images of the sample were obtained with the two methods.
The two systems produced very similar results, even though the images obtained with pulse-compression exhibited a better sensitivity for the detection of the deepest defects as well as a better defect shape reconstruction compared to the standard pulse-echo method.
These preliminary results encourage further improvement to the system and to extend the analysis of the benefits of PuC-PA inspection to more challenging samples with higher attenuation or larger dimensions, where the pulse-echo method cannot assure enough sensitivity to detect deep defects.

Author Contributions

Conceptualization, M.R., S.L., and M.K.R.; methodology of sample realization, H.M. and M.G.; software, formal analysis, and investigation, M.K.R., S.L., and M.R.; writing—original draft preparation, M.K.R. and M.R.; funding acquisition and supervision, M.R., H.M., and M.G. All authors have read and agreed to the published version of the manuscript.

Funding

This research work was funded from the European Union’s Horizon 2020 research and innovation programme under the Marie Skłodowska-Curie grant agreement No. 722134—NDTonAIR.

Institutional Review Board Statement

Not applicable.

Informed Consent Statement

Not applicable.

Data Availability Statement

The data presented in this study are available on request from the corresponding author.

Conflicts of Interest

The authors declare no conflict of interest.

References

  1. Meola, C.; Toscano, C. Non Destructive evaluation of carbon fiber reinforced polymers with ultrasonics and infrared thermography: An overview on historical steps and patents. Recent Pat. Mater. Sci. 2012, 5, 48–67. [Google Scholar] [CrossRef]
  2. Brotherhood, C.J.; Drinkwater, B.W.; Freemantle, R.J. An ultrasonic wheel-array sensor and its application to aerospace structures. Insight Non-Destr. Test. Cond. Monit. 2003, 45, 729–734. [Google Scholar] [CrossRef]
  3. Jasiūnienė, E.; Mažeika, L.; Samaitis, V.; Cicėnas, V.; Mattsson, D. Ultrasonic non-destructive testing of complex titanium/carbon fibre composite joints. Ultrasonics 2019, 95, 13–21. [Google Scholar] [CrossRef]
  4. Park, J.; Hu, C.; Li, X.; Zhou, Q.; Shung, K.K. Wideband linear power amplifier for high-frequency ultrasonic coded excitation imaging. IEEE Trans. Ultrason. Ferroelectr. Freq. Control 2012, 59, 825–832. [Google Scholar] [CrossRef]
  5. Zhang, G.M.; Harvey, D.M. Contemporary ultrasonic signal processing approaches for nondestructive evaluation of multilayered structures. Nondestruct. Test. Eval. 2012, 27, 1–27. [Google Scholar] [CrossRef]
  6. Huang, R.; Schmerr, L.W.; Sedov, A. Modeling the radiation of ultrasonic phased-array transducers with Gaussian beams. IEEE Trans. Ultrason. Ferroelectr. Freq. Control 2008, 55, 2692–2702. [Google Scholar] [CrossRef] [PubMed]
  7. Nakahata, K.; Kono, N. 3-D modelings of an ultrasonic phased array transducer and its radiation properties in solid. In Ultrasonic Waves; InTech: Rijeka, Croatia, 2012; pp. 59–80. [Google Scholar]
  8. Drinkwater, B.W.; Wilcox, P.D. Ultrasonic arrays for non-destructive evaluation: A review. NDT E Int. 2006, 39, 525–541. [Google Scholar] [CrossRef]
  9. Schmerr, L.W. Fundamentals of Ultrasonic Nondestructive Evaluation; Springer: New York, NY, USA, 2016; pp. 241–249. [Google Scholar]
  10. Macovski, A. Ultrasonic imaging using arrays. Proc. IEEE 1979, 67, 484–495. [Google Scholar] [CrossRef]
  11. Johnson, J.A.; Karaman, M.; Khuri-Yakub, B.T. Coherent-array imaging using phased subarrays. Part I: Basic principles. IEEE Trans. Ultrason. Ferroelectr. Freq. Control 2005, 52, 37–50. [Google Scholar] [CrossRef] [PubMed] [Green Version]
  12. Sutcliffe, M.; Weston, M.; Dutton, B.; Charlton, P.; Donne, K. Real-time full matrix capture for ultrasonic non-destructive testing with acceleration of post-processing through graphic hardware. NDT E Int. 2012, 51, 16–23. [Google Scholar] [CrossRef]
  13. Szabo, T.L. Diagnostic Ultrasound Imaging: Inside Out; Elsevier Academic Press: Burlington, MA, USA, 2004; pp. 298–330. [Google Scholar]
  14. Shung, K.K. Diagnostic Ultrasound: Imaging and Blood Flow Measurements; CRC Press: Boca Raton, FL, USA, 2015. [Google Scholar]
  15. Holmes, C.; Drinkwater, B.W.; Wilcox, P.D. Post-processing of the full matrix of ultrasonic transmit—receive array data for non-destructive evaluation. NDT E Int. 2005, 38, 701–711. [Google Scholar] [CrossRef]
  16. Zhang, J.; Drinkwater, B.W.; Wilcox, P.D.; Hunter, A.J. Defect detection using ultrasonic arrays: The multi-mode total focusing method. NDT E Int. 2010, 43, 123–133. [Google Scholar] [CrossRef]
  17. Fan, C.; Caleap, M.; Pan, M.; Drinkwater, B.W. A comparison between ultrasonic array beamforming and super resolution imaging algorithms for non-destructive evaluation. Ultrasonics 2014, 54, 1842–1850. [Google Scholar] [CrossRef] [Green Version]
  18. Misaridis, T.; Jensen, J.A. Use of modulated excitation signals in medical ultrasound. Part II: Design and performance for medical imaging applications. IEEE Trans. Ultrason. Ferroelectr. Freq. Control 2005, 52, 192–207. [Google Scholar] [CrossRef] [PubMed]
  19. Gan, T.H.; Hutchins, D.A.; Billson, D.R.; Schindel, D.W. The use of broadband acoustic transducers and pulse-compression techniques for air-coupled ultrasonic imaging. Ultrasonics 2001, 39, 181–194. [Google Scholar] [CrossRef]
  20. Hutchins, D.; Burrascano, P.; Davis, L.; Laureti, S.; Ricci, M. Coded waveforms for optimised air-coupled ultrasonic nondestructive evaluation. Ultrasonics 2014, 54, 1745–1759. [Google Scholar] [CrossRef] [PubMed] [Green Version]
  21. Misaridis, T.; Jensen, J.A. Use of modulated excitation signals in medical ultrasound. Part I: Basic concepts and expected benefits. IEEE Trans. Ultrason. Ferroelectr. Freq. Control 2005, 52, 177–191. [Google Scholar] [CrossRef]
  22. Ramalli, A.; Guidi, F.; Boni, E.; Tortoli, P. A real-time chirp-coded imaging system with tissue attenuation compensation. Ultrasonics 2015, 60, 65–75. [Google Scholar] [CrossRef]
  23. Rizwan, M.K.; Senni, L.; Burrascano, P.; Laureti, S.; Goldammer, M.; Mooshofer, H.; Borgna, R.; Neri, S.; Ricci, M. Contextual application of Pulse-Compression and Multi-frequency Distance-Gain Size analysis in ultrasonic inspection of forging. J. Nondestruct. Eval. 2019, 38, 72. [Google Scholar] [CrossRef]
  24. Hutchins, D.A.; Watson, R.L.; Davis, L.A.; Akanji, L.; Billson, D.R.; Burrascano, P.; Laureti, S.; Ricci, M. Ultrasonic Propagation in Highly Attenuating Insulation Materials. Sensors 2020, 20, 2285. [Google Scholar] [CrossRef] [Green Version]
  25. Lin, J.; Hua, J.; Zeng, L.; Luo, Z. Excitation waveform design for Lamb wave pulse compression. IEEE Trans. Ultrason. Ferroelectr. Freq. Control 2015, 63, 165–177. [Google Scholar] [CrossRef]
  26. De Marchi, L.; Marzani, A.; Moll, J.; Kudela, P.; Radzieński, M.; Ostachowicz, W. A pulse coding and decoding strategy to perform Lamb wave inspections using simultaneously multiple actuators. Mech. Syst. Signal. Process. 2017, 91, 111–121. [Google Scholar] [CrossRef]
  27. Malekmohammadi, H.; Laureti, S.; Burrascano, P.; Ricci, M. Comparison of optimisation strategies for the improvement of depth detection capability of Pulse-Compression Thermography. Quant. InfraRed Thermogr. J. 2020, 17, 26–39. [Google Scholar] [CrossRef]
  28. Mulaveesala, R.; Arora, V.; Dua, G. Pulse compression favorable thermal wave imaging techniques for non-destructive testing and evaluation of materials. IEEE Sens. J. 2020. [Google Scholar] [CrossRef]
  29. Hedayatrasa, S.; Poelman, G.; Segers, J.; Van Paepegem, W.; Kersemans, M. On the application of an optimized Frequency-Phase Modulated waveform for enhanced infrared thermal wave radar imaging of composites. Opt. Lasers Eng. 2021, 138, 106411. [Google Scholar] [CrossRef]
  30. Ferrigno, L.; Laracca, M.; Malekmohammadi, H.; Tian, G.Y.; Ricci, M. Comparison of time and frequency domain features’ immunity against lift-off in pulse-compression eddy current imaging. NDT E Int. 2019, 107, 102152. [Google Scholar] [CrossRef]
  31. Barton, D. Radars. Volume 3—Pulse Compression; Artech House, Inc.: Dedham, MA, USA, 1975; p. 236. [Google Scholar]
  32. Levanon, N.; Mozeson, E. Radar Signals; John Wiley & Sons: Hoboken, NJ, USA, 1975. [Google Scholar]
  33. Lam, F.; Szilard, J. Pulse compression techniques in ultrasonic non-destructive testing. Ultrasonics 1976, 14, 111–114. [Google Scholar] [CrossRef]
  34. Pollakowski, M.; Ermert, H. Chirp signal matching and signal power optimization in pulse-echo mode ultrasonic nondestructive testing. IEEE Trans. Ultrason. Ferroelectr. Freq. Control 1994, 41, 655–659. [Google Scholar] [CrossRef]
  35. Turin, G. An introduction to matched filters. IRE Trans. Inf. Theory 1960, 6, 311–329. [Google Scholar] [CrossRef] [Green Version]
  36. White, J.D.H.; Challis, R.E. A Golay sequencer based NDT system for highly attenuating materials. In Proceedings of the IEE Colloquium on Non-Contacting and Remote NDT, London, UK, 10 November 1992; IET: London, UK, 1992; pp. 7/1–7/7. [Google Scholar]
  37. Burrascano, P.; Laureti, S.; Senni, L.; Ricci, M. Pulse compression in nondestructive testing applications: Reduction of near sidelobes exploiting reactance transformation. IEEE Trans. Circuits Syst. I Regul. Pap. 2018, 66, 1886–1896. [Google Scholar] [CrossRef]
  38. Burrascano, P.; Callegari, S.; Montisci, A.; Ricci, M.; Versaci, M. (Eds.) Ultrasonic Nondestructive Evaluation Systems: Industrial Application Issues; Springer: Berlin/Heidelberg, Germany, 2014. [Google Scholar]
  39. Azhari, H. Basics of Biomedical Ultrasound for Engineers; John Wiley & Sons: Hoboken, NJ, USA, 2010. [Google Scholar]
  40. You, K.; Kim, S.H.; Choi, H. A Class-J Power Amplifier Implementation for Ultrasound Device Applications. Sensors 2020, 20, 2273. [Google Scholar] [CrossRef] [PubMed]
Figure 1. Schematic representation of the pulse-compression-based phased-array (PuC-PA) ultrasonic testing system: coded signals are generated in a personal computer and fed to the system for signal generation and acquisition; the ultrasonic signals are transmitted and received with separate transducers in a pitch–catch configuration, and the acquired and digitalized signals are sent back to the computer for processing and imaging purposes.
Applsci 11 01508 g001
Figure 2. Illustration of the total focusing method (TFM) image reconstruction procedure when the full matrix capture (FMC) data are acquired using a pulse-compression-based linear phased-array (PuC-PA) system. Two separated array transducers are used for the transmission and reception of ultrasonic testing (UT) signals, and the plane in the middle of the two transducers is visualized.
Applsci 11 01508 g002
Figure 3. (a) Sketch and (b) picture of the (60 mm thick carbon fiber-reinforced polymers (CFRP)) sample under test, indicating the side drilled holes located at different depths from the surface of inspection (all the dimensions are in mm).
Applsci 11 01508 g003
Figure 4. Examples of the signals involved in the pulse compression ultrasonic measurement: the input chirp signal (top-left) applied to the transmitting element; the echo signal acquired through the reception element of the array transducer (top-right); the impulse response of the sample under test (SUT) retrieved by convolving the acquired signal with the matched filter (bottom).
Applsci 11 01508 g004
Figure 5. Sector scan images of the CFRP sample obtained by using the full aperture of the UT array transducers; (a) image obtained with the pulse-compression-based system and (b) image obtained using with the pulse-echo system.
Applsci 11 01508 g005
Figure 6. Surface view of a zoom of the sector scan images of Figure 5. around the location of the defects no. 3 and no. 4. Results of the measurements with (a) pulse-compression and (b) pulse-echo systems.
Applsci 11 01508 g006
Figure 7. TFM Image of the CFRP sample, obtained using a linear chirp coded excitation signal, and the pulse-compression procedures. The images visualize (a) the full-wave amplitude, (b) the energy, and (c) the energy in the dB scale of the echo signal.
Applsci 11 01508 g007
Figure 8. TFM image of the CFRP sample obtained from the FMC data captured using the standard and commercial pulse-echo system. The colormap in the images indicates (a) the full-wave amplitude, (b) the energy, and (c) the energy in the dB scale of the echo signal.
Applsci 11 01508 g008
Figure 9. Surface image of the defects no. 3 and no. 4, highlighting the defect detection capability of the used methods. (ac) are the 3D demonstration of the pulse-compression-based TFM images shown in Figure 7, while (df) are the 3D demonstration of the standard pulse-echo-based TFM images shown in Figure 8, at the location of defects no. 3 and no. 4.
Applsci 11 01508 g009
Figure 10. TFM image of the sample obtained using pulse-compression and chirp excitation signals with a central frequency of 2.25 MHz. The central frequency of the array transducer was 2.25 MHz as well. The image is reconstructed considering (a) the full-wave amplitude, (b) energy, and (c) the energy shown in the dB scale of the echo signals.
Applsci 11 01508 g010
Figure 11. TFM image of the CFRP sample, but, this time, obtained employing array transducers with a central frequency of 4 MHz while the central frequency of the chirp signal was 2.50 MHz. The image is reconstructed based on the (a) the full-wave amplitude, (b) the energy, and (c) energy in the dB scale of the UT echo signals.
Applsci 11 01508 g011
Figure 12. Surface image of the defects no.3 and no.4. (ac) are the 3D demonstration of the TFM image shown in Figure 10, while (de) are the 3D demonstration of the TFM image shown in Figure 11.
Applsci 11 01508 g012
Figure 13. The plot is a cross-section line through the position of the defects which shows the intensity of the TFM image and highlights the obtained SNR at the defects. (Top) Intensity of the defects in the TFM image of the PuC-based system shown in Figure 7. (Bottom) Intensity of the defects in the TFM image of the standard, commercial pulse-echo system shown in Figure 8.
Applsci 11 01508 g013
Publisher’s Note: MDPI stays neutral with regard to jurisdictional claims in published maps and institutional affiliations.

