Article

Application of the Segmented Correlation Technology in Seismic Communication with Morse Code

1
College of Instrumentation and Electrical Engineering, Jilin University, Changchun 130061, China
2
Key Laboratory of Geophysical Exploration Equipment, Ministry of Education, Jilin University, Changchun 130061, China
*
Author to whom correspondence should be addressed.
Submission received: 31 December 2020 / Revised: 9 February 2021 / Accepted: 18 February 2021 / Published: 23 February 2021
(This article belongs to the Special Issue Advances in Applied Geophysics)

Abstract

:
Seismic communication might promise to revolutionize the theory of seismic waves. However, one of the greatest challenges to its widespread adoption is the difficulty of signal extraction because the seismic waves in the vibration environments, such as seas, streets, city centers and subways, are very complex. Here, we employ segmented correlation technology with Morse code (SCTMC), which extracts the target signal by cutting the collected data into a series of segments and makes these segments cross-correlate with the decoded signal to process the collected data. To test the effectiveness of the technology, a seismic communication system composed of vibroseis sources and geophones was built in an environment full of other vibration signals. Most notably, it improves the signal-to-noise ratio (SNR), extending the relay distance and suppressing other vibration signals by using technology to deal with seismic data generated by the system.

1. Introduction

As early as 1899, scientists started to discuss how to implement a system of communication which could transmit signals through the earth [1]. During World War I, French physicists invented a geophone to detect underground activities in the battlefield, such as underground mining and tunnel excavation [2]. From the middle of the 1980s to the early 1990s, frequent seismic activities threatened the lives and property of miners, which drew the attention of the Canadian federal government, the Ontario provincial government and major mining companies. As a result, the technology of geophones gradually became a significant monitoring method for mine safety and ground control [3]. During the gulf war, the American military took full advantage of the electronic-jamming aircraft to destroy the air defense systems of Iraqi army, which paralyzed the radar systems of the Iraqi army so that the American military quickly won a victory on the battlefield [4]. During a mine disaster in Chile in August 2010, victims hammered a drill and attached a slip of paper to the drill to attract the attention of rescuers [5]. Over the last three decades, many methods have been proposed for communication in special circumstances where radio cannot operate, such as during mine disasters or wars, as mentioned above. To overcome this problem, Hanafy conducted a seismic communication test, where hammering signals are encoded and filtered by a band-pass filter with a hammer and geophones [6,7]. Hao delineated the framework of the rake reception system by analyzing the multipath fading, which adopted time diversity and maximum ratio combination to reduce the bit error rate of propagation about seismic waves [8,9]. Zhang discussed the transmission of seismic signals with direct sequence spread spectrum technology (DSSS), orthogonal frequency division multiplexing technology (OFDM) and code division multiple access technology (CDMA) [10]. He pointed out that a RAKE receiver could be used to solve the problem of multipath fading of seismic waves by MATLAB simulation [11].
With the continuous development of urban underground space, many cities also face similar problems [12,13,14,15]. Some countries would like to only develop shallow underground space to ensure the safety of people and quickly evacuate the population in case of accidents. For example, most underground spaces of cities in China are less than 30 m. However, the increasing cases of urban disaster are seriously endangering the health of the public and the safety of property. For example, on 2 December 2019, more than 1100 rescue workers and 192 emergency rescue vehicles were deployed in Guangzhou to search for underground victims due to the sudden collapse of the ground. On 7 January 2020, a worker was trapped for nine hours in a 30 m deep bomb shelter when an elevator suddenly failed, and his cell phone had no radio signal.
Maintaining the connection between the underground and the ground when the communication of radio or cable is not available is an urgent task [16]. This is a feasible project, as Hanafy mentioned, but there are many shock signals which might interfere with target signals. This study will discuss the influence of other vibration signals (especially the footstep signal) in urban environments and explore how to make use of the SCTMC to extract target signals. For the sake of illustration, this paper will be divided into the following five parts: the principles and methods in seismic communication, the experimental process, the analysis of experimental data, discussion of experimental results and conclusion about the segmented correlation technology.

2. Principles and Methods

Seismic communication systems mainly include four parts: the mode of seismic communication, facilities employed in the experiment, modulation of transmitted signal and the method of signal extraction, as described in the following sections.

2.1. Communication Mode

The establishment of a communication system first needs to determine the method of signal encoding. In different applications, Morse code is one of the most commonly used methods to realize information transmission about short signal [17,18,19]. Compared with other methods, Morse code relies on a stable and unchanging wireless signal so that its wireless communication equipment is simpler and can be used in high noise and weak signal environments [20]. These features will contribute to the realization of seismic communication, so Morse code is adopted in this paper. By encoding information into dot, dash, symbol spaces, character spaces and word spaces, the information can be designed in various orders to deliver different punctuation marks, numbers and letters. Based on the principle of Morse code, a communication network can be set up with seismic transceivers, which can encode, decode, receive and emit seismic signals [21,22,23], as described in Figure 1.
A complete signal, which is compiled by transceivers, consists of a beginning signal, a Morse signal and an end signal. When transceiver 2 receives the beginning signal from transceiver 1, transceiver 2 is activated and decodes the seismic signal. When transceiver 2 receives the end signal from transceiver 1, transceiver 2 interrupts the communication with transceiver 1 and transmits the decoded signal in the form of a complete signal. Then the compiled signals received by other transceivers can be transmitted again so that seismic signals travel a long distance. In this system, the communication distance is the length between the first transceiver and the last transceiver, and the distance between the two adjacent transceivers is the relay distance. This paper will discuss how to take advantage of the SCTMC to extend them. Although the integrated seismic transceiver has not been manufactured yet, it can be taken over by some instruments like vibroseis sources, hammer sources and geophones.

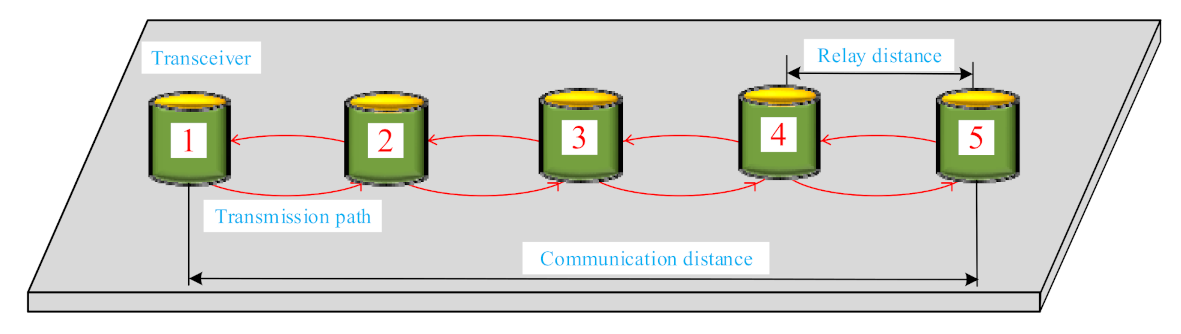
2.2. Experimental Facilities

When a disaster occurs, it is better for victims to send out a distress signal with a hammer or small vibroseis source [24,25,26]. Hammer sources, whose signals are actually shock signals, send out seismic signals by hitting the ground with gravity [27,28]. However, the components of vibration signals in urban environments are very complex, such as a lot of footstep signals (a shock signal) in crowded places, and it is unclear whether the hammer sources are suitable for urban communication. For instance, the amplitudes of the hammering signals obtained at the acquisition may be close to that of the footstep signals after hammering signals pass through the earth, as shown in Figure 2a. The footstep signals and the hammer signals are all weakened when the collected data are filtered by a 5–100 Hz band-pass filter accepted in the experiment of Hanafy, as shown in Figure 2b. The phenomenon occurs because the bandwidths of their frequencies are overlapped, which may increase the bit error rate of the system, as shown in Figure 2c,d.
Unlike hammer sources, the vibroseis source is a continuous vibration source whose duration and frequency can be controlled [29,30,31]. To test the effect of vibroseis signals on the results, footstep signals are synthetically generated, as shown in Figure 3a. After filtering 200 Hz single-frequency signals generated by vibroseis sources with a 180–220 Hz band-pass filter, the footstep signals are significantly weakened while the vibroseis signals are hardly affected, as shown in Figure 3b. The vibroseis sources accepted in this paper have great advantages in signal modulation compared with hammer sources.
The vibroseis source sends seismic signals to the underground in the form of radiant energy, which takes several seconds to release energy. Therefore, the relative durations can be defined: marks—dot = 4 s and dash = 8 s, spaces—symbol space = 4 s, word space = 8 s and sentence space = 12 s.

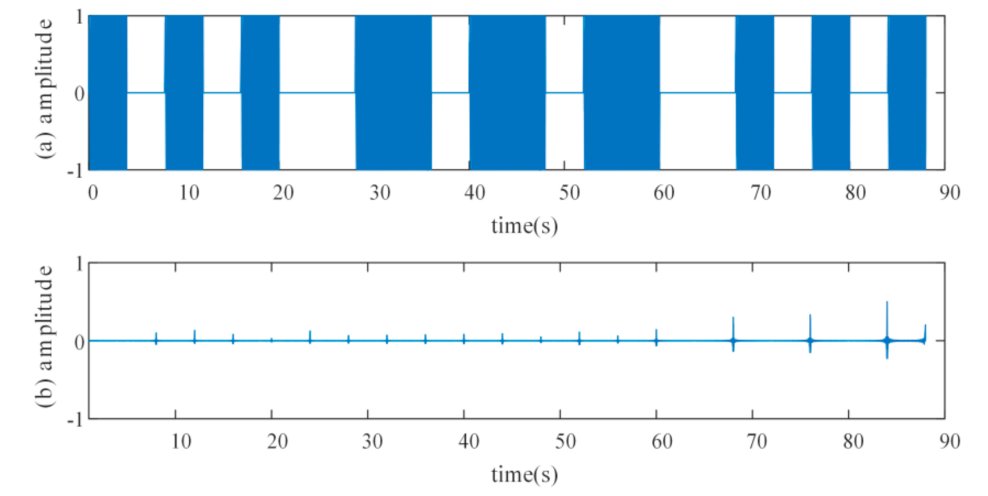
2.3. Signal Modulation

The modulation of transmitted signals is performed with a 500 N electromagnetic driven vibroseis source developed by Jilin university, which mainly transmits a linear sweep signal [32,33], whose function is defined as follows:
s ( t ) = A ( t ) sin 2 π ( F 1 + F 2 F 1 2 T D t ) t , 0 t T D
where s(t) stands for the linear sweep signal; A(t) represents the cosine amplitude envelope function of the linear scanning signal; F1 shows the initial frequency; F2 identifies the termination frequency; TD reveals the duration of the scanning signals. It is straightforward to adjust the frequency and duration of signals so that vibroseis sources can output the desired signals. When the frequencies (F2 and F1) are set to 200 and the TD is set to 4, the output of the vibroseis source is a 200 Hz single-frequency signal with length 4 s.

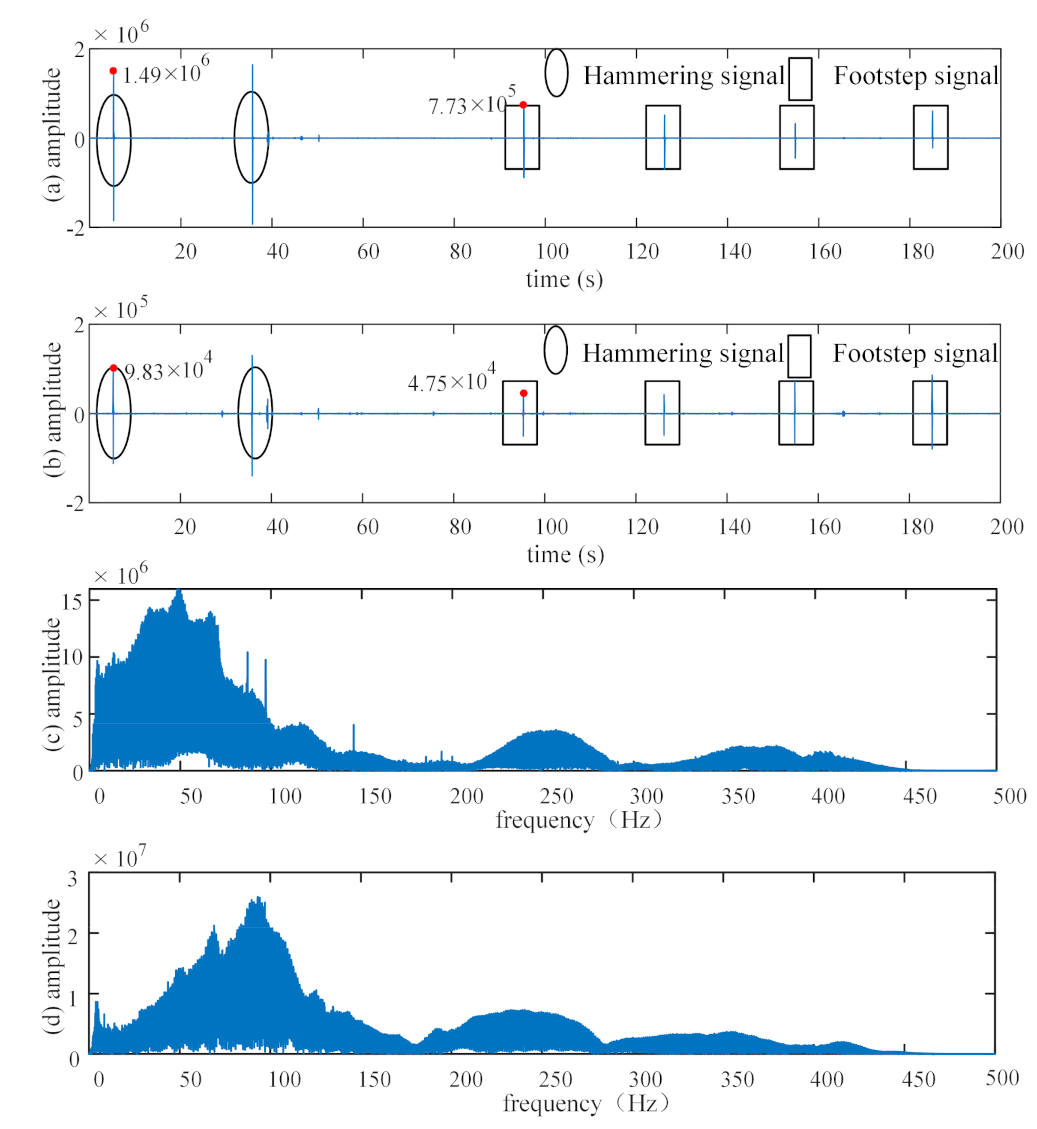
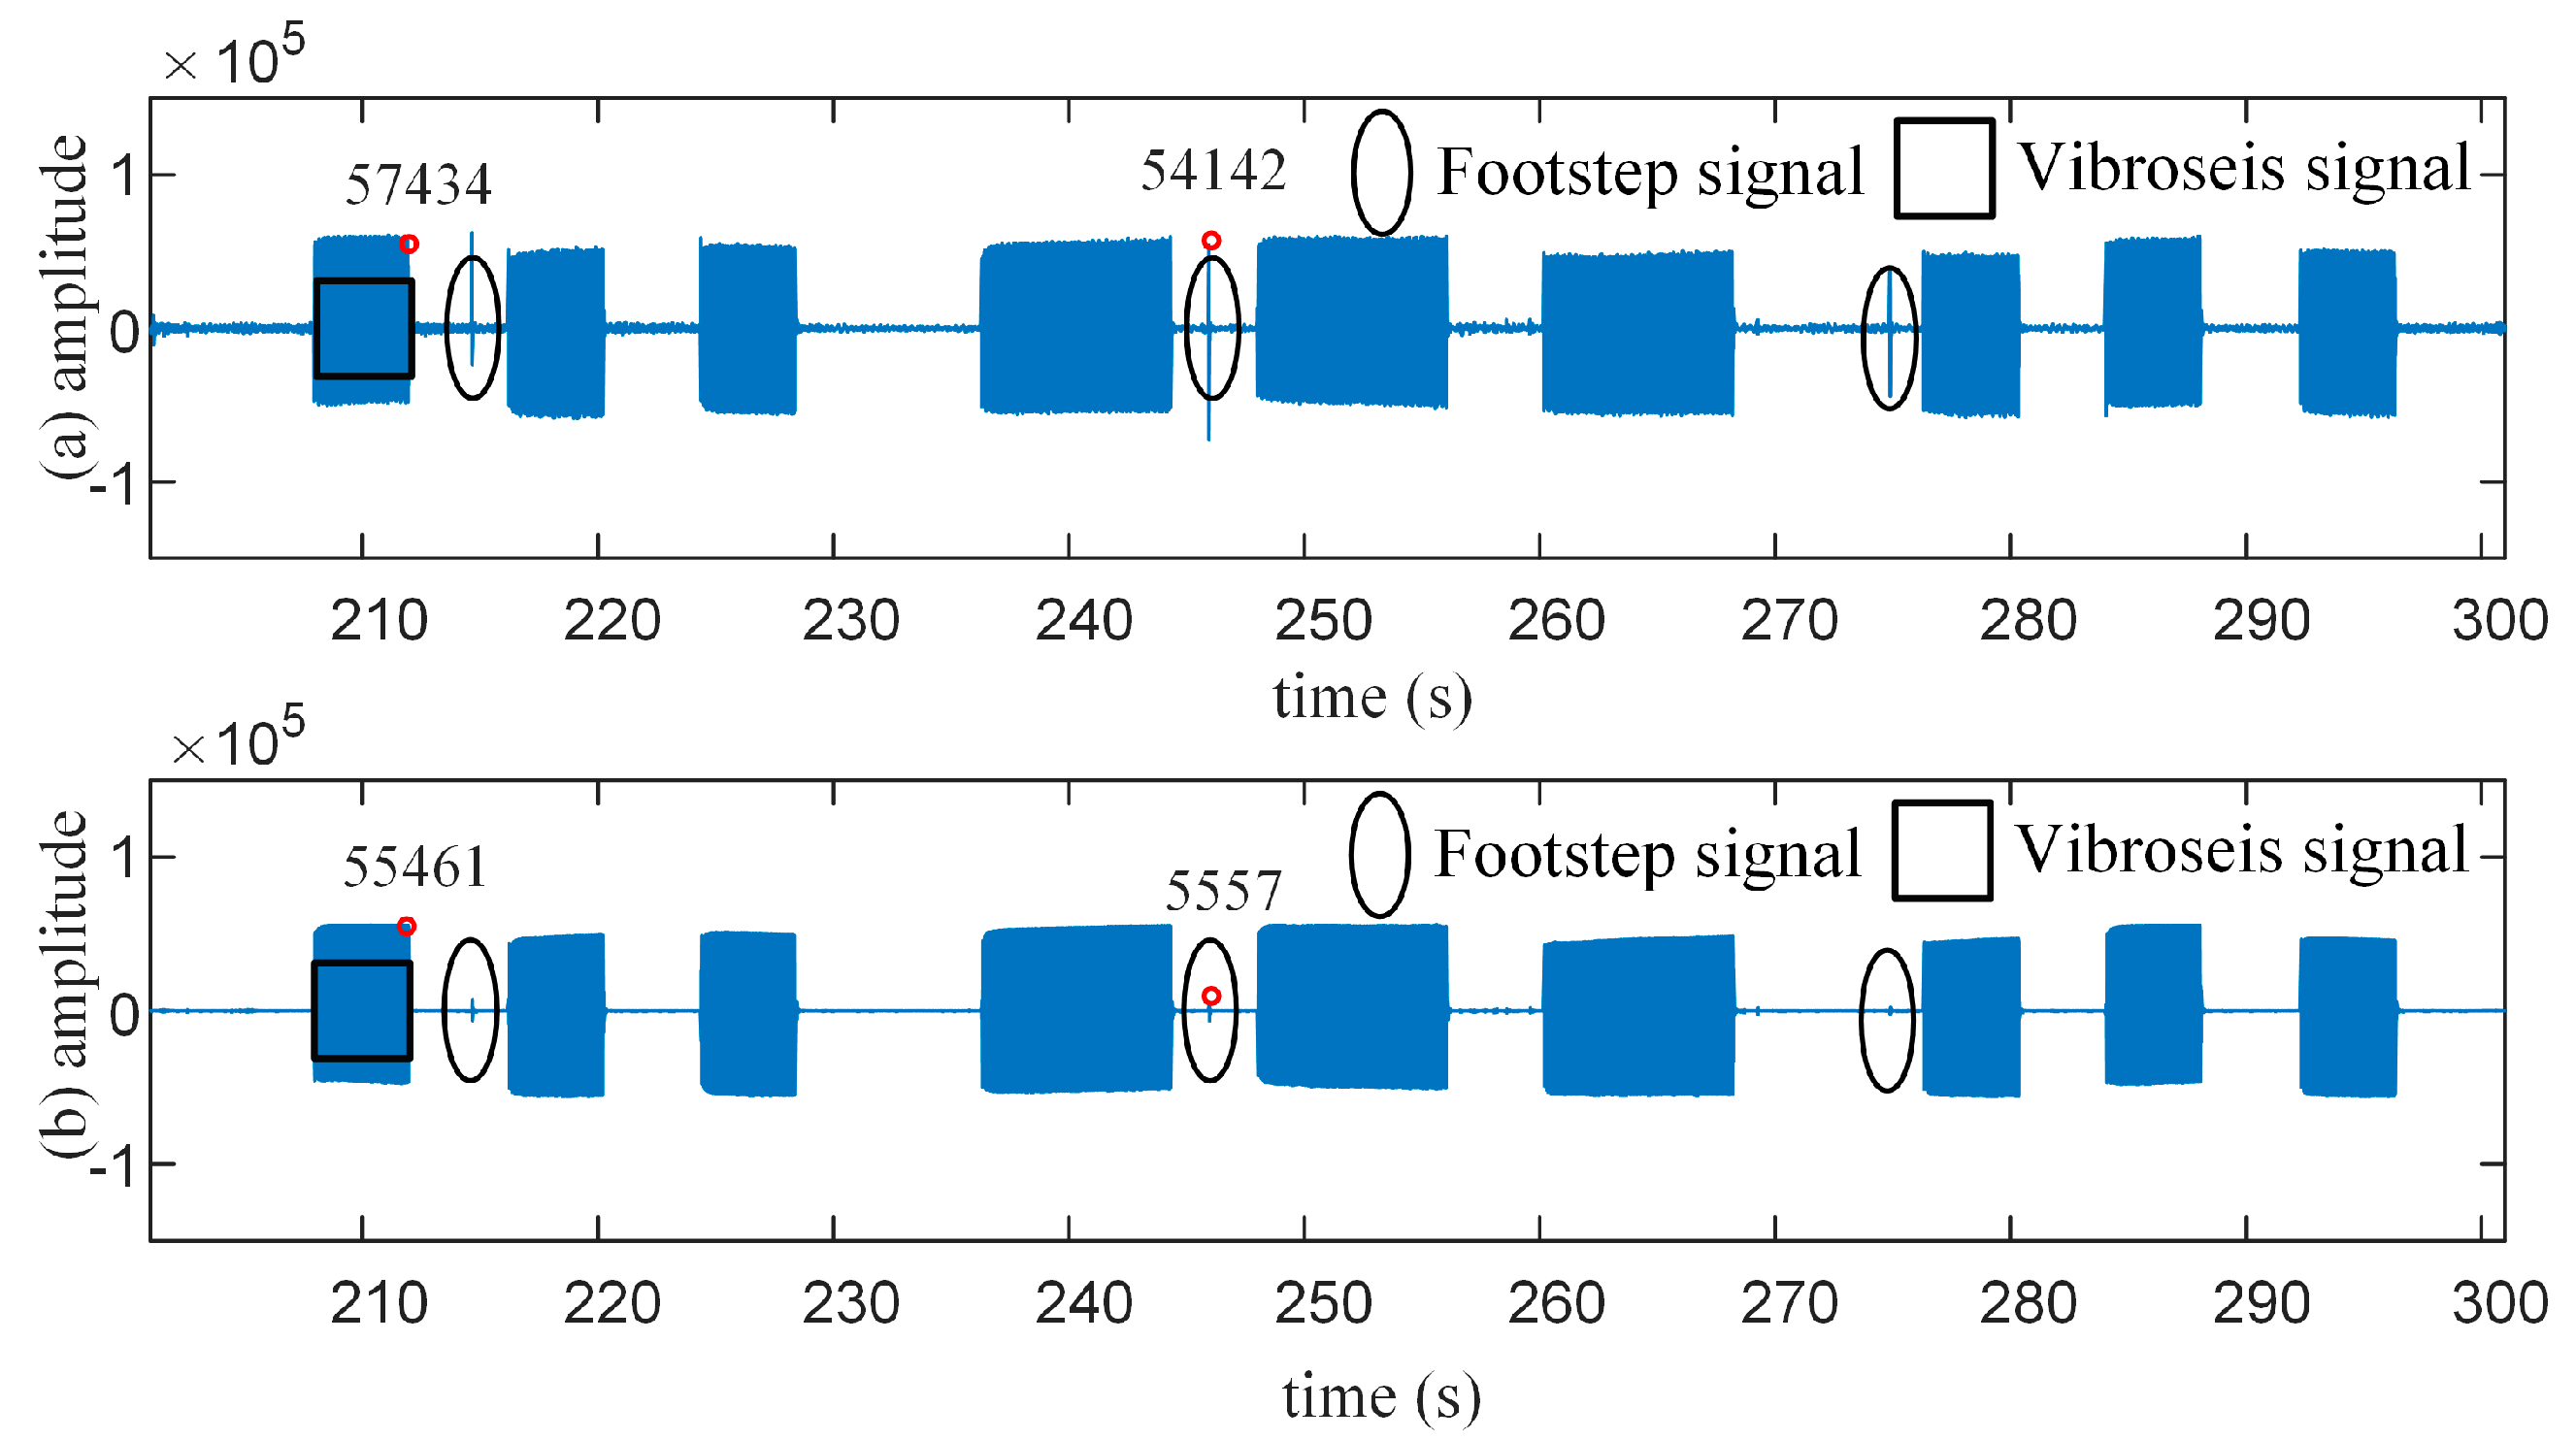
2.4. Signal Extraction

The cross-correlation adopted in this study is the digital characteristic that describes the statistical relation between two signals [34,35,36]. In other words, when the collected signal and the decoded signal are very similar, the target signal can be extracted. The decoded signal is designed to have the same frequency and duration as the target signal without noise [37]. The direct cross-correlation function can be expressed as:
R XH ( t 1 , t 2 ) = E [ X ( t 1 ) H ( t 2 ) ]
where RXH(t1, t2) stands for the direct cross-correlation signal; X(t1) represents the collected signal at time t1; H(t2) identifies the decoded signal at time t2. Although cross-correlation technology can effectively extract the target signal and suppress partial surface waves in seismic exploration, it is difficult to get the correct information from the direct cross-correlation. When the save our souls (SOS) signal is correlated directly, the cross-correlation signal will be different from our target signal (SOS), as shown in Figure 4. The vibroseis sources transmit the seismic signal intermittently, so the final signal we get is a discrete signal.
Based on this reality, the segmented correlation technology is proposed to deal with this problem. According to the rules of Morse code, the collected data are divided into a certain number of segments, and then these fragments are correlated with the decoded signal respectively, and the segmented correlation function is as follows.
Φ XH ( u ) = n = 1 N E [ X n ( u ) H n ( u ) ]
where ΦXH(u) is the segmented correlation signal; X(u) shows the nth fragment of the collected signal with length u; H(u) the nth fragment of the decoded signal with length u.
If the amplitude of a fragment exceeds a pre-selected threshold value, then that fragment is interpreted as “1”, otherwise the fragment is interpreted as “0”. So, we can interpret the complete signal according to the following definition:
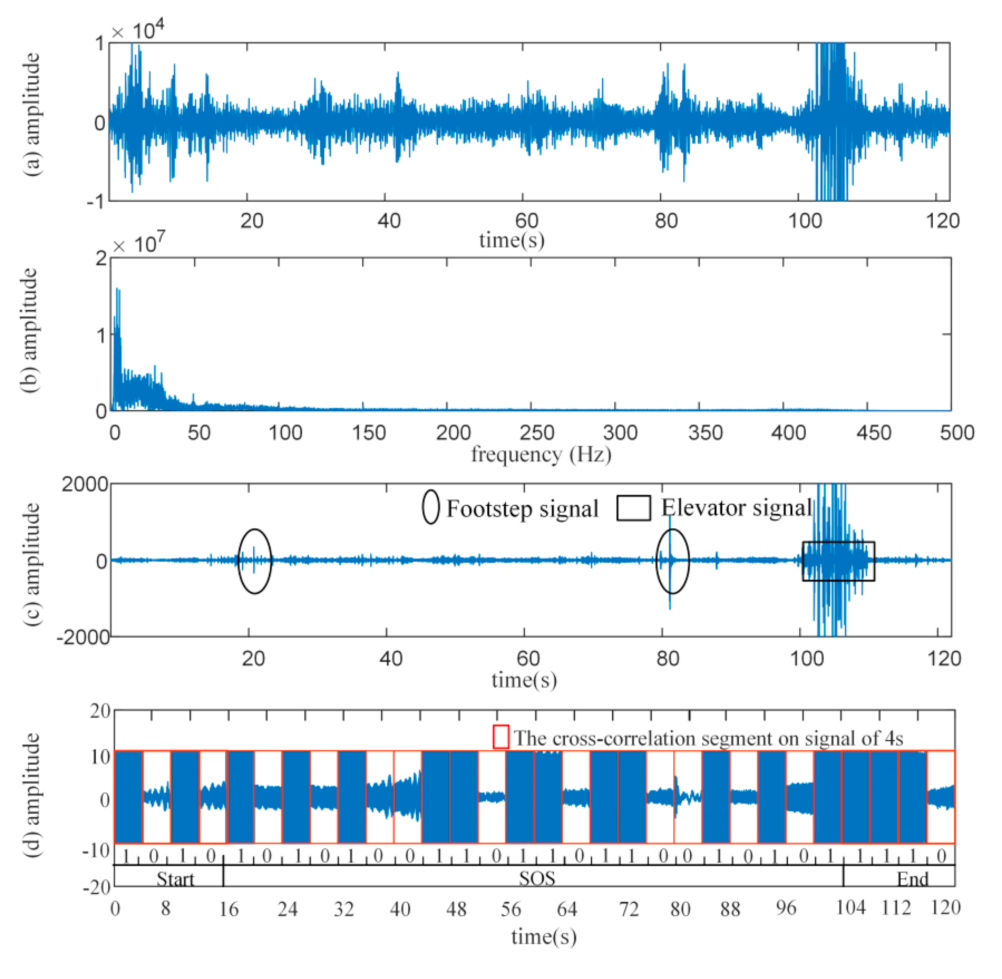
  • “1010” for the beginning of the message;
  • “1110” for end of message;
  • The signal between the beginning signal and the end signal is considered to be the intermediate signal, which is the message.

3. Experiment

In the course of experiment, a seismic communication system is first set up with a 500 N vibroseis source, 5 CDJS2C-2 geophones and 5 GEIWS RII seismometers in the Geological Palace of Changchun, Jilin, China. A 500 N vibroseis source sends out seismic signals encoded in Morse code, whose volume is no more than 8000 cm3 so that it is easy to carry. The vibroseis, whose power supply system can be adjusted according to the actual situation, is powered by alternating current (AC) in the urban power grid or the lithium battery system with voltage of 220 V and frequency of 50 Hz. The CDJS2C-2 geophones are used to collect signals through the earth, whose sensitivity is 2 + 10% v/cm/s. The GEIWSR-II seismometers are employed to record and store seismic data from the geophones at a sampling rate of 1000 Hz. In this system, the distance between the first geophone and the source is 20 m, the distance between geophones is 10 m and the distribution of their locations as shown in Figure 5. Finally, a series of instructions (including a 200 Hz SOS signal) are sent at the appointed time in the environment with various electromagnetic equipment, people and elevators. According to the Morse table, the binary code of the SOS signal should be 1010100110110110010101.

4. Data Analysis

The energy of the seismic signal decreases as the distance increases, and the target signal at 60 m is certainly the weakest [38,39,40]. Through reading the collected signal, whose SNR is 3.83 dB at 60 m, the target signal is completely drowned in noise as shown in the Figure 6a.
The signal in Figure 6a is too different from that in Figure 4a to distinguish the target signal, so the existence of the target signal needs to be identified. Spectrum analysis is first adopted to process the collected data, which can detect the frequency of the target signal [41,42]. According to results of the spectral analysis in Figure 6b, the frequencies of collected signals are mainly concentrated below 100 Hz while the 200 Hz frequency of the target signal is not detected. Moreover, even if a 180–220 Hz band-pass filter is employed to filter the collected data, the target signal is still not found, while a lot of other vibration signals are obtained, such as footstep signals and elevator signals in Figure 6c. That is to say, the target signal is submerged by other vibration signals so that it is impossible to realize seismic communication within 60 m with a band-pass filter at the site under these conditions.
To further extract the target signal, the SCTMC is employed to process the collected data obtained at 60 m. During the seismic communication experiment, the time of the seismic signal transmitted by the source is designed so that the rough position of the target signals can be predicted in collected data at 60 m. Then the SCTMC cuts the collected data into 4 s length segments, which are cross correlated with the decoded signal. By fine-tuning the position of cutting in collected data according to the cross-correlation results, the target signal (its SNR is 7.5 dB) is extracted while other vibration signals (including footstep signals) are suppressed. When the threshold of the correlation signal is set to 8.5, the binary code 101010101001101101100101011110 of the collected signal can be obtained, as show in Figure 6d. Then, we take advantage of the source to transmit the SOS signal again in this location, and similar results are obtained 60 m away from the source. At this time, the communication distance is 120 m and the relay distance is 60 m.

5. Discussion

In this study, we have presented the SCTMC to extract the target signal (SOS) and built a seismic communication system. By comparing the results of footstep signals, vibroseis signals and hammer signals, the signal transmitter suitable for complex environments is selected. According to Morse code, a vibroseis source is employed to transmit a 200 Hz SOS signal, which is received by geophones and recorded by seismometers at 60 m. However, the energy of the target signal is so weak that the band-pass filter cannot extract the target signal. Hence, the SCTMC is put forward to handle the seismic data, which extracts the target signal and suppresses other signals. Although its amplitude is only 0.2% of the amplitude about the original signal (in Figure 6a), the extracted signal can be converted into the binary code 101010101001101101100101011110 by setting a reasonable threshold. In this study, the communication distance can also be extended by improving the filtering algorithm or increasing the number of vibroseis and geophones. This kind of information recognition is at the expense of information transmission, which is relatively low at present. However, with the development of seismic communication technology, the relay distance will be extended or the communication speed will be improved.

6. Conclusions

In this paper, we first discuss the influence of other vibration signals on the target signal using different transmitting devices, such as hammers and vibroseis sources. By contrast, vibroseis sources accepted in this study have great advantages in signal modulation compared with hammer sources. However, it is difficult to extract the target signal because there are a large number of strong vibration signals in a complex environment. In order to solve the problem, the SCTMC is proposed to extract the target signal in the collected data. The experimental results show that the SCTMC is well combined with the advantages of vibroseis sources to extract the target signal. At its core, it effectively extracts the similar signal, suppresses other signals, improves the SNR of seismic signal and extends the relay distance of the communication system, which greatly reduces the cost of the seismic communication system. Implementing the transmission of information recognition with SCTMC is a breakthrough which offers a better application of the vibroseis sources and geophones, constitutes an innovative form of wireless communication and lays the foundation for the long-distance communication for the seismic communication system. Maybe in the near future, this technology might be widely employed in our production and life.

Author Contributions

Y.J.: writing—original draft preparation; Y.C., R.T., L.W., S.L., J.L. and X.X.: offering some suggestions and guidance for the original draft preparation; Y.J., and Y.C.: conducting the experiments or partial experiments. All authors have read and agreed to the published version of the manuscript.

Funding

This research was funded by National Natural Science Foundation of China, grant number 41827803.

Institutional Review Board Statement

Not applicable.

Informed Consent Statement

Not applicable.

Data Availability Statement

The data generated or analyzed in this study are included in the submitted article.

Acknowledgments

Authors acknowledge Jilin University who provides instruments, funding and experimental sites. Authors would also like to thank anonymous reviewers who have provided many helpful comments on the manuscript.

Conflicts of Interest

The authors declare no conflict of interest.

References

  1. Forooshani, A.E.; Bashir, S.; Michelson, D.G.; Noghanian, S. A survey of wireless communications and propagation modeling in underground mines. IEEE Commun. Surv. Tutor. 2013, 15, 1524–1545. [Google Scholar] [CrossRef]
  2. Ralchenkoa, M.; Svilansb, M.; Samsona, C.; Roperbl, M. Finite-difference time-domain modelling of through-the-Earth radio signal propagation. Comput. Geosci. 2015, 85, 184–195. [Google Scholar] [CrossRef]
  3. Xu, N.W.; Li, T.B.; Dai, F.; Li, B.; Zhu, Y.G.; Yang, D.S. Microseismic monitoring and stability evaluation for the large scale underground caverns at the Houziyan hydropower station in Southwest China. Eng. Geol. 2015, 188, 48–67. [Google Scholar] [CrossRef]
  4. Allagui, I.; Akdenizli, B. The Gulf Information War and the role of media and communication technologies. Int. J. Commun. 2019, 13, 1287–1300. [Google Scholar]
  5. Rashid, F.; Edmondson, A.C.; Leonard, H.B. Leadership lessons from the chilean mine rescue. Harv. Bus. Rev. 2013, 91, 113–134. [Google Scholar]
  6. Hanafy, S.M.; Cao, W.; McCarter, K.; Schuster, G.T. Using super-stacking and super-resolution properties of time-reversal mirrors to locate trapped miners. Lead. Edge 2009, 28, 302–307. [Google Scholar] [CrossRef]
  7. Hanafy, S.M.; Schuster, G.T. Two applications of time reversal mirrors: Seismic radio and seismic radar. J. Acoust. Soc. Am. 2011, 130, 1985–1994. [Google Scholar] [CrossRef] [Green Version]
  8. Hao, J.J.; Wang, F.Y. Multipath characteristics of TTE stratified medium channel of elastic wave signal communication. J. China Coal. Soc. 2012, 37, 695–699. [Google Scholar]
  9. Hao, J.J.; Sun, X.C. Analysis and comparison of several through-the-earth communication technologies for mining. J. Hunan Univ. Sci. Tech. 2014, 1, 59–63. [Google Scholar]
  10. Zhang, B. Study of Applicability for Modulation Method in Elastic Wave Stratum Communication System. Master’s Thesis, Shandong University of Science and Technology, Qingdao, China, 2016. [Google Scholar]
  11. He, Q.H.; Chen, X.Z.; Zhang, B.; Wu, Y.R. Design of Elastic Wave Receiving Scheme in Stratum Communication System. Electron. Qual. 2017, 1, 97–102. [Google Scholar]
  12. Qiao, Y.K.; Peng, F.L.; Wang, Y. Monetary valuation of urban underground space: A critical issue for the decision-making of urban underground space development. Land Use Policy 2017, 69, 12–24. [Google Scholar] [CrossRef]
  13. Zhang, J.; Liu, S.; Yang, C. Detection of urban underground cavities using seismic scattered waves: A case study along the Xuzhou Metro Line 1 in China. Near Surf. Geophys. 2020. [Google Scholar] [CrossRef]
  14. Wang, Y.; Shi, G.; Tian, X. Experimental Study on City Road Collapse under Vibrating Load. Shock Vib. 2020, 2020, 6074658. [Google Scholar] [CrossRef]
  15. Abidi, A.; Demehati, A.; Banouni, H. The Importance of Underground Cavities Detection in the Choice of Constructible Areas: Case of the Agglomeration of Fez (Morocco). Geot. Geol. Eng. 2017, 36, 1919–1932. [Google Scholar] [CrossRef]
  16. Zhao, S.; Zhou, C.; Shen, X. Investigation of VLF Transmitter Signals in the Ionosphere by ZH-1 Observations and Full-Wave Simulation. J. Geophys. Res.-Space Phys. 2019, 124. [Google Scholar] [CrossRef]
  17. Yuan, Y.; Sun, Z.H.; Wei, Z.H.; Jia, K.B. Deep Morse: A Deep Convolutional Learning Method for Blind Morse Signal Detection in Wideband Wireless Spectrum. IEEE Access 2019, 7, 80577–80587. [Google Scholar] [CrossRef]
  18. Juneja, S.; Joshi, P. Design and development of a low cost and reliable writing aid for visually impaired based on Morse code communication. Technol. Disabil. 2020, 32, 59–67. [Google Scholar] [CrossRef]
  19. Wang, X.; Zhang, M.; Zhou, H. A Robust Real-Time Automatic Recognition Prototype for Maritime Optical Morse-Based Communication Employing Modified Clustering Algorithm. Appl. Sci. 2020, 10, 1227. [Google Scholar] [CrossRef] [Green Version]
  20. Junker, F.B.; Schlaffke, L.; Axmacher, N. Impact of multisensory learning on perceptual and lexical processing of unisensory Morse code. Brain Res. 2021, 1775, 147259. [Google Scholar] [CrossRef]
  21. Dani, V.; Jalihal, D.; Ramaiyan, V. Variable Length Coding for Asynchronous Communication. IEEE Commun. Lett. 2020, 24, 2157–2161. [Google Scholar] [CrossRef]
  22. Cao, Q.; Yu, C.; Cheng, X.F. Polysquaramides: Rapid and Stable Humidity Sensing for Breath Monitoring and Morse Code Communication. Sens. Actuator B Chem. 2020, 320, 128390. [Google Scholar] [CrossRef]
  23. Cho, J. Prefix-Free Code Distribution Matching for Probabilistic Constellation Shaping. IEEE Trans. Commun. 2019, 68, 670–682. [Google Scholar] [CrossRef]
  24. Zheng, X.; Wang, H.; Guo, J. Method for multi-information drilling detection after mining disasters. Comput. Electr. Eng. 2020, 86, 106726. [Google Scholar] [CrossRef]
  25. He, J.F.; Zhao, Z.Q.; Yin, Q.L. Design and optimisation on rapid rescue well-drilling technology with large-diameter pneumatic hammers. Int. J. Min. Reclam. Environ. 2020, 34, 19–33. [Google Scholar] [CrossRef]
  26. Gaurav, D.; Abdullah, A.T.; Ahmad, T. Extracting 220 Hz information from 55 Hz field data by near-field superresolution imaging. Geophys. J. Int. 2016, 206, 197. [Google Scholar]
  27. Allstadt, K.E.; Farin, M.; Iverson, R.M. Measuring Basal Force Fluctuations of Debris Flows Using Seismic Recordings and Empirical Green’s Functions. J. Geophys. Res.-Earth Surf. 2020, 125. [Google Scholar] [CrossRef]
  28. Yordkayhun, S.; Suwan, J.N. A university-developed seismic source for shallow seismic surveys. J. Appl. Geophys. 2012, 82, 110–118. [Google Scholar] [CrossRef]
  29. Jia, Z.; Lu, W. CNN-Based Ringing Effect Attenuation of Vibroseis Data for First-Break Picking. IEEE Geosci. Remote Sens. Lett. 2019, 16, 1319–1323. [Google Scholar] [CrossRef]
  30. Butler, K.E.; Bernd, K.; Pugin André, J.-M. Multimode seismoelectric phenomena generated using explosive and vibroseis sources. Geophys. J. Int. 2018, 213, 836–850. [Google Scholar] [CrossRef]
  31. Marcello, S.; Gaetano, F.; Philippe, R. A strongly heterogeneous hydrothermal area imaged by surface waves: The case of Solfatara, Campi Flegrei, Italy. Geophys. J. Int. 2016, 205, 1813–1822. [Google Scholar]
  32. Parker, L.; Thurber, C.; Zeng, X. Active-Source Seismic Tomography at the Brady Geothermal Field, Nevada, with Dense Nodal and Fiber-Optic Seismic Arrays. Seismol. Res. Lett. 2018, 89, 1629–1640. [Google Scholar] [CrossRef]
  33. Naghizadeh, M.; Snyder, D.; Cheraghi, S. Acquisition and Processing of Wider Bandwidth Seismic Data in Crystalline Crust: Progress with the Metal Earth Project. Minerals 2019, 9, 145. [Google Scholar] [CrossRef] [Green Version]
  34. Lin, M.; Qin, J.; Wang, G. Multi-scale cross-correlation analysis of temporal and spatial seismic data. Eur. Phys. J. B 2020, 93. [Google Scholar] [CrossRef]
  35. Li, G.; Chen, J.; Peng, D. Short communication: The lag response of daily milk yield to heat stress in dairy cows. J. Dairy Sci. 2020, 104, 981–988. [Google Scholar] [CrossRef] [PubMed]
  36. Cao, C.; Yang, H.; Zhang, H. Passive Detection of Low-Altitude Signal Sources Using an Improved Cross-Correlation Algorithm. Appl. Sci. 2018, 8, 2348. [Google Scholar] [CrossRef] [Green Version]
  37. Borio, D. Cross-correlation Codeless Processing of BOC Modulated Signals. IET Radar Sonar Navig. 2019, 13, 1998–2007. [Google Scholar] [CrossRef]
  38. Littel, G.F.; Thomas, A.M.; Baltay, A.S. Using tectonic tremor to constrain seismic wave attenuation in cascadia. Geophys. Res. Lett. 2018, 45, 9579–9587. [Google Scholar] [CrossRef]
  39. Mukhopadhyay, S.; Sharma, J.; Del-Pezzo, E. Study of attenuation mechanism for Garwhal–Kumaun Himalayas from analysis of coda of local earthquakes. Phys. Earth Planet. Int. 2010, 180, 7–15. [Google Scholar] [CrossRef]
  40. Dobrynina, A.A.; Predein, P.A.; Sankov, V.A. Spatial variations of seismic wave attenuation in the South Baikal Basin and adjacent areas (Baikal rift). Geod. Tect. 2019, 10, 147–166. [Google Scholar] [CrossRef]
  41. Guo, L.; Jiang, J.; Tan, F. Channelized broadband signal spectrum analysis based on weighted overlap-add structure. Rev. Sci. Instrum. 2016, 87, 105123. [Google Scholar] [CrossRef]
  42. Ciuonzo, D.; Rossi, P.S. Non-colocated Time-Reversal MUSIC: High-SNR Distribution of Null Spectrum. IEEE Signal Process. Lett. 2017, 24, 397–401. [Google Scholar] [CrossRef] [Green Version]
Figure 1. A long-distance transmission scheme about seismic signals.
Applsci 11 01947 g001
Figure 2. The comparison of hammering signals and footstep signals; (a) Hammer signals and footstep signals in raw data; (b) Hammering signals and footstep signals filtered by a 5–100 Hz band-pass filter; (c) The spectrum of footstep signals in raw data; (d) The spectrum of hammer signals in raw data.
Applsci 11 01947 g002
Figure 3. The amplitude changes of signals before and after filtering; (a) Vibroseis signals and footstep signals before filtering; (b) Vibroseis signals and footstep signals after filtering.
Applsci 11 01947 g003
Figure 4. The direct cross-correlation in signal simulation; (a) The 200 Hz SOS signal in the simulation diagram; (b) The direct cross-correlation about SOS signal in the simulation diagram.
Applsci 11 01947 g004
Figure 5. The distribution of 5 CDJ-S2C-2 geophones, 5 GEIWSR-II seismometers and a 500 N vibroseis source.
Applsci 11 01947 g005
Figure 6. The collected signal at 60 m; (a) The original data at 60 m; (b)The spectral analysis of the original data; (c) The target signal extraction with a band-pass filter; (d) The target signal extraction with the segmented correlation technology.
Applsci 11 01947 g006
Publisher’s Note: MDPI stays neutral with regard to jurisdictional claims in published maps and institutional affiliations.

