1. Introduction
Cells are systems composed of proteins, and their conditions are essentially dependent on amounts and states of these proteins. Genomics is one of the most powerful methodologies available for profiling cells, but the amounts of proteins are affected by efficiency of translation, post-translational processing of gene products, and protein degradation rates in the cells. Therefore, protein amounts are difficult to estimate using only genomics. Furthermore, states of proteins, such as post-translational modification, including phosphorylation, cannot be investigated by genomics. On the other hand, proteomics deals directly with proteins, and amounts and states of the components of cells can be revealed using proteomics methods. Among techniques used in proteomics, two-dimensional gel electrophoresis (2D-GE) is available for directly examining amounts and states of proteins. However, the quality of the data depends heavily on the method, and because the procedures involved require skill and time, it can be difficult to obtain large amounts of high-quality data. This is a practical reason why 2D-GE has not been used for clinical diagnoses, even though proteomics is the most powerful method available for profiling of organisms [
1].
Recently, we developed a high-performance two-dimensional polyacrylamide gel electrophoresis (HP-2D-PAGE) technique with high throughput, high sensitivity, and high reproducibility [
2]. In this procedure, the first dimensional and second dimensional gel whose size is smaller than that for usual two-dimensional electrophoresis was used because the stabilities of electric field, voltage, and temperature should be maintained. If these stabilities are lost, the focuses of spots on the gel will be lost. Additionally, loose focus will result in deterioration for resolutions of the spots and sensitivities of the signals. Additionally, size and thickness of filter papers on electrodes of the first gel electrophoresis should be large and thick enough to absorb all salts gathering to the electrodes. Furthermore, the proper amounts of total proteins on the gels are different and should be optimized for each case. As for human serum, the amount was optimized by counting spots on the gels. Finally, although total number of the spots has not been raised compared with the conventional methods, other performances including high throughput capacity, high sensitivity, and high reproducibility have been raised enough for the practical applications.
For clinical applications, large amounts of data should be obtained in a short time period from small amounts of specimens. The quality of the data must be high for inter-comparisons. Conventional techniques could hardly be available for the purpose. On the other hand, our technique can solve these issues and can provide a sufficient amount of proteomics data to satisfy the necessary conditions for clinical use [
3]. However, one issue still impedes realization of clinical proteomics using HP-2D-PAGE: how to facilitate high-throughput processing of vast numbers of 2D-PAGE images.
Here, the first success of 2D-PAGE image processing using artificial intelligence (AI) is reported. If 2D-PAGE images can be processed automatically and quickly, large amounts of clinical data providing vital information can be utilized clinically. Furthermore, this breakthrough opens new avenues for data mining. Typically, 2D-PAGE spots that drastic changes in intensity as a patient’s condition progresses are considered significant in terms of diagnosis. However, the proteins associated with such spots are not necessarily important for determining clinical state. In the cases of a number of diseases, multiple but slight changes in proteins are thought to induce disease onsets. It can be difficult to manually identify such significant spots on 2D-PAGE images. However, AI provides a principally different way of looking at these data and can be used to identify essential, significant spots from among large numbers of spots on 2D-PAGE images.
Sepsis was chosen as the first target for AI-aided diagnosis in this study for various reasons. Sepsis is generally classified by severity, with severe sepsis characterized by a state of organ dysfunction, organ perfusion loss, or hypotension; septic shock, in particular, is characterized by persistent hypotension despite large-volume intravenous infusion [
4]. Mortality is generally high in severe sepsis, with common case fatality rates of 20 to 30% [
5,
6,
7]. Early stage treatment is strongly related to reduced mortality rate, but the pathogenic mechanisms of sepsis are very wide-ranging and complex. For this reason, sepsis treatment largely comprises symptomatic therapy. Moreover, diagnosis is often sought at a location other than the hospital in which treatment occurs. The need for AI-aided diagnosis is therefore particularly critical for prompt, appropriate treatment. AI-aided diagnosis holds the promise of faster, more accurate diagnosis of this complex pathology. It also holds promise of providing new findings that could not be obtained via manual visual inspection of data. In this study, therefore, we evaluated a fast and accurate AI-aided method for the diagnosis of sepsis.
Practical development of AI-aided diagnosis using 2D-GE images posed two key problems. First, 2D-GE images generally exhibit very low quality and poor reproducibility compared with data used in AI image diagnosis already in practical use, such as facial authentication and computed tomography (CT) images. Images obtained with previously developed methods exhibit clear contrast, good quality, and good reproducibility in comparison with those obtained with existing methods but are substantially inferior in comparison with those already practically developed. The question arises then as to whether the 2D-GE images obtained in this study could be used in machine learning for AI-aided diagnosis. Until now, at the research level, there have been researches on image processing of two-dimensional electrophoresis using AI, but they have not yet been put into their practical uses [
8]. In this research, using the dramatic progress of AI in recent years, two-dimensional electrophoresis image processing by AI for practical use has been studied.
Another major task was to obtain sufficient training data for machine learning. In already practically developed AI image diagnosis (recognition) methods, several hundred-thousand to several million images are used as training data. In this study, we achieved high throughput by improving the 2D-GE method using less than one-thousand images for training data. A further major task is to effectively achieve machine learning with a smaller amount of training data.
In this article, sepsis classification was performed using deep neural network (DNN) which has been widely studied in recent years [
9]. DNN is known to require a large amount of training data and has achieved high classification performance using large dataset such as skin cancer [
10]. On the other hand, it is still difficult to collect sufficient number of the proteome data of patient due to a 2D-GE method because of the conventional technical issues that the time to obtain data are too long and the quality of data to be compared with each other is too low. Because of the issues mentioned above, the technique could be used only for research settings, and the practical implementation has been difficult so far. In fact, despite using our 2D-GE method, we could only collect 98 images which include 30 sepsis images (68 images are non-sepsis images). From this situation, we applied a transfer learning approach for DNNs. In order to solve the problem, it is necessary not only to improve the algorithm but also to develop more general-purpose devices to generate the big-data, but this is another topic for other studies.
Transfer learning is a method that reuses source domain knowledge to solve a target domain task [
11]. For example, if we want to solve a task that determines whether a patient of an input image has sepsis or not by reusing the knowledge of natural pictures classification task (e.g., dog or cat), the natural pictures classification task corresponds to the source domain task, and the sepsis classification task corresponds to the target domain task. Transfer learning for DNN has been studied in various fields of AI [
12,
13] and these methods can be divided into three approaches: supervised, semi-supervised, and unsupervised. Unsupervised and semi-supervised approaches assume that the target domain labels equal the source domain label [
14]. However, in a biomedical field, it is difficult to collect target domain data having the same label as the source domain. Therefore, we focus on the supervised transfer learning approach, which allows the labels of the source/target domain to be different.
Conventional supervised transfer learning methods for DNN [
15] first train a DNN on the source domain. Then, the second DNN is constructed based on target domain data by reusing the hidden layers of the first DNN as the initial values, except for an output layer. However, this approach has a risk of poor classification performance caused by random initial values of the output layer because the output layer must be trained on a significantly small amount of target domain data. To avoid this problem, we propose a reusing of all layers, including the output layer.
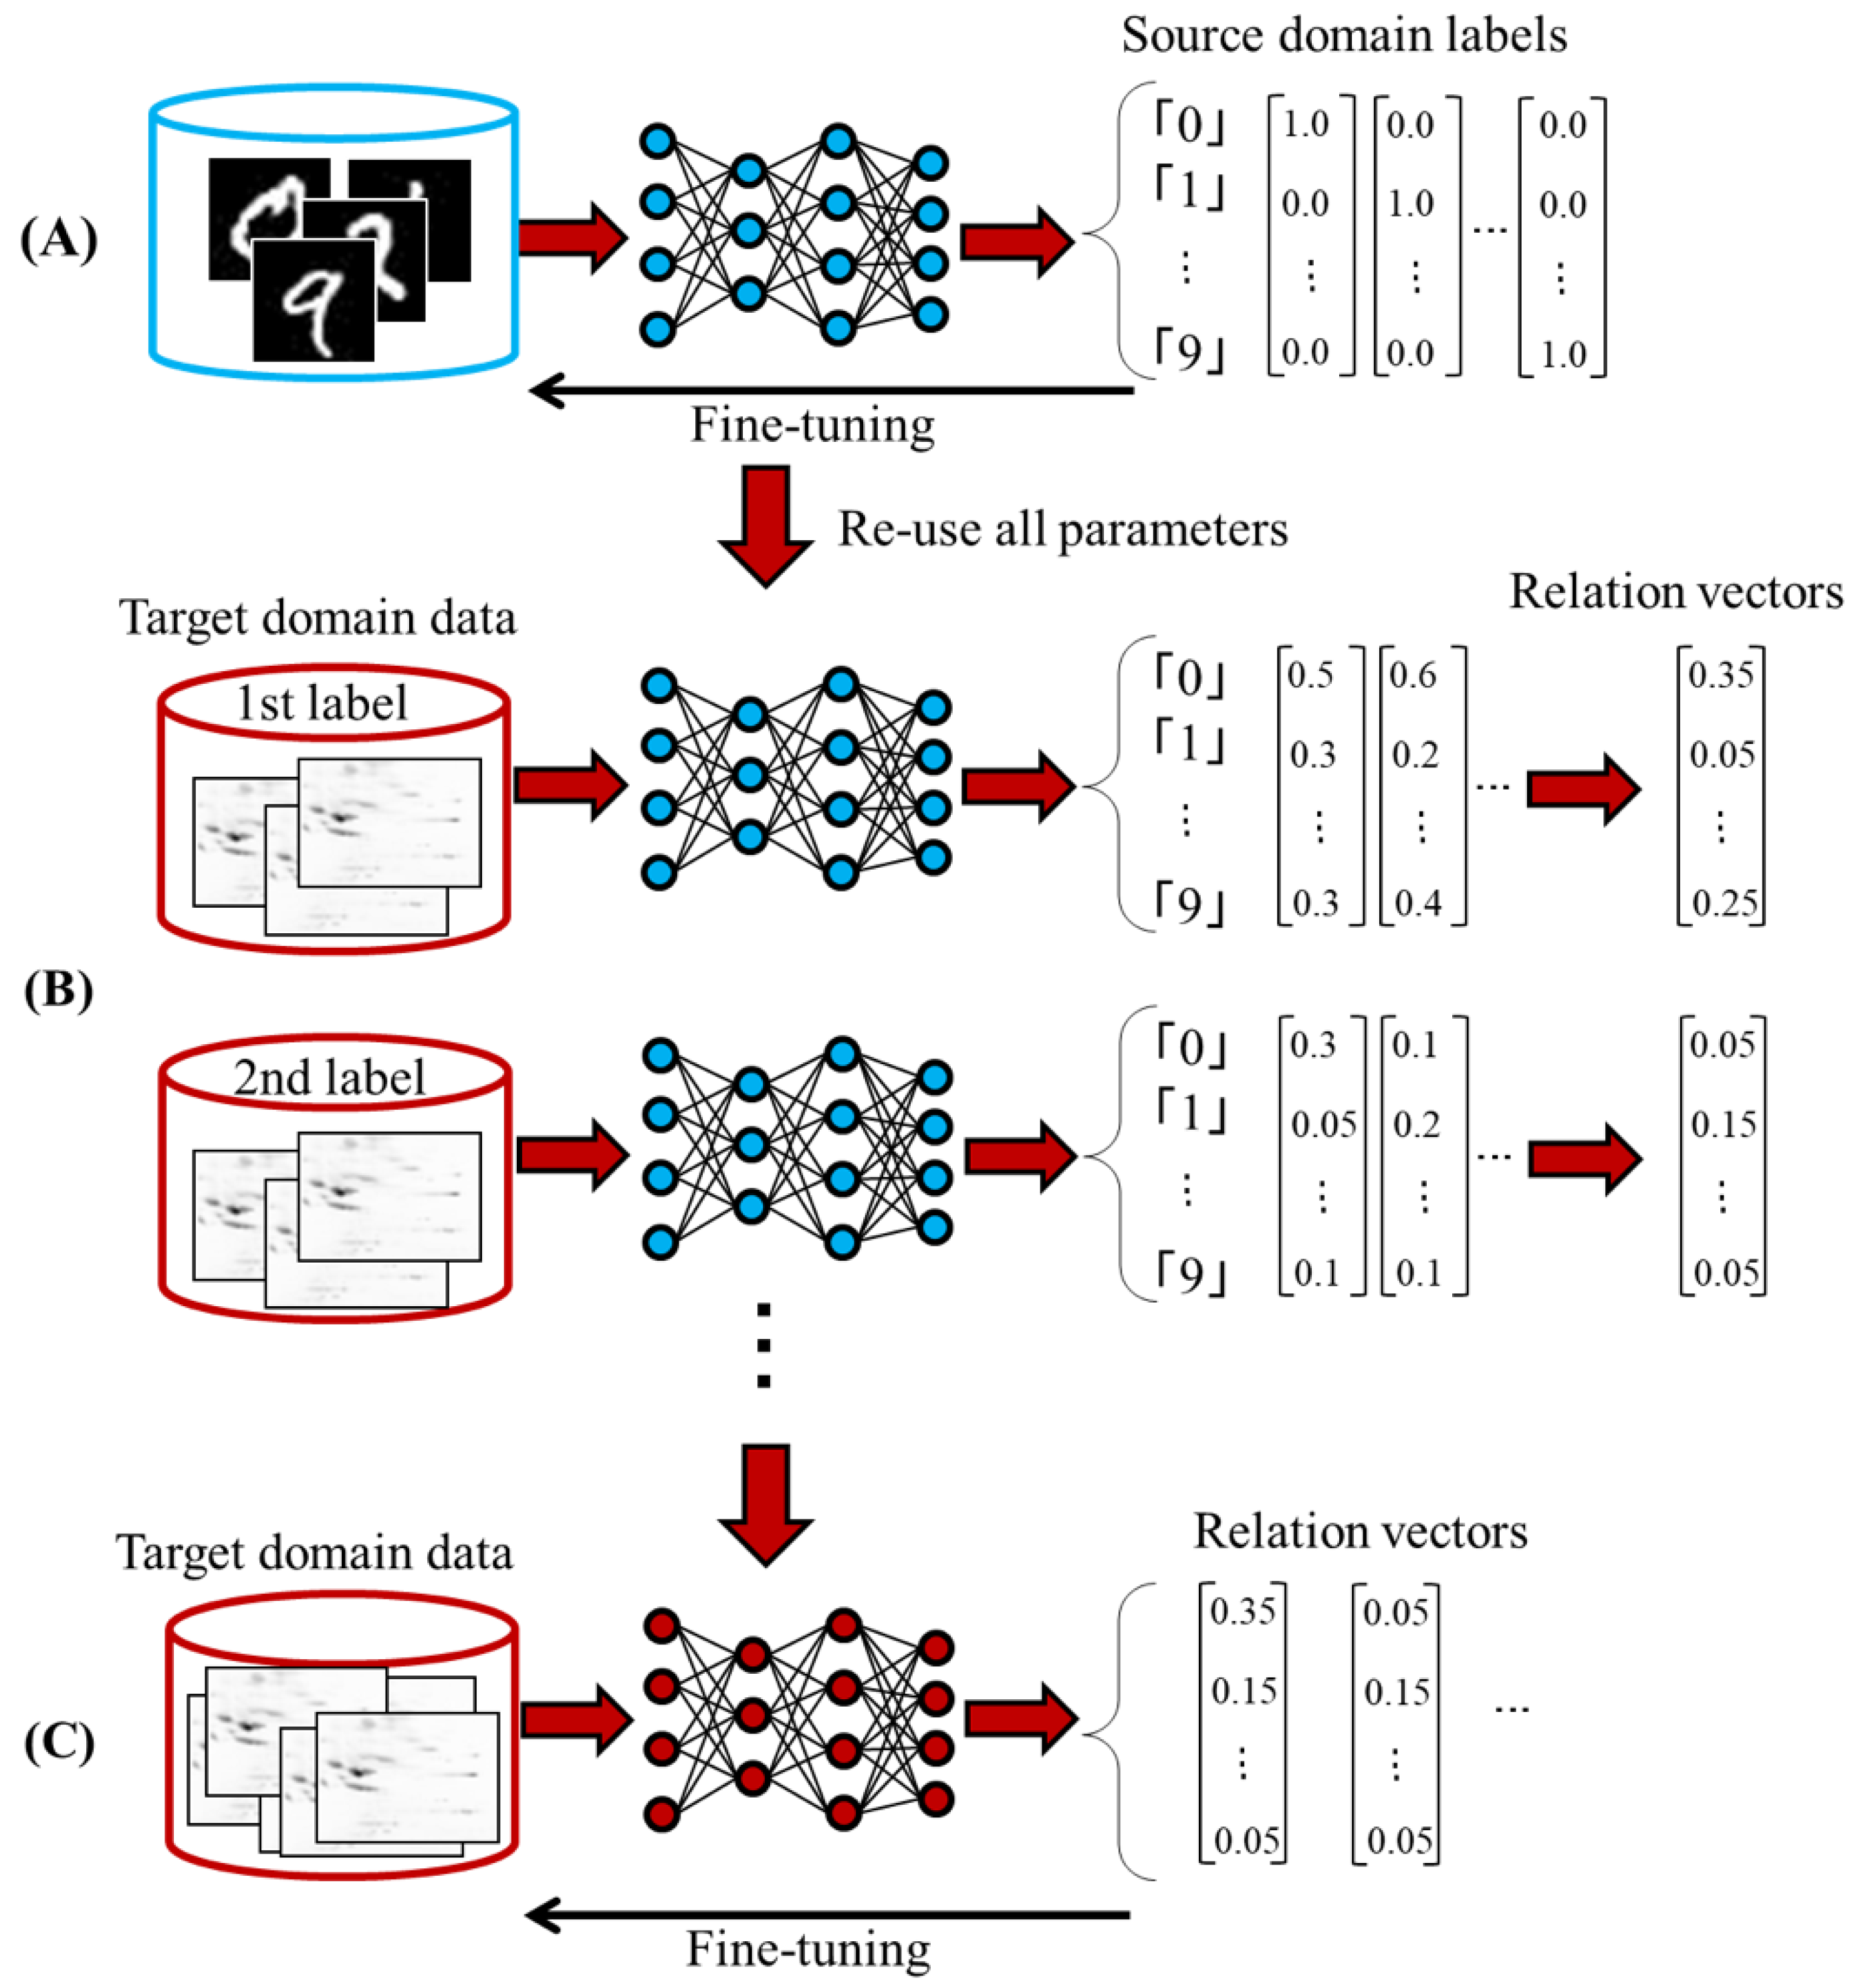
An outline of our learning method is shown in
Figure 1. First, we train a DNN (source DNN) to solve the source domain task (
Figure 1A). In this study, we pre-trained hidden layers based on a de-noising autoencoder [
4] and minimized a mean squared error between target vector and output vector using a stochastic gradient descent algorithm. Second, we reuse all parameters of the source DNN for solving the target domain task (
Figure 1B). Finally, we fine-tuned all parameters using the target domain data and obtained a target DNN (
Figure 1C). It should be noted that target vectors of each target domain label for executing the last step are indeterminate. For example, if the source domain task is the natural pictures classification and the target domain task is the sepsis classification, the target domain label does not match the source domain label. Therefore, we cannot fine-tune parameters of the target DNN. To tackle this problem, we estimate target vectors based on the output vector by feeding the target domain data to the source DNN. We call these target vectors as relation vectors.
2. Materials and Methods
Patient serum. Serum samples were collected from 20 patients at Nihon University Hospital in accordance with the regulations of the ethics committee, and written informed consent was obtained from each patient before inclusion in the study. The patient group included both males and females, and the distribution of ages was 35 to 79 years of age. Sixty microliters of serum were used in the experiments.
Removal of major proteins contained in serum. An Aurum Serum Protein Mini Kit (Bio-Rad, Tokyo, Japan) was used to remove the albumin and IgG contained in large amounts in serum. A Seppro® IgY14 protein kit (Sigma-Aldrich, Tokyo, Japan) was used to remove 14 other proteins that are contained in large amounts.
2D-PAGE. For accurate quantification necessary for high-precision analyses, the amount of protein in each sample was determined using a 2-D Quant Kit (GE Healthcare Japan, Tokyo, Japan). Removal of impurities and desalination of the samples were carried out using a 2-D Clean-Up Kit (GE Healthcare).
Treated samples were dissolved in Destreak rehydration solution (GE Healthcare) and applied for swelling of Immobiline dry strips (GE Healthcare). Isoelectric focusing as the first dimension was carried out using the swelled strips on a Multiphor II system (GE Healthcare).
Second dimension separation was carried out on a discontinuous SDS gel system as first described by Laemmli [
16] using a NuPAGE 4–12% Bis-Tris Z00m Gel (Thermo Fisher Scientific, Tokyo, Japan). The resulting gels were stained with a fluorescent dye, SYPRO Ruby Protein Gel Stain (Thermo Fisher Scientific).
Fluorescent images were acquired from the stained gels using a Typhoon FLA 9500 apparatus with Ettan DIGE imager software (GE Healthcare), and the images were analyzed using Image Master 2D Platinum 7.0 software (GE Healthcare).
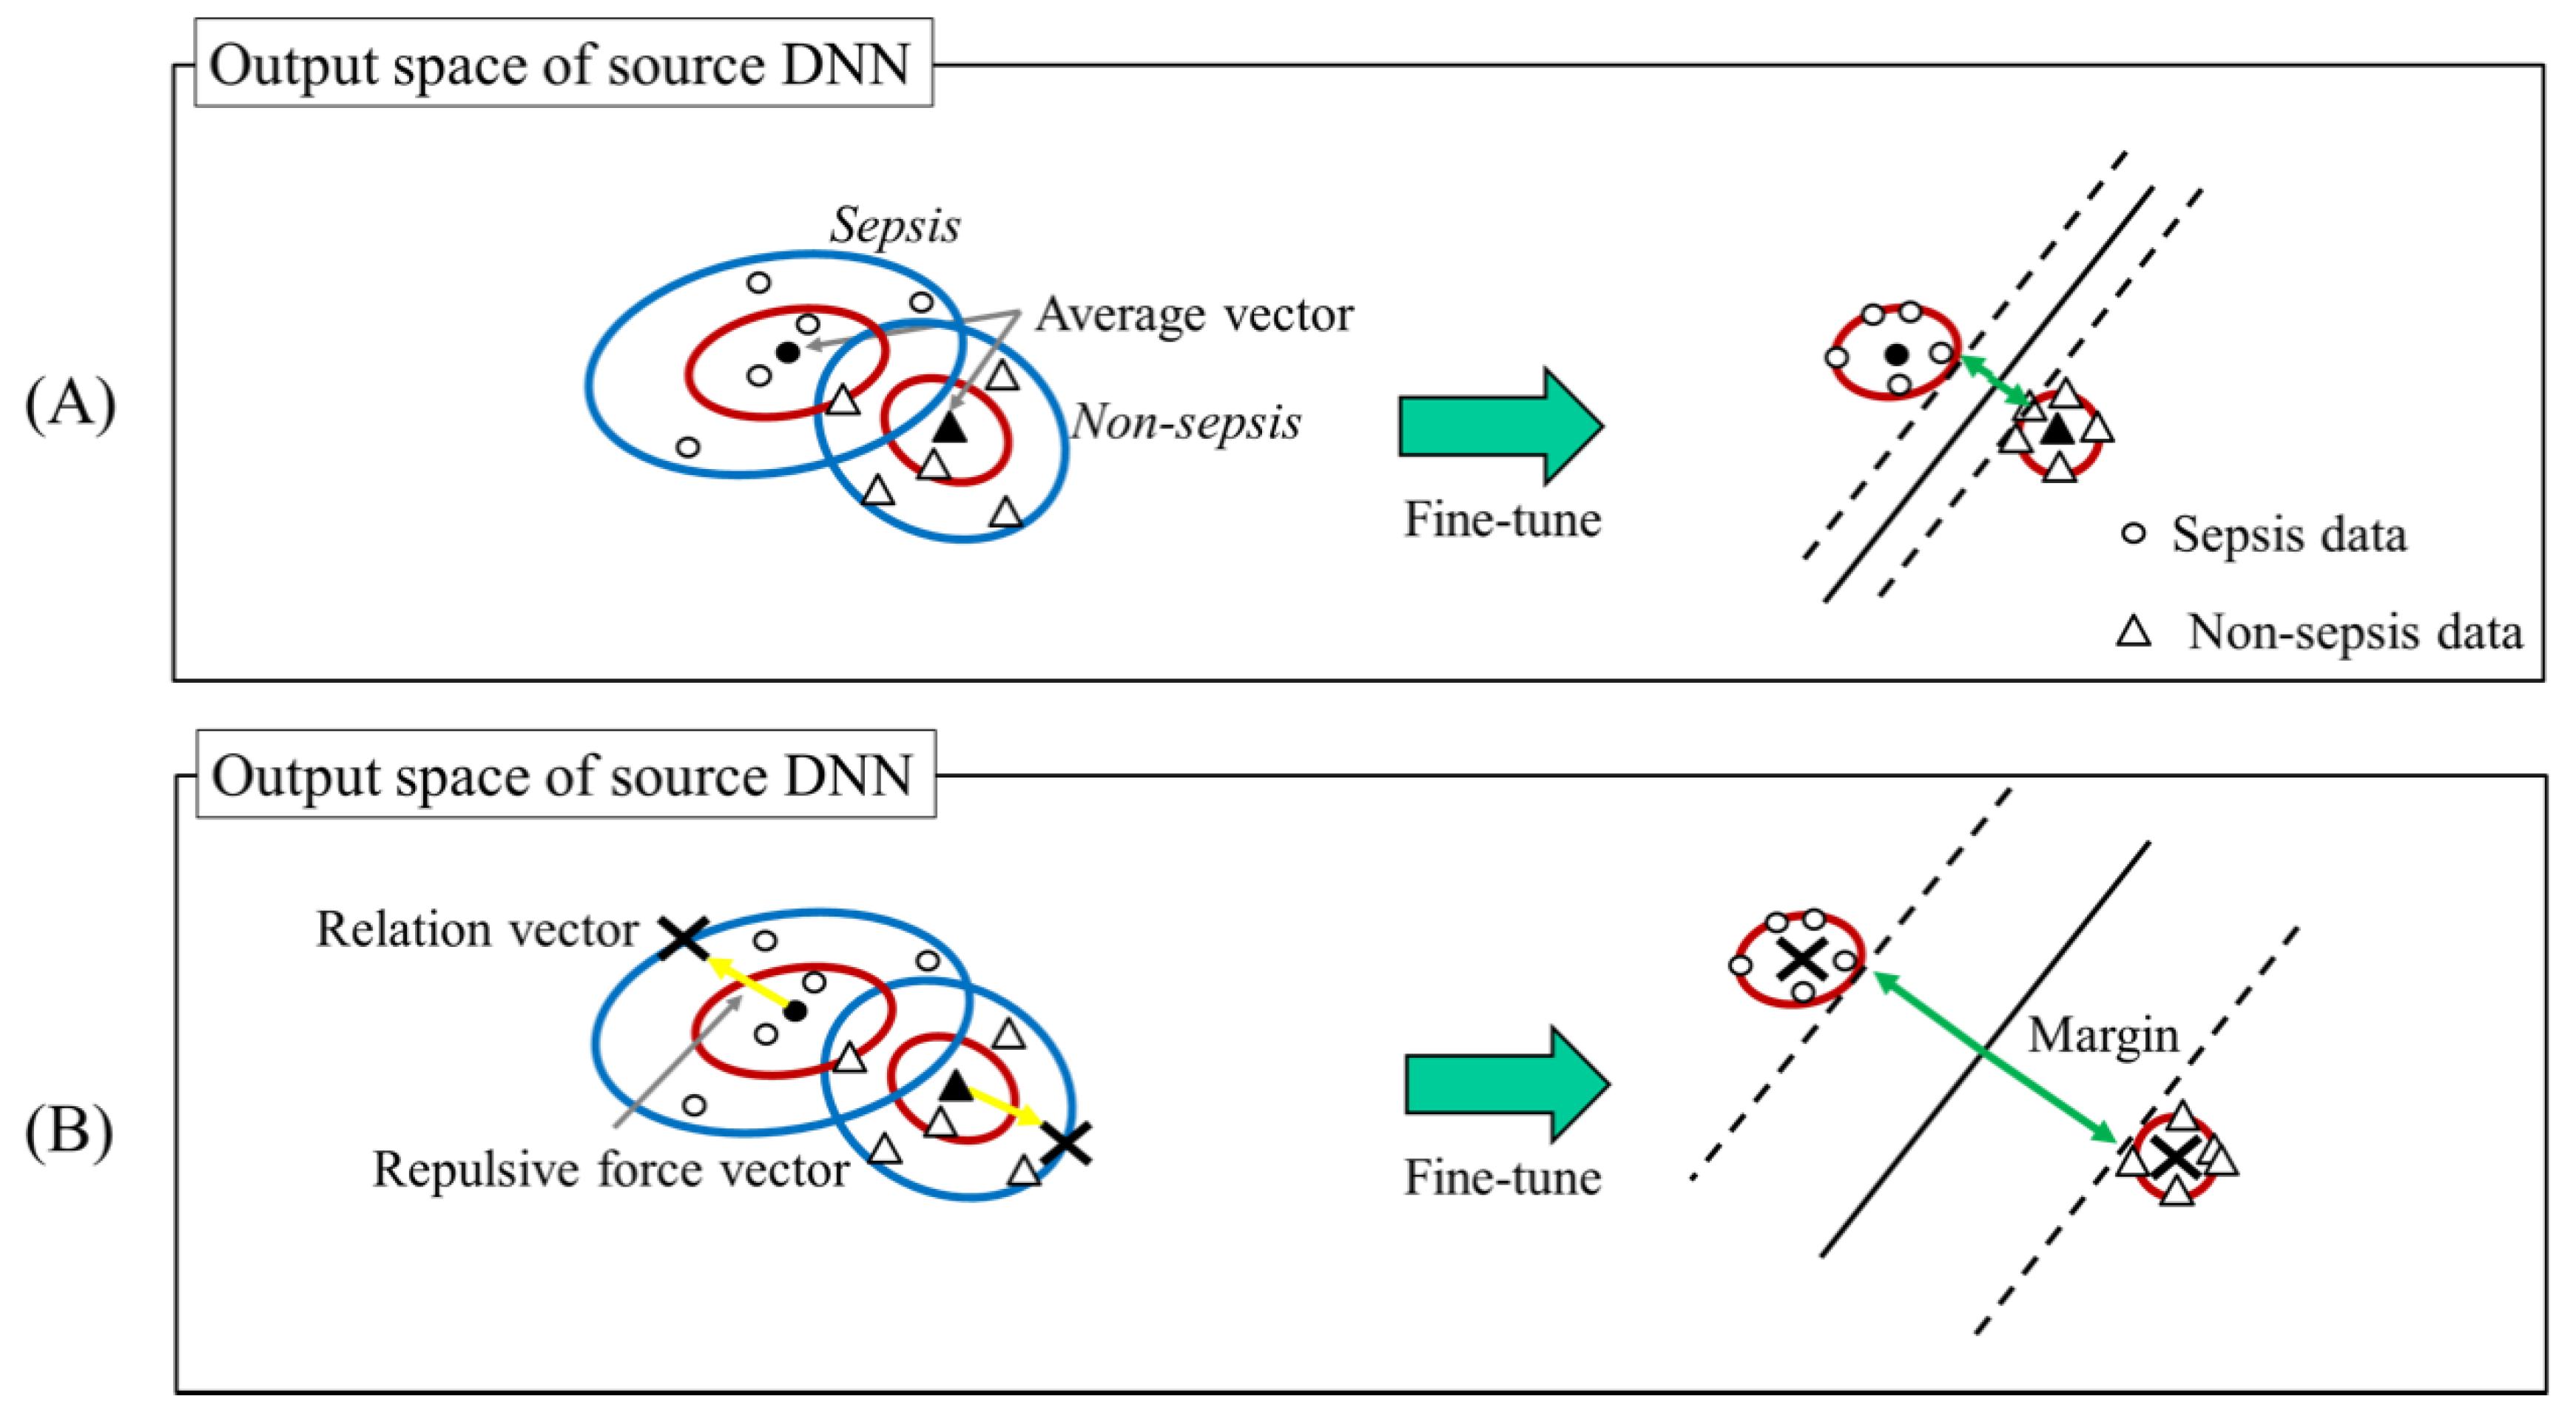
Conventional Transfer Learning for DNN and Our Proposed Approach. To estimate relation vectors, we consider the distance between hyperplane and the relation vectors. The last step of our method converges the target domain data around the corresponding relation vectors. Namely, the above distance strongly relates to the margin between the hyperplane and the target domain data.
Figure 2 shows the relationship between the relation vectors and the hyperplane. We assume that a large margin provides high classification performance similar to that of a support vector machine. However, if we maximize the margin without any constraints, the relation vectors obviously diverge, and the final fine-tuning process fails. From these considerations, we estimate relation vectors as follows:
where
represents relation vectors, and
represents the average vector. This is computed by the vectors and achieved by feeding the target domain data having the
l-th target domain label (sepsis or not) to the source DNN.
represent a vector which increases a distance between relation vectors. We call this vector as a repulsive force vector. To maximize the margin while preventing divergence, we add constraints to the repulsive force vector. In this article, the length of this vector is set so that the Mahalanobis distance with
is 1.0, and the direction is set so that the distance between other relation vectors is maximized. By using this setting, without the risk of divergence, our method can provide a large margin compared to
which is the simplest approach of relation vectors estimation [
17] shown in
Figure 2.
Table 1 lists the confusion matrix when
Compared to
Table 2, using our method we can improve the classification performance.
Setting of DNN. We used one CPU (core i7 5930K) and one GPU (GeForceGTX TITAN X), and training time took less than 2 h in total. When the test image is inputted, our method can output answer less than 1 s.
We selected the best hyperparameters as follows. The number of hidden layers was selected from {1, 2, 3}, the learning rate was selected from {1.0 × 10⁻³, 5.0 × 10⁻³, 1.0 × 10⁻², 5.0 × 10⁻²}, and the momentum was gradually increased from 0.5 to {0.7, 0.99}. The size of minibatches set as 10.
We used open source library pylearn2 [
18] and set the total iteration of fine-tuning of all methods to be 200. We confirmed that all first DNNs which are trained by the source domain were not overfitted by using the ten-fold cross-validation of the source domain in advance.
The 2D-GE image first cuts the area, not including the spots, and is then downsized to 53 × 44 = 2332 gray-scale pixels due to the limited source and target domain data. This input size was determined to preserve the information of large spots under the supervision of biologists. All images of Caltech-101 were resized to 53 × 44 to ensure that they were aligned with the 2D-GE images. In addition, due to limited source domain data, we used a compact model, of which the dimension of all hidden layers is 188 (cumulative contribution is over 99.5% based on PCA). When we used Caltech-101 as the source domain, we selected the dimension from {188, 500, 1000} because Caltech-101 is larger than 2D-GE source domain. Note that when we use 2D-GE source domain, the first DNN was overfit.
3. Results
3.1. 2D-PAGE Using Sepsis Patients’ Serum
For sepsis data classification, which is our main task, we collected the following numbers: sepsis data 30, and non-sepsis data 68. Also, images obtained from serum with different experimental parameters were also used for machine learning (
Table 3). The diagnosis was made by a doctor’s comprehensive diagnosis and sample (blood) culture.
3.2. Machine Learning
We evaluated the performance by ten-fold cross-validation. As the source domain which differs from target domain (sepsis diagnosis), we used 2D-GE images with different labels from the target domain sepsis or non-sepsis data. These images were generated from patients diagnosed as normal. The source domain task comprised the classification of the differences between protein extraction and refining protocols, as shown in
Table 3.
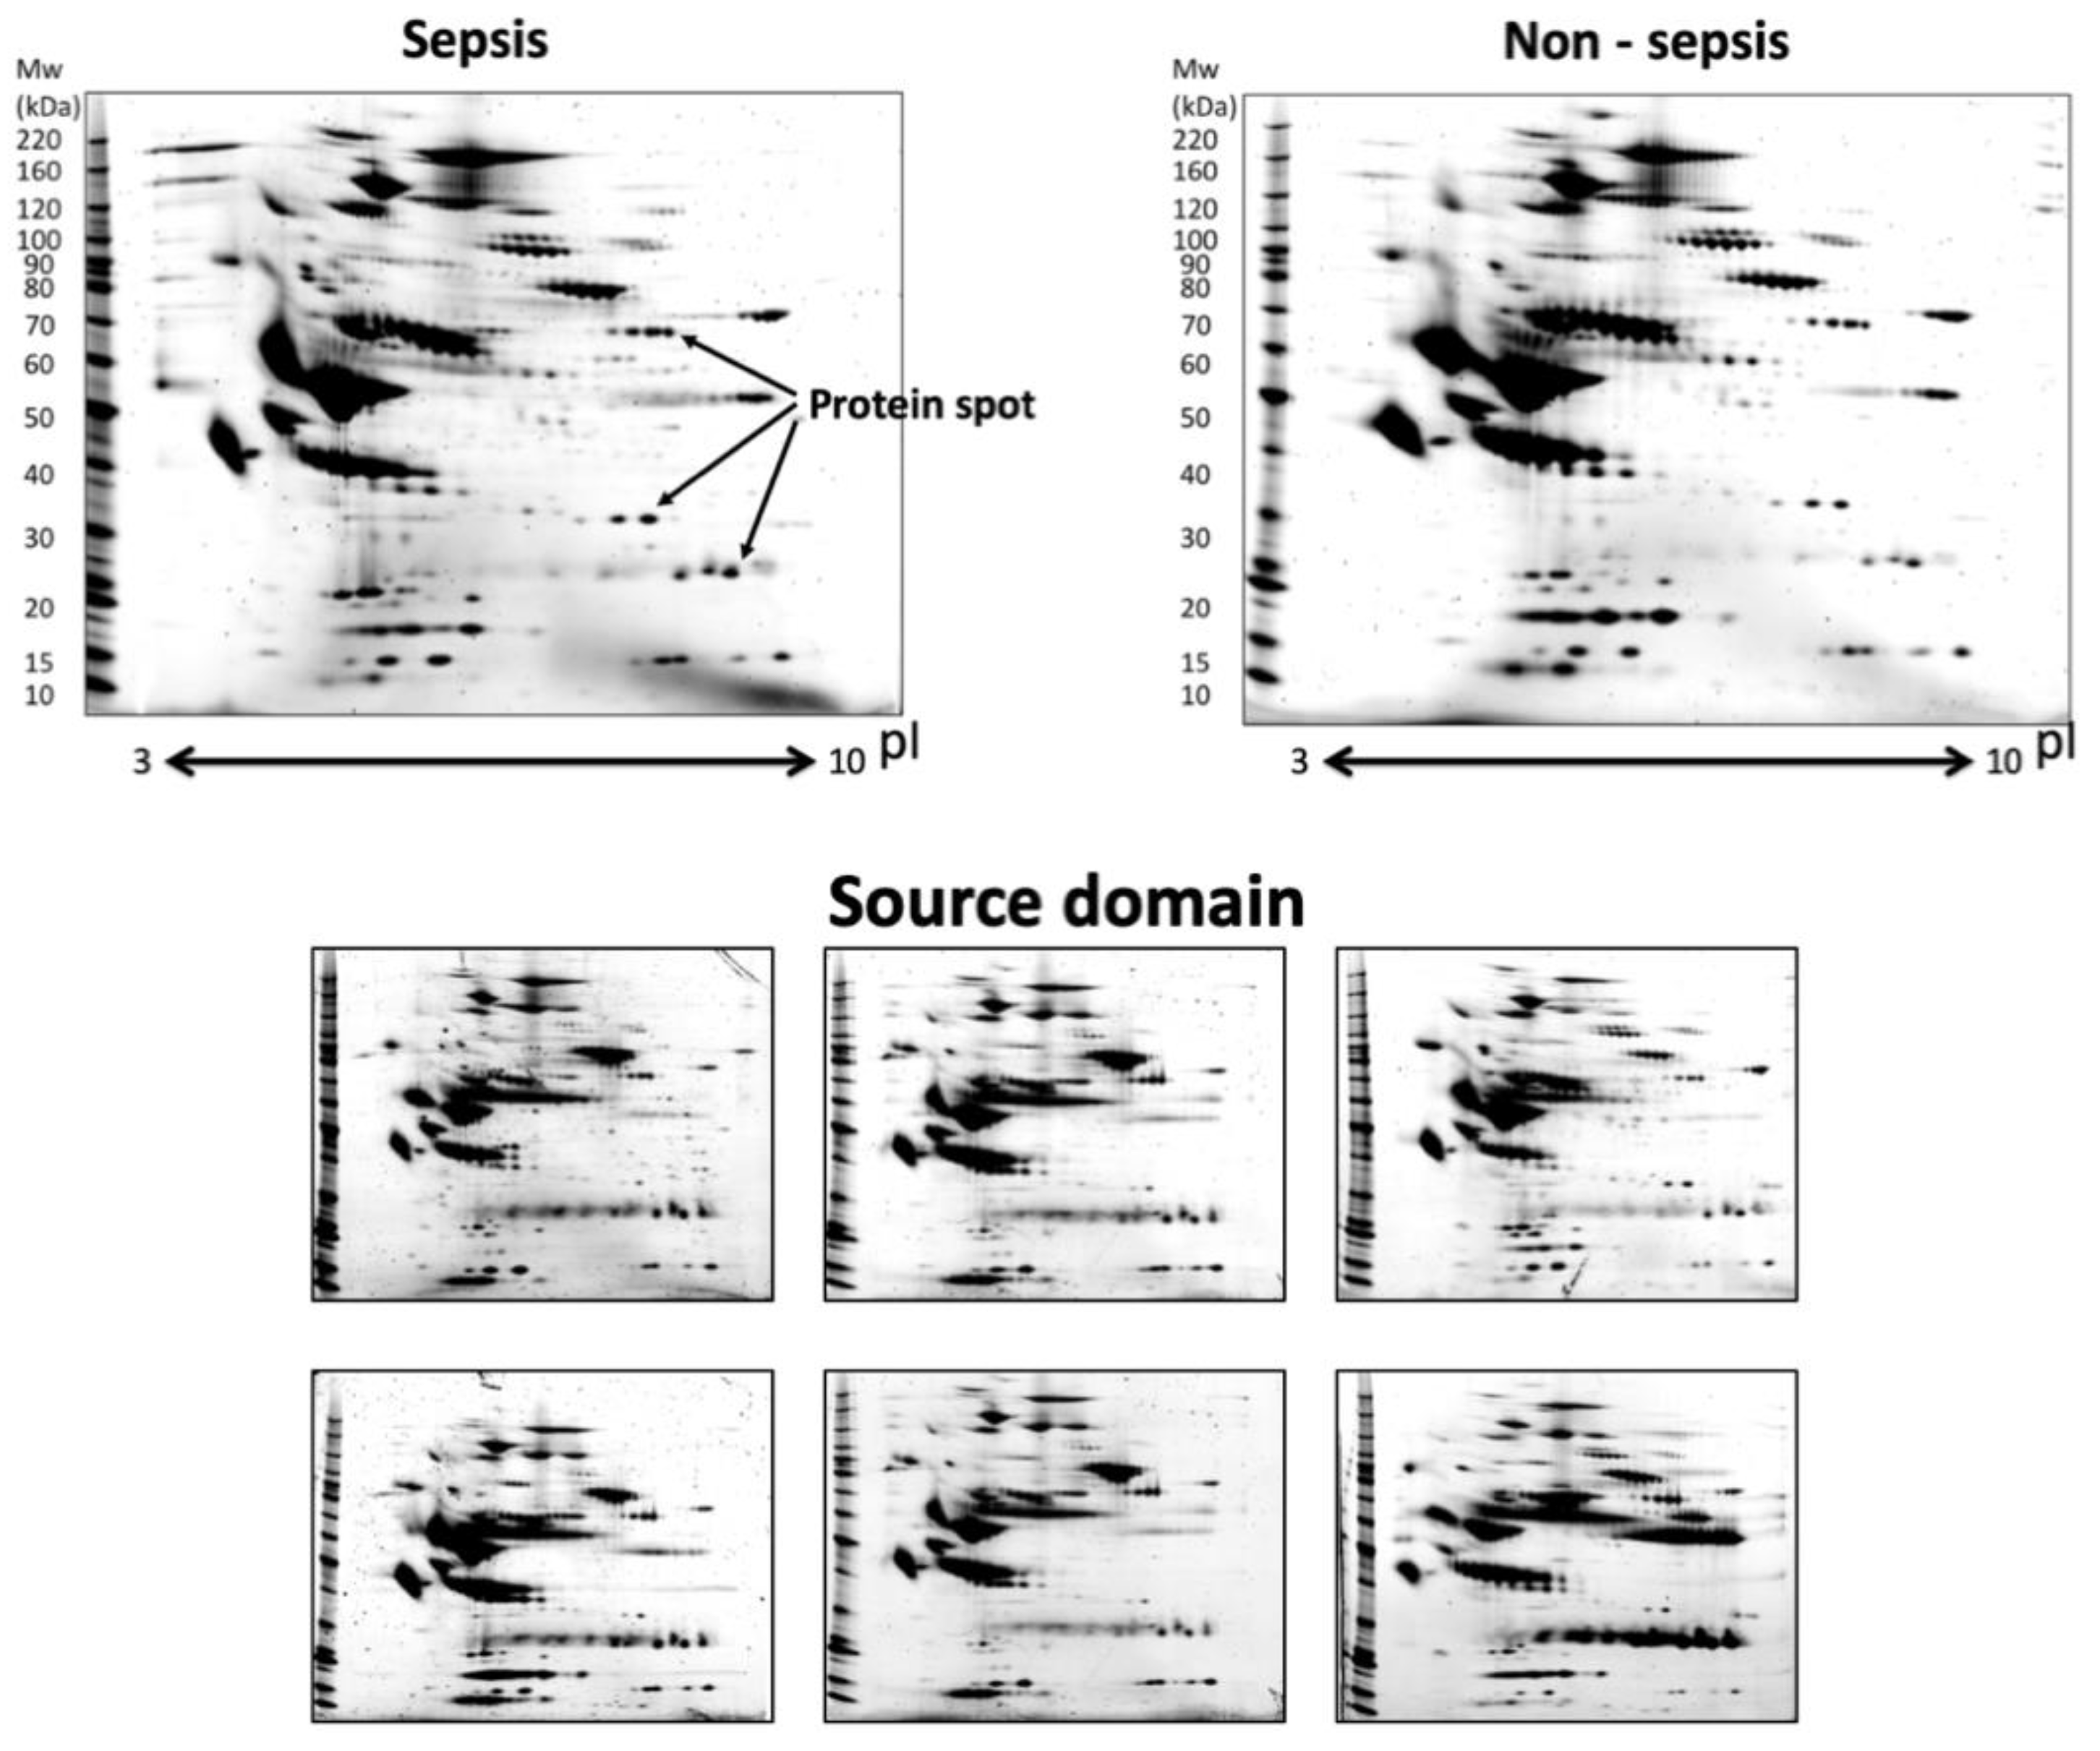
Figure 3 shows examples of sepsis, non-sepsis, and source domain images. Since these source domain data included many spots and minute spot changes, we expected that they would also include the information for classifying sepsis. Additionally, data obtained during the process of optimization for the procedure (
Table 3) are supposed to include all of variations of the 2D-GE images.
In this study, we inputted the 2D-GE images directly into the DNN because valid spots for detecting sepsis have not been fully clarified to date.
Table 2 lists our confusion matrix,
Table 4 lists the matrix of full scratch model which trains only target domain, and
Table 5 list the matrices of conventional transfer learning method [
15]. Our method clearly made the diagnoses of sepsis by an absolutely different concept from the conventional ones as shown in these tables, and the evidence is revealed in the progress of this research as the partial ones have been shown in this paper.
The above result used 2D-GE images as the source domain data. To investigate the relationship between the source and target domain, we changed the source domain data, which were obtained from Caltech-101 [
19]. Caltech-101 is a famous natural picture dataset including 101 labels (e.g., airplanes, camera, panda). The number of images of Caltech-101 is 9146.
Table 6 list the confusion matrix of Caltech-101. Compared to
Table 2, the classification performance of using 2D-GE images as the source domain was higher than the performance of using Caltech-101, although the number of 2D-GE images was smaller. These results show that information regarding the differences between protein extraction and refining protocols is useful for classifying sepsis.
As described above, in 2D-GE images, the position of a protein not related to the phenomena of interest is theoretically equal for each patient. Thus, by visualizing the weight of the target DNN such as “google cat [
20]”, we can confirm the effectiveness of spots in sepsis classification.
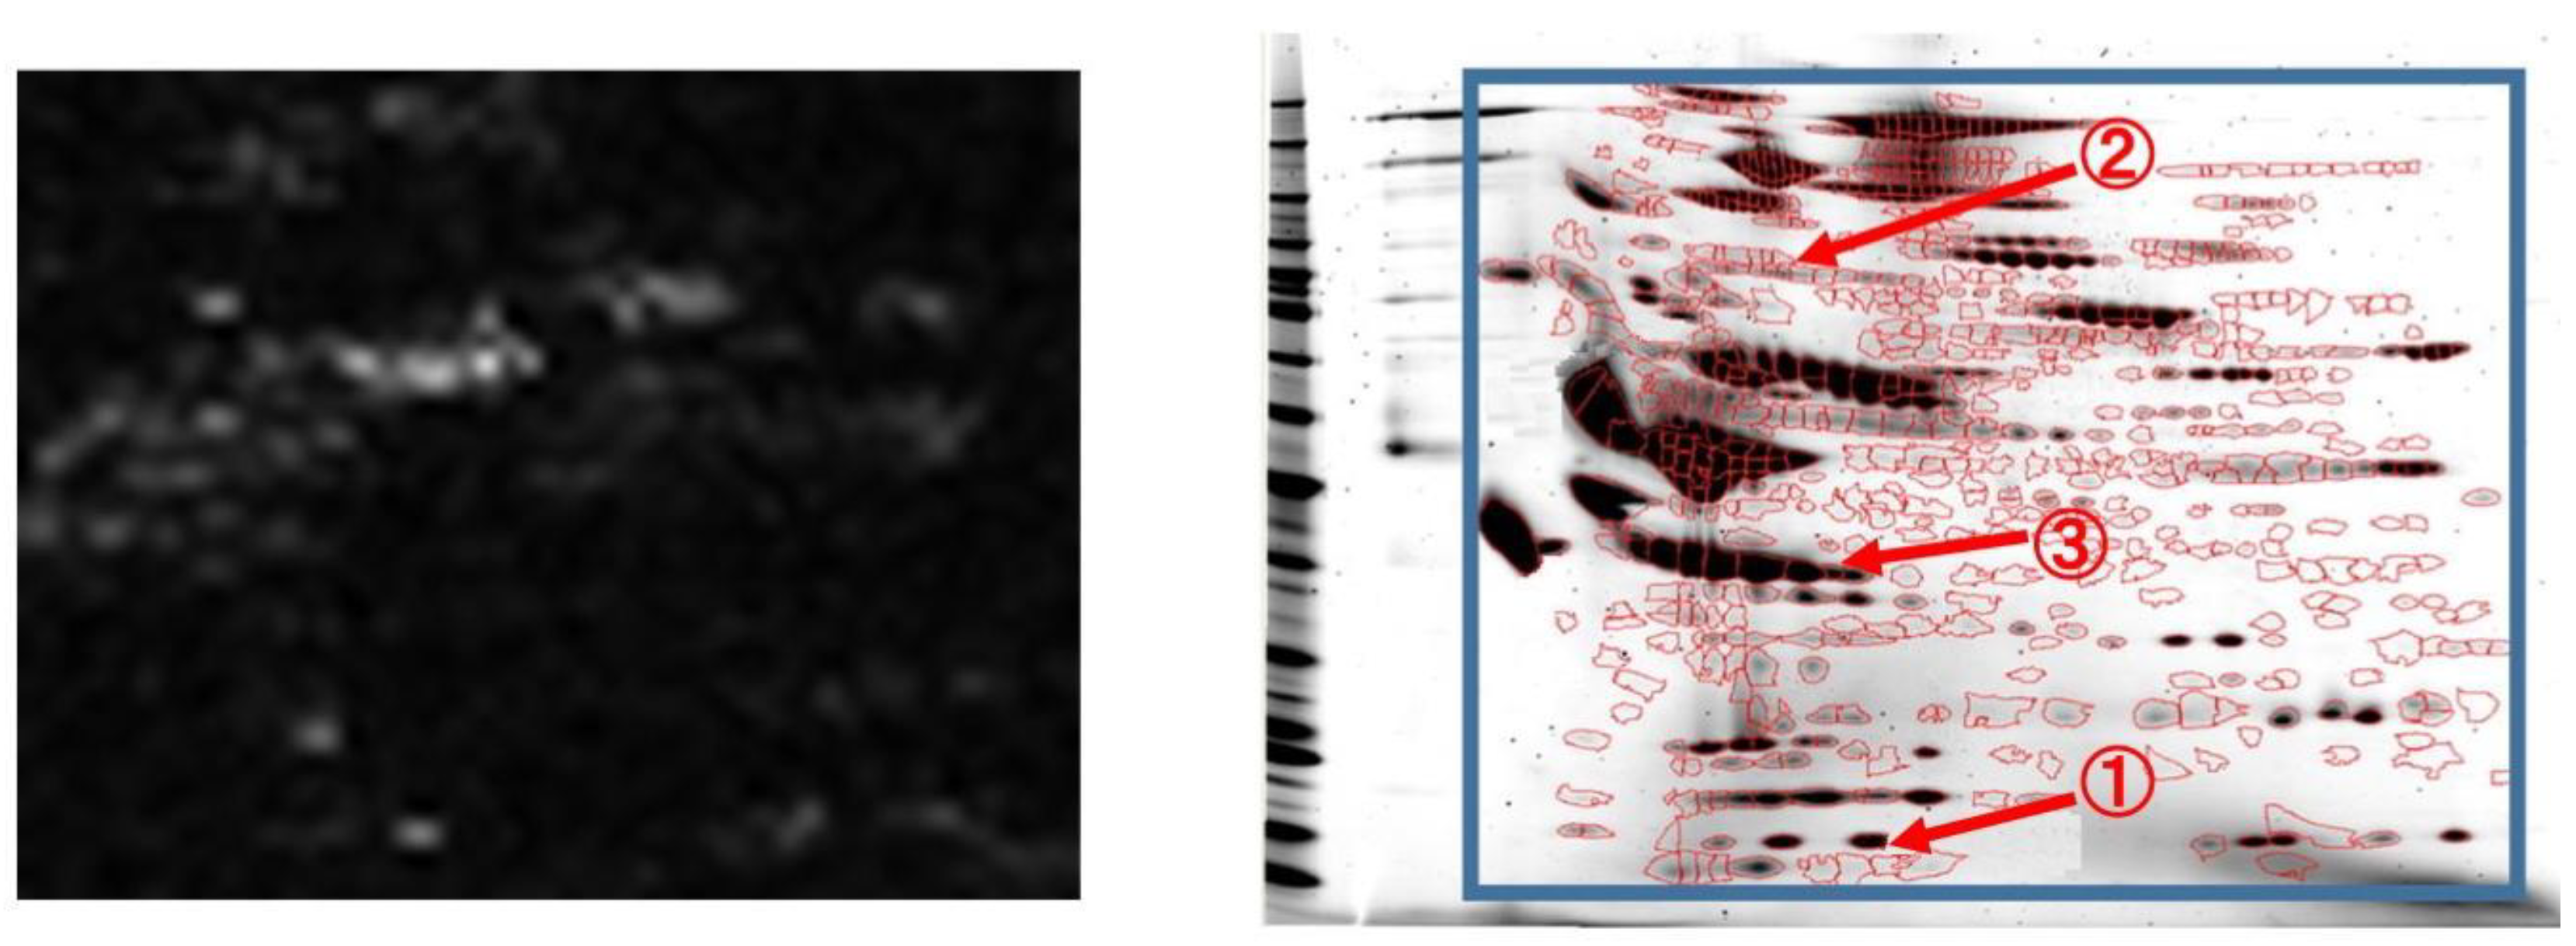
Figure 4 shows the average of the absolute weights of the first layer when the source domain data are 2D-GE images. By using this visualization, doctors can confirm the effective spots at a glance. As shown in this figure, our method uses the minute changes of many spots to classify sepsis. In addition, the red circles show examples of currently known valid spots for sepsis classification. The circled 1 represents Transthyretin [
21], 2 represents Ceruloplasmin [
22], and 3 represents Prothrombin [
23]. These have been validated by mass spectrometry [
3]. Transthyretin is an amyloidogenic protein that can lead to a heterogeneous group of disorders characterized by accumulation of polypeptide amyloid fibrils. Ceruloplasmin is an enzyme which in its structure contains six atoms of copper and is responsible for catalyzing the oxidation of iron. Prothrombin is a vitamin K-dependent plasma protein synthesized in the liver. Some significant spots, including theses ones, are supposed to be closely related to the progression mechanism of the sepsis [
3]. This result indicates that the DNN can automatically detect biologically meaningful spots. Valid spots for classifying sepsis have not been fully clarified to date. Thus, the weight visualization may help to elucidate new spots related to sepsis.
4. Discussion
Proteins are configuration factors that drive biological systems, and proteomics represents the ultimate method for profiling living organisms by exhaustive and comprehensive assessment of the types and amounts of proteins. Although the information density of the image data generated by 2D-GE is extremely high compared with other methods, the problem has been how to extract the data. It was generally thought, moreover, that 2D-GE image data should be amenable to analysis by AI, which is generally highly favorable as a means of image analysis, but the technical difficulty of obtaining high-quality data in a large volume has effectively prevented the application of machine learning. In the present study, we approached this problem by developing a 2D-GE method with high throughput and high reproducibility, obtaining a fairly high amount of high-quality data. We also developed deep-learning and transfer-learning algorithms, and thanks to increases in computer capacity, employed these algorithms for disease diagnosis aided by machine learning of 2D-GE images for the first time. This success is the result of these technical advances and was facilitated by the choice of sepsis as a fulminant target disease easily distinguished from normal health.
The severity of the sepsis varies significantly depending on the inflammatory response and organ dysfunction. Severe sepsis during which hypotension continues even after adequate fluid resuscitation is classified as septic shock [
4]. Mortality of severe sepsis is as high as 20 to 30% [
5,
6,
7], and the early initiation of the proper treatment greatly improves the mortality rate. Some molecules including c-reactive protein (CRP), IL-6, procalcitonin (PCT), and other substances are currently used as clinical biomarkers for sepsis, but none of these biomarkers has adequate performance in terms of the outcome prediction [
16,
24]. CRP is most popularly used as an indicator of infection, but it is also elevated in conditions other than the infection. IL-6 is a representative of the inflammatory cytokines, but the usefulness in diagnosing sepsis is still controversial [
25,
26]. Recently, monitoring of PCT has been proposed as clinically useful. However, because the levels are elevated even during non-infectious inflammation, such as after surgery or from trauma, the diagnostic accuracy is still a matter for debate [
27]. Therefore, a new method enabling diagnosis in a shorter time and with greater accuracy is required with the clear evidence.
AI-aided diagnosis with machine learning using 2D-GE images of biological samples has also been shown to be possible for diseases other than sepsis. Currently, diseases are investigated separately using distinctive samples, but presumably simultaneous diagnosis of different diseases could be performed by applying the present method to a single processing of an image as a sample for multiple diseases. This may well help slow the rise in medical costs associated with increasing numbers of tests and test parameters. For that purpose, it will be necessary to obtain learning data on each disease and perform the related machine learning. With sepsis, a fulminant disease, successful disease diagnosis with machine learning was achieved using a volume of training data smaller than usual (by an order of magnitude). The volume of required training data will increase with the complexity of the pathology and the mildness of the symptoms (i.e., less change), but by increasing the volume of training data for any disease that has been described, it will then be logically possible to achieve diagnosis not only after the outbreak of illness but in its early, non-pathologic, and pre-symptomatic stages. Early discovery and consequent avoidance of the need for treatment in a critical stage can also lead to lower medical costs. Nevertheless, further clinical validations are needed to evaluate the actual efficacy. Especially for different tests, it is considered that they will be meaningful. Samples from the other groups of sepsis patients who comprise different generations, onset reason/results, and regions will be useful.
Apart from diagnosis of disease, application of this method by an “AI doctor” for “diagnosis” (assessment and guidance) relating to biological conditions such as normal fatigue and voluntary bodily functions, including intelligence, muscular strength, metabolism, and emotions, might also be possible. Advice from the AI doctor could help individuals achieve maximum performance, such as a student in the next day’s test, an athlete in a coming sports match, or an employee in an approaching work period. The possibilities of AI-aided diagnosis may also extend beyond human health to other organisms (such as cattle and livestock (meat quality control, animal health control)), agriculture (e.g., produce quality control), pet health, and other plant and animal sectors.
The AI-aided diagnosis process holds the promise of faster, highly accurate diagnosis and the high probability of discovering biomarkers based on the identification of specific 2D-GE spots using AI that simply cannot be detected by the human eye. Extracting AI-specific spots as relevant criteria and identifying them as new biomarkers will then comprise major tasks.
The diseases/conditions that can be diagnosed via AI-aided diagnosis will increase over a wide range with increases in learning data, and integration of large amounts of data will be necessary for that purpose. However, the possibility is strong for (1) development of a 2D-GE device/system that is small and general-purpose in principle and facilitates obtaining large-amount/volume of wide-ranging data, and (2) the achievement of transmission to an image data analysis center of relatively small size compared with the very high information density relative to that generated using other methods. This diagnosis method will increase in applications and accuracy with rising data integration. It is an organism diagnosis system that will continue to expand, and data providers will contribute to the development of new diagnosis methods and enjoy their benefits. One of the most important aspects of the success achieved in this study is the demonstration that the automation of data processing (diagnosis) using AI can be achieved. The AI-aided method described here can be applied to the discovery of new findings by cooperating participants seeking to build mutual win–win relationships with the goal of realizing a future-oriented healthy society.
Sepsis is caused by multiple factors: bacterial, fungal, viral, etc. Although proteome data include comprehensive knowledge to differentiate the type of the sepsis, this could hardly be extracted manually so far. However, it is expected that the DNN technique can differentiate the type of vector for sepsis for the future. Furthermore, in a clinical setting, evaluating the stage of sepsis is critical. However, this study was the first challenge so we used only extreme samples that could be clearly defined. The classifier, when properly trained to output the stage of sepsis for, e.g., early stage, late stage, septic shock, etc., is the next significant goal of this technique.
The aim of this study was to obtain proof of the concept that proteome image data can be treated by AI, so we chose a clear target (diagnoses of clearly judged states in the medical setting). One of the important next issues will be to improve the current diagnoses through this technique. In addition, for future practical use it is necessary to unify the procedure for acquiring data. This is also an issue for the future.
Author Contributions
Original concept, writing—final draft preparation, project administration, supervision, funding, N.H.; writing—original draft preparation, methodology, and analysis, Y.S. (Yoshihide Sawada); analysis, Y.S. (Yoshikuni Sato); data curation, K.U. and S.Y.; project administration, T.N.; sample collection, T.M.; supervision, medical consideration, T.I.; writing—review and editing, all authors. All authors have read and agreed to the published version of the manuscript.
Funding
This work was supported in part by Grants-in-Aid for Scientific Research C 25462831 and 16K11421 from the Ministry of Education, Science, Sports and Culture of Japan. A part of this study was supported by CR Fixed Income Fund from AXA Life Insurance Co., Ltd., Japan. A part of this study was also supported by NIMS Nanofabrication Platform in Nanotechnology Platform Project sponsored by the Ministry of Education, Culture, Sports, Science and Technology (MEXT), Japan.
Institutional Review Board Statement
This study has been approved by the ethical committee of Nihon University, Juntendo University and Tokyo Institute of Technology under the approval numbers 120403, 2013087, and 2016069.
Informed Consent Statement
This study has been managed by the ethical committee of Nihon University, Juntendo University and Tokyo Institute of Technology.
Data Availability Statement
Data sharing not applicable.
Conflicts of Interest
The authors declare no conflict of interest.
References
- He, T. Implementation of Proteomics in Clinical Trials. Proteom. Clin. Appl. 2019, 13, e1800198. [Google Scholar] [CrossRef] [PubMed]
- Wong, S.Y.; Hashim, O.H.; Hayashi, N. Development of high-performance two-dimensional gel electrophoresis for human hair shaft proteome. PLoS ONE 2019, 14, e0213947. [Google Scholar] [CrossRef] [PubMed]
- Hayashi, N.; Yamaguchi, S.; Rodenburg, F.; Wong, S.Y.; Ujimoto, K.; Miki, T.; Iba, T. Multiple biomarkers of sepsis identified by novel time-lapse proteomics of patient serum. PLoS ONE 2019, 14, e0222403. [Google Scholar] [CrossRef] [PubMed] [Green Version]
- Dellinger, R.; Levy, M.; Rhodes, A.; Carlet, J.M.; Bion, J.; Parker, M.M.; Jaeschke, R.; Vincent, J.L. Surviving Sepsis Campaign: International guidelines for management of severe sepsis and septic shock. Intensive Care Med. 2013, 39, 165–228. [Google Scholar] [CrossRef]
- Skibsted, S.; Bhasin, M.K.; Aird, W.C.; Shapiro, N.I. Bench-to-bedside review: Future novel diagnostics for sepsis—A systems biology approach. Crit. Care 2013, 17, 231. [Google Scholar] [CrossRef]
- Stevenson, E.K.; Rubenstein, A.R.; Radin, G.T.; Wiener, R.S.; Walkey, A.J. Two decades of mortality trends among patients with severe sepsis: A comparative meta-analysis. Crit. Care Med. 2014, 42, 625–631. [Google Scholar] [CrossRef]
- Angus, D.C.; Linde-Zwirble, W.T.; Lidicker, J.; Clermont, G.; Carcillo, J.; Pinsky, M.R. Epidemiology of severe sepsis in the United States: Analysis of incidence, outcome, and associated costs of care. Crit. Care Med. 2001, 29, 1303–1310. [Google Scholar] [CrossRef]
- Appel, R.; Hochstrasser, D.; Roch, C.; Funk, M.; Muller, A.F.; Pellegrini, C. Automatic classification of two-dimensional gel electrophoresis pictures by heuristic clustering analysis: A step toward machine learning. Electrophoresis 1988, 9, 136–142. [Google Scholar] [CrossRef]
- LeCun, Y.; Bengio, Y.; Hinton, G. Deep learning. Nature 2015, 521, 436. [Google Scholar] [CrossRef]
- Esteva, A.; Kuprel, B.; Novoa, R.A.; Ko, J.; Swetter, S.M.; Blau, H.M.; Thrun, S. Dermatologist-level classification of skin cancer with deep neural networks. Nature 2017, 542, 115. [Google Scholar] [CrossRef]
- Pan, S.J.; Yang, Q. A survey on transfer learning. Knowl. Data Eng. 2019, 22, 1345–1359. [Google Scholar] [CrossRef]
- Tajbakhsh, N.; Shin, J.Y.; Gurudu, S.R.; Hurst, T.; Kendall, C.B.; Gotway, M.B.; Liang, J. Convolutional Neural Networks for Medical Image Analysis: Full Training or Fine Tuning? Med. Imaging 2016, 35, 1299–1312. [Google Scholar] [CrossRef] [PubMed] [Green Version]
- Mou, L.; Meng, Z.; Yan, R.; Li, G.; Xu, Y.; Zhang, L.; Jin, Z. How Transferable are Neural Networks in NLP Applications? In Proceedings of the Empirical Methods on Natural Language Processing, Austin, TX, USA, 1–5 November 2016; pp. 479–489. [Google Scholar]
- Tzeng, E.; Hoffman, J.; Saenko, K.; Darrell, T. Adversarial discriminative domain adaptation. In Proceedings of the IEEE Conference on Computer Vision and Pattern Recognition, Honolulu, HI, USA, 21–26 July 2017; pp. 7167–7176. [Google Scholar]
- Razavian, A.S.; Azizpour, H.; Sullivan, J.; Carlsson, S. CNN features off-the-shelf: An astounding baseline for recognition. In Proceedings of the IEEE Conference on Computer Vision and Pattern Recognition Workshops (CVPRW), Honolulu, HI, USA, 21–26 July 2014; pp. 512–519. [Google Scholar]
- Bruel, A.V.; Thompson, M.S.; Haj-Hassan, T.; Stevens, R.; Moll, H.; Lakhanpaul, M.; Mant, D. Diagnostic value of laboratory tests in identifying serious infections in febrile children: Systematic review. Bmj 2011, 342, d3082. [Google Scholar] [CrossRef] [Green Version]
- Cortes, C.; Vladimir, V. Support-vector networks. Mach. Learn. 1995, 20, 273–297. [Google Scholar] [CrossRef]
- Goodfellow, I.J.; Warde-Farley, D.; Lamblin, P.; Dumoulin, V.; Mirza, M.; Pascanu, R.; Bergstra, J.; Bastien, F.; Bengio, Y. Pylearn2: A machine learning research library. arXiv 2013, arXiv:1308.4214. [Google Scholar]
- Fei-Fei, L.; Fergus, R.; Perona, P. Learning generative visual models from few training examples: An incremental bayesian approach tested on 101 object categories. Comput. Vis. Image Underst. 2007, 106, 59–70. [Google Scholar] [CrossRef]
- Le, Q.V.; Monga, R.; Devin, M.; Chen, K.; Corrado, G.S.; Dean, J.; Ng, A.Y. Building High-level Features Using Large Scale Unsupervised Learning. In Proceedings of the International Conference on International Conference on Machine Learning, 26 June–1 July 2012; pp. 507–514. [Google Scholar]
- Ingenbleek, Y.; Visscher, M.D.; Nayer, P.H. Measurement of prealbumin as index of protein-calorie malnutrition. Lancet 1972, 330, 106–109. [Google Scholar] [CrossRef]
- Chiarla, C.; Giovannini, I.; Siegel, J.H. Patterns of correlation of plasma ceruloplasmin in sepsis. J. Surg. Res. 2008, 144, 107–110. [Google Scholar] [CrossRef]
- Chinnaraj, M.; Chen, Z.; Pelc, L.A.; Grese, Z.; Bystranowska, D.; Cera, E.D.; Pozzi, N. Structure of prothrombin in the closed form reveals new details on the mechanism of activation. Sci. Rep. 2018, 8, 2945. [Google Scholar] [CrossRef] [Green Version]
- Pierrakos, C.; Vincent, J.L. Sepsis biomarkers: A review. Crit. Care 2010, 14, 1–18. [Google Scholar] [CrossRef] [PubMed] [Green Version]
- Oda, S.; Hirasawa, H.; Shiga, H.; Nakanishi, K.; Matsuda, K.I.; Nakamua, M. Sequential measurement of IL-6 blood levels in patients with systemic inflammatory response syndrome (SIRS)/sepsis. Cytokine 2005, 29, 169–175. [Google Scholar] [CrossRef] [PubMed]
- Abe, R.; Oda, S.; Sadahiro, T.; Nakamura, M.; Hirayama, Y.; Tateishi, Y.; Shinozaki, K.; Hirasawa, H. Gram-negative bacteremia induces greater magnitude of inflammatory response than Gram-positive bacteremia. Crit. Care 2010, 14, R27. [Google Scholar] [CrossRef] [PubMed] [Green Version]
- Schroeder, S.; Hochreiter, M.; Koehler, T.; Schweiger, M.; Bein, B.; Keck, F.S.; Spiegel, T.V. Procalcitonin (PCT)-guided algorithm reduces length of antibiotic treatment in surgical intensive care patients with severe sepsis: Results of a prospective randomized study. Langenbeck’s Arch. Surg. 2009, 394, 221–226. [Google Scholar] [CrossRef] [PubMed]
| Publisher’s Note: MDPI stays neutral with regard to jurisdictional claims in published maps and institutional affiliations. |
© 2021 by the authors. Licensee MDPI, Basel, Switzerland. This article is an open access article distributed under the terms and conditions of the Creative Commons Attribution (CC BY) license (http://creativecommons.org/licenses/by/4.0/).


 ,
, 


