Article

Early Monitoring Response to Therapy in Patients with Brain Lesions Using the Cumulative SUV Histogram

1
Institute of Molecular Bioimaging and Physiology, National Research Council (IBFM-CNR), 90015 Cefalù, Italy
2
Laboratori Nazionali del Sud, Istituto Nazionale di Fisica Nucleare, 95125 Catania, Italy
3
University Medical Center Groningen, Department of Radiotherapy, University of Groningen, 9713 GZ Groningen, The Netherlands
4
FORA S.p.A., Via Alfred Bernhard Nobel 11/A, 43122 Parma, Italy
5
Nuclear Medicine and NeuroRadiosurgery Departments, Cannizzaro Hospital, 95126 Catania, Italy
6
Ri.MED Foundation, Via Bandiera 11, 90133 Palermo, Italy
*
Author to whom correspondence should be addressed.
Submission received: 19 February 2021 / Revised: 16 March 2021 / Accepted: 23 March 2021 / Published: 27 March 2021

Abstract

:

Featured Application

The study proposes a methodology to evaluate the response of patients with brain lesions to Gamma Knife treatments through the use of Positron Emission Tomography imaging.

Abstract

Gamma Knife treatment is an alternative to traditional brain surgery and whole-brain radiation therapy for treating cancers that are inaccessible via conventional treatments. To assess the effectiveness of Gamma Knife treatments, functional imaging can play a crucial role. The aim of this study is to evaluate new prognostic indices to perform an early assessment of treatment response to therapy using positron emission tomography imaging. The parameters currently used in nuclear medicine assessments can be affected by statistical fluctuation errors and/or cannot provide information on tumor extension and heterogeneity. To overcome these limitations, the Cumulative standardized uptake value (SUV) Histogram (CSH) and Area Under the Curve (AUC) indices were evaluated to obtain additional information on treatment response. For this purpose, the absolute level of [11C]-Methionine (MET) uptake was measured and its heterogeneity distribution within lesions was evaluated by calculating the CSH and AUC indices. CSH and AUC parameters show good agreement with patient outcomes after Gamma Knife treatments. Furthermore, no relevant correlations were found between CSH and AUC indices and those usually used in the nuclear medicine environment. CSH and AUC indices could be a useful tool for assessing patient responses to therapy.

1. Introduction

The Leksell Gamma Knife (GK) is a stereotactic radio surgical device capable of treating brain tumors inaccessible to conventional surgery by allowing accurate target irradiation. It is a minimally invasive instrument that does not involve a scalpel or incision [1,2]. Tumor delineation is the crucial step when planning GK treatment because metastatic lesions can show infiltrative natures. Magnetic resonance (MR) is usually used to perform accurate delineation of the target volume. MR provides high-quality images with excellent soft-tissue contrast [3,4,5,6]. With the aim of adding another layer of sophistication during radiosurgery, the integration of positron emission tomography (PET) images in the treatment planning phase was evaluated [7,8,9]. Functional information improves lesion knowledge, as demonstrated by Gempt et al. [10]. The biological tumor volume (BTV) identified by PET can be used to treat the cancer region more precisely [11]. Furthermore, PET imaging has become a standard component of diagnosis and staging in oncology [12,13,14,15,16]. Functional changes are often faster and more indicative of the effects caused by therapy than anatomical imaging, providing a faster method of detecting the treatment response [17,18]. Levivier et al. [19] found that PET conveys complementary information to information derived from computerized tomography (CT) or MR imaging in brain disorders. Historically, the first parameter introduced for the evaluation of PET studies is the maximum standardized uptake value (SUVmax), which provides punctual information of the voxel showing the highest uptake value within the tumor. Nevertheless, this parameter can be affected by statistical fluctuation errors and cannot provide information on the extent of the tumor [20]. For this reason, other quantitative indices have been introduced, such as metabolic tumor volume (MTV) and total lesion glycolysis (TLG) [21]. These parameters provide information on the extent of the tumor but no information on the uptake heterogeneity.
To overcome these limitations and considering that the dose distribution is not uniform in GK treatments, sixteen patients underwent [11C]-Methionine (MET) PET scans and GK treatments were considered in this study to calculate new PET indices, such as the Cumulative SUV Histogram (CSH) and Area Under the Curve (AUC), in order to obtain additional PET information, such as the functional heterogeneity [22]. In other words, we focus on the [11C]-MET uptake heterogeneity in pre- and post-treatment PET examinations by calculating CSH and AUC for each patient. Methionine is an amino acid that exhibits increased transport within active cancer cells. It has been reported that the extent of tumor cell invasion can be more clearly detected by [11C]-MET PET than by CT or MR [23]. The correlation between CSH and AUC results with medical reports evaluated by three physicians was also considered in our study. The proposed methodology could represent a useful tool for assessing patient response to GK treatments.

2. Materials and Methods

2.1. Patients

We retrospectively analyzed patients with metastatic brain cancers who underwent restaging PET/CT after GK between March 2014 and December 2015. The inclusion criteria were as follows: (i) [11C]-MET PET/CT performed one week before stereotactic neuro-radiosurgery, (ii) [11C]-MET PET/CT performed two months after stereotactic neuro-radiosurgery for the early treatment assessment, and (iii) MR performed one year after stereotactic neuro-radiosurgery to assess the treatment response. In this way, sixteen patients (8 males, 8 females; mean age ± standard deviation: 60 ± 9.80 years; median age: 57 years; age range: 48 ÷ 78 years) with metastatic brain cancers originating from melanoma (n = 2), breast (n = 2), kidney (n = 2), lung (n = 9), and urothelium (n = 1) primary cancers were considered.
All subjects were treated with Leksell Gamma Knife® model C, a mini-invasive technique for the treatment of cerebral lesions inaccessible to conventional surgery [24,25]. The dose released during treatment in a single fraction ranged from 16 to 18 Gy at 50% isodose. The qualitative evaluation of the treatment response was carried out by a team of three physicians (S.C., Sebastiano Cosentino, F.M., and S.C., Salvatore Cicero). The clinical staff jointly analyzed brain tumors without any information of the quantitative evaluation performed in this study. Comparing their perspectives, physicians were able to provide a careful assessment for each case.
This study was not a clinical trial but a retrospective study that did not influence management of patients. Image analyses were performed offline. In any case, the informed consent to the processing of personal data was obtained from all the subjects involved in the study.

2.2. [11C]-Methionine PET (MET)

Methionine is the most popular amino acid tracer used in PET imaging. It has a potential role in providing additional information in brain studies, although MR remains the gold-standard for diagnosis and follow-up evaluations after radiotherapy [26,27]. Cell proliferation in brain tumors is associated with protein synthesis and since the amino acids are protein constituents, avid uptake of these precursors indicates a rapidly proliferating cell. As a consequence, an increase in amino acid transport and protein synthesis, compared to normal tissue, indicates the presence of tumor proliferation. For this reason, MET-PET is able to distinguish between malign and benign tissue with great sensitivity and specificity. The MET-PET specificity for cancer delineation and differentiation between relapse and radiation necrosis is higher than MR [28].
Since C-11 isotope has a short half-life (20.3 min) [29], on-site production of MET is essential to perform diagnostic scans. An IBA cyclotron 18 MeV was used to produce C-11. To ensure compatibility with in vivo administration, the final product was subjected to quality control according to European Pharmacopoeia. Radiochemical and enantiomeric purity, higher than 95% and 90%, respectively, were assessed by radio-HPLC-UV, while residual solvents were evaluated by gas chromatography.

2.3. PET/CT

PET brain acquisitions were performed using the PET/CT Discovery 690 with time of flight (TOF) by General Electric Medical Systems (Milwaukee, WI, USA). Patients fasted for 4 hours before PET examination and were injected intravenously with MET. The PET protocol started 10 minutes after injection. PET images consisted of a matrix of 256 × 256 voxels of 1.1719 × 1.1719 × 3.27 mm3 voxel size. Imaging data were encoded in the 16-bit Digital Imaging and Communications in Medicine (DICOM) format. The activity of MET administered to patients was 550 MBq.

2.4. PET Feature-Based Measures

Similar to the dose–volume histogram (DVH), which is the radiation dose histogram for tumor treatment [30], the CSH uses the SUV derived from PET imaging instead of the dose value derived from CT imaging. Specifically, the SUV is the widely used PET semiquantitative parameter calculated as the ratio of the tissue radioactivity concentration (RC) in kBq/mL and the MET injected dose (ID) in MBq at the time of injection divided by the body weight in kilograms [31]:
SUV =   RC ID ×   M p
where RC is calculated as the ratio between the image intensity and the image scale factor. ID is the product between actual activity and dose calibration factor. Therefore, in the case of PET imaging, the image intensity values were normalized in SUVs. While the SUVmean is the mean intensity value in the region of interest (ROI), the SUVmax is defined as the voxel with the highest SUV within a specified ROI. It is the most common PET parameter because it is both a ROI and user independent [32]. A disadvantage is that it represents a small portion of the tumor that may not be a statistically reliable representation of the whole-tumor biology. It does not take into account the SUV distribution within the tumor. Starting from these considerations, the CSH is the representation of the percentage of the tumor volume with a certain SUV [22,33]. The CSH summarizes the 3D functional imaging intensity information in a single curve for the structure of interest, which will be used to derive intensity-volume metrics, such as the area under the CSH (AUC) to take into account the tumor uptake heterogeneity [22] (see Figure 1 for an example of CSH and AUC). In this way, it is possible to analyze changes in the uptake distribution within the tumor due to nonuniform dose distribution during GK treatments. Finally, in addition to the aforementioned PET feature-based measures, MTV and TLG were also calculated [21]. These parameters provide information on the tumor extension but no information on the uptake heterogeneity. MTV is the active volume of oncological lesions obtained using a segmentation algorithm, e.g., [34,35], while TLG was calculated to acquire a simultaneous estimate of volumetric and metabolic information:
TLG = MTV × SUV mean
Consequently, TLG is also a segmentation-dependent parameter.

2.5. Data Analysis

For the purpose of treatment response monitoring, the quantitative assessment of PET studies before and after treatment can become the standard. In general, however, the uptake of PET radiotracers is not homogeneously distributed across the tumor due to necrosis, cell proliferation, blood flow, microvessel density, and hypoxia [22]. For this reason, it is interesting to quantify heterogeneity in tumor uptake to provide useful information for planning radiation therapy treatment. The area under the CSH can be a quantitative parameter capable of providing additional information on the tumor response and its heterogeneity. Lower values correspond to greater heterogeneity.
To evaluate this innovative PET parameter in the evaluation of the treatment response, we analyzed PET images using a semiautomatic MATLAB tool [36] to reduce intra- and interoperator result variability. As a matter of fact, semiautomatic algorithms provide greater accuracy and consistency in defining PET volumes and they are important to quantify the response to therapy. In our tool, the operator dependence is minimal because it is limited to the change in the size of the bounding area containing the cancer region—no parameter setup is required.
In the following, a brief explanation of the processing steps is presented. The user draws a line on the coronal PET image along the lesion, and the axial slice with SUVmax is automatically identified and showed to the user. To manage ambiguous situations, physicians can make corrections to the volume of interest (VOI), including the tumor region, obtained as described in [36]. After a square bounding region enclosing the tumor is shown, the user can reduce the region size to discard any external area with high uptake to target. This approach allows the proper inclusion of cancer, excluding false positives. Furthermore, the number of PET slices containing the tumor in basal examinations is recorded to process the same slice volume in post-GK treatment examinations. In this way, the proposed tool is designed ad hoc to appropriately compare cumulative histograms between follow-up scans. According to the literature [19], the SUV threshold was set at 50% of SUVmax and the area under the CSH curve was considered as a quantitative index of the MET uptake heterogeneity within the lesion volume. Figure 2 outlines the overall flow diagram of the proposed approach.
In order to evaluate the ablation effect, the percentage change of AUC between pre- and post-treatment periods was obtained as follows:
Δ AUC = AUC post AUC pre AUC pre
AUC variation was analyzed and its correlation with the patients’ outcomes was studied. Three outcome classes, based on variation of AUC and on shifting of CSH curve, were identified: positive response, stable response, and negative response. Figure 3 shows the workflow of the proposed study used to compare PET studies before and after GK treatment.

2.6. Statistical Analysis

Statistical analyses were performed to assess whether ΔAUC provides additional information compared to the other PET parameters (ΔMTV, ΔSUVmax, ΔSUVmean and ΔTLG). For this reason, the Pearson correlation coefficient (r) between ΔAUC and the aforementioned prognostic indices was computed as:
r = C O V ( X , Y ) σ X σ Y
where COV is covariance, σX is the standard deviation of X and σY is the standard deviation of Y. The Pearson correlation coefficient ranged between +1 and −1, where + 1 and −1 show total correlation (no difference between ΔAUC and the aforementioned prognostic indices), 0 is no correlation (total difference between ΔAUC and the aforementioned prognostic indices). Consequently, the determination coefficient (R2) was calculated as:
R 2 =   r 2
In this way, R2 ranges from 0 to 1. R2 = 0 means that the dependent variable cannot be predicted by the independent variable. Finally, the paired t-test was used to determine whether a result is statistically significant. Particularly, the t-test was used to determine whether the correlation coefficient is significantly equal to zero, hence there is no evidence of an association between ΔAUC and the aforementioned indices.

3. Results

A total of 16 patients were involved in this study. All subjects were treated with the Leksell Gamma Knife Model C and they underwent PET/CT Discovery 690 with TOF (GE Medical Systems) before and after the treatment. For basal studies, tumor size ranged from 0.25 to 10.56 cm3 (mean ± standard deviation: 2.83 ± 2.41 cm3) with a SUVmax between 1.6 and 6.84 (mean ± standard deviation: 3.91 ± 1.57). In follow-up studies, tumor size ranged from 0 (complete response) to 12.02 cm3 (mean ± standard deviation: 2.40 ± 2.96 cm3) with a SUVmax between 0 (complete response) and 4.6 (mean ± standard deviation: 2.81 ± 1.17). Changes (Δ) in AUC, SUVmax, SUVmean, MTV and TLG between baseline and follow-up scans and medical reports performed by the three nuclear medicine physicians are shown in Table 1 for each patient.
Starting from an exploratory analysis of PET parameters to understand if ΔAUC could actually provide further information to other PET parameters, Pearson correlation coefficients (r) between ΔAUC and the aforementioned prognostic indices were computed. ΔMTV, ΔSUVmax, ΔSUVmean, and ΔTLG were not highly correlated with ΔAUC (see Figure 4). The determination coefficients (R2) were low, demonstrating a low correlation between considered measures. As a result, it can be affirmed that ΔAUC provides additional information than other PET parameters. The paired t-test showed a p-value greater than 0.05 in all cases, so there is no evidence of an association between ΔAUC and the aforementioned indices. Finally, three outcome classes were identified based on the variation of AUC and on the shifting of the CSH curve: positive response, stable response, and negative response, as shown in Figure 5.

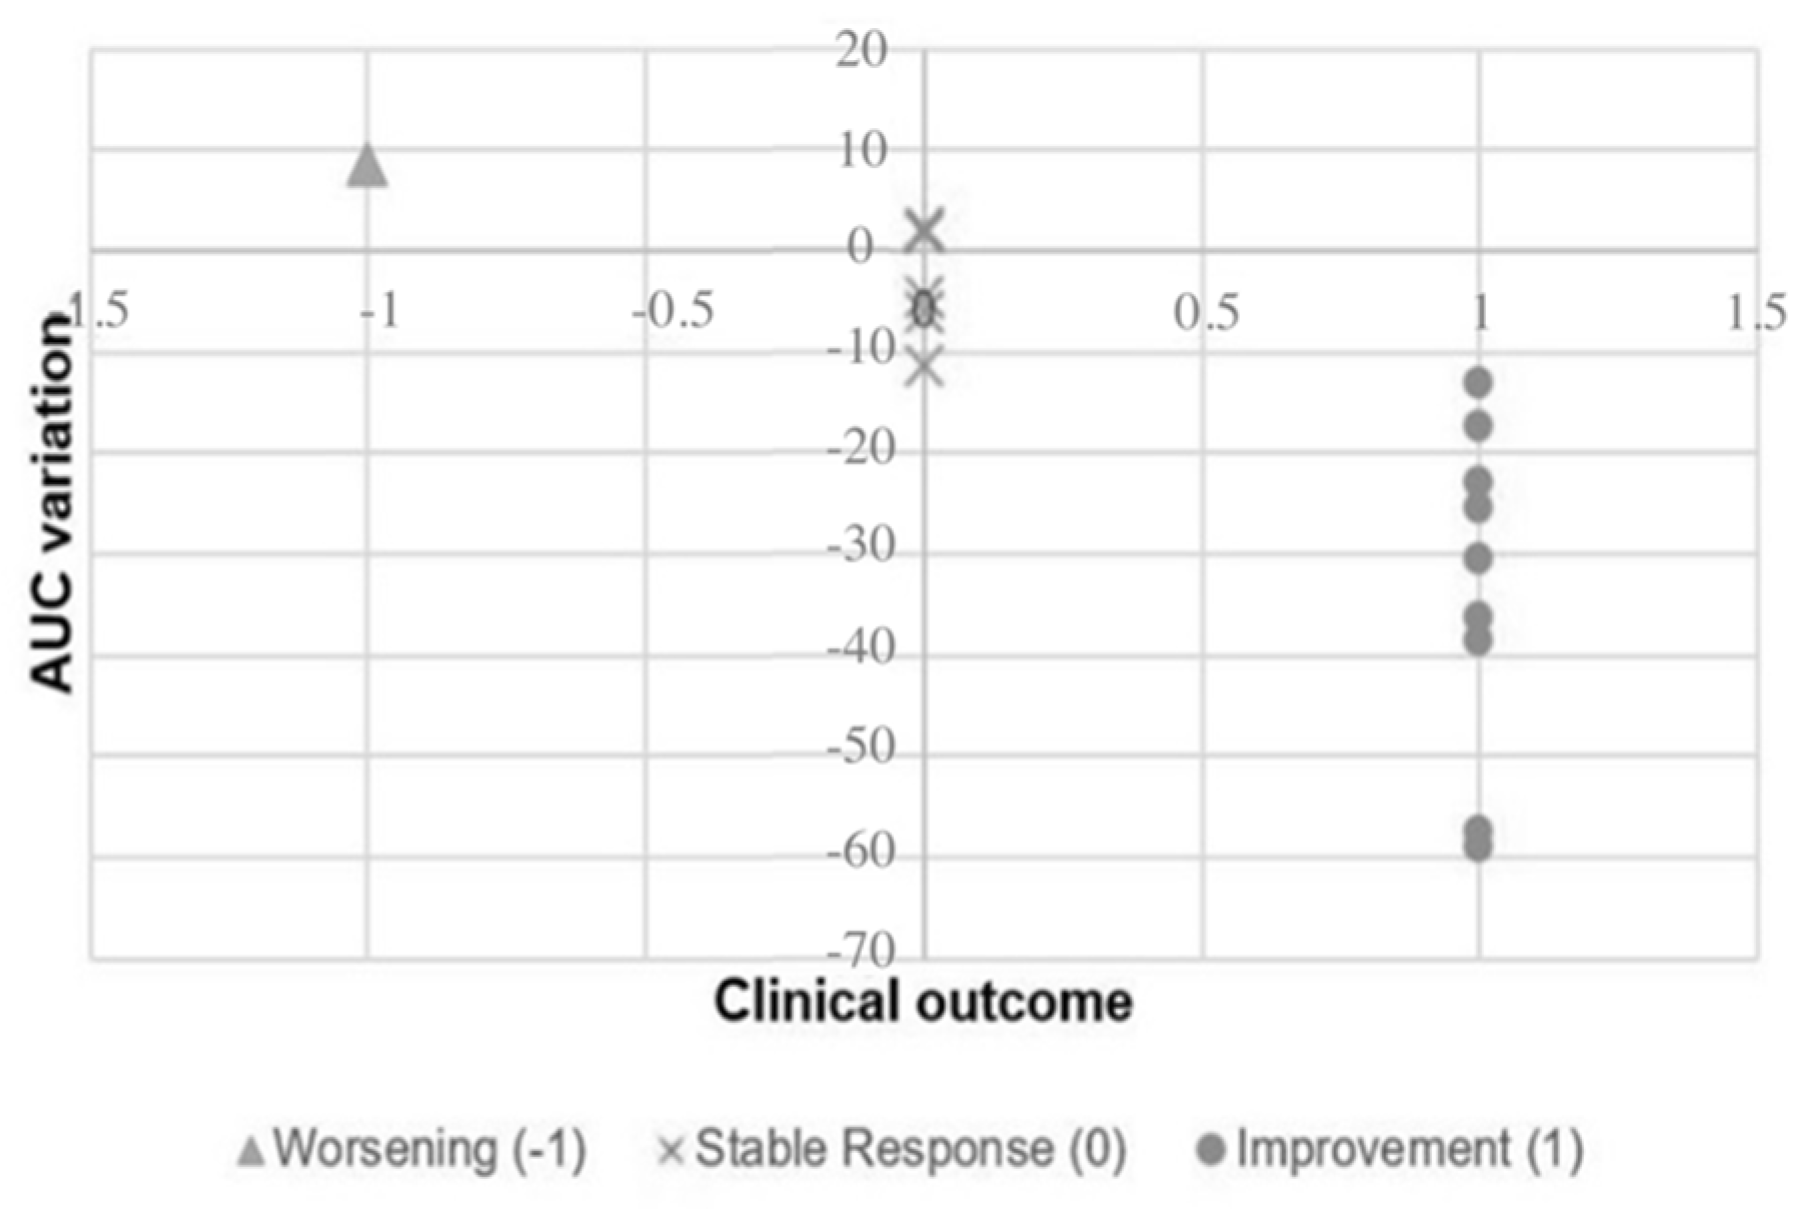
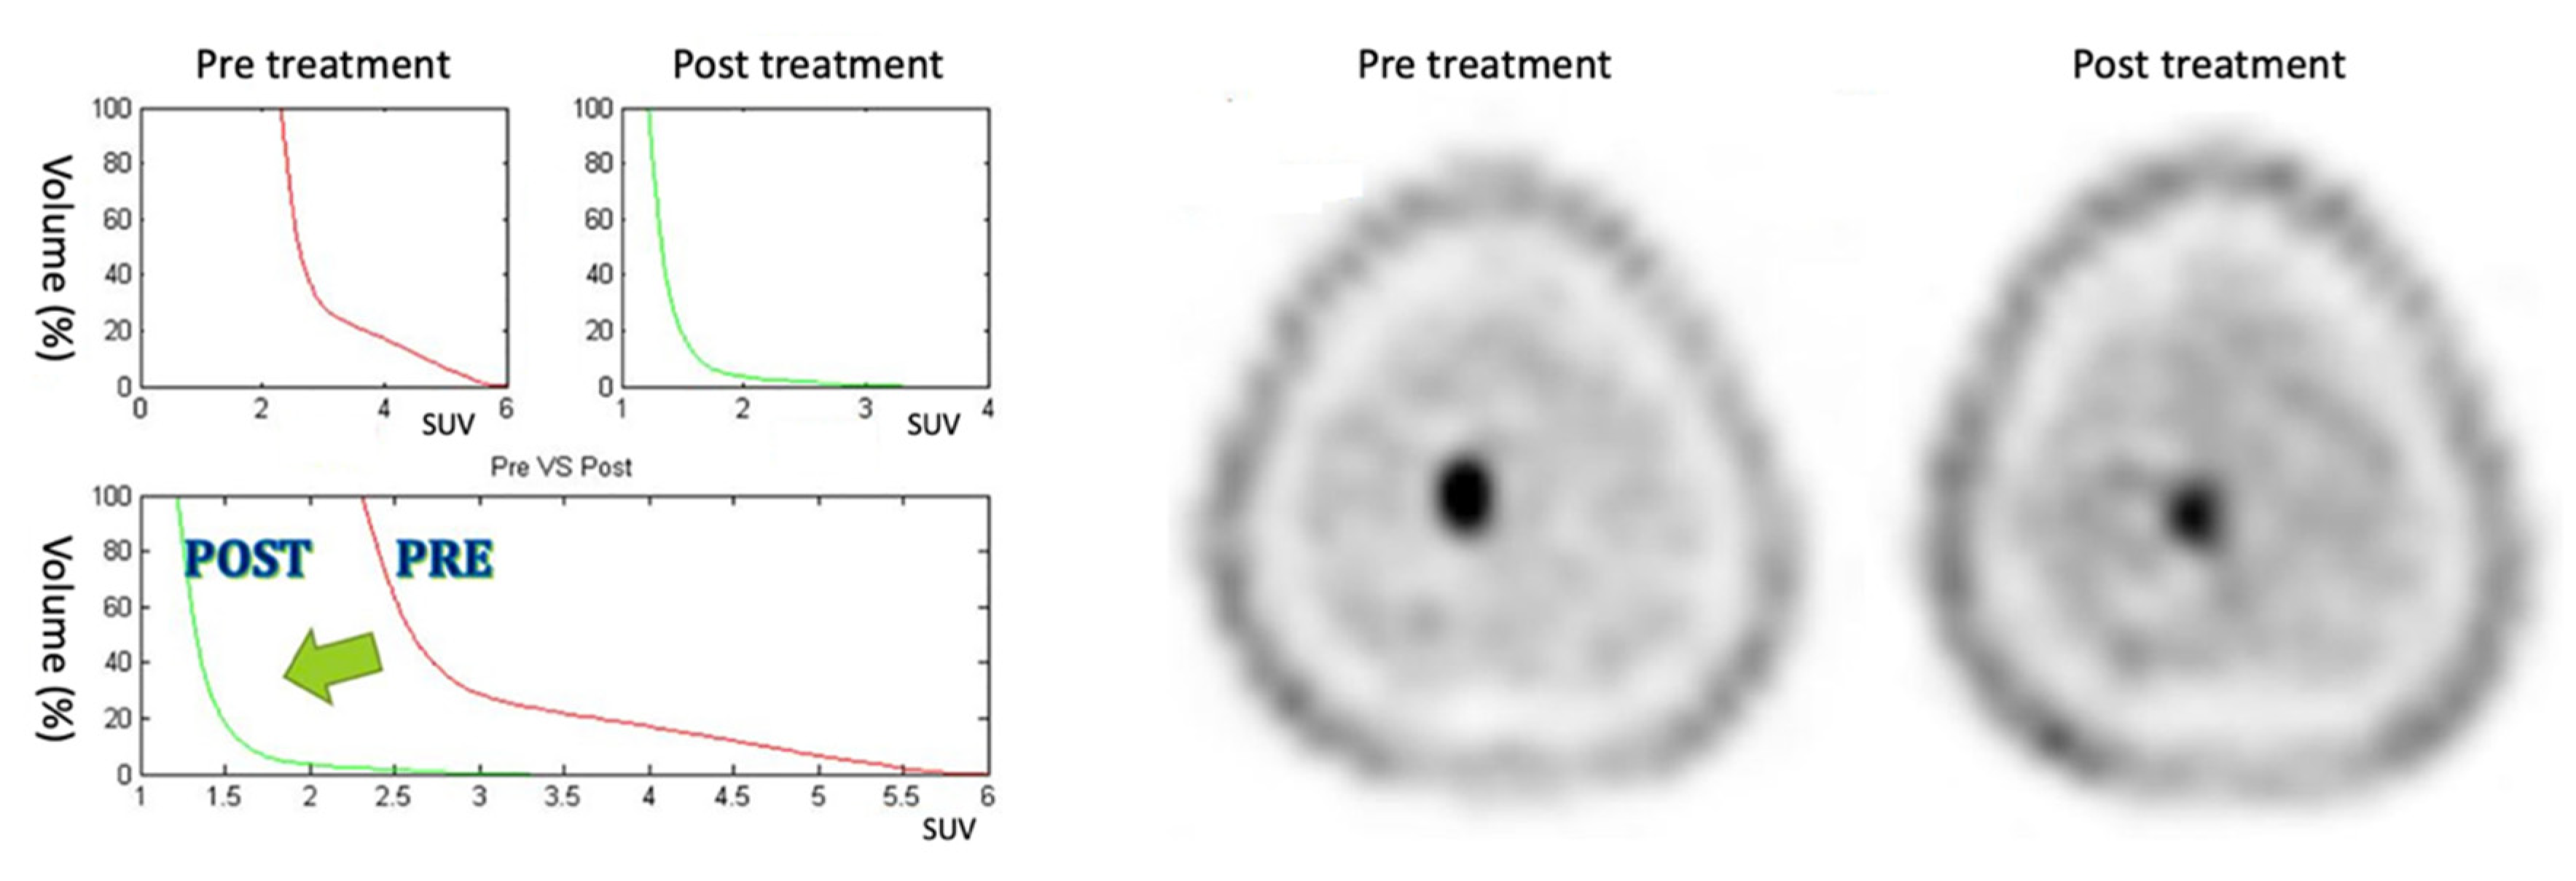
3.1. Positive Response

Nine patients who showed positive responses to treatment show a reduction in the AUC greater than about 10% and a shifting of the CSH to the left, as is possible to see in Figure 6 (patient #3). Patients included in this category show a marked response to the therapy. In particular, all cases show a reduction in the MET uptake (as can be seen in Table 1, where ΔSUVmean is always negative), indicating a probable formation of necrotic areas.

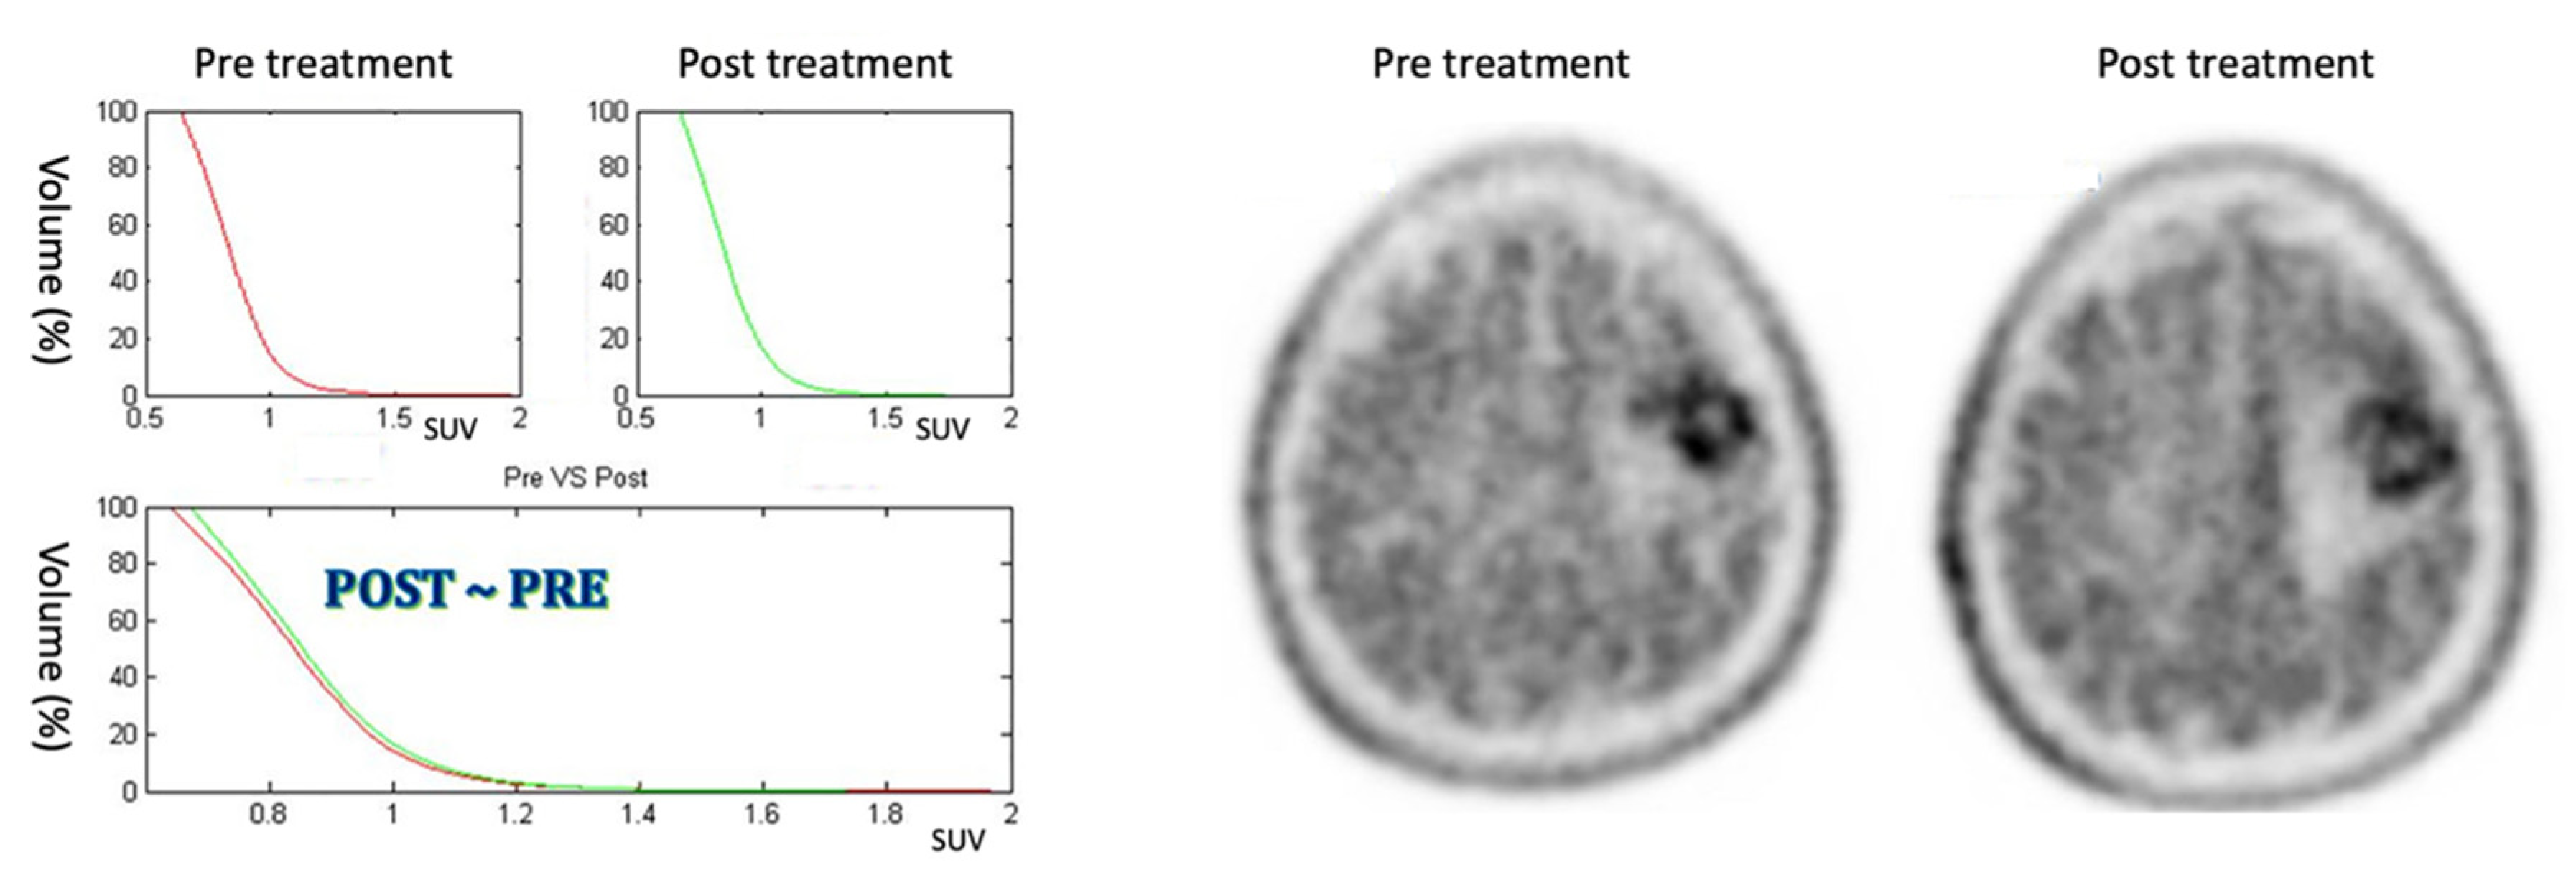
3.2. Stable Response

The five patients included in this class show a AUC reduction of less than 10% and no modification of the CSH between the PET pretreatment and the PET post-treatment, as it is possible to see in Figure 7 (patient #1). Patients included in this category show a moderate response to the therapy.

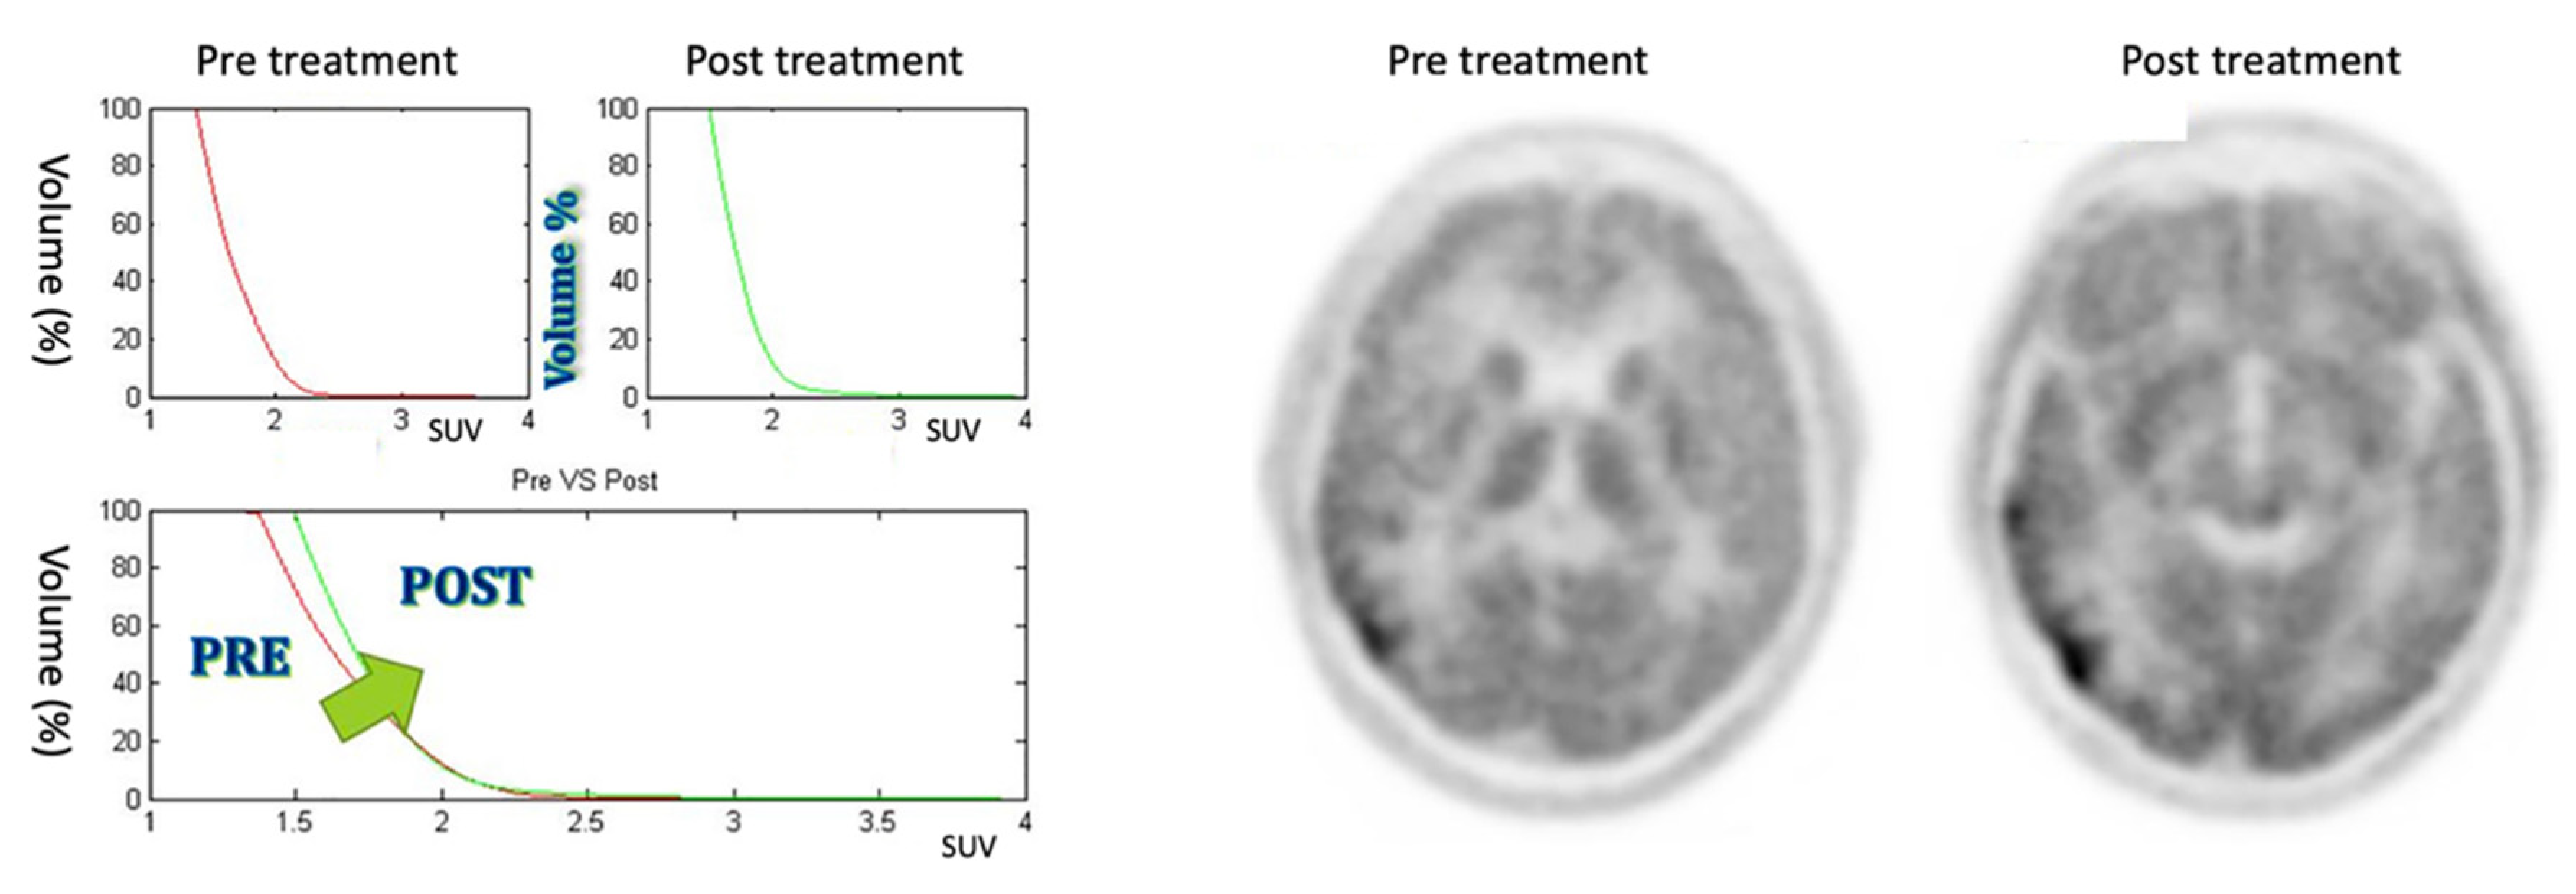
3.3. Negative Response

The patient included in this class shows an increasing AUC and a right shifting of CSH, as it is possible to see in Figure 8 (patient #7). The patient included in this category worsened following therapy.

4. Discussion

The conventional parameters used in the nuclear medicine environment, such as the SUVmax, can be affected by statistical fluctuation errors and cannot provide information on the tumor extension and heterogeneity. The other parameters introduced to resolve these limitations have some limitations related to partial volume effect [32] and to the segmentation method chosen to identify the tumor area [37]. TLG is the first parameter that can provide both anatomical and metabolic information. It is calculated by performing a multiplication of SUVmean with the MTV value. Nevertheless, TLG does not take into account the SUV distribution within the VOI.
New parameters were proposed, such as CSH and AUC, in order to provide information about the absolute uptake, the radiotracer distribution, and the lesion dimension [22,33,38,39]. The histograms are similar to DVH used in radiotherapy [30]. The CSH is a cumulative histogram that shows the percentage of the lesion volume with the same SUV. It takes into account the distribution of SUV within the tumor volume. The AUC consists of the value of the area under the histogram curve and can be a quantitative index of tracer uptake heterogeneity or homogeneity tumor response [22].
The aim of this work was to assess these new prognostic indices in order to perform an early assessment of the treatment response to therapy using MET-PET images. The strength of these new parameters is that they can potentially take into account the SUV distribution within the tumor area voxel by voxel and not only a single one, as is the case when using SUVmax or a single mean value, i.e., the SUVmean, which does not take into account the tumor heterogeneity. No relevant correlation was found between AUC and other parameters usually used in the nuclear medicine environment. Furthermore, the CSH and AUC parameters showed a good agreement with the patient follow-up after GK treatments. Changes in AUC between baseline and follow-up scans could indicate an increase in necrotic tissue tumour after treatment [22]. In our study, the proposed classification (positive, stable, and negative response) found a good agreement with the patient outcome evaluated by three physicians. In particular, nine patients with a positive response to the treatment showed a reduction in AUC—lower AUC values correspond to greater heterogeneity, which can be associated with an increase in the necrotic tissue, as well as the corresponding MET uptake reduction in the follow-up scans.
Conversely, an increase in heterogeneity (positive ΔAUC) can indicate a negative response to therapy. As a result, AUC represents a potential clinical index for an early assessment of the treatment response. In fact, functional changes are faster to identify the therapy response than anatomical imaging (CT or MRI). However, the current clinical methodology in nuclear medicine departments is limited to visual assessment or uptake value measurements, such as SUVmax. Our preliminary results suggest that the proposed parameters could provide better discriminating power for the use of PET imaging in radiotherapy or chemotherapy. These parameters may be incorporated into the planning process to modify patient management. For example, this could be carried out by intensifying chemotherapy treatment after radiotherapy for high-risk patients showing negative responses or providing less toxic regimens for patients at lower risk; in the age of radiomics [40,41], it is mandatory to find the most relevant quantitative features in monitoring or predicting the patient’s response to cancer therapy. Further studies are needed to evaluate the proposed PET parameters in depth and enlarge the number of patients involved, as well as improve statistics to validate the patient outcome classes identified in our work.

5. Conclusions

CSH and AUC could be new functional parameters useful for evaluating treatment response considering the heterogeneity information provided by PET studies. An innovative method to monitor the patient’s treatment response could be developed to alter patient management in the early stages to maximize results of therapy from the perspective of personalized medicine.

Author Contributions

Conceptualization, A.S.; Data curation, A.S., S.C. (Sebastiano Cosentino), F.M., and S.C. (Salvatore Cicero); Formal analysis, A.S. and P.P.; Funding acquisition, A.S. and A.C.; Investigation; A.S.; Methodology, A.S.; Project administration, A.S.; Resources, P.P. and M.G.S.; Software, A.S.; Supervision, G.R. and M.I.; Validation, P.P.; Visualization, A.S., A.C., and M.P.; Writing—original draft, A.S. and P.P.; Writing—review and editing, A.S., A.C., and M.P. All authors have read and agreed to the published version of the manuscript.

Funding

This research received no external funding.

Institutional Review Board Statement

The proposed research has no implication on patient treatment. Review board approval was not sought: the proposed image analysis was performed offline and thus did not change the current treatment protocol.

Informed Consent Statement

Informed consent was obtained from all subjects involved in the study.

Data Availability Statement

Data sharing not applicable.

Acknowledgments

Authors would like to thank Giovanni Borasi and Lucia M. Valastro for their crucial help in the management of the proposed study.

Conflicts of Interest

The authors declare no conflict of interest. The funders had no role in the design of the study; in the collection, analyses, or interpretation of data; in the writing of the manuscript; or in the decision to publish the results.

References

  1. Moskvin, V.; DesRosiers, C.; Papiez, L.; Timmerman, R.; Randall, M.; DesRosiers, P.; Dittmer, P. Monte Carlo simulation of the Leksell Gamma Knife: I. Source modelling and calculations in homogeneous media. Phys. Med. Biol. 2002, 47, 301. [Google Scholar] [CrossRef]
  2. Wu, A. Physics and dosimetry of the gamma knife. Neurosurg. Clin. N. Am. 1992, 3, 35–50. [Google Scholar] [CrossRef]
  3. Khoo, V.S.; Joon, D.L. New developments in MRI for target volume delineation in radiotherapy. Br. J. Radiol. 2006, 79, S2–S15. [Google Scholar] [CrossRef]
  4. Bol, G.H.; Kotte, A.N.T.J.; van der Heide, U.A.; Lagendijk, J.J.W. Simultaneous multi-modality ROI delineation in clinical practice. Comput. Methods Programs Biomed. 2009, 96, 133–140. [Google Scholar] [CrossRef] [PubMed]
  5. Cuocolo, R.; Cipullo, M.B.; Stanzione, A.; Ugga, L.; Romeo, V.; Radice, L.; Brunetti, A.; Imbriaco, M. Machine learning applications in prostate cancer magnetic resonance imaging. Eur. Radiol. Exp. 2019, 3, 35. [Google Scholar] [CrossRef]
  6. Comelli, A.; Terranova, M.C.; Scopelliti, L.; Salerno, S.; Midiri, F.; Lo Re, G.; Petrucci, G.; Vitabile, S. A kernel support vector machine based technique for Crohn’s disease classification in human patients. In Advances in Intelligent Systems and Computing; Springer: Cham, Switzerland, 2018; Volume 611, pp. 262–273. ISBN 9783319615653. [Google Scholar]
  7. Comelli, A.; Stefano, A.; Russo, G.; Bignardi, S.; Sabini, M.G.; Petrucci, G.; Ippolito, M.; Yezzi, A. K-nearest neighbor driving active contours to delineate biological tumor volumes. Eng. Appl. Artif. Intell. 2019, 81, 133–144. [Google Scholar] [CrossRef]
  8. Comelli, A.; Stefano, A. A Fully Automated Segmentation System of Positron Emission Tomography Studies. In Medical Image Understanding and Analysis; Zheng, Y., Williams, B.M., Chen, K., Eds.; Communications in Computer and Information Science; Springer: Cham, Switzerland, 2020; Volume 1065, pp. 353–363. [Google Scholar]
  9. Comelli, A.; Stefano, A.; Bignardi, S.; Coronnello, C.; Russo, G.; Sabini, M.G.; Ippolito, M.; Yezzi, A. Tissue Classification to Support Local Active Delineation of Brain Tumors. In Medical Image Understanding and Analysis; Zheng, Y., Williams, B.M., Chen, K., Eds.; Communications in Computer and Information Science; Springer: Cham, Switzerland, 2020; Volume 1065, pp. 3–14. [Google Scholar]
  10. Gempt, J.; Bette, S.; Buchmann, N.; Ryang, Y.-M.; Förschler, A.; Pyka, T.; Wester, H.-J.; Förster, S.; Meyer, B.; Ringel, F. Volumetric Analysis of F-18-FET-PET Imaging for Brain Metastases. World Neurosurg. 2015, 84, 1790–1797. [Google Scholar] [CrossRef]
  11. Stefano, A.; Vitabile, S.; Russo, G.; Ippolito, M.; Marletta, F.; D’Arrigo, C.; D’Urso, D.; Sabini, M.G.; Gambino, O.; Pirrone, R.; et al. An automatic method for metabolic evaluation of gamma knife treatments. In Image Analysis and Processing—ICIAP 2015; Lecture Notes in Computer Science; Springer: Cham, Switzerland, 2015; Volume 9279, pp. 579–589. [Google Scholar]
  12. Weber, W.A.; Grosu, A.L.; Czernin, J. Technology Insight: Advances in molecular imaging and an appraisal of PET/CT scanning. Nat. Clin. Pract. Oncol. 2008, 5, 160–170. [Google Scholar] [CrossRef] [PubMed]
  13. Fletcher, J.W.; Djulbegovic, B.; Soares, H.P.; Siegel, B.A.; Lowe, V.J.; Lyman, G.H.; Coleman, R.E.; Wahl, R.; Paschold, J.C.; Avril, N.; et al. Recommendations on the use of 18F-FDG PET in oncology. J. Nucl. Med. 2008, 49, 480–508. [Google Scholar] [CrossRef] [PubMed] [Green Version]
  14. Stefano, A.; Porcino, N.; Banna, G.; Russoa, G.; Mocciaro, V.; Anile, G.; Gieri, S.; Cosentino, S.; Murè, G.; Baldari, S.; et al. Metabolic response assessment in non-small cell lung cancer patients after platinum-based therapy: A preliminary analysis. Curr. Med. Imaging Rev. 2015, 11, 218–227. [Google Scholar] [CrossRef]
  15. Banna, G.L.; Anile, G.; Russo, G.; Vigneri, P.; Castaing, M.; Nicolosi, M.; Strano, S.; Gieri, S.; Spina, R.; Patanè, D.; et al. Predictive and Prognostic Value of Early Disease Progression by PET Evaluation in Advanced Non-Small Cell Lung Cancer. Oncology 2017, 92, 39–47. [Google Scholar] [CrossRef] [PubMed]
  16. Cegla, P.; Kazmierska, J.; Gwozdz, S.; Czepczynski, R.; Malicki, J.; Cholewinski, W. Assessment of biological parameters in head and neck cancer based on in vivo distribution of 18F-FDG-FLT-FMISO-PET/CT images. Tumori 2019, 106, 33–38. [Google Scholar] [CrossRef]
  17. Wahl, R.L.; Jacene, H.; Kasamon, Y.; Lodge, M.A. From RECIST to PERCIST: Evolving Considerations for PET response criteria in solid tumors. J. Nucl. Med. 2009, 50 (Suppl. 1), 122S–150S. [Google Scholar] [CrossRef] [Green Version]
  18. Borasi, G.; Russo, G.; Alongi, F.; Nahum, A.; Candiano, G.; Stefano, A.; Gilardi, M.C.; Messa, C. Radiotherapy and High Intensity Focused Ultrasound in Oncology: Competition or integration? A future scenario. J. Ther. Ultrasound 2013, 1, 6. [Google Scholar] [CrossRef] [Green Version]
  19. Levivier, M.; Wikier, D.; Goldman, S.; David, P.; Metens, T.; Massager, N.; Gerosa, M.; Devriendt, D.; Desmedt, F.; Simon, S.; et al. Integration of the metabolic data of positron emission tomography in the dosimetry planning of radiosurgery with the gamma knife: Early experience with brain tumors. Technical note. J. Neurosurg. 2000, 93 (Suppl. 3), 233–238. [Google Scholar] [CrossRef]
  20. Stefano, A.L.; Gallivanone, F.; Messa, C.L.; Gilardi, M.C.L.; Castiglioni, I. Metabolic impact of Partial Volume Correction of [18F]FDG PET-CT oncological studies on the assessment of tumor response to treatment. Q. J. Nucl. Med. Mol. Imaging 2014, 58, 413–423. [Google Scholar] [PubMed]
  21. D`Urso, D.; Stefano, A.; Romano, A.; Russo, G.; Cosentino, S.; Fallanca, F.; Gioe, M.; Attanasio, M.; Sabini, M.G.; Di Raimondo, F.; et al. Analysis of Metabolic Parameters Coming from Basal and Interim PET in Hodgkin Lymphoma. Curr. Med. Imaging Rev. 2017, 14, 533–544. [Google Scholar] [CrossRef]
  22. van Velden, F.H.P.; Cheebsumon, P.; Yaqub, M.; Smit, E.F.; Hoekstra, O.S.; Lammertsma, A.A.; Boellaard, R. Evaluation of a cumulative SUV-volume histogram method for parameterizing heterogeneous intratumoural FDG uptake in non-small cell lung cancer PET studies. Eur. J. Nucl. Med. Mol. Imaging 2011, 38, 1636–1647. [Google Scholar] [CrossRef] [Green Version]
  23. Nariai, T.; Tanaka, Y.; Wakimoto, H.; Aoyagi, M.; Tamaki, M.; Ishiwata, K.; Senda, M.; Ishii, K.; Hirakawa, K.; Ohno, K. Usefulness of L-[methyl-11C] methionine—Positron emission tomography as a biological monitoring tool in the treatment of glioma. J. Neurosurg. 2005, 103, 498–507. [Google Scholar] [CrossRef] [PubMed]
  24. Stefano, A.; Vitabile, S.; Russo, G.; Ippolito, M.; Sardina, D.; Sabini, M.G.; Gallivanone, F.; Castiglioni, I.; Gilardi, M.C. A Graph-Based Method for PET Image Segmentation in Radiotherapy Planning: A Pilot Study. In Image Analysis and Processing—ICIAP 2013; Lecture Notes in Computer Science; Springer: Berlin/Heidelberg, Germany, 2013; pp. 711–720. [Google Scholar]
  25. Stefano, A.; Comelli, A.; Bravatà, V.; Barone, S.; Daskalovski, I.; Savoca, G.; Sabini, M.G.; Ippolito, M.; Russo, G. A preliminary PET radiomics study of brain metastases using a fully automatic segmentation method. BMC Bioinform. 2020, 21, 325. [Google Scholar] [CrossRef] [PubMed]
  26. Miwa, K.; Matsuo, M.; Shinoda, J.; Aki, T.; Yonezawa, S.; Ito, T.; Asano, Y.; Yamada, M.; Yokoyama, K.; Yamada, J.; et al. Clinical Value of [11C]Methionine PET for Stereotactic Radiation Therapy With Intensity Modulated Radiation Therapy to Metastatic Brain Tumors. Int. J. Radiat. Oncol. 2012, 84, 1139–1144. [Google Scholar] [CrossRef] [PubMed]
  27. Grosu, A.L.; Weber, W.a.; Riedel, E.; Jeremic, B.; Nieder, C.; Franz, M.; Gumprecht, H.; Jaeger, R.; Schwaiger, M.; Molls, M. L-(methyl-11C) methionine positron emission tomography for target delineation in resected high-grade gliomas before radiotherapy. Int. J. Radiat. Oncol. Biol. Phys. 2005, 63, 64–74. [Google Scholar] [CrossRef] [PubMed]
  28. Grosu, A.L.; Weber, W.A.; Franz, M.; Stärk, S.; Piert, M.; Thamm, R.; Gumprecht, H.; Schwaiger, M.; Molls, M.; Nieder, C. Reirradiation of recurrent high-grade gliomas using amino acid PET (SPECT)/CT/MRI image fusion to determine gross tumor volume for stereotactic fractionated radiotherapy. Int. J. Radiat. Oncol. 2005, 63, 511–519. [Google Scholar] [CrossRef]
  29. Tu, Z.; Mach, R.H. C-11 Radiochemistry in Cancer Imaging Applications. Curr. Top. Med. Chem. 2010, 10, 1060–1095. [Google Scholar] [CrossRef] [PubMed]
  30. Drzymala, R.E.; Mohan, R.; Brewster, L.; Chu, J.; Goitein, M.; Harms, W.; Urie, M. Dose-volume histograms. Int. J. Radiat. Oncol. 1991, 21, 71–78. [Google Scholar] [CrossRef]
  31. Stefano, A.; Vitabile, S.; Russo, G.; Ippolito, M.; Marletta, F.; D’Arrigo, C.; D’Urso, D.; Gambino, O.; Pirrone, R.; Ardizzone, E.; et al. A fully automatic method for biological target volume segmentation of brain metastases. Int. J. Imaging Syst. Technol. 2016, 26, 29–37. [Google Scholar] [CrossRef]
  32. Soret, M.; Bacharach, S.L.; Buvat, I.I. Partial-volume effect in PET tumor imaging. J. Nucl. Med. 2007, 48, 932–945. [Google Scholar] [CrossRef] [PubMed] [Green Version]
  33. El Naqa, I.; Grigsby, P.; Apte, A.; Kidd, E.; Donnelly, E.; Khullar, D.; Chaudhari, S.; Yang, D.; Schmitt, M.; Laforest, R.; et al. Exploring feature-based approaches in PET images for predicting cancer treatment outcomes. Pattern Recognit. 2009, 42, 1162–1171. [Google Scholar] [CrossRef] [PubMed] [Green Version]
  34. Stefano, A.; Vitabile, S.; Russo, G.; D’Urso, D.; Ippolito, M.; Marletta, F.; Sabini, M.G.; Patti, I.V.; Pittera, S.; Sardina, D.; et al. Biological target volume segmentation for radiotherapy treatment planning. Phys. Medica 2016, 32, 64. [Google Scholar] [CrossRef]
  35. Comelli, A.; Bignardi, S.; Stefano, A.; Russo, G.; Sabini, M.G.; Ippolito, M.; Yezzi, A. Development of a new fully three-dimensional methodology for tumours delineation in functional images. Comput. Biol. Med. 2020, 120, 103701. [Google Scholar] [CrossRef] [PubMed]
  36. Comelli, A.; Stefano, A.; Russo, G.; Sabini, M.G.; Ippolito, M.; Bignardi, S.; Petrucci, G.; Yezzi, A. A smart and operator independent system to delineate tumours in Positron Emission Tomography scans. Comput. Biol. Med. 2018, 102, 1–15. [Google Scholar] [CrossRef] [PubMed]
  37. Comelli, A.; Stefano, A.; Benfante, V.; Russo, G. Normal and Abnormal Tissue Classification in Positron Emission Tomography Oncological Studies. Pattern Recognit. Image Anal. 2018, 28, 106–113. [Google Scholar] [CrossRef]
  38. Kang, S.R.; Song, H.C.; Byun, B.H.; Oh, J.R.; Kim, H.S.; Hong, S.P.; Kwon, S.Y.; Chong, A.; Kim, J.; Cho, S.G.; et al. Intratumoral Metabolic Heterogeneity for Prediction of Disease Progression After Concurrent Chemoradiotherapy in Patients with Inoperable Stage III Non-Small-Cell Lung Cancer. Nucl. Med. Mol. Imaging (2010) 2014, 48, 16–25. [Google Scholar] [CrossRef] [PubMed] [Green Version]
  39. Takeshita, T.; Morita, K.; Tsutsui, Y.; Kidera, D.; Mikasa, S.; Maebatake, A.; Akamatsu, G.; Miwa, K.; Baba, S.; Sasaki, M. The influence of respiratory motion on the cumulative SUV-volume histogram and fractal analyses of intratumoral heterogeneity in PET/CT imaging. Ann. Nucl. Med. 2016, 30, 393–399. [Google Scholar] [CrossRef] [PubMed]
  40. Stefano, A.; Gioè, M.; Russo, G.; Palmucci, S.; Torrisi, S.E.; Bignardi, S.; Basile, A.; Comelli, A.; Benfante, V.; Sambataro, G.; et al. Performance of Radiomics Features in the Quantification of Idiopathic Pulmonary Fibrosis from HRCT. Diagnostics 2020, 10, 306. [Google Scholar] [CrossRef] [PubMed]
  41. Comelli, A.; Stefano, A.; Coronnello, C.; Russo, G.; Vernuccio, F.; Cannella, R.; Salvaggio, G.; Lagalla, R.; Barone, S. Radiomics: A New Biomedical Workflow to Create a Predictive Model. In Medical Image Understanding and Analysis; Communications in Computer and Information Science; Springer: Cham, Switzerland, 2020; pp. 280–293. [Google Scholar]
Figure 1. An example of Cumulative standardized uptake value (SUV) Histogram (CSH) and Area Under the Curve (AUC). CSH shows the percentage of the tumor volume with a certain SUV. For example, the 60% of the tumor has a SUV > 1.
Applsci 11 02999 g001
Figure 2. Flow diagram of the proposed semiautomatic approach to calculate CSH and AUC parameters. Adopted graphical and color notations are explained in the legend box.
Applsci 11 02999 g002
Figure 3. The workflow of the proposed study.
Applsci 11 02999 g003
Figure 4. Correlation between ΔAUC and Δmetabolic tumor volume (ΔMTV), ΔSUVmax, ΔSUVmean, and Δtotal lesion glycolysis (ΔTLG).
Applsci 11 02999 g004
Figure 5. AUC variation correlated to patients’ outcomes.
Applsci 11 02999 g005
Figure 6. On the left: CSH pretreatment (top left); CSH post-treatment (top right); comparison between pre- and post-treatment (bottom) in positive response case: ΔAUC = −59.05%. On the right: PET images of pre- and post-treatment. (For interpretation of the references in colour in this figure legend, the reader is referred to the web version of this article.)
Applsci 11 02999 g006
Figure 7. On the left: CSH pretreatment (top left); CSH post-treatment (top right); comparison between pre- and post-treatment (bottom) in stable response case: ΔAUC = 2.33%. On the right: PET images of pre- and post-treatment. (For interpretation of the references in this figure legend in colour, the reader is referred to the web version of this article.)
Applsci 11 02999 g007
Figure 8. On the left: CSH pretreatment (top left); CSH post-treatment (top right); comparison between pre- and post-treatment (bottom) in negative response case: ΔAUC = 8.62%. On the right: PET images of pre- and post-treatment. (For interpretation of the references to colour in this figure legend, the reader is referred to the web version of this article.)
Applsci 11 02999 g008
Table 1. Positron emission tomography (PET) parameter variations (%) between pre- and post-Gamma Knife (GK) treatment.
Patient N.ΔAUCΔMTVΔSUVmaxΔSUVmeanΔTLGPhysician Report
#12.3313.87−12.63−12.180.05Stable
#2−38.6218.80−32.72−25.73−11.77Improvement
#3−59.050.12−47.66−33.56−33.48Improvement
#4−17.43−62.72−20.23−5.91−64.93Improvement
#5−57.59−81.16−41.83−14.34−83.86Improvement
#6−36.4224.85−44.36−40.85−26.15Improvement
#78.62−16.909.4710.10−8.50Worsening
#816−100−100−100−100Complete Response
#9−11.227.73−2.29−5.561.73Stable
#10−4.61−13.27−11.283.08−10.60Stable
#11−30.37−31.53−26.21−17.96−43.83Improvement
#12−13.0714.14−22.74−17.40−5.72Improvement
#13−23.03−94.29−34.64−10.65−94.90Improvement
#14−25.48−62.20−30.11−11.82−66.67Improvement
#151.88−61.12−1.004.34−59.43Stable
#16−6.11−5.06−33.55−13.41−17.80Stable
Publisher’s Note: MDPI stays neutral with regard to jurisdictional claims in published maps and institutional affiliations.

