Article

Numerical Investigation on the Evolution of Thin Liquid Layer and Dynamic Behavior of an Electro-Thermal Drilling Probe during Close-Contact Heat Transfer

1
School of Mechanical Engineering, Chung-Ang University, Seoul 06974, Korea
2
Offshore Industries R & BD Center, Korea Research Institute of Ships and Ocean Engineering, Geoje 53201, Korea
3
Ocean System Engineering Research Division, Korea Research Institute of Ships and Ocean Engineering, Daejeon 34103, Korea
4
Department of Intelligent Energy and Industry, Chung-Ang University, Seoul 06974, Korea
*
Author to whom correspondence should be addressed.
Submission received: 20 February 2021 / Revised: 8 April 2021 / Accepted: 9 April 2021 / Published: 12 April 2021
(This article belongs to the Section Mechanical Engineering)

Abstract

:
This study investigates the transient behavior of an electro-thermal drilling probe (ETDP) during a close-contact melting process within a glacier. In particular, the present work analyzes the effect of the tip temperature on the formation of molten thin liquid films and the subsequent rate of penetration (ROP) through numerical simulation. We used the commercial code of ANSYS Fluent (v.17.2) to solve the Reynolds-averaged Navier–Stokes equation, together with an energy equation considering the solidification and melting model. The ROP of the drilling probe is determined based on the energy balance between the heating power and melting rate of ice. As the results, the ETDP penetrates the ice through a close-contact melting process. The molten liquid layer with less than 1 mm of thickness forms near the heated probe tip. In addition, the ROP increases with the heated temperature of the probe tip.

1. Introduction

Glaciers and ice in polar regions have essential information about the past as well as recent geological history and climate change [1]. An unexplored subglacial lake, which is a lake formed under a glacier, attracts researchers from various fields, such as biology, astrobiology, and biochemistry [1,2,3]. After discovering unknown life and information in the Vostok glacier in Antarctica, a great deal of research has been conducted to reach the glacier and obtain microbial samples. Therefore, it is essential to develop polar exploration technology (i.e., drilling technology), facilitating quick penetration toward subglacial lakes without contamination in an ecosystem of the polar regions.
There are various conventional drilling techniques, such as wire-line drilling, hot-water drilling, and coiled-tube drilling that can penetrate the ice and reach a subglacial lake [4]. However, it is reported that such a conventional drilling method can cause contamination in both the polar regions and in retrieved samples [5,6]. An electro-thermal drilling probe (ETDP) is a promising way to facilitate the exploration of the subglacial lake without contamination and has been widely used to penetrate the glacier [7,8,9]. A heated probe tip is attached in the head of the ETDP, as shown in Figure 1. The ice which is in contact with the heated probe tip starts to melt and forms a thin liquid film [10,11,12]. Subsequently, the ETDP pushes the thin liquid film due to its weight and can slowly move downward through the close-contact melting process.
The rate of penetration (ROP), which indicates the speed at which the heated probe tip deepens the borehole, has been one of the key parameters in designing the shape and operating conditions of an ETDP [12,13,14,15]. Many researchers have analyzed the effect of factors, such as operating conditions and melting-tip shape, on the ROP. Shreve et al. [12] found that the ROP increased with heating power and the cross-sectional area of heated probe tip owing to a faster phase change with the increase in heating power. Talalay et al. [13] showed that a copper heated probe tip could penetrate ice faster because of its higher thermal conductivity. In addition, they conducted a parametric study to investigate the effect of the heated probe tip shape on the ROP. From the results, the heated probe tip with a 60° cone shape shows the highest ROP. They also found that the ROP increased with the weight of ETDP because heavier a ETDP can squeeze the molten liquid layer more strongly and move faster. Treffer et al. [15] provided several lab-scale experimental results showing that an ETDP with a spherical shape penetrates an ice-chamber faster with a higher heating power. The simple model was suggested to predict ROP based on the required heating power for melting ice. They over-estimated the ROP by about 30% compared to the experimental results. Suto et al. [14] studied the effects of the shape and material of the drill head and heater temperature on the rate of penetration via lab-scale experiments. They also estimated the total required thermal energy considering the thermal loss with various conditions through a one-dimension heat conduction problem. From the experimental results, a conical shape showed a higher ROP than a flat shape due to the large contact area with ice.
The studies mentioned above broadly analyzed the effects of design factors (shape and operating conditions) of ETDPs on the ROP. Unfortunately, there is a lack of information to understand the underlying physics of the drilling process considering the close-contact melting characteristics of ETDP. The heated probe tip melts the ice and forms a thin liquid layer [12]. The ETDP pushes the molten liquid layer and can move in a downward direction. The thin liquid layer plays a role in thermal resistance and influences heat transfer characteristics during the melting process. However, such close-contact melting characteristics of ETDP are not easily directly measured. Indeed, computational fluid dynamics (CFD) is a promising way to investigate various multi-physics problems in unsteady and quasi-steady states [16,17,18,19] and to obtain useful information which would not be easily measured directly. Therefore, the present study proposes a numerical approach to mimic the drilling process considering the close-contact melting phenomenon. This work aims to analyze the effects of the heated probe tip temperature on the formation of molten liquid layers and the subsequent ROP inside an ice region. In particular, we characterize the transient behavior of molten thin liquid layers near the heated electro-thermal drilling probe (ETDP), which is difficult to measure directly.

2. CFD Simulations

2.1. Governing Equations

The present study analyzes the transient behavior of thin liquid film formation near a heated probe tip. We used the commercial code of ANSYS Fluent (v.17.2) to solve the conservation equations of mass and momentum as follows:
ρ t + ( ρ v ) x = 0
t ( ρ v ) + · ( ρ v v ) = p + · ( τ ˜ ) + ρ g
where ρ is the density, v is the velocity vector, p is the pressure, τ denotes the stress tensor, and g is the gravitational acceleration. The enthalpy-based energy equation considering the solidification and melting model is as follows [20,21,22,23]:
t ( ρ H ) + · ( ρ v H ) = · ( k H )
where H indicates the enthalpy and k is the thermal conductivity. The enthalpy, H, is defined as the sum of the sensible enthalpy, h, and the latent enthalpy, ∆H, as follows:
H = h + Δ H
h = h r e f + T r e f T c p d T
Δ H = β L
where href is reference enthalpy, Tref is reference temperature, cp is the specific heat, and L is the latent heat. The liquid fraction, β, is estimated by:
β = 0 T < T S 1 T > T L ( T T S ) / ( T L T S ) T S < T < T L
where TS denotes solidus temperature at which the solidification begins, and TL represents liquidus temperature at which the melting begins. However, Equation (7) can be used for the case where the values of TS and TL are different (e.g., alloys and multiple substances). In the case of a pure substance (e.g., water/ice), TS is equal to TL. Therefore, β should be expressed based on the enthalpy as follows:
β = 0 H < H S 1 H > H L ( H H S ) / ( H L H S ) H S < H < H L
where HS indicates enthalpy of the solid at which the phase change begins, and HL represents enthalpy of the liquid. The liquid fraction, β, is zero at the solid phase where the temperature is below 273 K. When the temperature of the solid phase increases to 273 K, the enthalpy of the material, H, starts to increase from HS to HL. The liquid fraction, β, changes with corresponding enthalpy, H.

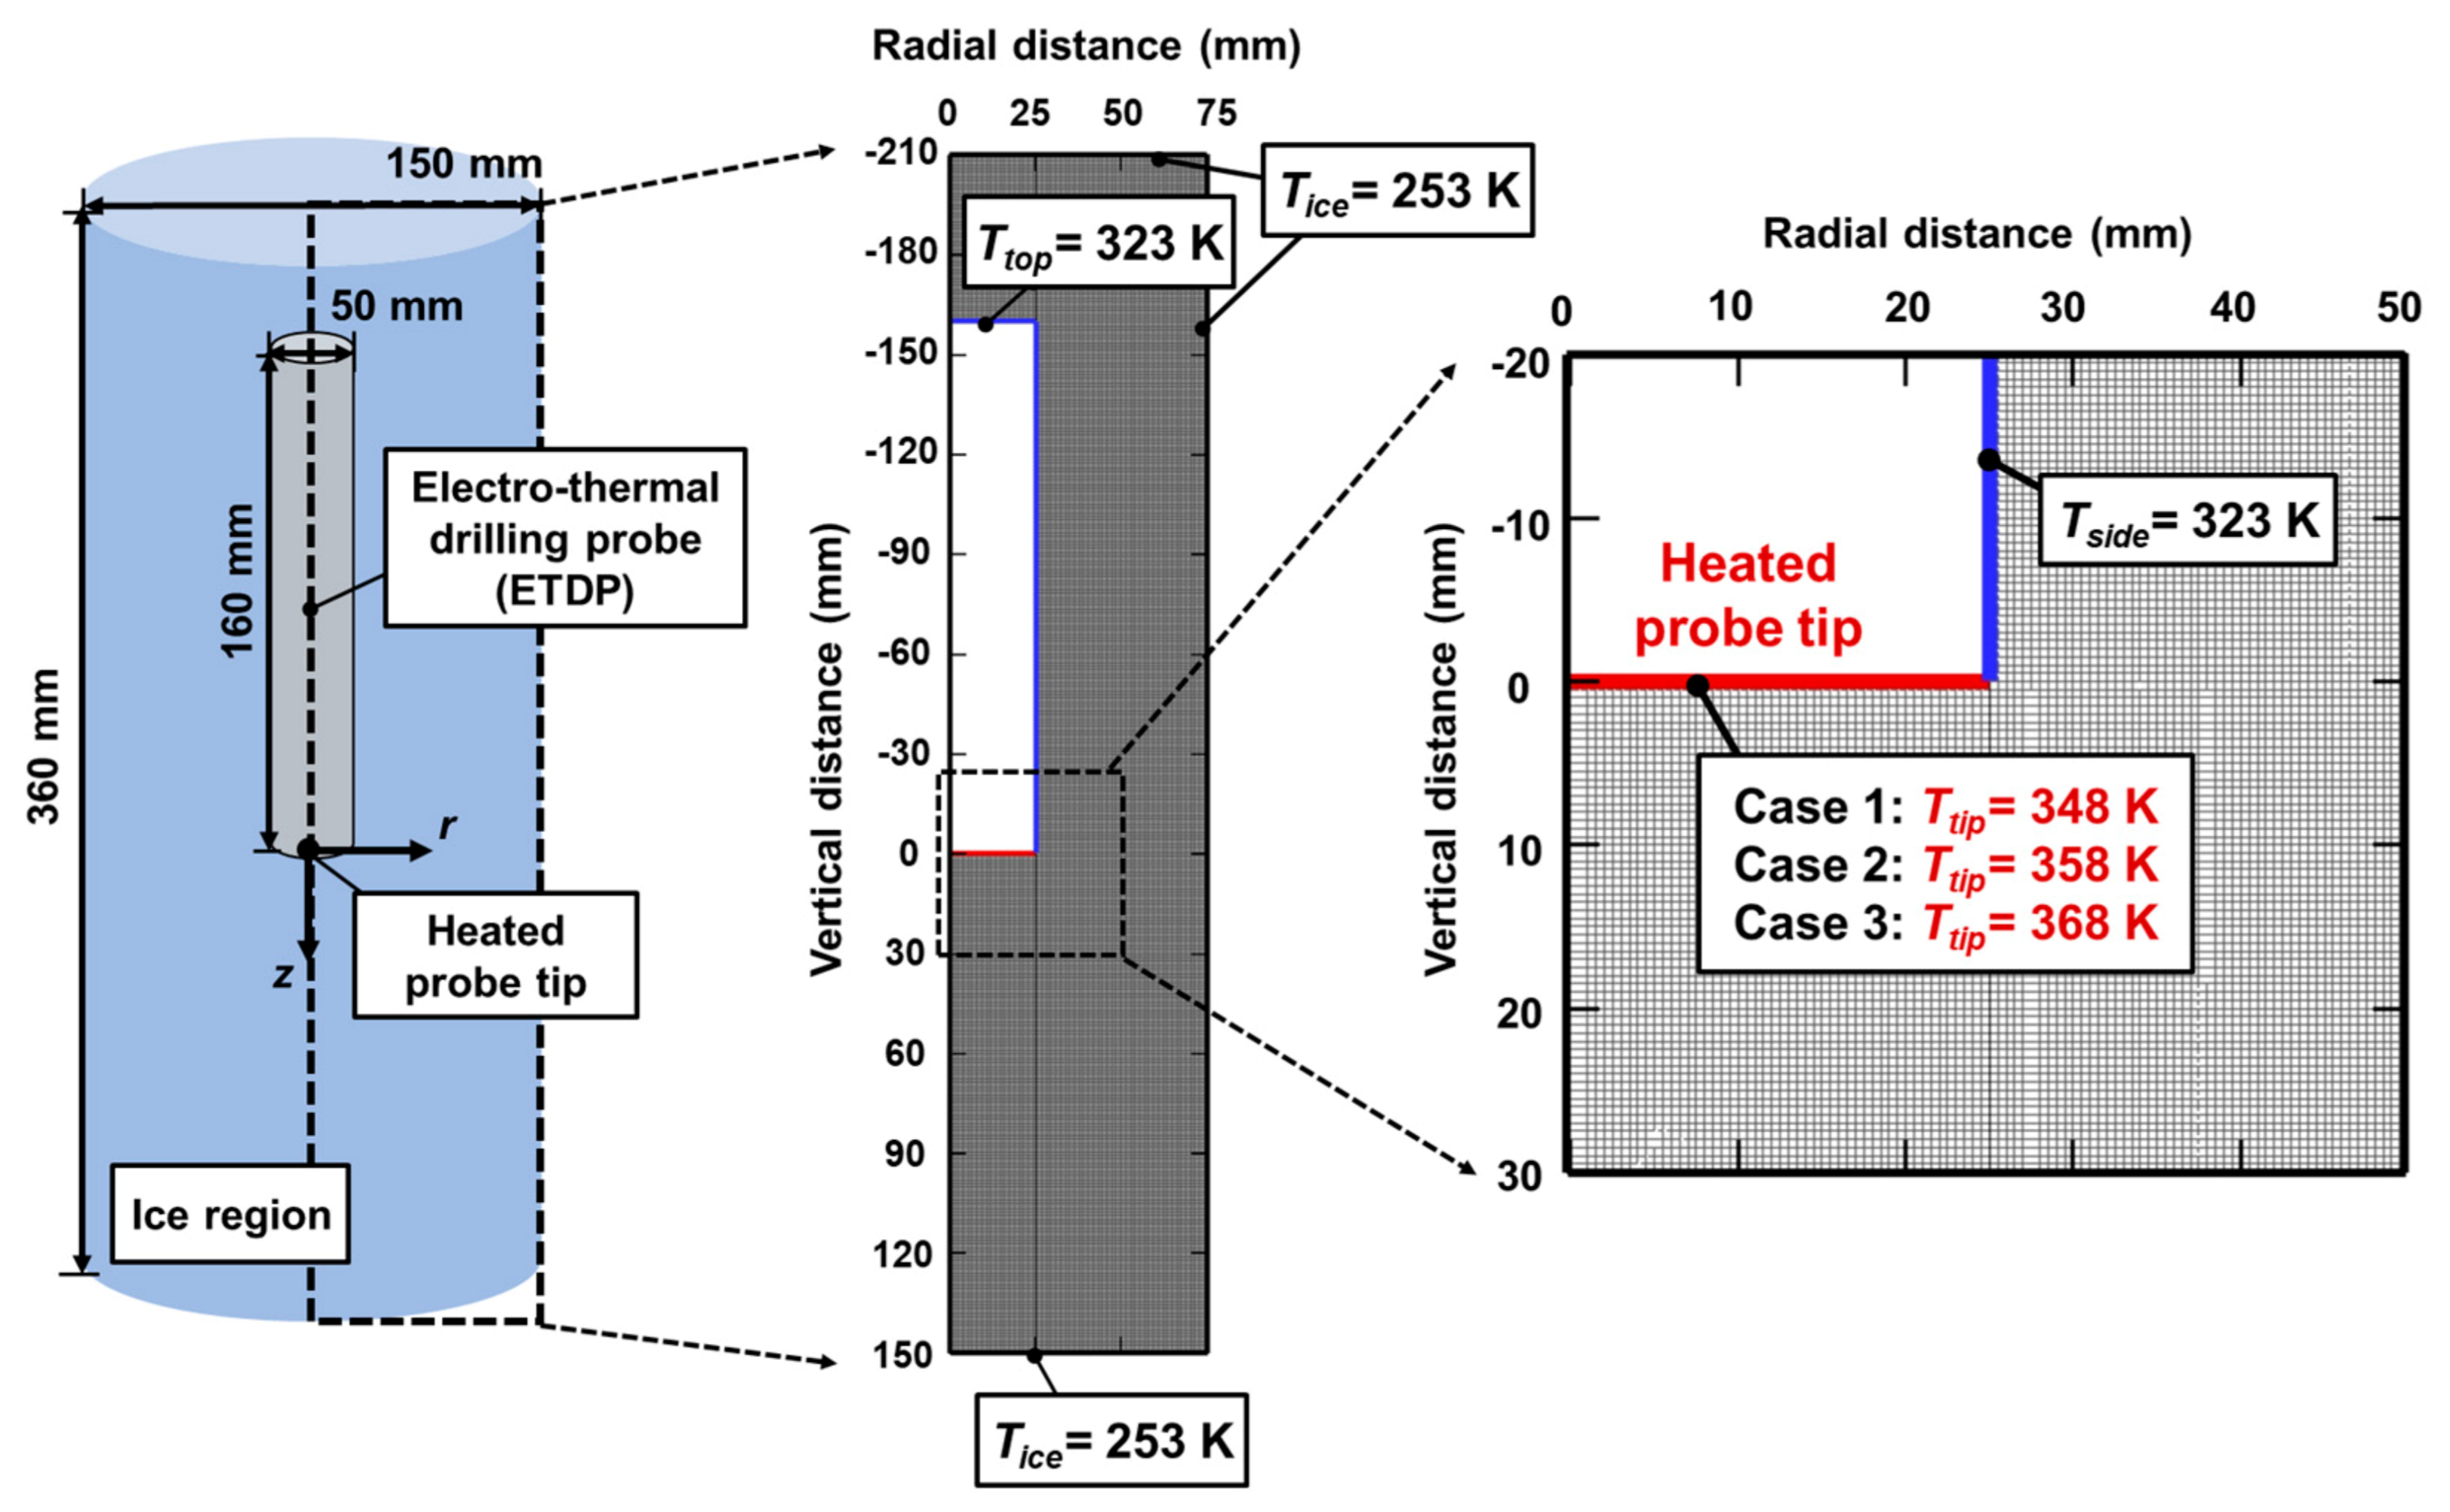
2.2. Numerical Details

Figure 2 shows that the 2D axisymmetric computational domain has a length of 360 mm and width of 75 mm. We determined the geometry of the cylindrical ETDP with a flat shaped heated probe tip by referring to a previous experimental study [14]. The ETDP with a height of 160 mm and radius of 25 mm was placed within the ice region, as shown in Figure 2. The temperature of the ice boundary, Tice, was set as 253 K. The top and side temperatures of ETDP, Ttop and Tside, were determined as 323 K. The present study changed the heated probe tip temperature, Ttip, from 348 to 368 K to analyze the influence of the heated probe tip temperature on thin film formation near the ETDP and the corresponding ROP. A grid size of 0.5 mm was selected by the grid convergence tests, and the total grid number was 92,150. The present work used the pressure-implicit with splitting of operators (PISO) algorithm, which is widely used for solving solidification and melting problems to couple the pressure with the velocity [24,25,26]. The time-step was adaptively selected in the range from 10−5 to 10−3 s to reduce the computational time. Convergence criteria of the solution were set as the residual value of 10−3 for continuity, 10−4 for momentum, and 10−8 for energy.

2.3. Dynamic Motion of ETDP

The present study provides a numerical approach to mimic penetration movement of ETDP with the use of the dynamic meshing method. The ROP of ETDP is determined based on the simple energy balance between the heating power and latent heat of melting ice, as follows:
P = π R 2 d δ d t ρ i c e L
where P represents heating power transmitted from the heated probe tip of ETDP to the ice, R is the radius of the heated probe tip, δ is the thickness of the molten liquid layer, ρice is the density of ice, and L is latent heat. By assuming that the melting rate of ice, dδ/dt, is equal to the velocity of the ETDP, v, Equation (9) can be expressed as follows:
d δ d t ~ v = P π R 2 ρ i c e L
Finally, we calculate the ROP by using the user defined function (UDF) based on Equation (10).

2.4. Validation of the Numerical Method

Unfortunately, there is a lack of information on experiments to evaluate the proposed numerical method. As an alternative, additional CFD simulations were carried out to assess the numerical method established in the present study by comparing with previous report results [13]. Talalay et al. [13] reported the ROP of a heated cylindrical ETDP with flat shape heated probe tip with different heating power. We carried out additional CFD simulations by mimicking the ETDP geometry used in Talalay’s experiments. The present study compares the predicted ROP using the proposed numerical method with the experimental results [13]. From the comparison, the order of predicted ROP has a similar value with the experimental results, as summarized in Table 1. The present model overestimates the ROP with an 18% maximum discrepancy at the heating power of 480 W. Considering the experimental uncertainty, the current prediction of the ROP would be acceptable, but further work should be done to get a more accurate solution.

3. Result and Discussion

Firstly, we assumed the initial condition under which a molten liquid layer of 1 mm thickness is formed at t = 0 s around the ETDP by referring to previous literature [11]. Figure 3a–c shows the temperature for the case of Ttip = 368 K over time. The heat is diffused from the heated probe tip toward the ice region. The highest temperature can be found near the ETDP. The enlarged temperature and enthalpy fields are highlighted by a green box and are illustrated in Figure 3d,e, respectively.
Interestingly, the ice that contacted with the heated probe tip remained at 273.15 K since it is the mushy zone (highlighted by a blue dotted box) where the phase change occurs. Although the mushy zone has a constant temperature of 273.15 K, as shown in Figure 3d, it is worth noting that enthalpy within the mushy zone presents a gradient toward the vertical direction, as shown in Figure 3e. This means that when the temperature of ice reaches 273.15 K (melting temperature), enthalpy begins to increase with a fixed temperature (T = 273.15 K) and the corresponding liquid fraction from Equation (8) also increases during the melting process.
Figure 4a–c shows the liquid fraction fields for the case of a heated probe tip temperature, Ttip, of 368 K over time. As mentioned above, the ice region, where the temperature reaches 273.15 K, becomes a mushy zone where the liquid fraction is between 0 and 1. The liquid fraction inside the green dotted box in Figure 4d. Not surprisingly, it shows very similar distribution with the enthalpy distribution shown in Figure 3e. The thin liquid layer is formed near the heated probe tip. This implies that ETDP can move in a downward direction by pushing and squeezing the liquid layer, as shown in Figure 4e.
The ETDP slowly moves downward. The vertical positions of the heated probe tip, z, are 0, 14.7 and 29.8 mm at t = 0, 30 and 60 s, respectively. We can calculate the ROP of ETDP from the expression of ROP = dz/dt. As a result, the ROP of ETDP, dz/dt, has a roughly constant value of 0.49 mm/s for the case of Ttip = 368 K.
Figure 5 represents the penetration depth of ETDP, Δz, for the different temperatures of the heated probe tip. The present study determines the penetration depth of ETDP, Δz(t), from the following expression, z(t)–z(0), as shown in the subset image of Figure 5. The evolution of the penetration depth of ETDP shows a linear tendency with time for all cases of Ttip. The ROP are 0.38, 0.43 and 0.49 mm/s for the different Ttip of 348, 358 and 368 K, respectively. According to Equation (10), the ROP of ETDP, v, is proportional with the heating power, P, where P is the 0 R q r π r 2 d r and q′(r) indicates the local heat flux at the heated probe tip. Therefore, the fact that ROP has a constant value over time can be interpreted as that the heating power of ETDP also maintains a constant value during the drilling process. The ROP, v, increases with the temperature of the heated probe tip, Ttip, due to the increase of heating power, P.
Figure 6a–c shows the evolution of heating power, P(t), over time for the different Ttip. The evolution of heating power, P(t), shows the fluctuation behavior, but its time-averaged values converge to (Pavg = 229.4 W, σ = 23.1 for Ttip = 348 K), (Pavg = 264.2 W, σ = 25.7 for Ttip = 358 K), and (Pavg = 298.6 W, σ = 28.4 for Ttip = 368 K) where σ is the standard deviation. The fluctuation behavior is from the results, the time-averaged heating power, Pavg, increases with the temperature of the heated probe tip. This is because the temperature difference between the mushy zone (273.15 K) and heated probe tip, ΔT = Ttip −273.15 K, becomes higher with the increment of Ttip. The temperature differences are 75, 85 and 95 K.
Therefore, the ROP increases with the temperature of the heated probe tip, Ttip, due to the higher heating power. Figure 7a–c represents the variations of ROP over time, predicted based on Equation (10). As a result, the time-averaged ROP, vavg, converges to (0.38 mm/s, σ = 0.02 for Ttip = 348 K), (0.43 mm/s, σ = 0.02 for Ttip = 358 K), and (0.49 mm/s, σ = 0.03 for Ttip = 368 K), respectively. The convergence of time-averaged ROP can be explained by that the time scale of the ROP of 10−3~10−4 is to with the time scale for thermal penetration, k/(ρcpδ), of 10−3 to 10−4, where δ is liquid layer thickness having an order between 10−4 to 10−3 (m) [11].
Figure 8 shows the evolution of liquid layer thickness for the different Ttip over time. As above-mentioned, the initial thickness of the liquid layer is assumed to be 1 mm based on previous literature [11]. It continuously decreases to 0.618 mm for the Ttip = 348 K, 0.623 mm for the Ttip = 358 K, and 0.629 mm for the Ttip = 368 K, at 60 s. Although the ice directly contacts with the heated probe tip, the thickness of the liquid layer does not become thicker; rather, it becomes thinner. This is because the molten liquid layer is squeezed by the ETDP and pushed radially outward. In addition, the time scale of the ROP of 10−3–10−4 has a similar order with the time scale of thermal penetration, k/(ρcpδ), of 10−3 to 10−4. Therefore, the liquid layer maintains its thickness within 1 mm during the drilling process, as shown in Figure 8.

4. Conclusions

The present study performed a numerical analysis of the close-contact melting characteristics of electro-thermal drilling probe (ETDP) based on CFD simulations. From the numerical results, the influence of the temperature of heated probe tip on the formation of the molten thin liquid layer, and, subsequently, the rate of penetration (ROP) of ETDP were analyzed. In particular, the present study mimicked the transient movement of ETDP in a vertical direction using a simple model for predicting ROP. The distribution of temperature and liquid fraction were investigated during the drilling process. The following conclusions were drawn:
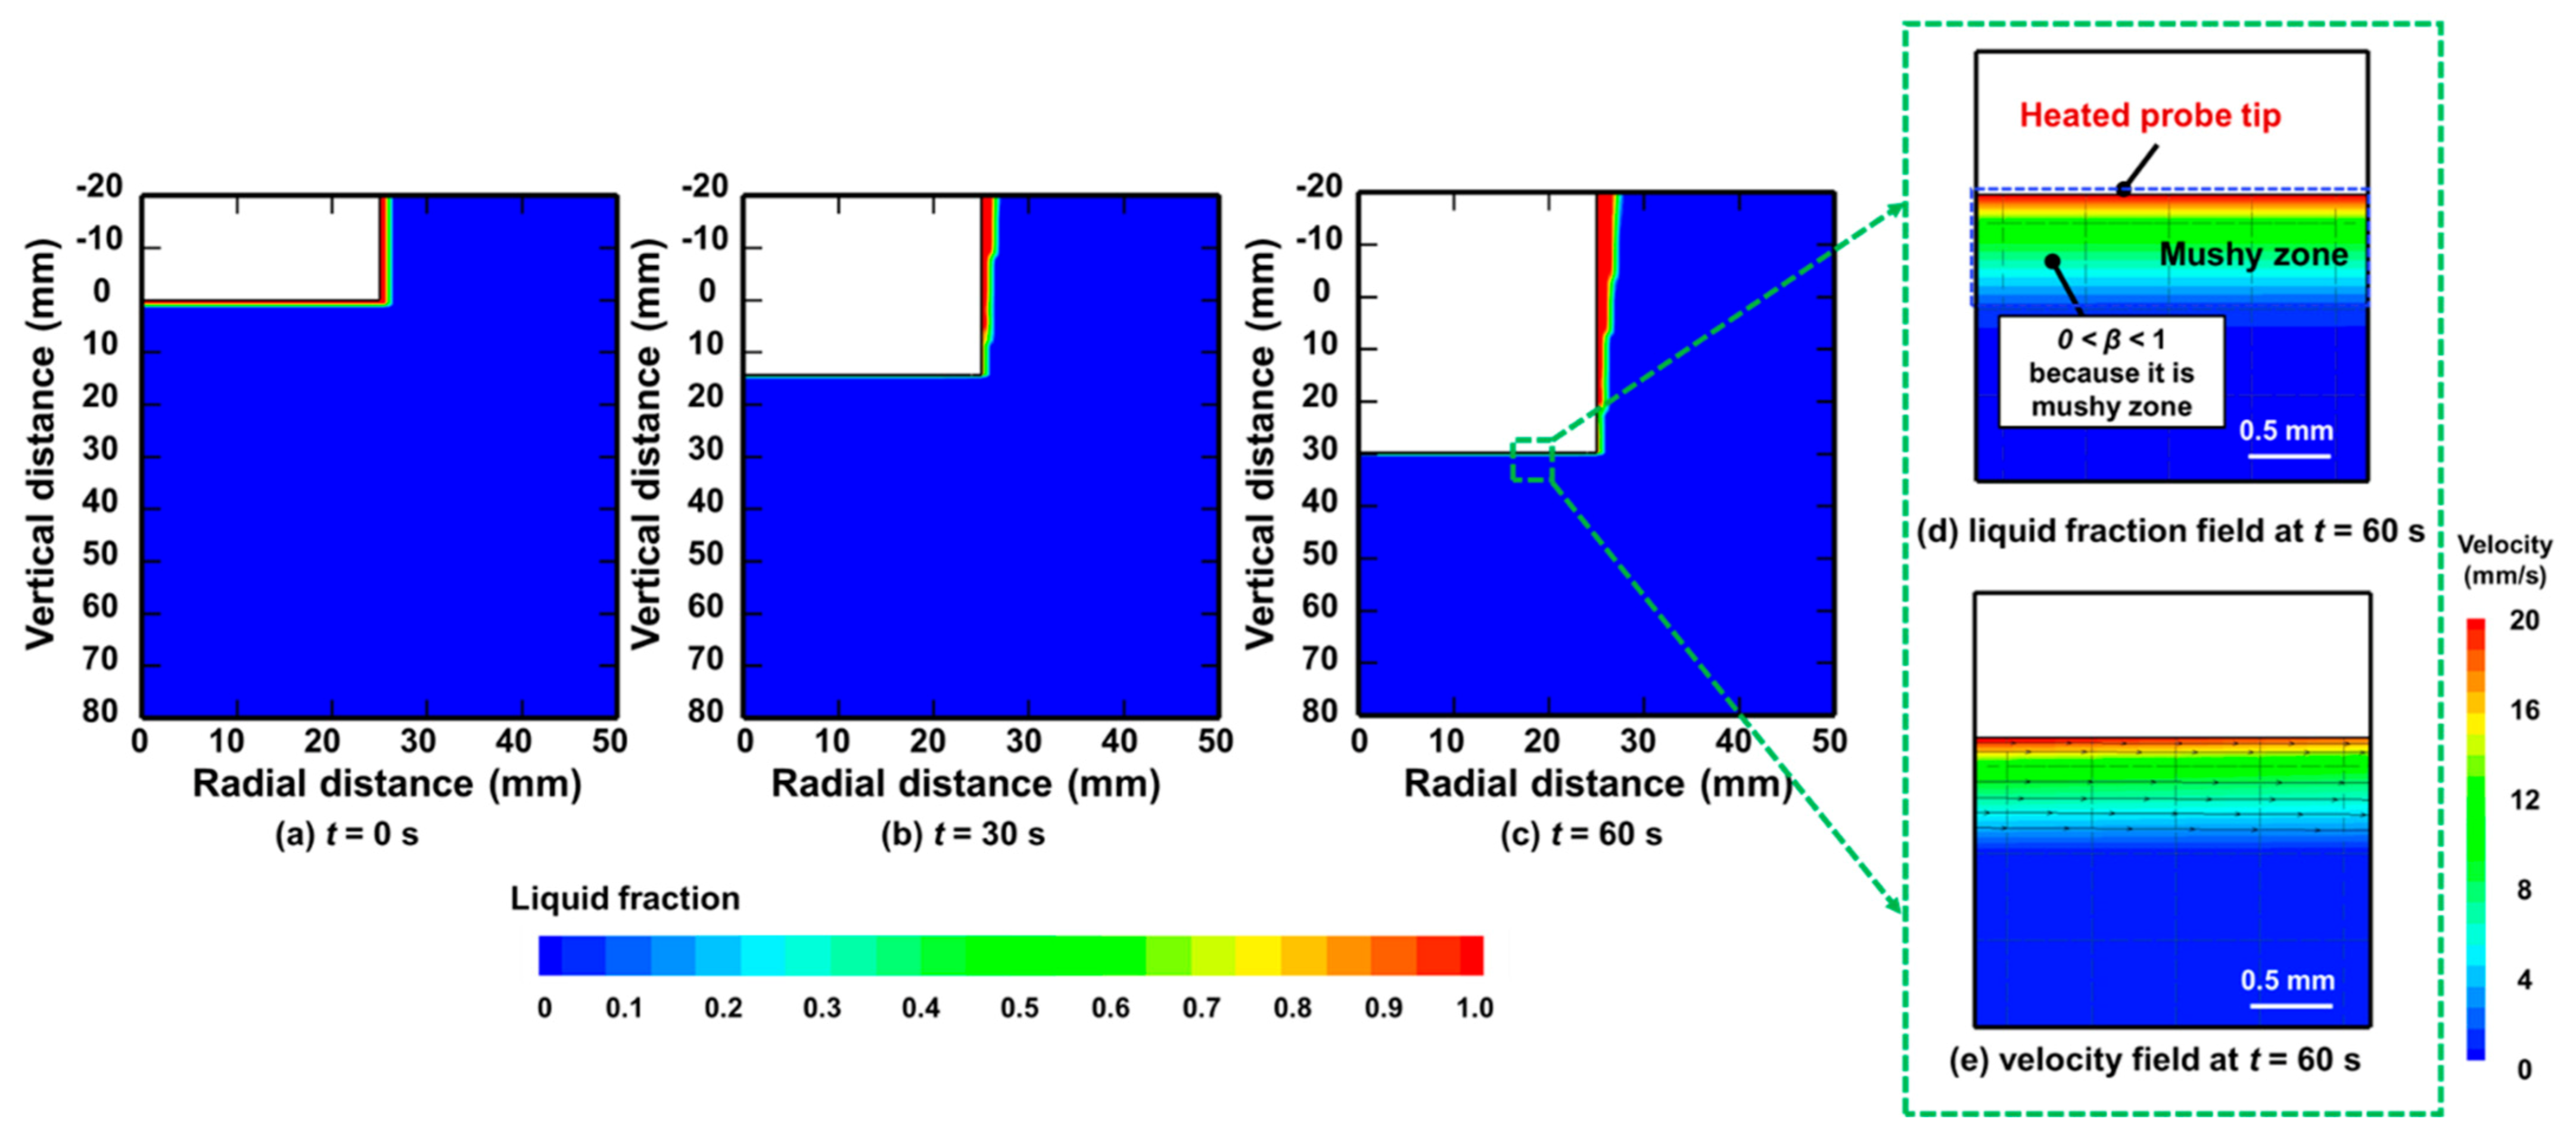
  • The mushy zone, where the melting process occurs, exists near the heated probe tip, and its temperature remains at a melting temperature of 273.15 K. Although the temperature of the mushy zone has a constant value of 273.15 K, its enthalpy increases during the melting process.
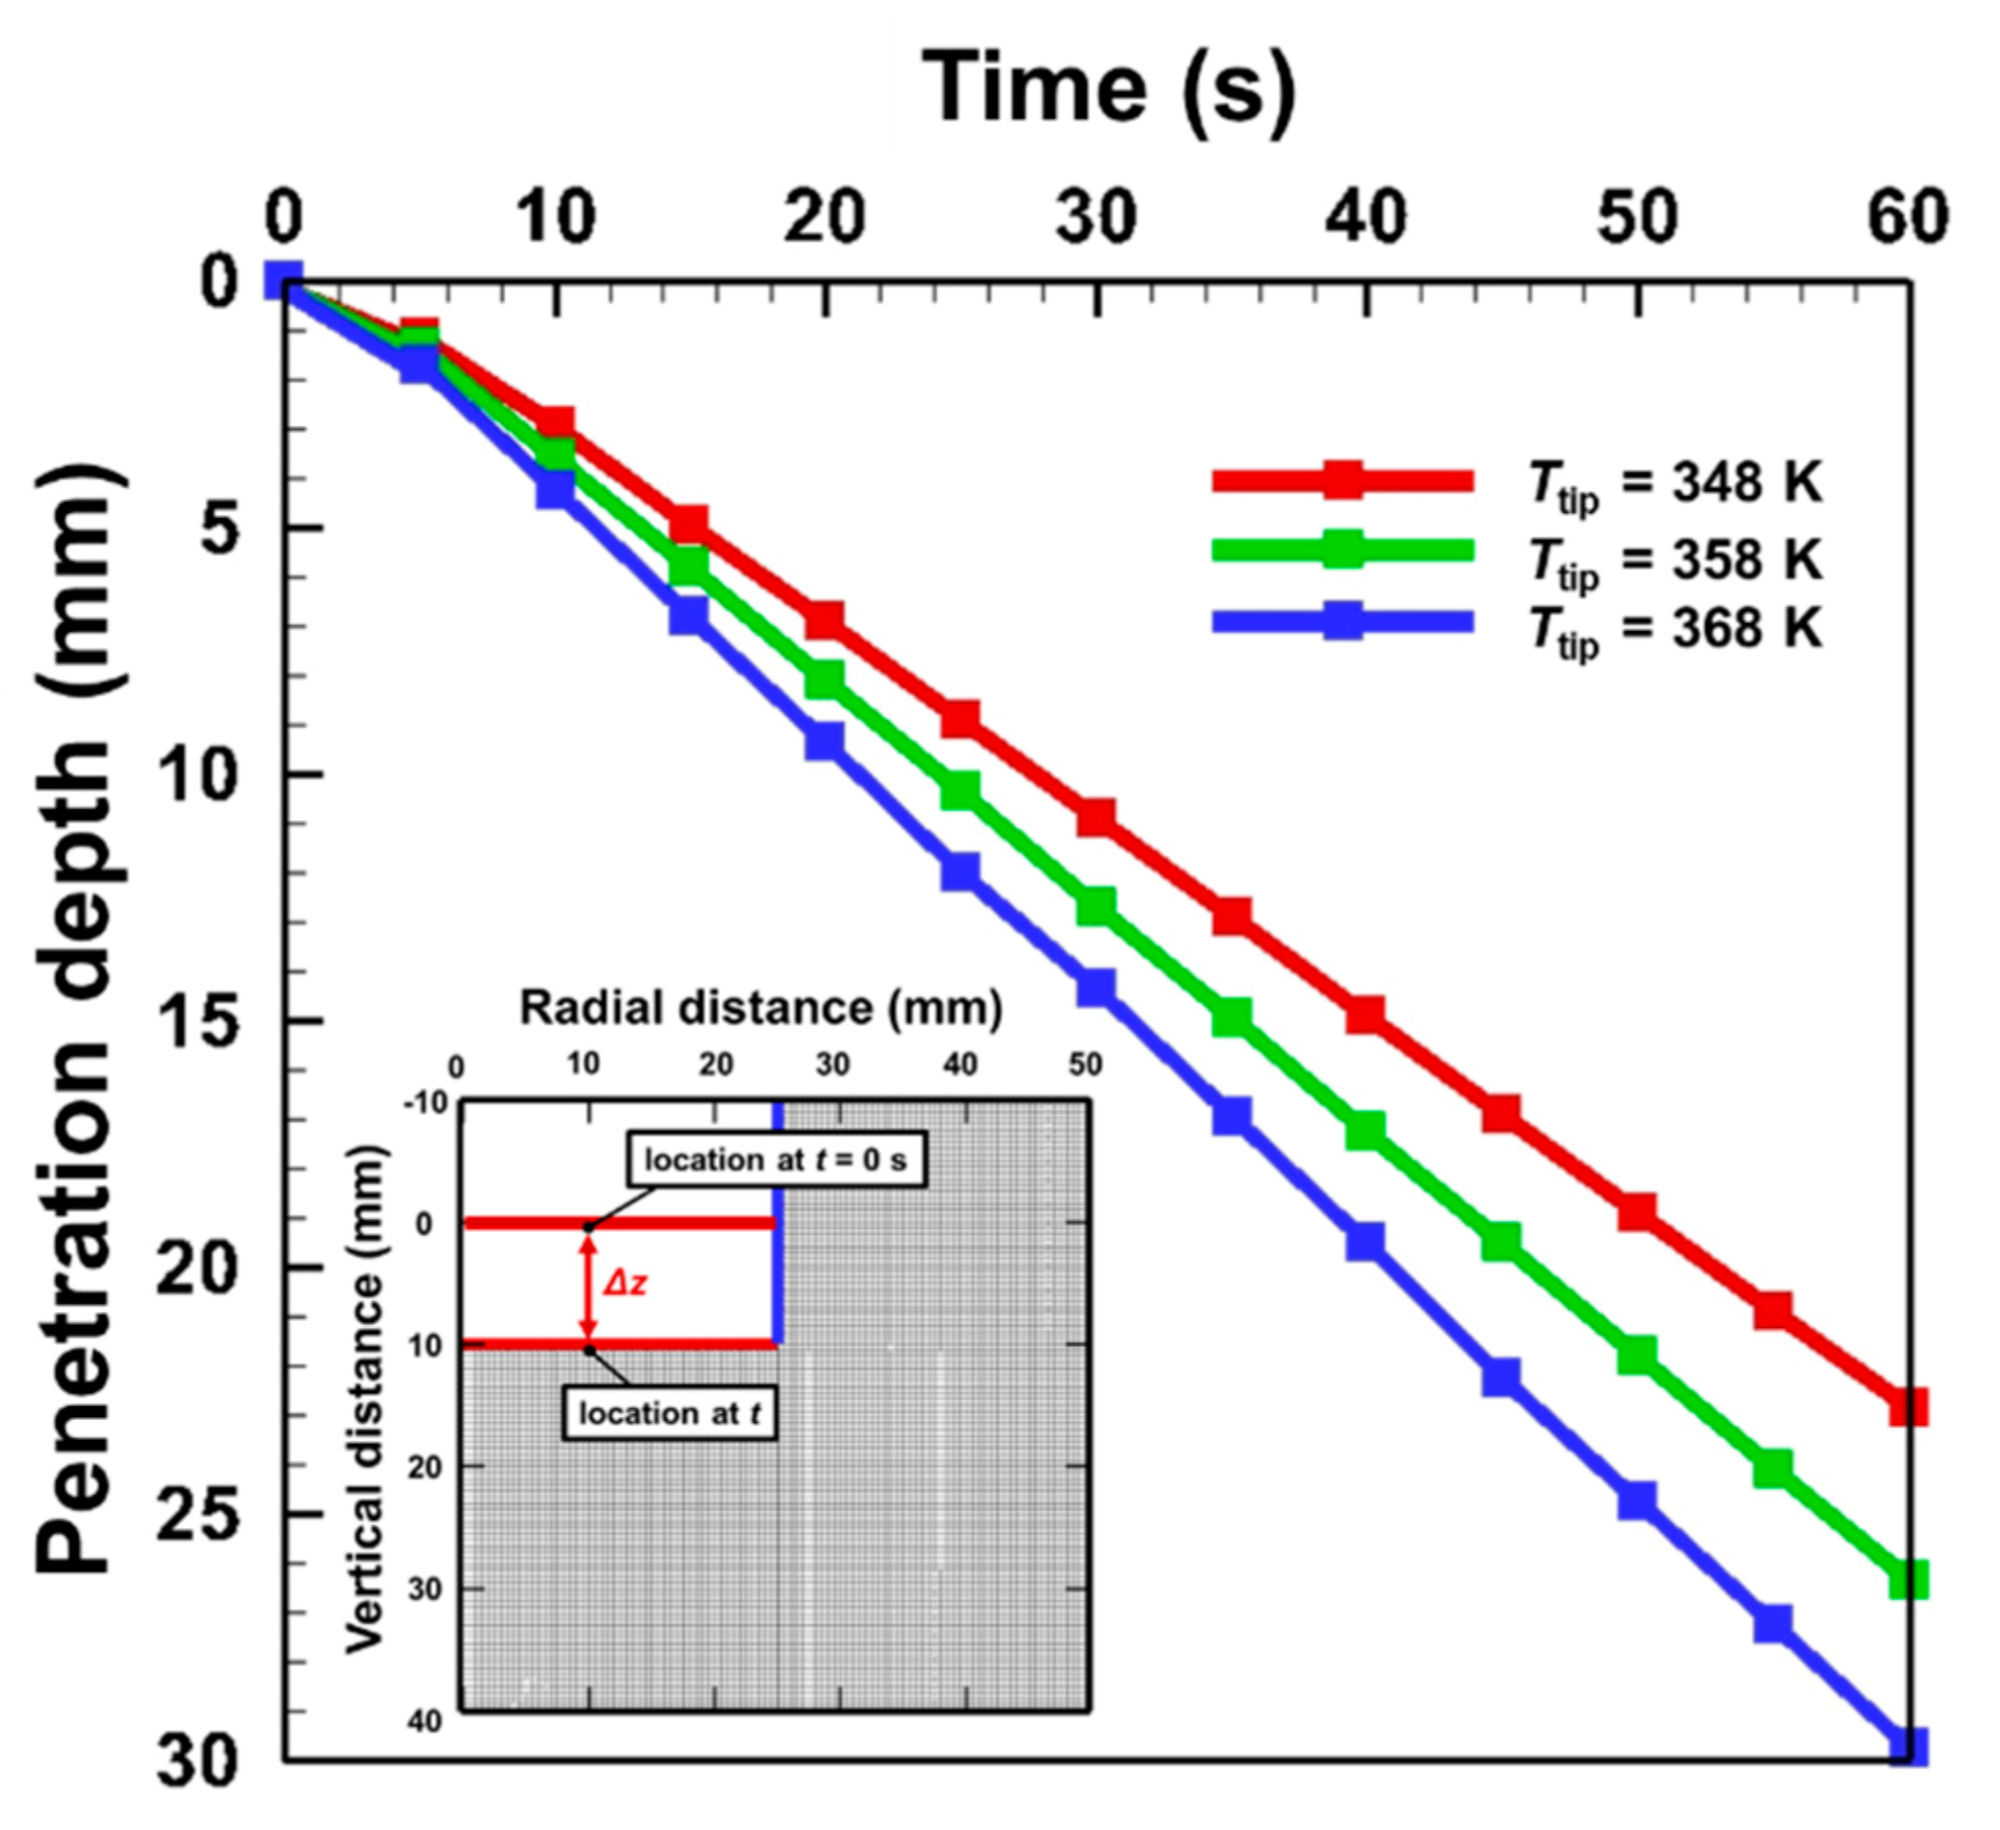
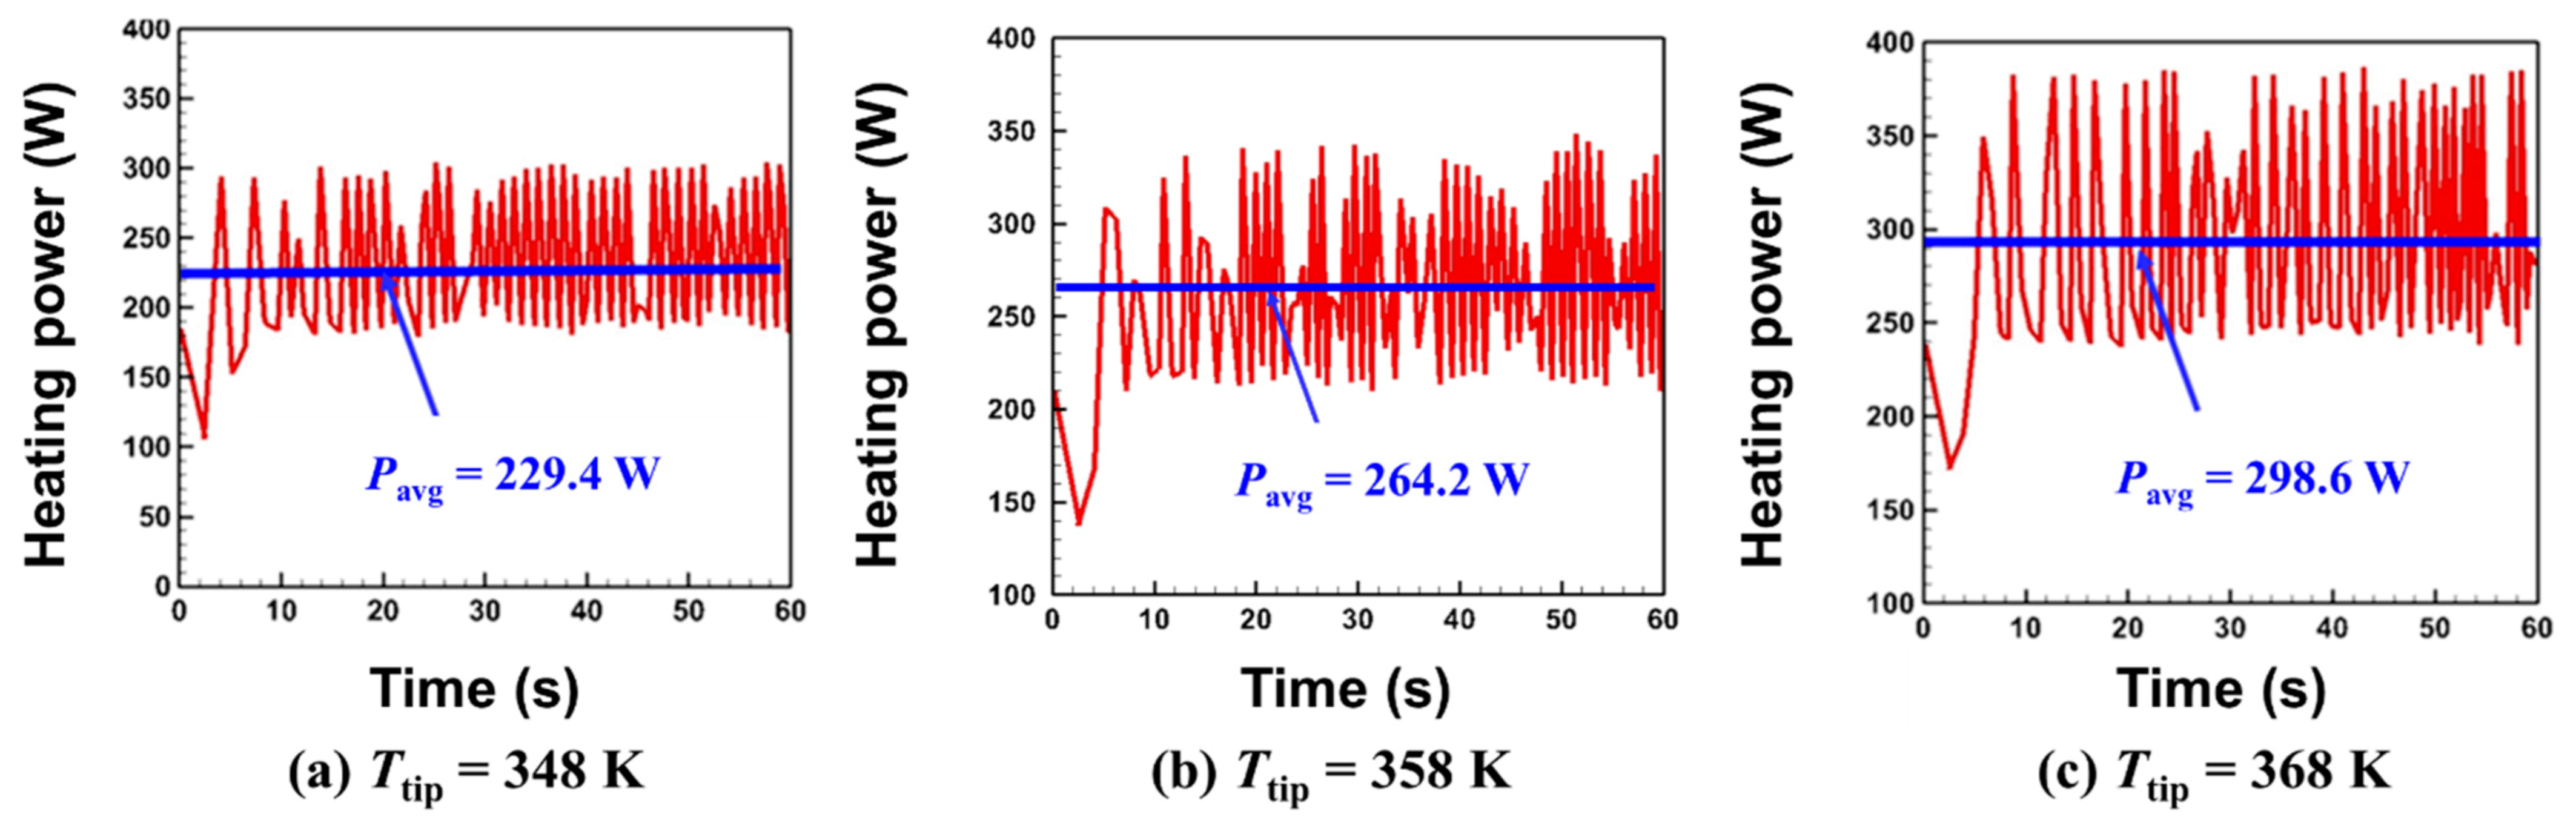
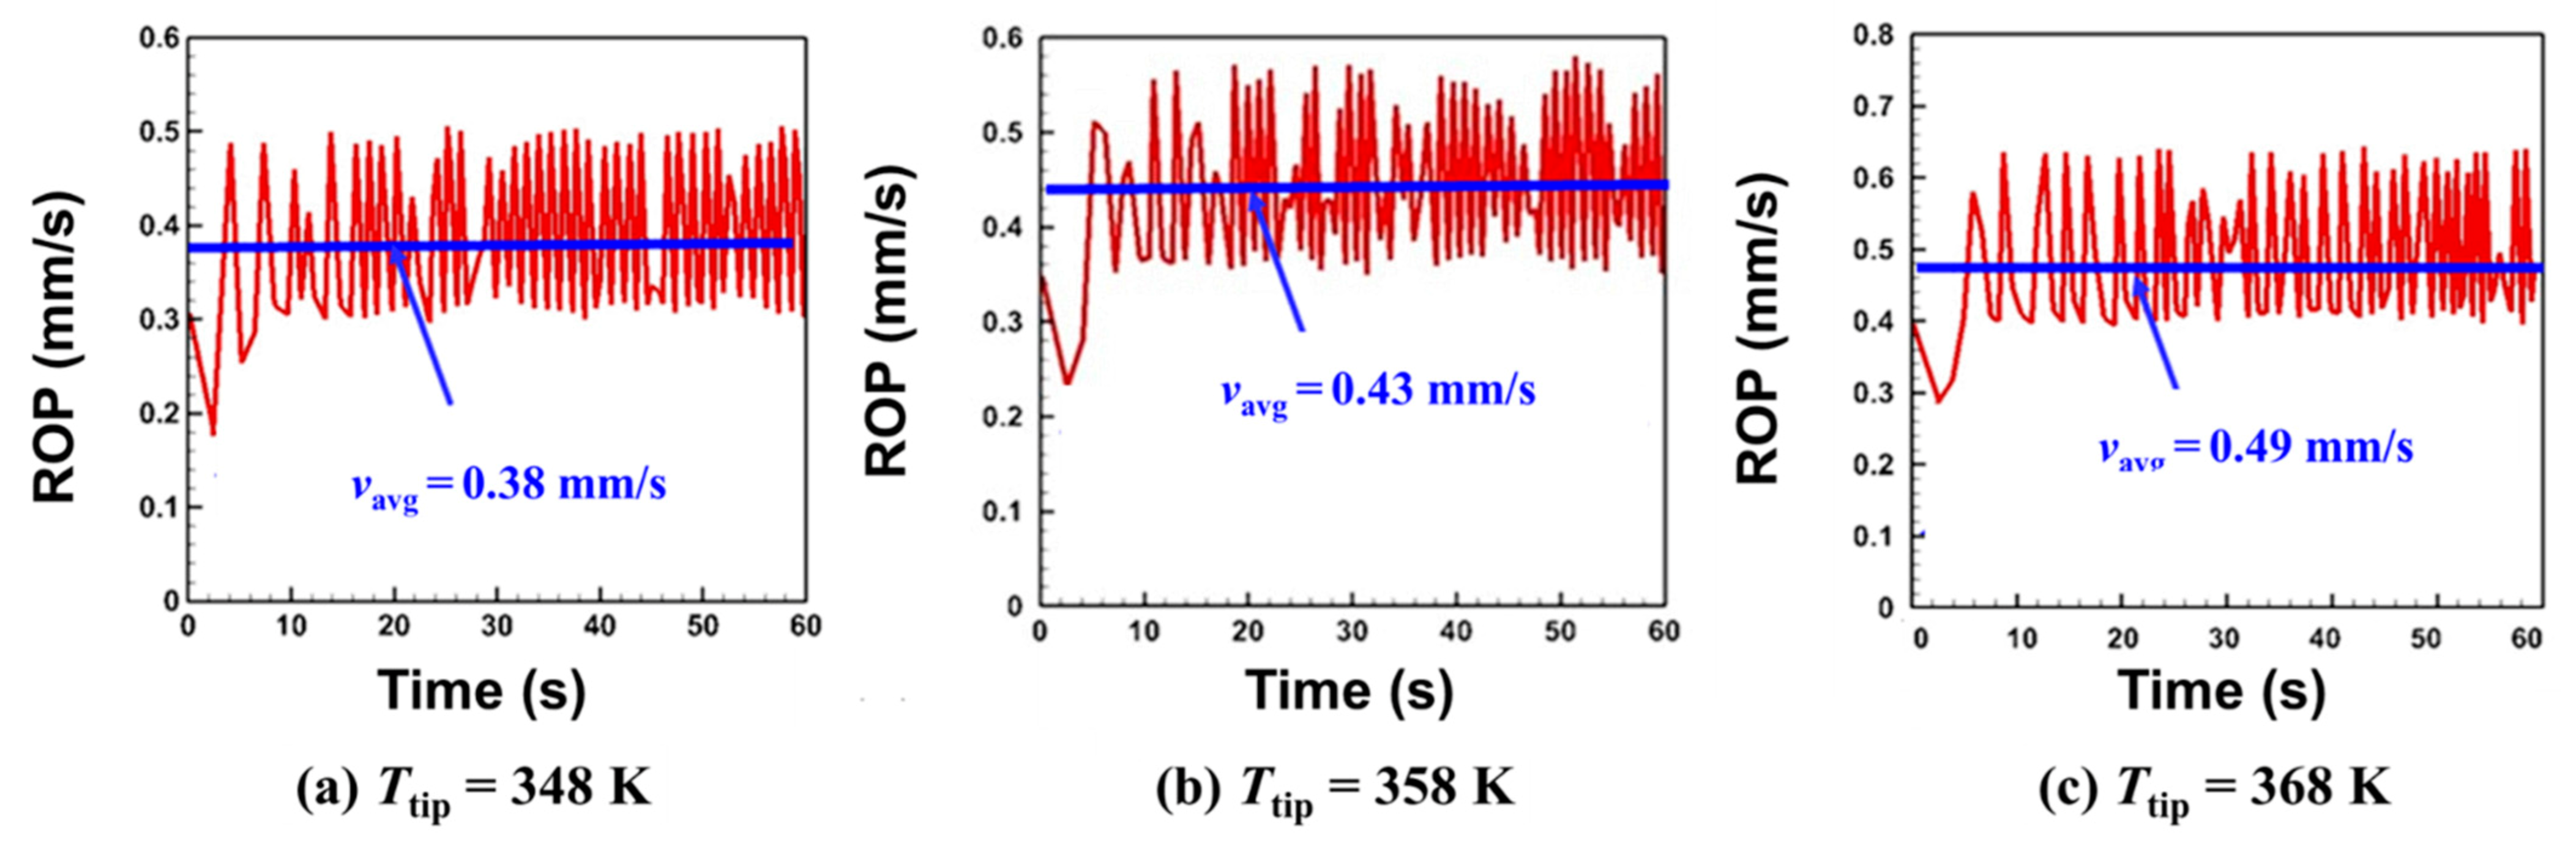
  • A thin liquid layer forms during the melting process, and the electro-thermal drilling probe can penetrate the ice by pushing and squeezing the molten thin liquid layer. The penetration depth linearly increases with time, and it implies that the ROP has a nearly constant value. The time-averaged ROP increases with the temperature of the heated probe tip, and has the values of 0.38, 0.43 and 0.49 mm/s for the different heated probe tip temperatures of 348, 358 and 368 K, respectively.
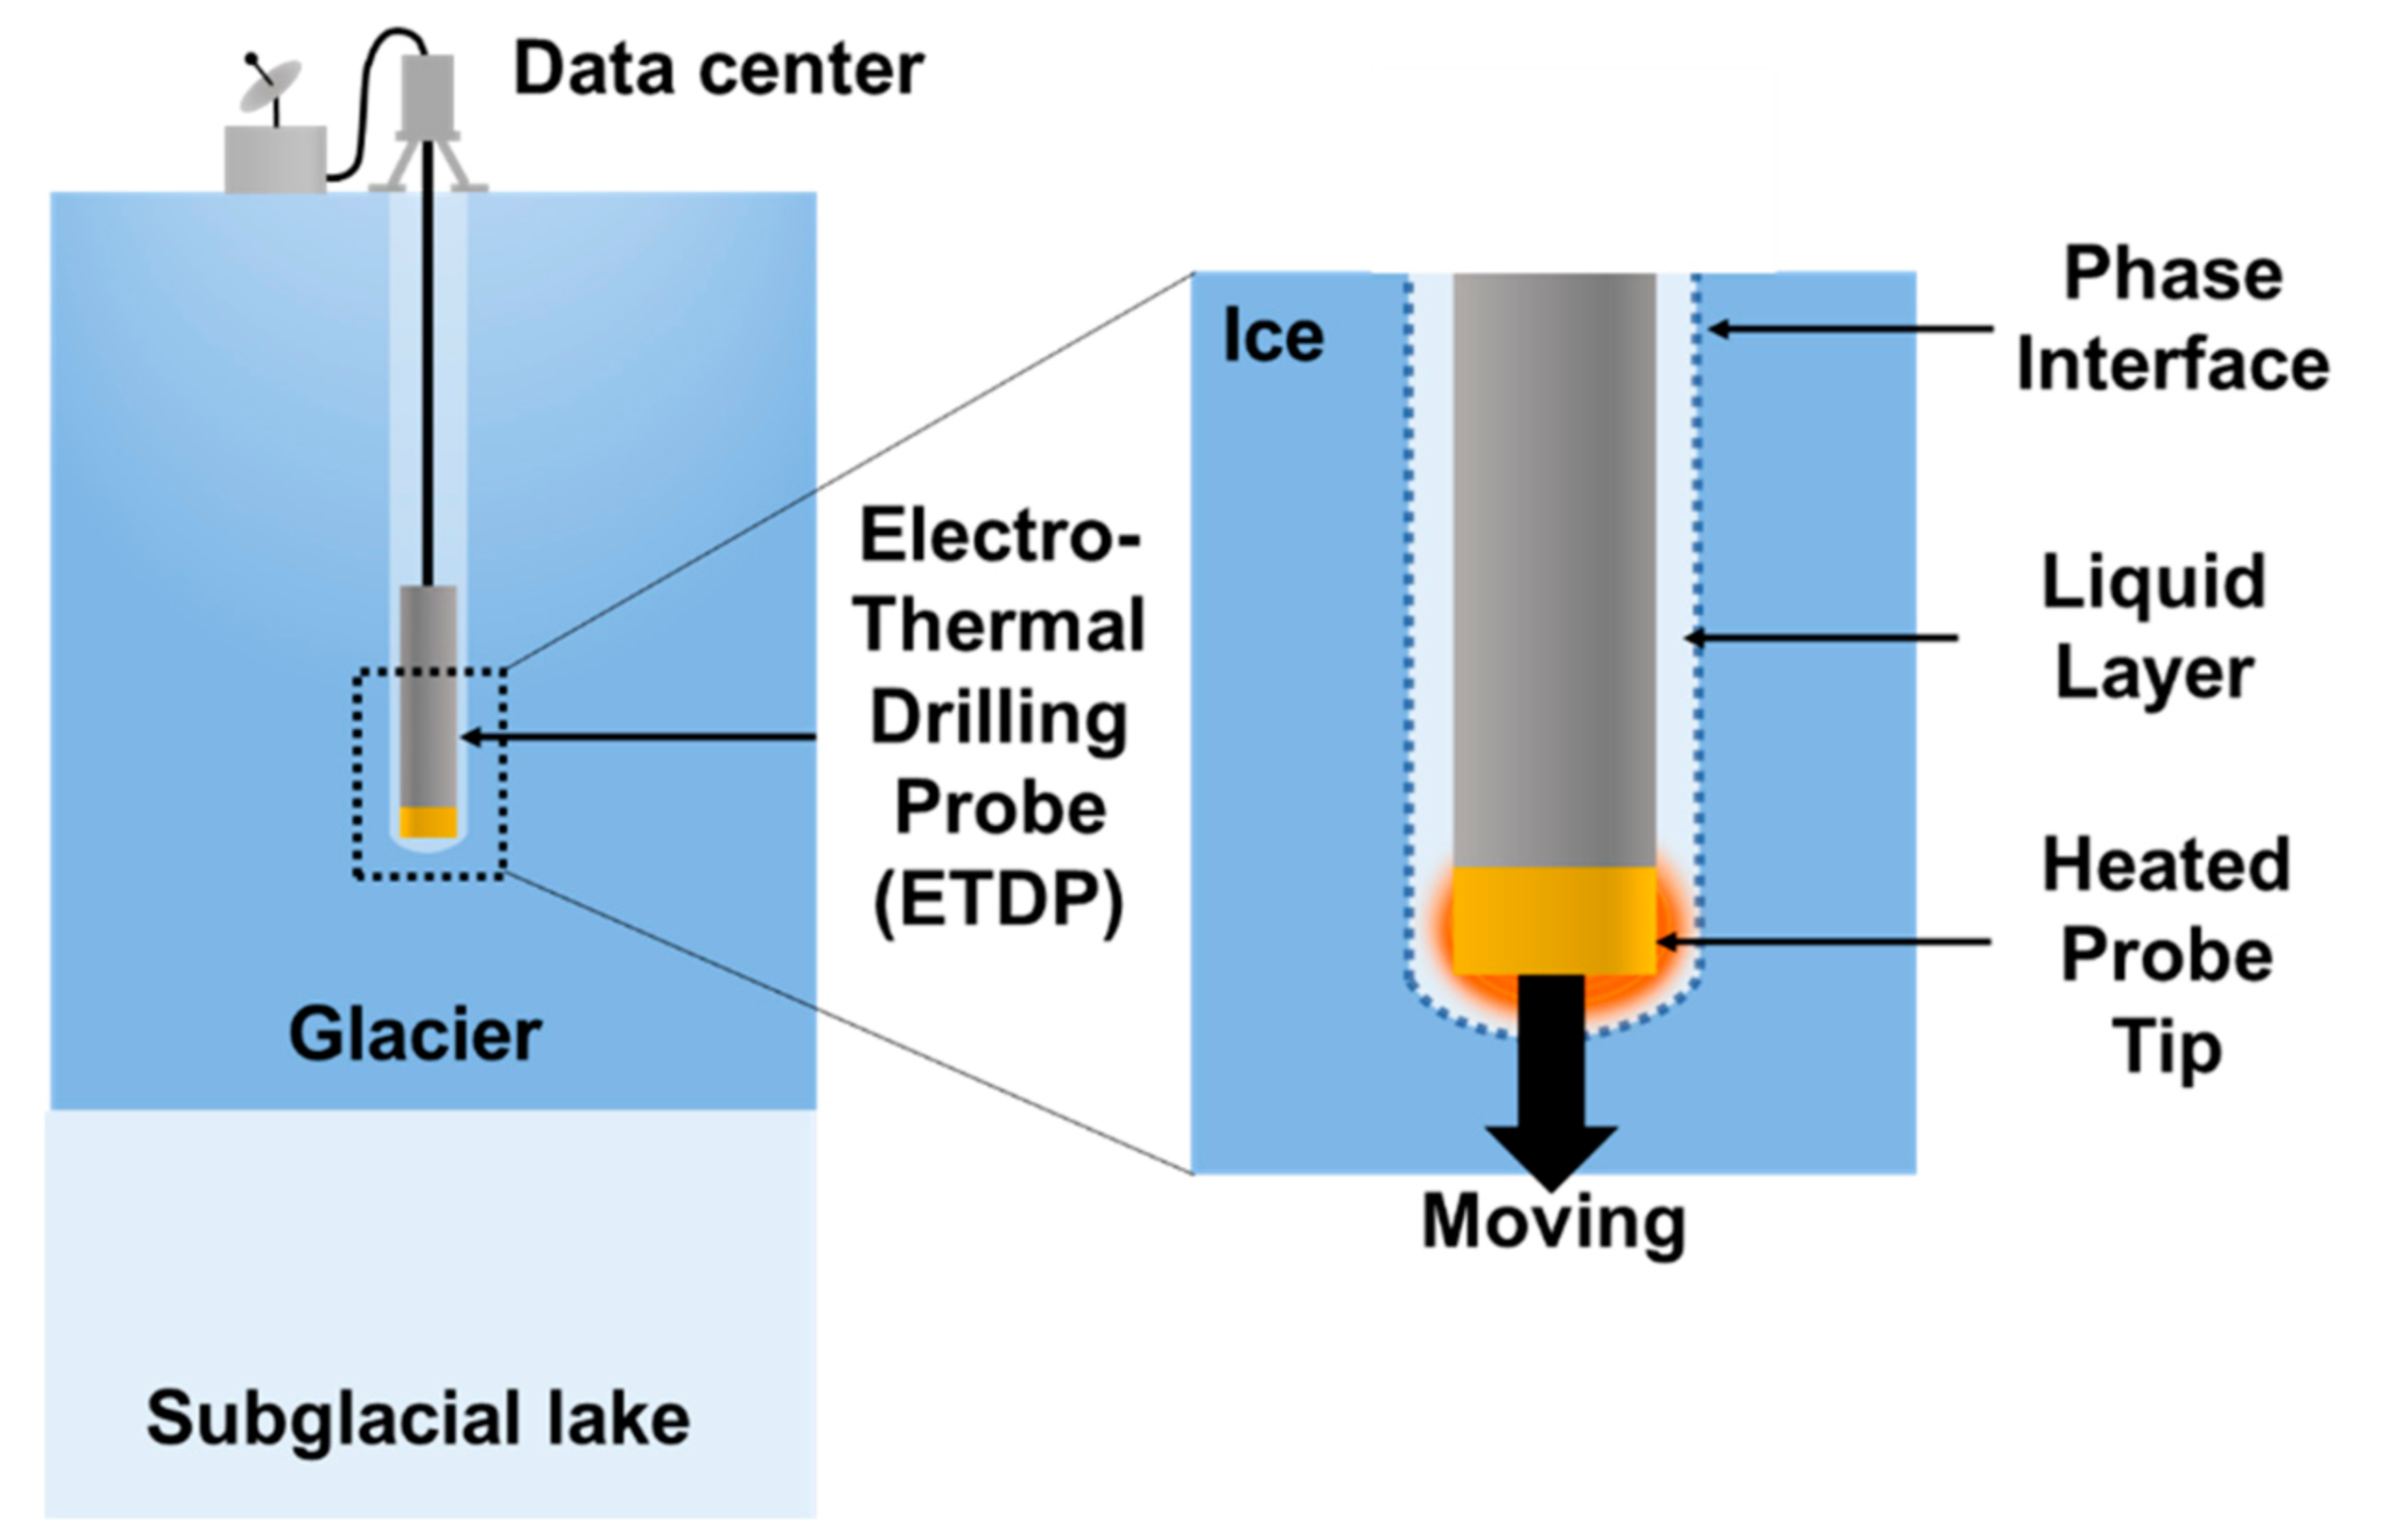
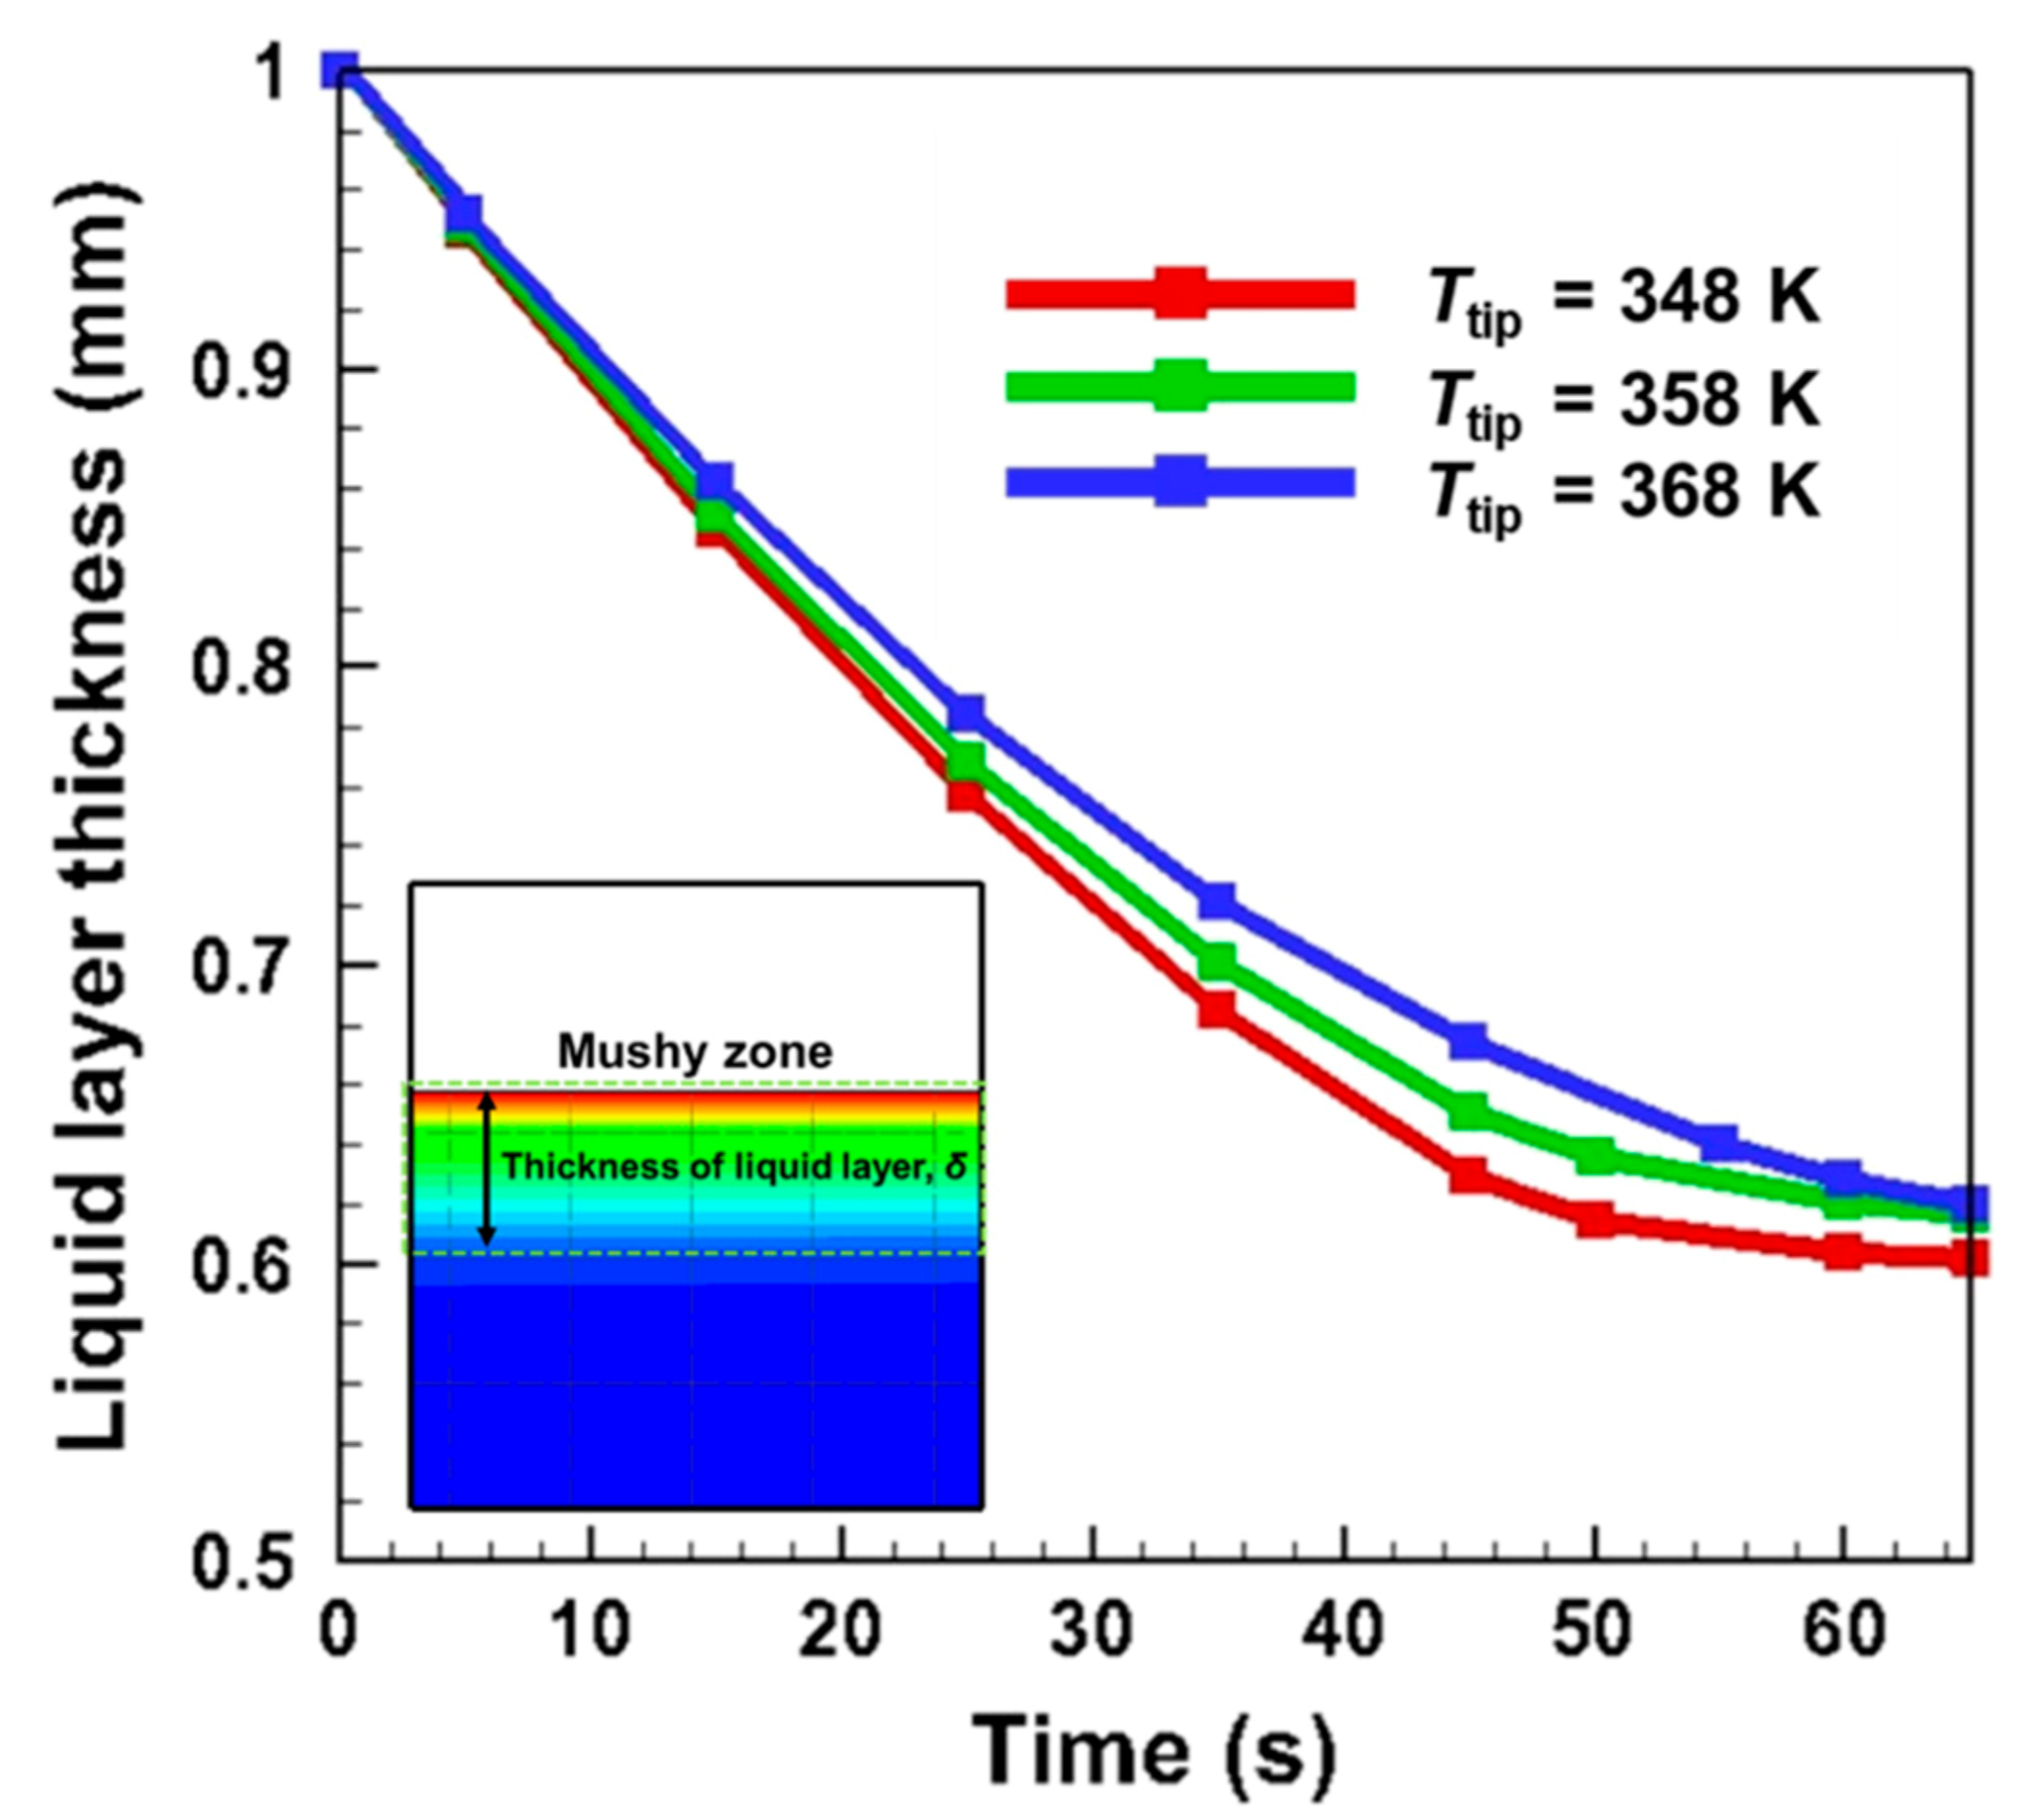
  • The molten liquid layer maintains its thickness within the 1 mm around the heated probe tip. The thin liquid layer does not become thicker; instead, it stays at about 0.6 mm during the melting process. This is because the molten liquid layer is squeezed by the ETDP and pushed radially outward.

Author Contributions

Conceptualization, S.H.L. and K.K.; validation, K.K.; investigation U.-J.P., H.J.L. and C.H.J.; methodology H.S.K. and C.H.J.; simulation U.-J.P. and C.H.J.; supervision, S.H.L.; writing of the original draft U.-J.P. and C.H.J.; project administration, J.-Y.P. and S.H.L.; funding acquisition, J.-Y.P.; writing—review and editing S.H.L. and C.H.J. All authors have read and agreed to the published version of the manuscript.

Funding

This research was supported by a grant from the endowment project of “Development of core technologies of underwater robot ICT for polar under-ice-shelf exploration and remote monitoring” funded by the Korea Research Institute of Ships and Ocean Engineering (PES4010).

Acknowledgments

This research was supported by a grant from the endowment project of “Development of core technologies of underwater robot ICT for polar under-ice-shelf exploration and remote monitoring” funded by Korea Research Institute of Ships and Ocean Engineering (PES4010). This research was also supported by the Chung-Ang University Research Scholarship Grants in 2020.

Conflicts of Interest

The authors declare no conflict of interest.

References

  1. Christner, B.C.; The WISSARD Science Team; Priscu, J.C.; Achberger, A.M.; Barbante, C.; Carter, S.P.; Christianson, K.; Michaud, A.B.; Mikucki, J.A.; Mitchell, A.C.; et al. A microbial ecosystem beneath the west antarctic ice sheet. Nature 2014, 512, 310–313. [Google Scholar] [CrossRef]
  2. Rampelotto, P.H. Resistance of microorganisms to extreme environmental conditions and its contribution to astrobiology. Sustainability 2010, 2, 1602–1623. [Google Scholar] [CrossRef] [Green Version]
  3. Priscu, J.C. Geomicrobiology of subglacial ice above lake vostok, antarctica. Science 1999, 286, 2141–2144. [Google Scholar] [CrossRef] [Green Version]
  4. Talalay, P.G.; Zagorodnov, V.S.; Markov, A.N.; Sysoev, M.A.; Hong, J. Recoverable autonomous sonde (recas) for environmental exploration of antarctic subglacial lakes: General concept. Ann. Glaciol. 2014, 55, 23–30. [Google Scholar] [CrossRef] [Green Version]
  5. Cuncil, N.R. Exploration of Antarctic Subglacial Aquatic Environments: Environmental and Scientific Stewardship; National Academic Press: Washington, DC, USA, 2007. [Google Scholar]
  6. Kapitsa, A.P.; Ridley, J.K.; Robin, G.D.; Siegert, M.J.; Zotikov, I.A. A large deep freshwater lake beneath the ice of central east antarctica. Nature 1996, 381, 684–686. [Google Scholar] [CrossRef]
  7. Zimmerman, W.; Bonitz, R.; Feldman, J. Cryobot: An ice penetrating robotic vehicle for mars and europa. In Proceedings of the Aerospace Conference Proceedings, Big Sky, MT, USA, 10–17 March 2001; pp. 311–323. [Google Scholar]
  8. Kowalski, J.; Linder, P.; Zierke, S.; von Wulfen, B.; Clemens, J.; Konstantinidis, K.; Ameres, G.; Hoffmann, R.; Mikucki, J.; Tulaczyk, S.; et al. Navigation technology for exploration of glacier ice with maneuverable melting probes. Cold Reg. Sci. Technol. 2016, 123, 53–70. [Google Scholar] [CrossRef] [Green Version]
  9. Aamot, H.W.C. Development of a vertically stabilized thermal probe for studies in and below ice sheets. J. Eng. Ind. 1970, 92, 263–268. [Google Scholar] [CrossRef]
  10. Schuller, K.; Kowalski, J.; Raback, P. Curvilinear melting-a preliminary experimental and numerical study. Int. J. Heat Mass Transf. 2016, 92, 884–892. [Google Scholar] [CrossRef]
  11. Alemany, O.; Chappellaz, J.; Triest, J.; Calzas, M.; Cattani, O.; Chemin, J.; Desbois, Q.; Desbois, T.; Duphil, R.; Falourd, S.; et al. The subglacior drilling probe: Concept and design. Ann. Glaciol. 2014, 55, 233–242. [Google Scholar] [CrossRef] [Green Version]
  12. Shreve, R.L. Theory of performance of isothermal solid-nose hotpoints boring in temperate ice. J. Glaciol. 1962, 4, 151–160. [Google Scholar] [CrossRef] [Green Version]
  13. Talalay, P.G.; Li, Y.Z.; Sysoev, M.A.; Hong, J.L.; Li, X.; Fan, X.P. Thermal tips for ice hot-point drilling: Experiments and preliminary thermal modeling. Cold Reg. Sci. Technol. 2019, 160, 97–109. [Google Scholar] [CrossRef]
  14. Suto, Y.; Saito, S.; Osada, K.-I.; Takahashi, H.; Motoyama, H.; Fujii, Y.; Tanaka, Y. Laboratory experiments and thermal calculations for the development of a next-generation glacier-ice exploration system: Development of an electro-thermal drilling device. Polar Sci. 2008, 2, 15–26. [Google Scholar] [CrossRef] [Green Version]
  15. Treffer, M.; Komle, N.I.; Kargl, G.; Kaufmann, E.; Ulamec, S.; Biele, J.; Ivanov, A.; Funke, O. Preliminary studies concerning subsurface probes for the exploration of icy planetary bodies. Planet. Space Sci. 2006, 54, 621–634. [Google Scholar] [CrossRef]
  16. Garcia-Diaz, M.; Pereiras, B.; Miguel-Gonzalez, C.; Rodriguez, L.; Fernandez-Oro, J. CFD analysis of the performance of a double decker turbine for wave energy conversion. Energies 2021, 14, 949. [Google Scholar] [CrossRef]
  17. An, X.D.; Jiang, L.; Hassanipour, F. Numerical analysis of air vortex interaction with porous screen. Fluids 2021, 6, 70. [Google Scholar] [CrossRef]
  18. Agrawal, K.K.; Misra, R.; Agrawal, G.D. CFD simulation study to evaluate the economic feasibility of backfilling materials for ground-air heat exchanger system. Geothermics 2021, 90, 102002. [Google Scholar] [CrossRef]
  19. Di Renzo, A.; Napolitano, E.S.; Di Maio, F.P. Coarse-grain dem modelling in fluidized bed simulation: A review. Processes 2021, 9, 279. [Google Scholar] [CrossRef]
  20. Voller, V.R.; Swaminathan, C.R. Eral source-based method for solidification phase change. Numer. Heat Transf. Part B Fundam. 1991, 19, 175–189. [Google Scholar] [CrossRef]
  21. Voller, V.R.; Brent, A.D.; Prakash, C. The modeling of heat, mass and solute transport in solidification systems. Int. J. Heat Mass Transf. 1989, 32, 1719–1731. [Google Scholar] [CrossRef]
  22. Voller, V.R.; Prakash, C. A fixed grid numerical modeling methodology for convection diffusion mushy region phase-change problems. Int. J. Heat Mass Transf. 1987, 30, 1709–1719. [Google Scholar] [CrossRef]
  23. Voller, V.R. Modeling the unidirectional solidification of a binary alloy with the heat-balance integral method. J. Min. Met. Mater. Soc. 1987, 39, A13. [Google Scholar]
  24. Kang, K.-G.; Ryou, H.-S. Computation of solidification and melting using the piso algorithm. Numer. Heat Transf. Part B Fundam. 2004, 46, 179–194. [Google Scholar] [CrossRef]
  25. Lu, J.F.; Ding, J.; Yang, J.P. Solidification and melting behaviors and characteristics of molten salt in cold filling pipe. Int. J. Heat Mass Transf. 2010, 53, 1628–1635. [Google Scholar] [CrossRef]
  26. Al-Maghalseh, M.M. Investigate the natural convection heat transfer in a pcm thermal storage system using ansys/fluent. Jordan J. Mech. Ind. Eng. 2017, 11, 217–223. [Google Scholar]
Figure 1. Schematic of the drilling process of electro-thermal drilling probe (ETDP).
Applsci 11 03443 g001
Figure 2. The schematic of the computational domain and corresponding boundary conditions.
Applsci 11 03443 g002
Figure 3. The temperature distribution around the electro-thermal drilling probe (ETDP) for the case of heated probe tip temperature of Ttip = 368 K at time (a) t = 0 s, (b) t = 30 s, and (c) t = 60 s. The enlarged fields of (d) temperature and (e) enthalpy within the green dotted box.
Applsci 11 03443 g003
Figure 4. The liquid fraction distribution around the electro-thermal drilling probe (ETDP) for the case of heated probe tip temperature of Ttip = 368 K at time (a) t = 0 s, (b) t = 30 s, and (c) t = 60 s. The enlarged fields of (d) liquid fraction within the green dotted box.
Applsci 11 03443 g004
Figure 5. The penetration depth, Δz, for different heated probe tip temperatures, Ttip.
Applsci 11 03443 g005
Figure 6. Comparison of heating power for different heated probe tip temperature of (a) Ttip = 348 K, (b) Ttip = 358 K and (c) Ttip = 368 K.
Applsci 11 03443 g006
Figure 7. Comparison of rate of penetration (ROP) for different heated probe tip temperature of (a) Ttip = 348 K, (b) Ttip = 358 K and (c) Ttip = 368 K.
Applsci 11 03443 g007
Figure 8. The evolution of liquid layer thickness for different heated probe tip temperatures of 348, 358 and 368 K.
Applsci 11 03443 g008
Table 1. Comparison of the predicted results of rate of penetration (ROP) with the experimental results [13].
Heating PowerRate of Penetration (Experiment Result)Rate of Penetration (Prediction Model Result)Error
240 W0.380 mm/s0.329 mm/s13.4%
300 W0.458 mm/s0.411 mm/s10.2%
360 W0.508 mm/s0.494 mm/s2.7%
480 W0.55 mm/s0.65 mm/s18%
Publisher’s Note: MDPI stays neutral with regard to jurisdictional claims in published maps and institutional affiliations.

