Next Article in Journal
Generating Robotic Speech Prosody for Human Robot Interaction: A Preliminary Study
Next Article in Special Issue
Low-Pass Filtering Method for Poisson Data Time Series
Previous Article in Journal
Performance Evaluation of rPPG Approaches with and without the Region-of-Interest Localization Step
Previous Article in Special Issue
Storm-Time Features of the Ionospheric ELF/VLF Waves and Energetic Electron Fluxes Revealed by the China Seismo-Electromagnetic Satellite
 
 
applsci-logo
Article Menu

Article Menu

Article

Trapped Proton Fluxes Estimation Inside the South Atlantic Anomaly Using the NASA AE9/AP9/SPM Radiation Models along the China Seismo-Electromagnetic Satellite Orbit

by
Matteo Martucci
1,2,*,
Roberta Sparvoli
1,2,
Simona Bartocci
1,
Roberto Battiston
3,4,
William Jerome Burger
4,5,
Donatella Campana
6,
Luca Carfora
1,2,
Guido Castellini
7,
Livio Conti
1,8,
Andrea Contin
9,10,
Cinzia De Donato
1,
Cristian De Santis
1,
Francesco Maria Follega
3,4,
Roberto Iuppa
3,4,
Ignazio Lazzizzera
3,4,
Nadir Marcelli
1,2,
Giuseppe Masciantonio
1,
Matteo Mergé
1,†,
Alberto Oliva
10,
Giuseppe Osteria
6,
Francesco Palma
1,†,
Federico Palmonari
9,10,
Beatrice Panico
6,
Alexandra Parmentier
1,
Francesco Perfetto
6,
Piergiorgio Picozza
1,2,
Mirko Piersanti
11,
Michele Pozzato
10,
Ester Ricci
3,4,
Marco Ricci
12,
Sergio Bruno Ricciarini
7,
Zouleikha Sahnoun
10,
Valentina Scotti
6,13,
Alessandro Sotgiu
1,
Vincenzo Vitale
1,
Simona Zoffoli
14 and
Paolo Zuccon
3,4
add Show full author list remove Hide full author list
1
INFN-Sezione di Roma “Tor Vergata”, V. della Ricerca Scientifica 1, I-00133 Rome, Italy
2
Department of Physics, University of Rome “Tor Vergata”, V. della Ricerca Scientifica 1, I-00133 Rome, Italy
3
Department of Physics, University of Trento, V. Sommarive 14, I-38123 Trento, Italy
4
INFN-TIFPA, V. Sommarive 14, I-38123 Trento, Italy
5
Centro Fermi, V. Panisperna 89a, I-00184 Rome, Italy
6
INFN-Sezione di Napoli, V. Cintia, I-80126 Naples, Italy
7
IFAC-CNR, V. Madonna del Piano 10, I-50019 Florence, Italy
8
Department of Engineering, Uninettuno University, C.so V. Emanuele II 39, I-00186 Rome, Italy
9
Department of Physics, University of Bologna, V.le C. Berti Pichat 6/2, I-40127 Bologna, Italy
10
INFN-Sezione di Bologna, V.le C. Berti Pichat 6/2, I-40127 Bologna, Italy
11
INAF-IAPS, V. Fosso del Cavaliere 100, I-00133 Rome, Italy
12
INFN-LNF, V. E. Fermi 54, I-00044 Rome, Italy
13
Department of Physics, University of Naples “Federico II”, V. Cintia 21, I-80126 Naples, Italy
14
Italian Space Agency, V. del Politecnico, I-00133 Rome, Italy
*
Author to whom correspondence should be addressed.
Also at ASI Space Science Data Center (SSDC), V. del Politecnico, I-00133 Rome, Italy.
Submission received: 9 March 2021 / Revised: 7 April 2021 / Accepted: 8 April 2021 / Published: 13 April 2021
(This article belongs to the Special Issue Research on Cosmic Rays and Their Impact on Human Activities)

Abstract

:
The radiation belts in the Earth’s magnetosphere pose a hazard to satellite systems and spacecraft missions (both manned and unmanned), heavily affecting payload design and resources, thus resulting in an impact on the overall mission performance and final costs. The NASA AE9/AP9/SPM radiation models for energetic electrons, protons, and plasma provide useful information on the near-Earth environment, but they are still incomplete as to some features and, for some energy ranges, their predictions are not based on a statistically sufficient sample of direct measurements. Therefore, it is of the upmost importance to provide new data and direct measurements to improve their output. In this work, the AP9 model is applied to the China Seismo-Electromagnetic Satellite (CSES-01) orbit to estimate the flux of energetic protons over the South Atlantic Anomaly during a short testing period of one day, 1 January 2021. Moreover, a preliminary comparison with proton data obtained from the High-Energy Particle Detector (HEPD) on board CSES-01 is carried out. This estimation will serve as the starting ground for a forthcoming complete data analysis, enabling extensive testing and validation of current theoretical and empirical models.

1. Introduction

The radiation belts, also known as Van Allen belts, are regions of the Earth’s magnetosphere where energetic charged particles are subject to long-term magnetic trapping. The outer belt is mostly populated by electrons with hundreds of keV to MeV energies, while the inner belt mostly consists of an intense radiation of energetic protons (from MeV up to a few GeV), electrons/positrons (up to ∼8 MeV), and a minor component of ions [1,2]. Proton populations with energies above a few tens of MeV originate from the β -decay of free neutrons produced in the interaction between galactic cosmic-rays and the Earth’s atmosphere in a mechanism called Cosmic Ray Albedo Neutron Decay (CRAND) [3,4]. Since the discovery of the Van Allen radiation belts, after the launch of the first Explorer satellites in 1958 and the Pioneer in 1959 [5,6], the scientific community has been considerably involved in modeling this space radiation environment. All these efforts were mostly aimed to meet the practical need of better understanding the significant radiation hazard to spacecraft and human crews. Several studies reported a direct association between the dynamic radiation environment and system or subsystem performances [7,8]. To address and solve these problems, more accurate, comprehensive, and up-to-date space radiation environment models have been developed by the National Reconnaissance Office (NRO) and the Air Force Research Laboratory (AFRL); the new AE9/AP9/SPM set of models for high-energy electrons, protons, and space plasma, respectively, is derived from 45 datasets obtained from sensors on board various satellites. These datasets have been processed to create maps of the particle fluxes along with estimates of uncertainties from both imperfect measurements and space weather variability [9]. A detailed comparison between the older AE8/AP8 and the newer AE9/AP9 models is reported in [10].
Gradual deterioration of spacecraft systems and components—and their overall performances—with accumulated dose is a fact, and various failures, due to phenomena associated with Single Event Effects (SEEs) or electrostatic discharge, are particularly common.
The first empirical models of the radiation belts, developed in the 1960s and 1970s by NASA, tried to describe and represent the radiation environment and their early versions, namely, AE8 and AP8 [11], were widely employed in spite of their limitations, especially at low altitudes [11,12,13]. Despite being successful in describing the radiation environment, even AE9/AP9/SPM are partly incomplete, and often their predictions are not based on a statistically sufficient sample of direct measurements [10]. For this reason, it is of key importance to test them and, above all, to provide new and reliable datasets from in-flight instruments to improve their output and accuracy. Among the scientific payloads on board the China Seismo-Electromagnetic Satellite (CSES-01), in Low-Earth Orbit since February 2018, the High-Energy Particle Detector (HEPD) has gone through an intense period of testing and calibration, and it is able to measure >3 MeV electrons and >35 MeV protons with high efficiency. With an overall expected mission duration of >5 years, and together with other similar missions planned in the coming years, measurements from HEPD could enable the testing and validation of the aforementioned models. In this work, we have used orbital information from CSES-01 and the AP9 model to estimate the flux of trapped protons over the South Atlantic Anomaly (SAA) during a short testing period, i.e., January 1, 2021, in order to assess the radiation level at CSES orbit in view of a comparison to experimental HEPD data in a forthcoming publication. A brief description of the South Atlantic Anomaly is given in Section 2, while some details on the CSES mission and the HEPD payload are given in Section 3. The analysis is described in Section 4, results are presented in Section 5, and, finally, a brief discussion is presented in Section 6.

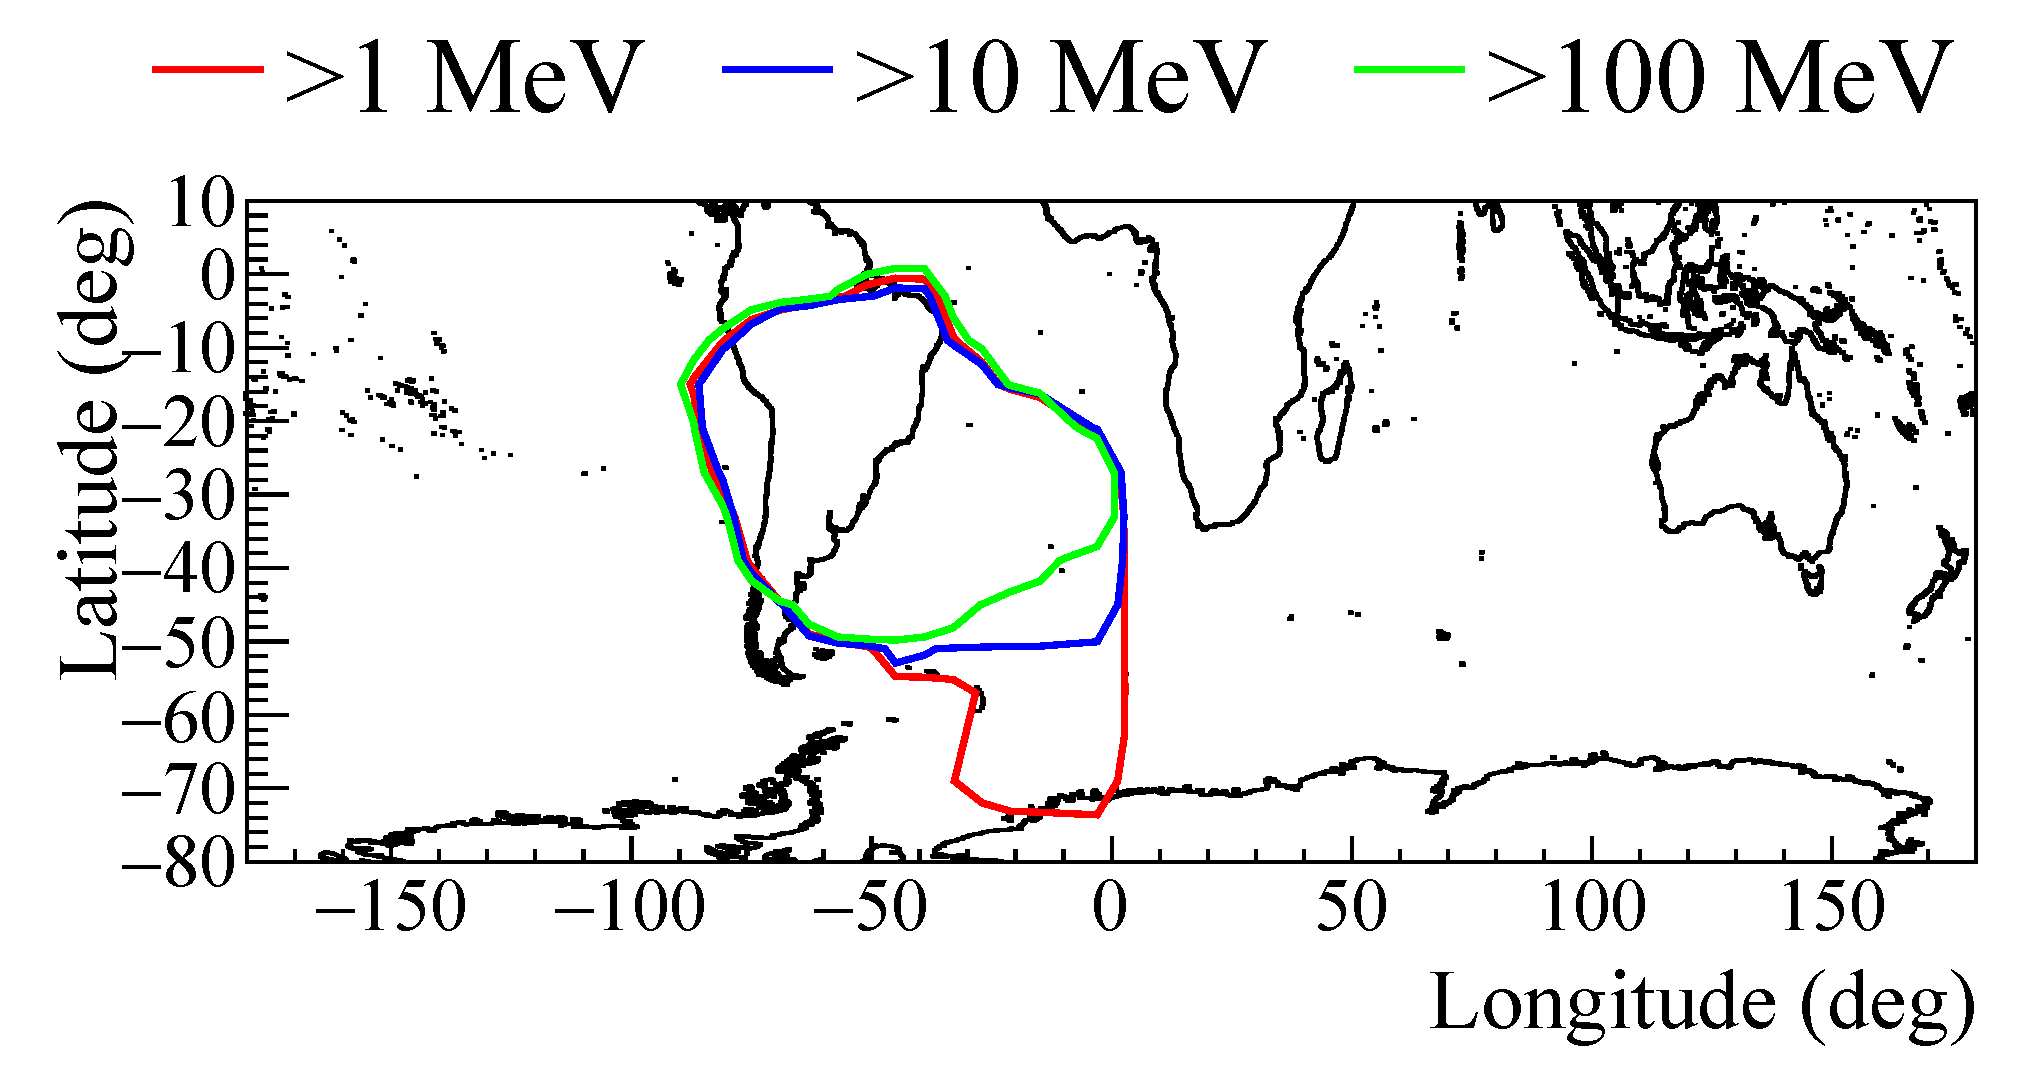
2. The South Atlantic Anomaly

The South Atlantic Anomaly (SAA) is one of the most well-known features of the Earth’s magnetic field. It emerges as a consequence of the tilt (∼10 ) between the magnetic dipole axis of the Earth and its rotational axis and of the offset (∼500 km) between the dipole and the Earth centers. It can be considered as the response of an inverse flux path at the core–mantle boundary of the radial component of the geomagnetic field—located approximately under the South Atlantic Ocean, which generates the hemisphere asymmetry of the Earth’s magnetic field [14]; this region is characterized by an extremely low intensity of the geomagnetic field, and its behavior suggests that this asymmetry could be connected to the general decrease of the dipolar field and to the significant increase of the non-dipolar field in the Southern Atlantic region [15,16]. The extent area of the SAA at the surface of the Earth has been continuously growing since instrumental intensity measurements were made available. Several studies relate this as an indicator of a possible upcoming geomagnetic transition (excursion or reversal). It is generally accepted that such transitions are anticipated by flux patches of reversed polarity, slowly appearing at low- or mid-latitude, which migrate towards the pole [17,18].
The spatial and temporal evolution of the geomagnetic field has been monitored since 1832, when Carl-Friedrich Gauss performed the first intensity measurements in this region [19]. It has been shown that the magnetic dipole strength has been continuously decreasing [20], and data from the Swarm mission [21] revealed that two different patches are present over South America and near the coast of Africa, the latter growing at a rate of −2.54 × 10 5 nT per century [22]. A correct modelization of the SAA is of capital importance due to the high impact it has on human health and on instrumental efficiency [23]. Furthermore, recent studies indicate that the extent of the anomaly follows a log-periodic acceleration, resembling the behavior of a system that moves toward a critical transition [24].

3. The CSES Scientific Mission

The China Seismo-Electromagnetic Satellite (CSES-01) [25] is the first of a series of multi-instrument monitoring satellites scheduled for launch in the next few years; it is designed to study the near-Earth environment, addressing variations of the electromagnetic field, plasma parameters, and particle fluxes linked to natural sources or artificial emitters. The main scientific objective of this mission—resulting from a Chinese/Italian joint effort—is to investigate possible correlations between the aforementioned perturbations and the occurrence of high-magnitude seismic events, but it is also well suited for studying a wide variety of space-weather phenomena triggered by solar–terrestrial interactions on short (i.e., geomagnetic storms, solar particle events, etc.) and long time-scales (i.e., cosmic-ray propagation, composition, etc.) [26,27]. A recent perspective [28] explained that claims based on self-organized criticality stating that at any moment any small earthquake can eventually cascade to a large event do not stand in view of the results obtained by natural time analysis [29,30]. The CSES-01 satellite, based on the Chinese 3-axis-stabilized CAST2000 platform (total mass ∼ 700 kg), is flying on a sun-synchronous polar orbit at a ∼507 km altitude, with a 97 inclination, a period of 94.6 min, and a 5-day revisiting periodicity. Nine scientific payloads are present on board CSES: two sets of particle detectors, namely, the High-Energy Particle Package (HEPP) [31] and the High-Energy Particle Detector (HEPD) [32]; a High-Precision Magnetometer (HPM) [33]; a Search-Coil Magnetometer (SCM) [34]; an Electric Field Detector (EFD) [35]; a Global Navigation Satellite System (GNSS) Occultation Receiver [36]; a Langmuir Probe (LAP) [37]; a Tre-Band Beacon transmitter (TBB) [38]; and a Plasma Analyzer Package (PAP) [39].

The High-Energy Particle Detector

The High-Energy Particle Detector (HEPD) is a light and compact (40.36 cm × 53.00 cm × 38.15 cm, total mass ∼45 kg) payload designed and built by the Limadou team, the Italian branch of the CSES Collaboration. The apparatus is made up of a series of sub-detectors:
  • A tracking system, including two 213.2 mm × 214.8 mm × 0.3 mm double-sided silicon microstrip planes. Each silicon plane is divided into three identical independent sections, each of which containing two silicon sensors.
  • A trigger system, consisting of one EJ-200 plastic scintillator layer segmented into six paddles (20 cm × 3 cm × 0.5 cm apiece), each one read out by two Photo-Multiplier Tubes (PMTs).
  • A range calorimeter composed of two sections: The upper part is a tower of 16 EJ-200 plastic scintillator planes (15 cm × 15 cm × 1 cm), each one read out by two PMTs. The lower part is a 3 × 3 matrix of Lutetium-Yttrium Oxyorthosilicate (LYSO) inorganic scintillator crystals—5 cm × 5 cm × 4 cm each; each of the nine crystals is read out by one PMT located at its bottom side; and
  • an anti-coincidence (VETO) system composed of five EJ-200 plastic scintillator planes (0.5 cm thick), each one read out by two PMTs.
The instrument is optimized to detect electrons in the 3 to 100 MeV energy range and protons between 35 and 250 MeV, as well as light nuclei. In these three years of flight, after a long period of calibration and testing, HEPD has been able to measure fluxes of low-energy galactic protons with great precision [40] and to observe the effects of the geomagnetic storm of August 2018 [41]. All the capabilities assessed in these years make HEPD well suited for the analysis of low-energy electrons and protons with good angular resolution and stability over time, which is particularly useful in highly anisotropic flux conditions like the ones encountered in SAA. More technical details can be found in [32,42,43].

4. Materials and Methods

The AE9/AP9/SPM set of models (version V1.50.001-release date December 2017) was downloaded from the Virtual Distributed Laboratory (VDL) website of the Air Force Research Laboratory (https://www.vdl.afrl.af.mil/programs/ae9ap9/, accessed on 1 February 2021). Element Set (ELSET) data—including Two-Line Elements (TLE) for the CSES satellite on 1 January 2021—have been retrieved from the Space-Track website (https://www.space-track.org/, accessed on 1 February 2021) and inserted in the code to generate the ephemeris of the satellite (at a 5 s resolution). The Simplified General Perturbations (SGP4) (the SGP4 propagator considers secular and periodic variations due the oblateness of the Earth, gravitational effects from Sun and Moon, and orbital drag and decay.) propagator has been preferred to the default Kepler with J2 perturbation effects, for cross-checking purposes. Indeed, these orbital results have been further compared to the ones obtained using 2-min broadcast information downloaded from the satellite itself, to verify the correctness of the procedure. This cross-check includes the following:
  • TLEs propagation using a chain of custom programs (including various SGP4 routines) to comply with the technique employed by the AE9/AP9 models;
  • IGRF-13 [20] model-based routines have been applied to the calculated trajectory to reconstruct the intensity of the magnetic field at a 1 second resolution, together with McIllwain’s L parameter in dipolar approximation [44]; these will be useful benchmarks in the future comparison to HEPD data.
After these steps, two sets of geographical/geomagnetic coordinates have been obtained: one calculated by NASA routines and another extracted by Limadou external routines used for trajectory propagation and magnetic field reconstruction since launch. A comparison between such datasets has been performed to assure the best possible agreement over the chosen testing period—1 January 2021. The resulting discrepancies are <0.08% for LATs/LONs, <0.13% for altitude, and <0.21% for magnetic field intensity. Small discrepancies are probably due to the models using the last TLE entry for orbit propagation, unlike external code picking the TLE closest in time. After ephemeris generation, an omnidirectional differential spectrum of trapped protons as a function of kinetic energy was created using AP9. This spectrum, averaged over all orbits of a single day, is shown in Figure 1; the blue arrow represents the HEPD low-energy thresholds for protons (30 MeV). Inside the inner radiation belt, trapped electron populations present a sharp threshold at ∼8 MeV, thus electrons of higher energy are virtually nonexistent. This means that in our future analysis, trapped protons will not be affected by any low-energy electrons contamination inside the SAA, consequently improving HEPD sensitivity to protons measurements.
The AP9 model could also be very useful to help define a fiducial area on the Earth’s surface (longitude vs. latitude) that may be applied to the future HEPD data analysis of trapped particles. However, the geographical extension of the inner belt (and consequently of the SAA) is largely dependent on energy, as shown in Figure 2. The surface contours for the >1, >10, and >100 MeV trapped protons are depicted as red, blue, and green curves, respectively, in the panel. These contours highlight how the low-energy trapped proton component is distributed in the southern regions of the SAA-even superimposing to the outer belt, while higher energy populations are more clearly enclosed in the classical boundaries of the inner belt, i.e., in the area above Brazil and the Atlantic Ocean.
For a further, more precise comparison with experimental HEPD data, four different 20 min orbit portions were selected among those crossing the SAA, in order to build the related time-profiles of protons at various energies (With a period of 94.6 min, the satellite makes ~15 complete orbits per day.):
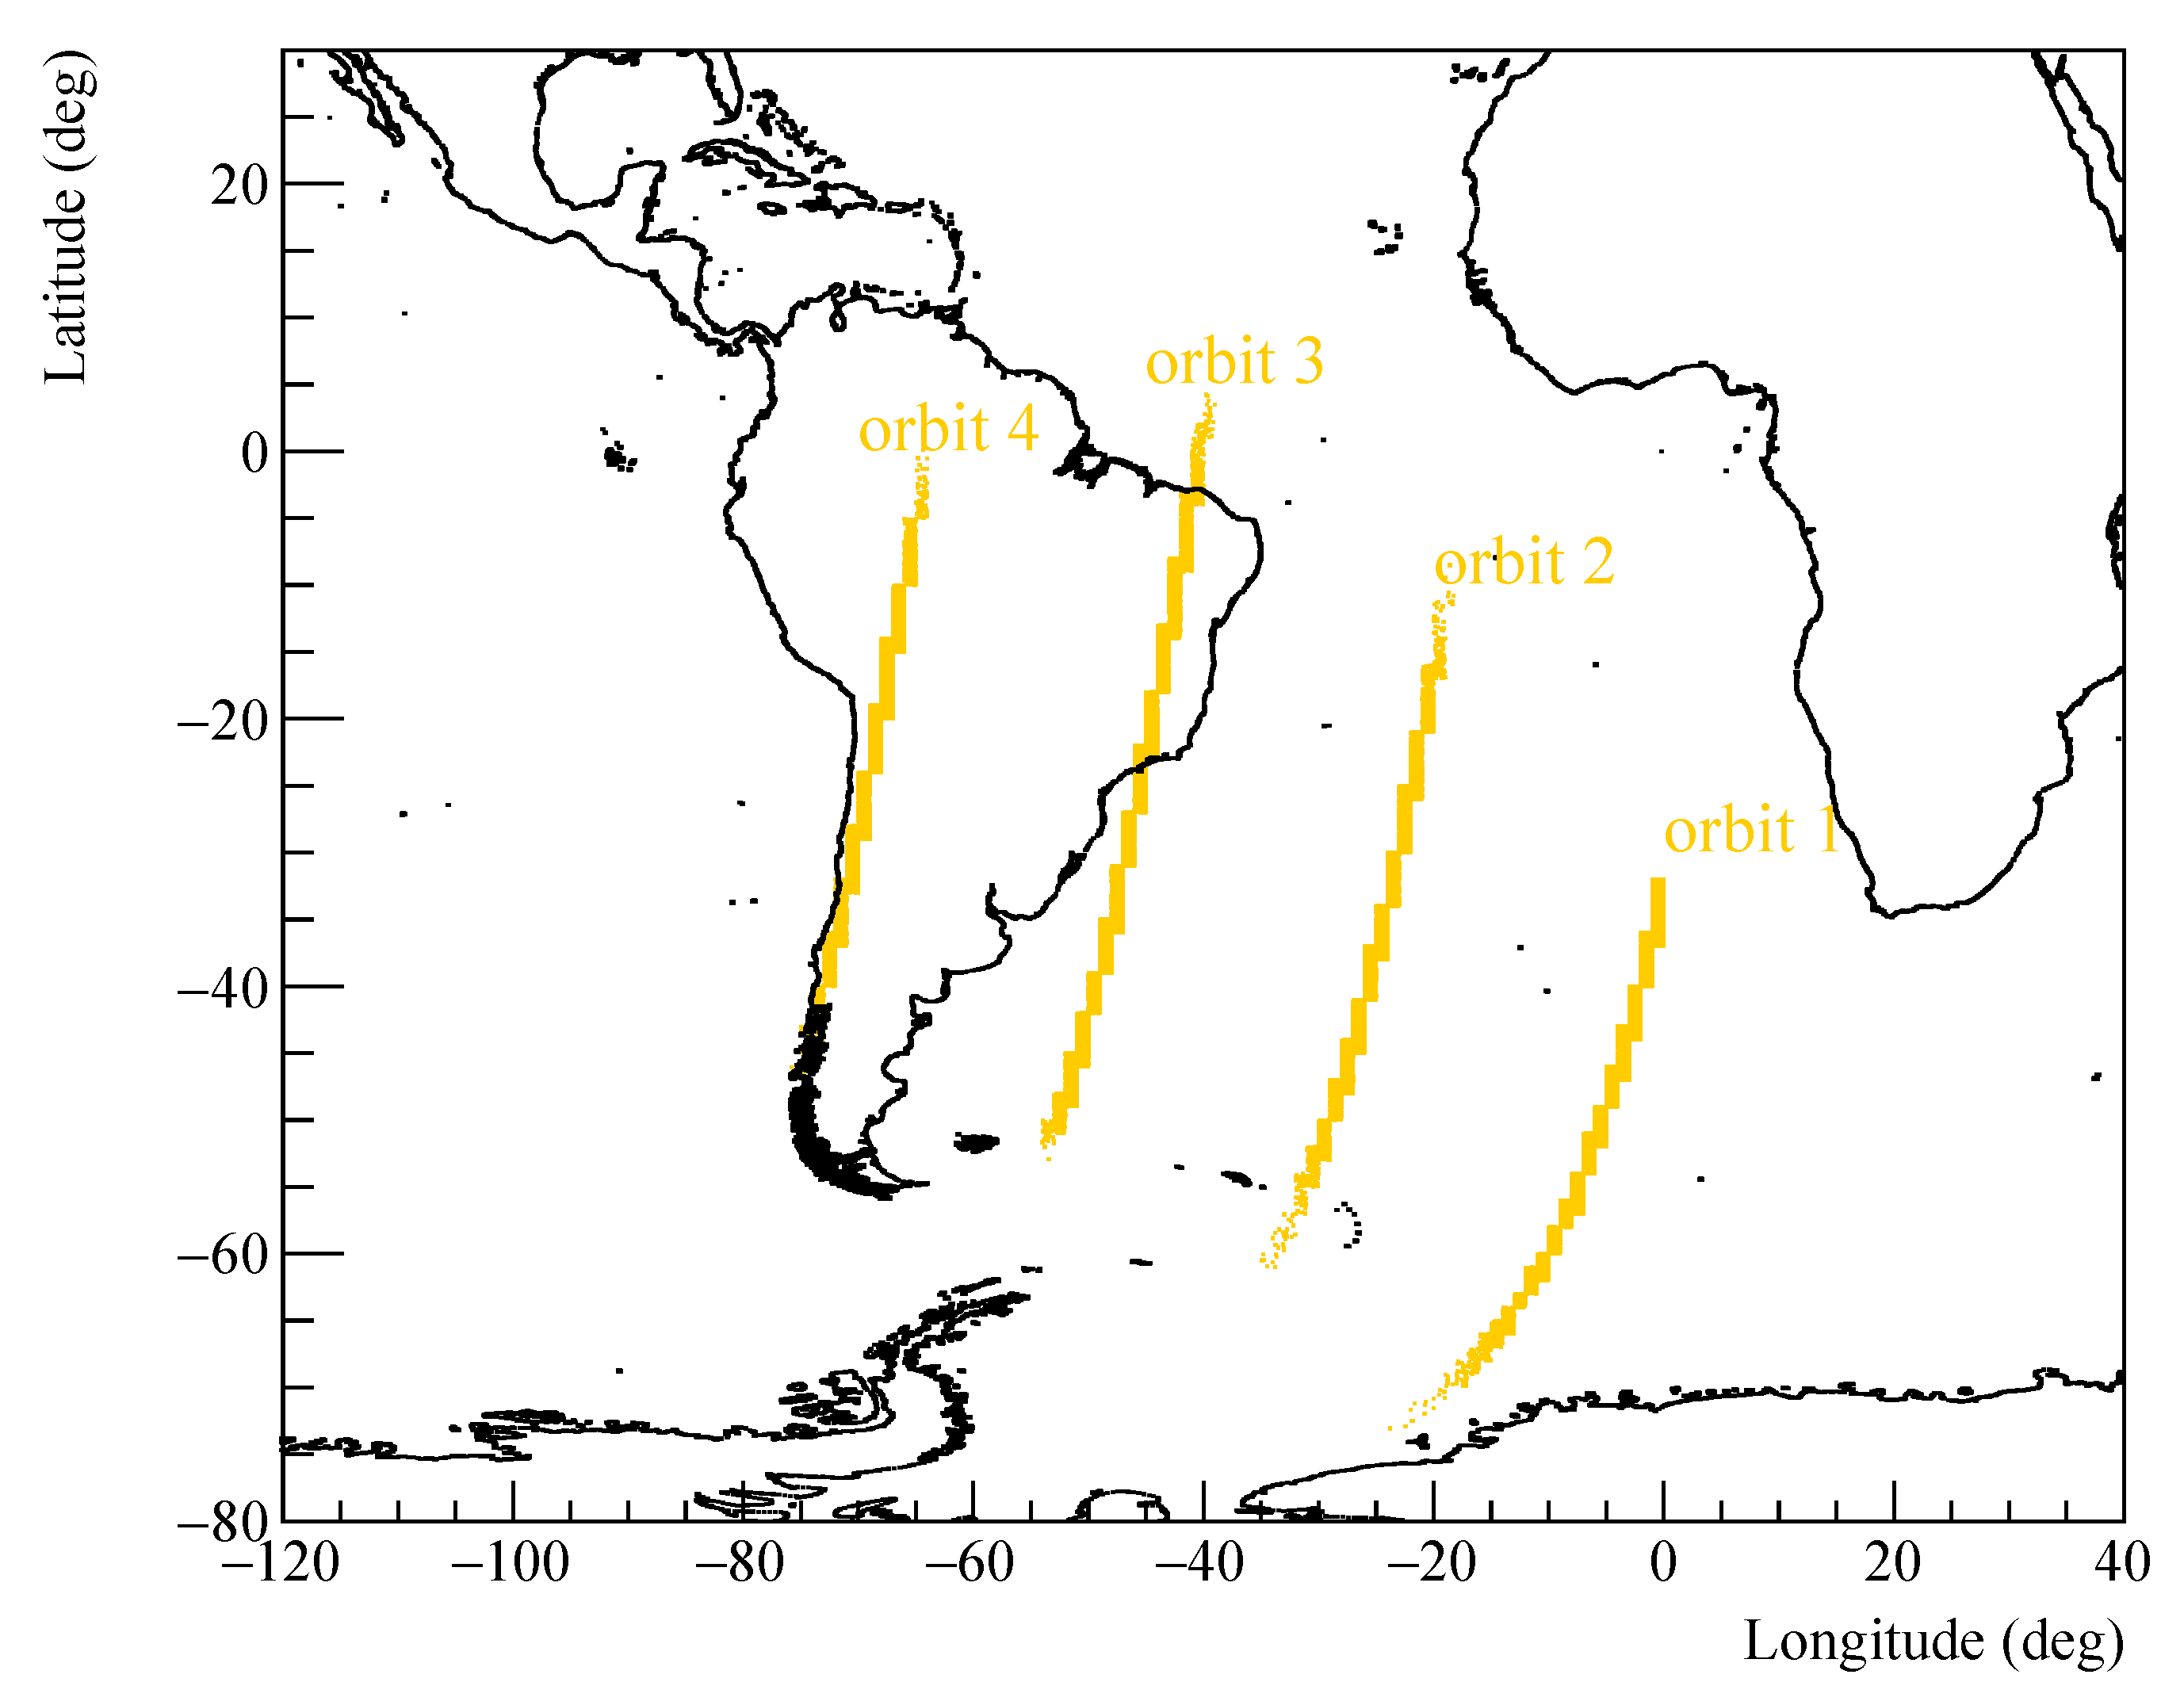
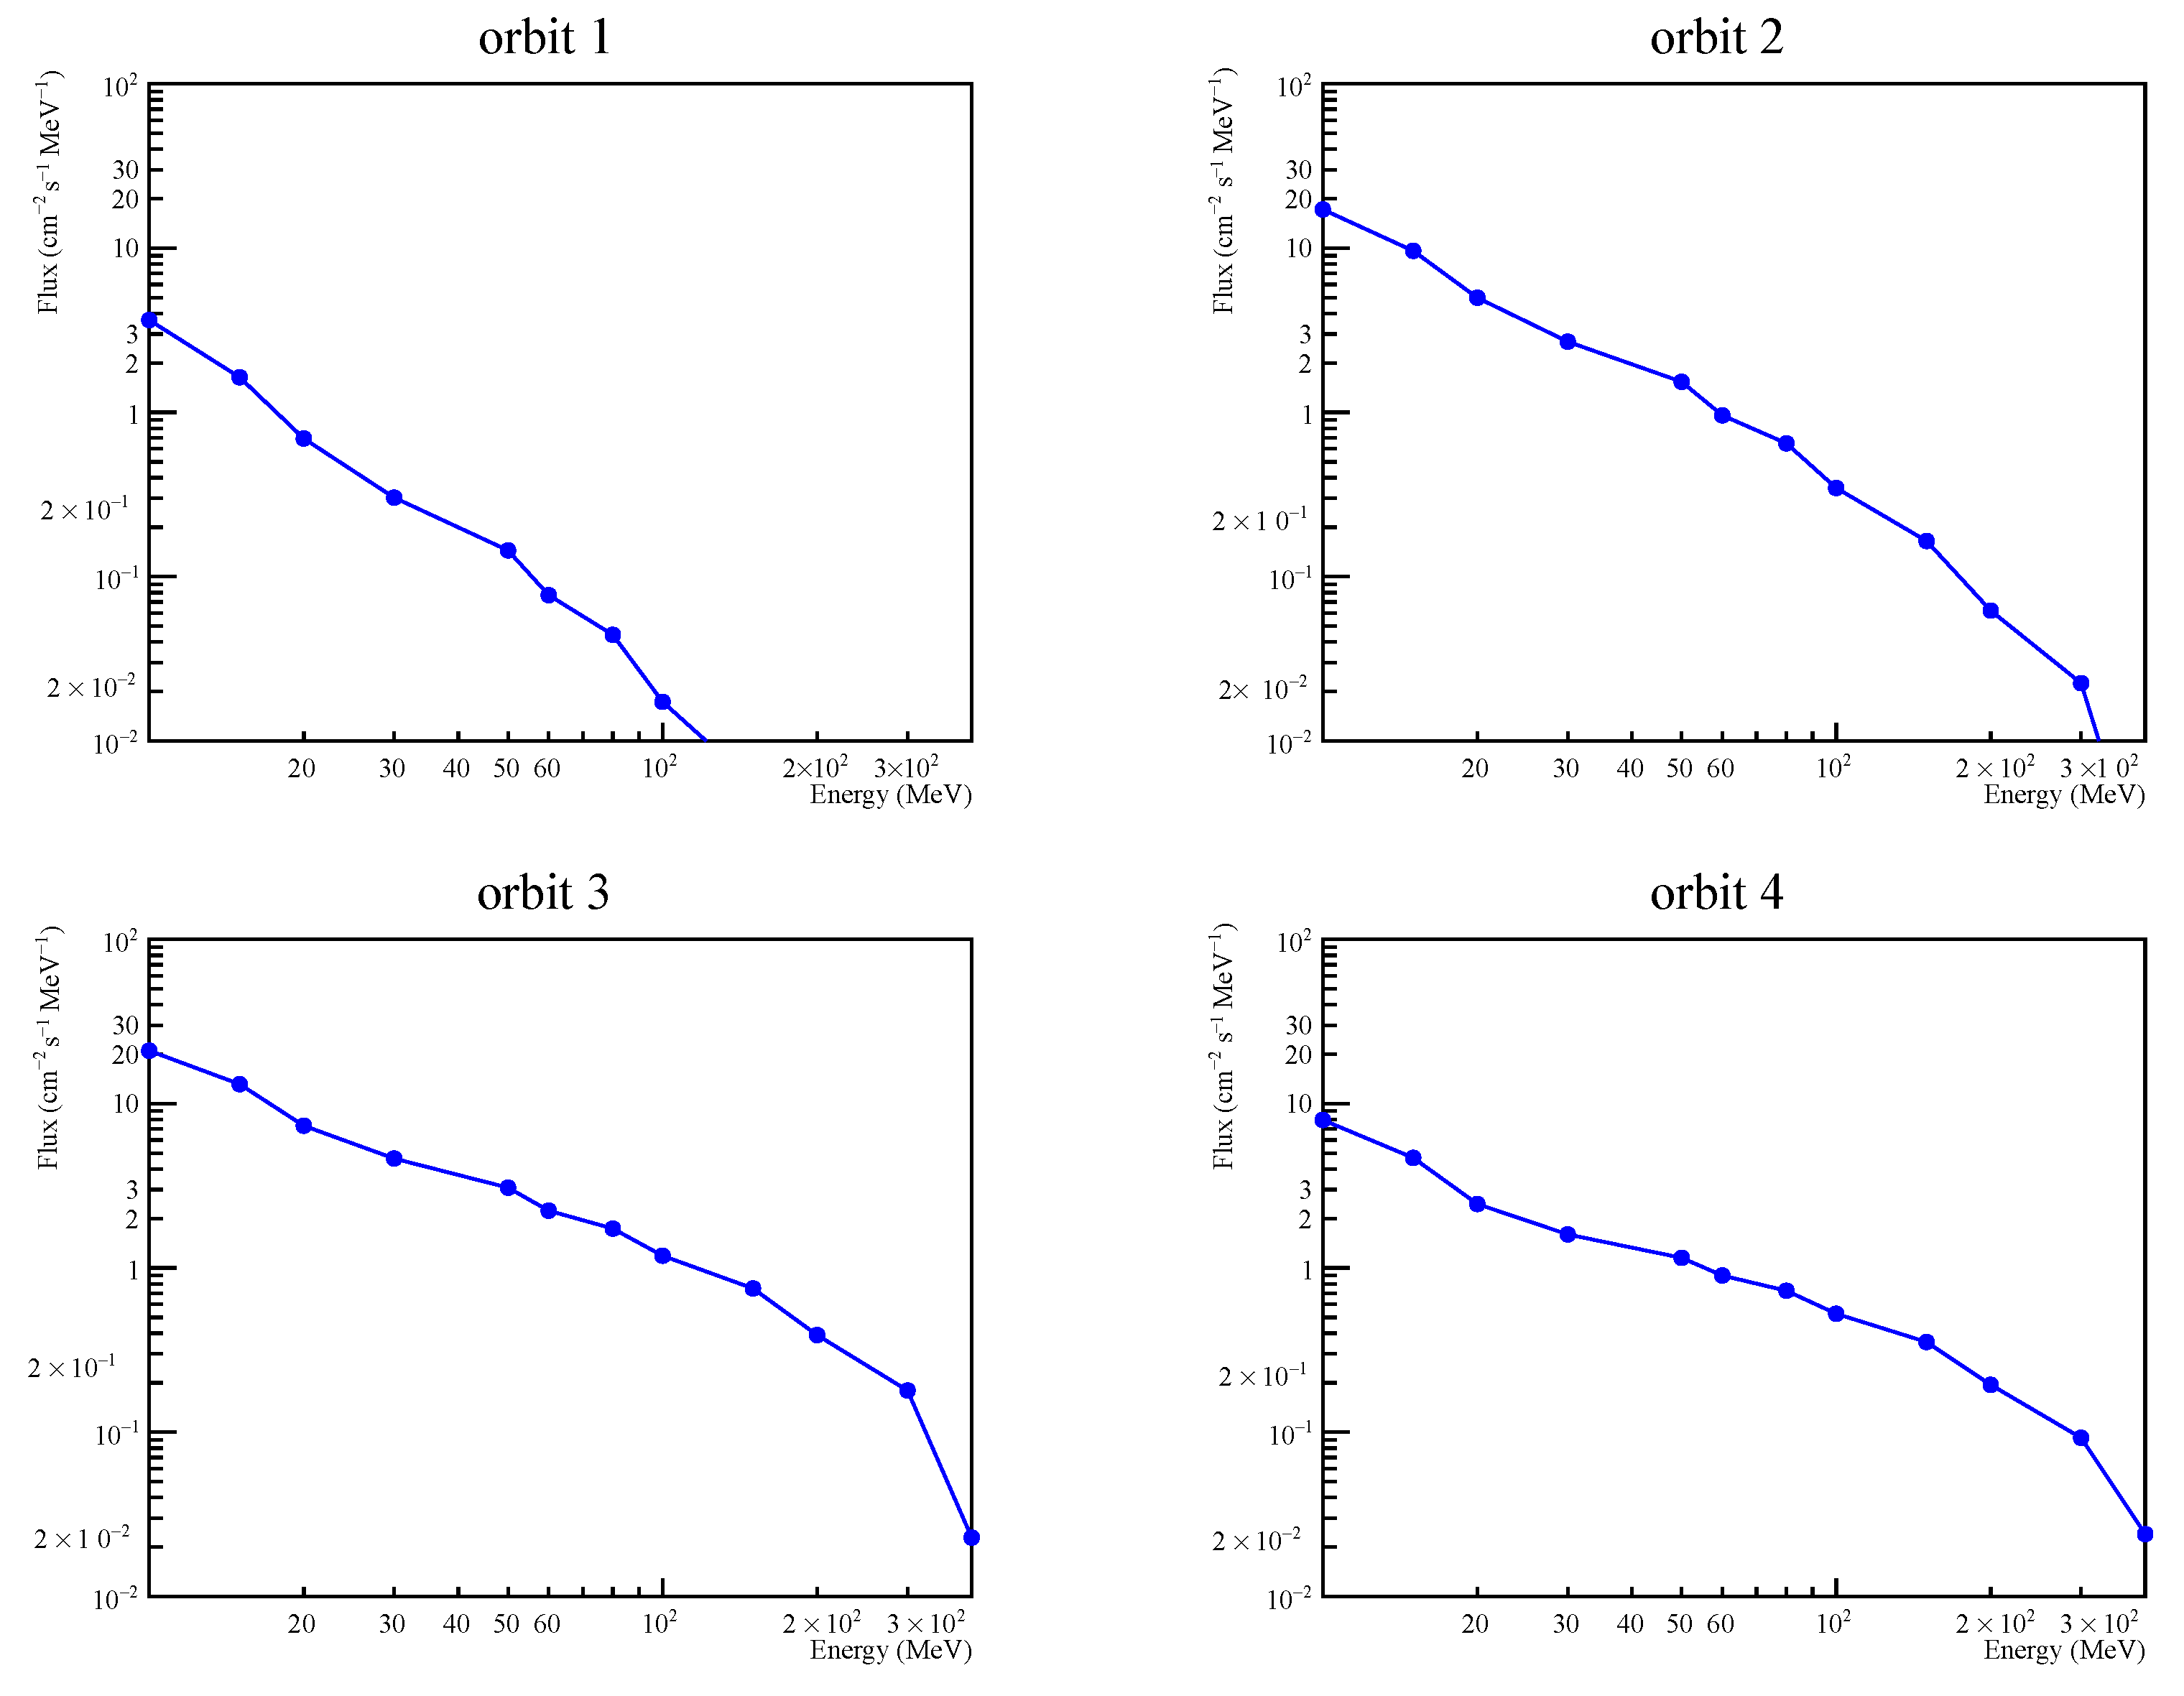
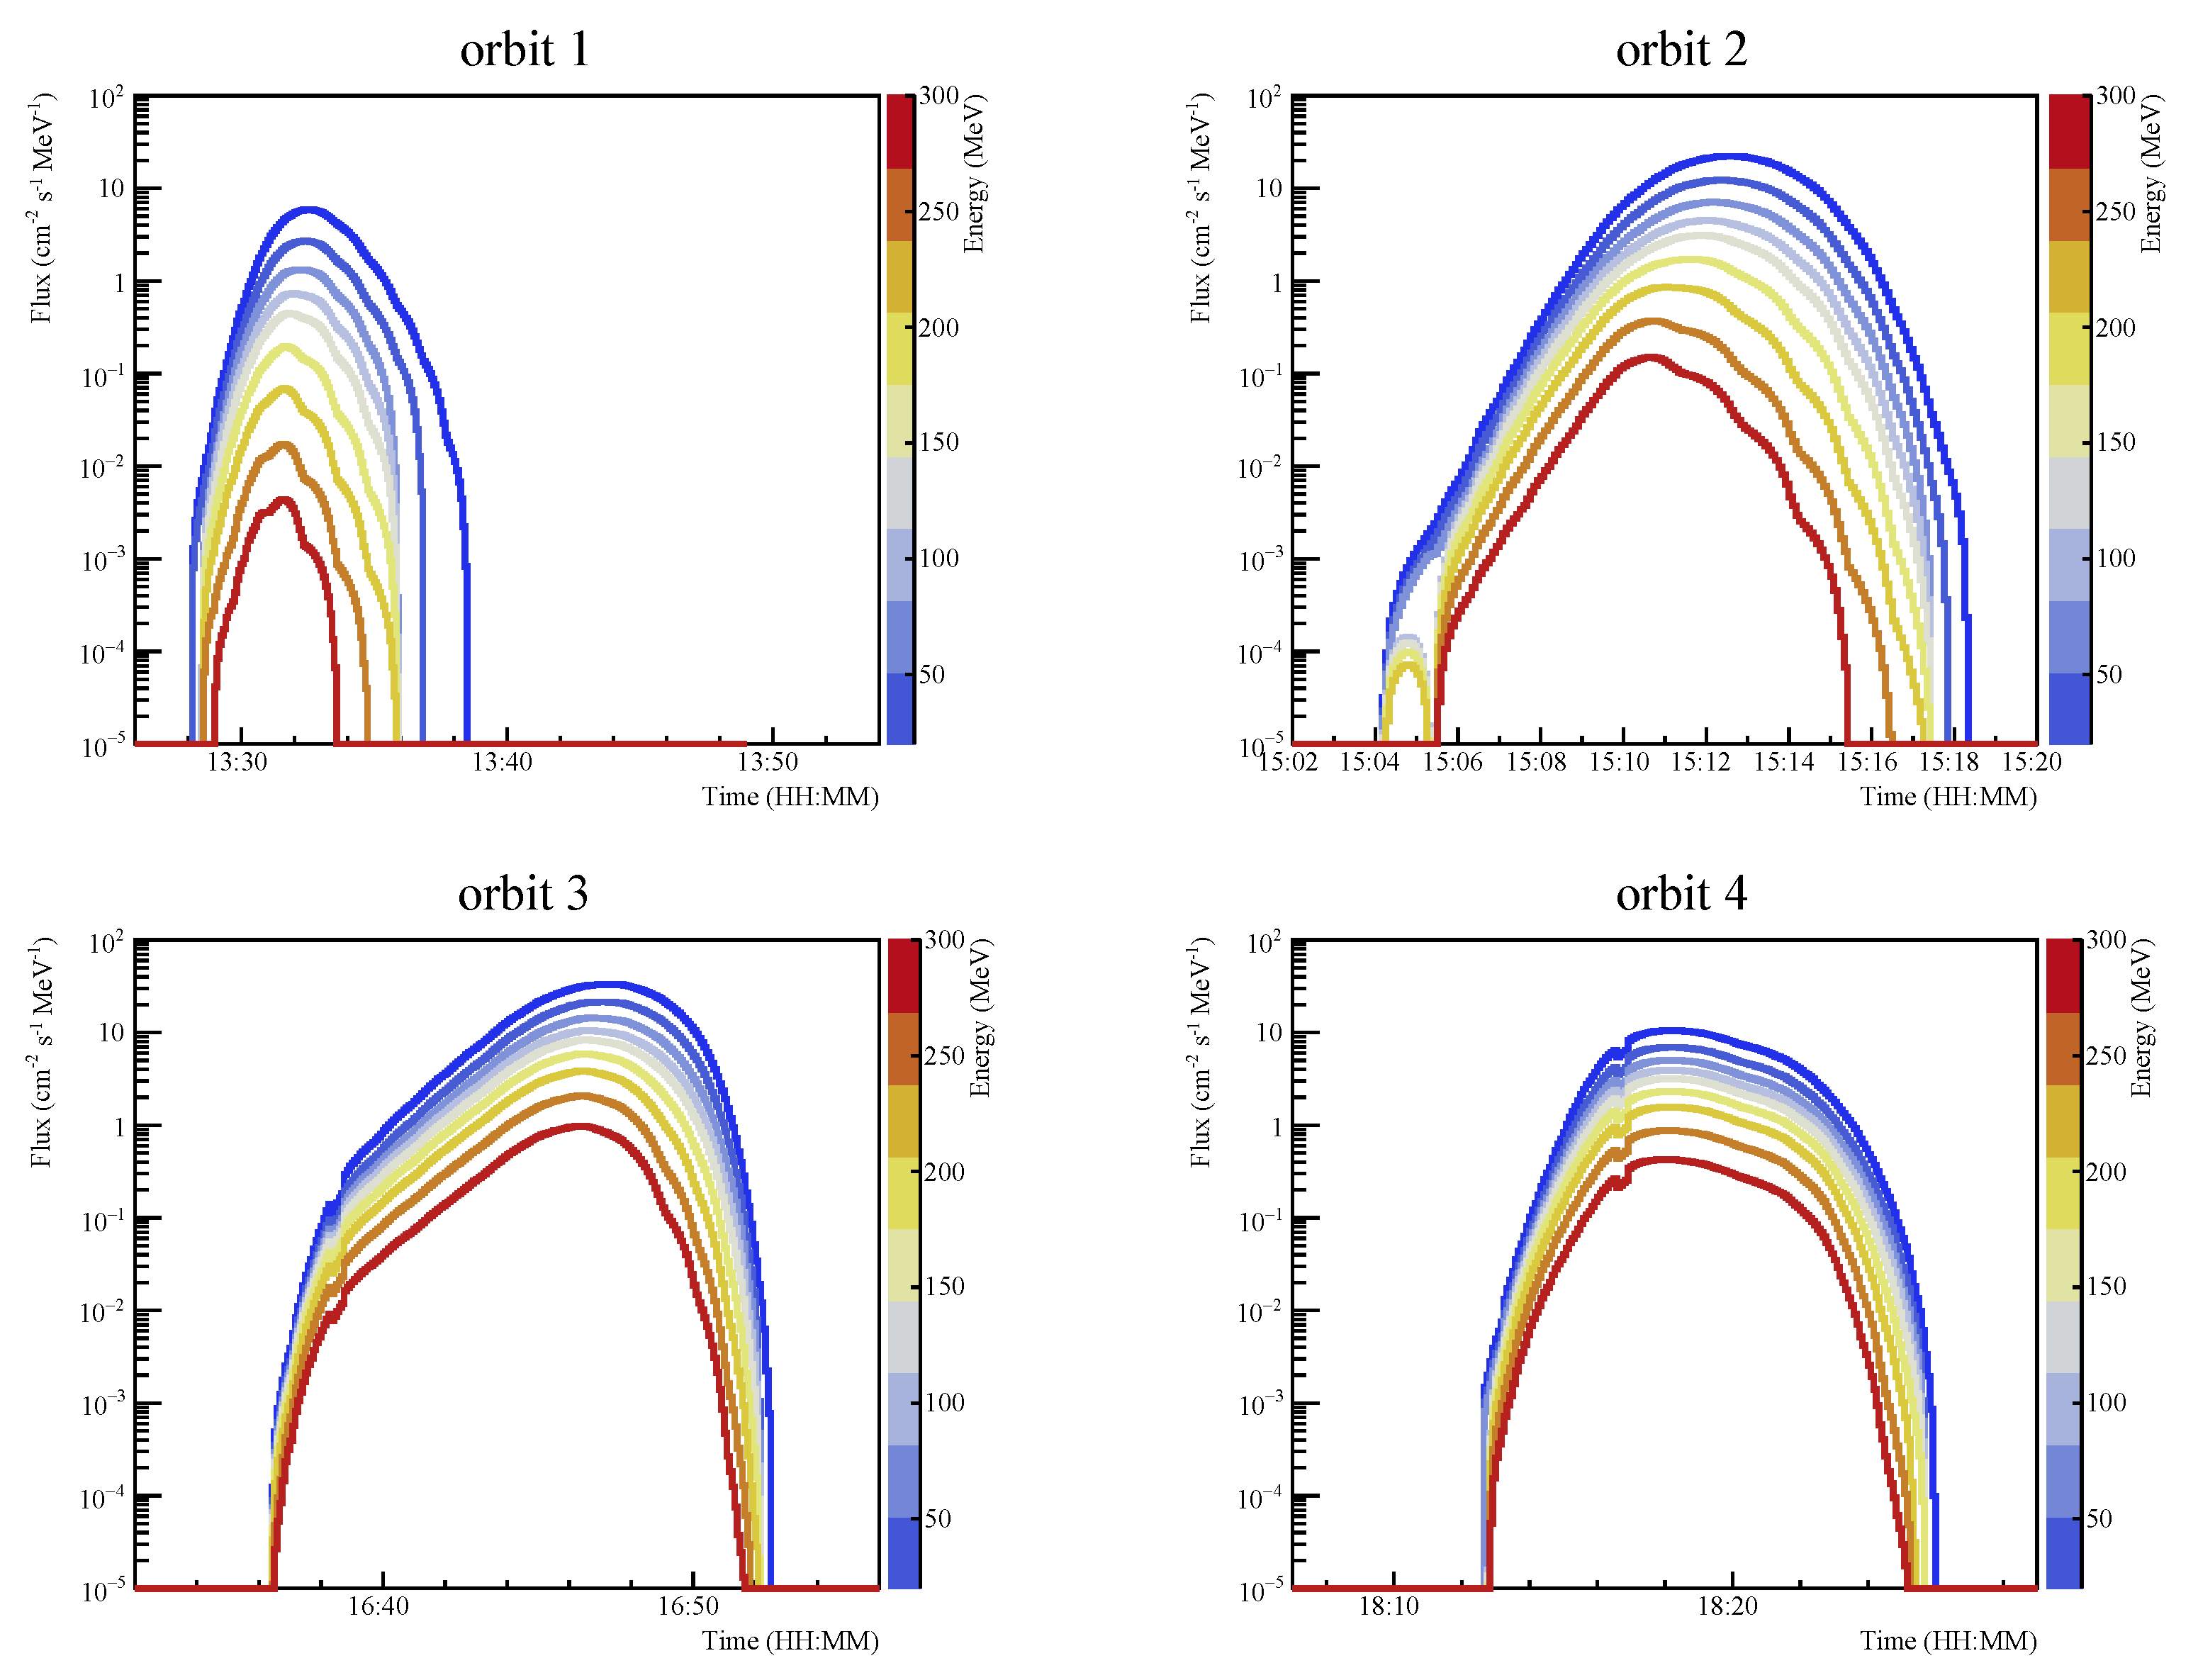
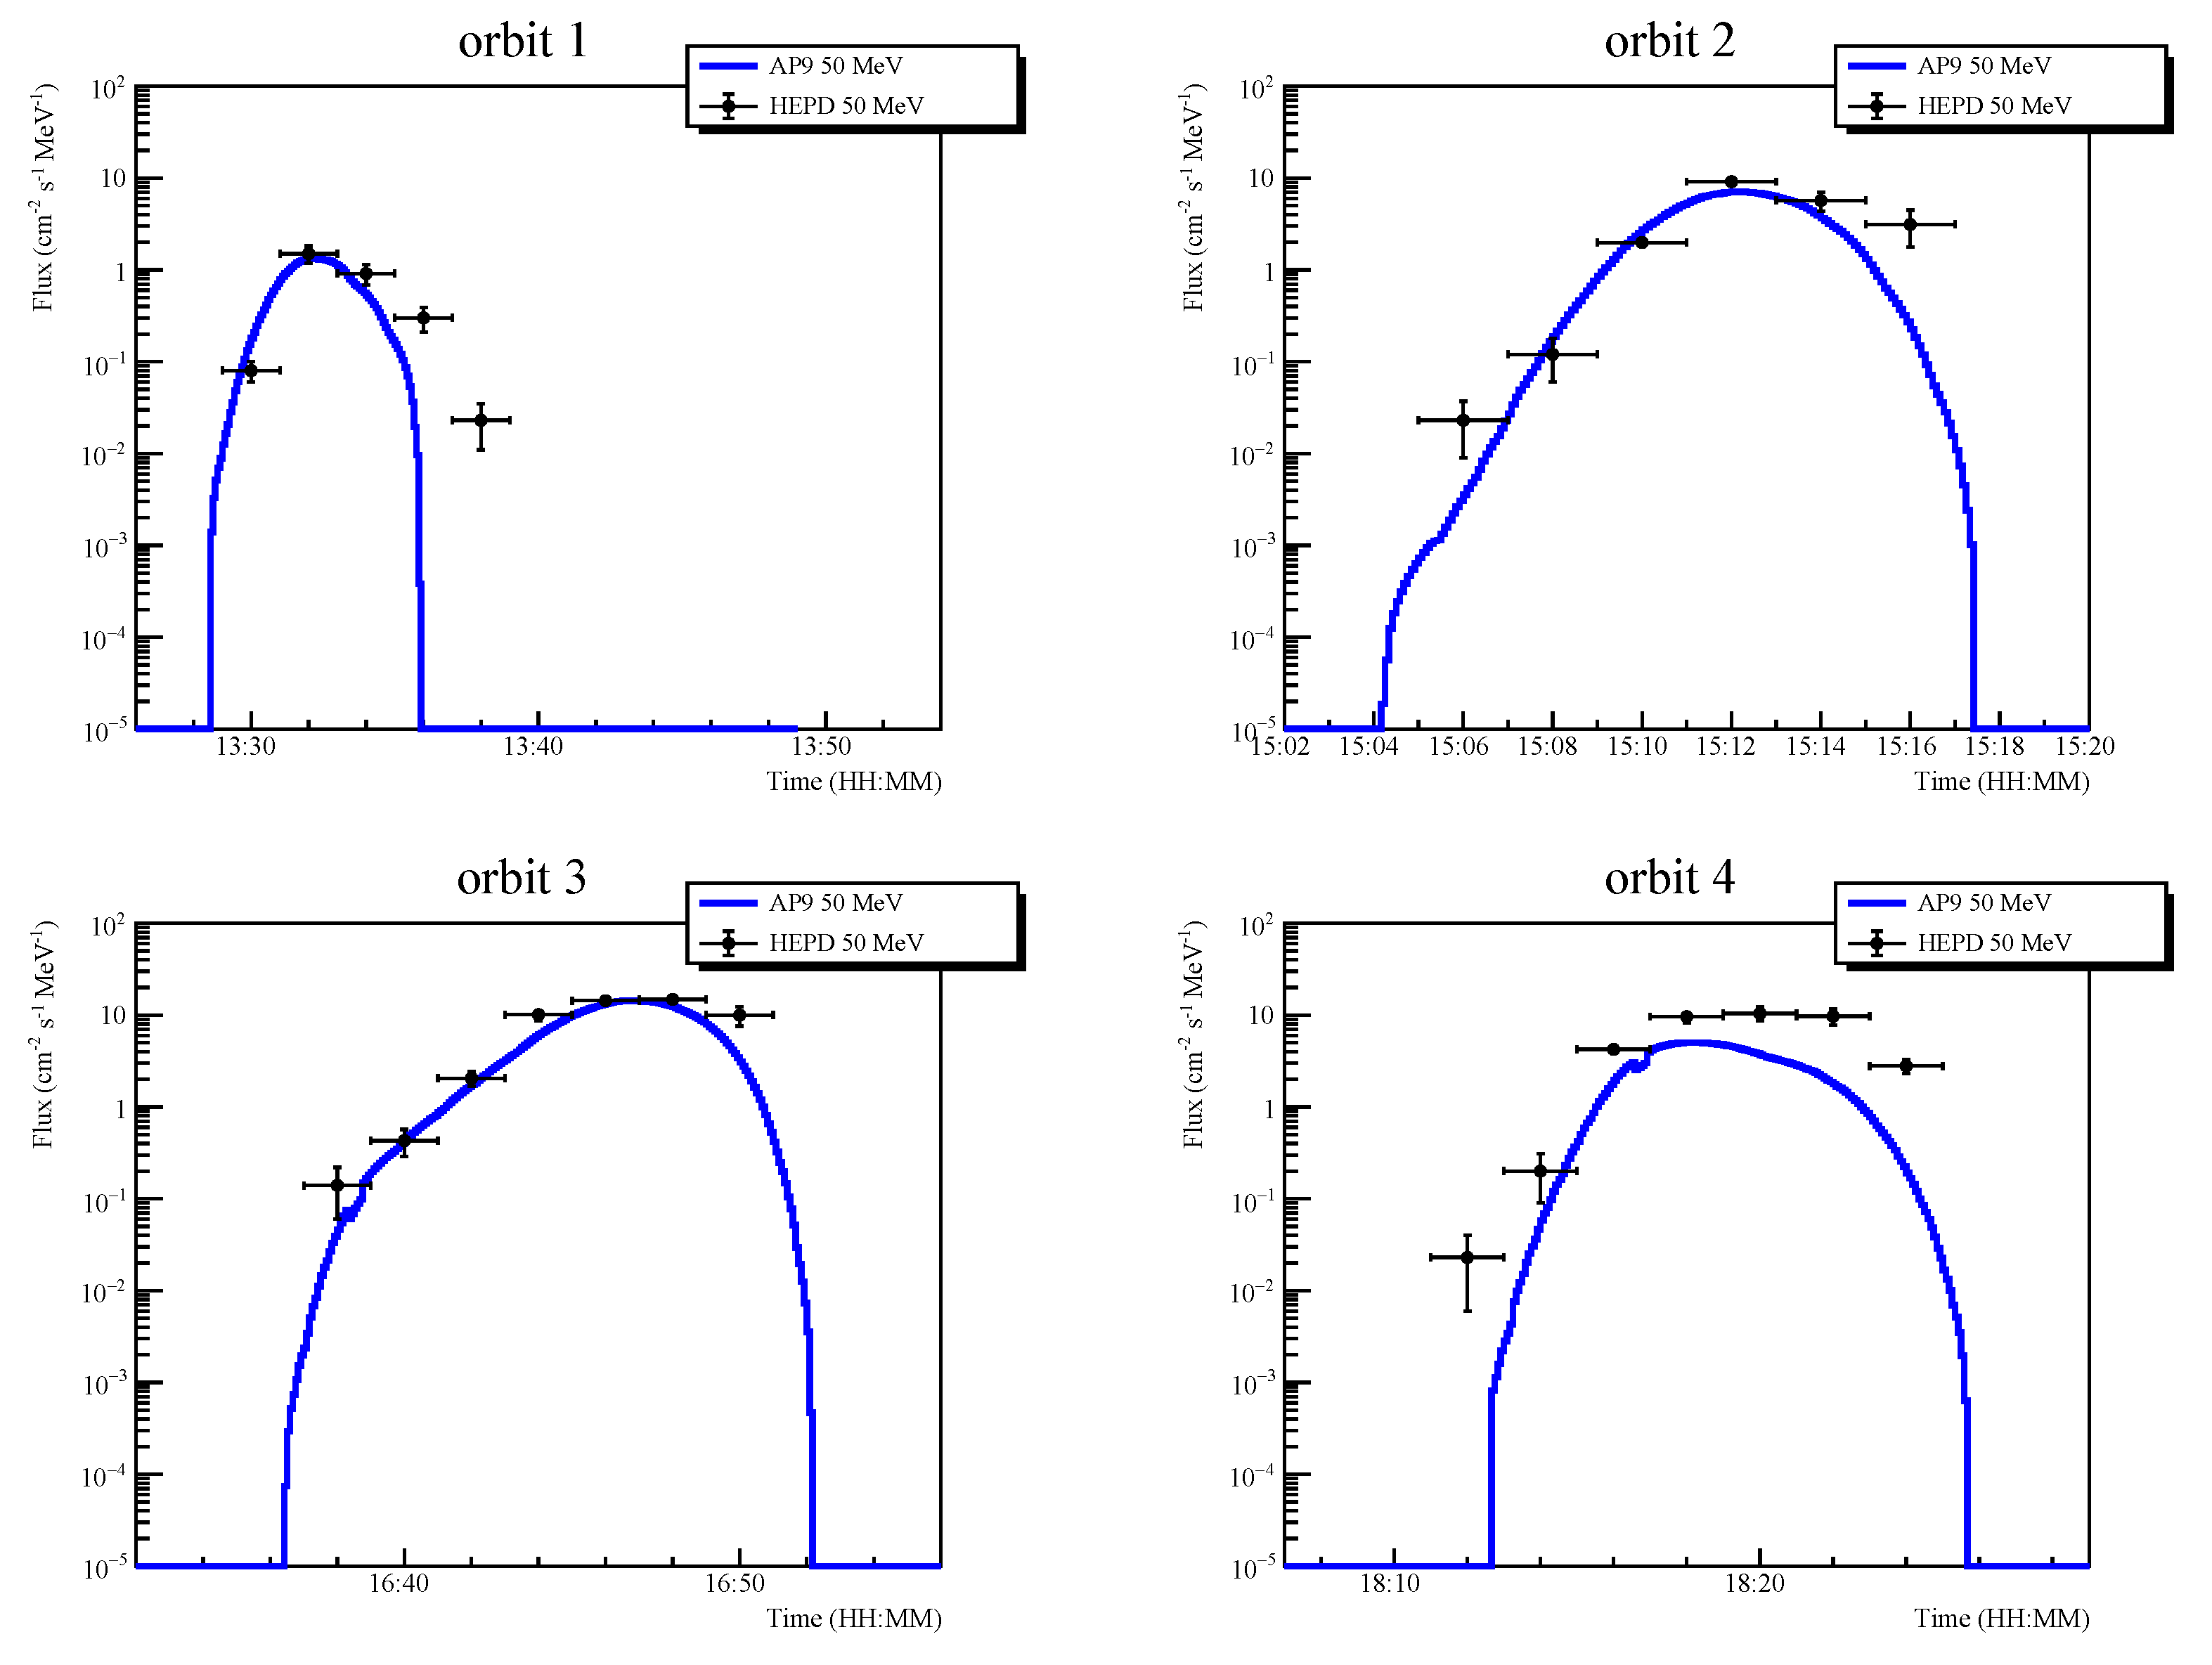
  • orbit 1-13:26:00/13:54:00
  • orbit 2-15:02:00/15:20:00
  • orbit 3-16:32:00/16:56:00
  • orbit 4-18:07:00/18:29:00
These passages over the SAA are represented in Figure 3 as a function of the geographical coordinates; while orbit 1 crosses the SAA in the outermost and peripheral region, orbit 3 crosses the bulk of the Anomaly, where particle fluxes are expected to be higher.

5. Results

The differential, omnidirectional energy spectra of trapped protons along the four portions of orbits depicted in Figure 3, all generated by the AP9 model, are shown in Figure 4. As energy increases, the spectrum in each orbit decreases with a somewhat different steepness, as expected. This is, in fact, due to the different aspects of the trapping mechanism, which is the resulting effects of cosmic ray albedo neutron decay (CRAND), solar proton injection, and radial diffusion [45]. The CRAND mechanism is the principal trapped proton source above ∼100 MeV, and the shape of the albedo neutron vertical spectrum above the geomagnetic cut-off is very similar to the one observed in trapped protons, i.e., the spectrum is decreasing as energy increases. On the contrary, the solar injection is more relevant below ~100 MeV (and it is more important for L > 2), while the radial diffusion tends to redistribute trapped particles in different L, so its effects are more complex. As a result, the trapped proton flux is strongly anisotropic and the overall spectrum changes rapidly, heavily depending on the region (latitude, longitude, L, etc.) where it is estimated.
The time profiles (5-s resolution) for the >10 MeV trapped protons along the orbits defined above are also shown in Figure 5. In each panel, the color palette relates to the different particle energy. Note that during each portion of the CSES-01 orbits, the spectra possess a different shape as a function of time. For example, during orbit 1, trapped fluxes tend to decrease very rapidly, while for the other orbits this decrease is slower. This is due to the fact that orbit 1 crosses the SAA region only in its peripheral section, so the trapped population is only encountered for a small amount of time. Furthermore, in each panel it seems that energetic protons are more concentrated in the internal sectors of the SAA, while low-energy protons are more widely distributed and spread over a larger area; this was inferred also from Figure 2, and it is another proof of the high variability of trapped fluxes inside the inner belt.
To assess the level of agreement between the AP9 model and the experimental data, a preliminary analysis was conducted using omnidirectional ∼50 MeV calibrated proton data from HEPD, obtained following the same procedure used in [40]. As can be seen from the four panels in Figure 6, the agreement seems to be good, even if some small discrepancies are evident, mostly in the peripheral regions of the SAA; these are probably due to the different operational definition of South Atlantic Anomaly that was used to derive the data with HEPD (For the HEPD data analysis, we define the South Atlantic Anomaly as the region enclosed in a value of the magnetic field >20,000 nT.). Further studies are needed to verify the agreement even in a longer time period and with the extensive use of simulations.
For the purposes of this preliminary analysis, the uncertainties of the AP9 model—related to measurement, gap-filling, or dynamic variations due to space-weather processes—are not taken into account. A future, more complete comparison with HEPD observations will require a precise assessment of the AP9 confidence levels, in order to better evaluate the match with experimental data. Considering that CSES-01 will be operative in a period of strong minimum between the end of the 24th solar cycle and the start of the 25th, no major effect related to space weather variability is expected.

6. Discussion and Conclusions

The NASA AE9/AP9/SPM set of models represents an important approach to specify the radiation environment for modern satellite design applications. In this work, this suite of models has been employed to estimate trapped proton fluxes over the South Atlantic Anomaly for some orbits of the China Seismo-Electromagnetic Satellite on 1 January 2021. This is intended as a starting point for a future analysis that will include data from the High-Energy Particle Detector. After three years of calibration and testing, HEPD has proven capable of measuring low-energy particle fluxes (>3 MeV electrons and >35 MeV protons) with precision and stability over time; among the others, these two characteristics in particular are very suitable for the measurement of strongly anisotropic particle fluxes, such as those trapped in SAA. Thus, HEPD, together with the other payloads on board CSES (such as those of the HEPP suite), can provide excellent cross-calibration for these radiation environment models at LEO. A preliminary analysis on HEPD proton data has been conducted to assess the agreement between the AP9 model and experimental data, and it seems already acceptable, even if some discrepancies—that need to be studied—are present. It is important to remember, as already mentioned, that there is also a certain number of known issues in these models:
  • There are no reliable data for inner region electrons at energies <1 MeV and spectral/spatial extrapolation of the few existing datasets can lead to large deviations.
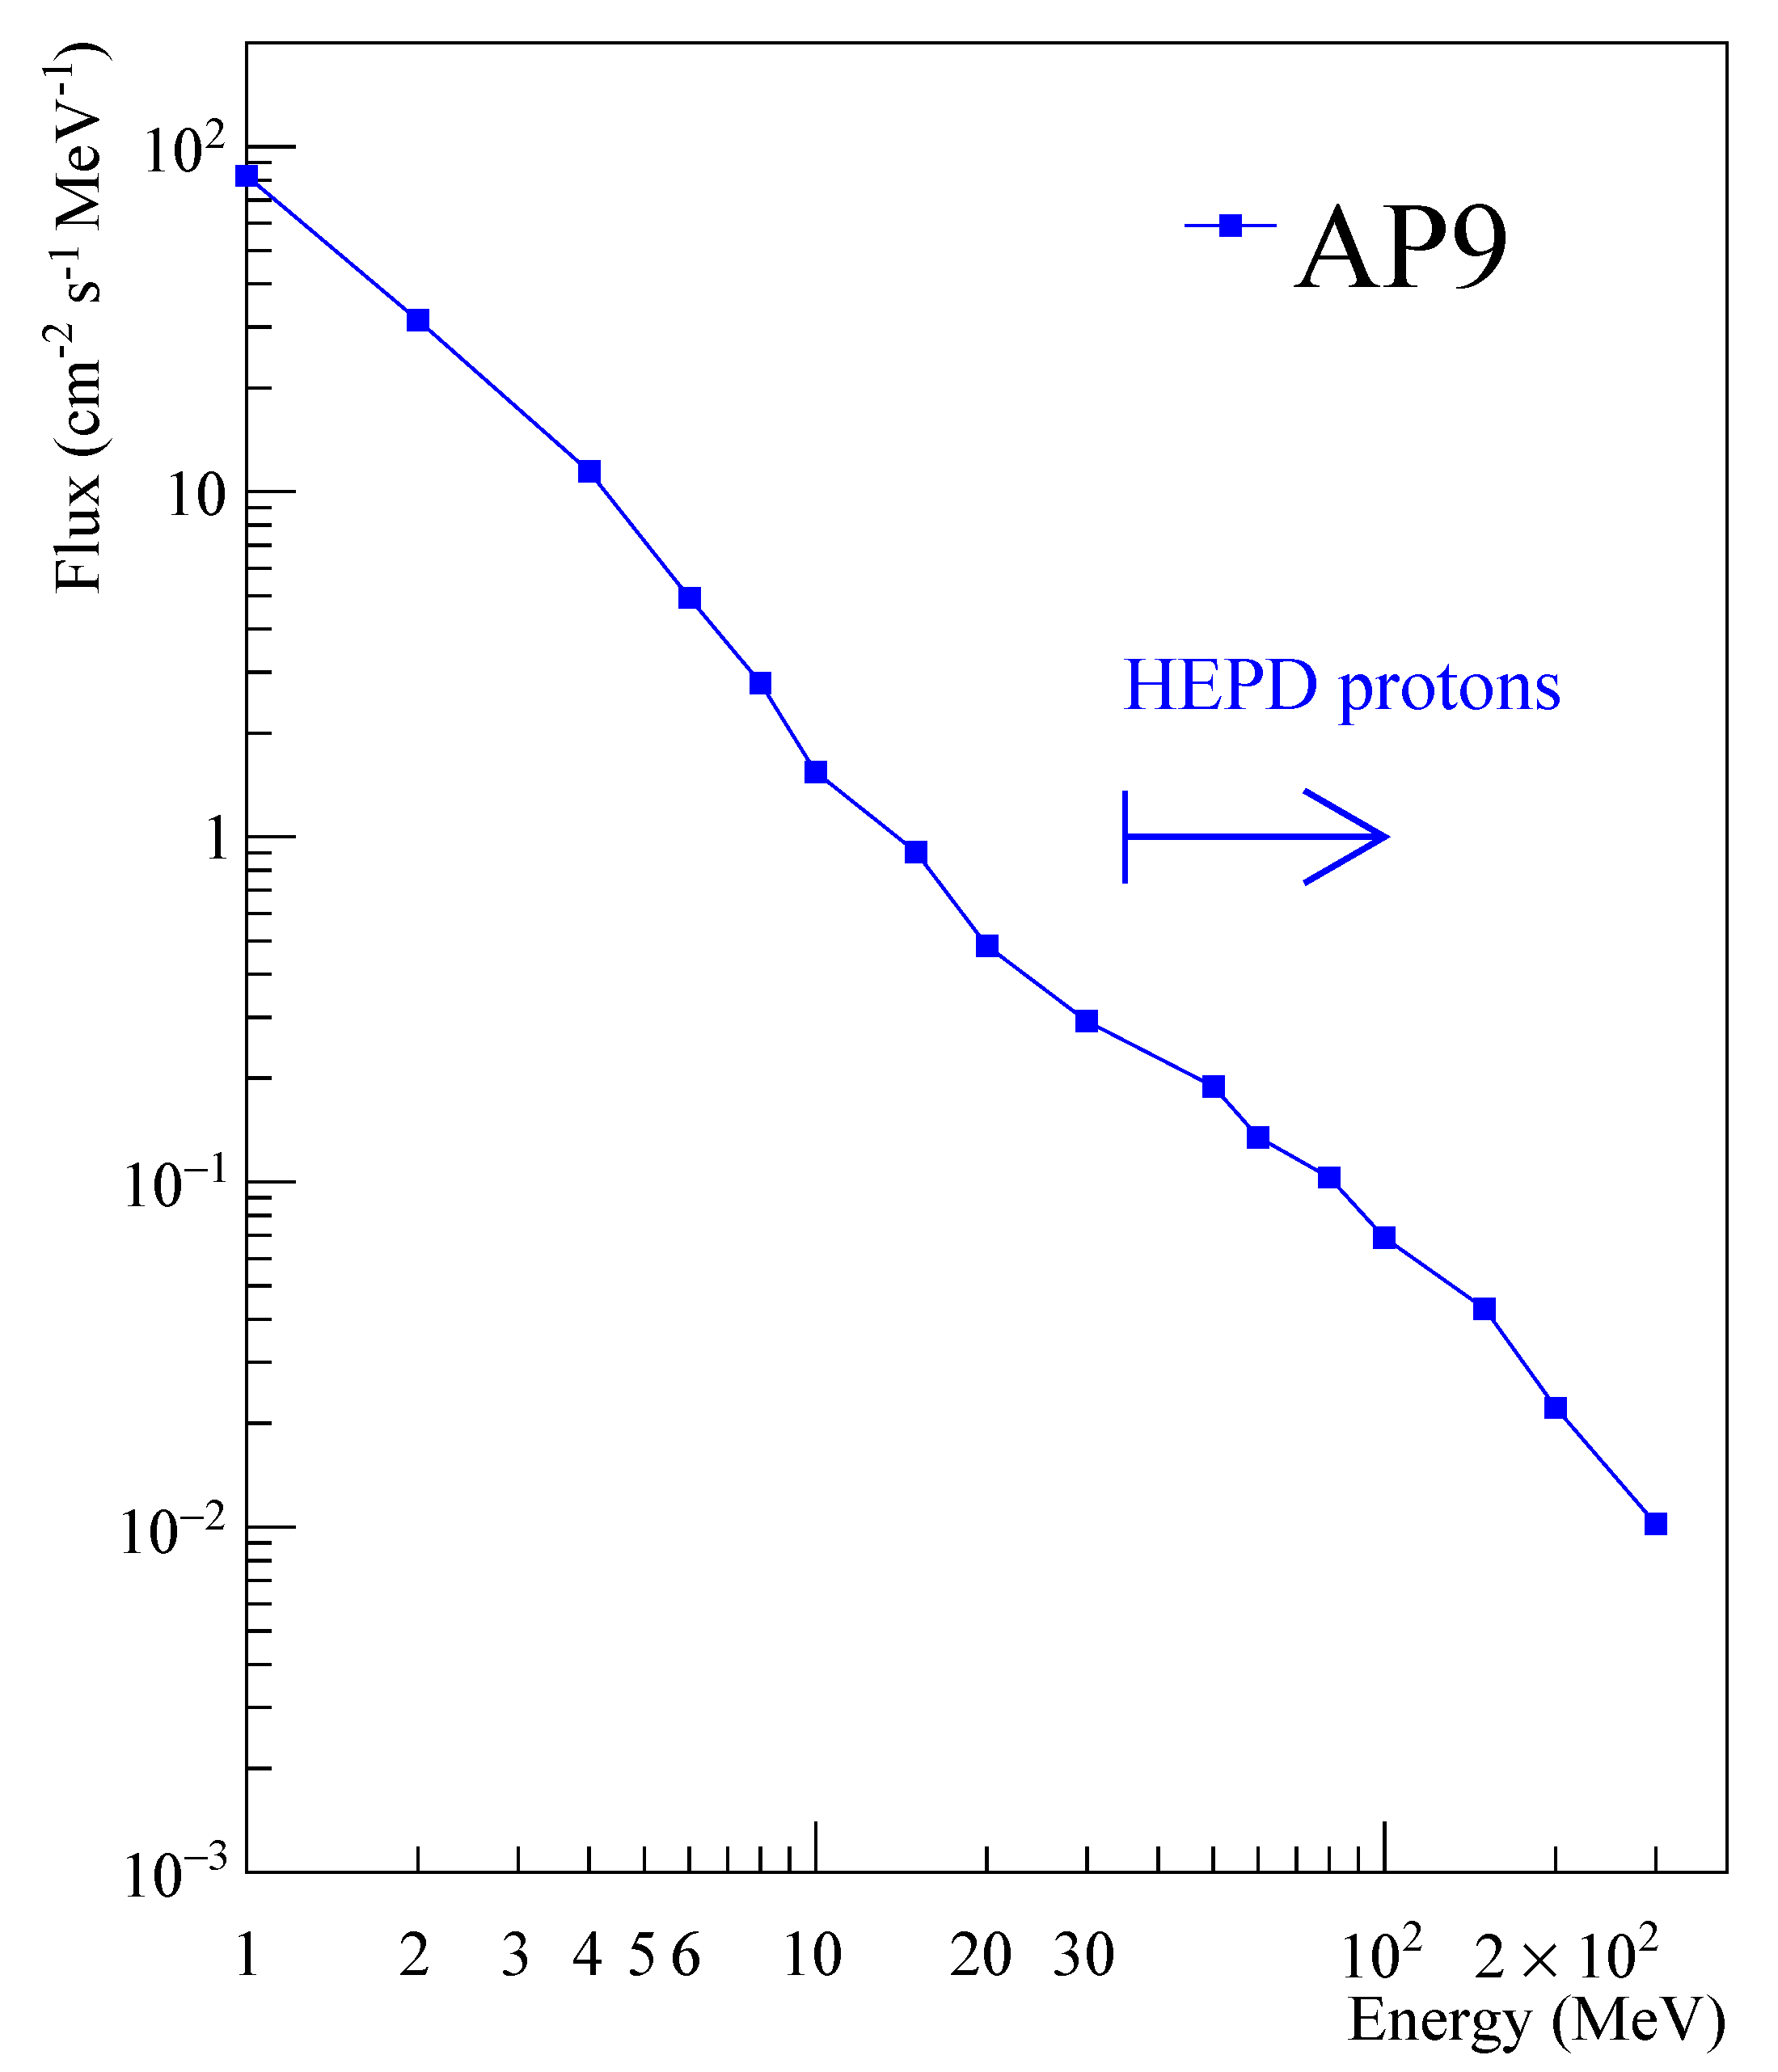
  • There are no data for high-energy protons (>150 MeV). AP9 goes out to 400 MeV only by using physics-based model extrapolation techniques.
Moreover, much of the validation of these models was performed using the Van Allen Probe mission [46], which provided a rich set of energetic particle and plasma data from the many instruments the spacecraft carried on board, together with a good pitch angle and energy resolution; unfortunately, after the end of the mission, new data are necessary to continue validation and to explore higher energy ranges with more statistics. HEPD proved to be able to cover this role, performing measurements with precision and stability in time; besides, new CSES missions (with more HEPD-like particle detectors) are already planned for the next years, greatly expanding the data-taking period by several years into the 2020s.

Author Contributions

Writing original draft, M.M. (Matteo Martucci); Conceptualization, R.S; Writing-review and editing, R.S., R.B., L.C. (Livio Conti), F.M.F., M.P. (Mirko Piersanti), A.P., C.D.D., A.S., F.P. (Francesco Palma); Designing the experiment or calibration or data production and processing, S.B., R.B., W.J.B., D.C., L.C. (Luca Carfora), G.C., L.C. (Livio Conti), A.C., C.D.D., C.D.S., F.M.F., R.I., I.L., N.M., G.M., M.M. (Matteo Mergé), A.O., G.O., F.P. (Francesco Palma), F.P. (Federico Palmonari), B.P., A.P., F.P. (Francesco Perfetto), P.P., M.P. (Mirko Piersanti), M.P. (Michele Pozzato), E.R., M.R., S.B.R., Z.S., V.S., A.S., V.V., S.Z., P.Z. All authors have read and agreed to the published version of the manuscript.

Funding

This research received no external funding.

Institutional Review Board Statement

Not applicable.

Informed Consent Statement

Not applicable.

Data Availability Statement

CSES/HEPD data can be found in www.leos.ac.cn/, accessed on 1 February 2021.

Acknowledgments

This work makes use of data from the CSES mission (www.leos.ac.cn/, accessed on 1 February 2021), a project funded by China National Space Administration (CNSA), China Earthquake Administration (CEA) in collaboration with the Italian Space Agency (ASI), National Institute for Nuclear Physics (INFN), Institute for Applied Physics (IFAC-CNR), and Institute for Space Astrophysics and Planetology (INAF-IAPS). We kindly acknowledge the AFRL for providing the AE9/Ap9/SPM set of models. This work was supported by the Italian Space Agency in the framework of the “Accordo Attuativo 2020-32.HH.0 Limadou Scienza+” (CUP F19C20000110005) and the ASI-INFN agreement n.2014-037-R.0, addendum 2014-037-R-1-2017.

Conflicts of Interest

The authors declare no conflict of interest.

Abbreviations

The following abbreviations are used in this manuscript:
CSESChina Seismo-Electromagnetic Satellite
HEPDHigh-Energy Particle Detector
SAASouth Atlantic Anomaly
AFRLAir Force Research Laboratory
TLETwo-Line Elements
SGP4Simplified General Perturbations
CRANDCosmic Ray Albedo Neutron Decay
SEESingle Event Effect
NRONational Reconnaissance Office
VDLVirtual Distributed Laboratory
LEOLow-Earth Orbit
ELSETElement Set

References

  1. Cummings, J.R.; Cummings, A.C.; Mewaldt, R.A.; Selesnick, R.S.; Stone, E.C.; von Rosenvinge, T.T. New Evidence for Anomalous Cosmic Rays Trapped in the Magnetosphere. In Proceedings of the 23rd International Cosmic Ray Conference (ICRC23), Calgary, AB, Canada, 19–30 July 1993; Volume 3, p. 428. [Google Scholar]
  2. Adriani, O.; Barbarino, G.C.; Bazilevskaya, G.A.; Bellotti, R.; Boezio, M.; Bogomolov, E.A.; Bongi, M.; Bonvicini, V.; Bottai, S.; Bruno, A.; et al. Trapped proton fluxes at low Earth orbits measured by the PAMELA experiment. Astrophys. J. 2015, 799, L4. [Google Scholar] [CrossRef] [Green Version]
  3. Singer, S.F. Trapped Albedo Theory of the Radiation Belt. Phys. Rev. Lett. 1958, 1, 181–183. [Google Scholar] [CrossRef]
  4. Farley, T.A.; Walt, M. Source and loss processes of protons of the inner radiation belt. J. Geophys. Res. 1971, 76, 8223. [Google Scholar] [CrossRef]
  5. Van Allen, J.A.; McIlwain, C.E.; Ludwig, G.H. Radiation Observations with Satellite 1958 ε. JGR 1959, 64, 271–286. [Google Scholar] [CrossRef]
  6. Van Allen, J.A.; Frank, L.A. Radiation Measurements to 658,300 Km. with Pioneer IV. Nature 1959, 184, 219–224. [Google Scholar] [CrossRef]
  7. Wrenn, G.L.; Sims, A.J. Internal Charging in the Outer Zone and Operational Anomalies. Wash. DC Am. Geophys. Union Geophys. Monogr. Ser. 1996, 97, 275. [Google Scholar] [CrossRef]
  8. Brautigam, D.H. CRRES in review: Space weather and its effects on technology. J. Atmos. Sol.-Terr. Phys. 2002, 64, 1709–1721. [Google Scholar] [CrossRef]
  9. Ginet, G.P.; O’Brien, T.P.; Huston, S.L.; Johnston, W.R.; Guild, T.B.; Friedel, R.; Lindstrom, C.D.; Roth, C.J.; Whelan, P.; Quinn, R.A.; et al. AE9, AP9 and SPM: New Models for Specifying the Trapped Energetic Particle and Space Plasma Environment. Space Sci. Rev. 2013, 179, 579–615. [Google Scholar] [CrossRef] [Green Version]
  10. Ripa, J.; Dilillo, G.; Campana, R.; Galgoczi, G. A comparison of trapped particle models in low Earth orbit. In Proceedings of the Space Telescopes and Instrumentation 2020: Ultraviolet to Gamma Ray, Online, 13 December 2020. [Google Scholar] [CrossRef]
  11. Fung, S.F.; Boscher, D.M.; Bilitza, D.; Tan, L.C.; Cooper, J.F. Modelling the Low-Altitude Trapped Radiation Environment. In Proceedings of the Environment Modeling for Space-Based Applications, Noordwijk, The Netherlands, 18–20 September 1996; Volume 392, p. 65. [Google Scholar]
  12. Daly, E.J.; Evans, H.D.R. Problems in radiation environment models at low altitudes. Radiat. Meas. 1996, 26, 363–368. [Google Scholar] [CrossRef]
  13. Brautigam, D.H.; Ray, K.P.; Ginet, G.P.; Madden, D. Specification of the Radiation Belt Slot Region: Comparison of the NASA AE8 Model With TSX5/CEASE Data. IEEE Trans. Nucl. Sci. 2004, 51, 3375–3380. [Google Scholar] [CrossRef]
  14. Heirtzler, J. The future of the South Atlantic Anomaly and implications for radiation damage in space. J. Atmos. Sol.-Terr. Phys. 2002, 64, 1701–1708. [Google Scholar] [CrossRef] [Green Version]
  15. Gubbins, D.; Jones, A.L.; Finlay, C.C. Fall in Earth’s magnetic field is erratic. Science 2006, 312, 900–902. [Google Scholar] [CrossRef]
  16. Aubert, J. Geomagnetic forecasts driven by thermal wind dynamics in the Earth’s core. Geophys. Suppl. Mon. Not. R. Astron. Soc. 2015, 203, 1738–1751. [Google Scholar] [CrossRef]
  17. Aubert, J.; Aurnou, J.; Wicht, J. The magnetic structure of convection-driven numerical dynamos. Geophys. J. Int. 2008, 172, 945–956. [Google Scholar] [CrossRef] [Green Version]
  18. Wicht, J.; Christensen, U.R. Torsional oscillations in dynamo simulations. Geophys. J. Int. 2010, 181, 1367–1380. [Google Scholar] [CrossRef]
  19. Gauß, C.F. Anzeige der Abhandlung des Herrn Hofr. Gauß: Intensitas vis magneticae terrestris admensuram absolutam revocata. Astron. Nachrichten 1833, 10, 349. [Google Scholar]
  20. Erwan, T.; Finlay, C.; Beggan, C.; Alken, P.; Aubert, J.; Barrois, O.; Bertrand, F.; Bondar, T.; Boness, A.; Brocco, L.; et al. International Geomagnetic Reference Field: The 12th generation. Earth Planets Space 2015, 67, 79. [Google Scholar] [CrossRef]
  21. Olsen, N.; Haagmans, R. Swarm-The earth’s magnetic field and environment explorers. Earth Planets Space 2006, 58, 349–495. [Google Scholar] [CrossRef] [Green Version]
  22. Pavón-Carrasco, F.J.; De Santis, A. The South Atlantic Anomaly: The Key for a Possible Geomagnetic Reversal. Front. Earth Sci. 2016, 4, 40. [Google Scholar] [CrossRef] [Green Version]
  23. Deme, S.; Reitz, G.; Apáthy, I.; Héjja, I.; Láng, E.; Fehér, I. Doses Due to the South Atlantic Anomoly During the Euromir’95 Mission Measured by an On-Board TLD System. Radiat. Prot. Dosim. 1999, 85, 301–304. [Google Scholar] [CrossRef] [PubMed]
  24. De Santis, A.; Qamili, E.; Wu, L. Toward a possible next geomagnetic transition? Nat. Hazards Earth Syst. Sci. 2013, 13, 3395–3403. [Google Scholar] [CrossRef] [Green Version]
  25. Shen, X.; Zhang, X.; Yuan, S.; Wang, L.; Cao, J.; Huang, J.; Zhu, X.; Piergiorgio, P.; Dai, J. The state-of-the-art of the China Seismo-Electromagnetic Satellite mission. Sci. China E Technol. Sci. 2018, 61, 634–642. [Google Scholar] [CrossRef]
  26. Piersanti, M.; Materassi, M.; Battiston, R.; Carbone, V.; Cicone, A.; D’Angelo, G.; Diego, P.; Ubertini, P. Magnetospheric-Ionospheric-Lithospheric Coupling Model. 1: Observations during the 5 August 2018 Bayan Earthquake. Remote Sens. 2020, 12, 3299. [Google Scholar] [CrossRef]
  27. Piersanti, M.; De Michelis, P.; Del Moro, D.; Tozzi, R.; Pezzopane, M.; Consolini, G.; Marcucci, M.F.; Laurenza, M.; Di Matteo, S.; Pignalberi, A.; et al. From the Sun to Earth: Effects of the 25 August 2018 geomagnetic storm. Ann. Geophys. 2020, 38, 703–724. [Google Scholar] [CrossRef]
  28. Varotsos, P.A.; Sarlis, N.V.; Skordas, E.S. Self-organized criticality and earthquake predictability: A long-standing question in the light of natural time analysis. EPL (Europhys. Lett.) 2020, 132, 29001. [Google Scholar] [CrossRef]
  29. Varotsos, P.A.; Sarlis, N.V.; Skordas, E.S. Study of the temporal correlations in the magnitude time series before major earthquakes in Japan. J. Geophys. Res. Space Phys. 2014, 119, 9192–9206. [Google Scholar] [CrossRef]
  30. Sarlis, N.V.; Skordas, E.S.; Varotsos, P.A.; Nagao, T.; Kamogawa, M.; Tanaka, H.; Uyeda, S. Minimum of the order parameter fluctuations of seismicity before major earthquakes in Japan. Proc. Natl. Acad. Sci. USA 2013, 110, 13734–13738. [Google Scholar] [CrossRef] [PubMed] [Green Version]
  31. Li, X.Q.; Xu, Y.B.; An, Z.H.; Liang, X.H.; Wang, P.; Zhao, X.Y.; Wang, H.Y.; Lu, H.; Ma, Y.Q.; Shen, X.H.; et al. The high-energy particle package onboard CSES. Radiat. Detect. Technol. Methods 2019, 3, 22. [Google Scholar] [CrossRef]
  32. Picozza, P.; Battiston, R.; Ambrosi, G.; Bartocci, S.; Basara, L.; Burger, W.J.; Campana, D.; Carfora, L.; Casolino, M.; Castellini, G.; et al. Scientific Goals and In-orbit Performance of the High-energy Particle Detector on Board the CSES. Astrophys. J. Suppl. 2019, 243, 16. [Google Scholar] [CrossRef]
  33. Cheng, B.; Zhou, B.; Magnes, W.; Lammegger, R.; Pollinger, A. High precision magnetometer for geomagnetic exploration onboard of the China Seismo-Electromagnetic Satellite. Sci. China Technol. Sci. 2018, 61, 659. [Google Scholar] [CrossRef]
  34. Cao, J.; Zeng, L.; Zhan, F.; Wang, Z.; Wang, Y.; Chen, Y.; Meng, Q.; Ji, Z.; Wang, P.; Liu, Z.; et al. The electromagnetic wave experiment for CSES mission: Search coil magnetometer. Sci. China Technol. Sci. 2018, 61, 653. [Google Scholar] [CrossRef]
  35. Diego, P.; Bertello, I.; Candidi, M.; Mura, A.; Coco, I.; Vannaroni, G.; Ubertini, P.; Badoni, D. Electric field computation analysis for the Electric Field Detector (EFD) on board the China Seismic-Electromagnetic Satellite (CSES). Adv. Space Res. 2017, 60, 2206–2216. [Google Scholar] [CrossRef]
  36. Lin, J.; Shen, X.; Hu, L.; Wang, L.; Zhu, F. CSES GNSS ionospheric inversion technique, validation and error analysis. Sci. China Technol. Sci. 2018, 61, 669. [Google Scholar] [CrossRef]
  37. Yan, R.; Guan, Y.; Shen, X.; Huang, J.; Zhang, X.; Liu, C.; Liu, D. The Langmuir Probe onboard CSES: Data inversion analysis method and first results. Earth Planet. Phys. 2018, 2, 479–488. [Google Scholar] [CrossRef]
  38. Chen, L.; Ou, M.; Yuan, Y.; Sun, F.; Yu, X.; Zhen, W. Preliminary observation results of the Coherent Beacon System onboard the China Seismo-Electromagnetic Satellite-1. Earth Planet. Phys. 2018, 2, 505–514. [Google Scholar] [CrossRef]
  39. Liu, C.; Guan, Y.; Zheng, X.; Zhang, A.; Piero, D.; Sun, Y. The technology of space plasma in-situ measurement on the China Seismo-Electromagnetic Satellite. Sci. China Technol. Sci. 2019, 62, 829–838. [Google Scholar] [CrossRef]
  40. Bartocci, S.; Battiston, R.; Burger, W.J.; Campana, D.; Carfora, L.; Castellini, G.; Conti, L.; Contin, A.; Donato, C.D.; Persio, F.D.; et al. Galactic Cosmic-Ray Hydrogen Spectra in the 40–250 MeV Range Measured by the High-energy Particle Detector (HEPD) on board the CSES-01 Satellite between 2018 and 2020. Astrophys. J. 2020, 901, 8. [Google Scholar] [CrossRef]
  41. Martucci, M.; Ambrosi, G.; Battiston, R.; Bartocci, S.; Basara, L.; Burger, W.; Campana, D.; Carfora, L.; Casolino, M.; Castellini, G.; et al. Space-Weather capabilities and preliminary results of the High Energy Particle Detector (HEPD) on-board the CSES-01 satellite. In Proceedings of the 36th International Cosmic Ray Conference—PoS(ICRC2019), Madison, WI, USA, 24 July–1 August 2019; Volume 358, p. 1118. [Google Scholar] [CrossRef]
  42. Ambrosi, G.; Bartocci, S.; Basara, L.; Battiston, R.; Burger, W.J.; Campana, D.; Carfora, L.; Castellini, G.; Cipollone, P.; Conti, L.; et al. Beam test calibrations of the HEPD detector on board the China Seismo-Electromagnetic Satellite. Nucl. Instrum. Methods Phys. Res. A 2020, 974, 164170. [Google Scholar] [CrossRef]
  43. Sotgiu, A.; De Donato, C.; Fornaro, C.; Tassa, S.; Scannavini, M.; Iannaccio, D.; Ambrosi, G.; Bartocci, S.; Basara, L.; Battiston, R.; et al. Control and data acquisition software of the high-energy particle detector on board the China Seismo-Electromagnetic Satellite space mission. Softw. Pract. Exp. 2020, 1–22. [Google Scholar] [CrossRef]
  44. McIlwain, C.E. Magnetic Coordinates. Space Sci. Rev. 1966, 5, 585–598. [Google Scholar] [CrossRef]
  45. Selesnick, R.S.; Looper, M.D.; Mewaldt, R.A. A theoretical model of the inner proton radiation belt. Space Weather. 2007, 5. [Google Scholar] [CrossRef]
  46. Mazur, J.; Friesen, L.; Lin, A.; Mabry, D.; Katz, N.; Dotan, Y.; George, J.; Blake, J.B.; Looper, M.; Redding, M.; et al. The Relativistic Proton Spectrometer (RPS) for the Radiation Belt Storm Probes Mission. Space Sci. Rev. 2013, 179, 221–261. [Google Scholar] [CrossRef] [Green Version]
Figure 1. Omnidirectional differential spectrum of trapped protons (blue squares) as a function of kinetic energy, obtained from the AP9 model and averaged over all the orbits of the testing day—1 January 2021. HEPD low-energy threshold for protons (30 MeV) is also depicted as a blue arrow.
Applsci 11 03465 g001
Figure 2. Geographical extension of the SAA for >1, >10, and >100 MeV protons (respectively, blue, red, and green curves in the panel), obtained from the AP9 model.
Applsci 11 03465 g002
Figure 3. Representation of the four orbits chosen for the time-profile evaluation as a function of geographical latitude and longitude; orbit 1 appears to be more peripheral with respect to, for example, orbit 3.
Applsci 11 03465 g003
Figure 4. Differential, omnidirectional energy spectra of >10 MeV trapped protons obtained with the AP9 model and averaged over each CSES-01 orbit (see title above each panel). In each orbit, the spectrum decreases as energy increases, as expected.
Applsci 11 03465 g004
Figure 5. Time profiles (5-s resolution) of 10–300 MeV trapped protons estimated from the AP9 model along CSES orbits 1–4 (from the top left panel to the lower right panel). As expected, higher energies have lower fluxes, while lower energies tend to have higher fluxes.
Applsci 11 03465 g005
Figure 6. Time profiles (5-s resolution) of 50 MeV trapped protons estimated from the Ap9 model and compared with preliminary data of ∼50 MeV proton data (black circles) from the HEPD instrument on board the CSES-01 satellite. The analysis has been carried out using the procedure described in [40]. The agreement between the data and the model appears generally good, despite showing small discrepancies, especially in the peripheral regions of the SAA. Only statistical errors are reported.
Applsci 11 03465 g006
Publisher’s Note: MDPI stays neutral with regard to jurisdictional claims in published maps and institutional affiliations.

