
An Experimental Study of the Performance of a Crossed Rib Diffuser in Room Acoustic Control

1
Technical Research Institute, Hazama Ando Corporation, 515-1 Karima, Tsukuba-City 305-0822, Japan
2
Acoustics Products Department, Daiken Corporation, 2-5-8 Kaigandori, Minami, Okayama 702-8045, Japan
*
Author to whom correspondence should be addressed.
Appl. Sci. 2021, 11(9), 3781; https://0-doi-org.brum.beds.ac.uk/10.3390/app11093781
Submission received: 29 March 2021
/
Revised: 19 April 2021
/
Accepted: 20 April 2021
/
Published: 22 April 2021
(This article belongs to the Special Issue Advances in Room Acoustics of Non-performing Public Spaces)
Abstract
:This paper presents a crossed rib diffuser (CRD) as an effective tool for room acoustic control. We performed an experimental investigation of its effectiveness using a specimen manufactured for this trial. The CRD is constructed by overlapping two one-dimensional (1D) periodic rib diffusers with different specifications so that they are crossed at non-right angles. The CRD achieves a higher scattering coefficient than 1D periodic rib diffusers in a wide band while maintaining the simple and friendly design of 1D periodic rib diffusers applicable to various architectural spaces. Moreover, inserting an absorbing layer between upper and lower ribs of the CRD, (CRD-A) yields a high broadband absorption coefficient. We first evaluated the random-incidence scattering coefficient of CRD using a 1/5 scaled model in comparison with those of 1D periodic diffusers assessed with a numerical method. Then, absorption coefficients for the CRD and the CRD-A were measured using a reverberation room. Subsequently, an experiment on a small meeting room with a 1D periodic rib diffuser, the CRD and the CRD-A was conducted to present performance of the CRD in room acoustic control. Impulse response measurements and evaluations of reverberation parameters ( and ) and speech clarity () were conducted. Additionally, we present differences in structure of reflected sounds found for the flat wall, the CRD and the CRD-A visually using a four-channel sound field microphone.
1. Introduction
Along with acoustic absorbers, acoustic diffusers are also classical tools for room acoustic control. To evaluate the reflective properties of a diffuser’s two indexes, the diffusion coefficient [1,2] and the scattering coefficient [3,4,5] were proposed and standardized. The diffusion coefficient characterizes the uniformity of a polar response of sounds reflected from a diffuser, thereby presenting the quality of the diffuser. However, the scattering coefficient represents a ratio of non-specularly reflected sounds to total reflected sounds, which which is useful for theoretical and numerical room acoustic modeling [6,7]. Details of the advantages and difficulties related to the two indexes were reviewed in [8,9]. This report specifically describes only the scattering coefficient as a reflective property of diffusers because of its applicability to room acoustic modeling and because of its ease in measuring a random-incidence value using a scaled reverberation room. Diffusers have been applied mostly to acoustic control and elimination of flutter echoes in music spaces such as concert halls, rehearsal rooms and recording studios because of their feature of reducing harmful reflected sounds without excessive energy loss [10]. However, the acoustic diffuser is also attractive for non-performance spaces because it has flexibility in terms of design and constituent materials. Some works used acoustic diffusers in non-performance spaces such as meeting rooms [11,12] and classrooms [13,14].
A one-dimensional (1D) periodic rib-type acoustic diffuser is the simplest and most widely used acoustic diffuser. The 1D periodic rib diffuser is constructed with a pattern of ribs and voids, presenting a simple and friendly design well suited to various architectural spaces. However, its simple periodic structure simultaneously produces strong sound incident-angle dependence [15]; i.e., a frequency bandwidth acquiring high scattering performance is narrow like a peak of sound absorption coefficient characteristic of a simple Helmholtz resonator without porous material. Consequently, to use the 1D periodic rib diffuser effectively for room acoustic control, more elaborate investigations related to characteristics of room acoustics, rib configurations and locations at which diffusers are set are needed for comparisons with diffusers with higher scattering coefficients in wide-band applications. The present study was conducted to increase the acoustical performance of a 1D periodic rib diffuser while maintaining its convenient design.
The scattering performance of a 1D periodic rib diffuser is likely to be improved with ease by overlapping two 1D periodic rib diffusers with different configurations so that they are mutually crossing at non-right angles, because a superposition of two periodic rib structures yields two-dimensional and more complex periodic structures than a 1D periodic rib diffuser. The crossed rib diffuser maintains the simple and intimate design of a 1D periodic rib diffuser. Moreover, it is easier to manufacture than high-performance diffusers such as [16,17]. Additionally, inserting a thin absorbing layer between the upper and lower ribs can transform the crossed rib diffuser into a broadband absorber like a quadratic residue diffuser with a fabric cover [18], extending the applicability of the crossed rib diffuser. From those features, some versatile activity of the crossed rib diffuser in architectural spaces is expected, but no study has examined acoustical properties of such crossed rib diffusers or their applications in rooms.
This paper describes a manufactured crossed rib diffuser (CRD) and an experimental investigation of its applicability to room acoustic control. First, the CRD’s scattering performance was evaluated using a 1/5 scale specimen and a 1/5 scale reverberation room, where random-incidence scattering coefficients were compared for CRD and 1D periodic rib diffusers. Subsequently, diffuse-field absorption coefficients of the CRD, a CRD with an absorbing layer (CRD-A) and 1D periodic rib diffusers composing the CRD were measured in a reverberation room with 1/1 scale specimens. Finally, an experiment was conducted in a small meeting room with a 1D periodic rib diffuser, the CRD and the CRD-A to demonstrate the applicability of the crossed rib structure for room acoustic control. There impulse response measurements and evaluations of room acoustic parameters were conducted. Additionally, we present structural differences of reflected sounds for a flat wall, the CRD and the CRD-A visually using a four-channel sound field microphone. The present paper is organized as follows. Section 2 first introduces the manufactured specimen’s configuration. Then, the CRD’s scattering and absorption performance is presented. Section 3 presents an experiment to demonstrate the CRD and the CRD-A effectiveness for acoustic improvement. Section 4 concludes by presenting findings from this study.
2. Specification and Acoustic Properties of CRD
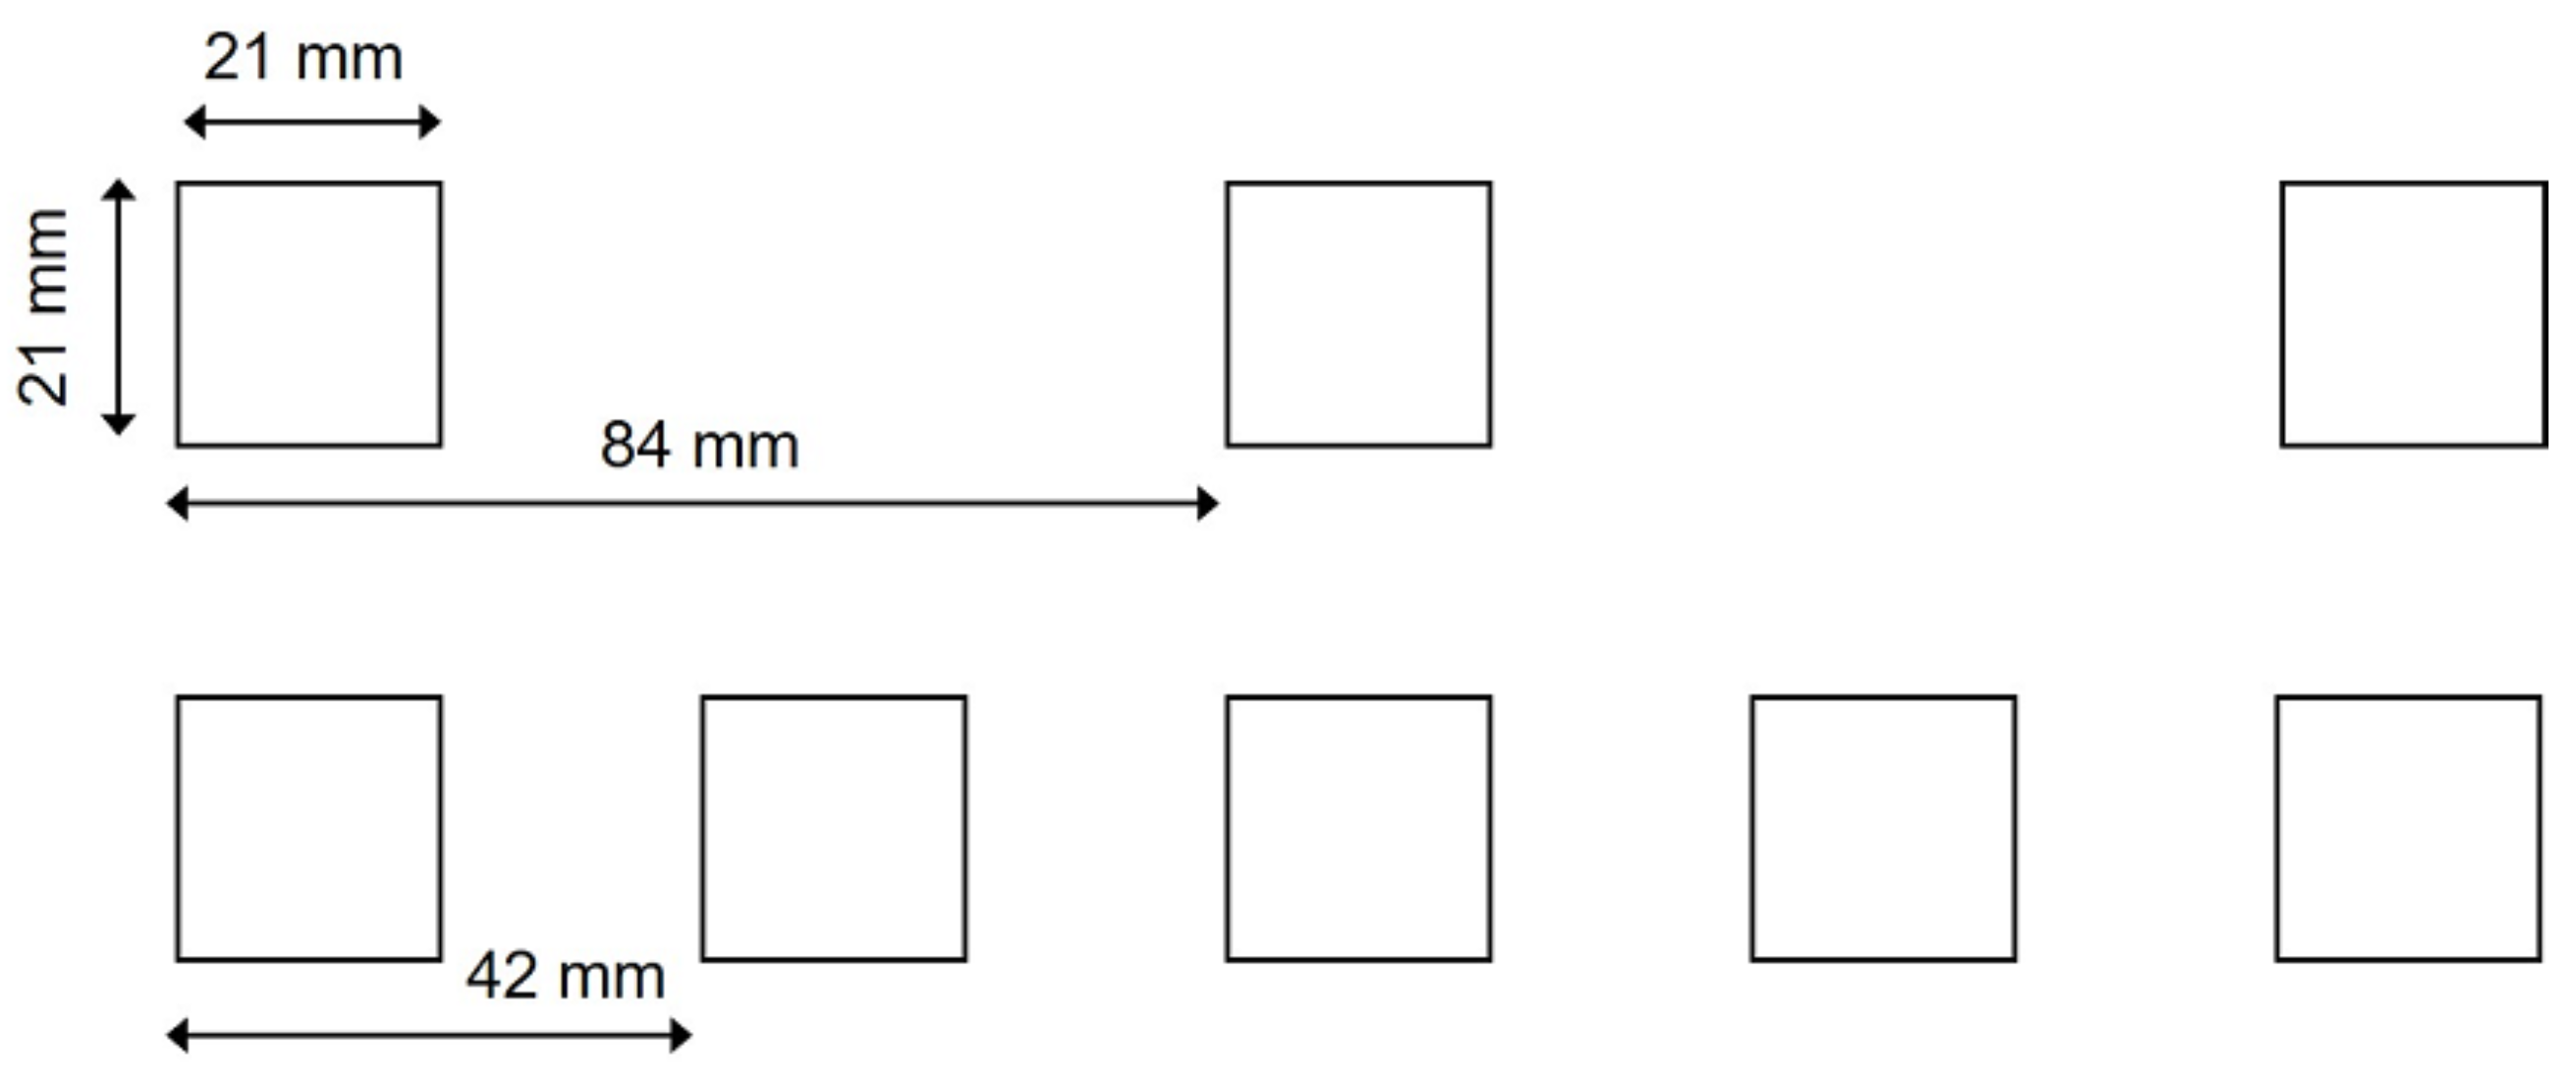
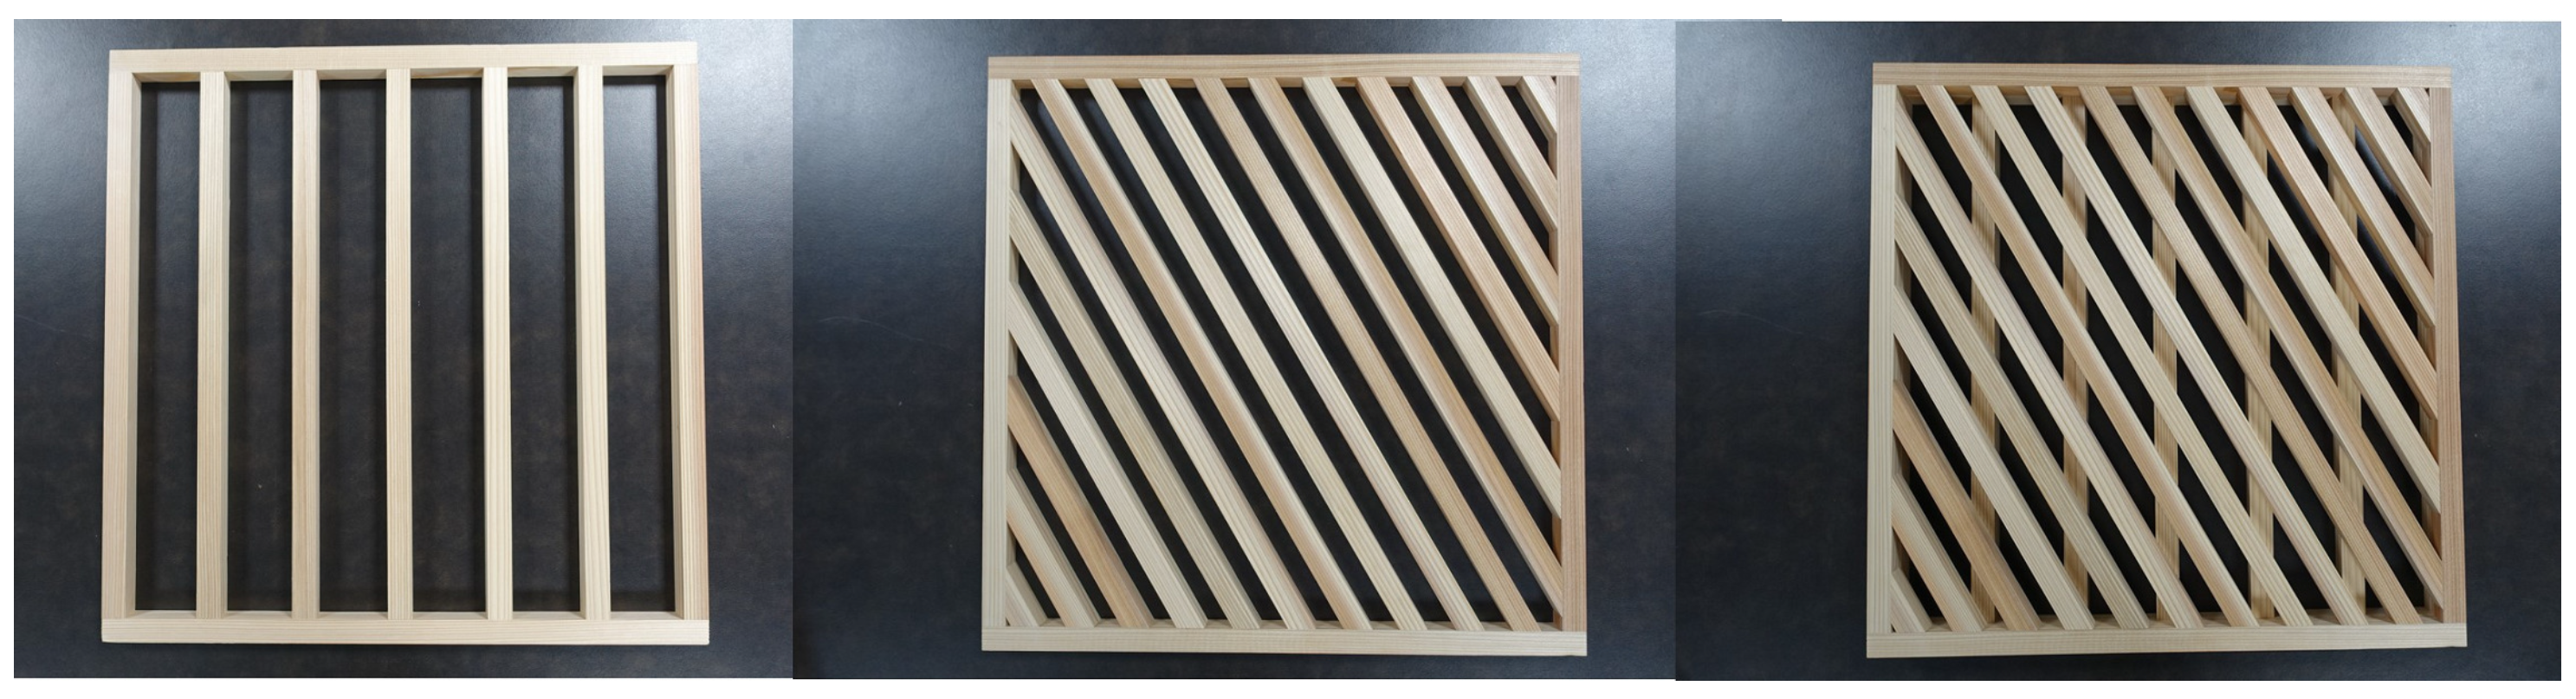
A CRD consists of two overlapping 1D periodic rib diffusers crossed at non-right angles. Herein, the two 1D periodic rib diffusers constituting the CRD are designated as R-1 and R-2. R-1 and R-2 were manufactured using the same square pieces of wood with cross-sectional areas of 21 mm × 21 mm. The period lengths of R-1 and R-2 were, respectively, 84 and 42 mm. Figure 1 presents the cross-sections of R-1 and R-2. For this study, CRD was manufactured by superimposing R-2 on top of R-1 so that the periodic directions intersected at 30. Photographs of the specimens of R-1 and R-2 and the their overlain CRD are shown in Figure 2. The single specimen size is 525 mm × 525 mm. For a later experiment, plural specimens were installed onto surfaces of room walls. The manufactured CRD was a trial production. The geometrical specifications were not optimized. However, the evaluation of material acoustic properties and the experiment show the better performance of the CRD than the 1D periodic rib diffusers.
2.1. Scattering Characteristics
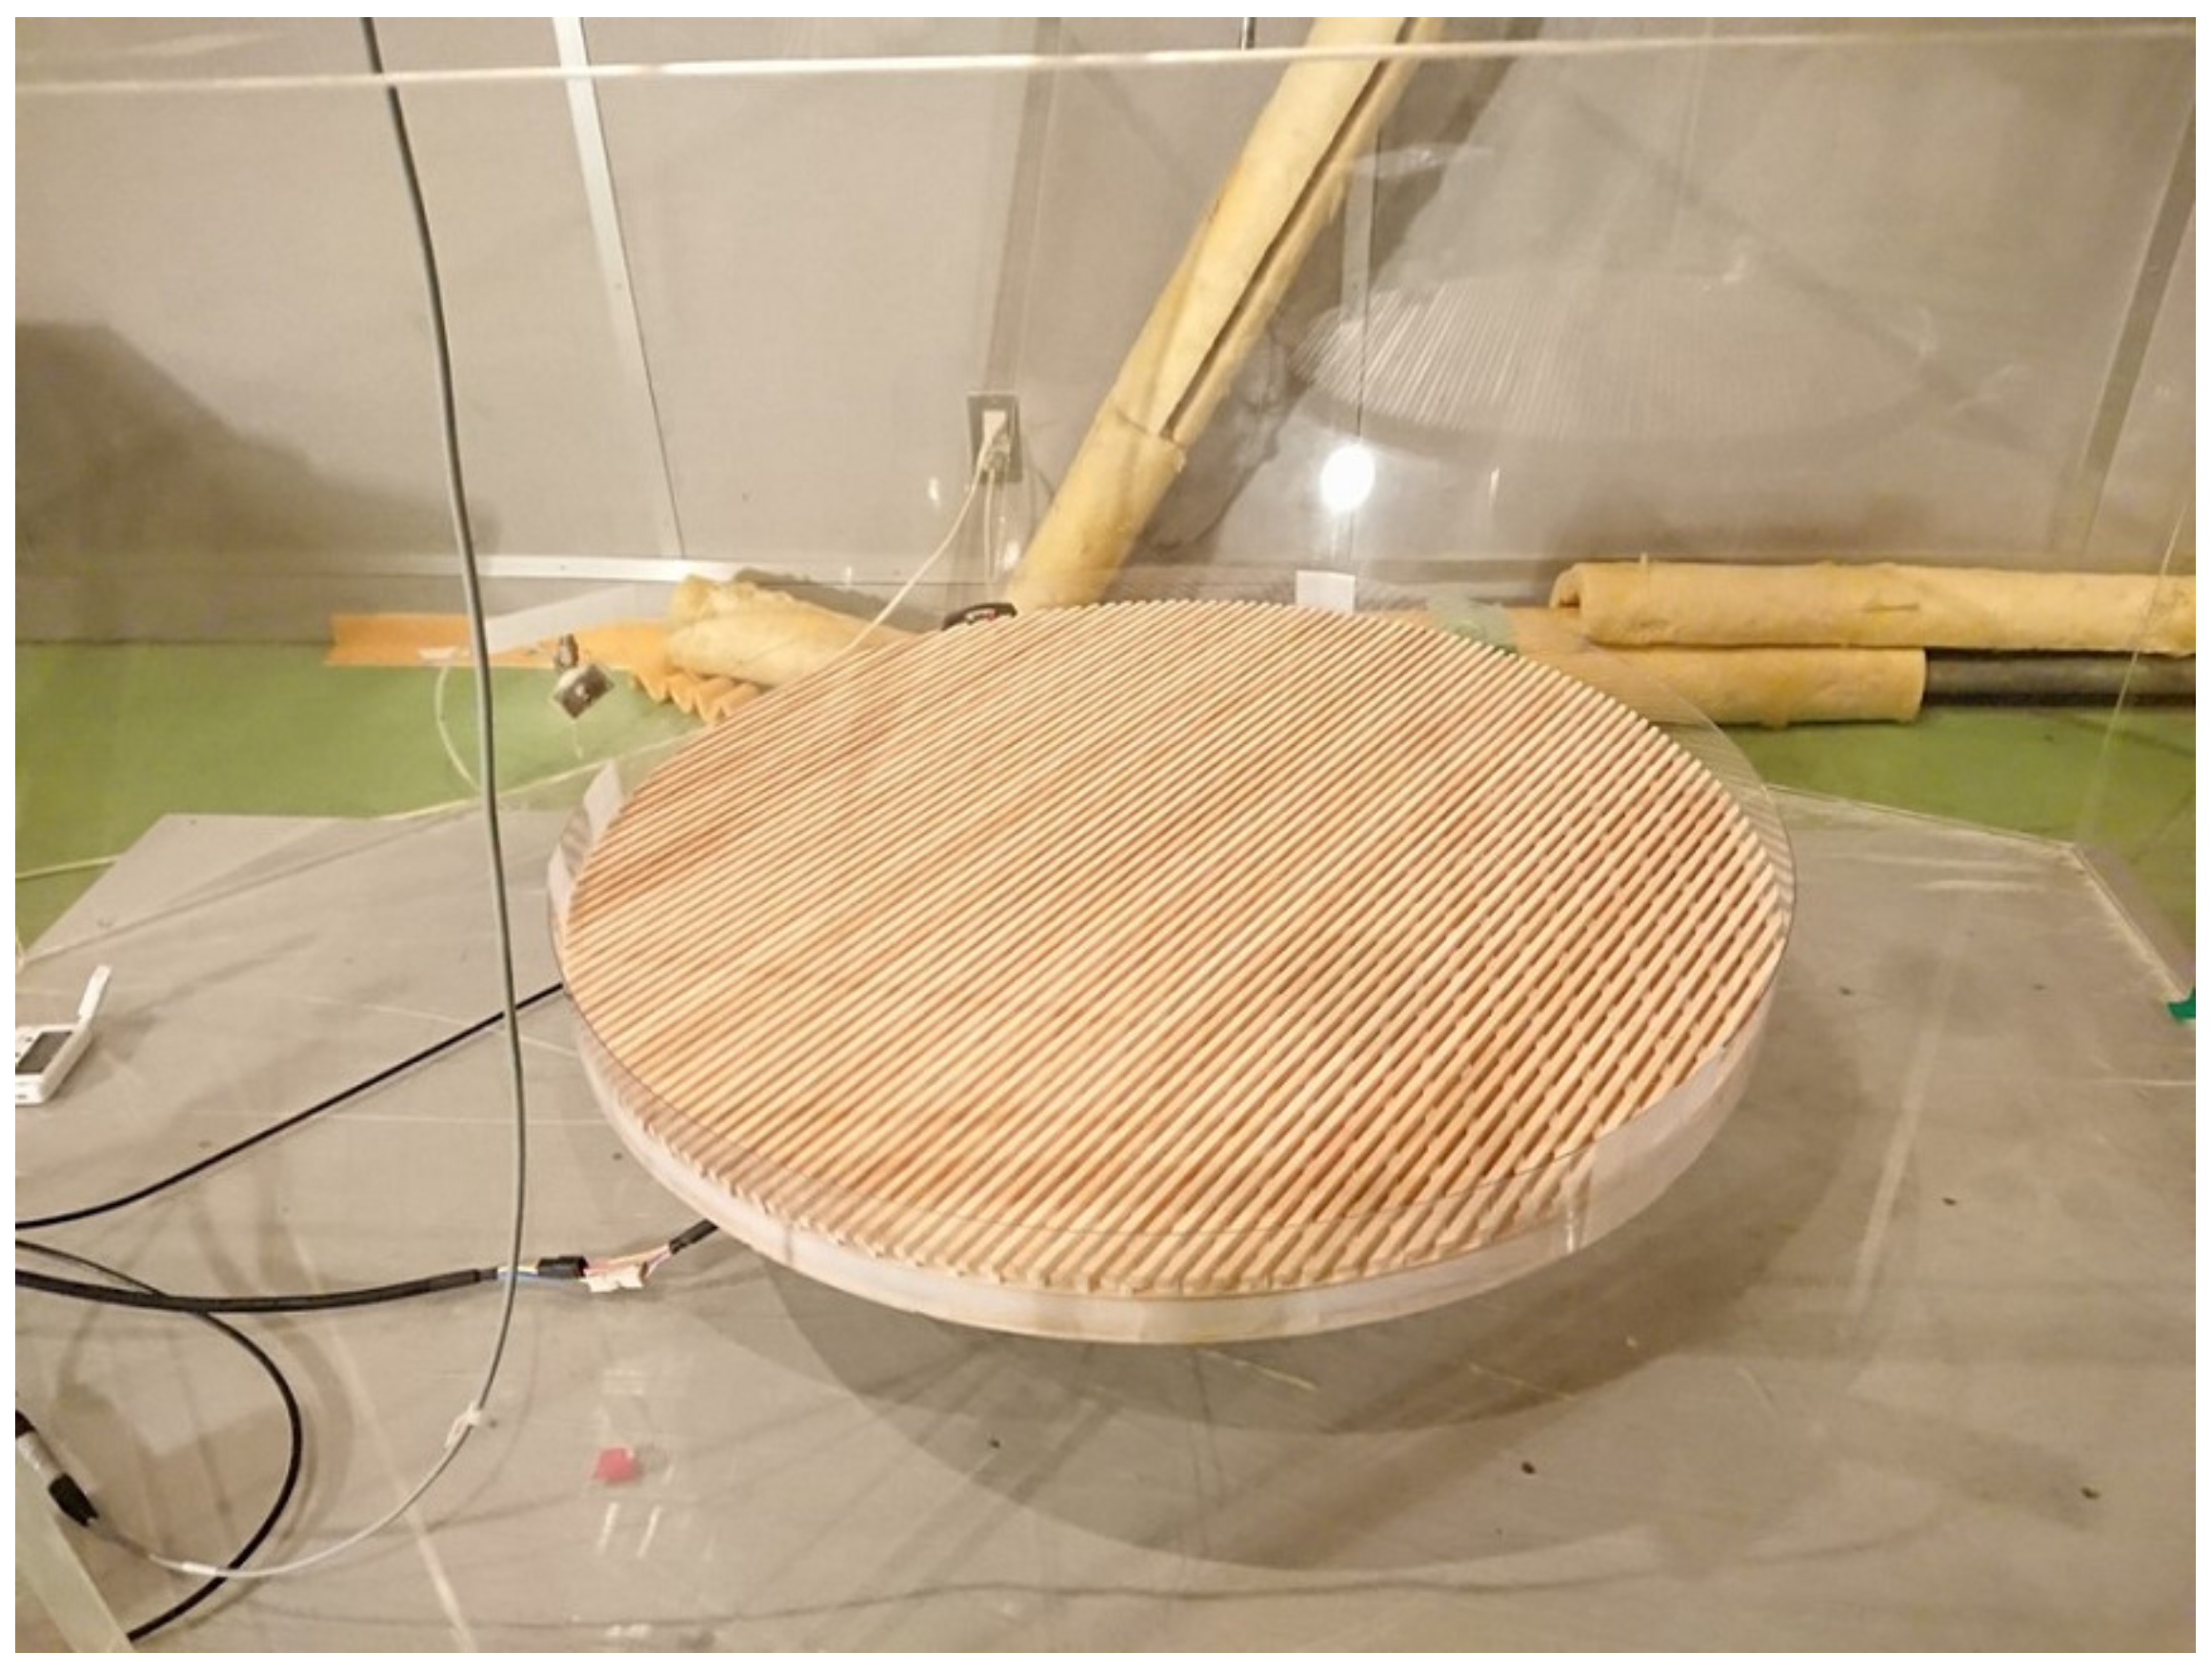
We evaluated the random-incidence scattering coefficients of the fabricated CRD and compared the obtained results with those for R-1, R-2, a two-stacked R-1 (R-1-W) and a two-stacked R-2 (R-2-W). As the CRD was a diffuser having a two-dimensional structure, the scattering coefficient was measured using a 1/5 scaled reverberation room, in which the 1/5 scaled test specimen was placed on wooden circular base. The use of a scale model for the scattering coefficient is recommended in [9]. Measurements for random-incidence scattering coefficients were conducted in accordance with ISO 17497-1 [5] and Sakuma and Lee [19]. The reverberation room’s volume and the circular base diameter were 212 m and 3.75 m, respectively, at 1/1 scale. In fact, the 1/5 specimen of CRD was constructed using square members with 5 mm edge length. Additionally, the respective period lengths of R-1 and R-2 were 1 and 20 mm because of the availability of square members. The 1/5 model of the crossed rib diffuser located in the 1/5 reverberation room is shown in Figure 3. For impulse response measurements in the 1/5 reverberation room, two source points and three receiver points were set up. A swept-sine signal with signal length of 1.365 s was used as a sound source signal. A rotation period was set to 162 s/rev. To measure the reverberation time in the rotating condition, we used the continuous method wherein 119 signals were emitted during the circular table rotations. To reduce the edge diffraction effects, the edge of the circular base was covered with a 1-mm-thick plastic plate.
The random-incidence scattering coefficients of 1D periodic rib diffusers were calculated using AMFG Reflex [20], where the correlation scattering coefficient proposed by Mommertz [4] was evaluated using the two-dimensional boundary element method. To reduce the effect of edge diffraction, each 1D periodic rib diffuser was modeled with 11 periods. Though the theoretical background of the correlation scattering coefficient is different from that of the reverberation room method, with random-incidence, the correlation scattering coefficient is theoretically nearly equivalent to the measured scattering coefficient in the reverberation room [21].
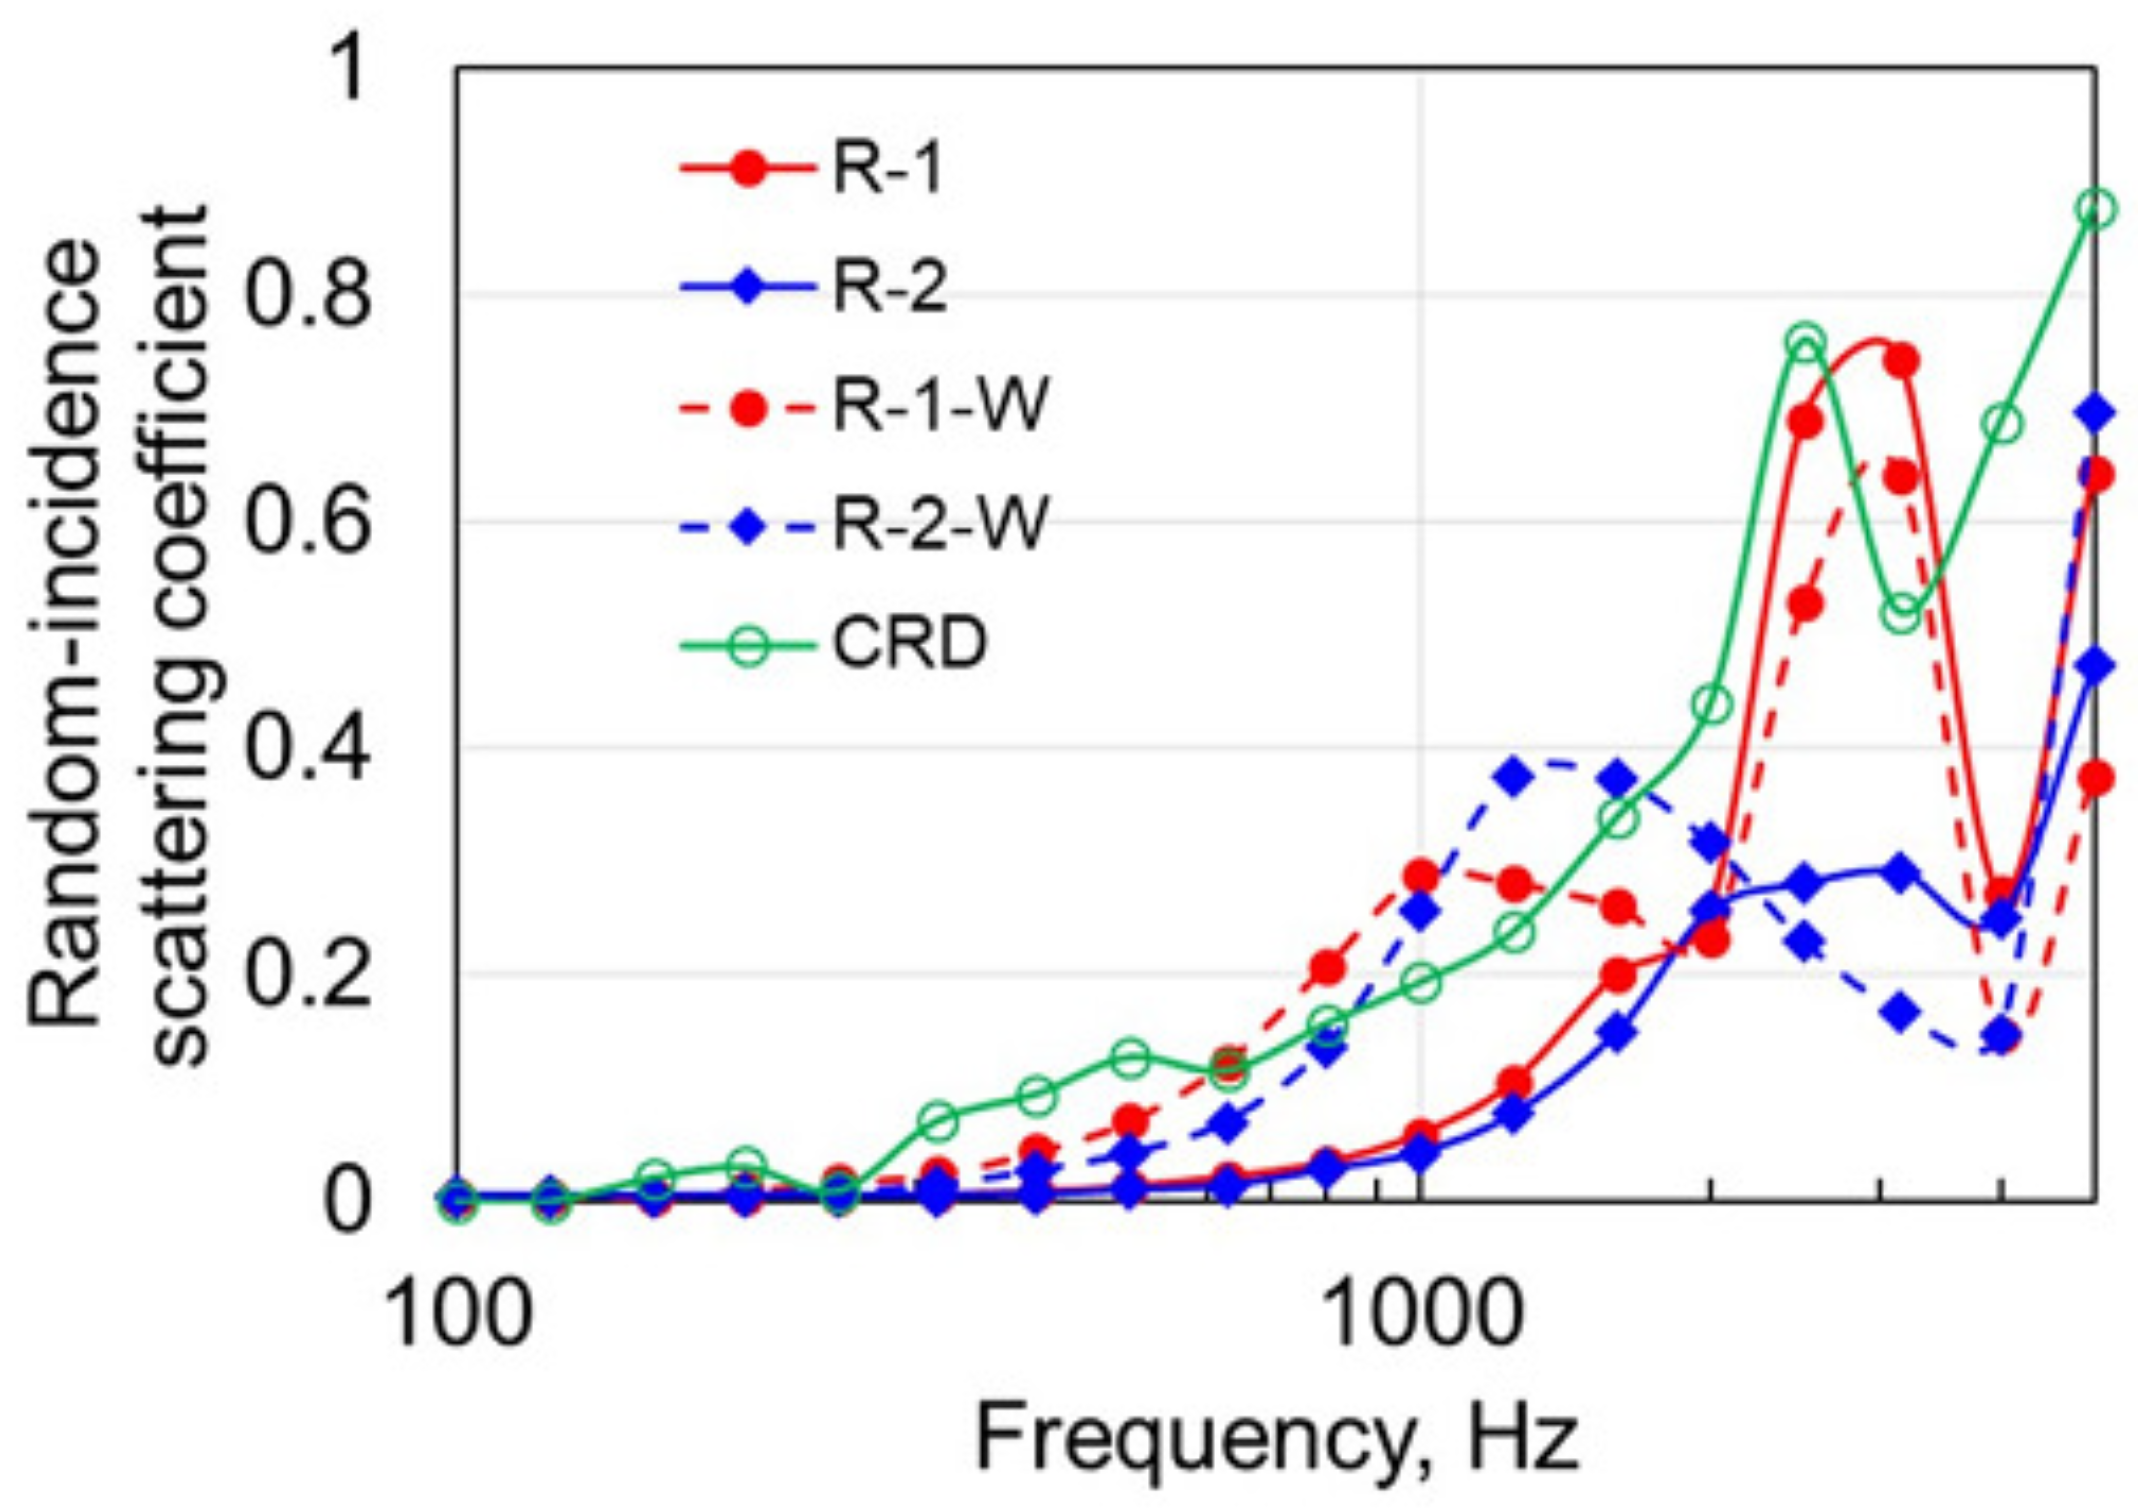
Figure 4 presents a comparison of random-incidence scattering coefficients of various rib-type diffusers. R-1 and R-1-W, respectively, showed peaks at 2.5 kHz and 3.15 kHz. However, they also present large declines before and after the peaks, leading to a narrow frequency band with high scattering coefficient, which is a typical shortcoming of 1D periodic rib diffusers. R-2 shows the low scattering coefficient in broadband. R-2-W presents the peak of scattering coefficient at 1.25 kHz, but the peak value is smaller than 0.4. The CRD shows an increase in the scattering coefficient with frequency. Additionally, the CRD scattering coefficient has a peak at 2.5 kHz and a dip at 3.15 kHz, derived from the structural property of R-1, the lower part of CRD. However, the declines in the scattering coefficient before and after the peak were reduced more than those of R-1 and R-1-W. This result demonstrates that the two-stage crossed structure of CRD overcomes the shortcoming of 1D periodic rib diffusers, engendering a higher scattering coefficient in a wide band.
2.2. Absorption Characteristics
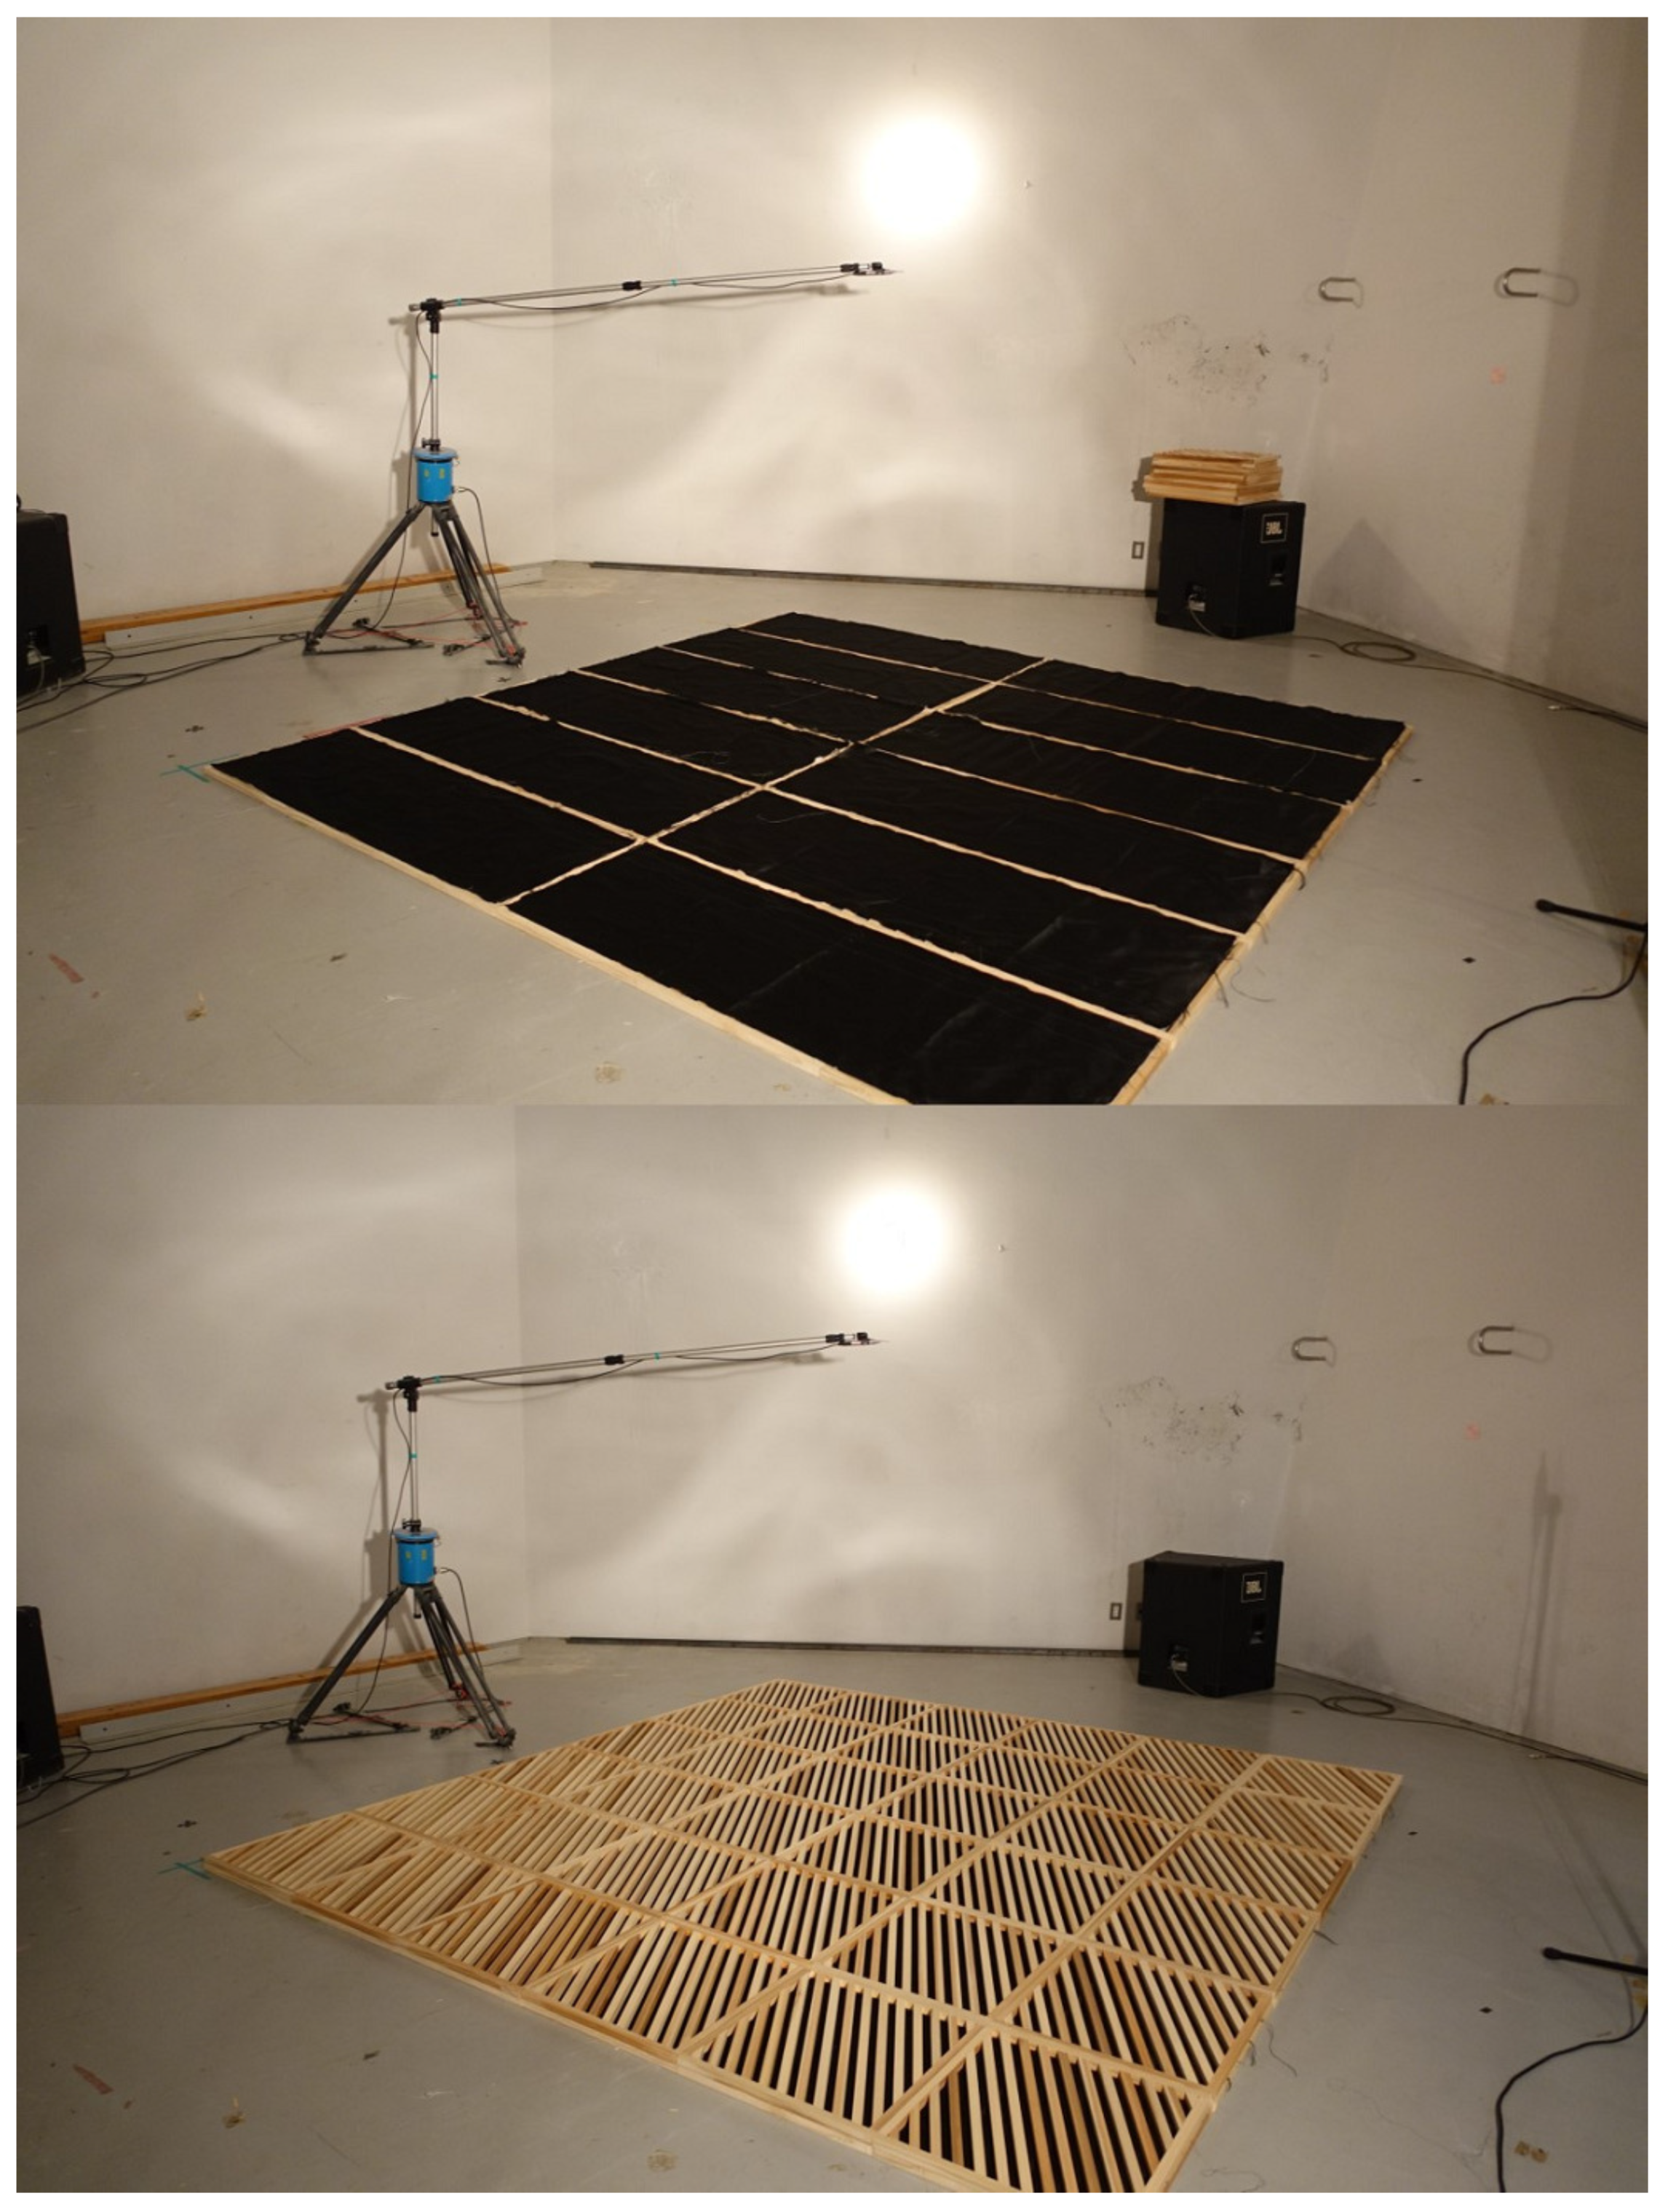
This subsection evaluates diffuse field absorption coefficients for R-1, R-2 and the CRD. Measurements were conducted in a reverberation room of 212 m (Technical Research Institute, Hazama Ando Corp.) with a projected surface area of the test specimens of 10 m. As a sound source signal, the swept-sine signal of 30 s signal length was used. Other settings were in accordance with JIS A 1409 (ISO 354 [22] compatible). Here, to address the potential for transforming the CRD to a broadband absorber by inserting a sound-absorbing layer between the upper and lower ribs, we also manufactured a CRD with a sound-absorbing layer, CRD-A. Then its sound absorption performance was measured. The inserted sound-absorbing layer was a 0.4 mm thick, permeable, high-density polyester fabric [23]. Figure 5 shows the status of laying a sound-absorbing layer on R-1 (Upper) and of the sound absorption measurement of the CRD-A. As a reference, a statistical sound absorption coefficient of the sound-absorbing layer with a 21 mm air layer was calculated using a theoretical model for a single-leaf permeable membrane sound absorber [24]. As shown in [23], the theoretical model can accurately predict the absorption performance of a thin porous layer with a rigid-backed air cavity. As the ribs behind the sound-absorbing layer can play the role of a honeycomb structure [25], we calculated the statistical sound absorption coefficient of a single-leaf permeable membrane absorber with two assumptions for wave propagation in the air layer, i.e., the extended reaction (ER) and the local reaction (LR). The specific acoustic impedance ratio z of a single-leaf permeable membrane absorber is calculated using [24]
where and denote air density and the speed of sound, respectively. Therein, R and M represent the flow resistance and the surface density of the sound-absorbing layer, respectively. In addition, L and are the length of air layer and the sound-incident angle. and k, respectively, denote the angular frequency and the imaginary unit . The statistical absorption coefficient with ER assumption was calculated by substituting Equation (1) into the following equation:
with
For this study, we calculated the theoretical absorption coefficients with M = 0.20 kg/m and R = 1050 Pa s/m [23]. Additionally, and were set to 343.7 m/s and 1.205 kg/m, respectively. The statistical absorption coefficient with LR assumption was assessed by substituting = 0 into Equation (1).
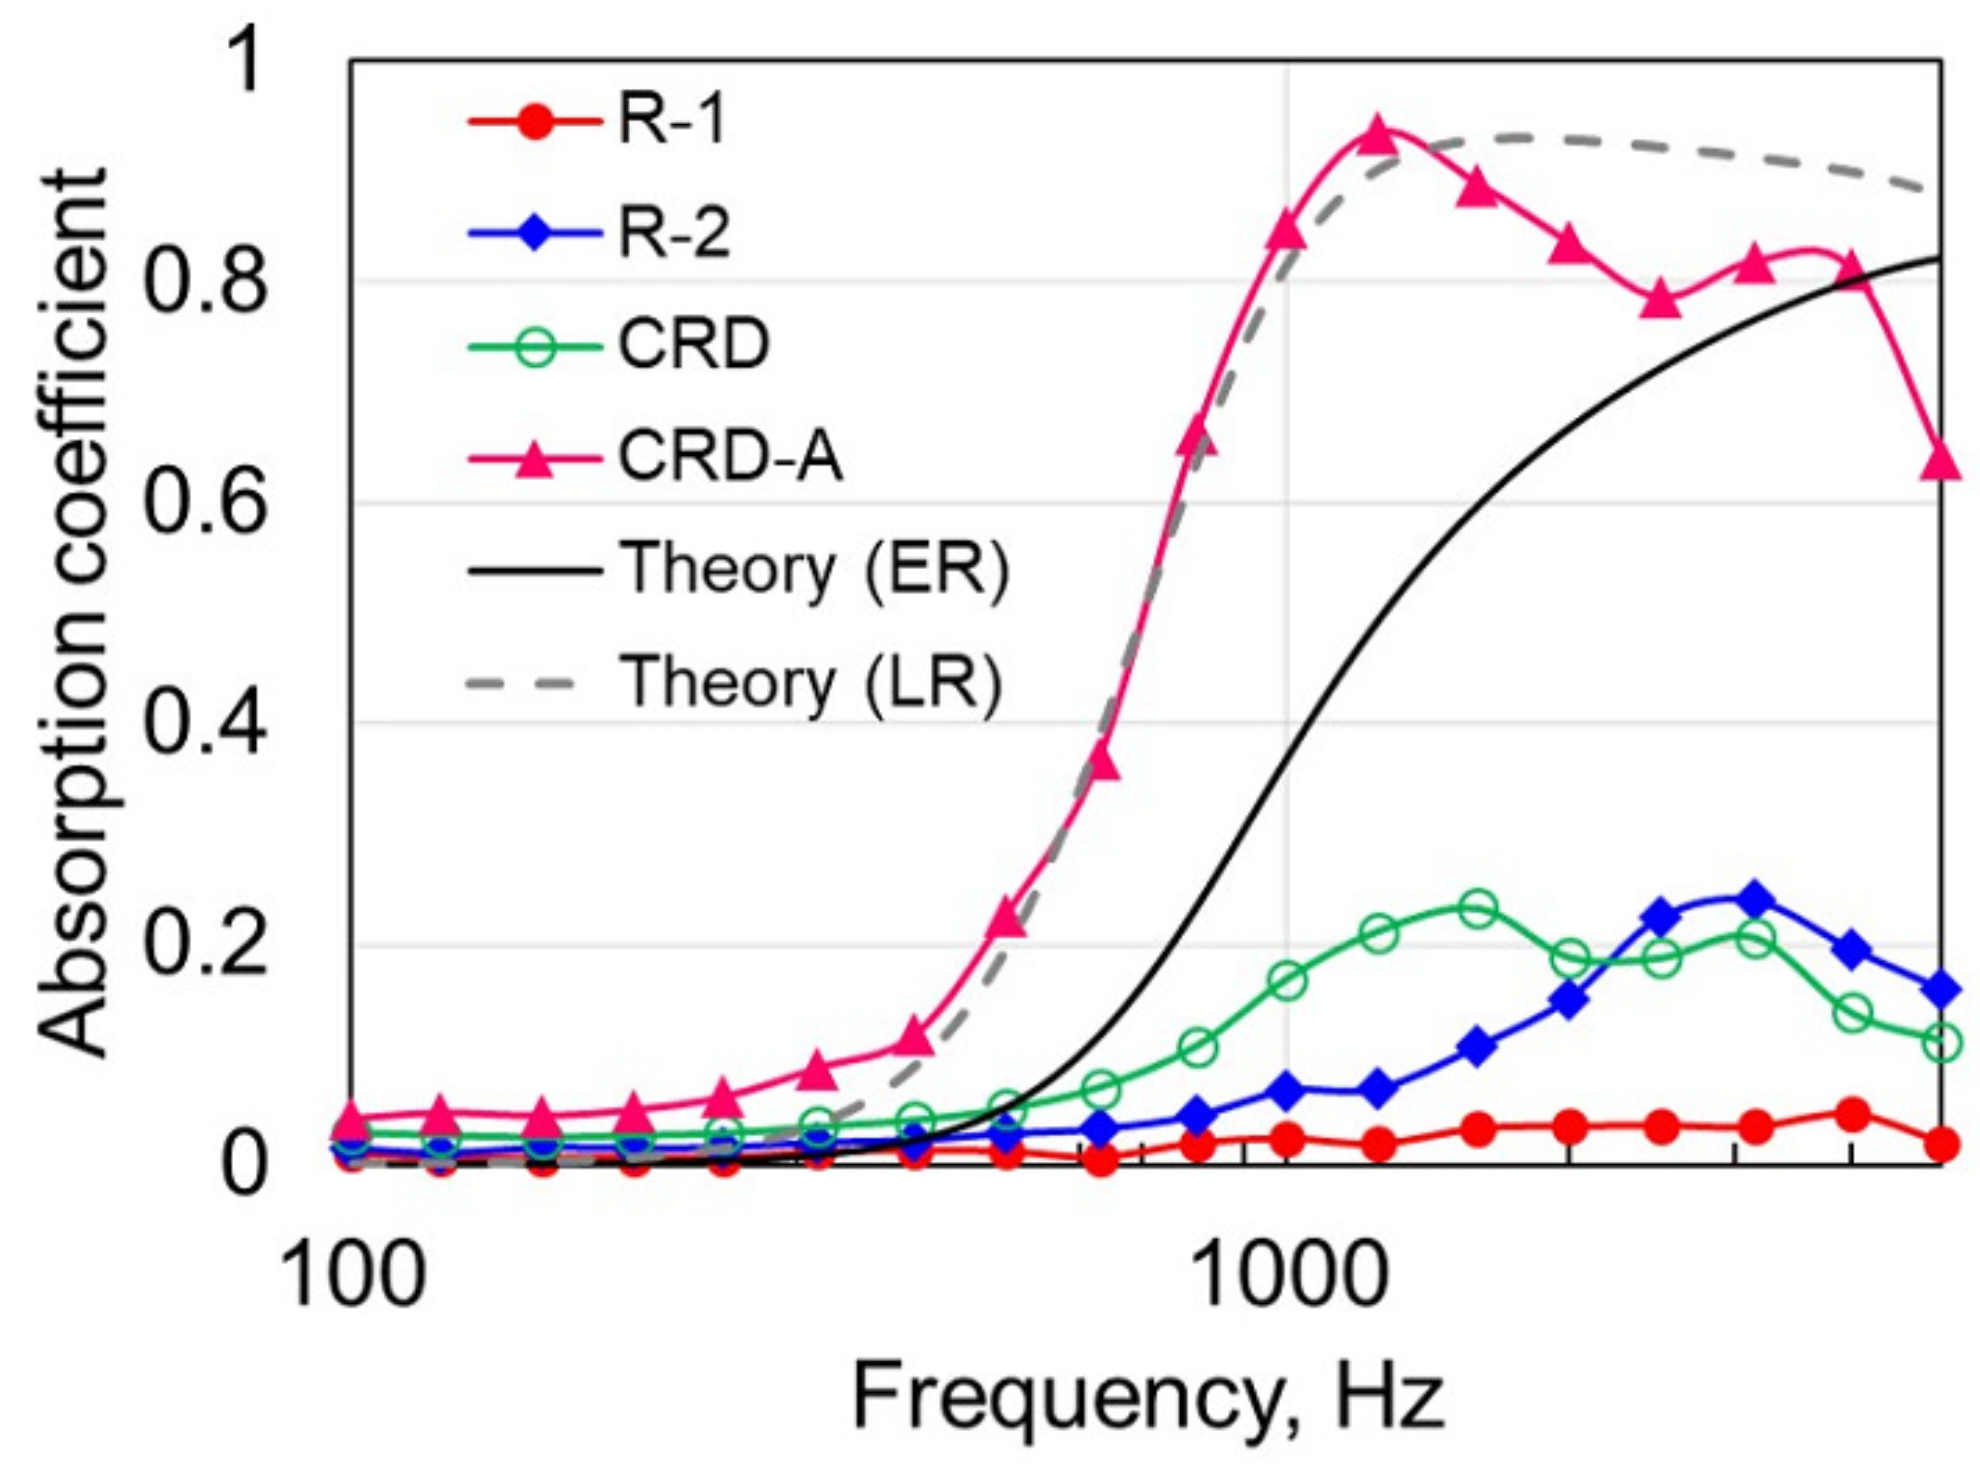
Figure 6 presents a comparison of diffuse field absorption coefficients of R-1, R-2, the CRD and the CRD-A; and the statistical absorption coefficients for a single-leaf permeable membrane absorber based on ER and LR assumptions. R-1 had almost no sound absorption performance, whereas R-2 showed absorption coefficient values of around 0.2 at frequencies higher than 2 kHz, with a gentle peak at 3.15 kHz. The CRD has absorption coefficients of around 0.2 at frequencies higher than 1 kHz, presenting better sound absorption performance of the CRD than R-1 and R-2. Furthermore, CRD shows a peak of the absorption coefficient at 1.6 kHz, which is lower frequency than that of R-2. The CRD-A had a broadband high absorption coefficient of larger than 0.6 at 800 Hz and higher, showing that the CRD can be altered to a practical absorber easily. Additionally, the measured result of CRD-A agreed well with theoretical absorption coefficient with LR assumption up to a peak frequency of 1.25 kHz. Thereafter, the measured value converged gradually to the theoretical value with an ER assumption. These results indicate that, for CRD-A, the ribs behind the absorbing layer play an identical role to that of a honeycomb structure at low-mid frequencies, resulting a local reacting behavior with a weak sound incident angle dependency. Then, the sound incident angle dependency became stronger with increasing frequency because the wavelength is smaller than the spaces between ribs.
3. The Experiment Using a Small Meeting Room
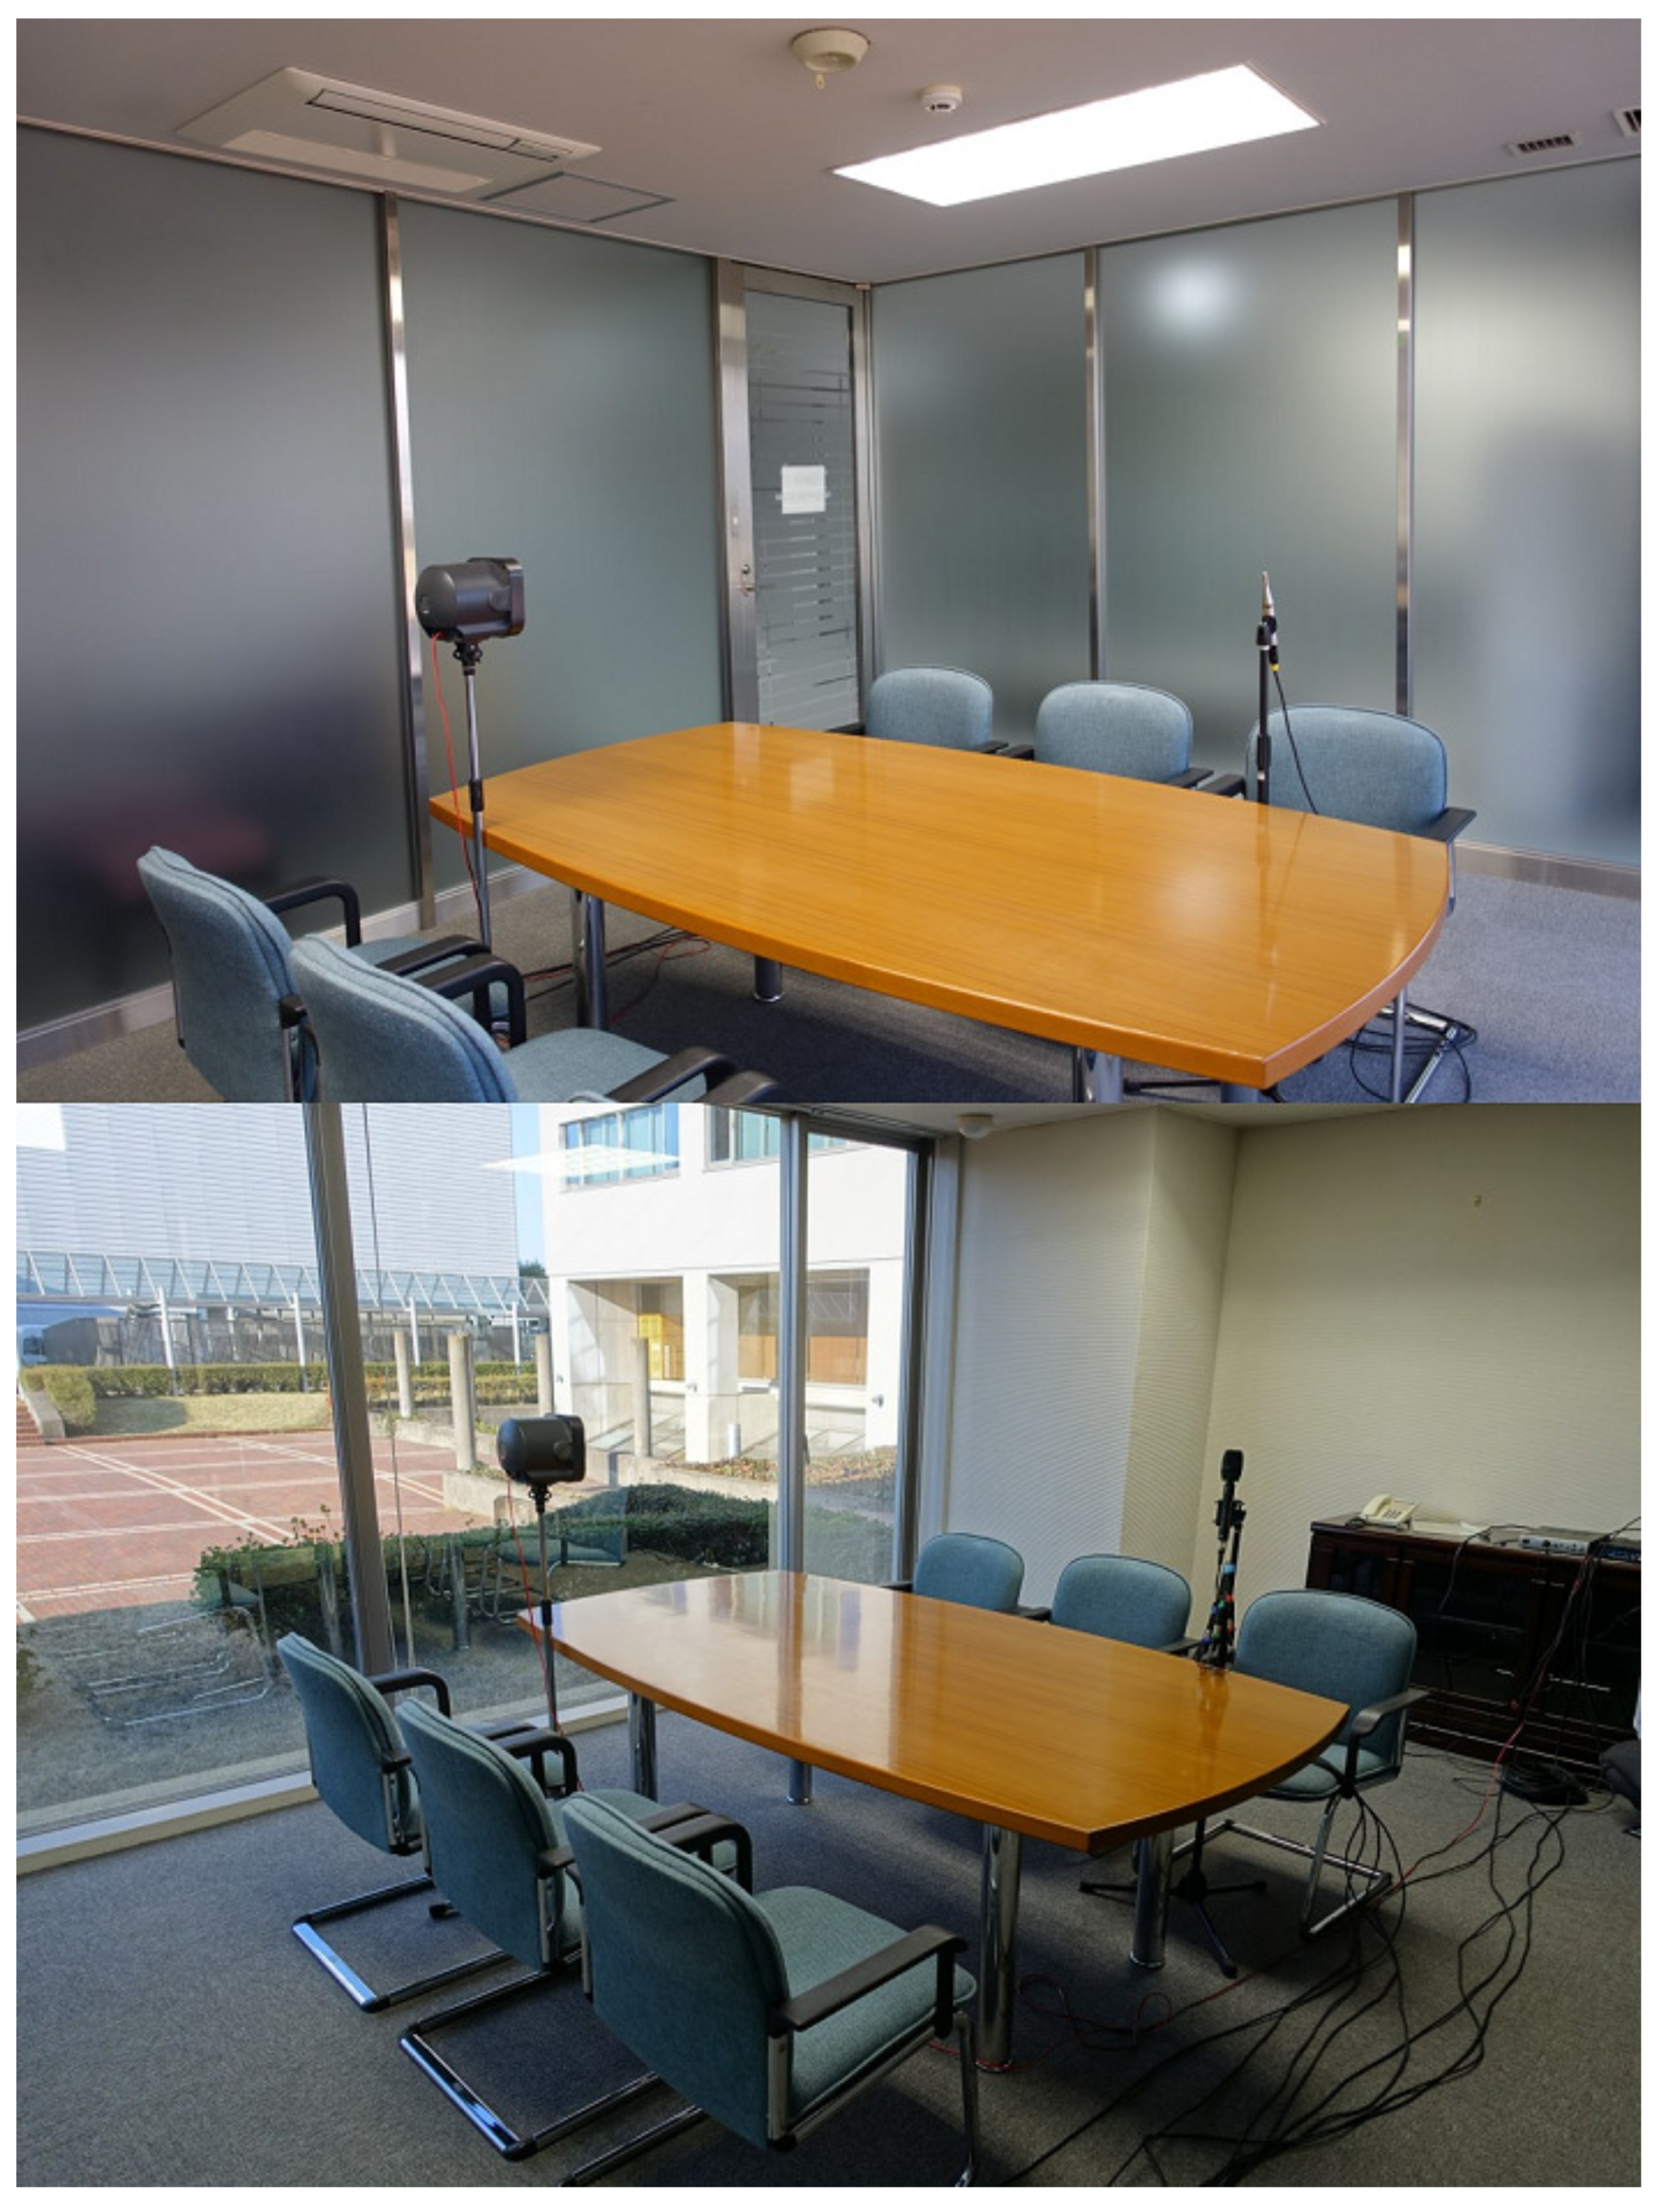
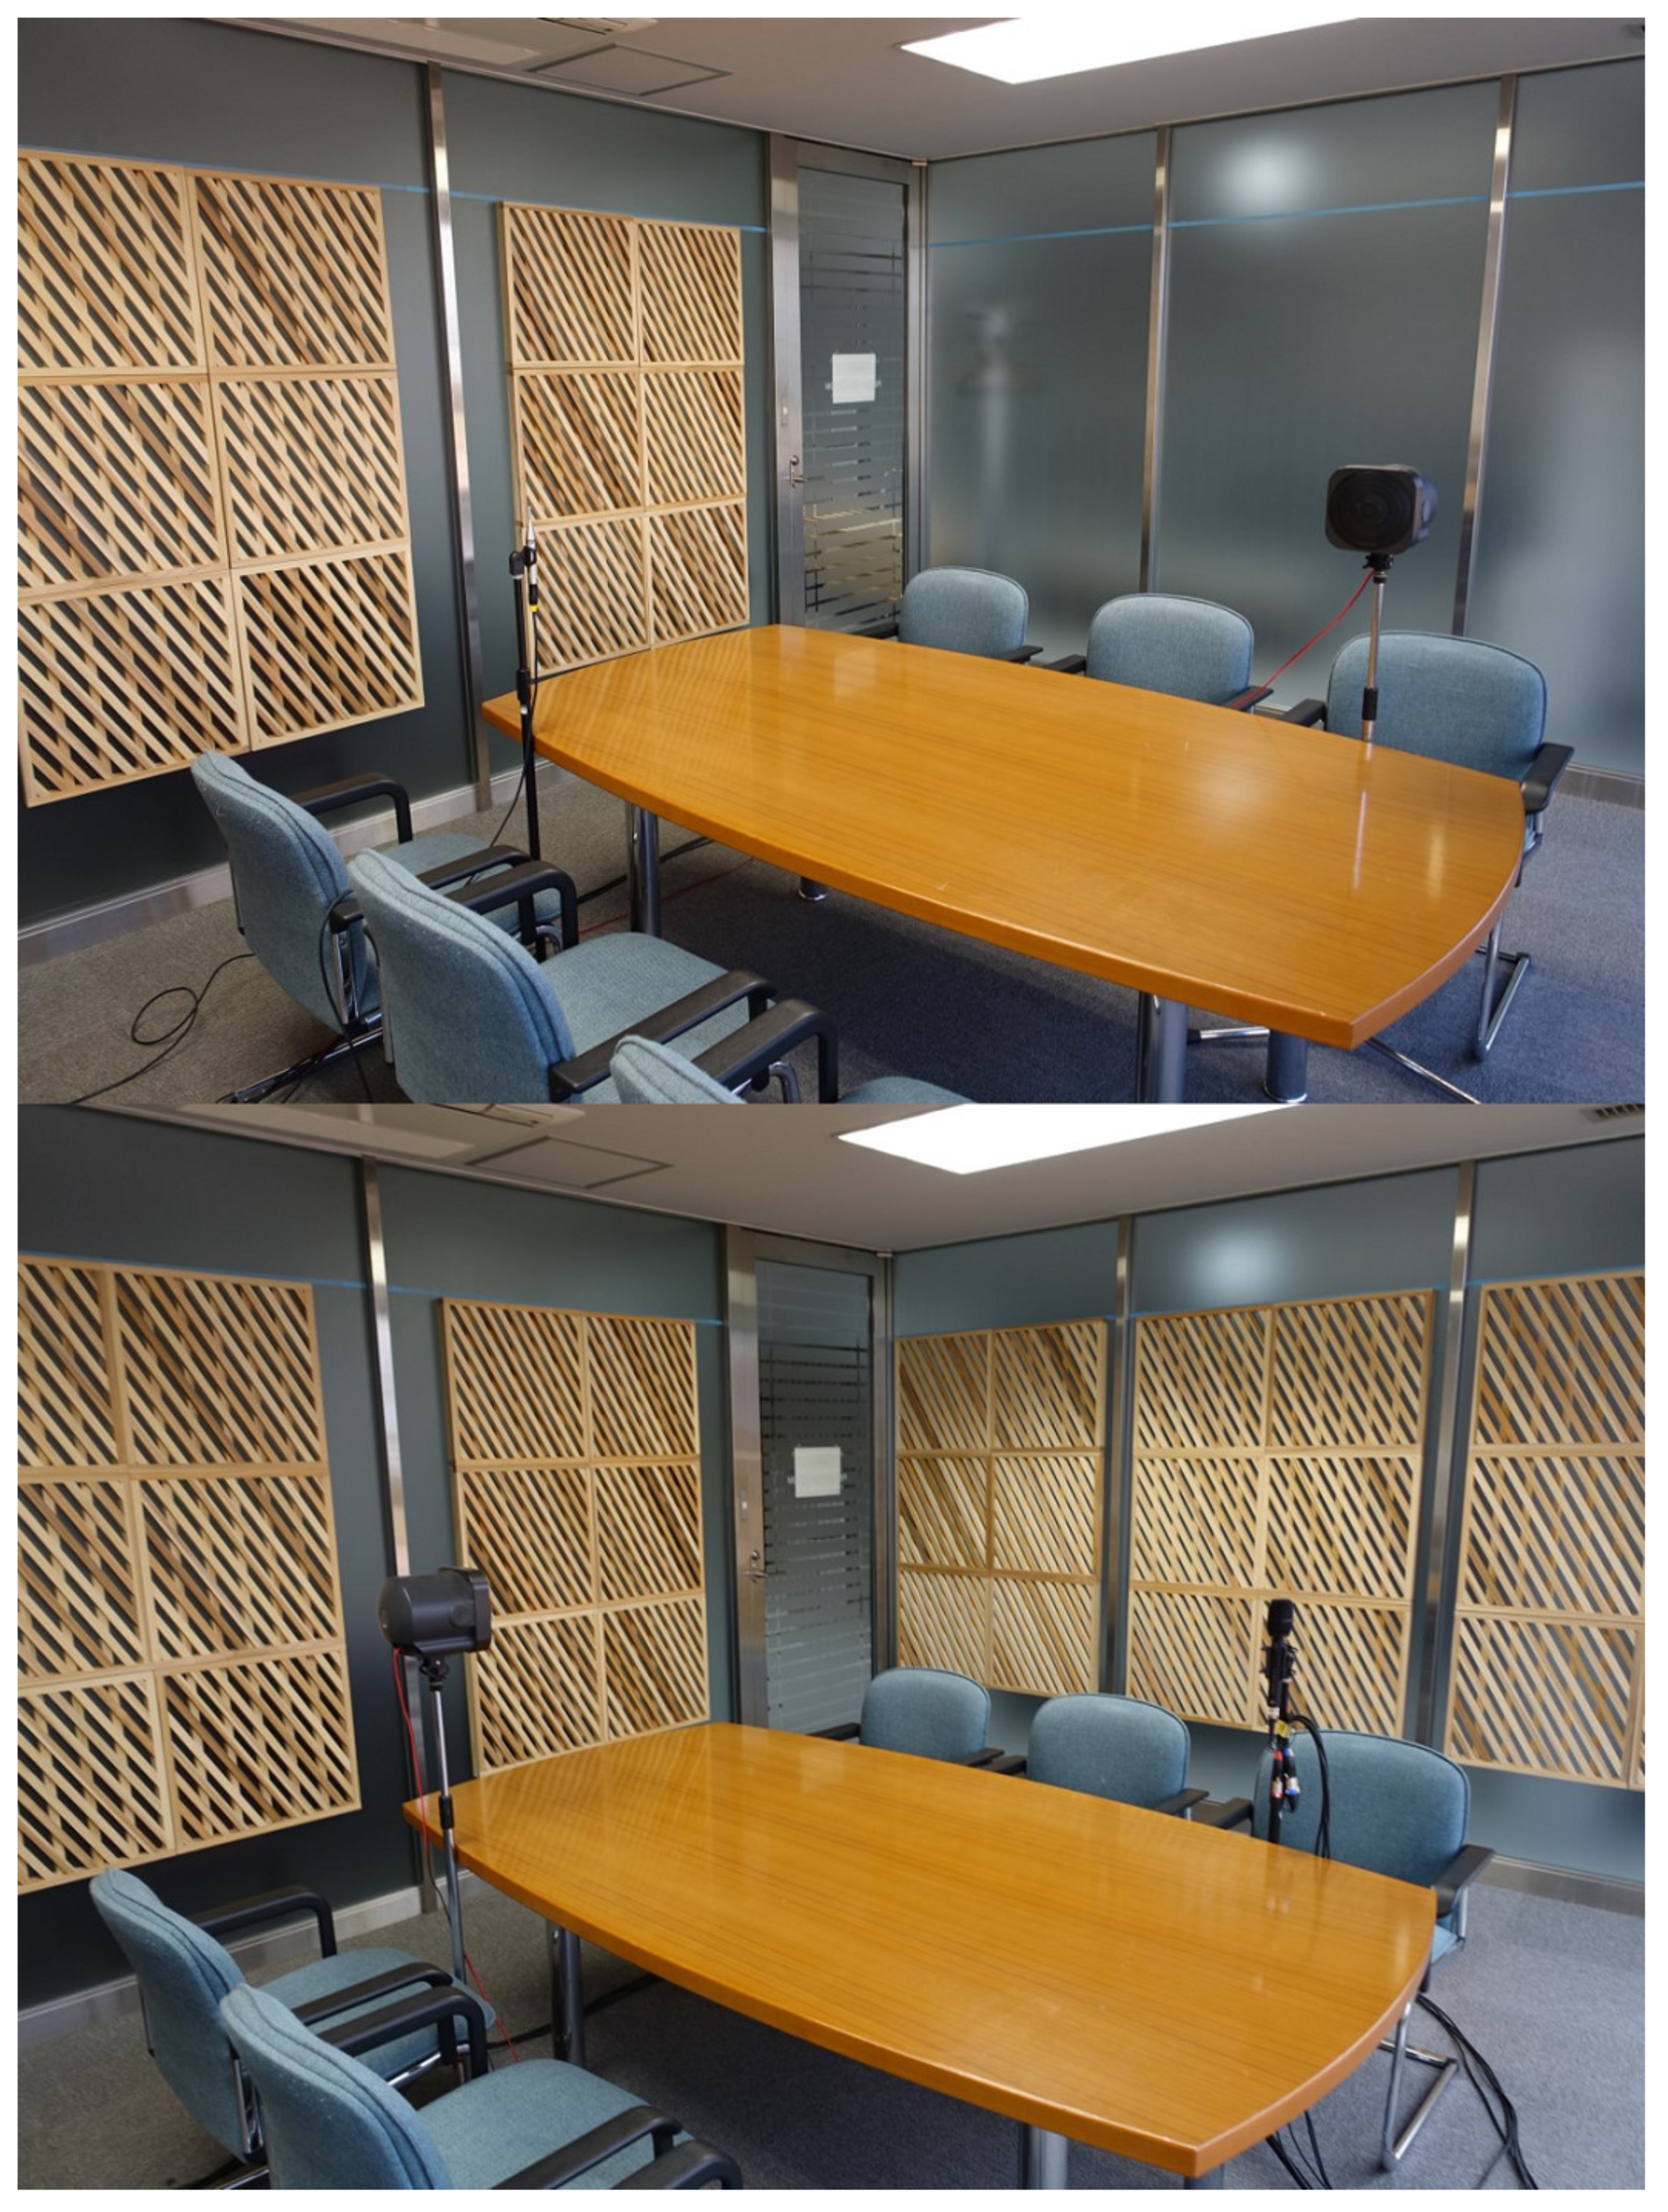
This section describes an experiment conducted with R-1, CRD and CRD-A using a small meeting room. Figure 7 portrays interior views of the small meeting room measured for this study. The meeting room had a gypsum board ceiling, a tile carpet floor, one gypsum board wall and three glass walls. A wooden table was placed at the center of the room with six chairs. Additionally, a wooden shelf was located at the back of the room. The room had slight sound absorption. Consequently, some flutter echo could be perceived by hand clapping. The room’s impulse responses without specimens and with R-1, the CRD and the CRD-A were measured using an omnidirectional microphone. Then, reverberation parameters (reverberation time and early decay time ) and a speech clarity parameter (definition ) were compared with each case to examine CRD and CRD-A effects on the room’s acoustic parameters. Furthermore, sound intensity measurements were taken using a four-channel sound field microphone to investigate the structural differences of reflected sounds among a flat wall, the CRD and the CRD-A. Virtual source locations were visualized, revealing the described incident direction and intensity of reflected sounds incident to the microphone. To observe the effect of scattering reflection by the CRD and absorption by the CRD-A, the visualizations were conducted at 2 kHz octave bands because the CRD and the CRD-A represent a high scattering coefficient and a high absorption coefficient at the frequency band, respectively. As references, the cases at 500 Hz and 1 kHz octave bands were also visualized in Appendix A.
3.1. Setup
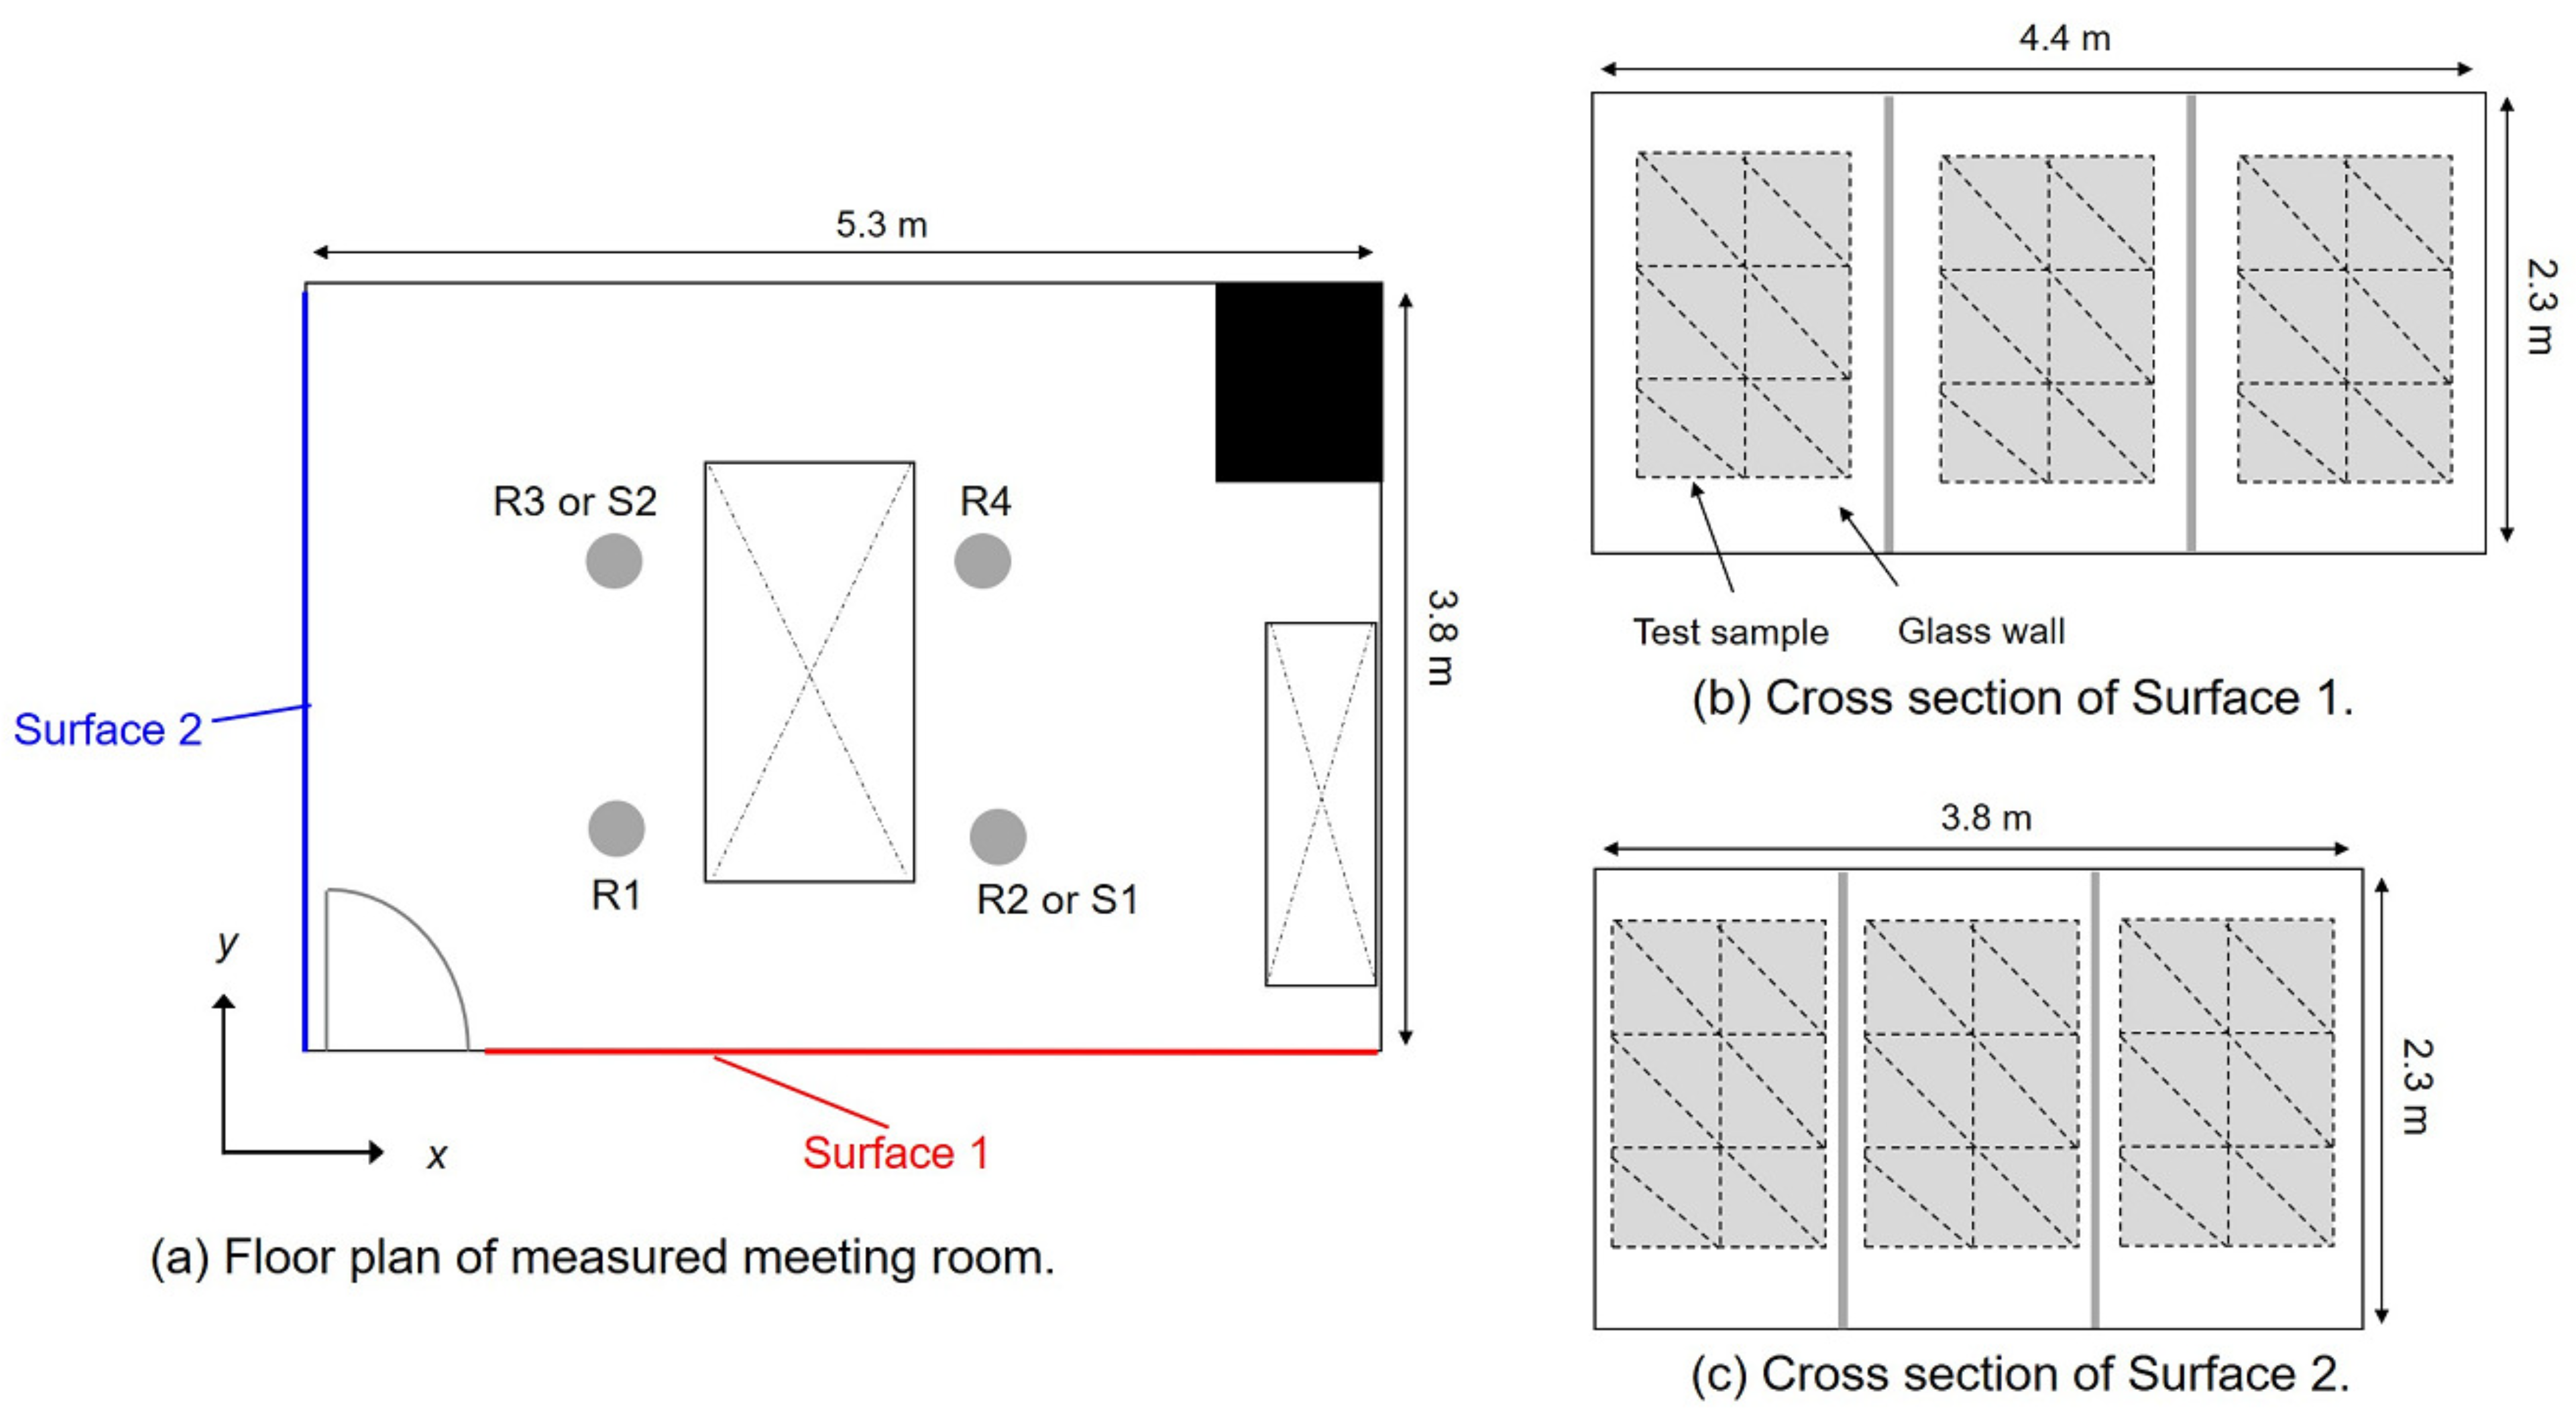
Two source points (S1 and S2) and four receiving points (R1–R4) were located above the chair at a height of 1.2 m from the room floor for the impulse response measurements. Figure 8a shows the floor plan of the small meeting room and locations of source points and receiving points. The receiving points of R2 and R3 were excepted for sources located respectively at S1 and S2. R-1, CRD and CRD-A were installed on only Surface 1 or both Surface 1 and Surface 2 shown in Figure 8. We took impulse response measurements using an omni-directional microphone in the seven cases presented in Table 1. Both Surface 1 and Surface 2 consisted of three glass plates separated with sashes. Figure 8b,c shows cross-sections for Surface 1 and Surface 2. The figures also present cases 1–6 of specimens of 2 × 3 on each glass plate. Figure 9 presents examples of the statuses of measurement in case 2 and case 5. We used an omnidirectional microphone (M-23; Earth Works) and a four-channel sound field microphone (Ambeo VR MIC; Sennheiser Electronic GmbH and Co. KG), respectively, for impulse response measurements and sound intensity measurements. The method for measuring sound intensity using the sound field microphone was well described in [26]. All measurements used the swept-sine signal with signal length of 17 s as a source signal. In addition, the source signal was emitted by a unidirectional speaker to simulate the directivity of human vocalization. Other settings for impulse response measurement were in accordance with the standard [27]. All measurements and calculations of room acoustic parameters and sound intensity vectors were conducted using [28].
3.2. Comparisons of Room Acoustic Parameters
3.2.1. Reverberation Time
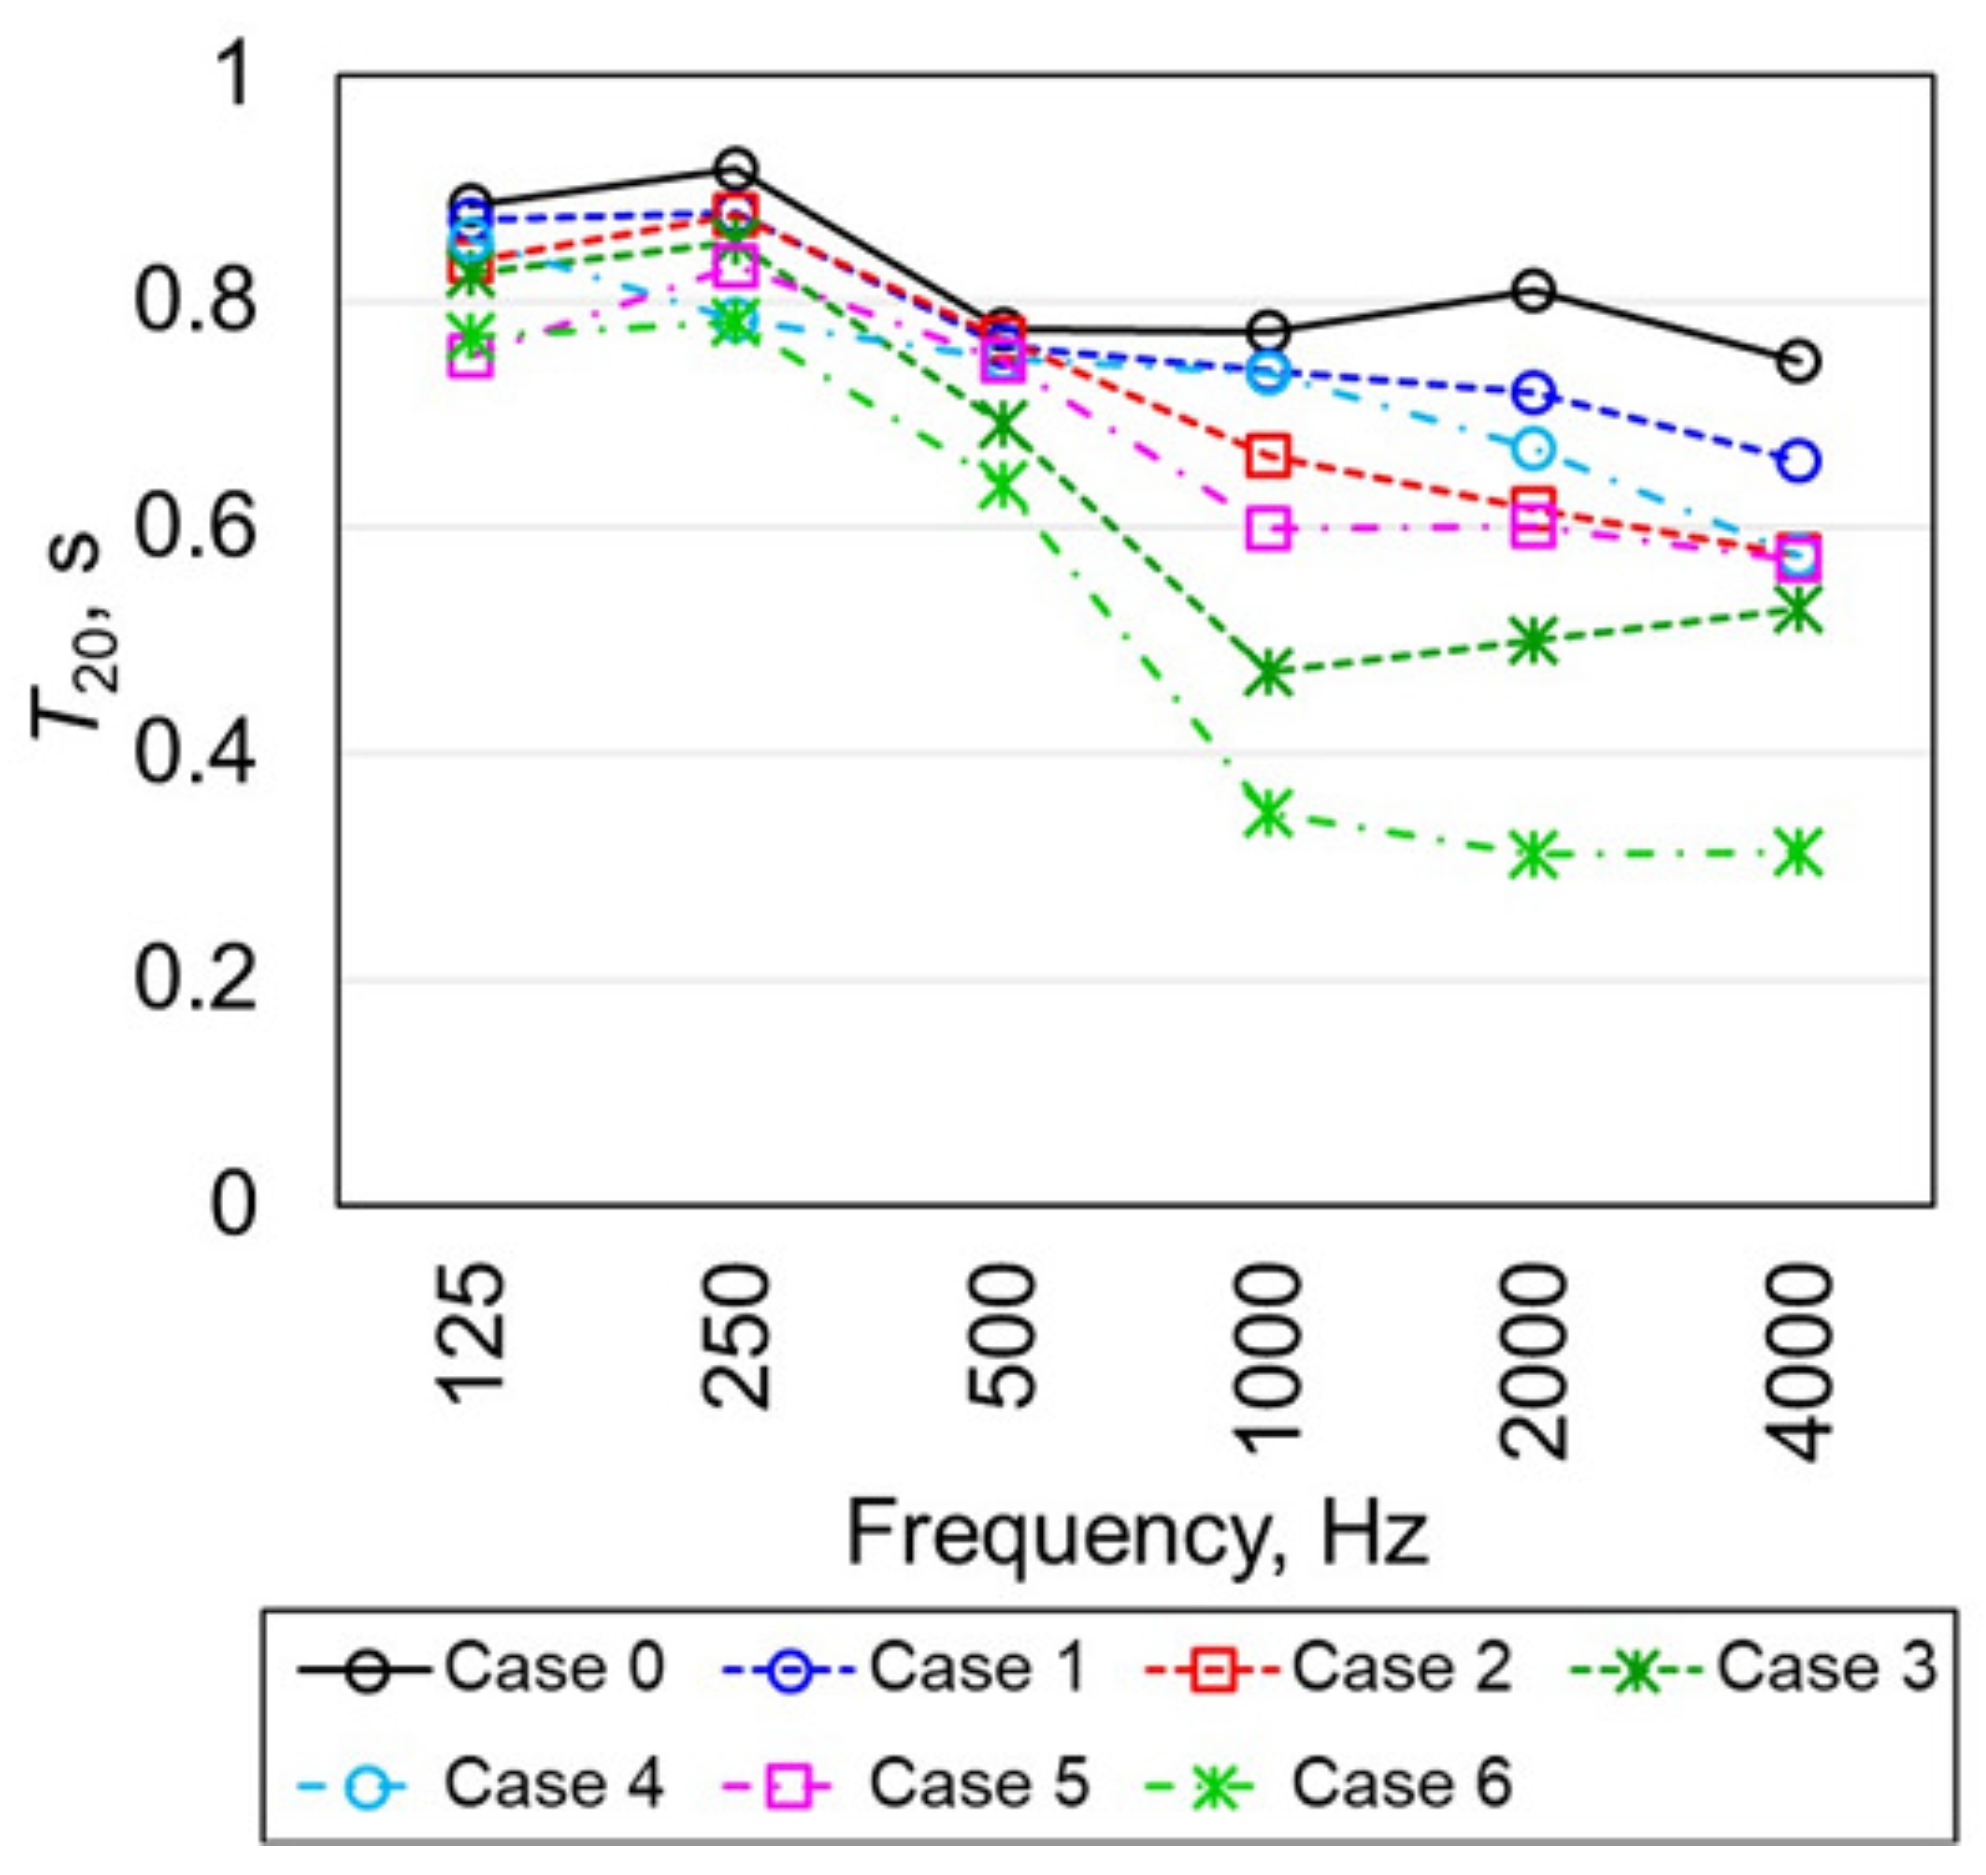
Figure 10 presents a comparison of spatially averaged s measured in each case. By installation of acoustic diffusers, cases 1–6 show shorter than case 0 at all frequency bands. In particular, cases 3 and 6 using highly absorptive CRD-A reduced greatly. Comparing cases 3 and 6, the reverberation time in case 6 decreased as the frequency increased; and a dip is apparent at 1 kHz in case 3. This dip occurred because the diffusivity of sound field at high frequencies lowered in case 3, where the highly absorptive surface was concentrated on one surface of the room. On the other hand, case 2 showed a shorter than in case 1 at frequencies higher than 1 kHz. Case 5 showed a shorter than in case 4 at frequencies higher than 500 Hz. Additionally, the of case 2 was shorter than that of case 4 above 1 kHz. These results clarified that CRD with smaller installation area can reduce the reverberation time in a wide bandwidth more than R-1.
3.2.2. Early Decay Time
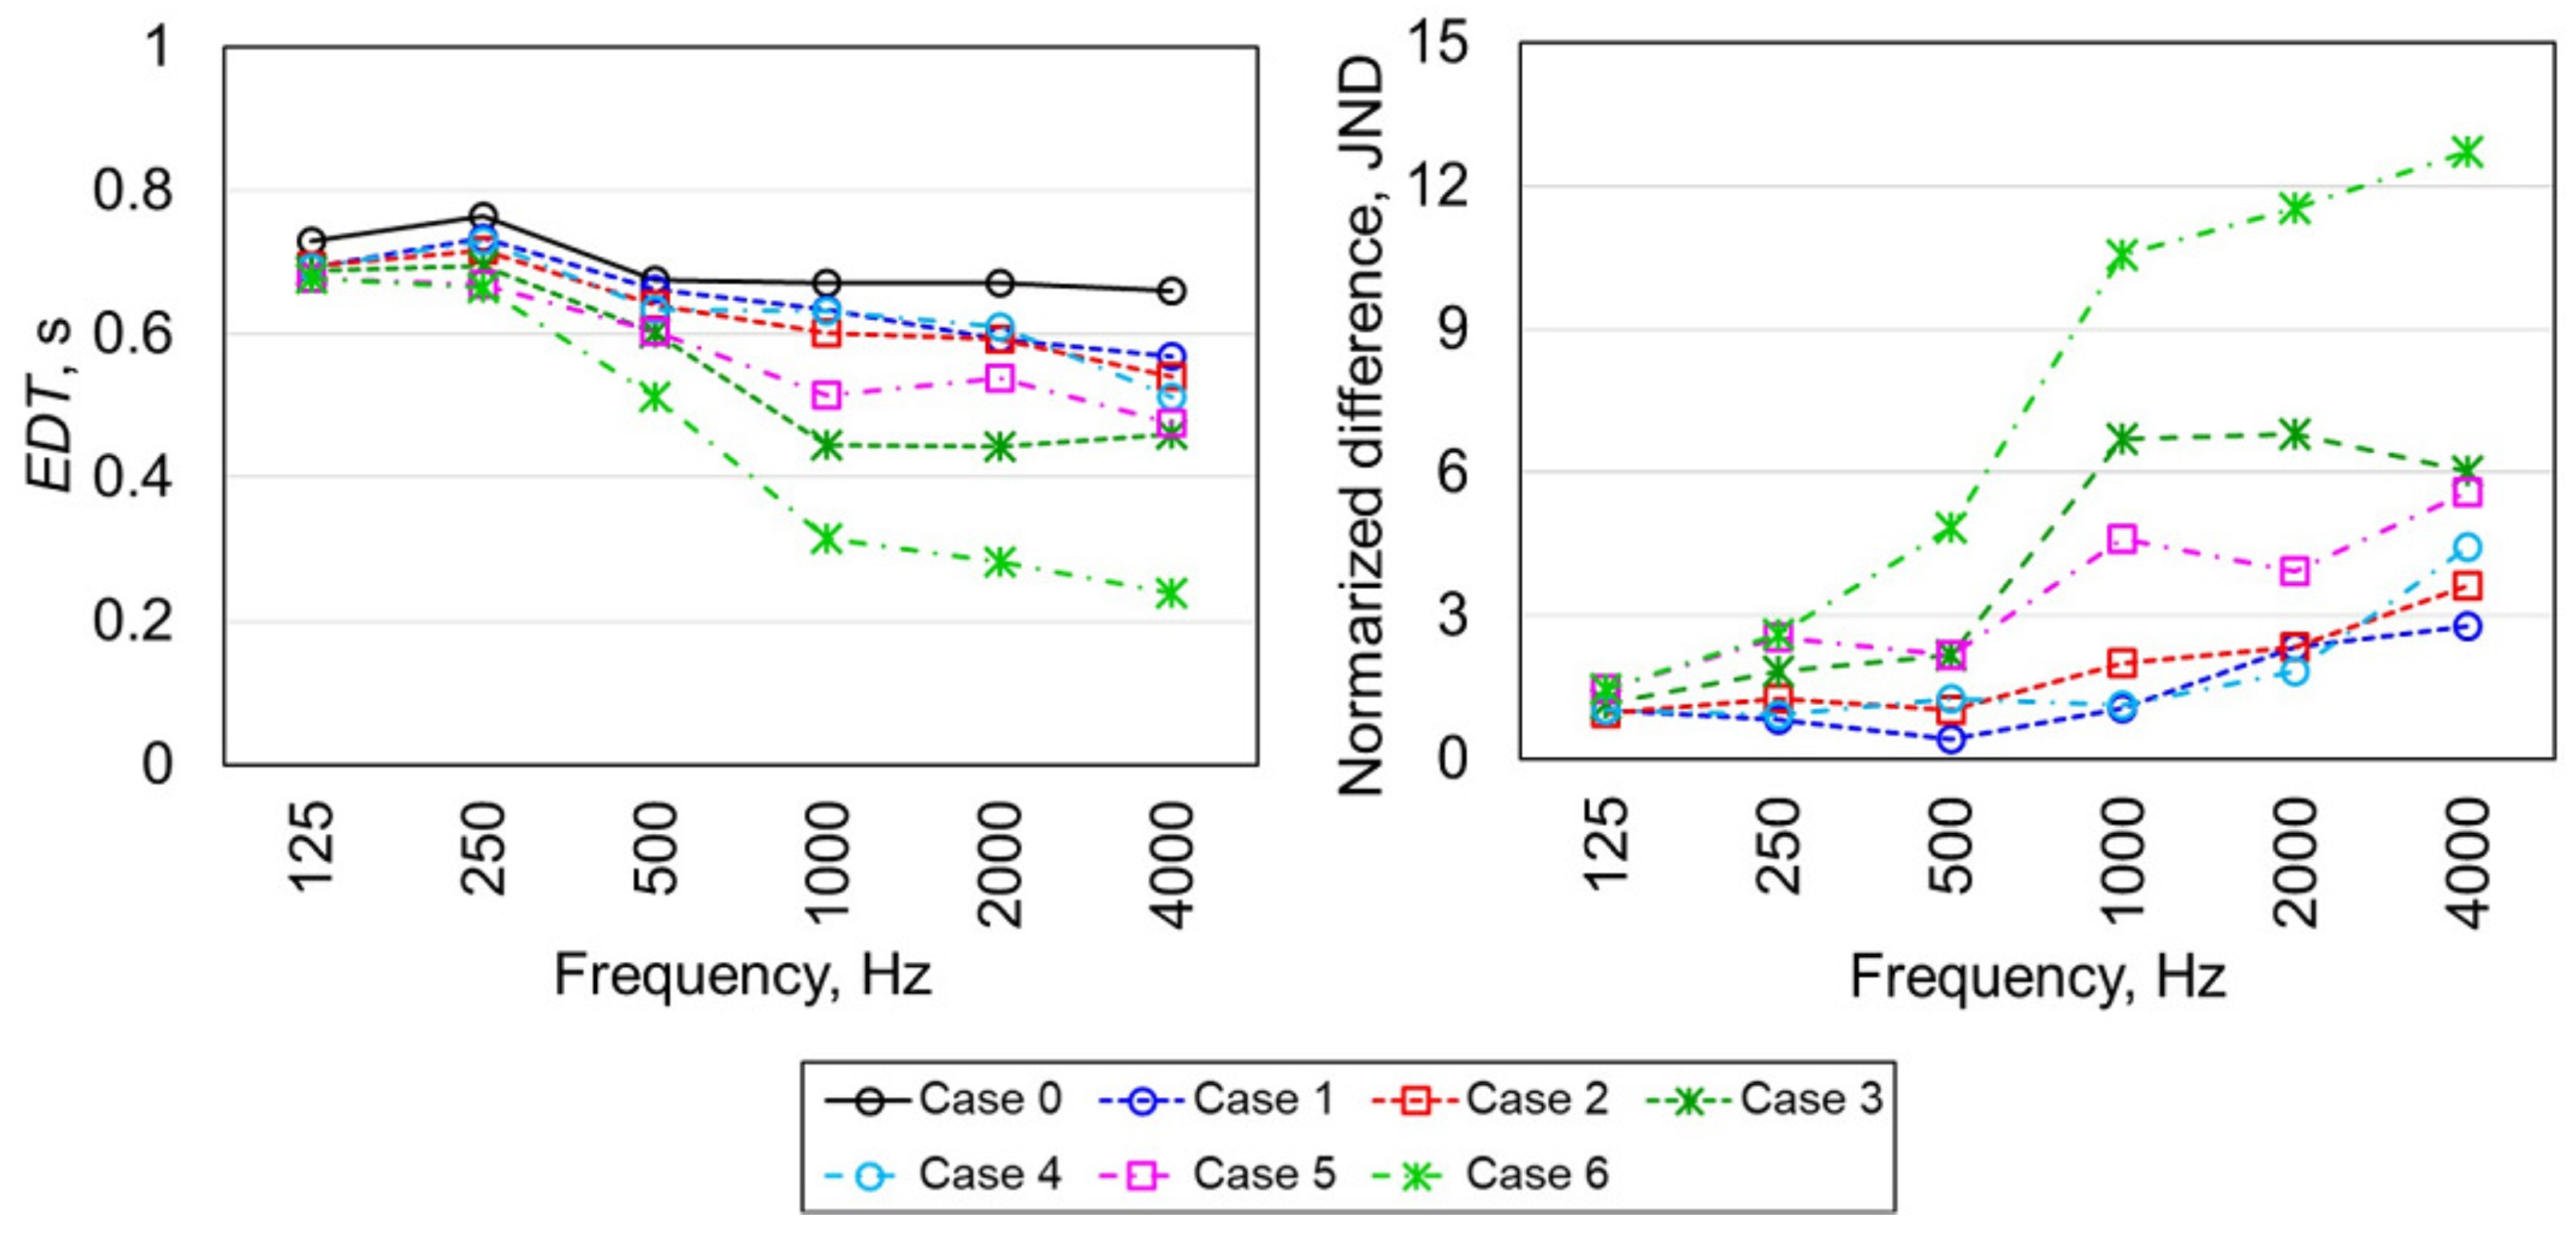
Figure 11a,b shows a comparison of spatial averaged s measured in each case and reductions in relative to case 0 normalized with a just noticeable difference (JND) for each case. Here, we used 5% as the JND, which is from ISO3382-1 [29]. The normalized difference was used as the measure to present a magnitude of change in the acoustic parameter before and after the installation of the diffusers. We note that whether the normalized differences and perceptibility of difference have a linear relation or not is unclear. Cases 1–6 show shorter at all frequency bands than case 0, as in the results. Case 6, with CRD-A installed onto two surfaces, presents the shortest values at all frequencies. Case 6 showed reduced compared to that of case 0—more than 4.9 and 10.6 JND, respectively, at 500 Hz and 1 kHz, indicating that CRD-A has potential for greatly improving reverberation in reflective small meeting rooms. Although case 5, in which the CRD was installed onto two surfaces, showed a longer than case 3 at frequencies higher than 500 Hz, case 5 reduced by 2.2 and 4.6 JND at 500 Hz and 1 kHz in comparison with case 0, respectively. This result presents that CRD without a sound absorbing structure can also improve reverberation in the room more than JND. Additionally, case 5 showed a shorter of more than 1 JND compared to case 4 at frequencies higher than 250 Hz, indicating that CRD has better performance than the 1D periodic diffuser with same installation area for broadband reverberation control.
3.2.3. Definition
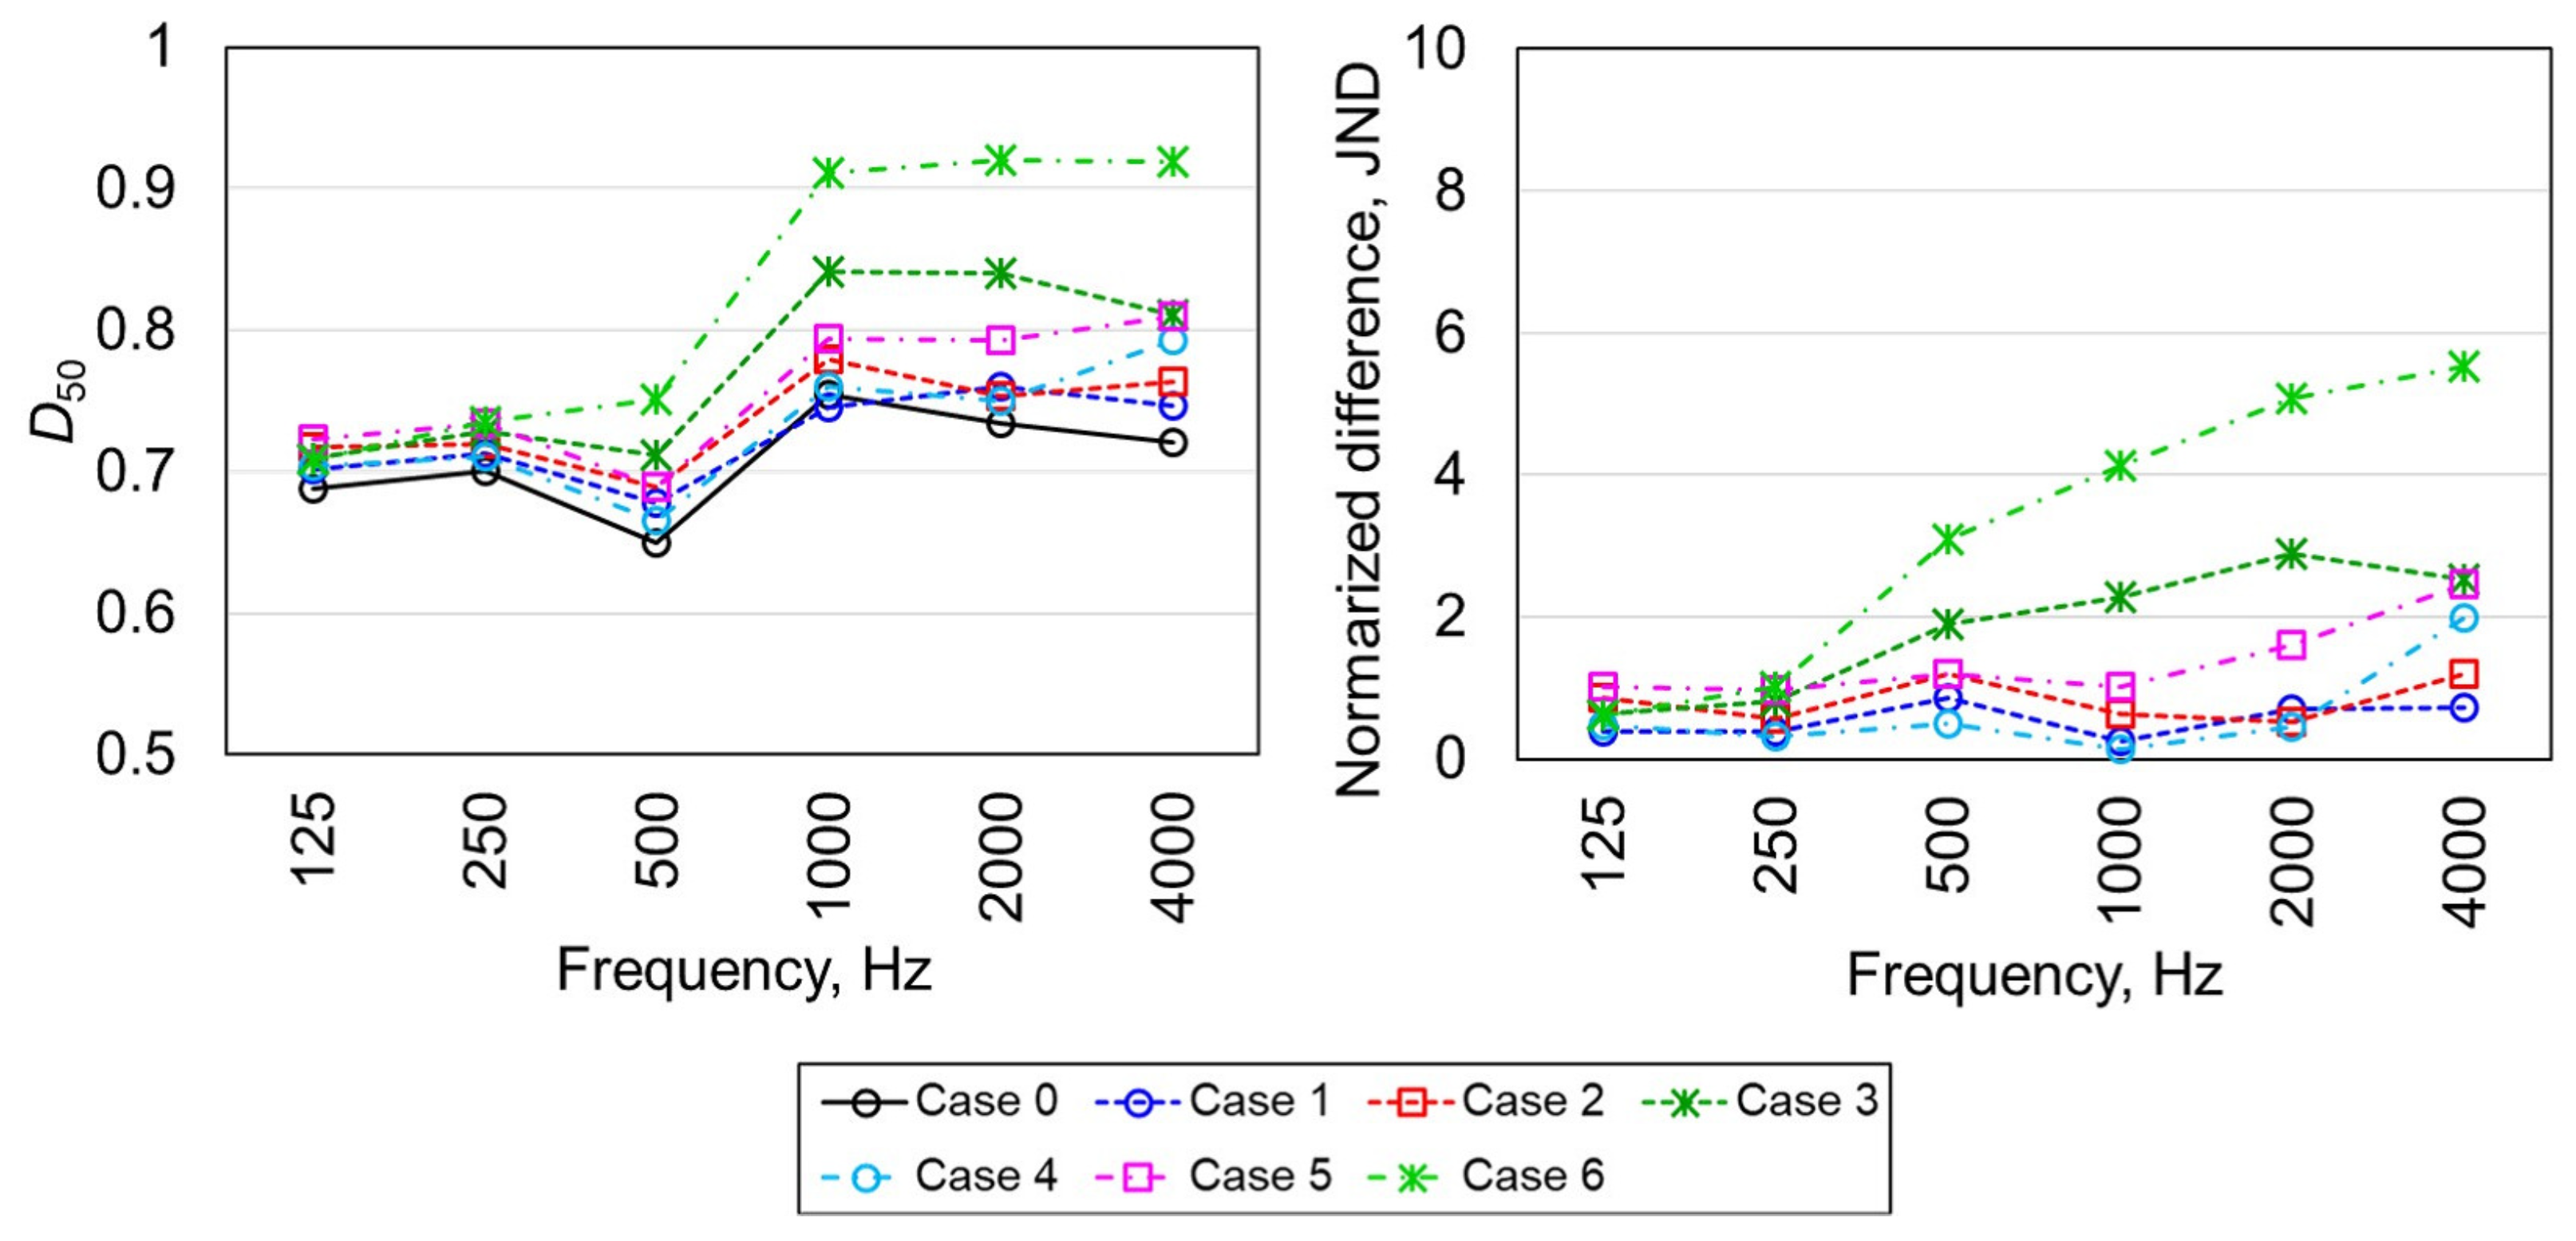
Figure 12a,b presents comparisons of spatial averaged s measured in each case and increases in relative to case 0 normalized with JND (5 % [29]) for each case. The values increased more than 1 JND in comparison with case 0 in the following conditions: case 2 at 500 Hz and 4 kHz; case 3 at 500 Hz and higher; case 4 at 4 kHz; case 5 at 500 Hz and higher; and case 6 at 250 Hz and higher. Case 6 using CRD-A on two surfaces mostly improved in all cases, augmenting more than 3 JND compared with case 0 at 500 Hz and higher. Additionally, for identical installed area, the CRD enhanced speech clarity in a wider frequency band than the 1D periodic diffuser.
3.3. Visualization of Reflected Sound Structure
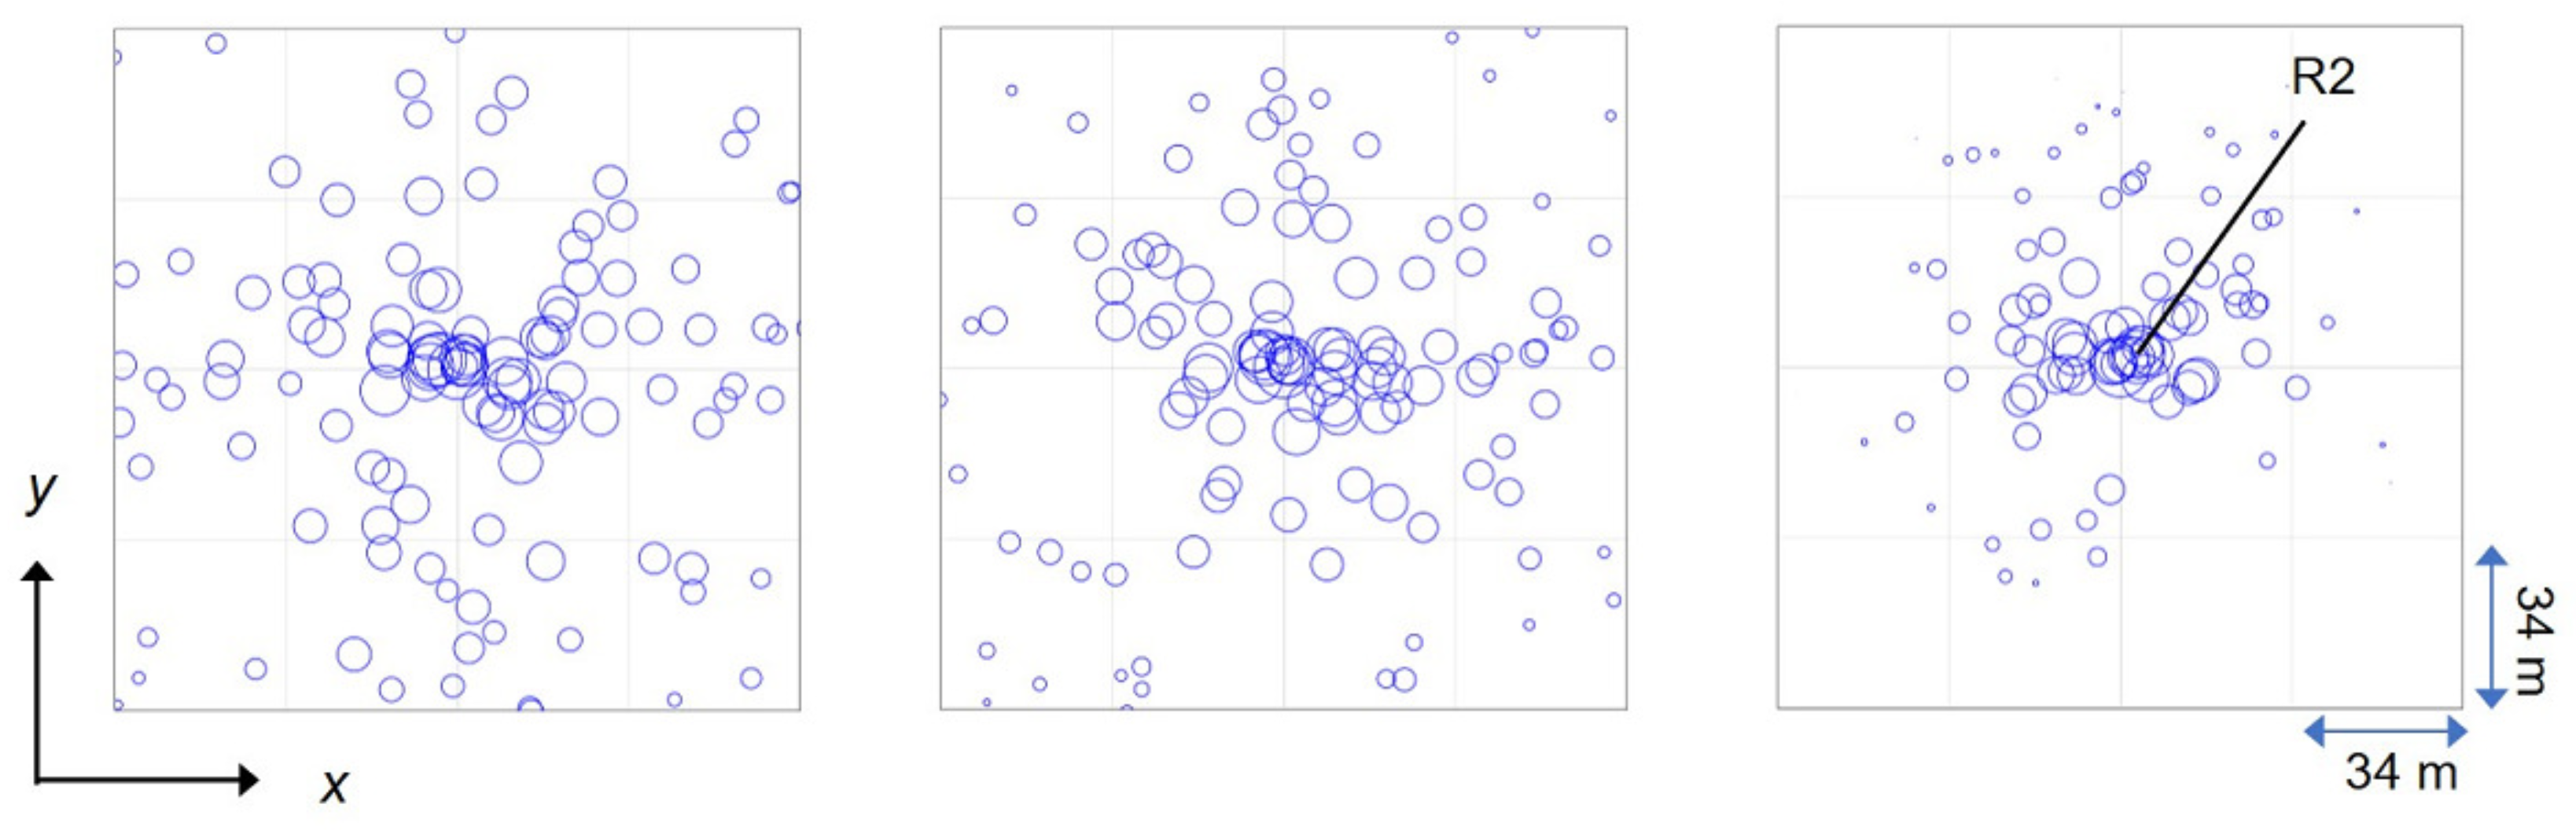
Figure 13 shows visualized virtual source locations in the 2 kHz octave band for the source to receiver distance of S2 to R2 for cases 0, 5 and 6, where the center of the figure corresponds to the location of R2. The figure expresses the respective strengths of incident sounds by circle size and the delay of incident time by the distance of the figure’s center to the circle’s center. We show sound intensities temporally integrated per 2 ms. Then, sounds fainter than −40 dB from direct sounds were excluded. Furthermore, assuming the speed of sound as 340 m/s, a circle 34 m distant from the center represents a reflected sound arriving 0.1 s after the direct sound. In addition, x–y axes in Figure 13 and Figure 8a are identical. Therefore, circles on the left side or a lower side from the centers represent sounds reflected, respectively, by the CRD and the CRD-A in cases 5 and 6. In case 0, the virtual sources were distributed continuously along both the x axis and the y axis, which led to multiple reflections between parallel walls, potentially introducing long reverberation and flutter echo. Case 5 resolved the continuous distribution of virtual sources in case 0. Additionally, virtual sources on the left side and lower part of the figure decreased, meaning that the CRD prevented harmful reflected sounds by scattering reflection. This reflection is a mechanism for the reduction of and , and for an increase of with installation of the CRD. On the other hand, in case 6, the later virtual sources at all directions, which brought the continuous distribution observed in case 0 and deterioration of , were drastically reduced. The result indicates that the CRD-A improved the reverberation parameters and in the room thanks to its high absorption property.
4. Conclusions
This paper described a crossed ribs diffuser (CRD) as an effective tool for room acoustic control and explained an experimental investigation of its effectiveness. The CRD was constructed by overlapping two 1D periodic rib diffusers with different specifications. We first evaluated the random-incidence scattering coefficients of CRD and 1D periodic diffusers using a 1/5 scaled model and numerical method. The CRD overcame an important weak point of 1D periodic diffusers by which high scattering performance was obtained in a narrow frequency band, achieving a better scattering coefficient than 1D rib diffusers composing the CRD in a wide band. Then, the absorption performances of manufactured specimens were compared via sound absorption measurements using a reverberation room. The CRD showed a diffuse field absorption coefficient of around 0.2 above 1 kHz without absorptive materials, which was slightly higher than those of 1D periodic diffusers. Here, we also measured the absorption coefficient of the CRD-A, inserting an absorbing layer between upper and lower ribs of the CRD, resulting in a porous-type absorption mechanism and broadband high absorption coefficient. We also presented that the diffuse field absorption coefficient of CRD-A was predicted accurately using a theoretical model for the single permeable membrane absorber. Subsequently, we conducted an experiment as the demonstration of CRD performance. The experimental results demonstrated that the CRD and the CRD-A improved the reverberation parameters and speech clarity in the small meeting room more than JND values. In particular, the installation of CRD-A onto two walls reduced more than 4.8 JND compared with that of a vacant room at 500 Hz and higher. Furthermore, the CRD was able to improve the reverberation parameters and speech clarity more than the 1D rib diffuser with same installation area as broadband. Finally, we visualized structural differences in reflected sounds among those of a flat wall, the CRD and the CRD-A. The results clarified that CRD controlled acoustics by preventing multiple reflections between parallel walls with scattering reflection, whereas the CRD-A improved acoustics by removing later reflected sounds with their highly absorptive properties. To explore the further applicability of the crossed ribs structures, we are now attempting the next experiment with a larger meeting room. In addition, the presented CRD design was a trial. Thus, the optimum geometrical specification for the CRD is unclear in this stage. Development of a prediction method for the scattering property of CRD is also a subject for examination in future studies.
Author Contributions
Conceptualization, T.Y., Y.U., N.M. and Y.M.; investigation, T.Y.; methodology, T.Y.; supervision, T.Y.; project administration, Y.U.; resources T.Y., Y.U., N.M. and Y.M.; validation, T.Y.; visualization, T.Y.; writing—original draft, T.Y.; writing—review and editing, T.Y., Y.U., N.M. and Y.M. All authors have read and agreed to the published version of the manuscript.
Funding
This research received no external funding.
Institutional Review Board Statement
Not applicable.
Informed Consent Statement
Not applicable.
Data Availability Statement
Not applicable.
Conflicts of Interest
The authors declare no conflict of interest.
Appendix A. Visualization of Reflected Sound Structure at 500 Hz and 1 kHz
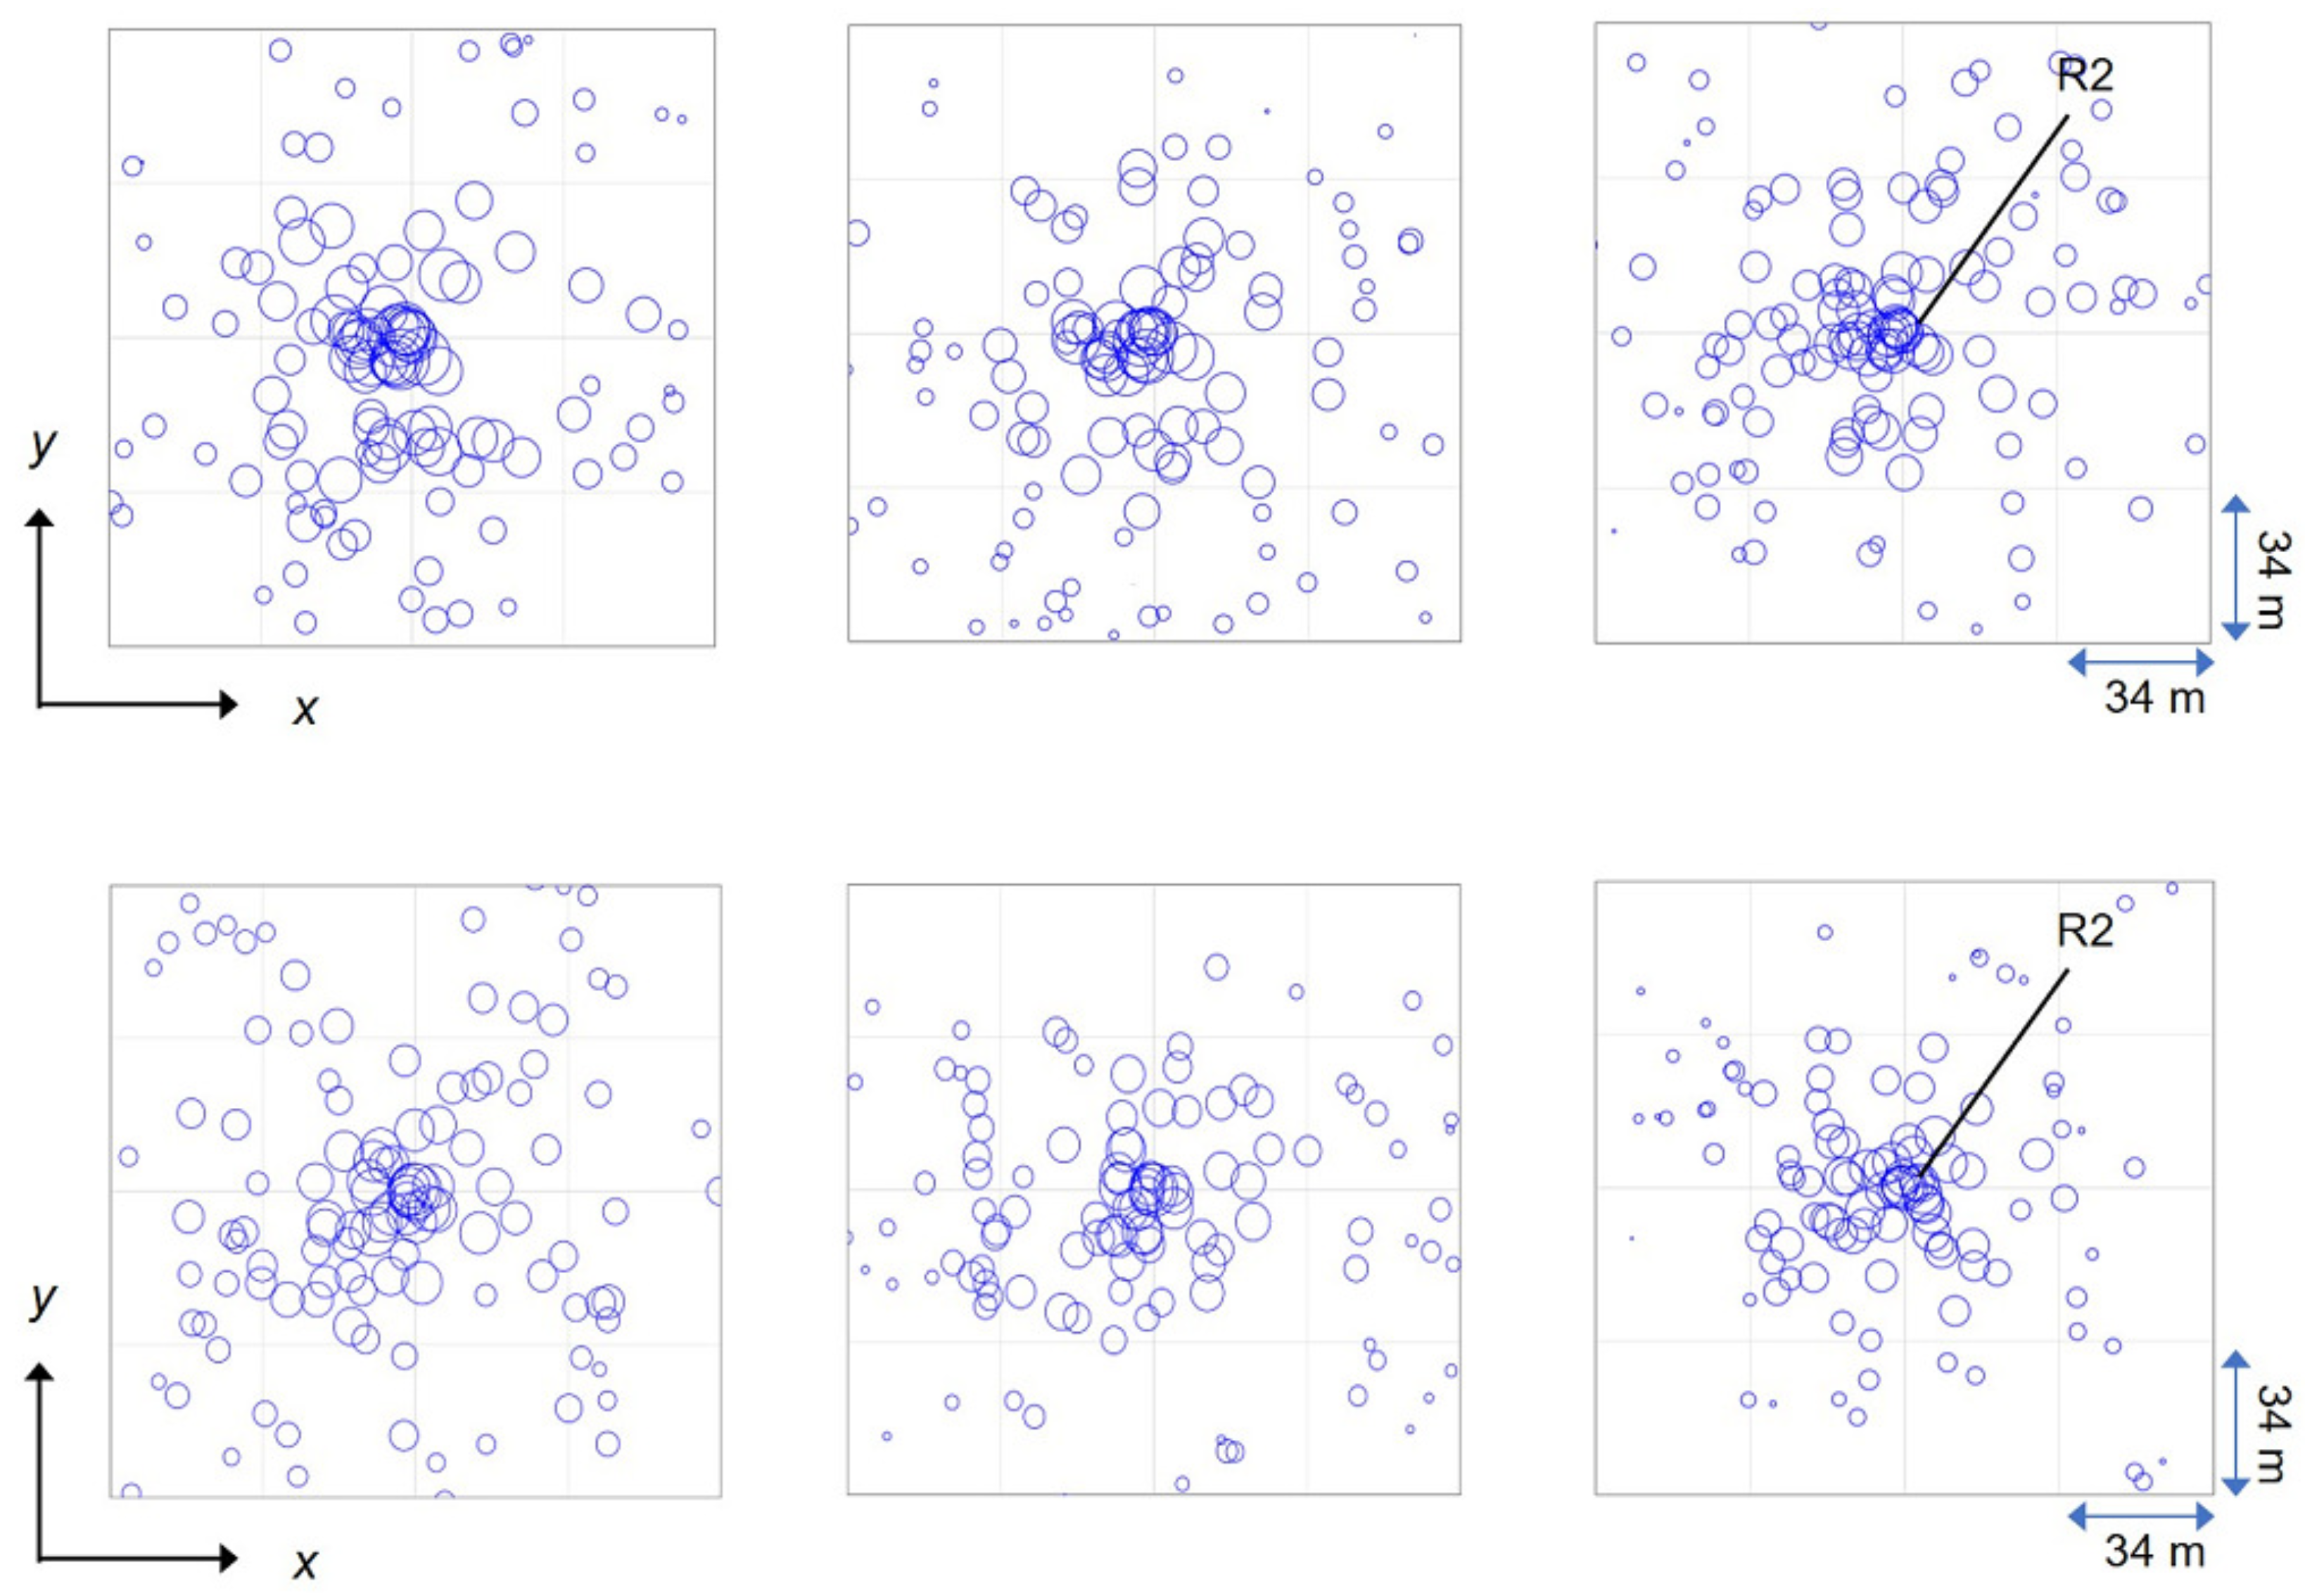
This appendix presents the visualized virtual source locations at 500 Hz and 1 kHz octave band in the source to receiver condition of S2 to R2 for cases 0, 5 and 6 as references, which are shown in Figure A1.
Figure A1.
Visualized virtual source locations on the x–y plane for the source to receiver condition of S2 to R2 at 500 Hz and 1 kHz octave band in the cases of case 0 (Left), case 5 (Center) and case 6 (Right). The upper figures and the lower figures respectively present the cases at 500 Hz and 1 kHz.

References
- D’Antonio, P.; Cox, T.J. AES information document for room acoustics and sound reinforcement systems—Characterization and measurement of surface scattering uniformity. J. Audio Eng. Soc. 2001, 49, 149–165. [Google Scholar]
- ISO. 17497–2:2012 Acoustics—Sound-Scattering Properties of Surfaces—Art 2: Measurement of the Directional Diffusion Coefficient in a Free Field; International Organization for standardization: Geneva, Switzerland, 2004. [Google Scholar]
- Vorländer, M.; Mommertz, E. Definition and measurement of random-incidence scattering coefficients. Appl. Acoust. 2000, 60, 187–199. [Google Scholar] [CrossRef]
- Mommertz, E. Determination of scattering coefficients from the reflection directivity of architectural surfaces. Appl. Acoust. 2000, 60, 201–203. [Google Scholar] [CrossRef]
- ISO. 17497–1:2004 Acoustics—Sound-Scattering Properties of Surfaces—Part 1: Measurement of the Random-Incidence Scattering Coefficient in a Reverberation Room; International Organization for Standardization: Geneva, Switzerland, 2004. [Google Scholar]
- Sakuma, T. Approximate theory of reverberation in rectangular rooms with specular and diffuse reflections. J. Acoust. Soc. Am. 2012, 132, 2325–2336. [Google Scholar] [CrossRef] [PubMed]
- ODEON 16 User’s Manual. 2020. Available online: https://odeon.dk/download/Version16/OdeonManual.pdf (accessed on 9 March 2021).
- Cox, T.J.; Dalenback, B.I.L.; D’Antonio, P.; Embrechts, J.J.; Jeon, J.Y.; Mommertz, E.; Vorländer, M. A Tutorial on Scattering and Diffusion Coefficients for Room Acoustic Surfaces. Acta Acust. United Acust. 2006, 92, 1–15. [Google Scholar]
- Cox, T.J.; D’Antonio, P. Measurement of reflections. In Acoustic Absorbers and Diffusers: Theory, Design and Application, 3rd ed.; CRC Press: Boca Raton, FL, USA, 2016; pp. 131–173. [Google Scholar]
- Cox, T.J.; D’Antonio, P. Diffusers: Applications and basic principles. In Acoustic Absorbers and Diffusers: Theory, Design and Application, 3rd ed.; CRC Press: Boca Raton, FL, USA, 2016; pp. 41–89. [Google Scholar]
- Sanavi, A.; Schäffer, B.; Heutschi, K.; Eggenschwiler, K. On the effect of an acoustic diffuser in comparison with an absorber on the subjectively perceived quality of speech in a meeting room. Acta Acust. United Acust. 2017, 103, 1037–1049. [Google Scholar] [CrossRef]
- Labia, L.; Shtrepi, L.; Astolfi, A. Improved Room Acoustics Quality in Meeting Rooms: Investigation on the Optimal Configurations of Sound—Absorptive and Sound-Diffusive Panels. Acoustics 2020, 2, 451–473. [Google Scholar] [CrossRef]
- Choi, Y.J. Effects of periodic type diffusers on classroom acoustics. Appl. Acoust. 2013, 74, 694–707. [Google Scholar] [CrossRef]
- Arvidsson, E.; Nilsson, E.; Hagberg, D.B.; Karlsson, O.J.I. The Effect on Room Acoustical Parameters Using a Combination of Absorbers and Diffusers—An Experimental Study in a Classroom. Acoustics 2020, 2, 505–523. [Google Scholar] [CrossRef]
- Lee, H.; Sakuma, T. Numerical characterization of acoustic scattering coefficients of one-dimensional periodic surfaces. Appl. Acoust. 2015, 88, 129–136. [Google Scholar] [CrossRef]
- Jiménze, N.; Cox, T.J.; Romero-Gracía, V.; Groby, J.-P. Metadiffusers: Deep-subwavelength sound diffusers. Sci. Rep. 2017, 7, 5389. [Google Scholar] [CrossRef] [PubMed] [Green Version]
- Lee, H.; Tsuchiya, Y.; Sakuma, T. Acoustic scattering characteristics of Penrose-tiling-type diffusers. Appl. Acoust. 2018, 130, 168–176. [Google Scholar] [CrossRef]
- Kamisiński, T.; Brawata, K.; Pilch, A.; Rubacha, J.; Zastawnik, M. Sound Diffusers with Fabric Covering. Arch. Acoust. 2012, 37, 317–322. [Google Scholar] [CrossRef] [Green Version]
- Sakuma, T.; Lee, H. Validation of the sample rotation scheme in the measurement of random-incidence scattering coefficients. Acta Acust. United Acust. 2013, 99, 737–750. [Google Scholar] [CrossRef]
- AMFG Reflex. Available online: https://reflex.afmg.eu/ (accessed on 9 March 2021).
- Sakuma, T.; Kosaka, Y. Relationship between the scattering coefficients determined with coherent averaging and with directivity correlation. Appl. Acoust. 2009, 95, 669–677. [Google Scholar] [CrossRef]
- ISO. 354:2003 Acoustics—Measurement of Sound Absorption in a Reverberation Room; International Organization for Standardization: Geneva, Switzerland, 2003. [Google Scholar]
- Okuzono, T.; Shimizu, N.; Sakagami, K. Predicting absorption characteristics of single-leaf permeable membrane absorbers using finite element method in a time domain. Appl. Acoust. 2019, 151, 172–182. [Google Scholar] [CrossRef]
- Ingard, U. Sheet absorbers. In Notes on Sound Absorption Technology; Noise Control Foundation: New York, NY, USA, 1994; pp. 1–16. [Google Scholar]
- Okuzono, T.; Uenishi, K.; Sakagami, K. Experimental comparison of absorption characteristics of single-leaf permeable membrane absorbers with different backing air cavity designs. Noise Control Engr. J. 2020, 68, 237–245. [Google Scholar] [CrossRef]
- Martellotta, F. On the use of microphone arrays to visualize spatial sound field information. Appl. Acoust. 2013, 74, 987–1000. [Google Scholar] [CrossRef]
- ISO. 3382–2:2008 Acoustics—Measurement of Room Acoustic Parameters—Part 2: Reverberation Time in Ordinary Rooms; International Organization for Standardization: Brussels, Belgium, 2008. [Google Scholar]
- IRIS 2.0. Available online: http://www.iris.co.nz/ (accessed on 9 March 2021).
- ISO. 3382–1:2009 Acoustics—Measurement of Room Acoustic Parameters—Part 1: Performance Spaces; International Organization for standardization: Geneva, Switzerland, 2009. [Google Scholar]
Figure 1.
Cross-sections of R-1 (Upper) and R-2 (Lower).

Figure 2.
Manufactured samples: R-1 (Left); R-2 (Center); and crossed rib diffuser (Right).

Figure 3.
1/5 scale sample of CRD surrounded with a plastic border for scattering coefficient measurement.
Figure 3.
1/5 scale sample of CRD surrounded with a plastic border for scattering coefficient measurement.

Figure 4.
Random-incidence scattering coefficients of various 1D periodic rib diffusers (R-1, R-2, R-1-W and R-2-W) and the CRD.
Figure 4.
Random-incidence scattering coefficients of various 1D periodic rib diffusers (R-1, R-2, R-1-W and R-2-W) and the CRD.

Figure 5.
Laying a sound-absorbing layer on R-1 (Upper), and a sound absorption measurement of the CRD-A (Lower).
Figure 5.
Laying a sound-absorbing layer on R-1 (Upper), and a sound absorption measurement of the CRD-A (Lower).

Figure 6.
Measured absorption coefficients of R-1, R-2, CRD and CRD-A compared with the theoretical absorption coefficients of a single permeable membrane absorber based on an assumption of an extended reaction (ER) and a local reaction (LR).
Figure 6.
Measured absorption coefficients of R-1, R-2, CRD and CRD-A compared with the theoretical absorption coefficients of a single permeable membrane absorber based on an assumption of an extended reaction (ER) and a local reaction (LR).

Figure 7.
Interior views of the small meeting room measured for this study.

Figure 8.
(a) Floor plan of the meeting room, including locations of source points and receiver points. (b) A cross-section of Surface 1, and (c) a cross-section of Surface 2.
Figure 8.
(a) Floor plan of the meeting room, including locations of source points and receiver points. (b) A cross-section of Surface 1, and (c) a cross-section of Surface 2.

Figure 9.
Status of measurements for case 2 (Upper) and case 5 (Lower).

Figure 10.
Spatially averaged reverberation time, s, in a small meeting room for cases 0–6.

Figure 11.
Spatially averaged s for a small meeting room for cases 0–6 (Left) and differences from case 0 normalized by the JND value (5% [29]) (Right).
Figure 11.
Spatially averaged s for a small meeting room for cases 0–6 (Left) and differences from case 0 normalized by the JND value (5% [29]) (Right).

Figure 12.
Spatially averaged s in a small meeting room for cases 0–6 (Left) and differences from case 0 normalized by JND value (5% [29]) (Right).
Figure 12.
Spatially averaged s in a small meeting room for cases 0–6 (Left) and differences from case 0 normalized by JND value (5% [29]) (Right).

Figure 13.
Visualized virtual source locations on the x–y plane for the source to receiver distance of S2 to R2 in the 2 kHz octave band in case 0 (Left), case 5 (Center) and case 6 (Right).
Figure 13.
Visualized virtual source locations on the x–y plane for the source to receiver distance of S2 to R2 in the 2 kHz octave band in case 0 (Left), case 5 (Center) and case 6 (Right).


Table 1.
Room conditions for impulse response measurements.
| Case | Location | Material |
|---|---|---|
| 0 | – | – |
| 1 | Surface 1 | R-1 |
| 2 | Surface 1 | CRD |
| 3 | Surface 1 | CRD-A |
| 4 | Surface 1 + Surface 2 | R-1 |
| 5 | Surface 1 + Surface 2 | CRD |
| 6 | Surface 1 + Surface 2 | CRD-A |
Publisher’s Note: MDPI stays neutral with regard to jurisdictional claims in published maps and institutional affiliations. |
© 2021 by the authors. Licensee MDPI, Basel, Switzerland. This article is an open access article distributed under the terms and conditions of the Creative Commons Attribution (CC BY) license (https://creativecommons.org/licenses/by/4.0/).
Share and Cite
MDPI and ACS Style
Yoshida, T.; Ueda, Y.; Mori, N.; Matano, Y. An Experimental Study of the Performance of a Crossed Rib Diffuser in Room Acoustic Control. Appl. Sci. 2021, 11, 3781. https://0-doi-org.brum.beds.ac.uk/10.3390/app11093781
AMA Style
Yoshida T, Ueda Y, Mori N, Matano Y. An Experimental Study of the Performance of a Crossed Rib Diffuser in Room Acoustic Control. Applied Sciences. 2021; 11(9):3781. https://0-doi-org.brum.beds.ac.uk/10.3390/app11093781
Chicago/Turabian StyleYoshida, Takumi, Yasutaka Ueda, Norimasa Mori, and Yumi Matano. 2021. "An Experimental Study of the Performance of a Crossed Rib Diffuser in Room Acoustic Control" Applied Sciences 11, no. 9: 3781. https://0-doi-org.brum.beds.ac.uk/10.3390/app11093781
Note that from the first issue of 2016, this journal uses article numbers instead of page numbers. See further details here.