
Measurement of Adult Human Brain Responses to Breath-Holding by Multi-Distance Hyperspectral Near-Infrared Spectroscopy


1
Department of Physics, Faculty of Science, Ryerson University, 350 Victoria Street, Toronto, ON M5B 2K3, Canada
2
Institute of Biomedical Engineering, Science and Technology (iBEST), Li Ka-Shing Knowledge Institute, 7th Floor, LKS 735, 209 Victoria Street, Toronto, ON M5B 1T8, Canada
3
Department of Medicine, University of Toronto, 200 Elizabeth Street, Suite RFE 3-805, Toronto, ON M5G 2C4, Canada
*
Author to whom correspondence should be addressed.
Appl. Sci. 2022, 12(1), 371; https://0-doi-org.brum.beds.ac.uk/10.3390/app12010371
Submission received: 26 September 2021
/
Revised: 20 December 2021
/
Accepted: 24 December 2021
/
Published: 31 December 2021
(This article belongs to the Special Issue Advances in Hyperspectral and Multispectral Optical Spectroscopy and Imaging of Tissue)
Abstract
:A major limitation of near-infrared spectroscopy (NIRS) is its high sensitivity to the scalp and low sensitivity to the brain of adult humans. In the present work we used multi-distance hyperspectral NIRS (hNIRS) to investigate the optimal source-detector distances, wavelength ranges, and analysis techniques to separate cerebral responses to 30 s breath-holds (BHs) from the responses in the superficial tissue layer in healthy adult humans. We observed significant responses to BHs in the scalp hemodynamics. Cerebral responses to BHs were detected in the cytochrome C oxidase redox (rCCO) at 4 cm without using data from the short-distance channel. Using the data from the 1 cm channel in the two-layer regression algorithm showed that cerebral hemodynamic and rCCO responses also occurred at 3 cm. We found that the waveband 700–900 nm was optimal for the detection of cerebral responses to BHs in adults.
1. Introduction
Near-infrared spectroscopy (NIRS) was proposed for human brain measurements in 1970s [1]. It has also been considered for clinical monitoring of cerebral status during various medical conditions in adults, such as cardiac surgeries, cardiac arrest, and traumatic brain injury [2]. However, in such conditions significant circulatory and metabolic changes occur in the entire body, including the scalp, where NIRS sensitivity is maximal [3,4]. In general, high sensitivity to the scalp and low sensitivity to the brain of adult humans remains a main problem of NIRS in spite of numerous attempts to resolve it using different continuous-wave [5], time-domain [6], and frequency-domain approaches [7]. In particular, in several papers the combination of long and short source-detector channels was proposed and investigated [5,8,9,10,11,12]. Other aspects of cerebral NIRS requiring investigation include optimization of the spectrum of wavelengths [13,14,15], and of the range of source-detector distances [14,15,16] for specific categories of subjects and patients—children, adults, and seniors. In the present work we approached the above aspects of cerebral NIRS using multi-distance hyperspectral NIRS (hNIRS).
Apart from the ability to measure the optical properties of tissue at all NIR wavelengths simultaneously, hNIRS is the most robust technique to spectrally separate hemoglobin and redox cytochrome C oxidase (rCCO) changes [4,17,18]. An increase in rCCO signal corresponds to an increase in oxidized CCO and an equal decrease in reduced CCO. While rCCO is a direct marker of cellular oxygen metabolism, the robust measurement of rCCO is much more challenging than measurement of the blood parameters due to the much lower concentration of CCO than of hemoglobin. Therefore, the development and validation of the methodology for rCCO measurements remains a hot topic of NIRS research. Reference [18] provide comprehensive reviews of the physiological significance, and of the history and various aspects of measurements of cerebral rCCO. A review of multiple possible factors that can change rCCO in the brain (changes in oxygen tension, ATP, NADH, etc.) is available in [19].
In this work we used hNIRS to study the possibility to measure specific cerebral autoregulation changes concomitant with systemic changes at source-detector distances of 1 cm, 3 cm, and 4 cm in healthy adults during breath-holding (BH) respiratory challenges. Since BH was proposed as a clinical paradigm to assess cerebral status in various clinical conditions such as stroke, concussion, etc. [20,21,22], the dynamics of cerebral responses to BH have been studied both by NIRS [23,24] and functional magnetic resonance imaging (fMRI) [25,26], which allows for a direct comparison of our results with other studies.
2. Materials and Methods
The study was conducted according to the guidelines of the Declaration of Helsinki, and approved by the Research Ethics Board of Ryerson University (REB: 2008-003-1, 4 May 2015).
2.1. Measurement Setup
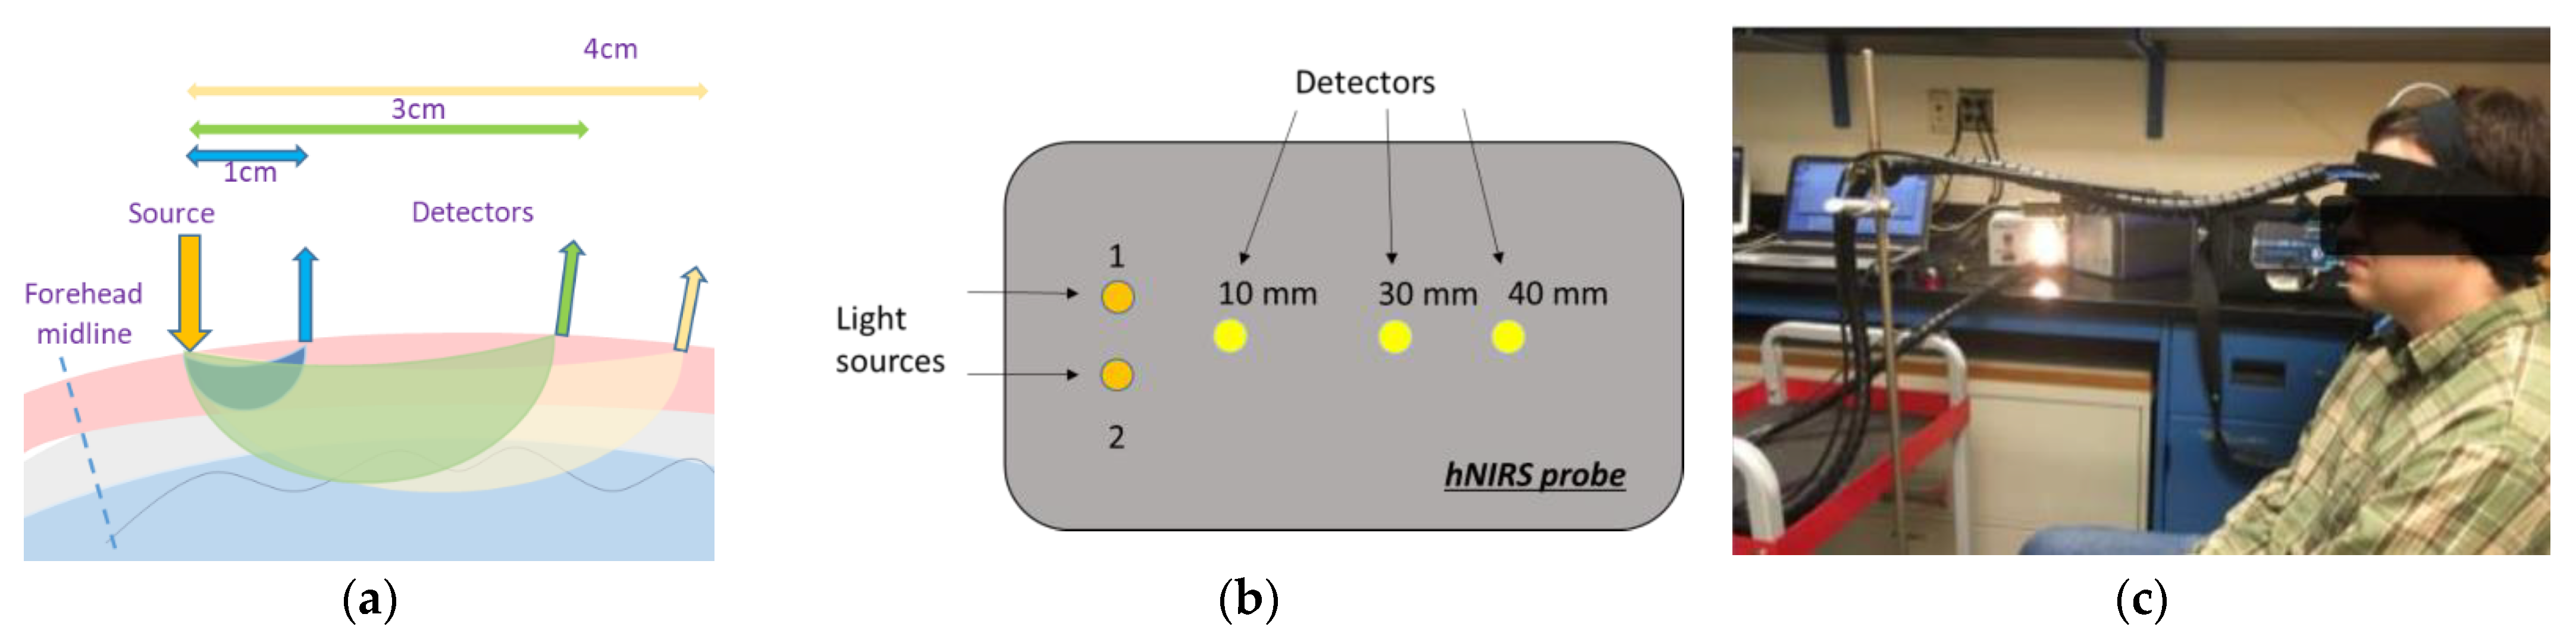
An hNIRS custom sensor was placed on the left forehead over the Fp1 position according to the International 10–20 system [27] for the entire measurement procedure (see Figure 1). The distance between two sources was 8 mm (Figure 1b). According to the Monte-Carlo simulation of the light propagation in the adult human head [3] and to the fMRI studies [25,26], with such a geometry the light from both sources collected at 3 cm and 4 cm interrogated the cortical region which was expected to show the same dynamics during BH.
The spectra were collected at the sampling rate of 2 Hz by three fiber optic spectrometers—AvaSpec (Avantes, CO, USA) and QE 65000 and USB 4000 (Ocean Optics, Dunedin, FL, USA) at 4, 3, and 1 cm, respectively, to separate the extracerebral and cerebral measurements. The spectrometers were tested on the same phantom and on a human forearm muscle to ensure that at the same distance they measured the same absorbance within the 700–1000 nm wavelength range. AvaSoft-Full software (Avantes, CO, USA) was used to collect data from the AvaSpec spectrometer (4 cm), and The Spectra Suite (Ocean Optics, FL, USA) software was used to collect the broadband continuous-wave hNIRS data from both Ocean Optics spectrometers with dark-signal correction. Data acquired at 1 cm represented the extra-cerebral layer (mostly scalp). Data acquired at 3 cm and 4 cm channels represented a combined extracerebral and cerebral tissue volume. The common spectral range of these spectrometers was from 650 to 1024 nm. The spectrometers at 4 cm and 3 cm had a high signal-to-noise ratio (over 1000:1 single acquisition) and the slit width of 0.5 mm to provide the sensitivity required to measure light at large distance from the source. Three custom-made 2-m-long optical fiber bundles (each made of seven 0.5 NA, 400 μm core-diameter multimode polymer-clad fibers with broad UV/VIS/NIR spectral range of 400 to 2200 nm Thorlabs, NJ, USA) connected spectrometers with the patient’s head. Two other optical fiber bundles were used to connect the probe with a halogen lamp light source (Fiber-Lite Dc 950H Fiber Optic Illuminator, Dolan-Jenner, MA, USA). The source light was injected into the tissue at two symmetric scalp locations (Figure 1b) in order to increase the total light power without exceeding the maximum permissible exposure.
2.2. Breath-Holding Paradigm
Data were obtained from 12 healthy adult participants (seven males, five females, 25–55 years old). All participants gave informed consent before participation and the experiment was performed according to Ryerson University Research Ethics protocol. Participants were audibly cued to perform a 30 s BH at the end of expiration. BH was repeated three times (60–90 s, 180–210 s, and 300–330 s from the beginning of the recording) with 90 s rest intervals. Long time intervals between BHs were used to avoid resonance induction of systemic Mayer waves in arterial blood pressure [28,29]. All data sets including the baseline periods before and after BHs were acquired during 10 min.
2.3. Data Processing
All our custom signal processing methods were implemented in MATLAB (Mathworks, Natick, MA, USA, Version R2020b). At the pre-processing stage the data from all spectrometers were resampled in both time and spectral domains to the time step of 0.5 s and wavelength step of 1 nm between 650 and 1024 nm, filtered in the time domain using a band-pass filter with the window of 0.01–0.3 Hz, and smoothed in the spectral domain with the median filter of the 20 nm width. To analyze the chromophores, we used two custom data processing approaches. Our first algorithm was based on the analytical solution to the diffusion equation [30,31] for the semi-infinite homogeneous medium. This allows for measuring the bulk absolute concentrations of tissue HbO2 and HHb, and changes in rCCO concentration without accounting for the layered tissue structure. The baseline concentrations of HbO2 and HHb were calculated by performing a non-linear least square fitting [30,31] of the measured absorbance spectrum at each moment of time by the analytical solution to the diffusion equation, in which the optical absorption coefficient was modeled as
According to Beer–Lambert law, the reduced scattering coefficient as a function of wavelength λ was modeled using the power law as described in [30]. In Equation (1) and below the square brackets denote concentrations measured in micromoles (μM), is the absorption by water assuming 80% water concentration. The temporal changes in the hemoglobin concentrations HbO2, Hb, and rCOO were resolved using a two-step data-fitting algorithm [30,31] (also based on the same analytical solution to the diffusion equation) by relating changes in HbO2, Hb, and rCOO to the changes in the optical absorbance as
where were the spectra of the extinction coefficients of HbO2, Hb, and rCCO (see Figure 2) [30,31].
The data-fitting was performed in two steps: first Δ[HbO2] and Δ[HHb] were calculated assuming Δ[CCO] = 0, and after that Δ[CCO] was calculated and retained non-zero only if the addition of Δ[CCO] resulted in an improvement in the fit quality of at least 20% in terms of the norm of residuals. Such a stepwise regression worked as an adaptive filter reducing the noise in the time-course of rCCO without suppressing changes recognized from significant spectral distortions corresponding to . Additional details on recovering the absolute values and changes of chromophore concentrations from the hNIRS data can be found in [32,33].
As the fraction of oxygenated hemoglobin relative to the total hemoglobin in the blood, the cerebral tissue saturation of oxygen was calculated as:
In order to assess differences between the cerebral and scalp responses to BH we used another common NIRS model—the modified Lambert–Beer law for a two-layer medium [32,33]. This model assumes that at any moment of time, t, the absorbance measured at 1 cm and at the wavelength λ can be related to the changes of the absorption coefficient of the scalp only :
where is the optical pathlength in the scalp at 1 cm, and the absorbance at 3 cm and 4 cm could be expressed as
where is the change in the cerebral absorption coefficient, and are the scalp partial pathlength at 3 cm and 4 cm, respectively, and and are the cerebral partial pathlength at 3 cm and 4 cm, respectively. Since the pathlengths in Equations (4)–(6) were specific for every individual and unknown, could not be algebraically excluded to find . However, since Equations (4) and (5) were linear with respect to the common time-dependent and , for every wavelength, one could exclude the time-course common with from and . Indeed, one could rewrite Equations (5) and (6) in the form
where
represents the difference between the cerebral and scalp responses to BH. Note that Equations (7) and (8) are linear with respect to and , and also we expect that the latter functions of time and wavelength will be uncorrelated in the time domain. Therefore the time-domain linear regression coefficients between and and between and should be close to and , respectively. Then, by subtracting and from Equations (7) and (8) we obtain:
Note that at all wavelengths the true cerebral response to BH could have a component close to the scalp response. Therefore, represent not the pure time-course of the cerebral absorption coefficient, but rather the difference between the cerebral and scalp absorption time-courses.
In accordance with Equation (2) one could model as a linear combination of the contributions from , , and :
By applying the stepwise linear regression spectral unmixing to the linear model (Equation (9)) (where the regressors are the extinction coefficients ) one could obtain the specific cerebral changes , , and , whose time-courses represent the differences between the cerebral and scalp responses in HHb, HbO2, and rCCO, respectively. In this spectral unmixing step the initial regression model did not include It was added to the model at the second step of the stepwise regression only if the p-value corresponding to non-zero was greater than 0.05.
In addition, we also used Equation (10) to calculate the specific cerebral response in the total hemoglobin . However, was calculated not by using the spectral unmixing, but by directly using Equation (10) around 800 nm since at this wavelength . Since near 800 nm is greater than , could include a crosstalk with
Since the values of cerebral pathlengths and were unknown, for the quantitative comparison in μM with the responses obtained using the homogeneous tissue model (explained above) we normalized , , and to the pathlength corresponding to the homogeneous tissue equal to the product of the differential pathlength factor (known be close to 6 for the mid-age human forehead [34]) and the source-detector distance.
2.4. Statistical Analysis
In the individual subject data the peak magnitudes of responses in , , and , and in , , and were measured as the difference between the time average over ±5 s around each peak time (see Table 1) and the average over 20 s just before BHs. These samples were checked for normality (positively) and further tested by the one-sample t-test (ttest MATLAB function) and p-values reported in Table 1 and Table 2. In addition, the differences in response magnitudes among three BH episodes were analyzed using ranova MATLAB function (repeated measures analysis of variance, RM ANOVA).
3. Results
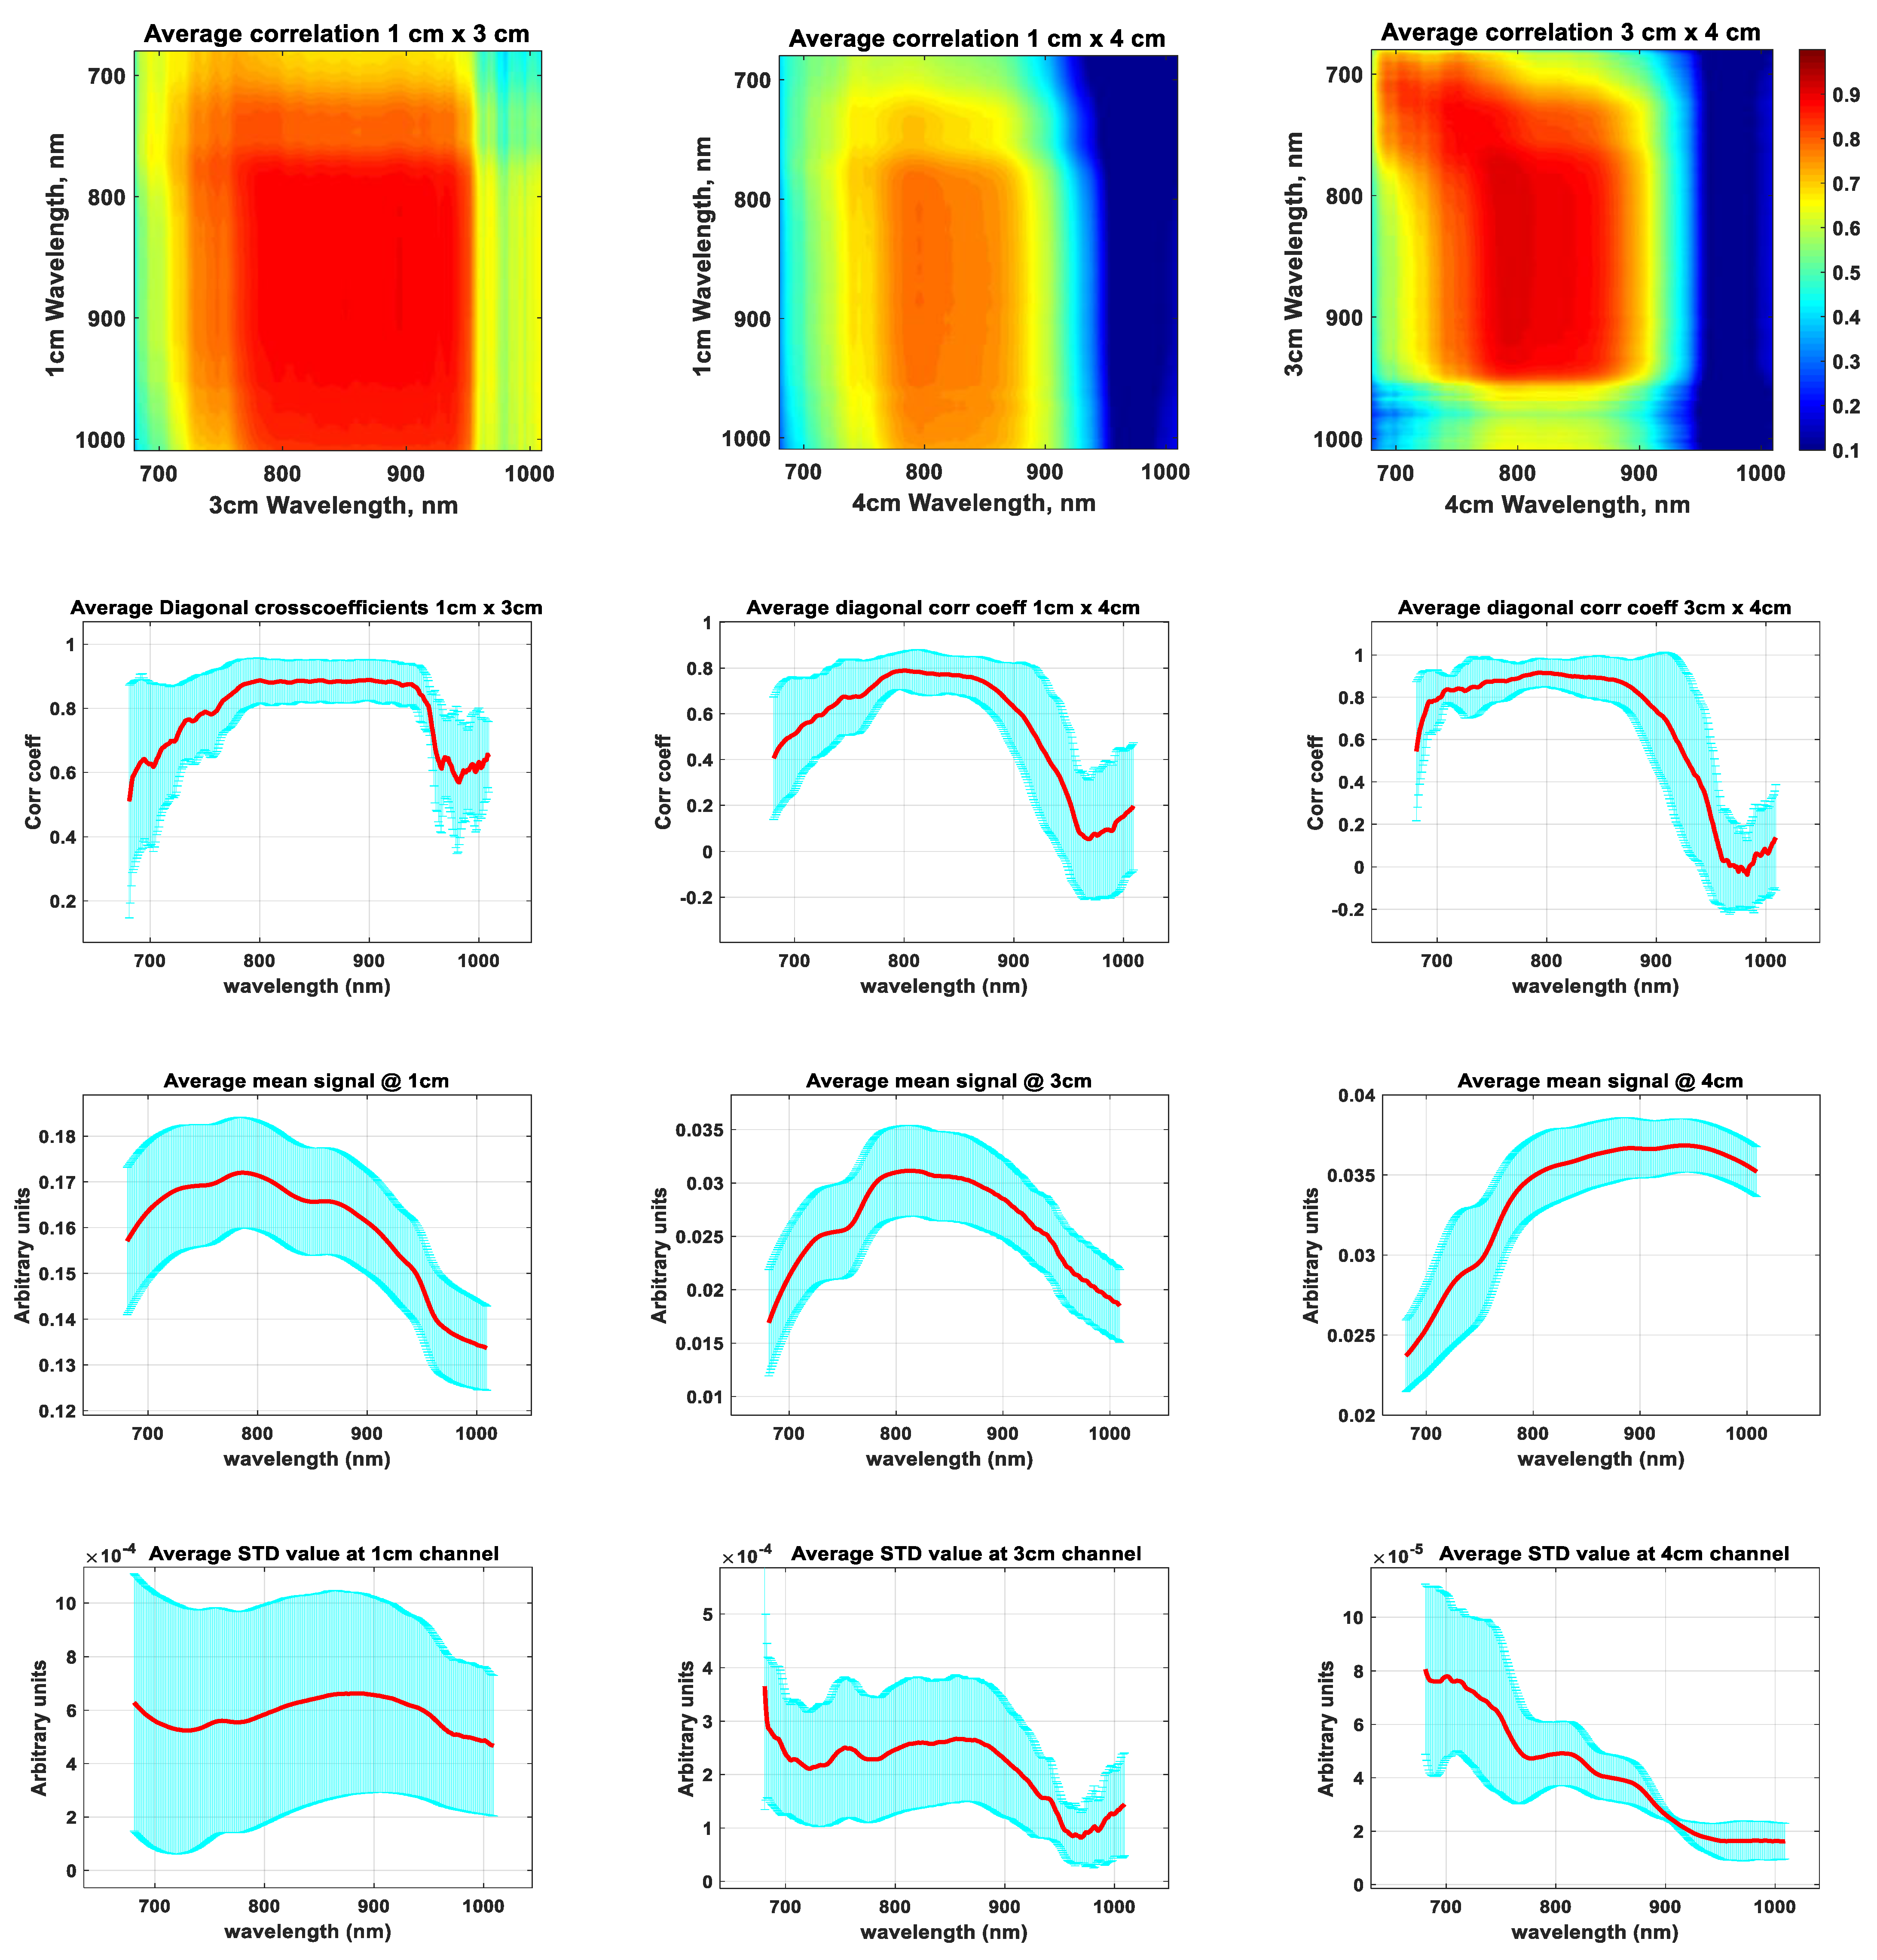
Figure 3 shows the assessment of de-noised signals in all three channels and at all wavelengths in terms of the cross-subject averaged temporal correlation (first and second rows), temporal logarithmic signal means (third row, used for the data quality assessment), and temporal standard deviations (fourth row).
Since the noise was filtered out, the latter represent the average magnitude of changes at different wavelengths. The correlation coefficient maps (first row) show that signals at all wavelengths from 700 nm to over 900 nm and in all channels were positively correlated. The latter means that there were no pairs of signals at any wavelengths from 700 nm to 900 nm and in any channels where temporal changes occurred simultaneously in opposite directions. Also from the correlation maps and same-wavelength correlation plots (second row) one could see that all signals between 750 nm and 900 nm were highly correlated (correlation coefficient > 0.6). This high correlation occurred because, as shown in [3], at both 3 and 4 cm the optical pathlength in the extracerebral tissue was several times longer than in the brain, and therefore the scalp contribution was high at both 4 and 3 cm channels. Correlations were low for the wavelengths longer than 900 nm in the 4 cm channel. While the mean signal value in the 4 cm channel at these wavelengths was high (third row), the amplitude of changes (fourth row) was small. This lack of changes should be due to fact that at longer wavelengths the partial optical pathlengths in the tissues where the changes occurred (scalp and brain) was shorter than at wavelengths below 900 nm, and at the 4 cm source-detector separation the light of wavelengths greater than 900 nm mostly interrogated the volume which belongs to the skull where no changes occurred. For the above reasons the further analysis was performed using the waveband from 750 nm to 900 nm.
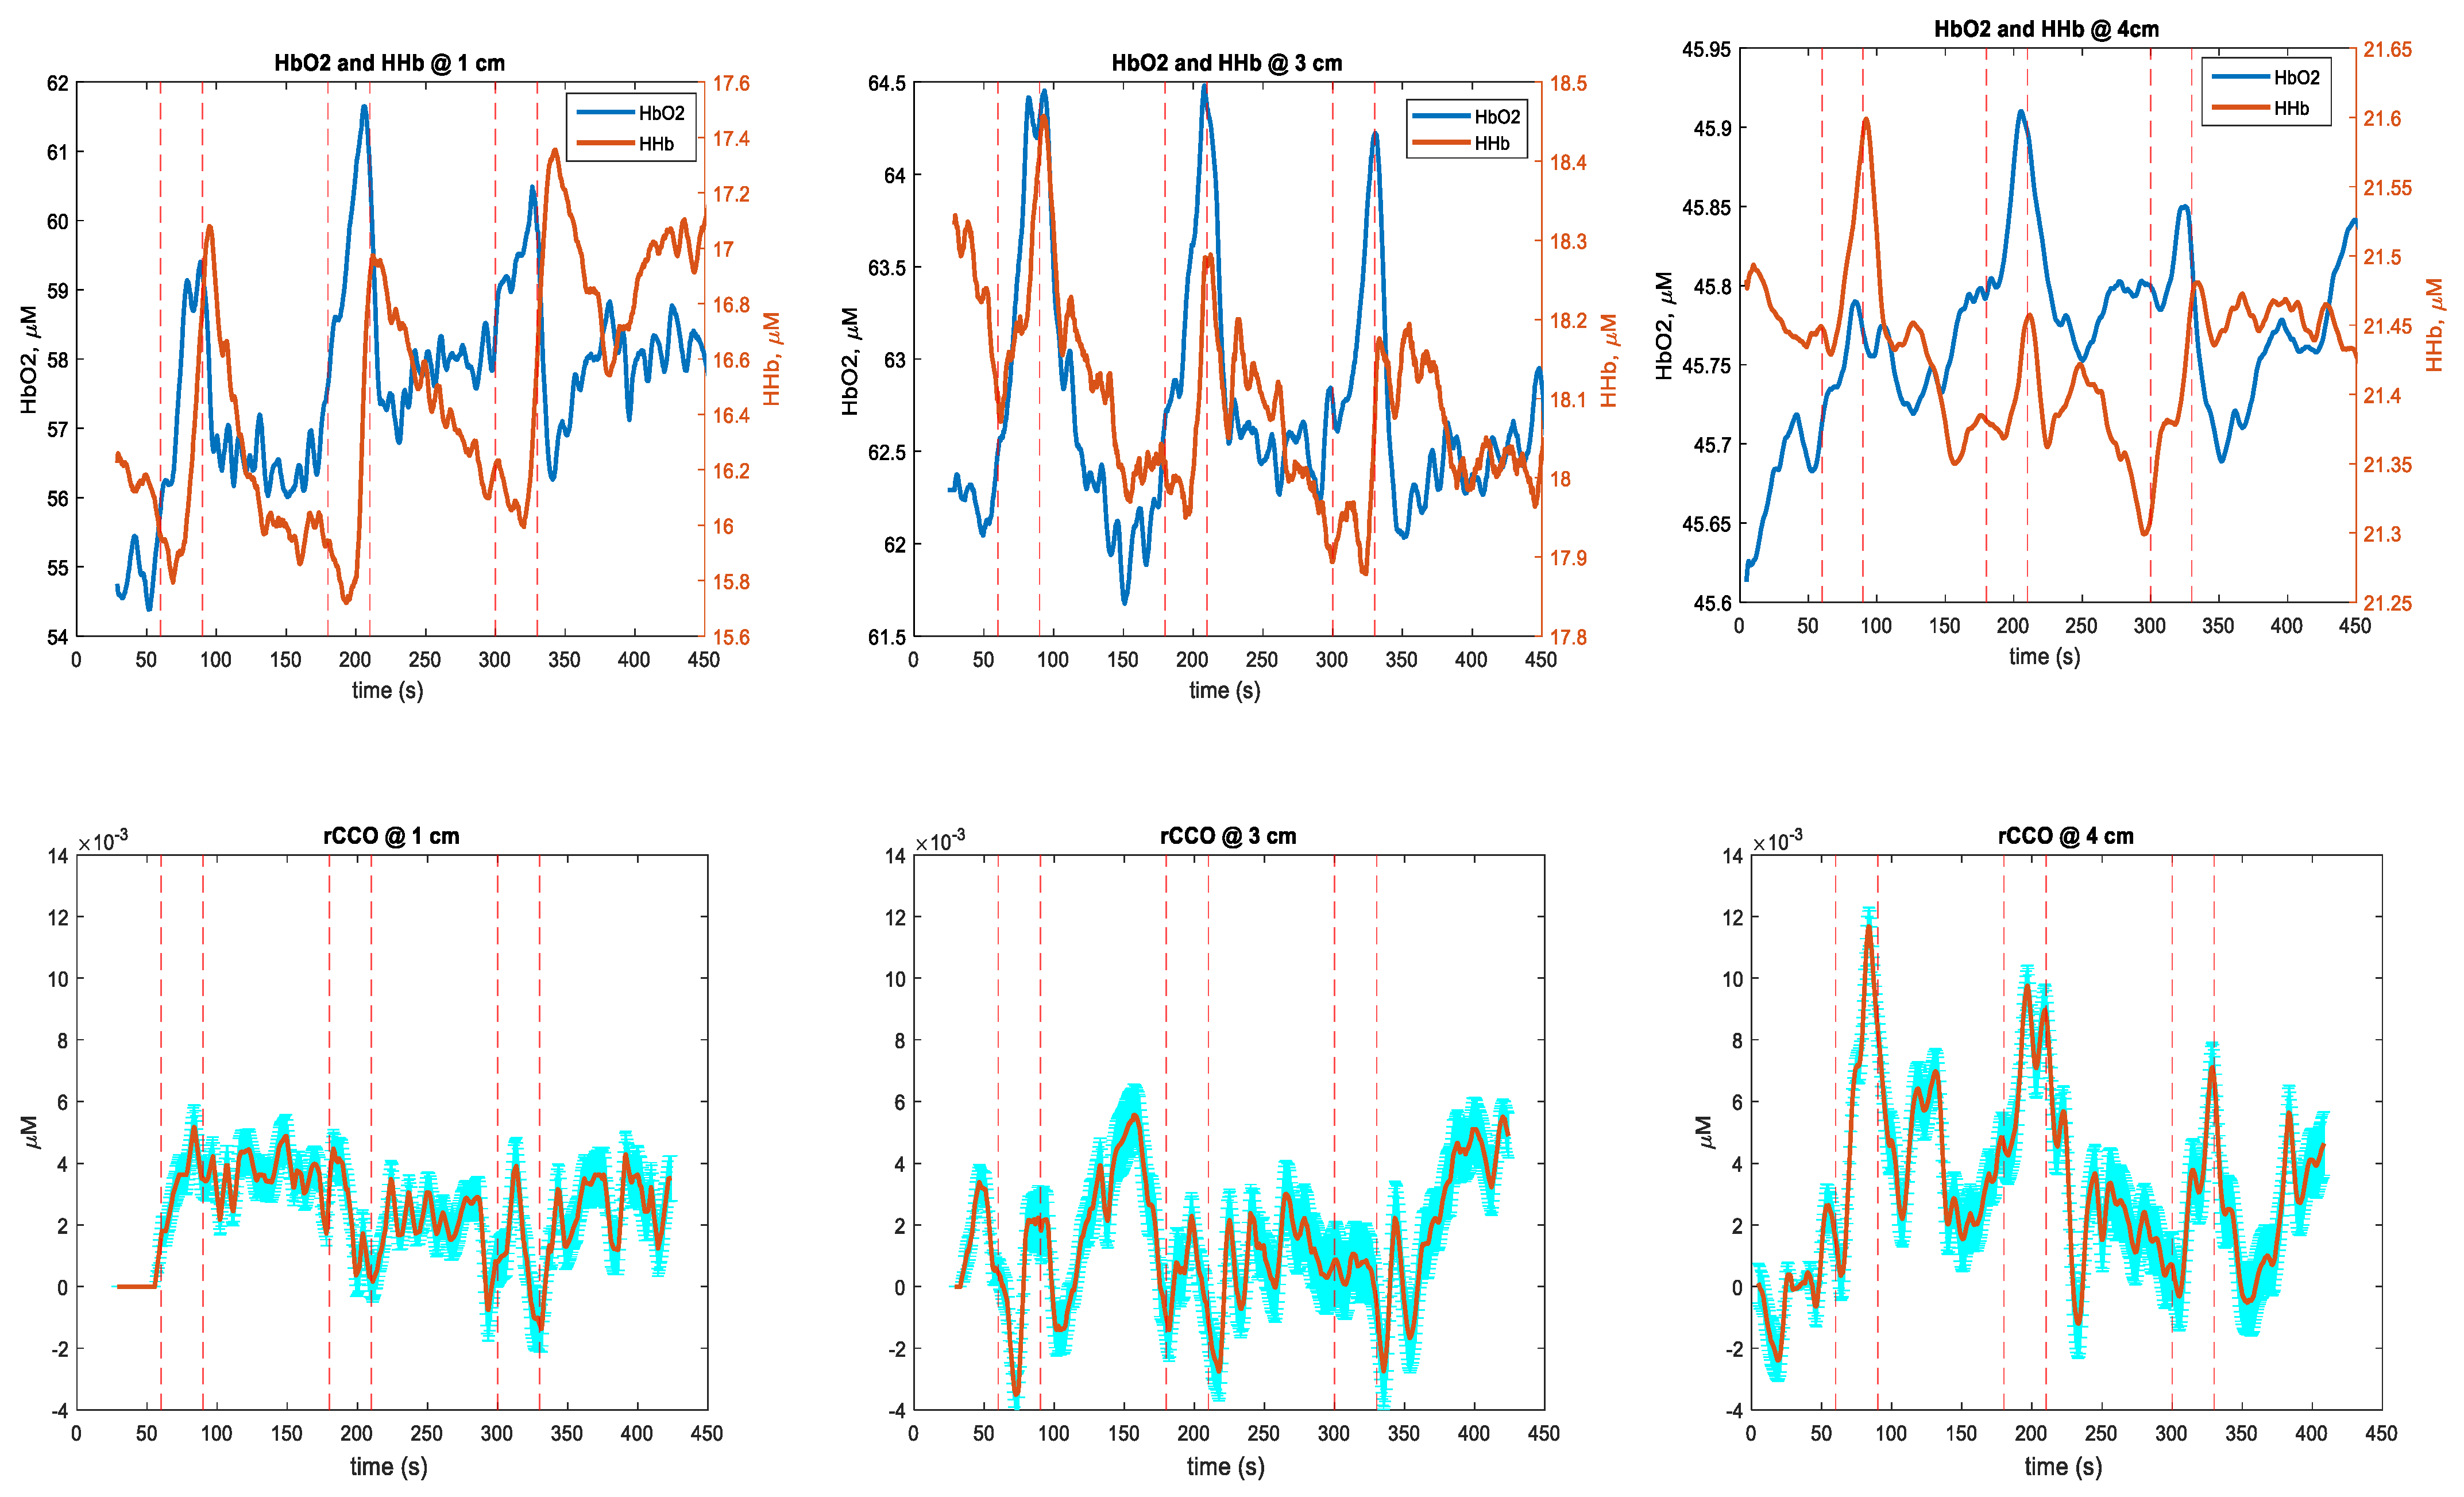
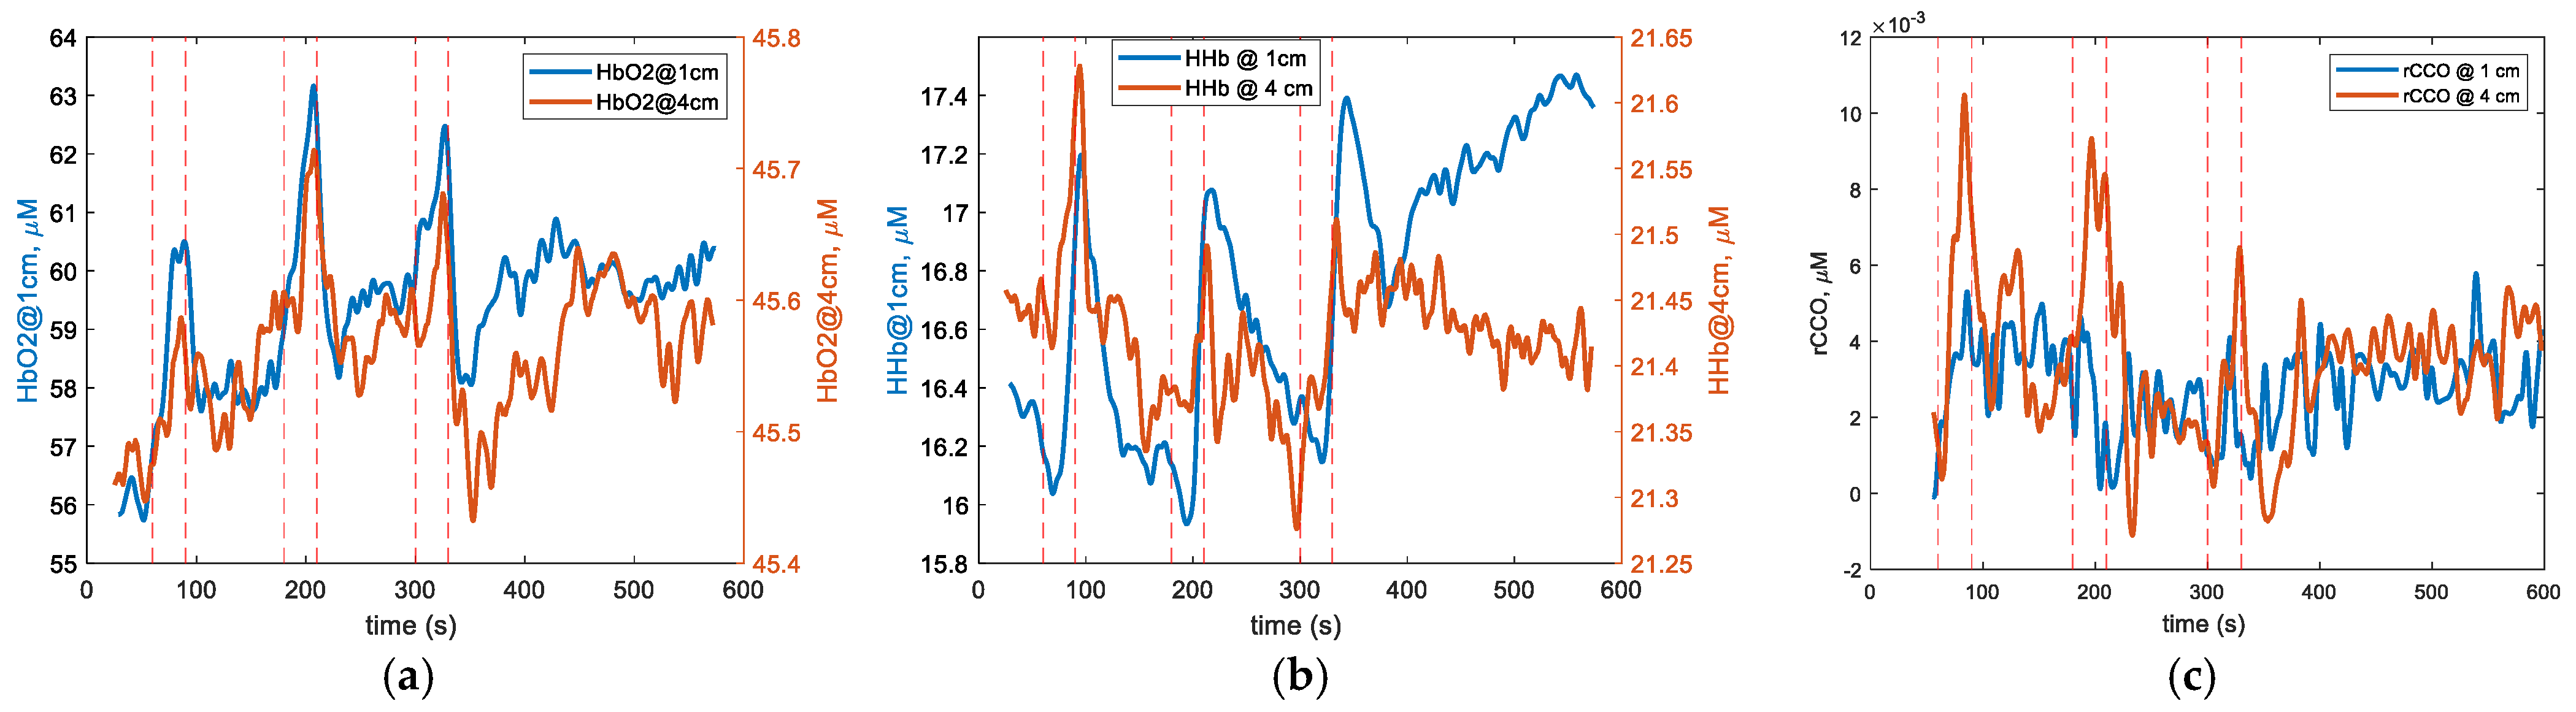
Figure 4 shows the cross-subject averaged changes in [HbO2], [HHb], [rCCO], and [rSO2] measured at 1 cm, 3 cm, and 4 cm using the homogeneous tissue model and 750–900 nm waveband. One could see that the hemoglobin signals showed responses to BHs in all channels, while rCCO exhibited clear responses only at 4 cm. Table 1 presents the average amplitude, p-values, and temporal values characteristic for the chromophore responses to BHs. In addition to Figure 4 and Figure 5 provides a direct comparison of the hemoglobin time-courses at 1 cm and 4 cm and shows a return to the baseline 4 min after BHs.
As shown in Figure 4 and Figure 5, and also from the peak times for HbO2 in Table 1 the time-courses of HbO2 responses appeared similar in all channels. The common features of HHb responses to BHs in 1 cm and 3 cm channels were the initial dips followed by quick increases peaking up 4–10 s after the end of BH. The depth of initial dips was much greater in the 1 cm channel than in 3 cm and 4 cm channels (Figure 5b). However, the magnitudes of these dips measured from the HHb levels just before BH were statistically insignificant (p > 0.05). The HHb peak times were longest for the 1 cm channel (about 9 s after the end of BH, see Table 1). Much earlier peaks and faster falls in the HHb responses at 4 cm compared to those features at 1 cm (Figure 5b, Table 1) might indicate a prevalence of the cerebral component in the 4 cm HHb responses. In particular, the faster falls of HHb at 4 cm than at 1 cm could be due to the cerebral autoregulation restoring the oxygen concentration in the brain faster than in extracerebral tissues. In Figure 4 one can also see that at 3 cm the HHb responses were intermediate between those measured at 1 cm and 4 cm.
The rCCO signals from the 1 cm and 3 cm channels showed no clear responses to BHs. In contrast, at 4 cm the rCCO responses were very clear (Figure 4 and Figure 5c), which also might indicate that these responses belonged solely to the cerebral tissue. Each rCCO fall after the end of BH was quickly followed by a rebound which also could be a result of the faster restoration of the oxygen supply in the brain than in other tissues. Note that rCCO peak changes had about 10 times smaller magnitudes than HbO2 and HHb changes (Table 1), which was in agreement with the fact that the concentration of CCO in the brain is approximately 10 times smaller than the concentration of hemoglobin.
In Figure 4 the SO2 time-course at 4 cm was also very different from those at 1 cm and 3 cm, which were very similar to each other by showing SO2 increases characteristic for the scalp tissue. However, the quick SO2 falls at 4 cm at the end of each BH should not be interpreted as the failure of cerebral autoregulation but rather, these falls resulted from the smaller magnitude of the HbO2 increase than of the HHb increase due to the difference in the partial volume of the skull interrogated by light at shorter and longer wavelengths. From Table 1 one can see that the magnitudes of HbO2 and HHb responses to BHs decreased with the distance. The reason for this was the application of the homogeneous model to the measurements of the inhomogeneous tissue, which included bone, where almost no blood was present. With the increase of the distance the partial volume of the bone increased leading to the underestimation of the magnitudes of HbO2 and HHb responses to BHs at 3 cm and 4 cm.
The cumulative p-values in Table 1 show that all included responses were statistically significant at p < 0.05 when the results of all three BHs were combined. HbO2 and HHb responses to each individual BH were significant at 1 cm and at 3 cm. Unlike HbO2 and HHb, at 4 cm, rCCO responses to each individual BH were statistically significant. Although the average peak values for different BHs in Table 1 were different, RM ANOVA analysis did not show statistical significance of these differences.
As explained above, in order to reveal differences between responses to BHs measured in different channels we performed time-spectral linear regression analysis. For the regression analysis the range of wavelengths was limited to 750–900 nm where the highest correlation between different channels was detected (see Figure 3). Figure 6 shows the cross-subject average correlation and standard deviations spectra of signals from the 3 cm and 4 cm channels after regressing out changes measured at the 1 cm channel. One could see that the correlation coefficient for all wavelengths in both channels was greater than 0.6 between 750 nm and 900 nm. The correlation coefficient for the same wavelengths in both channels (corresponding to the diagonal of the correlation map in Figure 6) was particularly high for all wavelengths. This high correlation indicated that after regressing out the superficial changes, both 3 cm and 4 cm channels exhibited very similar time-courses at all wavelengths. Also in Figure 6 one can see that the spectra of average amplitudes of changes (measured by SDs) were similar in shape to those before regression (shown in Figure 3). They showed peaks at the HHb and rCCO absorption maxima around 760 nm and 830 nm, respectively, (compare with Figure 2), and decreased at wavelengths longer than 870 nm, corresponding to maximum HbO2 absorption. Therefore, after the regression the HbO2 changes should have smaller magnitudes than the HHb and rCCO responses.
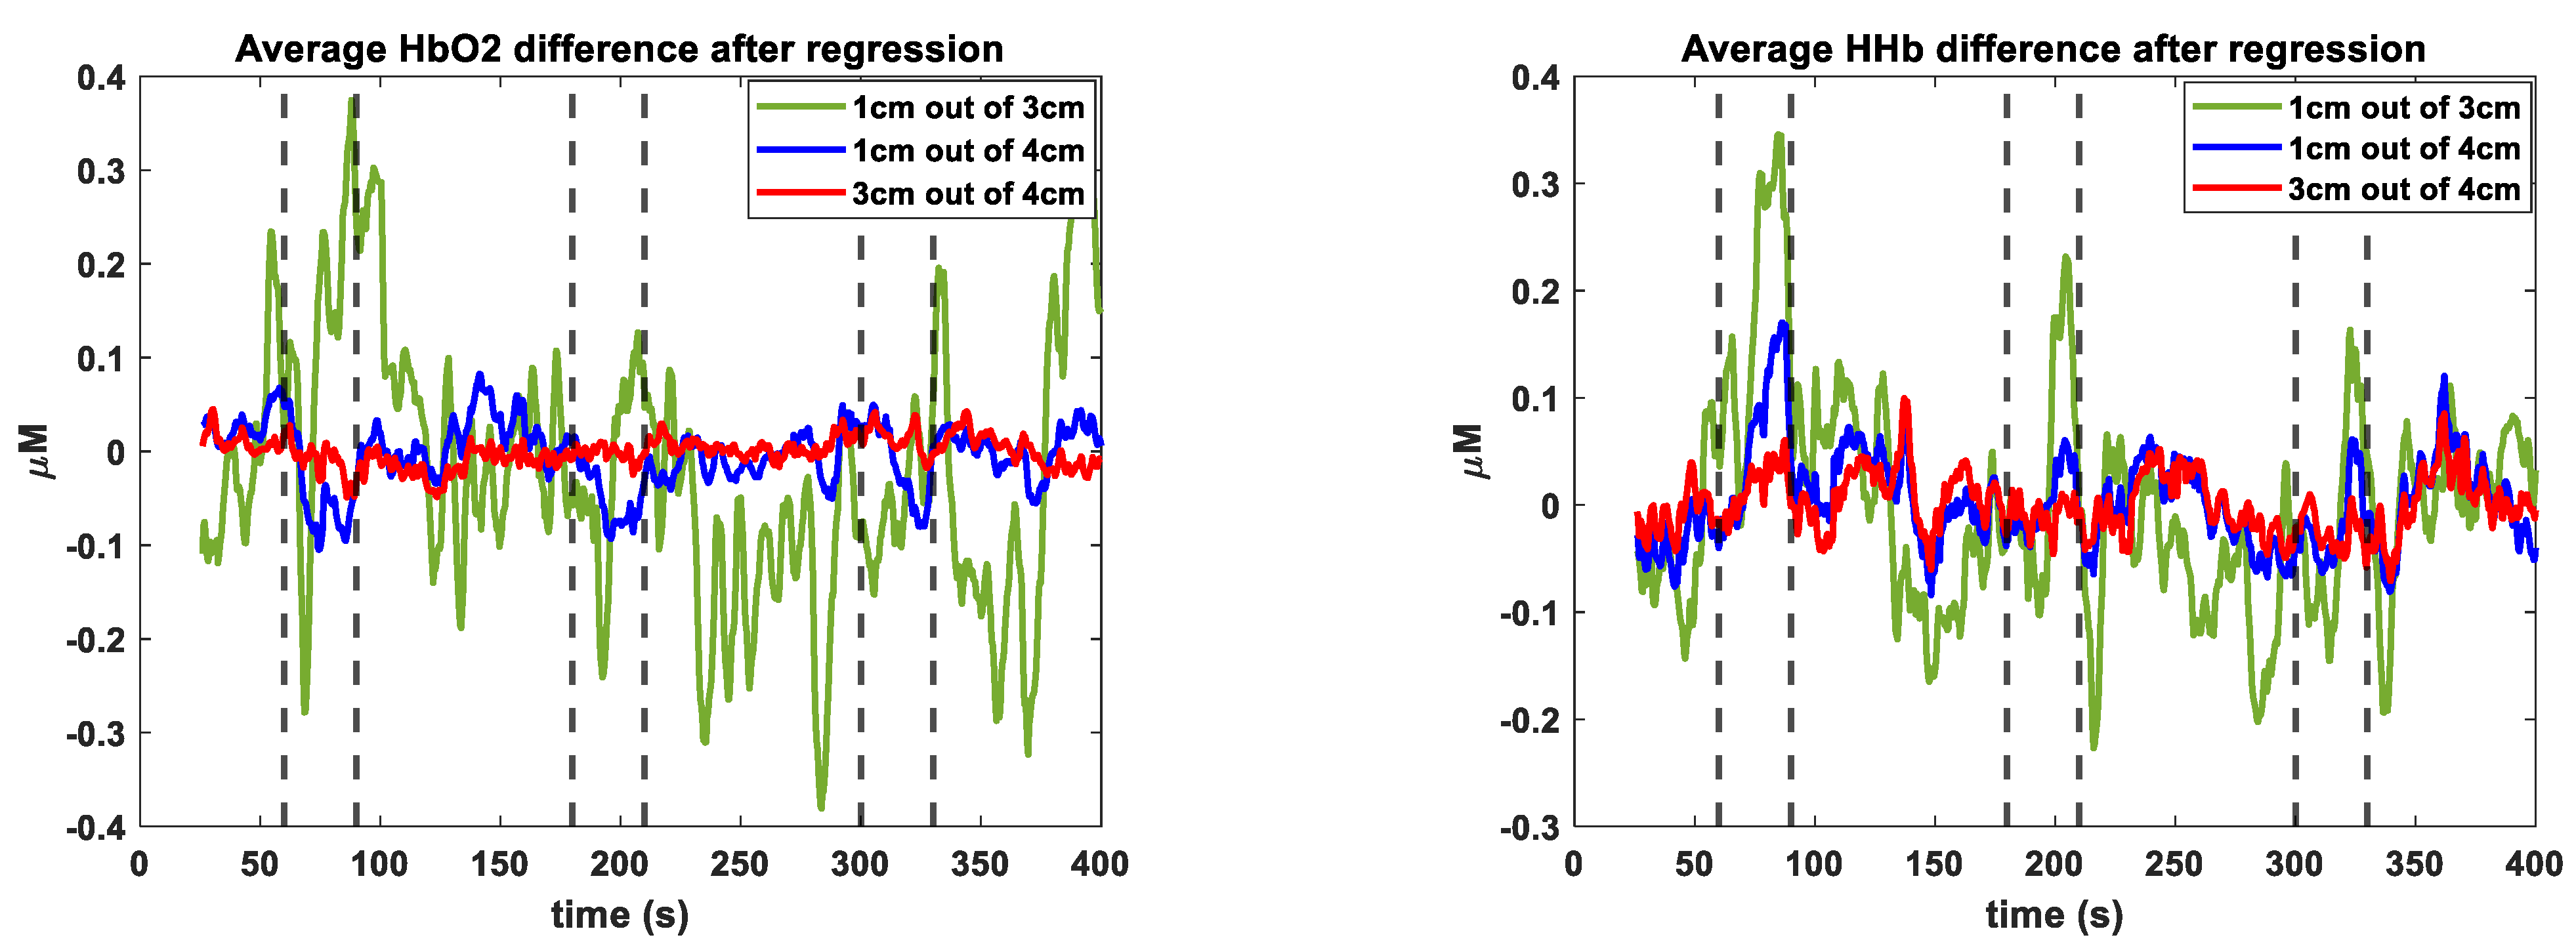
In Figure 7 the green and blue curves show the cross-subject averaged changes in HbO2, HHb, tHB, and rCCO calculated by applying the spectral-domain regression to the residuals after regressing out the in time-domain the changes measured at the 1 cm channel from the signals measured at the 3 cm and 4 cm channels, respectively. The tHB changes were computed by averaging changes in the 5 nm waveband around 800 nm where the HHb- and HbO2-specific absorptions were equal. Note that the changes in Figure 7 show the differences in the time-courses of changes in the deep and superficial tissues. (Note that signals measured at different channels never changed in opposite directions, which follows from the correlation analysis shown in Figure 3 and explained above.) In particular, the rising slopes seen on the curves in Figure 7 correspond to the time intervals when changes measured at 3 or 4 cm increased faster than changes measured at 1 cm. Conversely, the curves in Figure 6 show negative slopes during the times when changes measured at long-distance channels decreased faster than changes measured at the 1 cm channel. The fact that the HbO2 responses to BHs were not very clear means that the time-courses of [HbO2] changes in the superficial and cerebral tissues were similar. (The “noise” seen in Figure 7 was mostly due to the respiratory sinus arrhythmia between BHs). In Figure 7 one can also see that the peak times of [HHb], [tHB], and [rCCO] responses during all three BH episodes were between 15 and 25 s after the BH onsets, which was similar to the peak times of rCCO responses shown in Figure 4, but very different from the peak times of HbO2 and HHb responses shown in Figure 4, which never occurred earlier than 26 s from the beginning of a BH episode (see also Table 1). Some details of the HHb, tHB, and rCCO responses in Figure 7 were quite different. In particular, during BH episodes, the HHb curves showed initial dips during the first 10–15 s turning into the fast increases after that. During the same initial periods of BHs the tHB curves showed steady positive changes, while rCCO curves showed almost no changes during the first 10 s. These differences indicated that the responses to BHs in Figure 7 indeed corresponded to different chromophores and did not result from a crosstalk between different NIR wavelengths. The fact that in Figure 7 the curves corresponding to the 4 cm channel showed similar changes to the curves corresponding to the 3 cm channel but with much smaller magnitudes was due to the overall smaller magnitudes of changes at 4 cm as shown in Figure 3 and explained above.
In addition, the red curves in Figure 7 correspond to regressing out the 3 cm changes from the 4 cm changes. The fact that these curves show almost no changes means that after regressing out the changes due to the contribution from the superficial tissues, the time-courses of changes at all wavelengths in both 3 cm and 4 cm channels were very similar, which was also in agreement with the high correlation between signals from these channels at all wavelengths as shown in Figure 6.
Table 2 shows that HHb-, tHb-, and rCCO-specific cerebral responses to each individual BH were significant at both 3 cm and at 4 cm. rCCO responses showed highest significance (p < 0.03) among all chromophores. HbO2-specific cerebral responses to individual BHs were not significant at 3 cm or at 4 cm. RM ANOVA analysis did not reveal statistical significance of differences in responses to different BH trials.
4. Discussion
Our results showed that BHs induced significant hemodynamic responses in all three channels including the 1 cm channel, which mainly interrogated the scalp and partially the skull. Hemodynamic responses measured by the 3 cm channel were quite similar to those measured at 1 cm. In Figure 4 and Figure 5 only HHb and rCCO signals measured at 4 cm showed different responses to those of the extracerebral tissue. The clearest difference from the scalp response was observed at 4 cm in the rCCO response (Figure 4 and Figure 5). No rCCO responses were observed at 1 cm and 3 cm using the homogeneous tissue model. Clear HHb-, tHB-, and rCCO-specific cerebral responses seen in Figure 7 and Table 2 indicate that the dynamics of changes measured at 3 cm and 4 cm channels were different from that measured at 1 cm, and this difference can be attributed to the differences between the brain and scalp responses to BHs. Note that hemodynamic responses at 3 cm and 4 cm shown in Figure 7 and Table 2 had significantly smaller magnitudes than those shown in Figure 4 and Figure 5 and in Table 1. However, rCCO responses in both Figure 4 and Figure 7 had their magnitudes close to 0.1 μM. This result supports the conclusion that we succeeded in decoupling rCCO changes from changes in other chromophores, and that the measured rCCO changes occurred in the brain. We would like to underline that in both homogeneous and two-layer algorithms we used the most conservative treatments of rCCO changes such as thresholding by the quantitative improvement in the goodness of fit, which suppressed spurious rCCO changes.
The time-courses of cerebral responses to BHs in healthy adult humans were studied in detail using blood-oxygen-level-dependent (BOLD) fMRI in [25,26]. The quantitative relationship between the BOLD changes measured by fMRI and hemodynamic signals measured by NIRS was investigated in [35]. Figure 8 (adopted from [25]) shows averaged BOLD signal time-courses with a 15 s BH after the full expiration on the areas supplied by the middle cerebral artery (MCA, red), anterior cerebral artery (ACA, blue) and posterior cerebral artery (PCA, black). Since our hNIRS probe was positioned on the left side of the forehead near the midline, it could interrogate cortical regions supplied by both ACA and MCA. The main difference between ACA and MCA regional responses was the early rise of the BOLD signal response in the ACA region and a 10 s delay in the MCA region. In our results the initial dynamics (during the first 15 s of BH) of cerebral HbO2 and HHb responses rather corresponded to the MCA type of the BOLD response [25,33]. A delayed rCCO response after the regression (Figure 7) corresponded to the delayed ACA response. Such delayed cerebral responses were most different from the scalp hemodynamic responses to BHs measured at 1 cm (Figure 4), which were also very significant.
Another significant difference between the long- and short-distance channels was the longer peak times of HHb responses in the short-distance channel (longer than BH duration, Table 1). The peak times of responses to BHs after expiration measured by hNIRS at 4 cm were close to those measured by BOLD fMRI in [26] (see Figure 2 in [26]).
Our results show that without using a short-distance channel to remove biasing by the scalp, the cerebral responses to BHs were clearest in the rCCO time-course at 4 cm. Some features different from the scalp responses could also be seen in the HHb time-course at 4 cm. At 3 cm, some features of the cerebral response could be poorly recognized in the HHb time-course. The HbO2 time-course did not show clear cerebral responses to BH at 3 cm or at 4 cm, in particular due to the high inter-subject variability. However, measurement of rCCO changes required hyperspectral or many-wavelength multispectral technology.
We found the waveband 750–900 nm be optimal for the detection of cerebral responses to BHs in adults. The wavelength that exhibited the largest fractional change in the detected optical signal with respect to the baseline value both at 3 and 4 cm was between 800 and 850 nm, which was in good agreement with the results of [13] (830 nm).
5. Conclusions
Cerebral changes could be efficiently separated from the extra-cerebral biasing using the time-domain linear regression of hNIRS signals measured at 3 cm and 4 cm source-detector separations by the signals from the short-distance channel. Without using the short-distance channel, none of the signals measured at 3 cm clearly reflected cerebral changes. At 4 cm source-detector separation, cerebral changes could be detected without using short-distance channels in the [HHb] and [rCCO] time-courses. The clearest cerebral responses were detected in the [rCCO] time-course at 4 cm. The optimal waveband for the rCCO measurements was between 750 nm and 900 nm. The [HbO2] time-course at all source-detector distances was most dominated by the extracerebral biasing and therefore it was least suitable for cerebral signal detection. Further clinical studies are required to investigate the ability of the NIRS breath-holding paradigm to detect cerebral circulation disorders.
Author Contributions
Conceptualization, S.L. and V.T.; methodology, V.T.; software, V.T.; validation, S.L., V.T. and Z.G.; formal analysis, Z.G.; investigation, Z.G.; resources, V.T.; data curation, V.T.; writing—original draft preparation, V.T.; writing—review and editing, S.L.; visualization, Z.G.; supervision, V.T.; project administration, V.T.; funding acquisition, V.T. All authors have read and agreed to the published version of the manuscript.
Funding
This research received no external funding.
Institutional Review Board Statement
The study was conducted according to the guidelines of the Declaration of Helsinki, and approved by the Research Ethics Board of Ryerson University (REB: 2008-003-1, 4 May 2015).
Informed Consent Statement
Informed consent was obtained from all subjects involved in the study.
Acknowledgments
This research was supported by the Dean’s Research Fund, Faculty of Science, Ryerson University.
Conflicts of Interest
The authors declare no conflict of interest.
References
- Jöbsis, F. Noninvasive, infrared monitoring of cerebral and myocardial oxygen sufficiency and circulatory parameters. Science 1977, 198, 1264–1267. [Google Scholar] [CrossRef] [PubMed]
- Green, D.W.; Kunst, G. Cerebral oximetry and its role in adult cardiac, non-cardiac surgery and resuscitation from cardiac arrest. Anaesthesia 2017, 72, 48–57. [Google Scholar] [CrossRef] [Green Version]
- Okada, E.; Firbank, M.; Schweiger, M.; Arridge, S.R.; Cope, M.; Delpy, D.T. Theoretical and experimental investigation of near-infrared light propagation in a model of the adult head. Appl. Opt. 1997, 36, 21–31. [Google Scholar] [CrossRef] [PubMed]
- Tachtsidis, I.; Scholkmann, F. False positives and false negatives in functional near-infrared spectroscopy: Issues, challenges, and the way forward. Neurophotonics 2016, 3, 039801. [Google Scholar] [CrossRef] [PubMed] [Green Version]
- Wyser, D.; Mattille, M.; Wolf, M.; Lambercy, O.; Scholkmann, F.; Gassert, R. Short-channel regression in functional near-infrared spectroscopy is more effective when considering heterogeneous scalp hemodynamics. Neurophotonics 2020, 7, 035011. [Google Scholar] [CrossRef]
- Milej, D.; Abdalmalak, A.; Rajaram, A.; St Lawrence, K. Direct assessment of extracerebral signal contamination on optical measurements of cerebral blood flow, oxygenation, and metabolism. Neurophotonics 2020, 7, 045002. [Google Scholar] [CrossRef] [PubMed]
- Fantini, S.; Sassaroli, A. Frequency-domain techniques for cerebral and functional near-infrared spectroscopy. Front. Neurosci. 2020, 14, 300. [Google Scholar] [CrossRef] [Green Version]
- Gregg, N.M.; White, B.R.; Zeff, B.W.; Berger, A.J.; Culver, J.P. Brain specificity of diffuse optical imaging: Improvements from superficial signal regression and tomography. Front. Neuroenerg. 2010, 2, 14. [Google Scholar] [CrossRef] [Green Version]
- Gagnon, L.; Perdue, K.; Greve, D.N.; Goldenholz, D.; Kaskhedikar, G.; Boas, D.A. Improved recovery of the hemodynamic response in diffuse optical imaging using short optode separations and state-space modeling. NeuroImage 2011, 56, 1362–1371. [Google Scholar] [CrossRef] [Green Version]
- Yücel, M.A.; Selb, J.; Aasted, C.M.; Petkov, M.P.; Becerra, L.; Borsook, D.; Boas, D.A. Short separation regression improves statistical significance and better localizes the hemodynamic response obtained by near-infrared spectroscopy for tasks with differing autonomic responses. Neurophotonics 2015, 2, 035005. [Google Scholar] [CrossRef]
- Saager, R.B.; Berger, A.J. Direct characterization and removal of interfering absorption trends in two-layer turbid media. J. Opt. Soc. Am. A 2005, 22, 1874–1882. [Google Scholar] [CrossRef]
- Brigadoi, S.; Cooper, R.J. How short is short? Optimum source–detector distance for short-separation channels in functional near-infrared spectroscopy. Neurophotonics 2015, 2, 025005. [Google Scholar] [CrossRef] [Green Version]
- Cheng, X.; Sie, E.J.; Boas, D.A.; Marsili, F. Choosing an optimal wavelength to detect brain activity in functional near-infrared spectroscopy. Opt. Lett. 2021, 46, 924–927. [Google Scholar] [CrossRef] [PubMed]
- Dunne, L.; Hebden, J.; Tachtsidis, I. Development of a near infrared multi-wavelength, multi-channel, time-resolved spec-trometer for measuring brain tissue haemodynamics and metabolism. Adv. Exp. Med. Biol. 2014, 812, 181–186, Erratum in Adv. Exp. Med. Biol. 2014, 812. [Google Scholar] [CrossRef] [Green Version]
- Song, X.; Chen, X.; Chen, L.; An, X.; Ming, D. Performance Improvement for Detecting Brain Function Using fNIRS: A Multi-Distance Probe Configuration With PPL Method. Front. Hum. Neurosci. 2020, 14, 569508. [Google Scholar] [CrossRef]
- Song, X.; Chen, X.; Wang, Z.; An, X.; Ming, D. MBLL with weighted partial path length for multi-distance probe configura-tion of fNIRS. In Proceedings of the 2019 41st Annual International Conference of the IEEE Engineering in Medicine and Biology Society (EMBC), Berlin, Germany, 23–27 July 2019; pp. 4766–4769. [Google Scholar] [CrossRef] [PubMed]
- Giannoni, L.; Lange, F.; Tachtsidis, I. Hyperspectral imaging solutions for brain tissue metabolic and hemodynamic moni-toring: Past, current and future developments. J. Opt. 2018, 20, 044009. [Google Scholar] [CrossRef] [Green Version]
- Bale, G.; Elwell, C.E.; Tachtsidis, I. From Jöbsis to the present day: A review of clinical near-infrared spectroscopy meas-urements of cerebral cytochrome-c-oxidase. J. Biomed. Opt. 2016, 21, 091307, Erratum in J. Biomed. Opt. 2016, 21. [Google Scholar] [CrossRef] [PubMed]
- Heekeren, H.R.; Kohl, M.; Obrig, H.; Wenzel, R.; von Pannwitz, W.; Matcher, S.J.; Dirnagl, U.; Cooper, C.E.; Villringer, A. Noninvasive assessment of changes in cytochrome-c oxidase oxidation in human subjects during visual stimulation. J. Cereb. Blood Flow Metabol. 1999, 19, 592–603. [Google Scholar] [CrossRef] [Green Version]
- Chan, S.T.; Ordway, C.; Calvanio, R.J.; Buonanno, F.S.; Rosen, B.R.; Kwong, K.K. Cerebrovascular Responses to O2-CO2 Exchange Ratio under Brief Breath-Hold Challenge in Patients with Chronic Mild Traumatic Brain Injury. J. Neurotrauma 2021, 22. [Google Scholar] [CrossRef] [PubMed]
- McIntosh, R.C.; Hoshi, R.A.; Timpano, K.R. Take my breath away: Neural activation at breath-hold differentiates individuals with panic disorder from healthy controls. Respir. Physiol. Neurobiol. 2020, 277, 103427. [Google Scholar] [CrossRef]
- Lin, W.; Xiong, L.; Han, J.; Leung, T.; Leung, H.; Chen, X.; Wong, K.S. Hemodynamic effect of external counterpulsation is a different measure of impaired cerebral autoregulation from vasoreactivity to breath-holding. Eur. J. Neurol. 2014, 21, 326–331. [Google Scholar] [CrossRef]
- Schelkanova, I.; Toronov, V. Independent component analysis of broadband near-infrared spectroscopy data acquired on adult human head. Biomed. Opt. Express 2012, 3, 64–74. [Google Scholar] [CrossRef]
- Holper, L.; Mann, J.J. Test–retest reliability of brain mitochondrial cytochrome-c-oxidase assessed by functional near-infrared spectroscopy. J. Biomed. Opt. 2018, 23, 056006. [Google Scholar] [CrossRef] [Green Version]
- Leoni, R.F.; Mazzeto-Betti, K.C.; Andrade, K.C.; de Araujo, D.B. Quantitative evaluation of hemodynamic response after hypercapnia among different brain territories by fMRI. Neuroimage 2008, 41, 1192–1198. [Google Scholar] [CrossRef]
- Pinto, J.; Bright, M.G.; Bulte, D.P.; Figueiredo, P. Cerebrovascular Reactivity Mapping without Gas Challenges: A Method-ological Guide. Front. Physiol. 2021, 11, 608475. [Google Scholar] [CrossRef] [PubMed]
- Shrout, P.; Fleiss, J. Intraclass correlations: Uses in assessing rater reliability. Psychol. Bull. 1979, 86, 420–428. [Google Scholar] [CrossRef]
- Toronov, V.; Franceschini, M.A.; Filiaci, M.; Fantini, S.; Wolf, M.; Michalos, A.; Gratton, E. Near-infrared study of fluctuations in cerebral hemodynamics during rest and motor stimulation: Temporal analysis and spatial mapping. Med. Phys. 2000, 27, 801–815. [Google Scholar] [CrossRef] [PubMed]
- Ghali, M.G.Z.; Ghali, G.Z. Mechanisms Contributing to the Generation of Mayer Waves. Front. Neurosci. 2020, 14, 395. [Google Scholar] [CrossRef]
- Yeganeh, H.; Toronov, V.; Elliott, J.; Diop, M.; Lee, T.; St. Lawrence, K. Broadband continuous-wave technique to measure baseline values and changes in the tissue chromophore concentrations. Biomed. Opt. Express 2012, 3, 2761. [Google Scholar] [CrossRef] [PubMed]
- Nosrati, R.; Lin, S.; Ramadeen, A.; Monjazebi, D.; Dorian, P.; Toronov, V. Cerebral Hemodynamics and Metabolism During Cardiac Arrest and Cardiopulmonary Resuscitation Using Hyperspectral Near Infrared Spectroscopy. Circ. J. 2017, 81, 879–887. [Google Scholar] [CrossRef] [Green Version]
- Fabbri, F.; Sassaroli, A.; Henry, M.E.; Fantini, S. Optical measurements of absorption changes in two-layered diffusive media. Phys. Med. Biol. 2004, 49, 1183. [Google Scholar] [CrossRef] [Green Version]
- Baker, W.B.; Parthasarathy, A.B.; Ko, T.S.; Busch, D.R.; Abramson, K.; Tzeng, S.Y.; Mesquita, R.C.; Durduran, T.; Greenberg, J.H.; Kung, D.K.; et al. Pressure modulation algorithm to separate cerebral hemodynamic signals from extracerebral artifacts. Neurophotonics 2015, 2, 035004. [Google Scholar] [CrossRef]
- Scholkmann, F.; Wolf, M. General equation for the differential pathlength factor of the frontal human head depending on wavelength and age. J. Biomed. Opt. 2013, 18, 105004. [Google Scholar] [CrossRef] [Green Version]
- Toronov, V.; Walker, S.; Gupta, R.; Choi, J.H.; Gratton, E.; Hueber, D.; Webb, A. The roles of changes in deoxyhemoglobin concentration and regional cerebral blood volume in the fMRI BOLD signal. Neuroimage 2003, 19, 1521–1531. [Google Scholar] [CrossRef] [Green Version]
Figure 1.
hNIRS measurement setup: (a) approximate interrogated volumes in the scalp, skull, and brain; (b) optical sensor layout; and (c) subject position.
Figure 1.
hNIRS measurement setup: (a) approximate interrogated volumes in the scalp, skull, and brain; (b) optical sensor layout; and (c) subject position.

Figure 2.
Absorption spectra of HHb, HbO2, H2O, and rCCO.

Figure 3.
Hyperspectral signal analysis: cross-subject averaged correlation, temporal means, and temporal standard deviations for signals from 1 cm, 3 cm, and 4 cm channels. Blue color shows the cross-subject standard deviations.
Figure 3.
Hyperspectral signal analysis: cross-subject averaged correlation, temporal means, and temporal standard deviations for signals from 1 cm, 3 cm, and 4 cm channels. Blue color shows the cross-subject standard deviations.

Figure 4.
Cross-subject averaged changes in [HbO2], [HHb], and [rCCO], and regional SO2 measured at 1 cm, 3 cm, and 4 cm using the homogeneous tissue model and 750–900nm waveband. Blue color shows the cross-subject standard deviations.
Figure 4.
Cross-subject averaged changes in [HbO2], [HHb], and [rCCO], and regional SO2 measured at 1 cm, 3 cm, and 4 cm using the homogeneous tissue model and 750–900nm waveband. Blue color shows the cross-subject standard deviations.


Figure 5.
Cross-subject averaged temporal traces of [HbO2] (a), [HHb] (b), and [rCCO] (c) showing a comparison of 1 cm and 4 cm time-courses and a return to the baseline 4 min after BHs.
Figure 5.
Cross-subject averaged temporal traces of [HbO2] (a), [HHb] (b), and [rCCO] (c) showing a comparison of 1 cm and 4 cm time-courses and a return to the baseline 4 min after BHs.

Figure 6.
Cross-subject average correlation and standard deviation spectra of signals from the 3 cm and 4 cm channels after regressing out changes measured at the 1 cm channel.
Figure 6.
Cross-subject average correlation and standard deviation spectra of signals from the 3 cm and 4 cm channels after regressing out changes measured at the 1 cm channel.

Figure 7.
Cross-subject averaged changes in [HbO2], [HHb], [tHB], and [rCCO] calculated from the time-domain regression residuals using stepwise linear regression in spectral domain.
Figure 7.
Cross-subject averaged changes in [HbO2], [HHb], [tHB], and [rCCO] calculated from the time-domain regression residuals using stepwise linear regression in spectral domain.


Figure 8.
(Adapted from [23]) Averaged BOLD signal time-course with breath holding of 15 s after expiration on areas supplied by the MCA (red), ACA (blue), and PCA (black).
Figure 8.
(Adapted from [23]) Averaged BOLD signal time-course with breath holding of 15 s after expiration on areas supplied by the MCA (red), ACA (blue), and PCA (black).


Table 1.
Cross-subject average peak magnitudes, p-values, and peak times obtained from the homogeneous semi-infinite diffusion analysis. The peak magnitudes were measured from the 20 s averaged values before BHs. The peak times measured from the beginning of BHs were found in the averaged traces shown in Figure 4 with the errors estimated as the mean absolute deviation from the individual data.
| HbO2: Peak, p-Value, and Peak Times | |||||
| 1st BH | 2nd BH | 3rd BH | Cumulative | ||
| 1 cm | Δ(μM) | 5.7 ± 1.4, 0.01 | 6.3 ± 1.5, 0.02 | 3.7 ± 0.9, 0.001 | 5.2 ± 0.8, 0.000002 |
| t(s) | 25.4 ± 3.5 | 28.6 ± 3.7 | 30.5 ± 4.3 | 28.2 ± 2.3 | |
| 3 cm | Δ(μM) | 2.8 ± 0.6, 0.04 | 2.9 ± 0.6, 0.01 | 2.1 ± 0.5, 0.01 | 2.6 ± 0.3, 0.000002 |
| t(s) | 33.6 ± 3.6 | 29.6 ± 2.8 | 31.6 ± 3.3 | 31.6 ± 1.9 | |
| 4 cm | Δ(μM) | 0.2 ± 0.06 | 0.2 ± 0.1, 0.01 | 0.2 ± 0.1, 0.3 | 0.2 ± 0.07, 0.001 |
| t(s) | 28.0 ± 5.4 | 28.8 ± 4.1 | 26.6 ± 4.3 | 27.9 ± 1.3 | |
| rCCO: Peak, p-Value, and Peak Times | |||||
| 1st BH | 2nd BH | 3rd BH | Cumulative | ||
| 4 cm | Δ*10−2 | 1.1 ± 0.2, 0.01 | 0.9 ± 0.1, 0.05 | 0.8 ± 0.2, 0.04 | 0.9 ± 0.1, 0.00007 |
| t(s) | 24.4 ± 3.9 | 29.4 ± 5.4 | 27.6 ± 4.7 | 27.1 ± 2.5 | |
| HHb: Peak, p-Value, and Peak Times | |||||
| 1st BH | 2nd BH | 3rd BH | Cumulative | ||
| 1 cm | Δ(μM) | 1.9 ± 0.4, 0.017 | 2.1 ± 0.4, 0.015 | 1.9 ± 0.3, 0.002 | 2.0 ± 0.2, 0.00001 |
| t(s) | 35.0 ± 3.8 | 36.5 ± 4.1 | 42.5 ± 3.8 | 38.5 ± 4.0 | |
| 3 cm | Δ(μM) | 0.7 ± 0.3, 0.02 | 0.6 ± 0.2, 0.01 | 0.6 ± 0.2, 0.04 | 0.6 ± 0.06, 0.0003 |
| t(s) | 33.0 ± 4.3 | 32.5 ± 4.6 | 34.5 ± 5.1 | 33.3 ± 1.3 | |
| 4 cm | Δ(μM) | 0.4 ± 0.1, 0.02 | 0.3 ± 0.1, 0.6 | 0.4 ± 0.1, 0.04 | 0.4 ± 0.06, 0.008 |
| t(s) | 32.2 ± 5.7 | 31.7 ± 6.3 | 34.3 ± 4.9 | 32.7 ± 3.3 | |
Table 2.
Cross-subject average peak magnitudes and p-values obtained from the two-layer regression analysis. The peak magnitudes were measured from the 20 s averaged values before BHs.
Table 2.
Cross-subject average peak magnitudes and p-values obtained from the two-layer regression analysis. The peak magnitudes were measured from the 20 s averaged values before BHs.
| HbO2: Peak, p-Value | |||||
| 1st BH | 2nd BH | 3rd BH | Cumulative | ||
| Peak, p-Value | Peak, p-Value | Peak, p-Value | |||
| 3 cm | Δ(μM) | 0.2 ± 0.3, 0.05 | 0.1 ± 0.3, 0.2 | 0.2 ± 0.3, 0.2 | 0.2 ± 0.3, 0.007 |
| 4 cm | Δ(μM) | −0.07 ± 0.09, 0.2 | −0.03 ± 0.1, 0.3 | −0.02 ± 0.09, 0.4 | −0.04 ± 0.1, 0.01 |
| rCCO: Peak, p-Value | |||||
| 1st BH | 2nd BH | 3rd BH | Cumulative | ||
| 3 cm | Δ(μM) | 0.6 ± 0.6, 0.005 | 0.6 ± 0.7, 0.03 | 0.7 ± 0.5, 0.002 | 0.6 ± 0.6, 0.000002 |
| 4 cm | Δ(μM) | 0.2 ± 0.3, 0.03 | 0.1 ± 0.2, 0.03 | 0.2 ± 0.2, 0.001 | 0.2 ± 0.6, 0.000009 |
| HHb: Peak, p-Value | |||||
| 1st BH | 2nd BH | 3rd BH | Cumulative | ||
| 3 cm | Δ(μM) | 0.3 ± 0.4, 0.06 | 0.2 ± 0.4, 0.1 | 0.1 ± 0.5, 0.4 | 0.2 ± 0.4, 0.01 |
| 4 cm | Δ(μM) | 0.1 ± 0.1, 0.006 | 0.05 ± 0.09, 0.1 | 0.05 ± 0.1, 0.13 | 0.08 ± 0.1, 0.0004 |
| tHB: Peak, p-Value | |||||
| 1st BH | 2nd BH | 3rd BH | Cumulative | ||
| 3 cm | Δ(μM) | 1.4 ± 1.7,0.02 | 1.4 ± 1.4, 0.005 | 1.4 ± 1.7, 0.01 | 1.4 ± 1.6, 0.000005 |
| 4 cm | Δ(μM) | 0.4 ± 0.5, 0.02 | 0.3 ± 0.4, 0.03 | 0.4 ± 0.5, 0.02 | 0.4 ± 0.4, 0.00003 |
Publisher’s Note: MDPI stays neutral with regard to jurisdictional claims in published maps and institutional affiliations. |
© 2021 by the authors. Licensee MDPI, Basel, Switzerland. This article is an open access article distributed under the terms and conditions of the Creative Commons Attribution (CC BY) license (https://creativecommons.org/licenses/by/4.0/).
Share and Cite
MDPI and ACS Style
Guerouah, Z.; Lin, S.; Toronov, V. Measurement of Adult Human Brain Responses to Breath-Holding by Multi-Distance Hyperspectral Near-Infrared Spectroscopy. Appl. Sci. 2022, 12, 371. https://0-doi-org.brum.beds.ac.uk/10.3390/app12010371
AMA Style
Guerouah Z, Lin S, Toronov V. Measurement of Adult Human Brain Responses to Breath-Holding by Multi-Distance Hyperspectral Near-Infrared Spectroscopy. Applied Sciences. 2022; 12(1):371. https://0-doi-org.brum.beds.ac.uk/10.3390/app12010371
Chicago/Turabian StyleGuerouah, Zahida, Steve Lin, and Vladislav Toronov. 2022. "Measurement of Adult Human Brain Responses to Breath-Holding by Multi-Distance Hyperspectral Near-Infrared Spectroscopy" Applied Sciences 12, no. 1: 371. https://0-doi-org.brum.beds.ac.uk/10.3390/app12010371
Note that from the first issue of 2016, this journal uses article numbers instead of page numbers. See further details here.