
Parametric Analyses of the Response of Masonry Walls with Reinforced Plaster


1
Department of Architecture, Built Environment and Construction Engineering, Politecnico di Milano, 20133 Milan, Italy
2
Construction Technologies Institute, Italian National Research Council (ITC-CNR), 20098 San Giuliano Milanese, Italy
*
Author to whom correspondence should be addressed.
Appl. Sci. 2022, 12(10), 5090; https://0-doi-org.brum.beds.ac.uk/10.3390/app12105090
Submission received: 2 March 2022
/
Revised: 6 May 2022
/
Accepted: 14 May 2022
/
Published: 18 May 2022
(This article belongs to the Topic Advances on Structural Engineering)
Abstract
:This paper presents the results of a parametric study on the response of unreinforced and retrofitted masonry specimens. The adopted strengthening technique is the steel-reinforced plaster, which is very commonly used but it is not supported by a proper theoretical and experimental characterization in the scientific literature. The aim was to investigate the main parameters that affect the structural performances of the walls. Several numerical models were implemented using the finite element method to analyze the influence of the bricks’ arrangements, the mechanical properties of the mortar joints, the number of connectors, and the mechanical properties and thickness of the plaster coating. A concrete damage plasticity model was adopted to describe the bricks, the mortar joints, and the plaster behaviors. For the unreinforced specimens, the outcomes confirmed that the mortar strength had a significant influence on the performance of the wall, together with the presence of potential weaknesses in the bricks, while the bond effect was negligible. For reinforced walls, the connectors do not have a significant influence on retrofitted wall capacity but may prevent instability if a proper number is considered. Furthermore, the strength of the plaster coating does not affect the collapse load significantly, while increasing the fracture energy, which can be produced, for instance, by using fiber-reinforced concrete, increases the capacity of retrofitted walls, with more limited damage. Finally, an increase in the plaster thickness may be beneficial in terms of collapse load, even though greater thickness may increase the seismic masses significantly.
1. Introduction
Unreinforced masonry (URM) has been used for centuries, and worldwide, to build residential and public buildings, some of which are distinguished as examples of cultural heritage. These structures, which are usually designed to resist gravity loads, show poor shear resistance with respect to horizontal loads. Seismic events, long-term weathering, degradation phenomena, foundation settlements, enhanced bearing capacity requirements, or overloads in existing masonry can require structural solutions through strengthening or retrofitting, i.e., the structural protection and rehabilitation of existing masonry structures.
Masonry is a composite material that is usually made by stones or bricks in combination with mortar joints. It is characterized by a very complex nonlinear response, with a brittle response to tension and a frictional response to shear and anisotropy [1,2,3,4,5]. Brick or stone units and mortar usually have very different material properties, and they both show marked brittle behavior, which often causes the development of cracks. Due to these intrinsic characteristics, the prediction of masonry’s structural response is a very difficult task, and, despite the significant efforts undertaken by the scientific community, further experimental and theoretical developments are necessary. Given the importance of masonry structures in the existing building stock, upgrading interventions aimed at increasing their seismic performances are of the utmost importance, and a better understanding of masonry’s behavior is fundamental to design these structures effectively. When local out-of-plane wall failures are prevented by appropriate connections between elements, the resisting mechanism that governs the global response of the structure is the in-plane shear capacity of the walls, which is directly associated with the masonry’s shear strength. Among the different techniques commonly adopted to improve the in-plane performance of URM (see, for instance, [6,7,8,9,10,11,12,13]), reinforced plaster (RP) is a widely used approach. It consists in placing a steel mesh on the wall surfaces and coating it with a layer of plaster, which can be made of concrete or a ready-mix mortar. In order to transfer the shear stresses on the wall across the concrete–masonry interface, appropriate anchors are fixed with a qualified mortar system (adhesive or cementitious grout) into pre-drilled holes made in the masonry wall and connected to the steel mesh. The method is easy to install, and it produces high increases in strength and stiffness. It is not surprising, therefore, that RP coating is one of the most common retrofitting interventions on masonry.
Despite its frequent use, and even though many technical codes [14,15] often suggest it as an effective retrofitting technique, it is difficult to obtain a satisfactory characterization of masonry with RP in the scientific literature, especially from an experimental point of view. To cover this lack of knowledge, an experimental study on masonry specimens retrofitted with RP is ongoing at Politecnico di Milano, with the aim of investigating the effectiveness of this strengthening solution. The diagonal compression test [16,17,18,19], recommended by several national and international building codes to characterize the tensile strength of masonry, is being used as a tool to compare the responses of the analyzed specimens. In order to provide guidance to the experimental program, a numerical study was conducted on masonry walls, unreinforced and retrofitted with RP, analyzing the main parameters that have an influence on the in-plane structural response. Attention was given to several parameters, such as the mortar and plaster’s properties, or the number of anchors.
The high level of complexity associated with the modeling and analysis of masonry structures has led to the development of very different approaches, based on different hypotheses, with different levels of accuracy and computational costs. The possibilities span from distinct element models [20,21,22] to continuous finite element models, with the latter covering a variety of cases, depending on the level of discretization detail: homogeneous macromodels [23,24,25], simplified micromodels with no unit–joint interfaces [26], micromodels with simplified interfaces [27,28], or detailed micromodels [29], with diverse options of material constitutive laws. For this research, the numerical procedure is based on finite element modeling, which considers the local mechanical parameters of bricks and mortar with a simplified micro-modeling approach. The preliminary experimental outcomes of the experimental program were used to validate the numerical models.
The aim of the paper is to present and discuss the results of the parametric study, to allow a satisfying characterization of the retrofitting method and to guide researchers and engineers in their choice of proper design parameters. After the presentation of the main data about the experimental tests, the implemented numerical model is described, together with the constitutive models adopted for the different materials. The parametric analysis follows, with discussions on the effect of the analyzed parameters on the performance of the reinforced wall. The results of this study show that the connectors do not have a significant influence on the retrofitted wall capacity, but may prevent instability phenomena if a proper number is considered. Furthermore, the strength and thickness of the plaster may be beneficial in terms of collapse load, even if, regarding the thickness, it is always recommended to use smaller values to keep the seismic mass as low as possible. Lastly, the presence of the steel reinforcement is convenient to increase the maximum load and, especially, the ductility of the system. As an alternative to the steel mesh, the use of fiber-reinforced concrete may be considered, with analogous performance of the retrofitted wall, but with more limited damage.
2. Experimental Test
2.1. Specimen and Experimental Set-Up
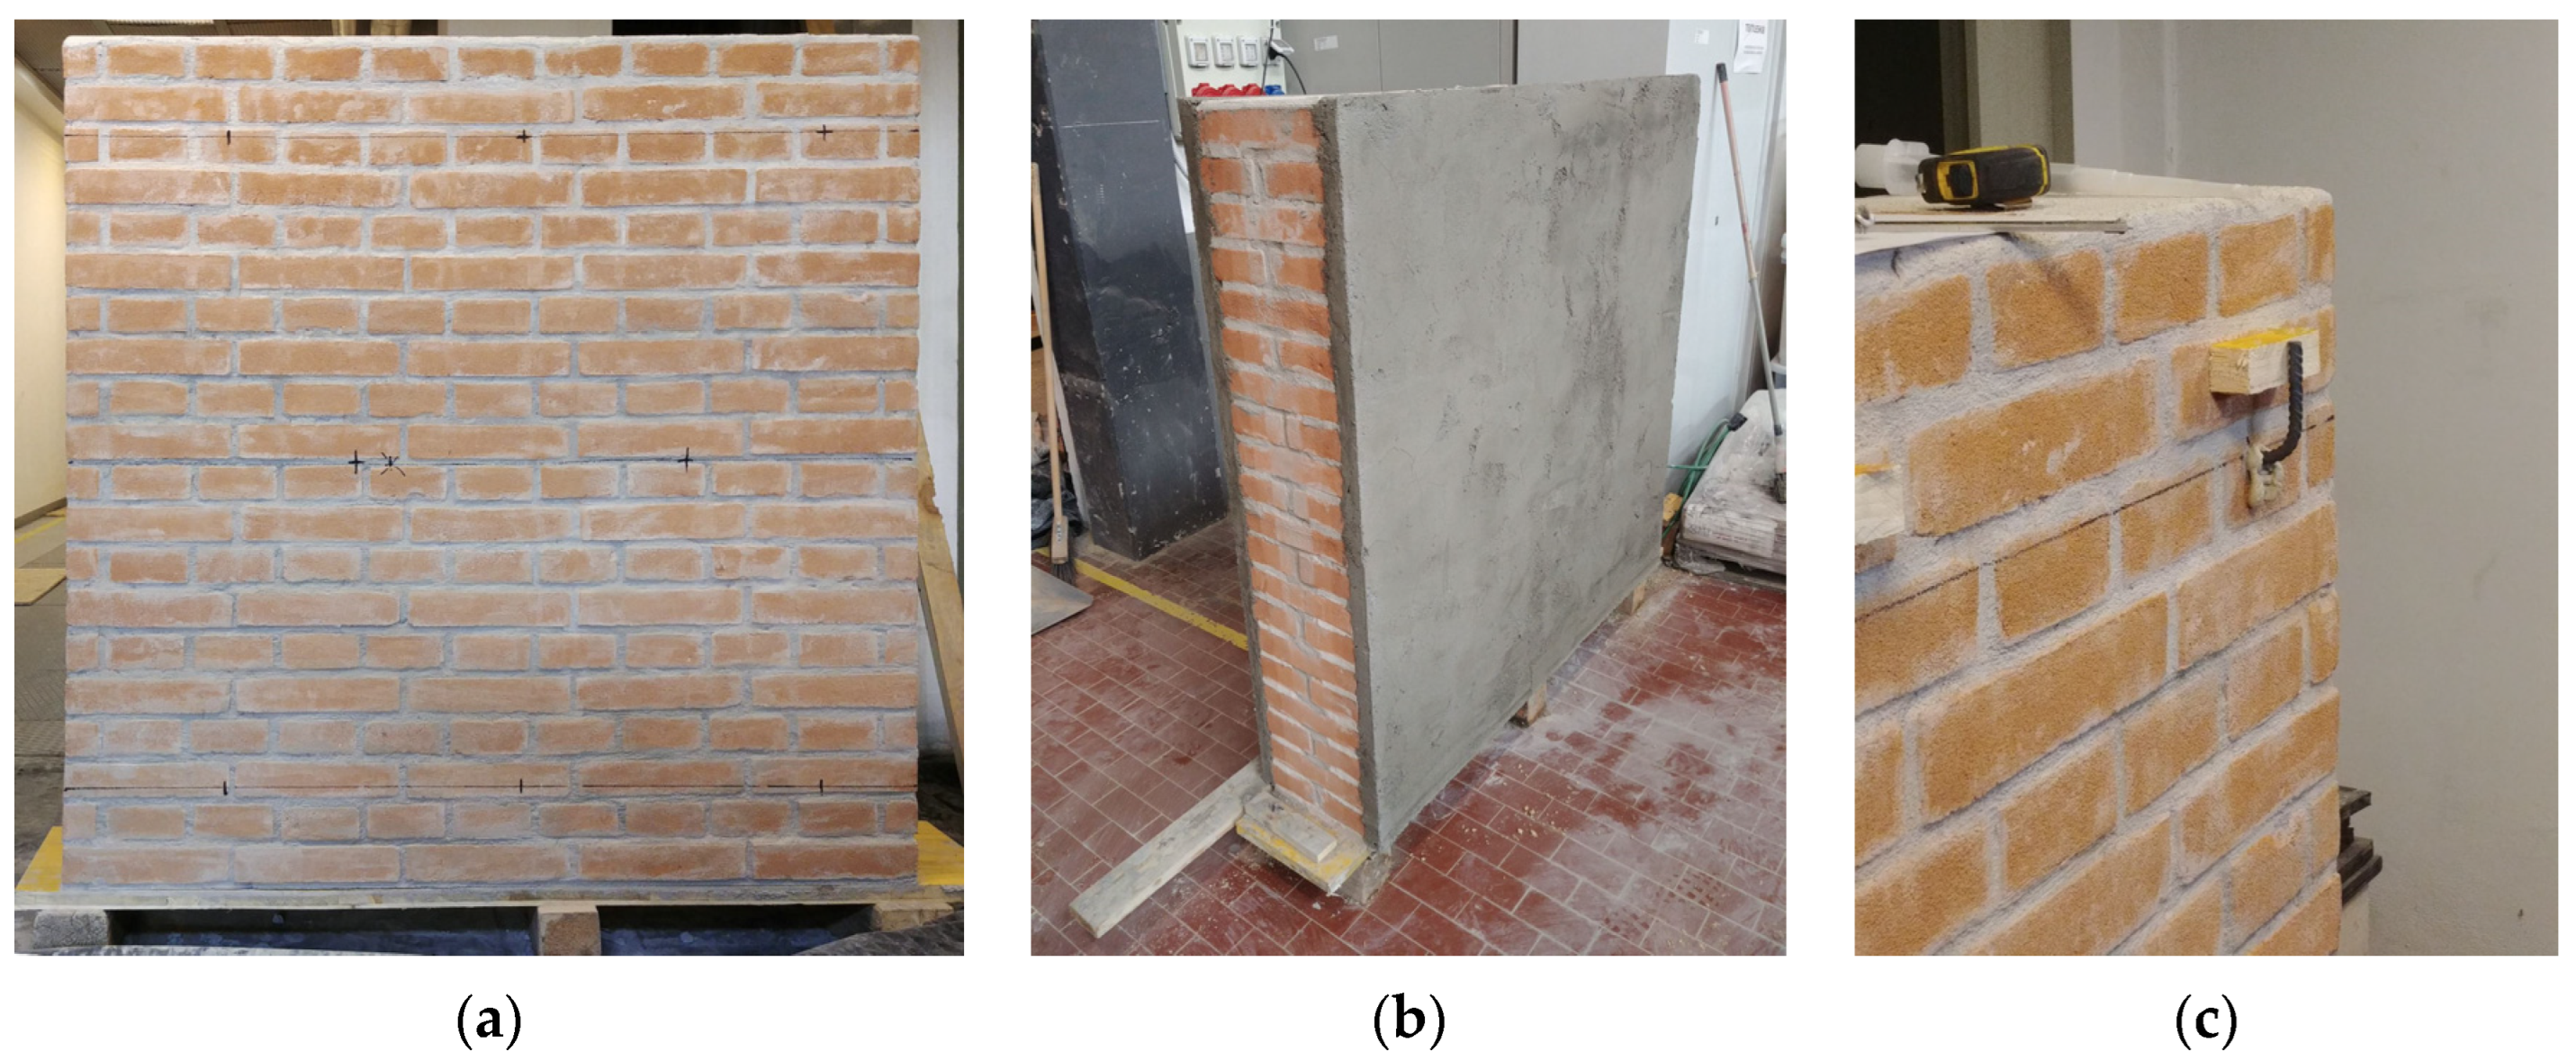
The geometry of the specimen, defined according to the suggestions given by ASTM-E-519-02 [21], was 1290 mm × 1290 mm, with a 250-mm thickness. Solid clay bricks, assembled with mortar joints of 10 mm, were considered. The bricks were the “Rosso Vivo A6R55 W”, which are very common in existing masonry buildings in Italy, produced by San Marco Terreal, with dimensions of 250 mm × 120 mm × 55 mm. The bricks were arranged in English bond layout (Figure 1a). A lime-cement mortar classified as M2.5 by Italian Building Code [14] was used for bed joints, with 1:5 water/cement ratio by weight. The mechanical characterization of the materials was derived from three-point bending and compressive tests, performed according to ASTM C293 [30] and ASTM C348 [31]. The average compressive strength of the bricks was 23.3 MPa. The mean value of mortar compressive strength was 5.4 MPa, and the mean flexural strength was 2.1 MPa. In the reinforced configuration, a steel mesh of 6-mm-diameter wire (B450C class) with a spacing of 100 mm in both horizontal and vertical directions was embedded in the plaster as reinforcement. A cement-based mortar was adopted for the plaster (Figure 1b). Experimental tests (i.e., three-point bending and compressive tests) were also performed for the plaster mortar, which gave a mean compressive strength of 33.91 MPa and a mean flexural strength of 6.38 MPa. The RP was connected to the masonry wall by using steel anchors in the form of steel-ribbed rebars (B450C, 8-mm diameter, 200-mm embedment depth), bent at one end with a 90-degree hook 50 mm in length (Figure 1c). The anchors were installed with a hybrid adhesive into boreholes 10 mm in diameter and following a quincunxes pattern with a density of 5 anchorage/m2. The plaster was applied on both sides of the specimen.
The diagonal compression (DC) test [16,17,18,32] was used for the characterization of the in-plane behavior of the masonry panels. The test consists of loading a masonry assemblage of compression along with one of the diagonals, thus causing tension failure, with the specimen splitting apart parallel to the direction of load. It should be stressed that the test is not able to catch all the possible failure modes (e.g., rocking/crushing), but only the diagonal cracking failure, which is a recurrent failure mechanism usually observed after earthquakes [33,34].
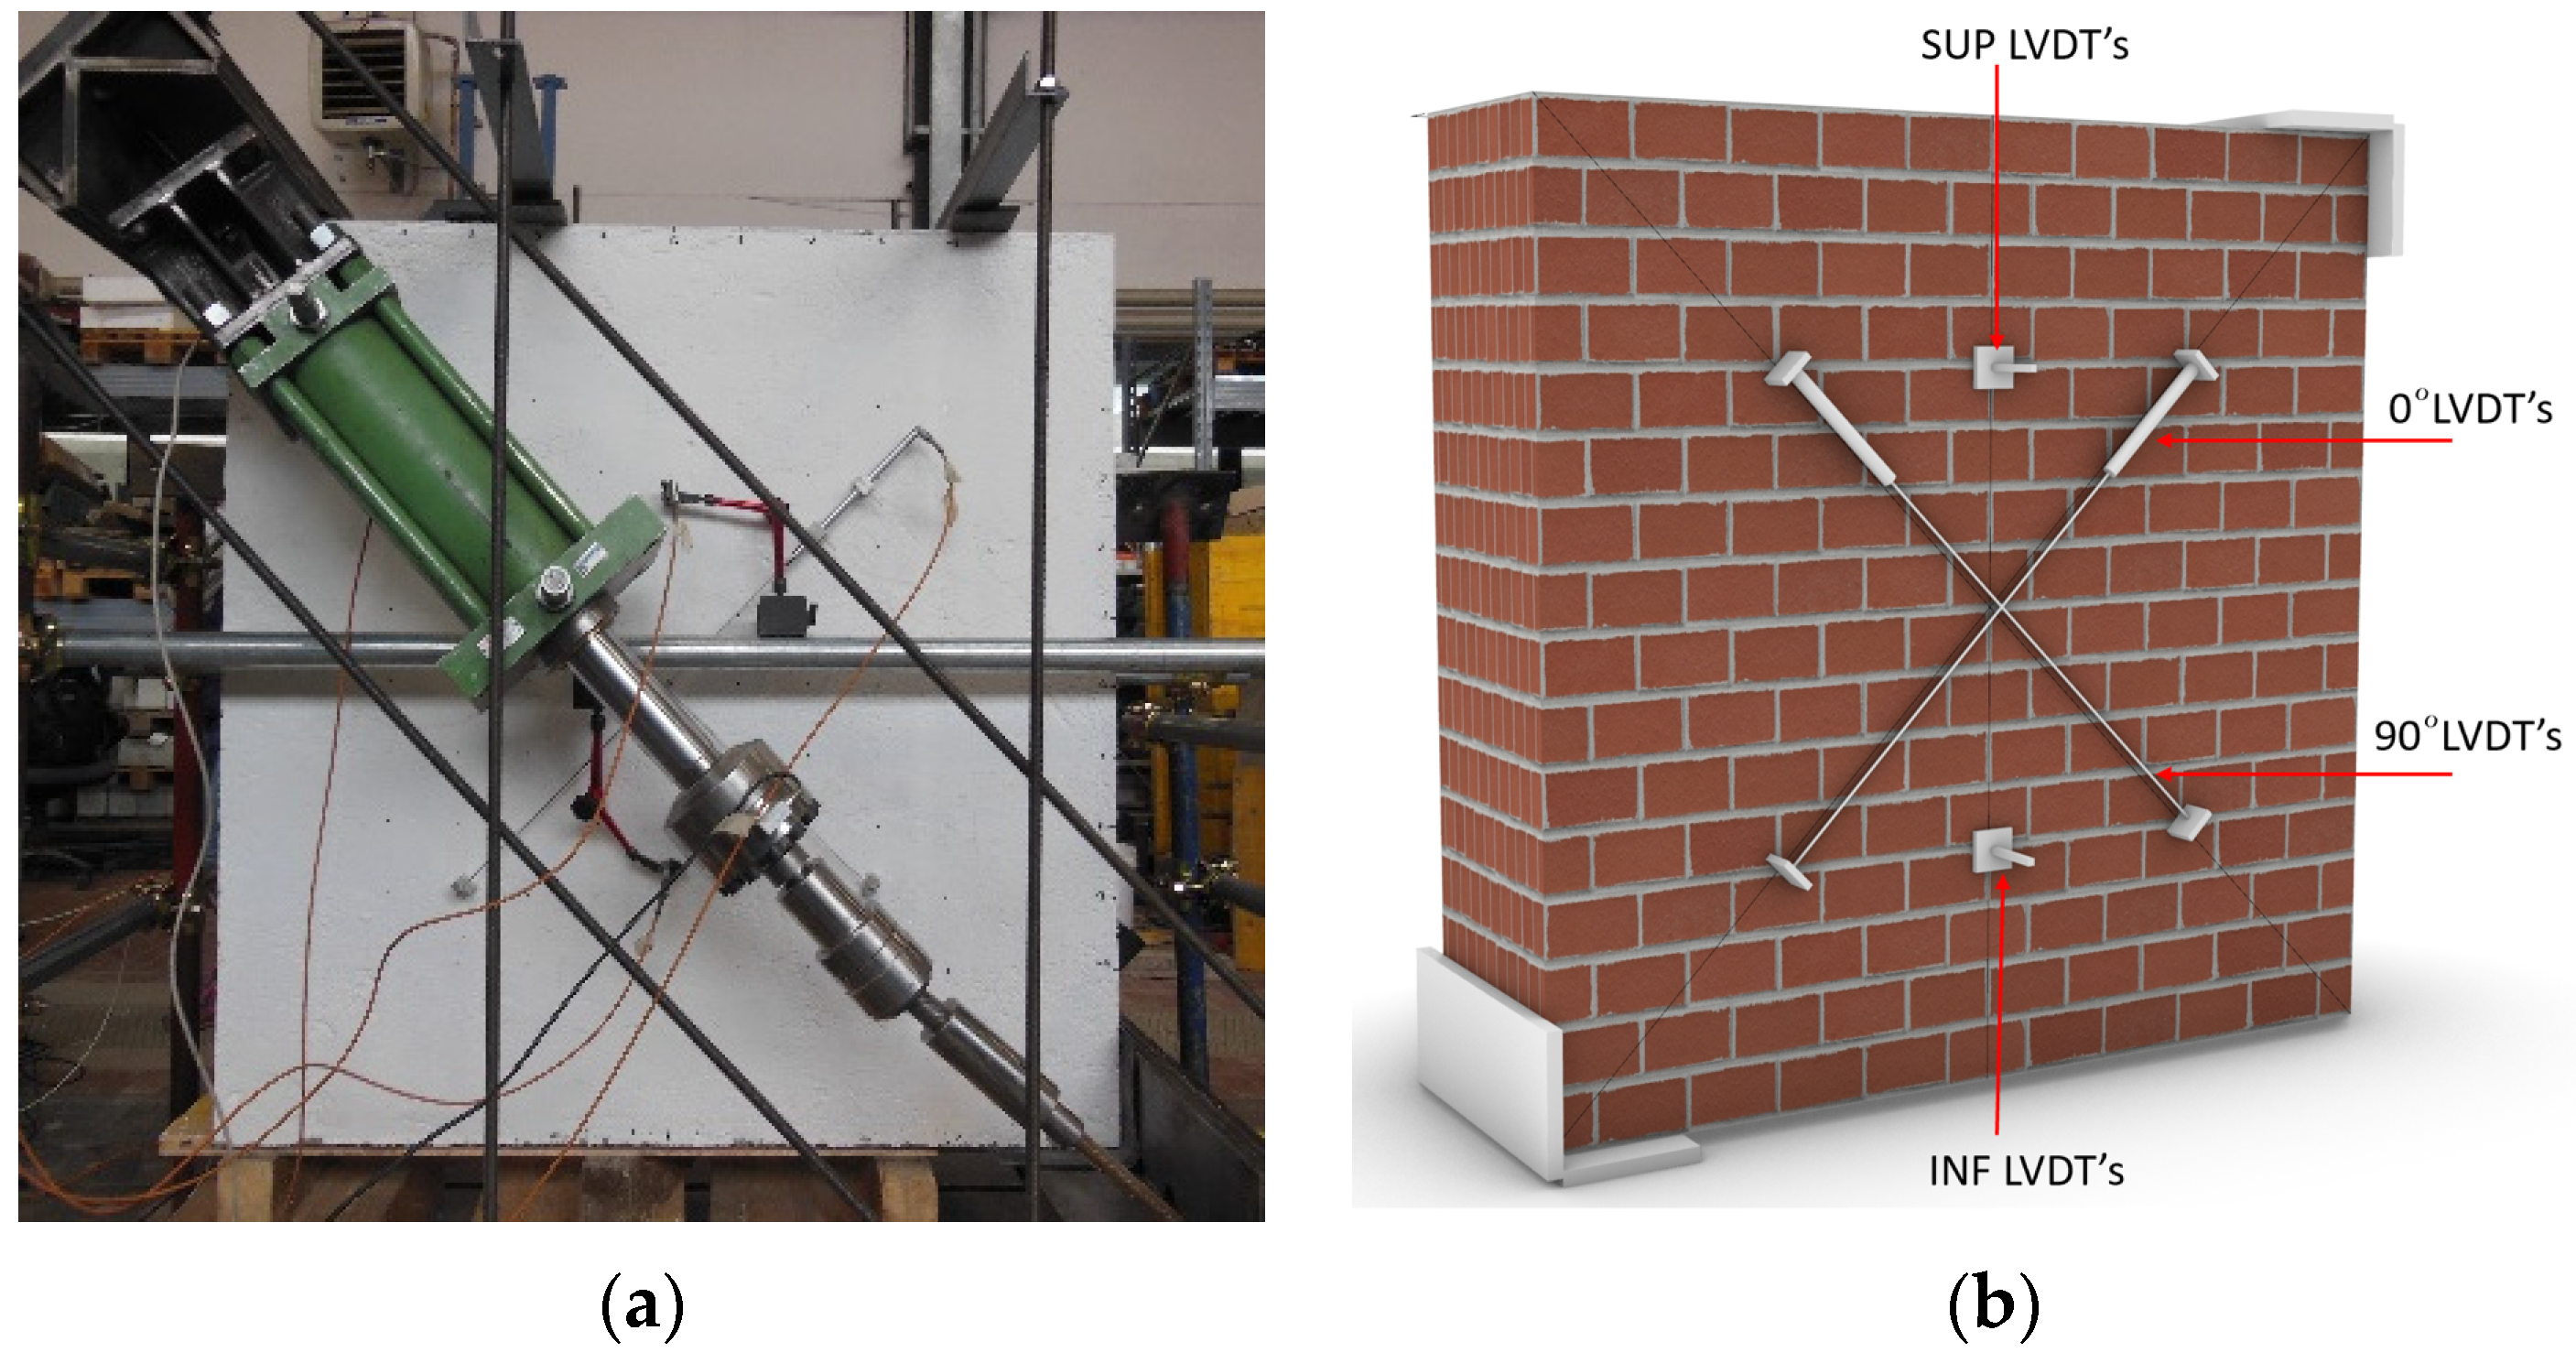
Two hydraulic jacks, each with a capacity of 300 kN, were placed on both sides of the wall (Figure 2a), along the diagonals of the specimen. The load was continuously monitored with a couple of load cells. Two steel shoes with L-shaped cross-sections and 150 mm in web length were placed at the ends of the main diagonal to transfer the diagonal displacement applied by hydraulic jacks. The tests were performed under displacement control at a displacement rate of 0.05 mm/s. Two linear variable differential transformers (LVDTs) were fixed along the diagonals of each lateral surface, with a 90-degree angle between them (gauge length of about 800 mm) (Figure 2b). Another two LVDTs were applied on each face, orthogonally to the front and backside of the specimen, to monitor the out-of-plane deformation of RP.
2.2. Experimental Results
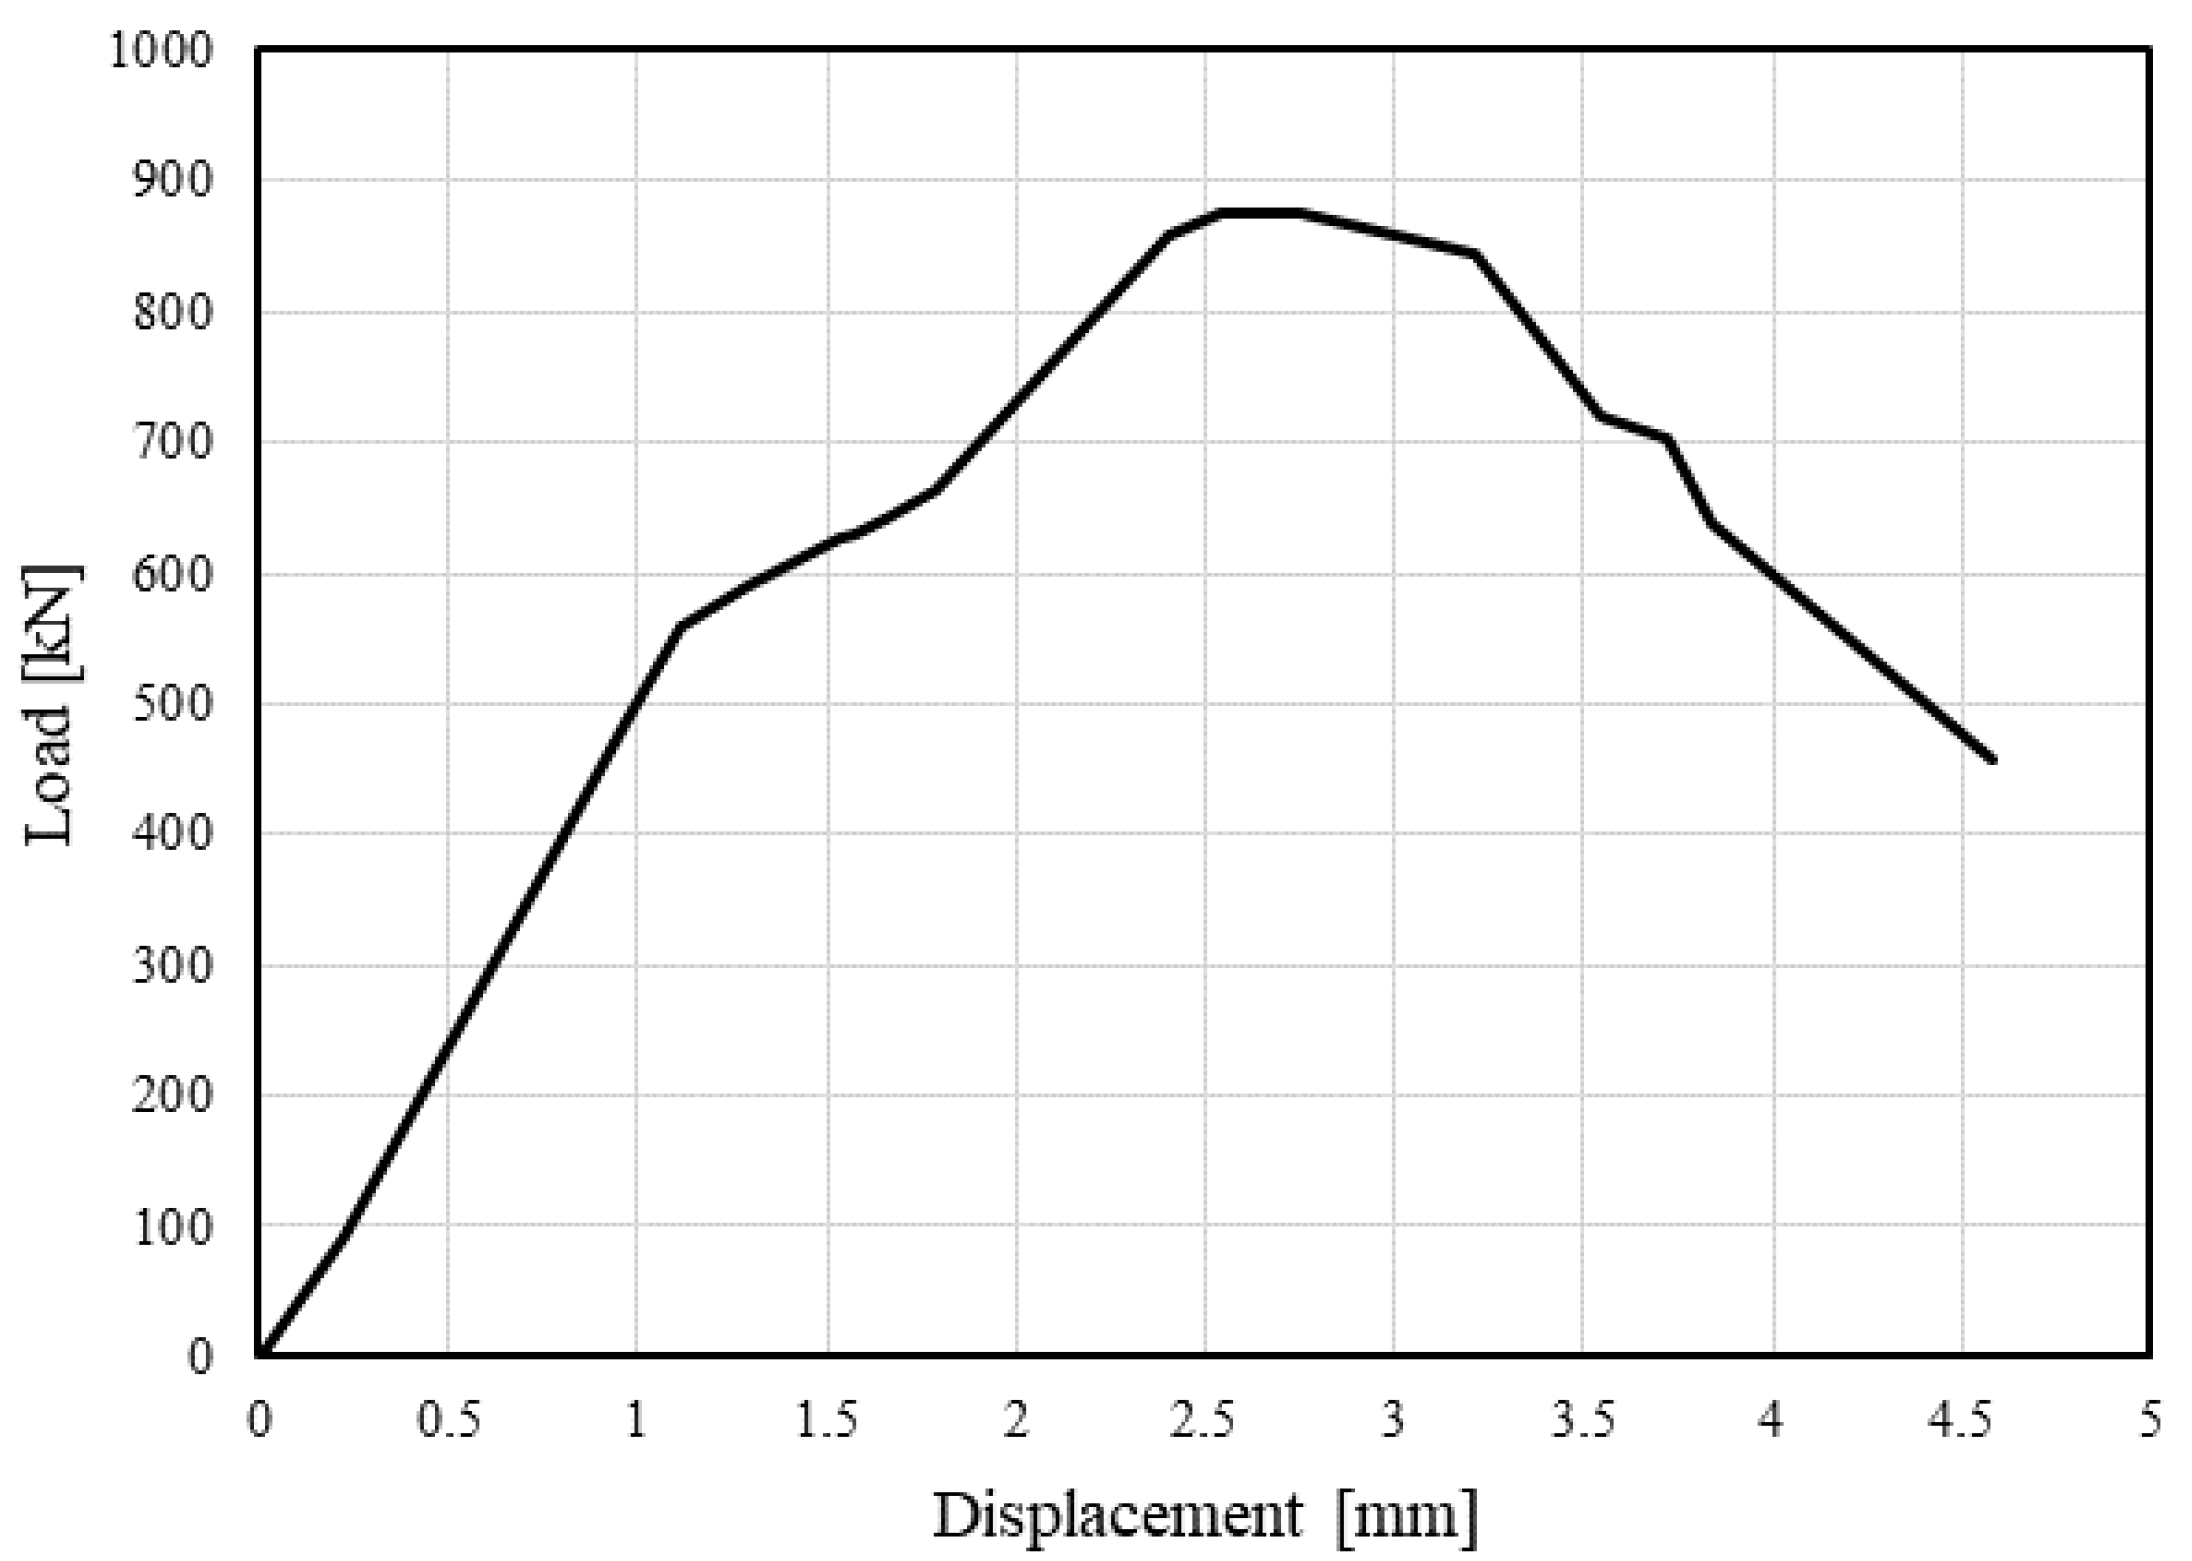
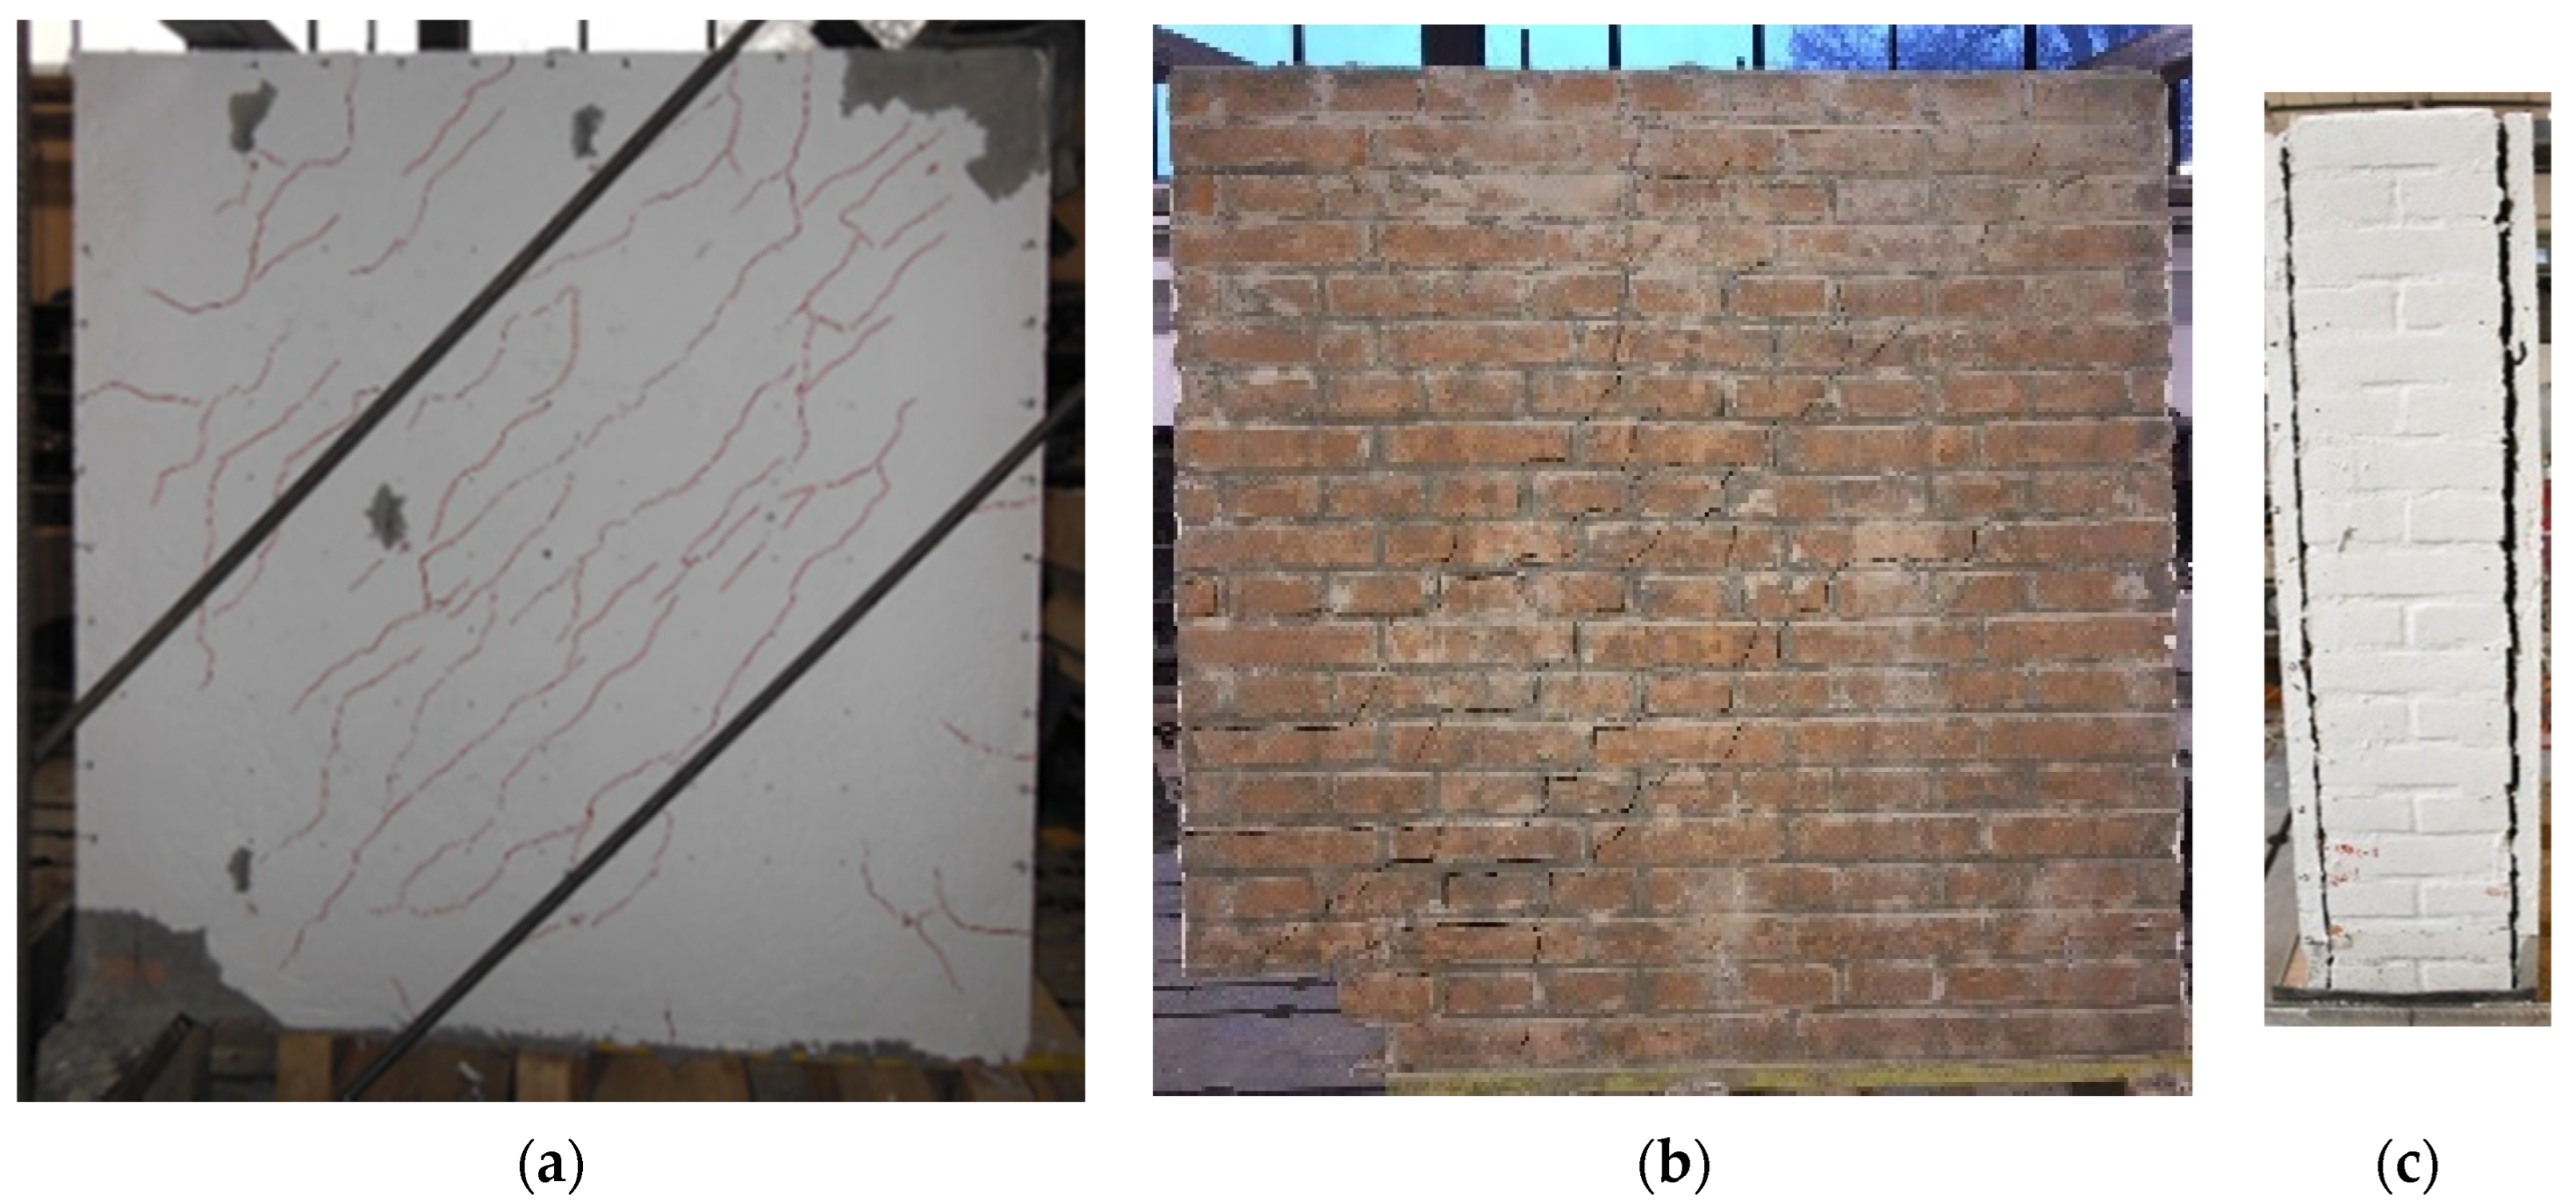
The first noticeable damage was located close to the loading shoes, where a detachment of the RP was detected. Diagonal cracks also appeared on the surface of the plaster. The detachment and the damage progressively increased with the increase in the imposed displacement. The maximum load was reached at 875 kN. Figure 3 shows the load vs. displacement curve, in which the displacement data were obtained by geometrical relations on the LVDTs measurements. The formation of damage corresponds to the beginning of the non-linear phase of the curve. At the peak load, a significant level of damage was already achieved. Figure 4 shows the crack pattern at failure on both plaster and masonry, and the detachment of the plaster layer. The cracks in the plaster resulted in a large area, while in the masonry, a small number of main cracks were detected along the loaded diagonals. At failure, the area close to the loading shoes was completely crushed and several anchor hooks were bent up again and punched the concrete cover.
3. Numerical Simulations
3.1. Finite Element Model
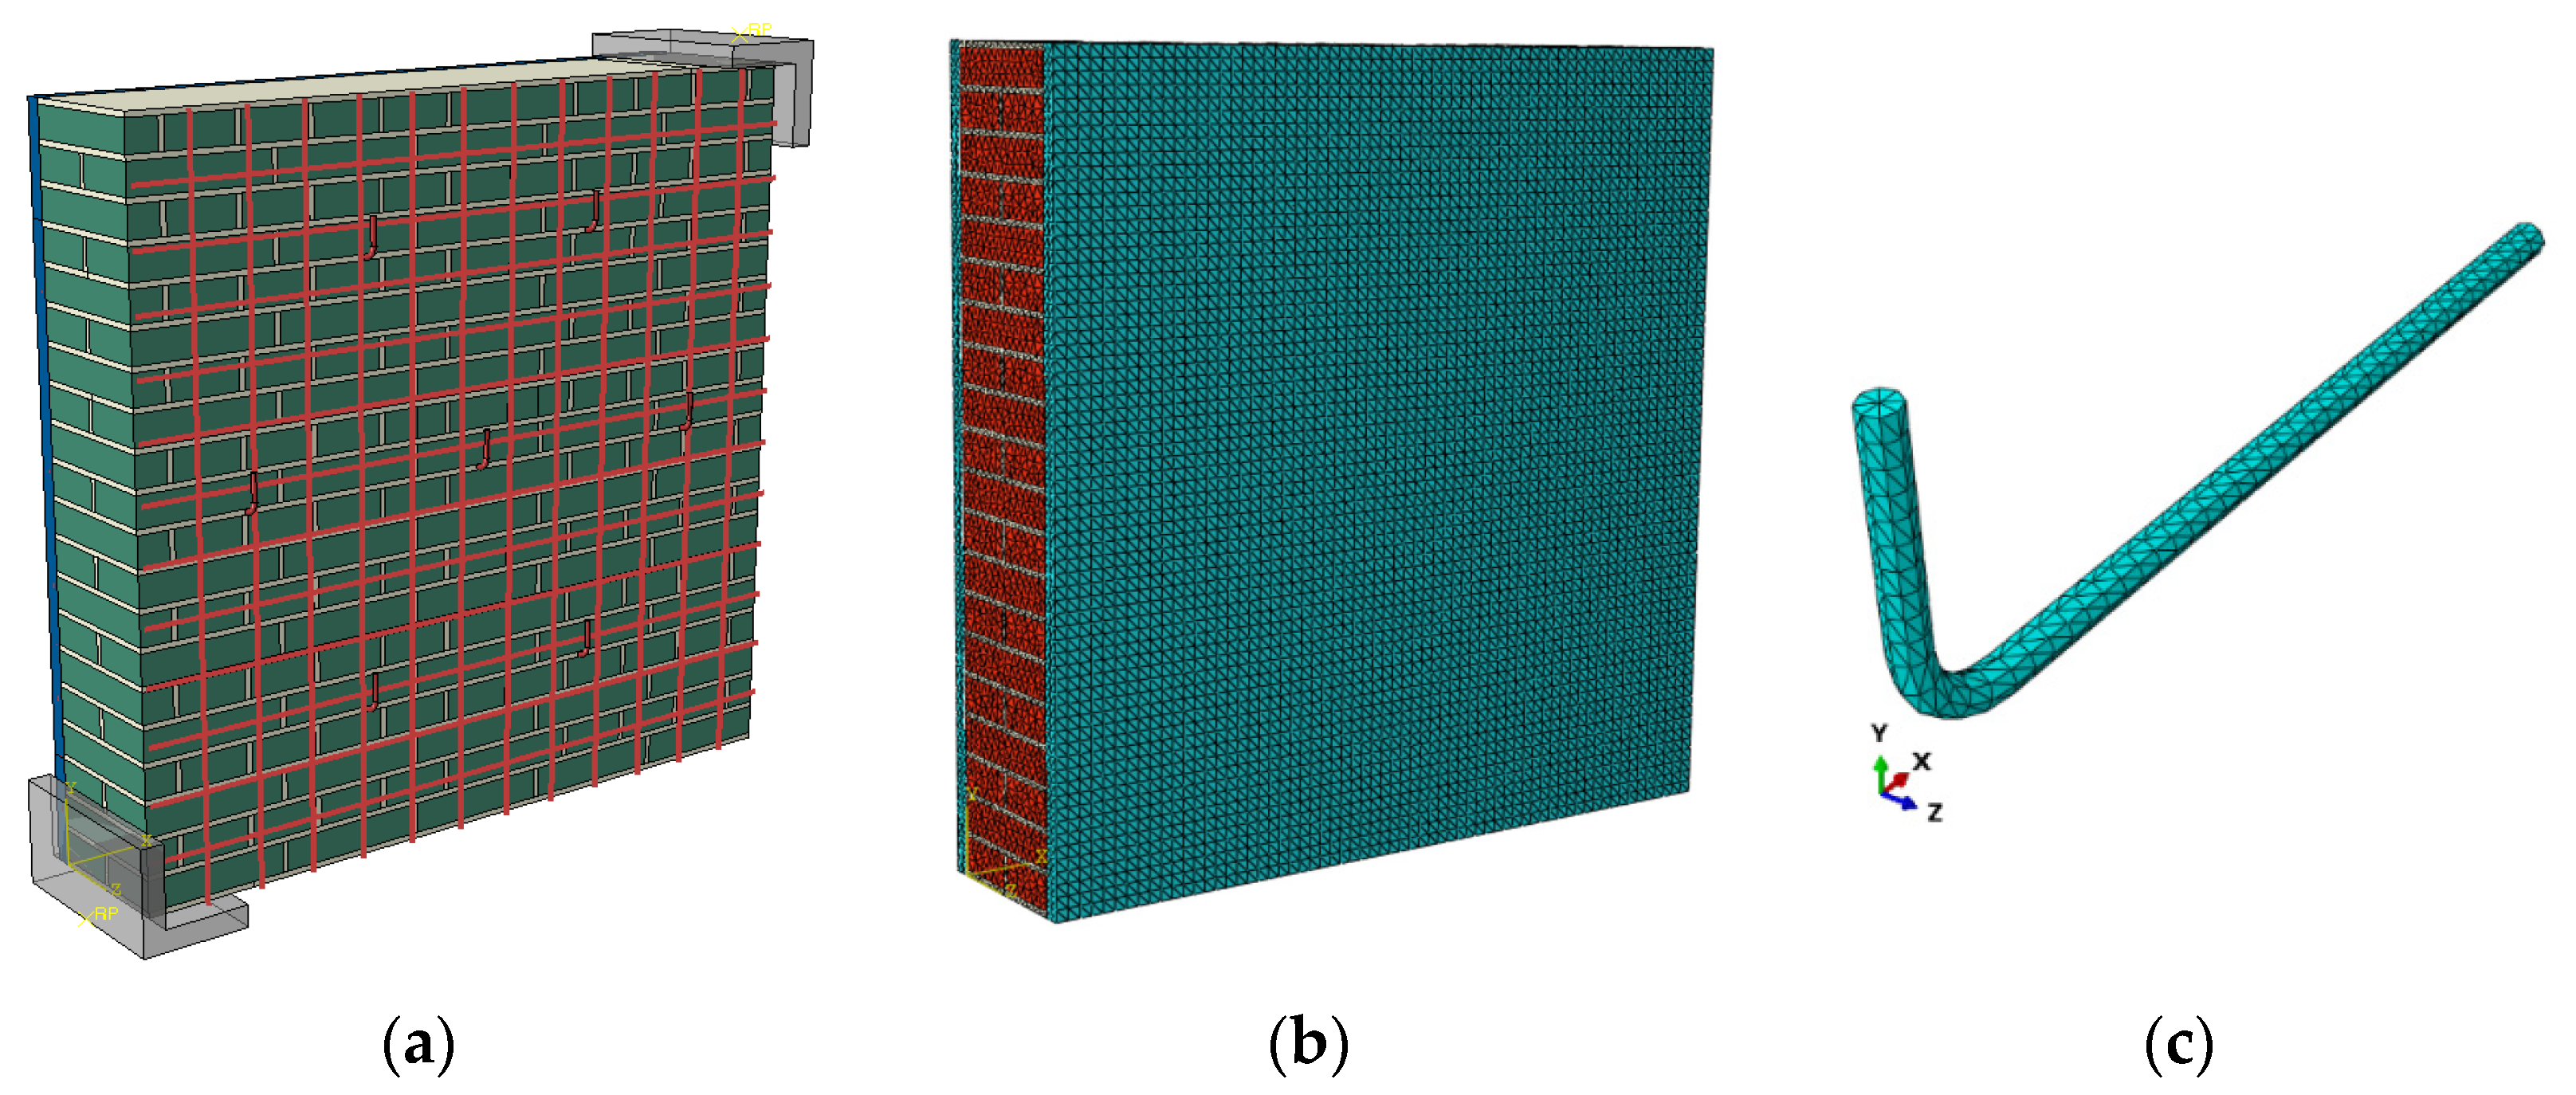
The numerical analyses were performed using 3D FE models of the specimens (Figure 5a), which were developed with the commercial software, Abaqus [35]. Since the analyses were restricted to wall specimens of limited dimensions, a simplified micro-modelling approach was adopted for the masonry by defining the individual mechanical properties of the units and the mortar, with no unit–mortar interfaces [8,26].
The size of the mesh and the typology of the elements were defined based on a sensitivity analysis. The interactions of the masonry components were fully compatible. Solid tetrahedral elements with mesh sizes of 20 mm and 10 mm were adopted for the brick and the mortar, respectively. The unit–mortar interface was not modeled in order to keep the computational time reasonable. For the retrofitted configuration, solid linear tetrahedral elements with mesh sizes of 20 mm and 5 mm were adopted for the plaster and nails, respectively. For the anchors, due to their curved geometry, a refined mesh was adopted compared to the other materials to avoid overclosure at the interface with the masonry and plaster. The interaction between the plaster and the wall surface was defined as normal hard contact and tangential behavior with friction coefficient μ = 0.1. This assumption made possible the development of debonding mechanisms. The interaction between the anchors and the plaster was also defined as normal hard contact and tangential behavior, but with a friction coefficient of μ = 0.4. The steel net was modeled by using beam elements embedded in the plaster region. A view of the reinforced specimen mesh is reported in Figure 5b, while a detail of the anchor’s mesh is reported in Figure 5c.
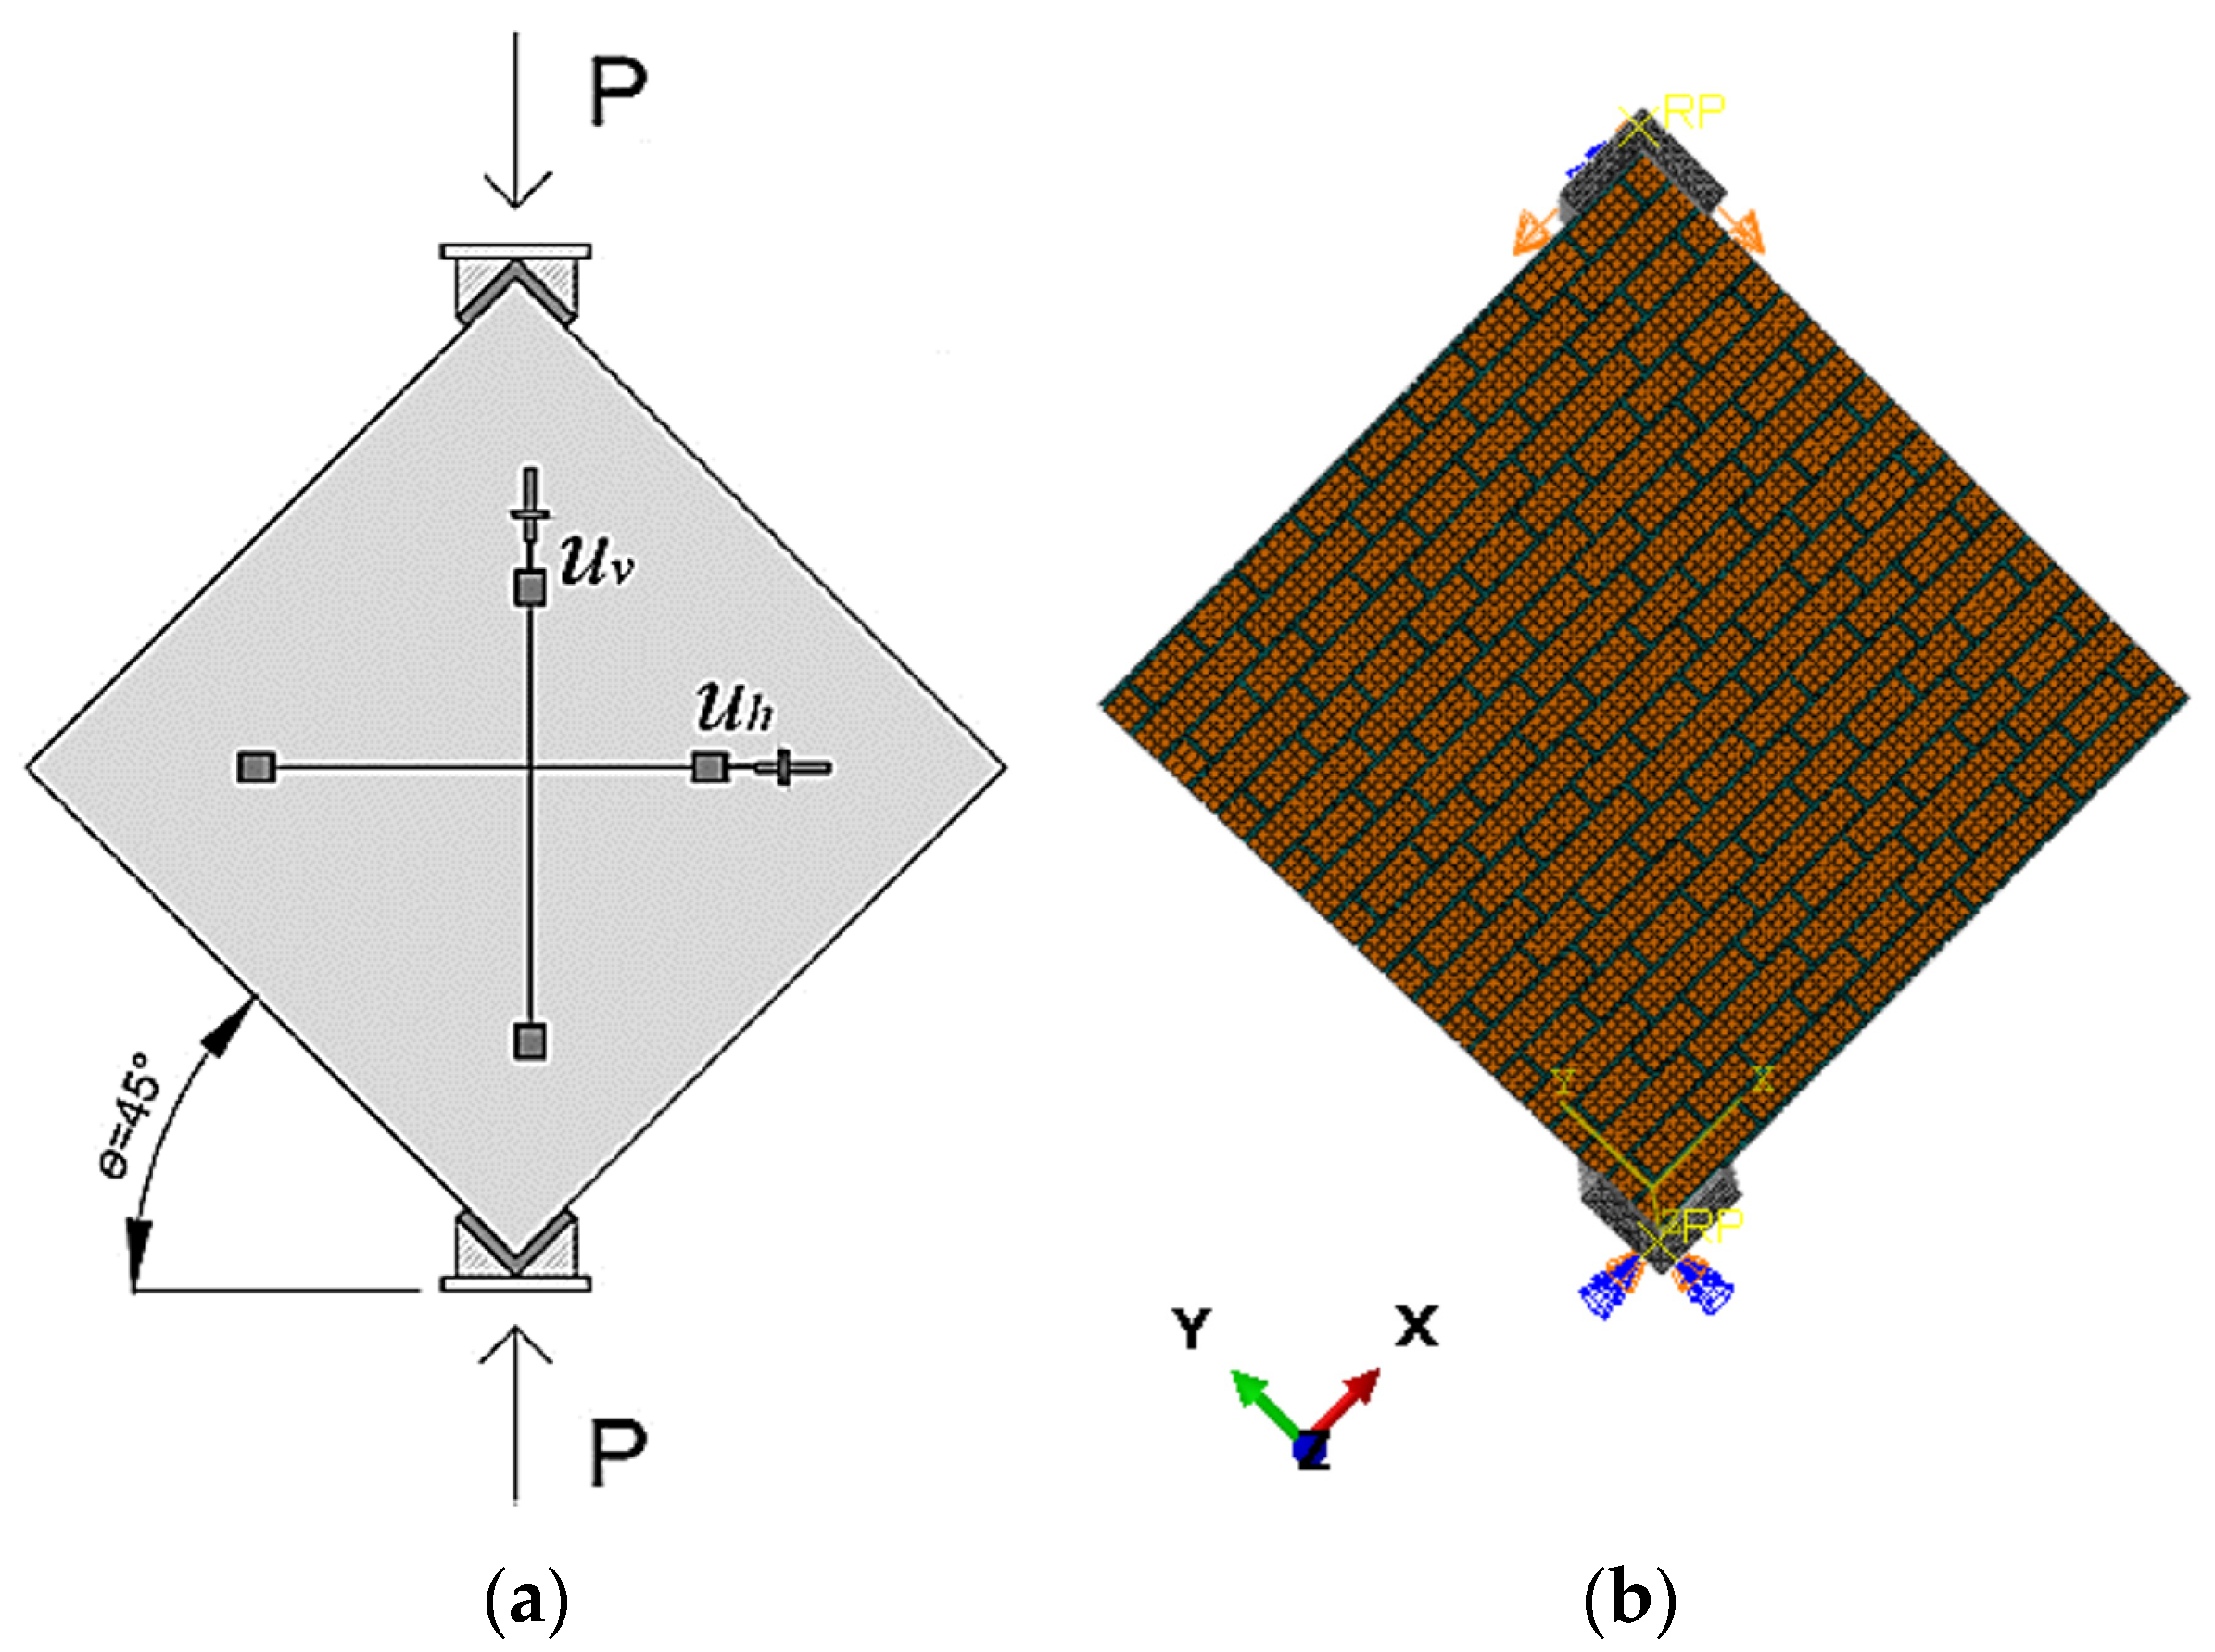
The numerical simulations followed the protocol suggested by ASTM-E519 [36]. The test setup is represented in Figure 6a. The steel shoes were modeled as rigid elements, and their interaction with the masonry was defined as normal hard contact and tangential behavior, with a friction coefficient of μ = 0.2. The simulation of the load application was performed through the imposed displacements applied on one shoe, while the other shoe was considered fully constrained to the ground. Figure 6b shows the finite element model of the specimen, with the load and boundary conditions.
The numerical solution was conducted by adopting a dynamic explicit solver, which uses the central difference time integration by considering the diagonal mass matrix of the system. Since the model is intrinsically nonlinear, the dynamic explicit solver can capture the nonlinear behavior of the specimen if a large number of small increments is adopted. Nevertheless, it should be considered that the real specimen is placed under static loading and not dynamic. For this reason, the time increment and the sizes of the meshes were optimized to solve the problem in a quasi-static manner, by diminishing the effects of the kinetic energy.
3.2. Mechanical Properties and Constitutive Laws
The mechanical properties adopted in the numerical analyses are collected in Table 1, where γ is the weight density, E is the Young modulus, υ is the Poisson ratio, and σcu and σt0 are the failure stress in the compression and tension, respectively. The values for the masonry, concrete, and steel were defined based on the data available from the experimental tests and according to EC2 [19]. All the unavailable mechanical data were quantified by calibration on the experimental results or on the basis of studies published by other researchers on analogous materials.
A concrete damage plasticity (CDP) model [37], already implemented in the Abaqus code, was assumed for the mortar, blocks, and concrete, while elastic–plastic behavior with strain hardening was considered for the steel, with yielding stress of 450 MPa, ultimate stress of 550 MPa, and plastic strain equal to 0.14. The CDP was developed by Lubliner [37] to describe the non-linear response of concrete, but it was found to be suitable for all applications with materials that exhibit brittle/quasi-brittle behavior and damage. Examples of the application of the CDP model to masonry structures may be found in [18,38,39]. The main features of the CDP model are the following: (1) linear and isotropic behavior in the elastic regime; and (2) elastic–plastic damageable behavior in the nonlinear range, taking into account the difference between the compressive and tensile strengths and the softening behavior once the strength of the material is reached.
The adopted plasticity-based damage model assumes that the two main failure mechanisms are tensile cracking and compressive crushing. Under uniaxial tension, the stress–strain response follows a linear elastic relationship until the value of the failure stress, σt0, is reached. The failure stress corresponds to the onset of micro-cracking in the material. Beyond the failure stress, the formation of micro-cracks is represented macroscopically with a softening stress–strain response, which induces strain localization in the material’s structure. Under uniaxial compression, the response is linear until the value of the initial yield, σc0. In the plastic regime, the response is typically characterized by stress hardening followed by strain softening beyond the ultimate stress, σcu. It is assumed that when the material is unloaded from any point on the softening branch, the response is characterized by a reduced elastic stiffness (damage). The degradation “d” of the elastic stiffness is governed by two damage variables, dc and dt, which are assumed to be functions of the plastic strains. These variables may assume values from zero (undamaged material) to one, which represents the total loss of stiffness.
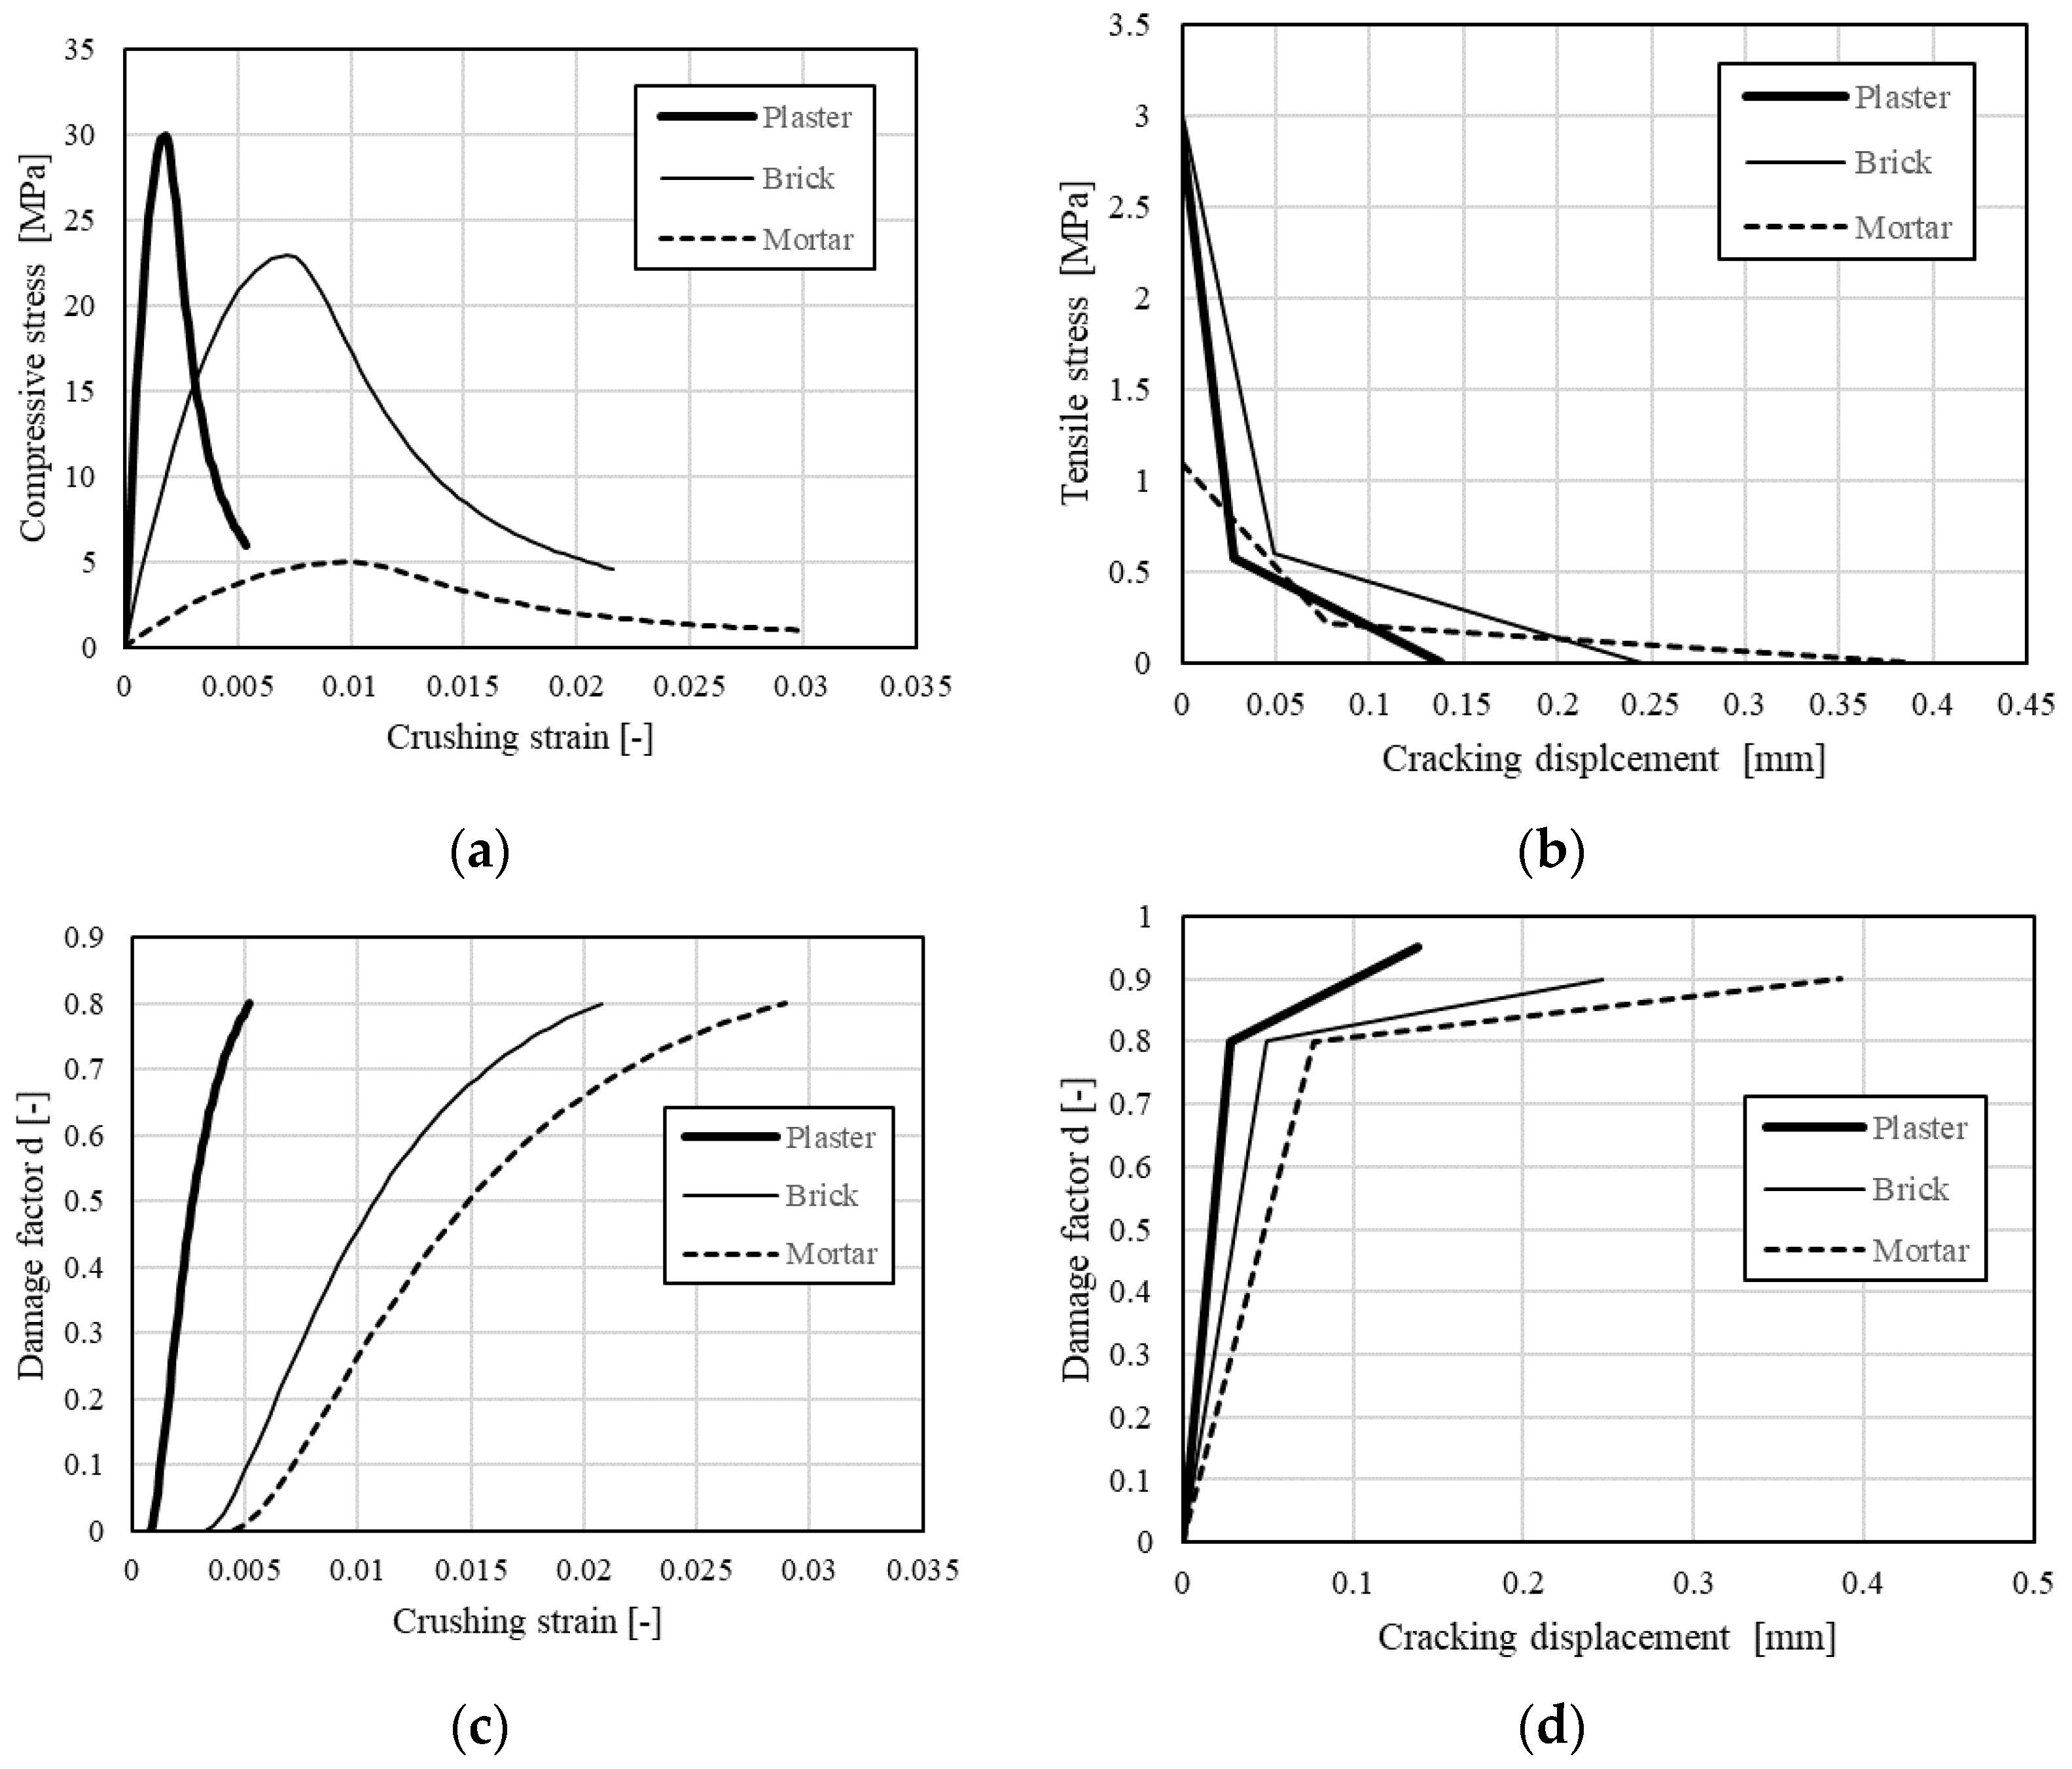
Figure 7 reports, for the mortar, brick, and plaster, the stress–strain behavior of the compression, the post-failure stress–displacement curves of the tension, and the values of the damage factor of the tension and compression.
A Drucker–Prager (DP) strength domain was assumed; its main parameters for the different materials are reported in Table 2. K is a parameter whose role is to smoothly distort the DP surface in the deviatoric plane from a circle to a surface more similar to a Mohr–Coulomb one; the adopted K value was the one suggested by the user’s guide to closely approximate a Mohr–Coulomb failure criterion. The regularization of the tensile corner was also adopted by means of a correction parameter, referred to as eccentricity e, expressing the rate at which the plastic flow potential approached the linear Drucker–Prager function at high confining pressure stress. A default value equal to 0.1 was adopted, which ensured that the dilation angle would remain constant over a wide range of confining pressures. Another important issue in dealing with masonry is the non-associativity of the plastic part. CDP allows the setting of a user-defined dilation angle Ψ of the elastoplastic part of the inelastic deformation. The ratio between the biaxial and the monoaxial compression strength σb0/σco was set to be equal to 1.16, while a relatively large value of the viscosity parameter μ was adopted to promote faster convergence based on the recommendations found in the literature [35,40], after several trial-and-error attempts.
3.3. Validation
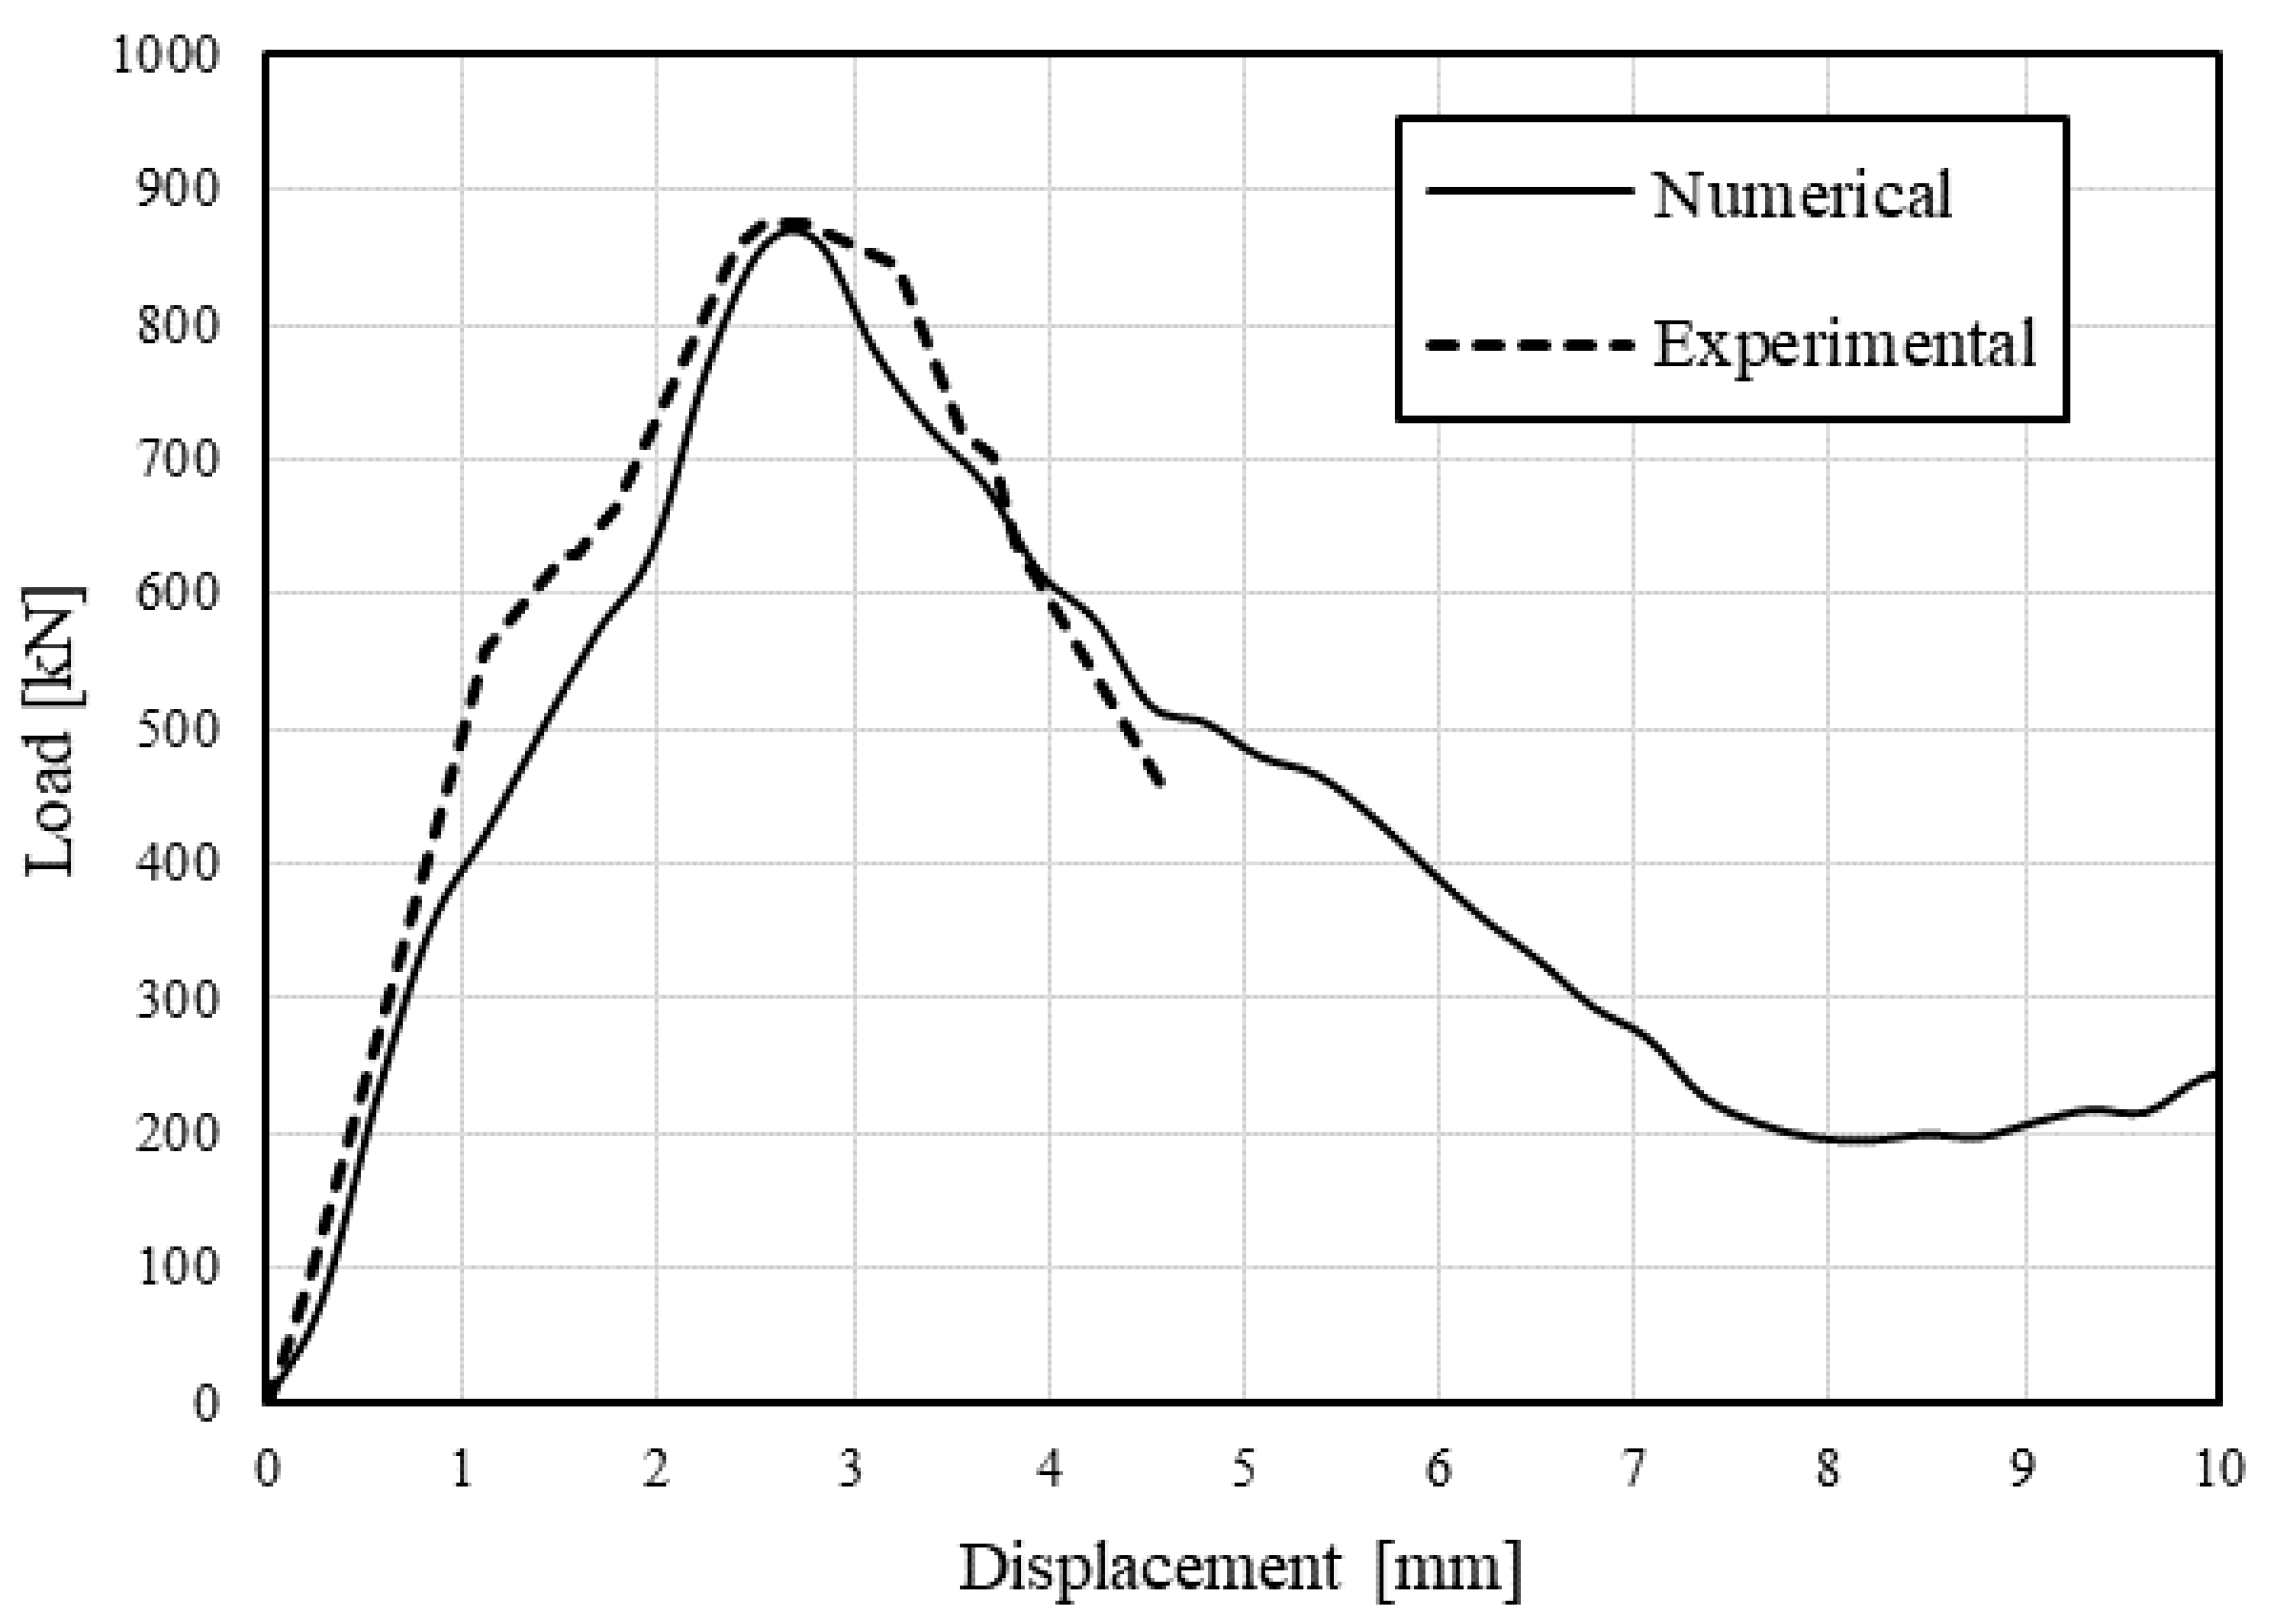
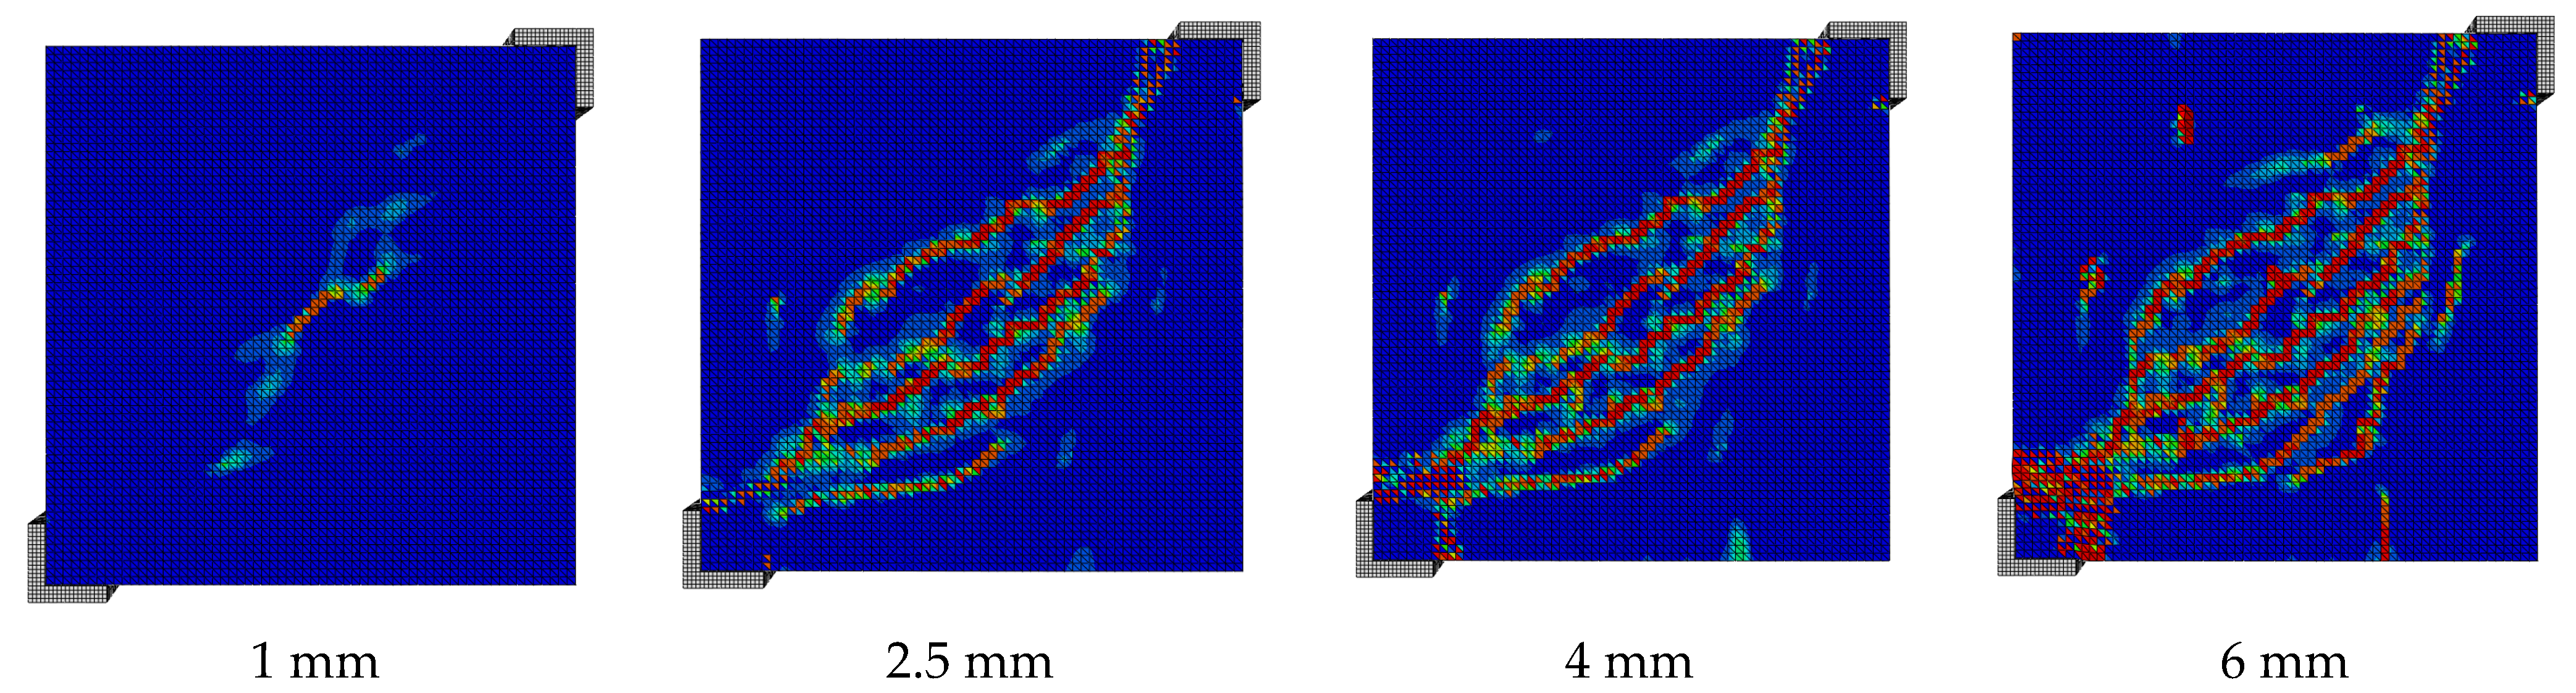
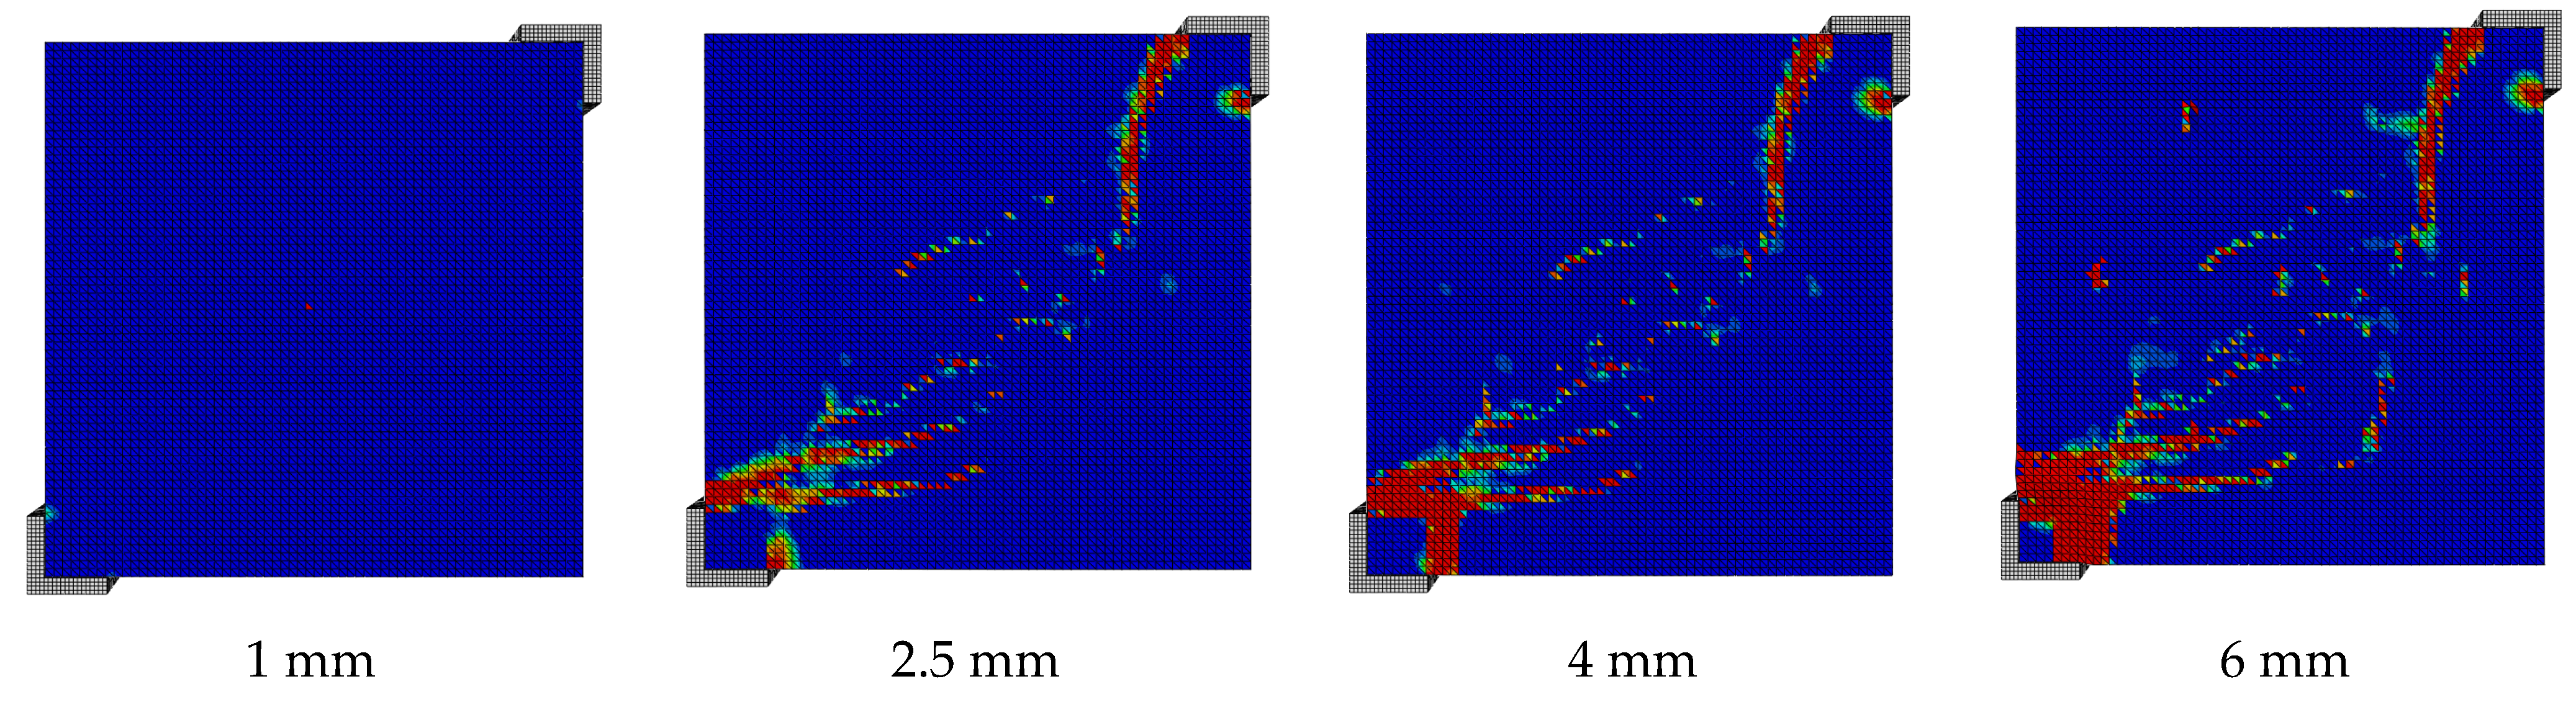
The preliminary experimental test results were used to calibrate and validate the numerical model, which reproduced the geometric and mechanical properties of the tested specimens. The choice of a suitable reference measurement for the comparison between the experimental and numerical curves constituted a crucial aspect of the study. To compare the numerical displacement with the experimental displacement in Figure 3, two nodes along each diagonal were considered as “virtual LVDT’s” and placed in the same position as the experimental ones. From the comparison between the experimental and numerical curves (Figure 8) it is evident that the numerical simulation is able to reproduce the initial stiffness, the peak load, and the value of the displacement at the peak, while it overestimates the post-peak ductility. Figure 9 and Figure 10 show the damage evolution for the different values of the displacement of the tension and compression, respectively. The first tensile damage is detected when the material response leaves the linear range (about 1 mm); at the peak load, several cracks are evident along the compressed diagonal, while some crushing damage can be highlighted close to the loading shoes. After the peak, with the decrease in the load, both compressive and tensile damage grow. At collapse, the crack pattern spreads across a wide area of the plaster; punching of the anchors is manifested, together with significant crushing damage close to the loading area. The final damage configuration reproduces exactly the damage observed after the experiment, and is reported in Figure 4.
4. Parametric Analyses
The implemented and validated FE models were employed to investigate the effects of different parameters on the non-linear responses of the unreinforced and strengthened walls. Some analyses were performed on the URM specimens, to estimate the influence of the bricks and mortar’s mechanical properties on the overall performance. Several retrofitted configurations were then analyzed considering the use of the reinforced plaster, investigating the effect of the number of connectors, the mechanical properties and thickness of the plaster, and the presence of the steel reinforcement. Additional tests were performed on the reduced specimens to investigate the optimal orientation of the nails. A summary of all the performed simulations is reported in Table 3.
In the following sections, each numerical test is presented, with a discussion of the obtained results.
4.1. Unreinforced Masonry—Effect of the Joint Mortar Strength
The performance of a masonry wall is strongly dependent upon the properties of its constituents. The mortar joints are usually the weakest elements of an assemblage, and their non-linear response is one of the most relevant features of masonry response. Moreover, it is well known that the difference between the elastic properties of the unit and mortar is the main cause of the failure of these structures. For these reasons, different grades of mortar were considered, with different ratios of cement, lime, and sand, to investigate the effect of the mortar’s strength on the overall behavior of the masonry walls. The mechanical properties of the mortars (Table 4) were selected as in [41], where an experimental characterization of mortar cubes is presented.
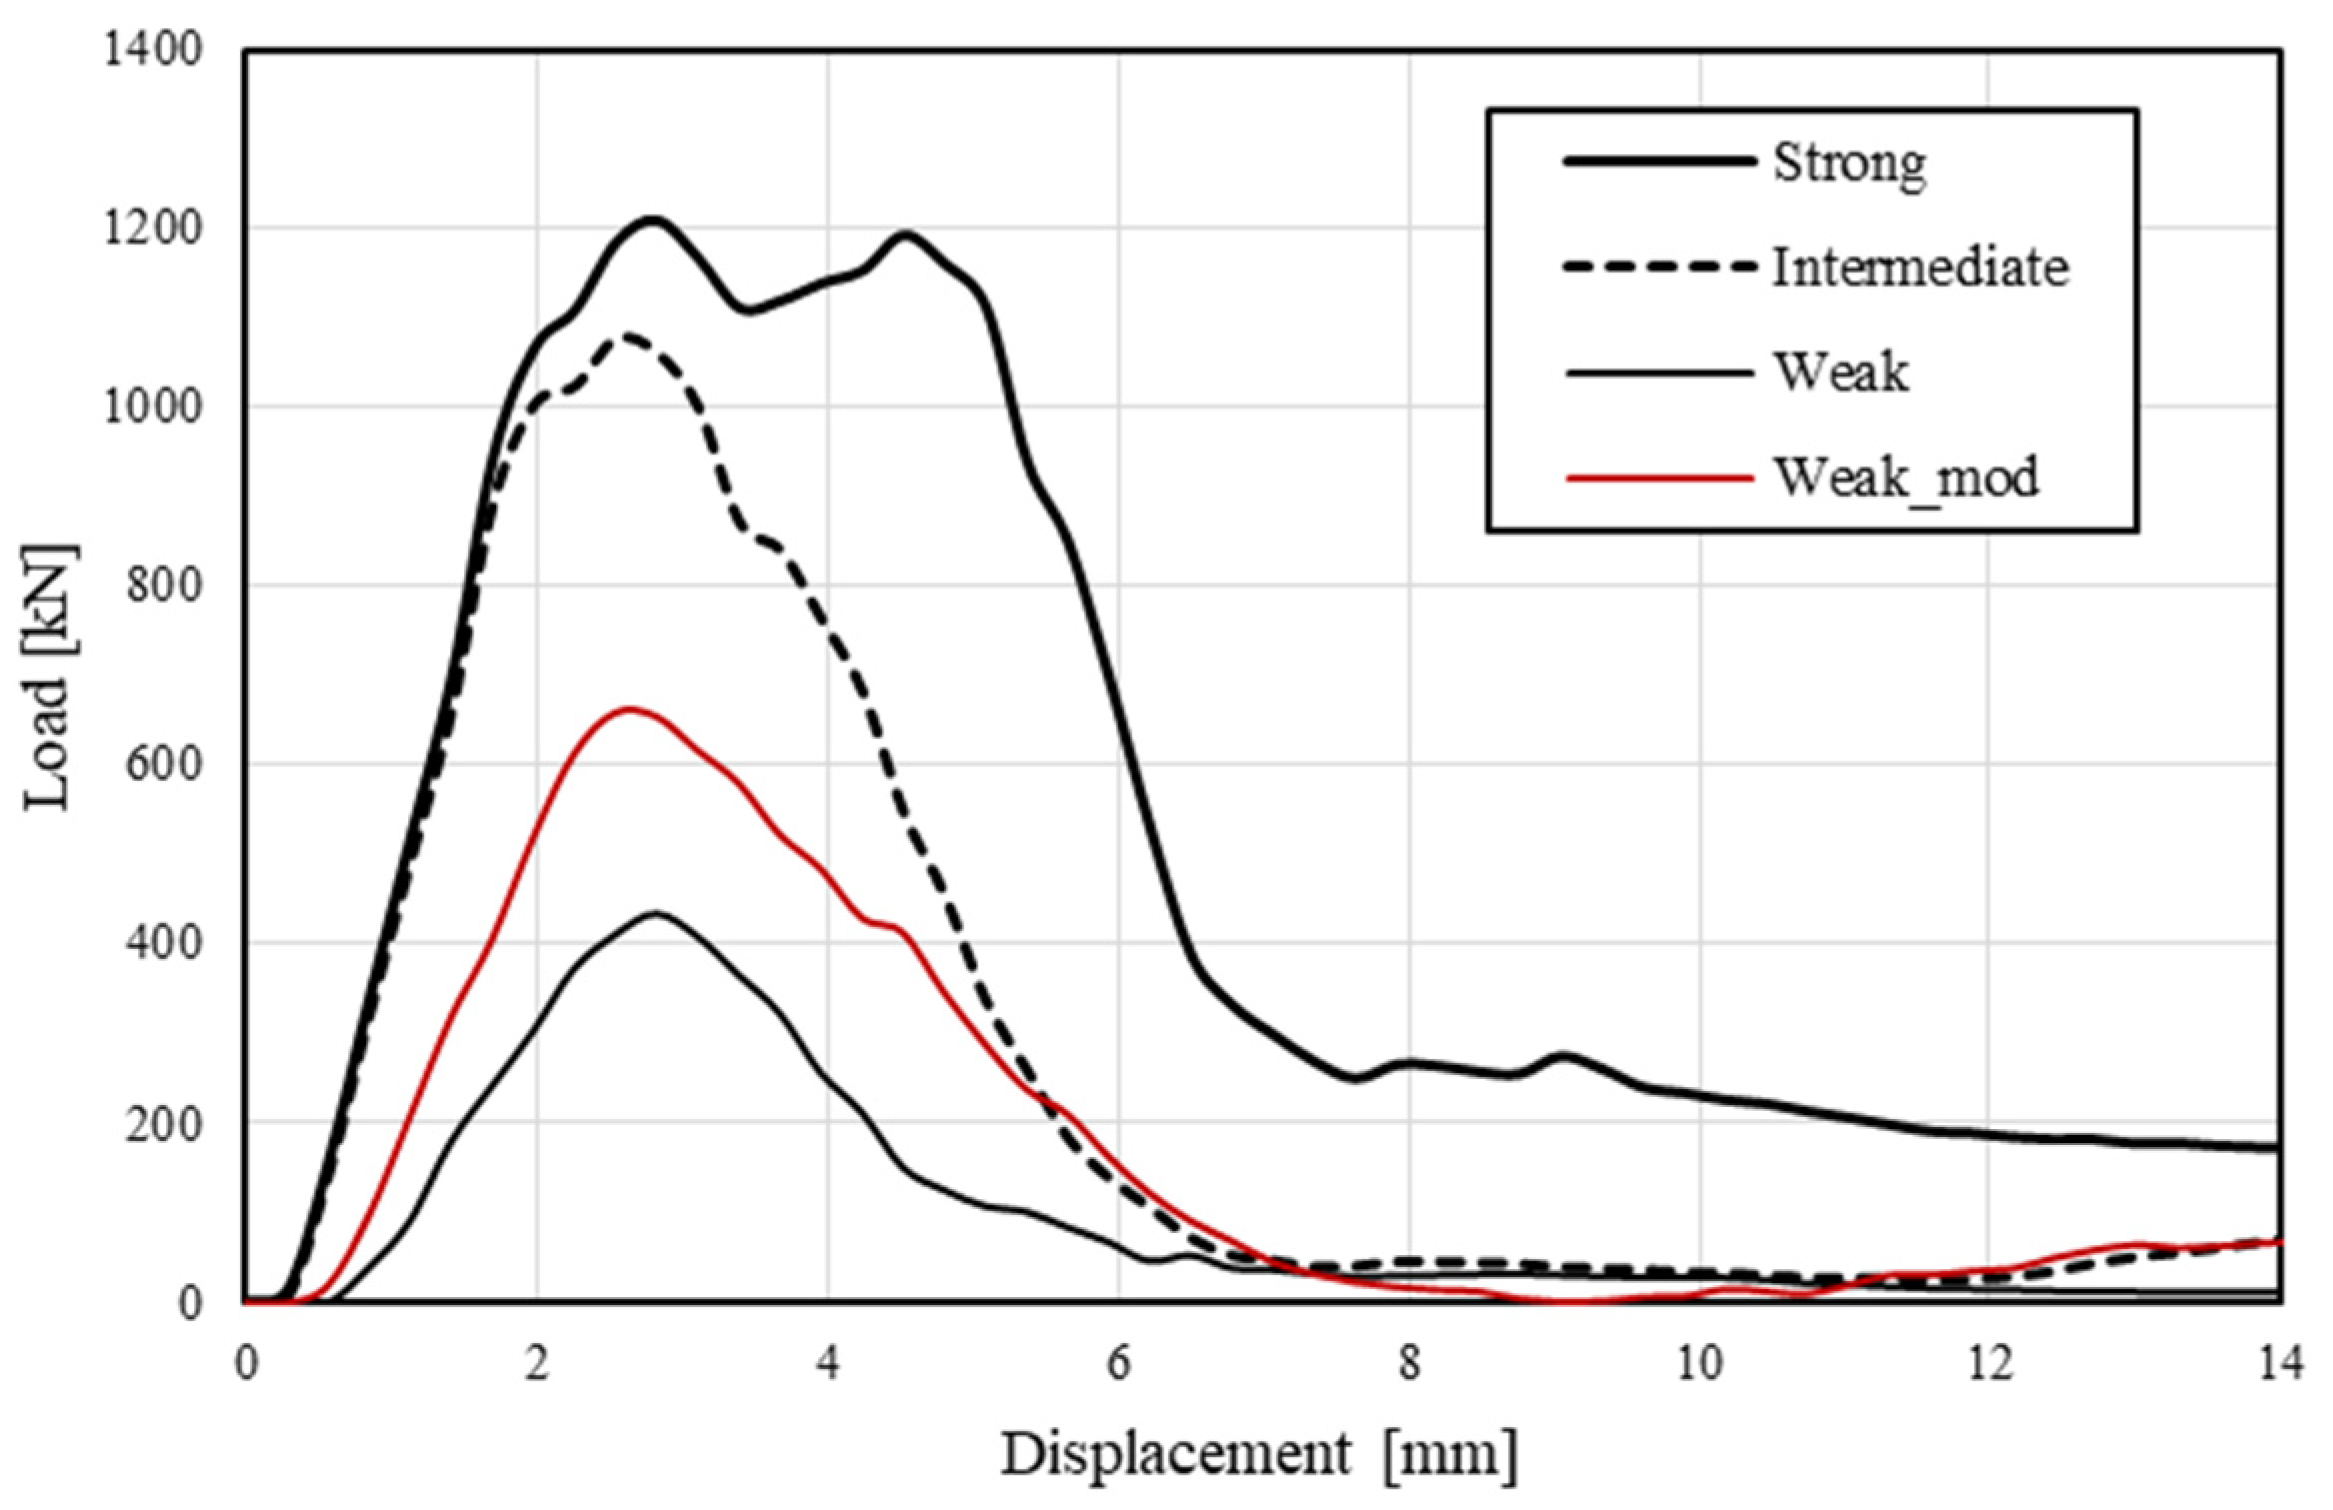
Figure 11 shows the results in terms of load vs. displacement curves, while Figure 12 shows the damage pattern at failure for the different configurations. For lower values of mortar strength, the peak load was lower and the damage that developed in the mortar joints, was spread over a wider area. For the strong mortars, a main crack developed along the compressed diagonal, involving both the joints and the bricks, with additional smaller cracks around the main crack. Moreover, more ductile behavior was detected at the peak load.
From the results, it was confirmed that, when the mechanical properties of the mortar are close to those of the brick, the peak stress is reduced, the overall response of the wall is more homogeneous, the masonry components are fully exploited, both in terms of resistance and stiffness, and more ductile behavior is achieved.
4.2. Unreinforced Masonry—Effect of Weak Bricks
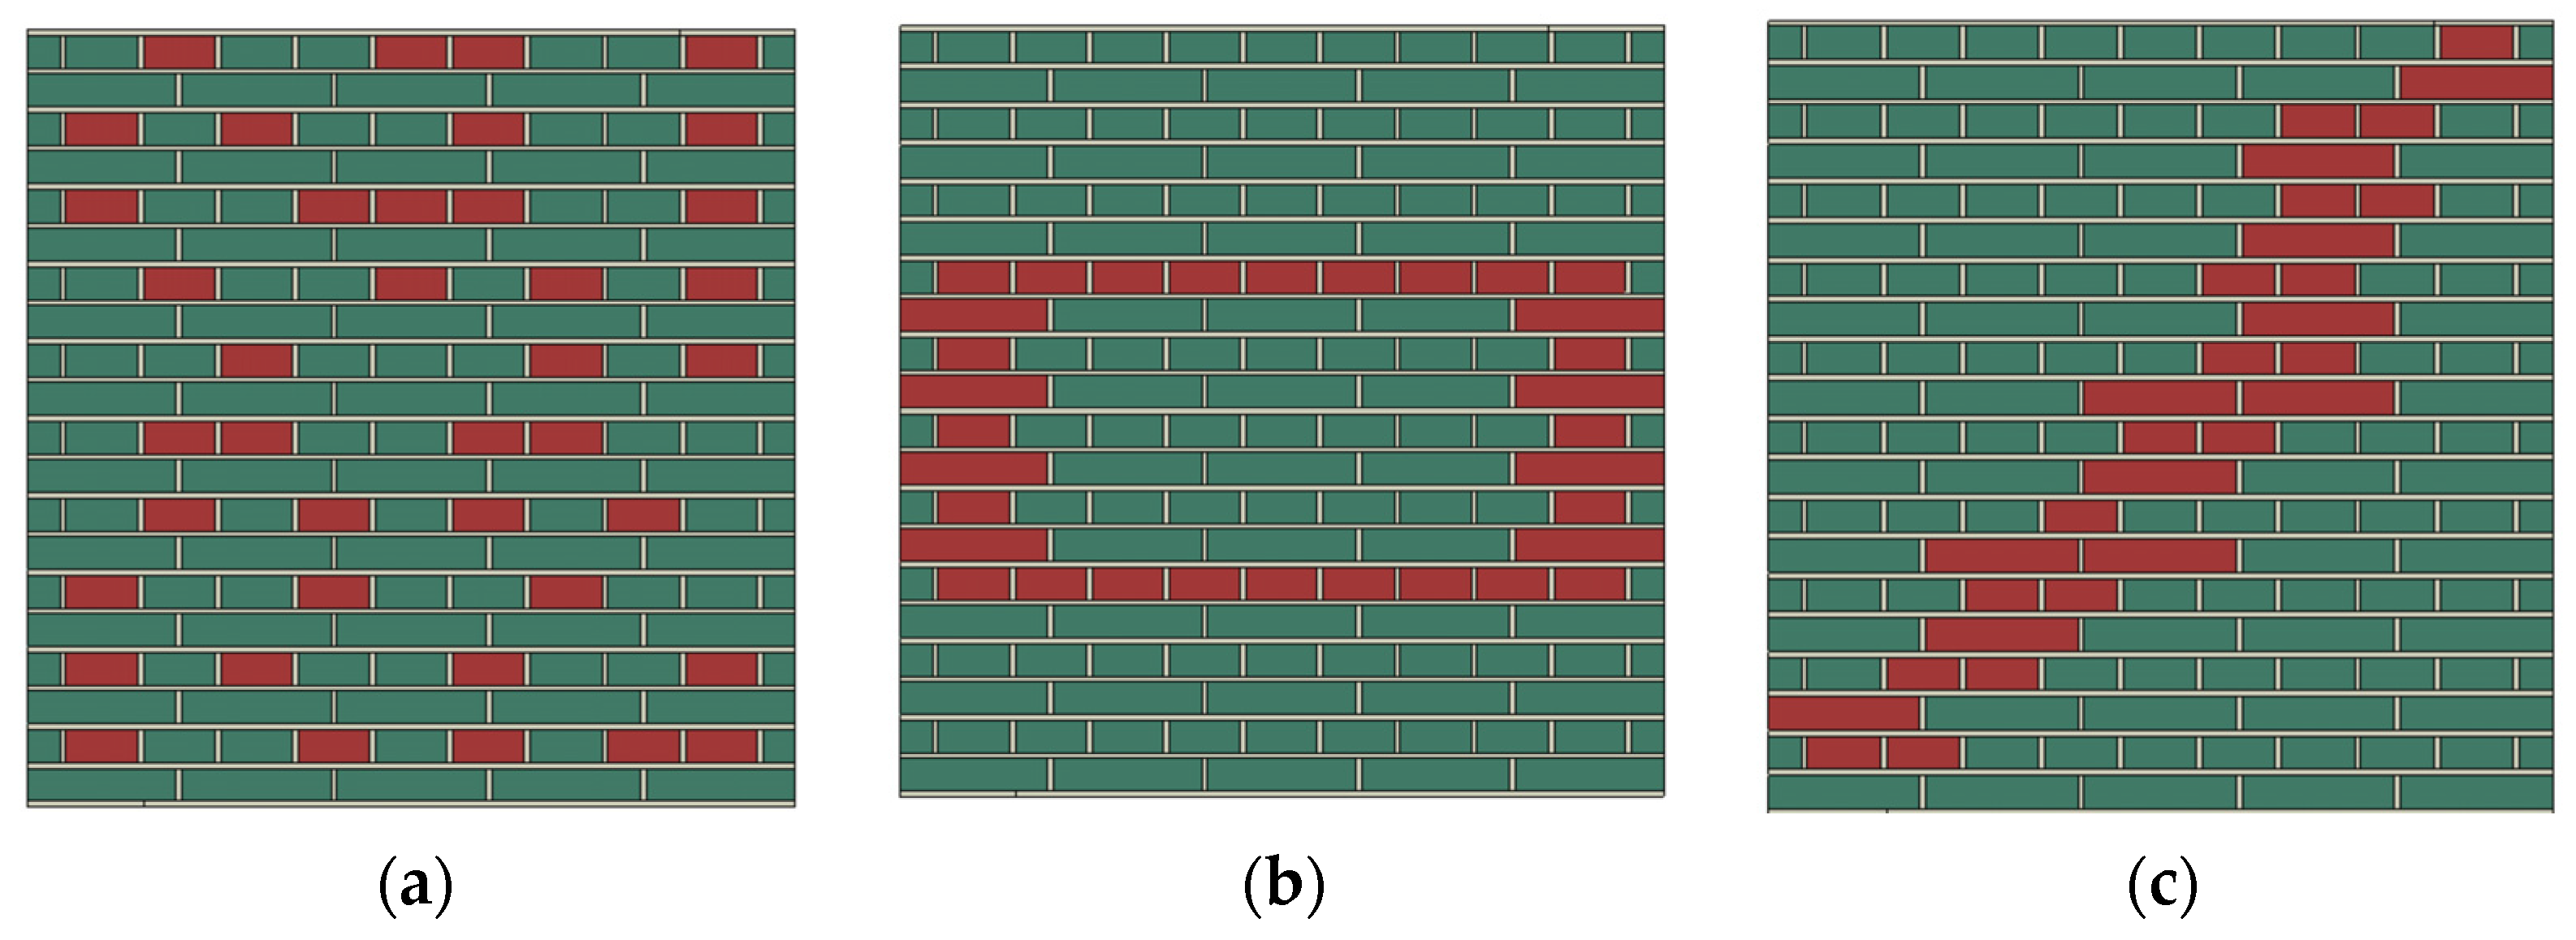
The quality of the brick in a masonry wall may have a significant effect on its overall response. Several factors influence brick quality: workmanship, the presence of inner cracks due to transportation to the job site, nonuniform heat distribution in the oven during the drying time, damage recorded after seismic events, etc. This section analyzes the effect of the distribution of some of the weak bricks on the overall wall structural response. Three different weak-brick patterns were defined (Figure 13), representing a wall with a random distribution of weak bricks (R1), a wall in which an opening has been closed so that the edges of the former window represent lines of structural weakness (R2), and a wall that shows damage along the diagonal because of an earthquake (R3). The number of weak bricks is constant in the different configurations. The assumed elastic properties of the weak bricks were an elastic modulus E = 500 MPa and a Poisson ratio ν = 0.17. The obtained results were compared, and then compared to those of the configuration with no weak bricks (i.e., reference configuration).
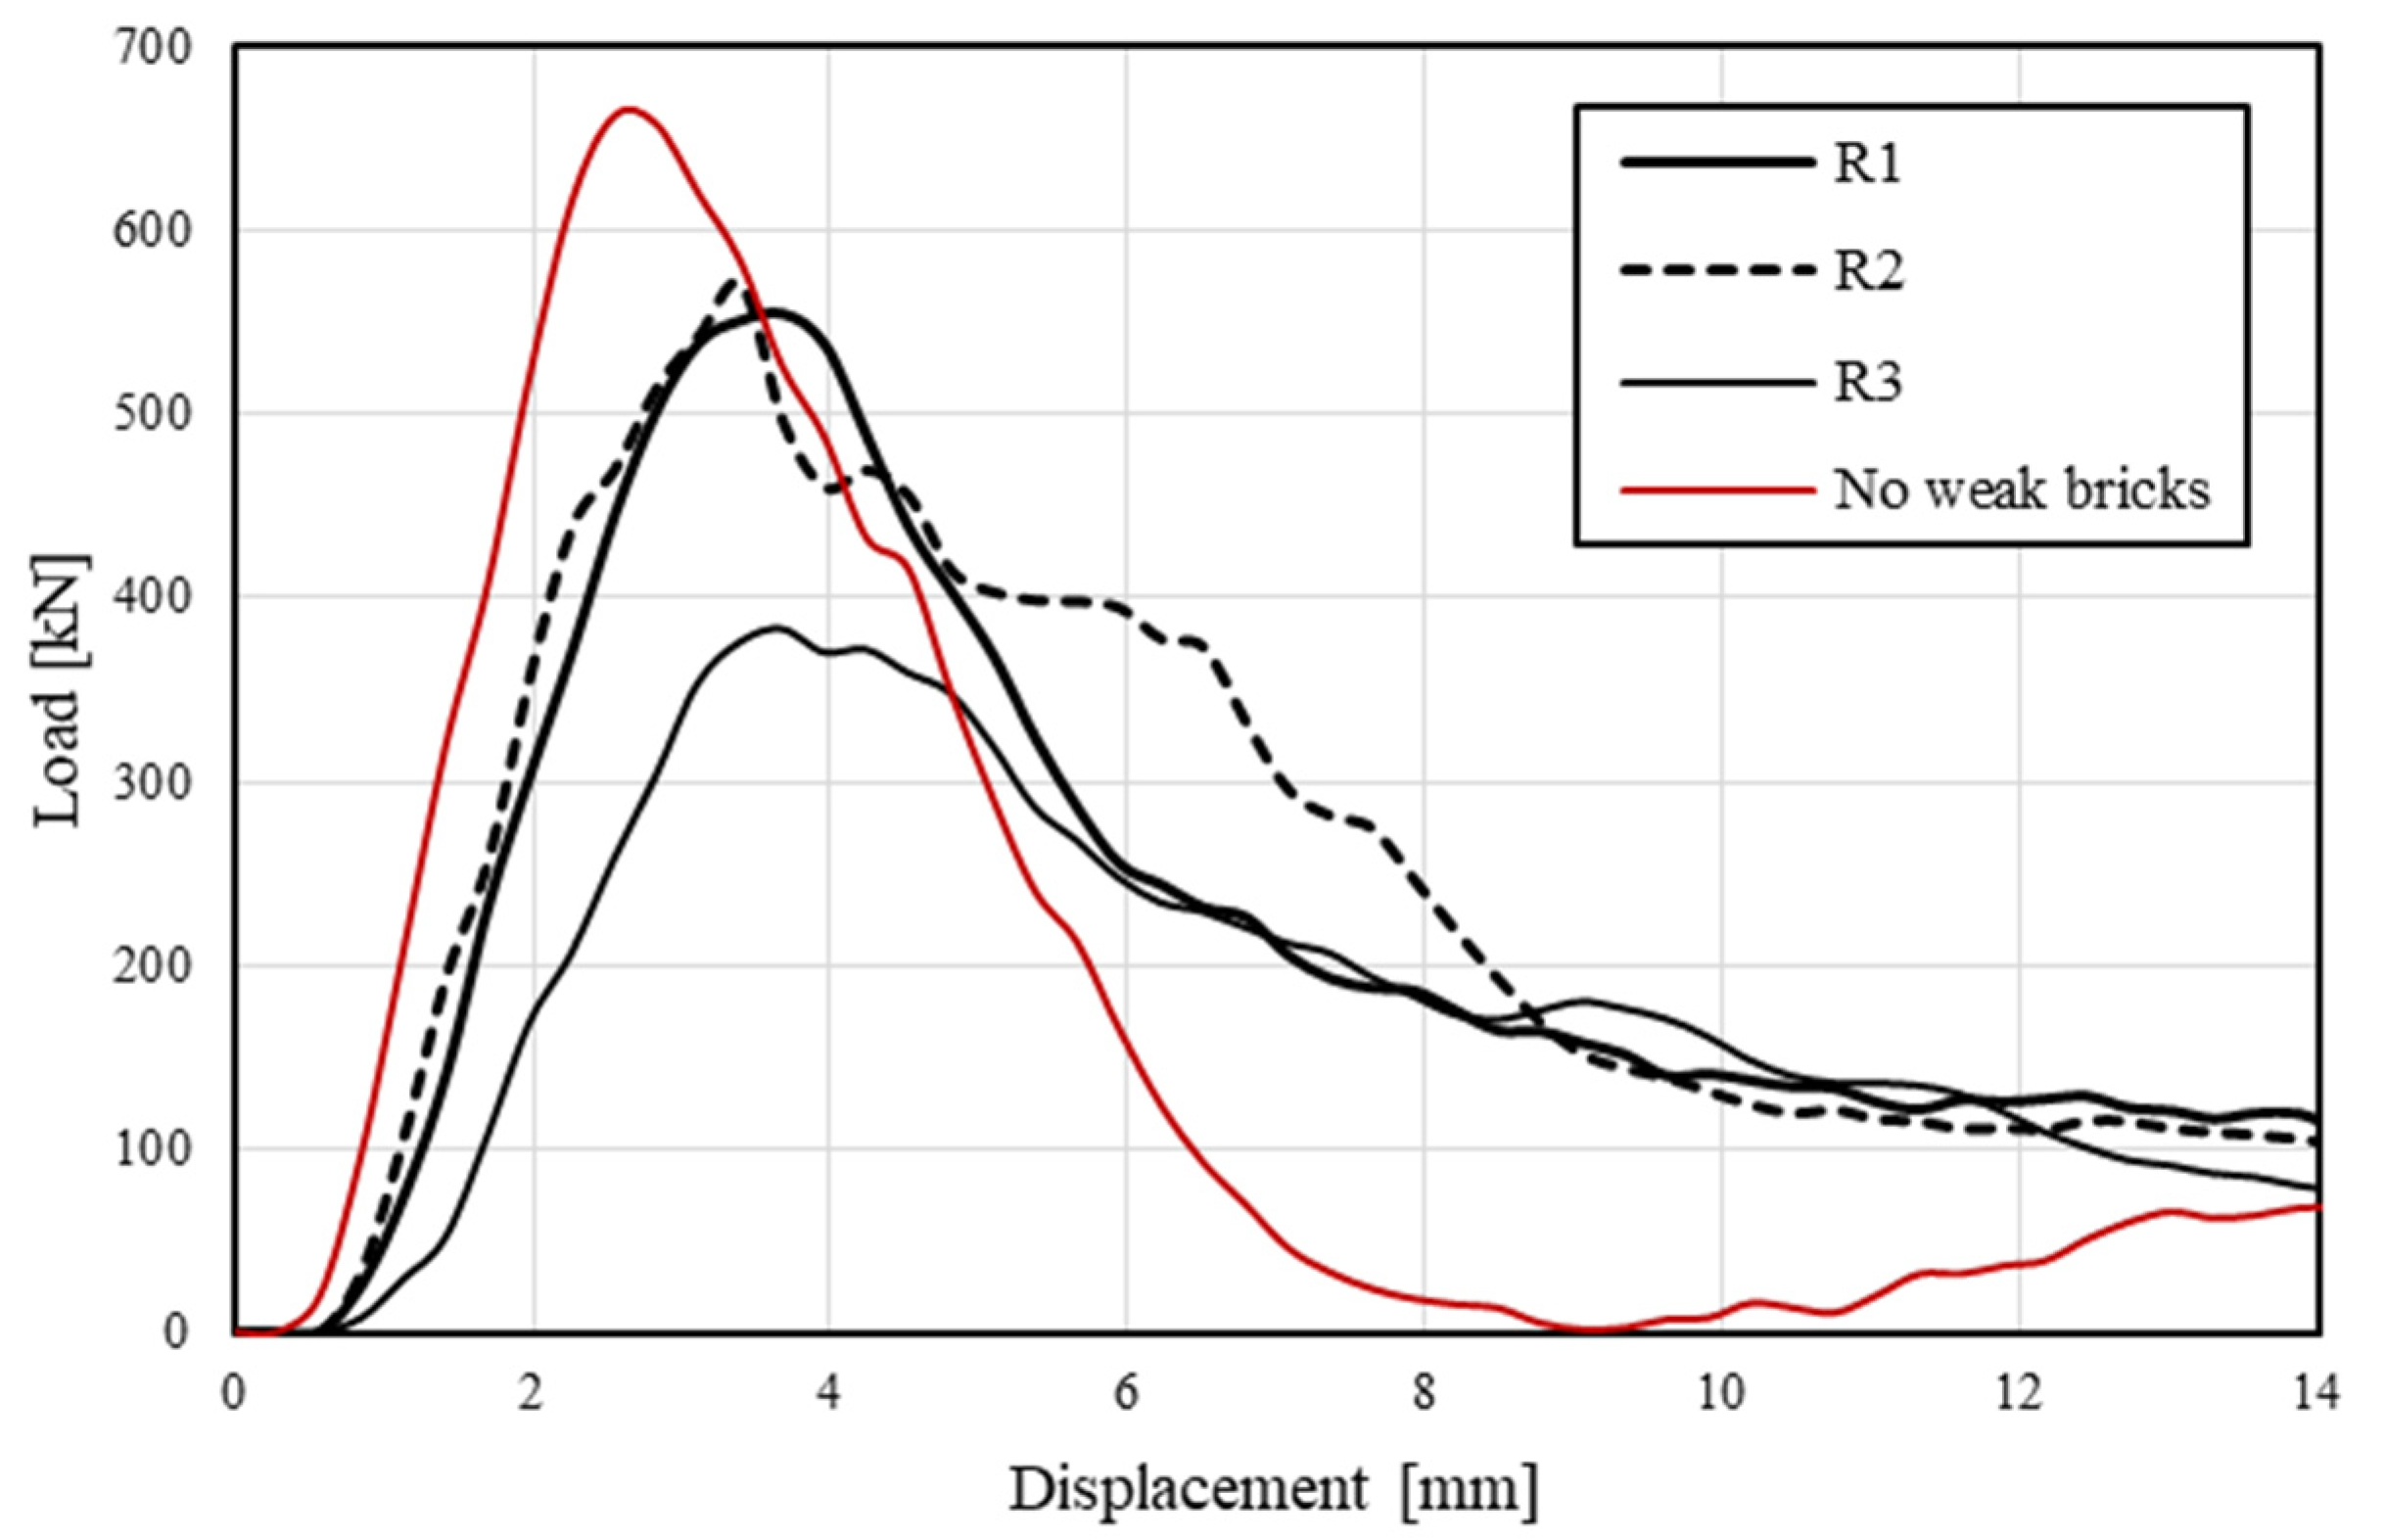
Figure 14 shows the load vs. displacement curves for the different configurations. It is evident that the presence of weak bricks determines a lower peak load and more ductile behavior of the specimen with respect to the reference configuration, but it is interesting to highlight how different distributions of the same number of weak bricks can determine different overall responses. In particular, when the weak bricks are located along the diagonal (i.e., case R3), a significant reduction in terms of the peak load and stiffness is evident with respect to cases R1 and R2. This result confirms the importance of considering the presence of weaknesses (e.g., pre-existing damage) in the modeling of existing masonry structures because they can significantly affect the overall structural response.
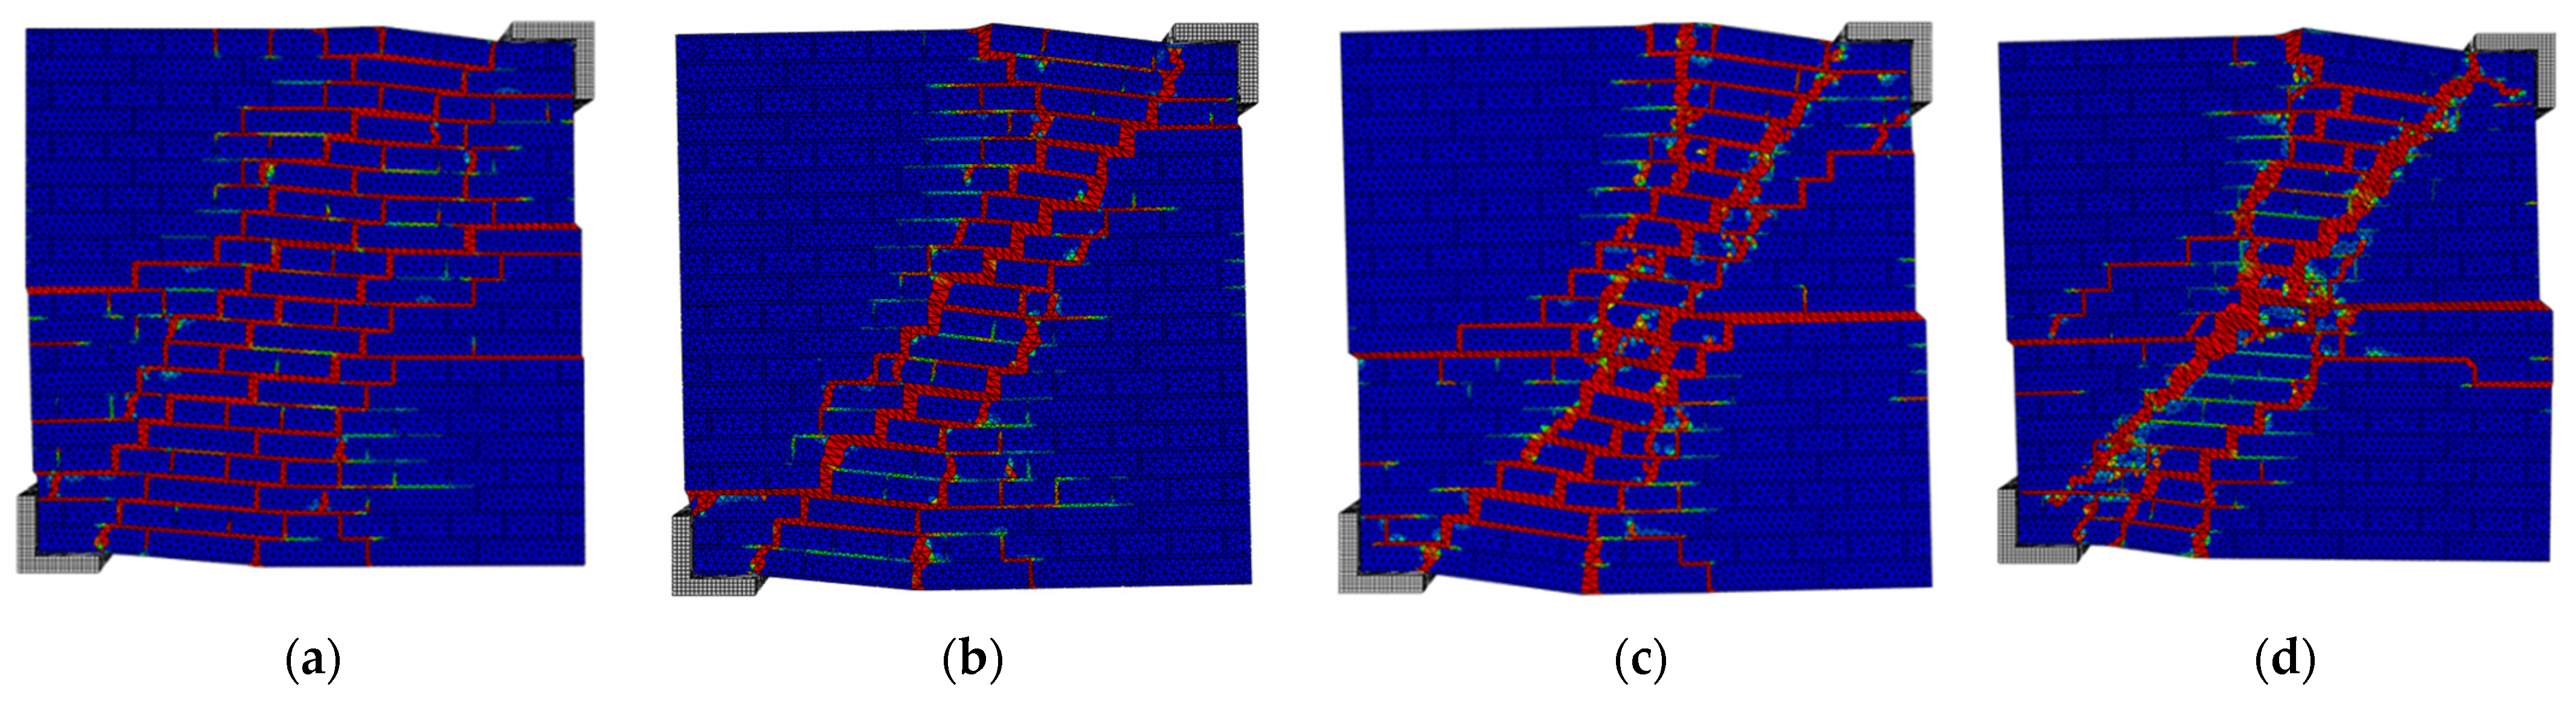
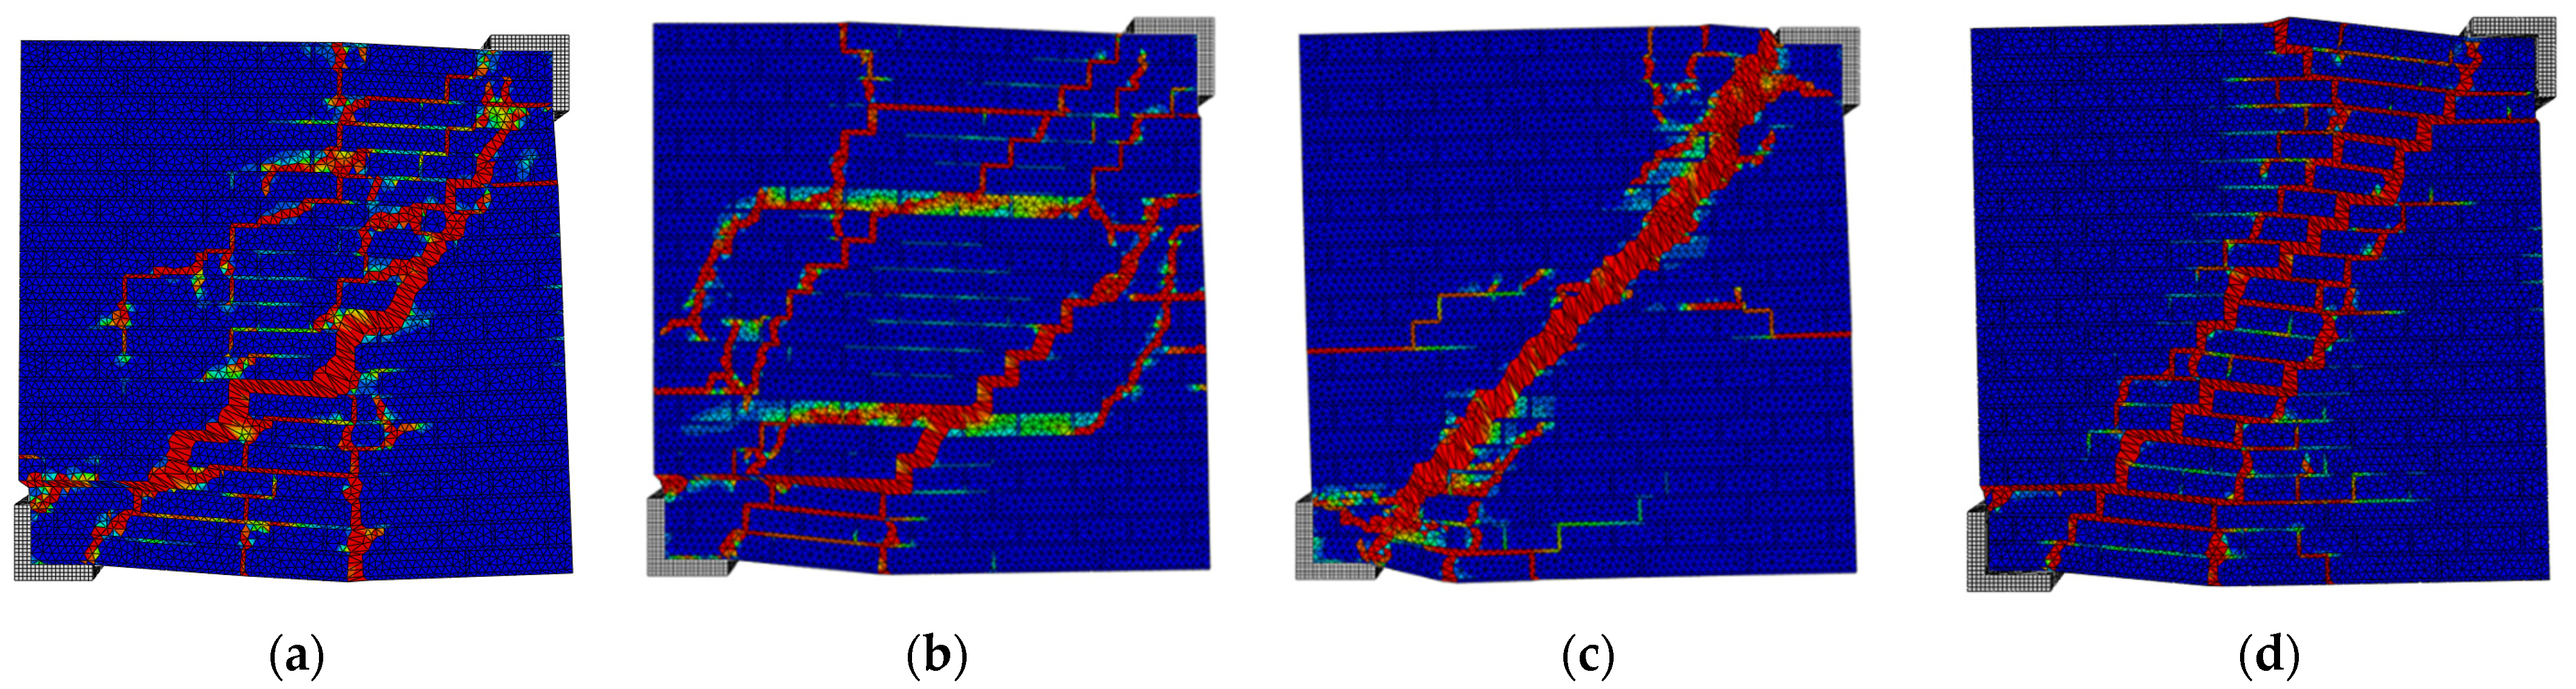
Figure 15 shows the damage distribution for the different configurations at failure. The cracks followed the mortar joints and the bricks were broken only rarely. In the R1 pattern (a), the damage was widespread in a larger area around the compressed diagonal and, even though a main diagonal crack was detected, several minor cracks involved both the mortar joint and the weak bricks. The R2 case (b) showed several diagonal cracks, which were mainly driven by the location of the weak bricks. In the case of R3 (c), the damage was entirely localized on the compressed diagonal, and only a few other cracks were detected in the mortar joints outside the damaged diagonal. The reference configuration without weak bricks (d) mainly shows stair-stepped cracks along the compressed diagonal.
Overall, it is evident that, for all the cases, the damage distribution was strongly influenced by the presence of weak elements, since the load always chose the path that minimized its internal work. When the damage (i.e., weak breaks) was distributed in a larger area, the wall response was more homogenous and the stress peaks, where the cracks usually initiated, reduced.
4.3. Retrofitted Masonry—Optimal Orientation for the Anchors
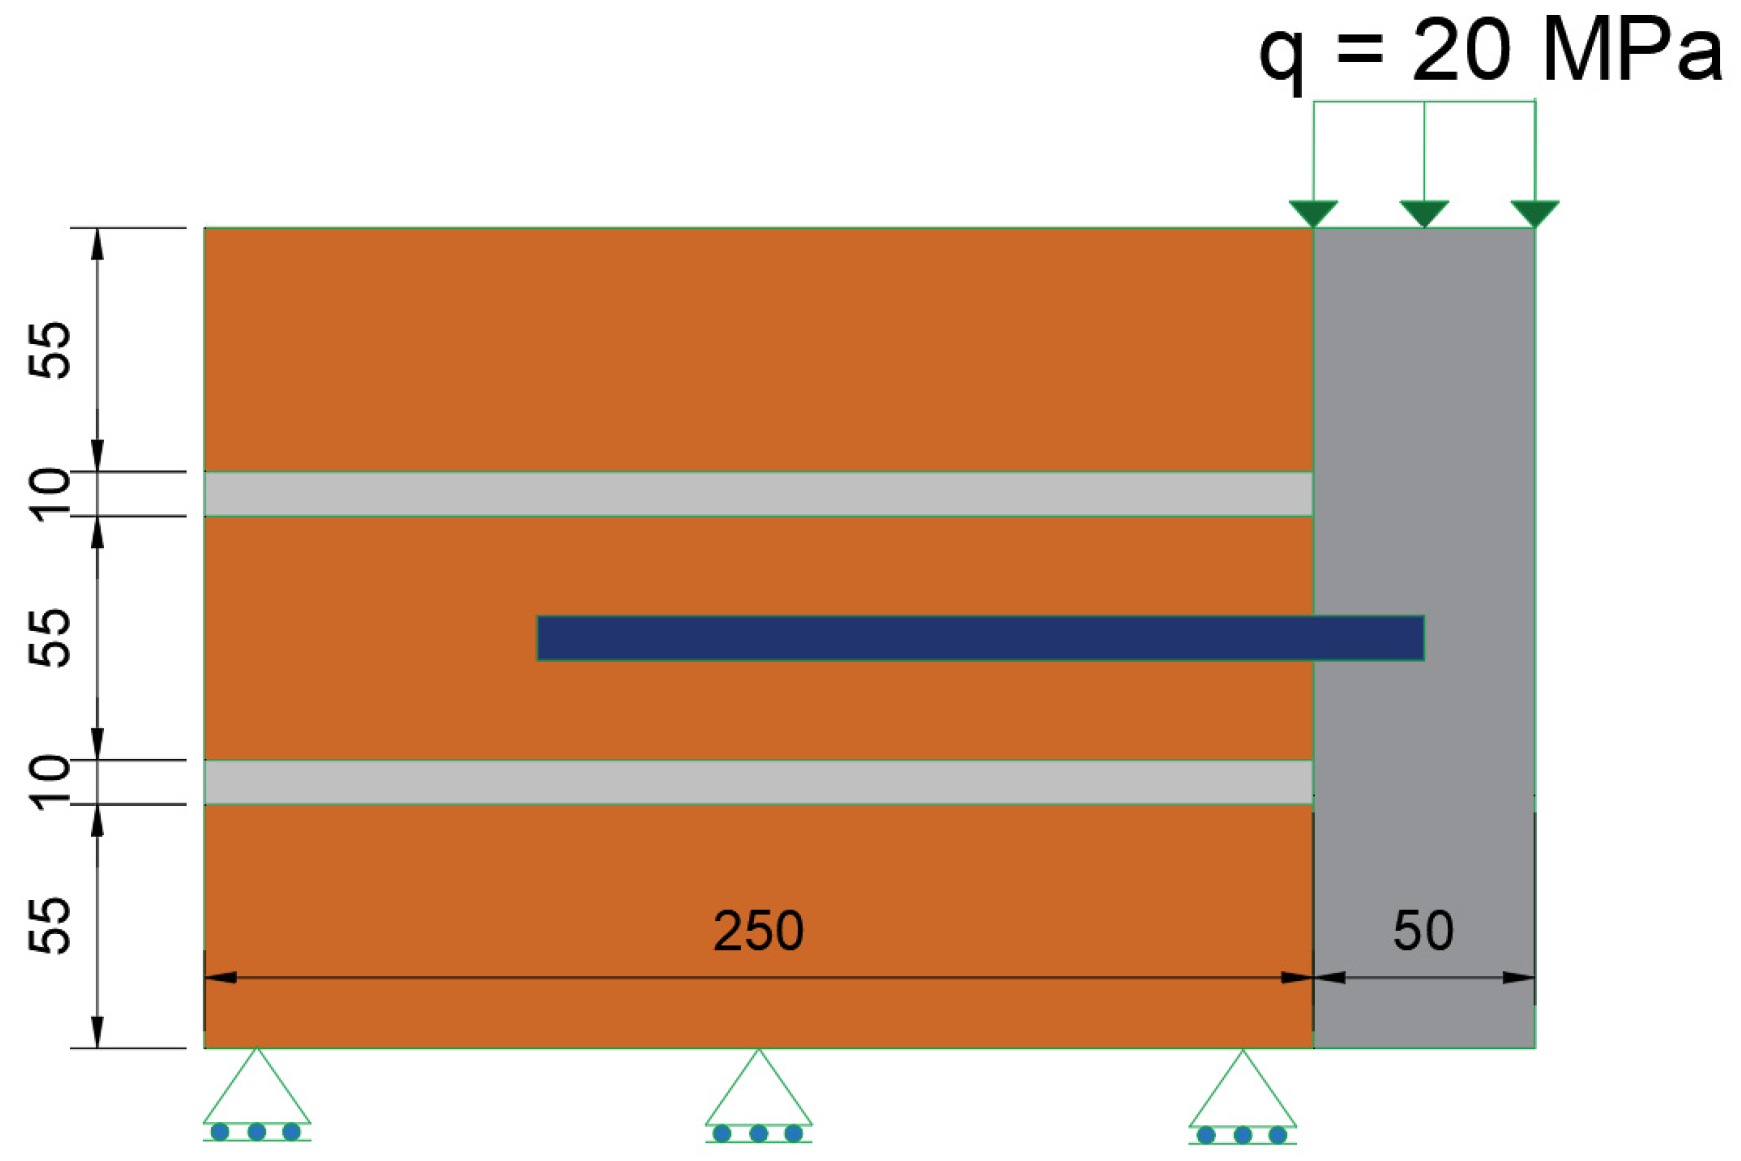
The function of anchors in the reinforced plaster technique is fundamental to guarantee the transfer of in-plane forces from the masonry to the plaster [42]. Good collaboration between the two materials depends on the stiffness of the anchors, which is influenced by the anchors’ orientation. To investigate the effect of the orientation of the anchors, several models were implemented, varying the angle with respect to the horizontal from 0° to 45°. The simulations were conducted using a reduced volume of masonry, made by three bricks, 10-mm mortar joints, and 50-mm plaster (Figure 16).
The length of the anchor was 200 mm (25 mm inside the plaster), while its diameter was 10 mm. The mechanical properties of the materials are defined in Table 2. The size of the mesh was 5 mm, except for the nail, where 2.5 mm mesh was used. The anchors were introduced as embedded elements in both the masonry and the plaster. The interaction between the plaster and the wall surface was defined as normal hard contact and tangential behavior, with a friction coefficient of μ = 0.1. The load was applied uniformly on the top face of the concrete plaster; the out-of-plane displacements of the plaster and the vertical and horizontal displacements of the bottom face of the brick were precluded.
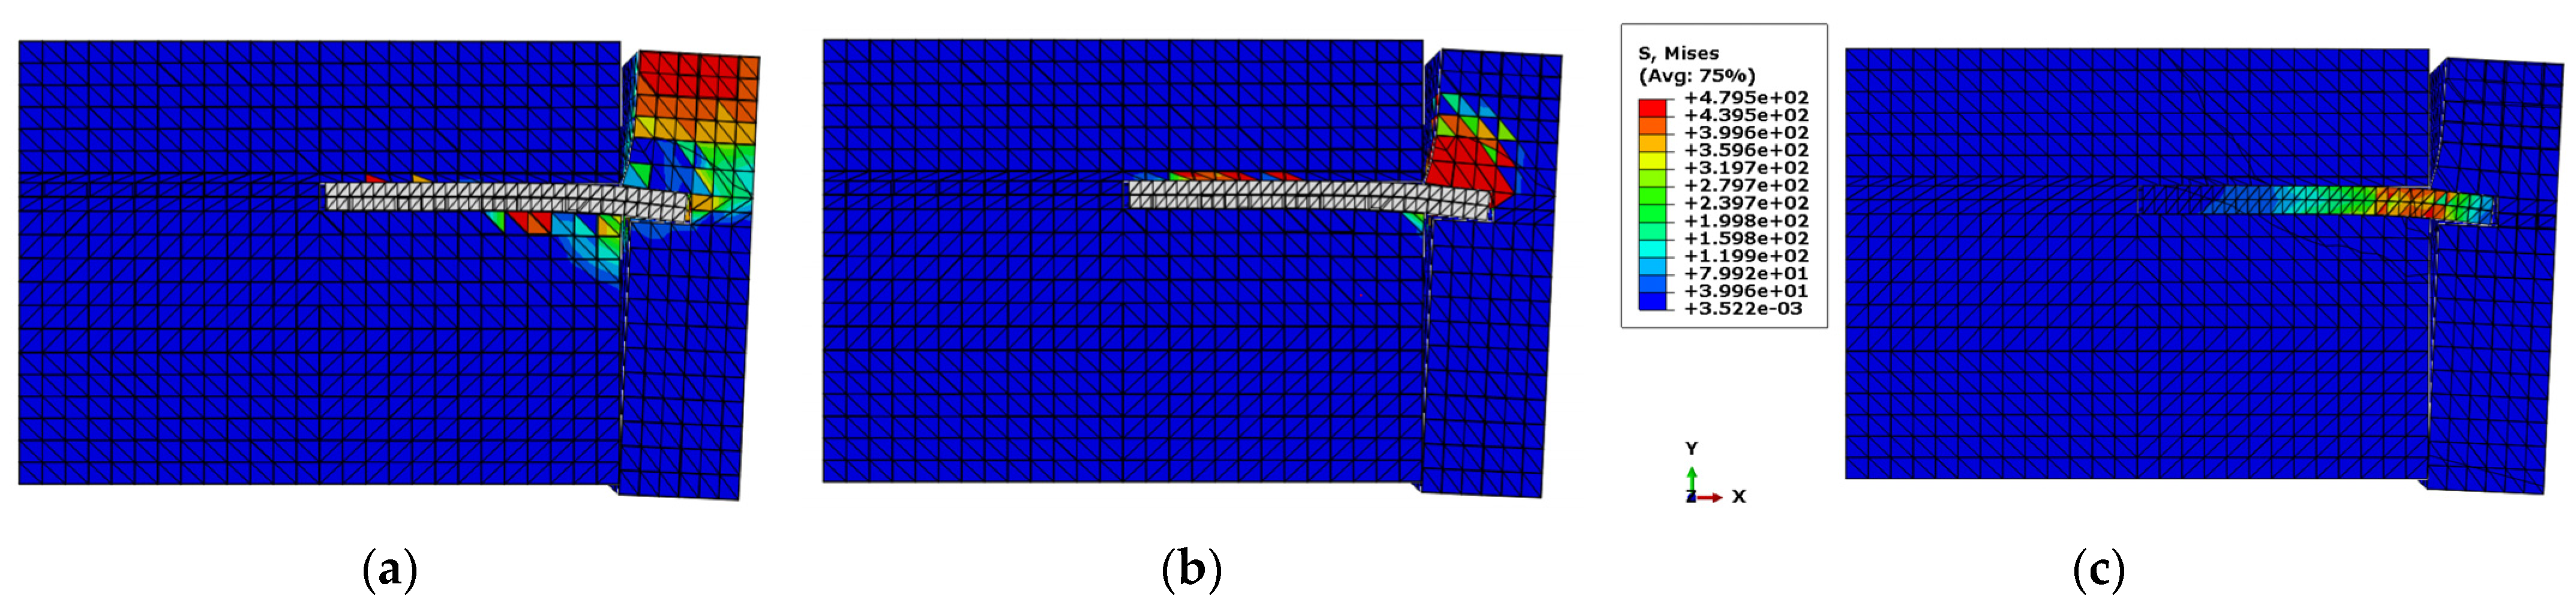
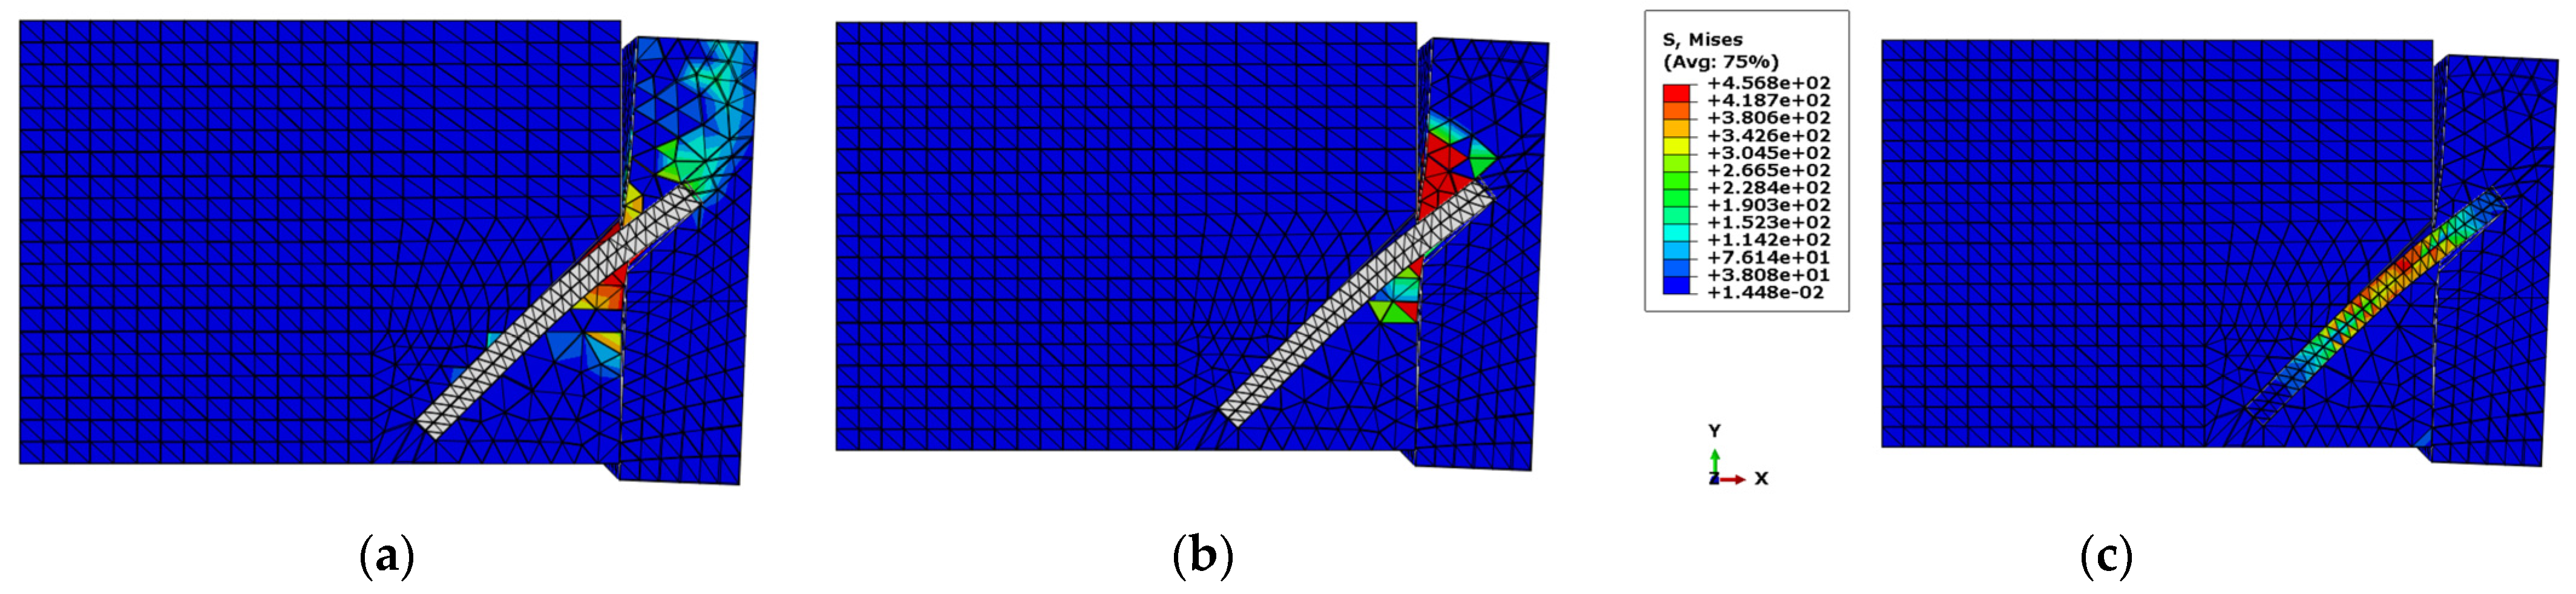
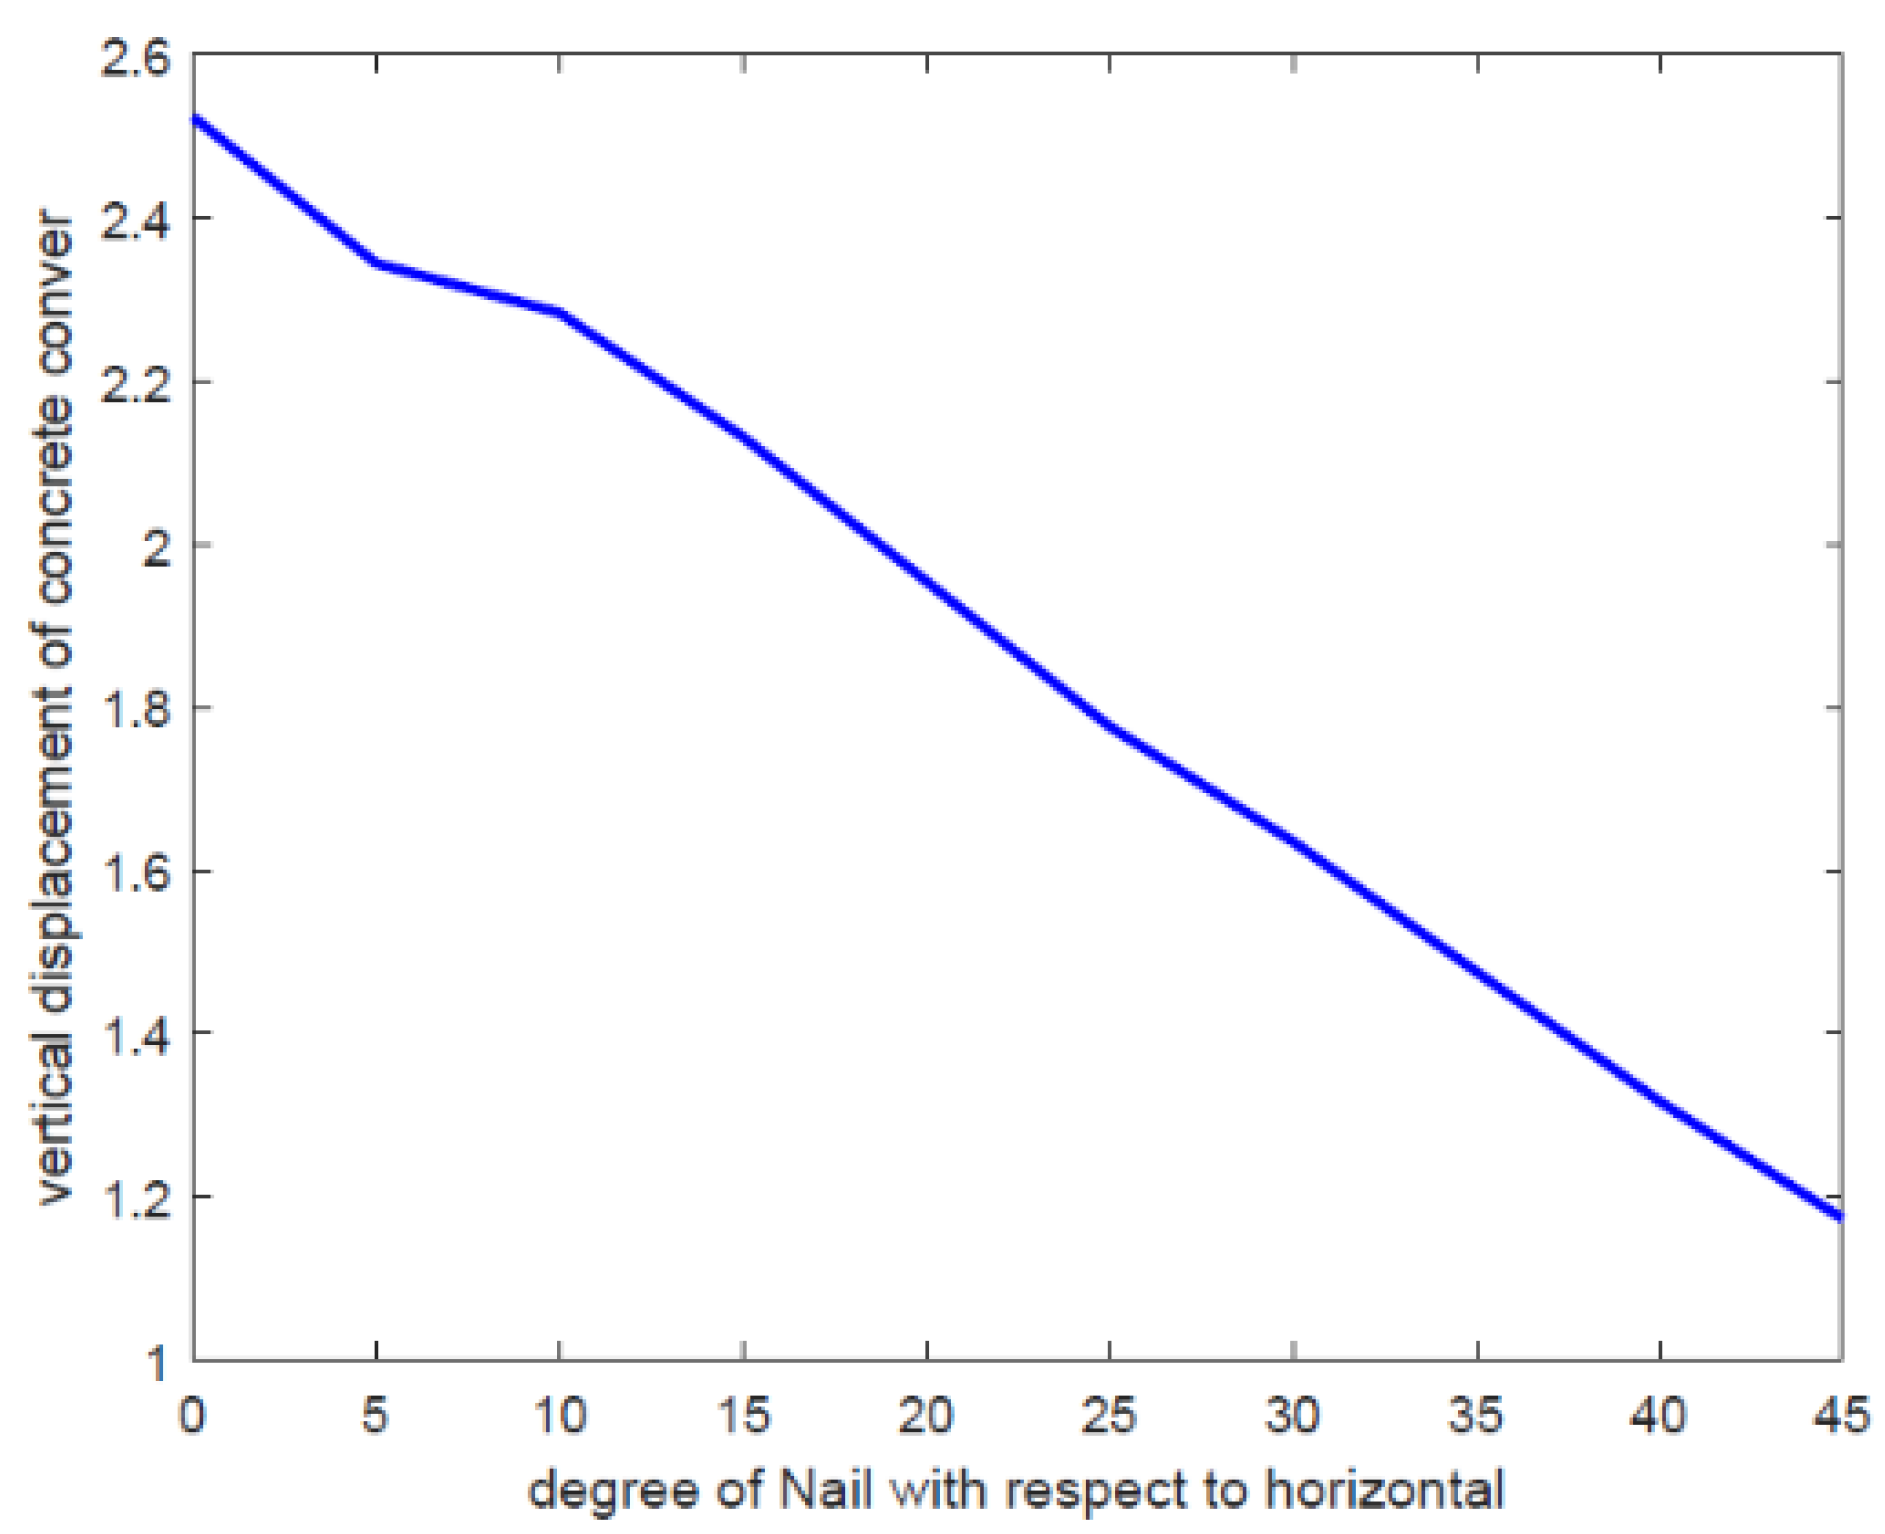
Figure 17 and Figure 18 show the anchor deformation inside the masonry, the damage of the tension and compression, and the maximum stresses in the anchor for 45° and 0°, respectively. In both configurations, the maximum stress occurred at the interface between the reinforced plaster and masonry prism, but in the 45° configuration, the stress values were lower. It is also evident that the damage, especially that of the tension, involved a larger area in the 0° configuration. Figure 19 shows how the anchor orientation influenced the vertical plaster displacement: by increasing the nail angle, the vertical displacement of the concrete cover decreased. This phenomenon may have two possible explanations: first, the shear area of the rotated nail was higher with respect to the horizontal one, and, second, as the orientation of the nail increased, the axial stiffness of the nail would collaborate to increase the stiffness of the anchor; in other words, the virtual work performed by the compressive force acting on the anchor reduced the final displacement, which led to a reduction in the reinforced plaster displacement. Nevertheless, by considering the drilling procedure to install the nails inside the masonry wall, zero degrees remains the better solution to guarantee proper installation.
4.4. Retrofitted Masonry—Number of Connectors
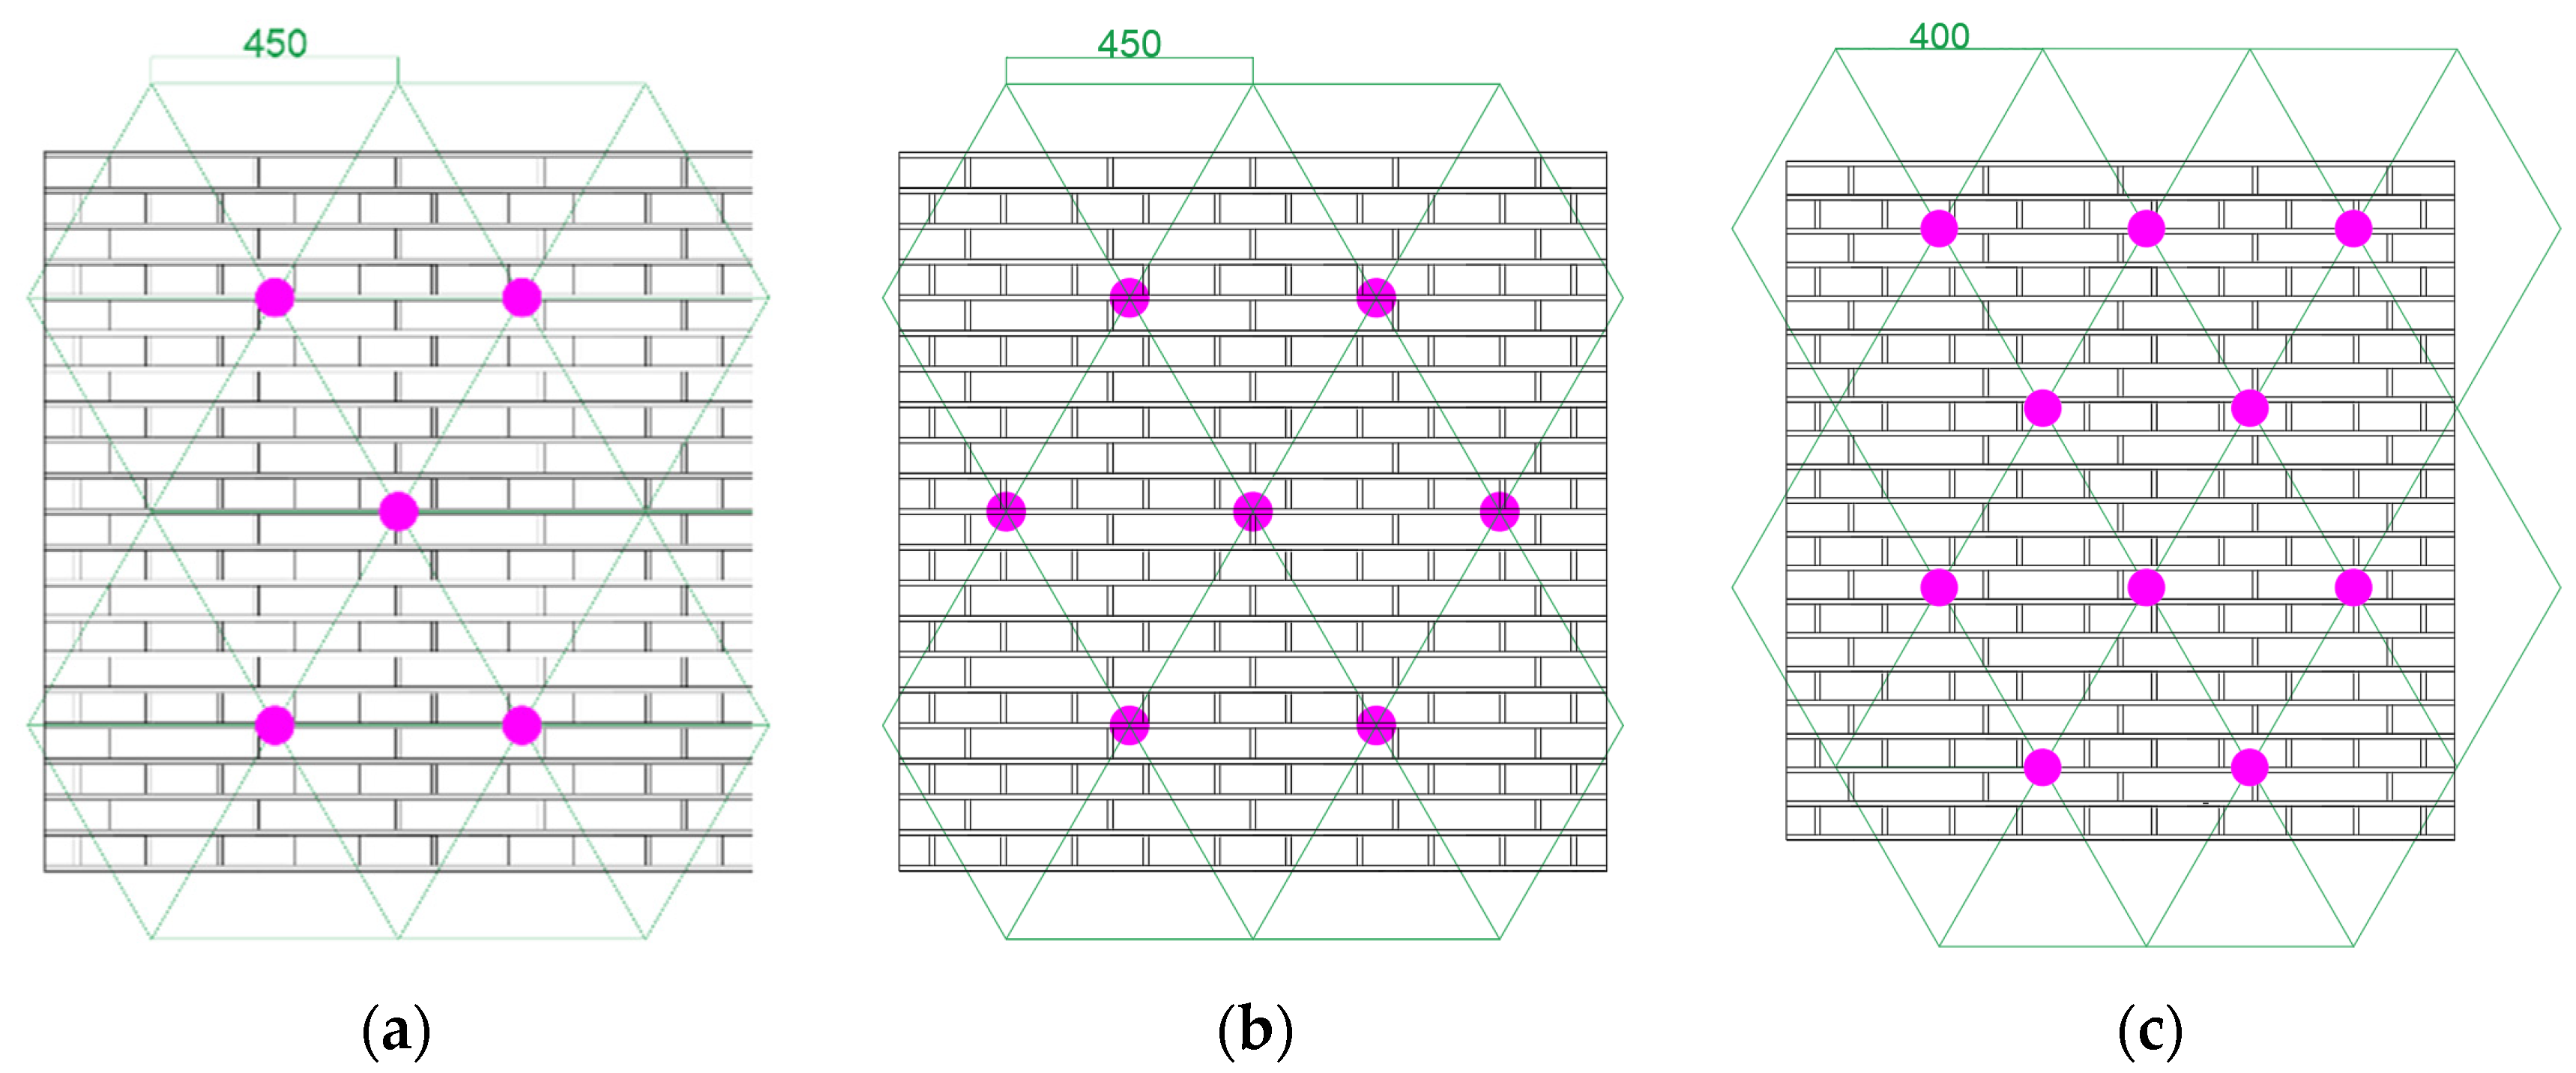
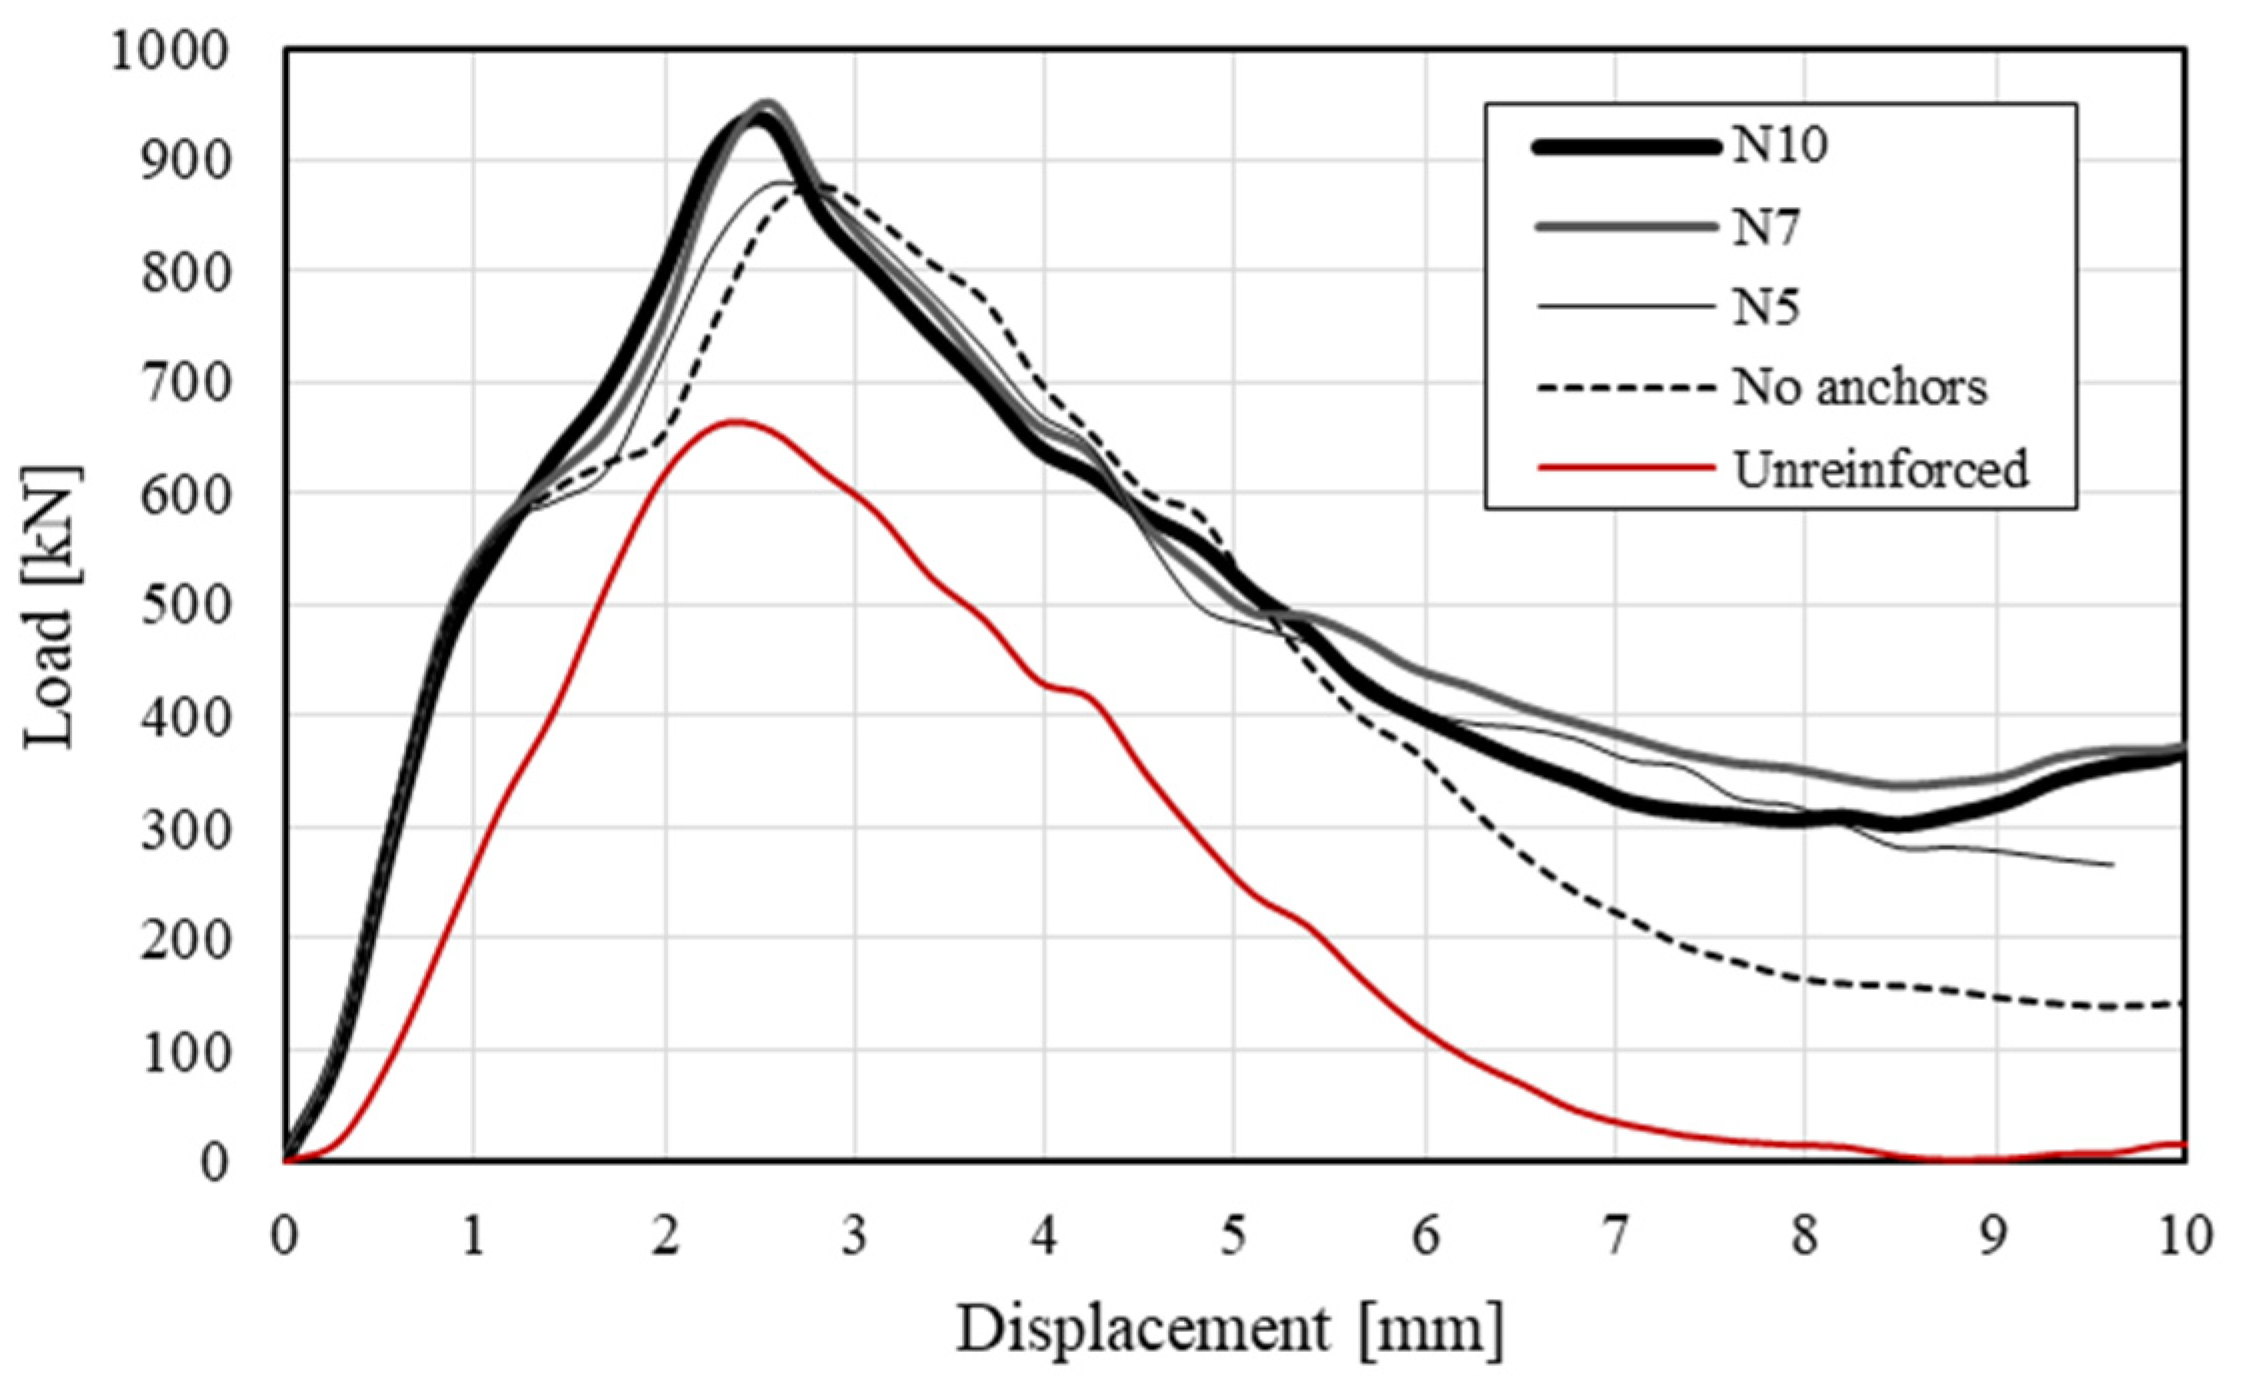
Of the parameters that influence the structural performance of a wall retrofitted with reinforced plaster, the number of connectors is investigated in this section. Four models were implemented with five, seven, ten (Figure 20), and no anchors, respectively. The anchors’ positions were defined according to the Italian technical code [14], which suggests using a quincunx pattern with an equilateral triangle. The nail diameter was 10 mm, while its length was 200 mm. The nail was placed horizontally (i.e., 0°). Nonlinear analyses were performed on specimens with 30-mm plaster thickness. The mechanical and interaction properties, loading conditions, and mesh size were those defined in Section 2 and Section 3.
Figure 21 shows the load vs. displacement curves for the different anchor configurations. The higher stiffness in the first branch of the curve was detected in all the reinforced specimens compared to the unreinforced one, and this stiffness was the same regardless of the considered number of anchors. No significant variation in the peak load was detected by increasing the number of anchors from zero to five and from seven to ten, whereas from five to seven, there was an increase of about 10%.
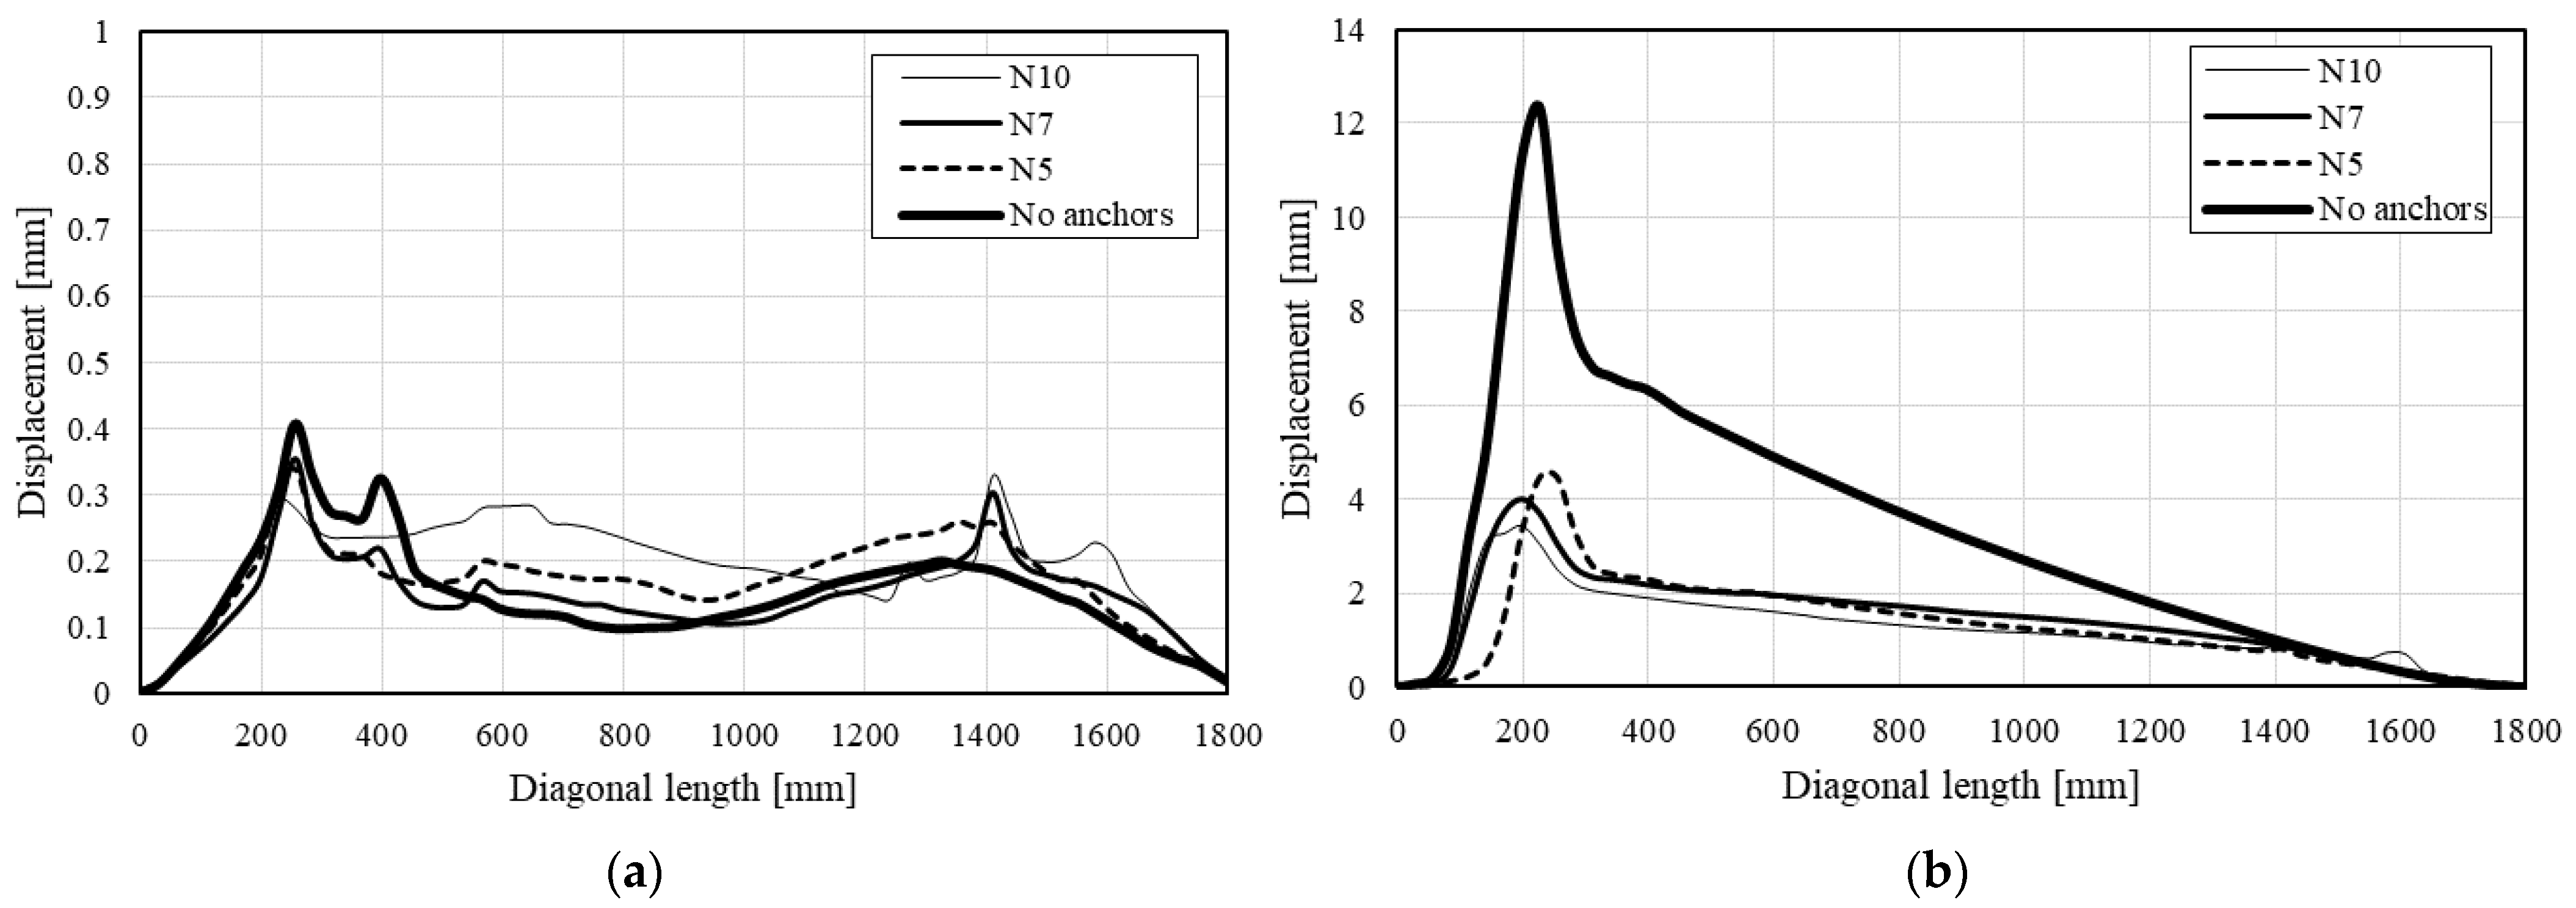
Figure 22 shows the out-of-plane displacement along the compressed diagonal for the different anchor configurations at the peak load (a) and at failure (b). The peaks in the different curves represent the crack openings. It is evident that, at the maximum load, the anchors were not activated, and the out-of-plane displacements were similar in the different configurations (less than 0.5 mm). After the peak, the displacements started to increase significantly. At collapse, the anchors showed their retaining effect, with higher out-of-plane displacement in the configuration without anchors and lower in the configuration with 10 anchors.
Even if the increase in the number of connectors does not significantly affect the collapse load, their role is fundamental to inhibit instability by the number of limiting out-of-plane displacements. Moreover, the numerical results show that the anchors can guarantee a certain resistance (abut 40% of the peak load) even close to the failure point due to the activation of a different resistant mechanism, which involves the connectors.
4.5. Retrofitted Masonry—Plaster Reiforcement
The relative contribution of reinforced plaster to the overall load-bearing capacity of masonry can be significant, especially for thin masonry walls of poor quality. The reinforcement of the plaster plays a significant role in improving the tensile strength and the ductility of a specimen. The conventional approach considers the use of steel nets as reinforcements, but, in the recent past, several alternatives have been proposed, using innovative materials as polymers, carbon or glass fibers, and fiber meshes [43,44]. A different concept of overlay strengthening systems involves fiber-reinforced concrete plaster [45,46], which avoids the use of reinforcement nets and has the advantage of developing diffuse crack patterns with reduced crack width.
A numerical comparison was performed to evaluate the effect of the steel net on the retrofitted wall, while also considering the use of steel fibers as alternatives to conventional steel reinforcement (Figure 23).
The ductility of the fibers has a significant reinforcing effect after cracks are initiated in the matrix (i.e., concrete plaster) and their use significantly increases the fracture energy Gf of the material. The fracture energy is a fundamental parameter that controls the behavior of a material after the limit strength is reached. For a certain value of plaster tensile strength, increasing the Gf means improving the material’s ductility, and greater ductility increases the resistance against crack growth. The value of Gf used in the simulation for the fiber-reinforced concrete was 800 N/m (in the reference configuration, the plaster had Gf = 80 N/m), which corresponded to a very low steel-fiber content (about 0.2%), although significantly higher values may also be reached by increasing the fiber volume (for instance, 20,000 N/m with 1% fiber content) [47,48].
From Figure 23 it is evident that the use of the steel net increased the load carrying capacity and deformability of the wall with respect to the configuration without reinforcement. A similar effect in terms of capacity was obtained by using the fiber-reinforced concrete plaster, which showed less ductility in the post-peak response than the steel net.
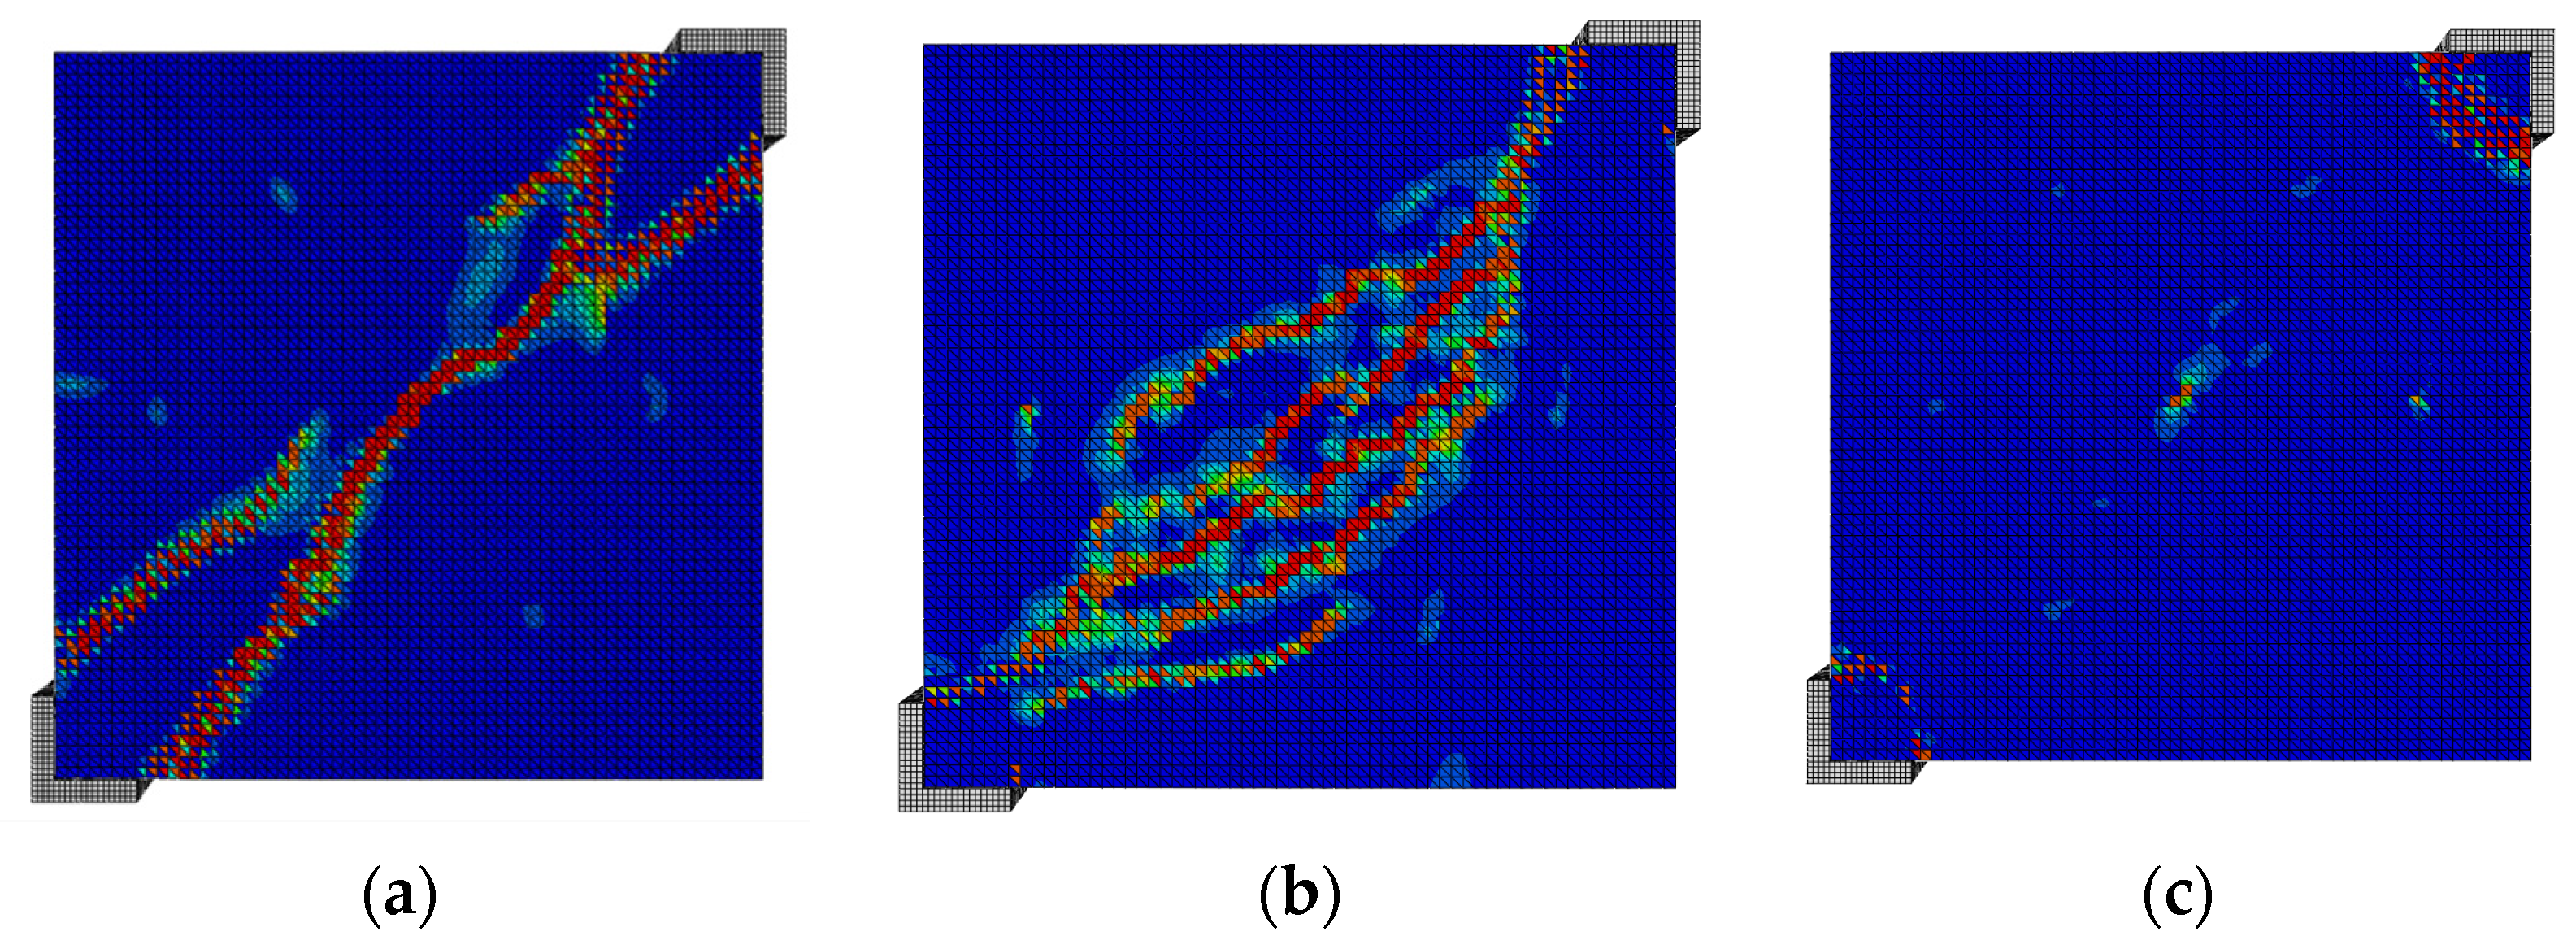
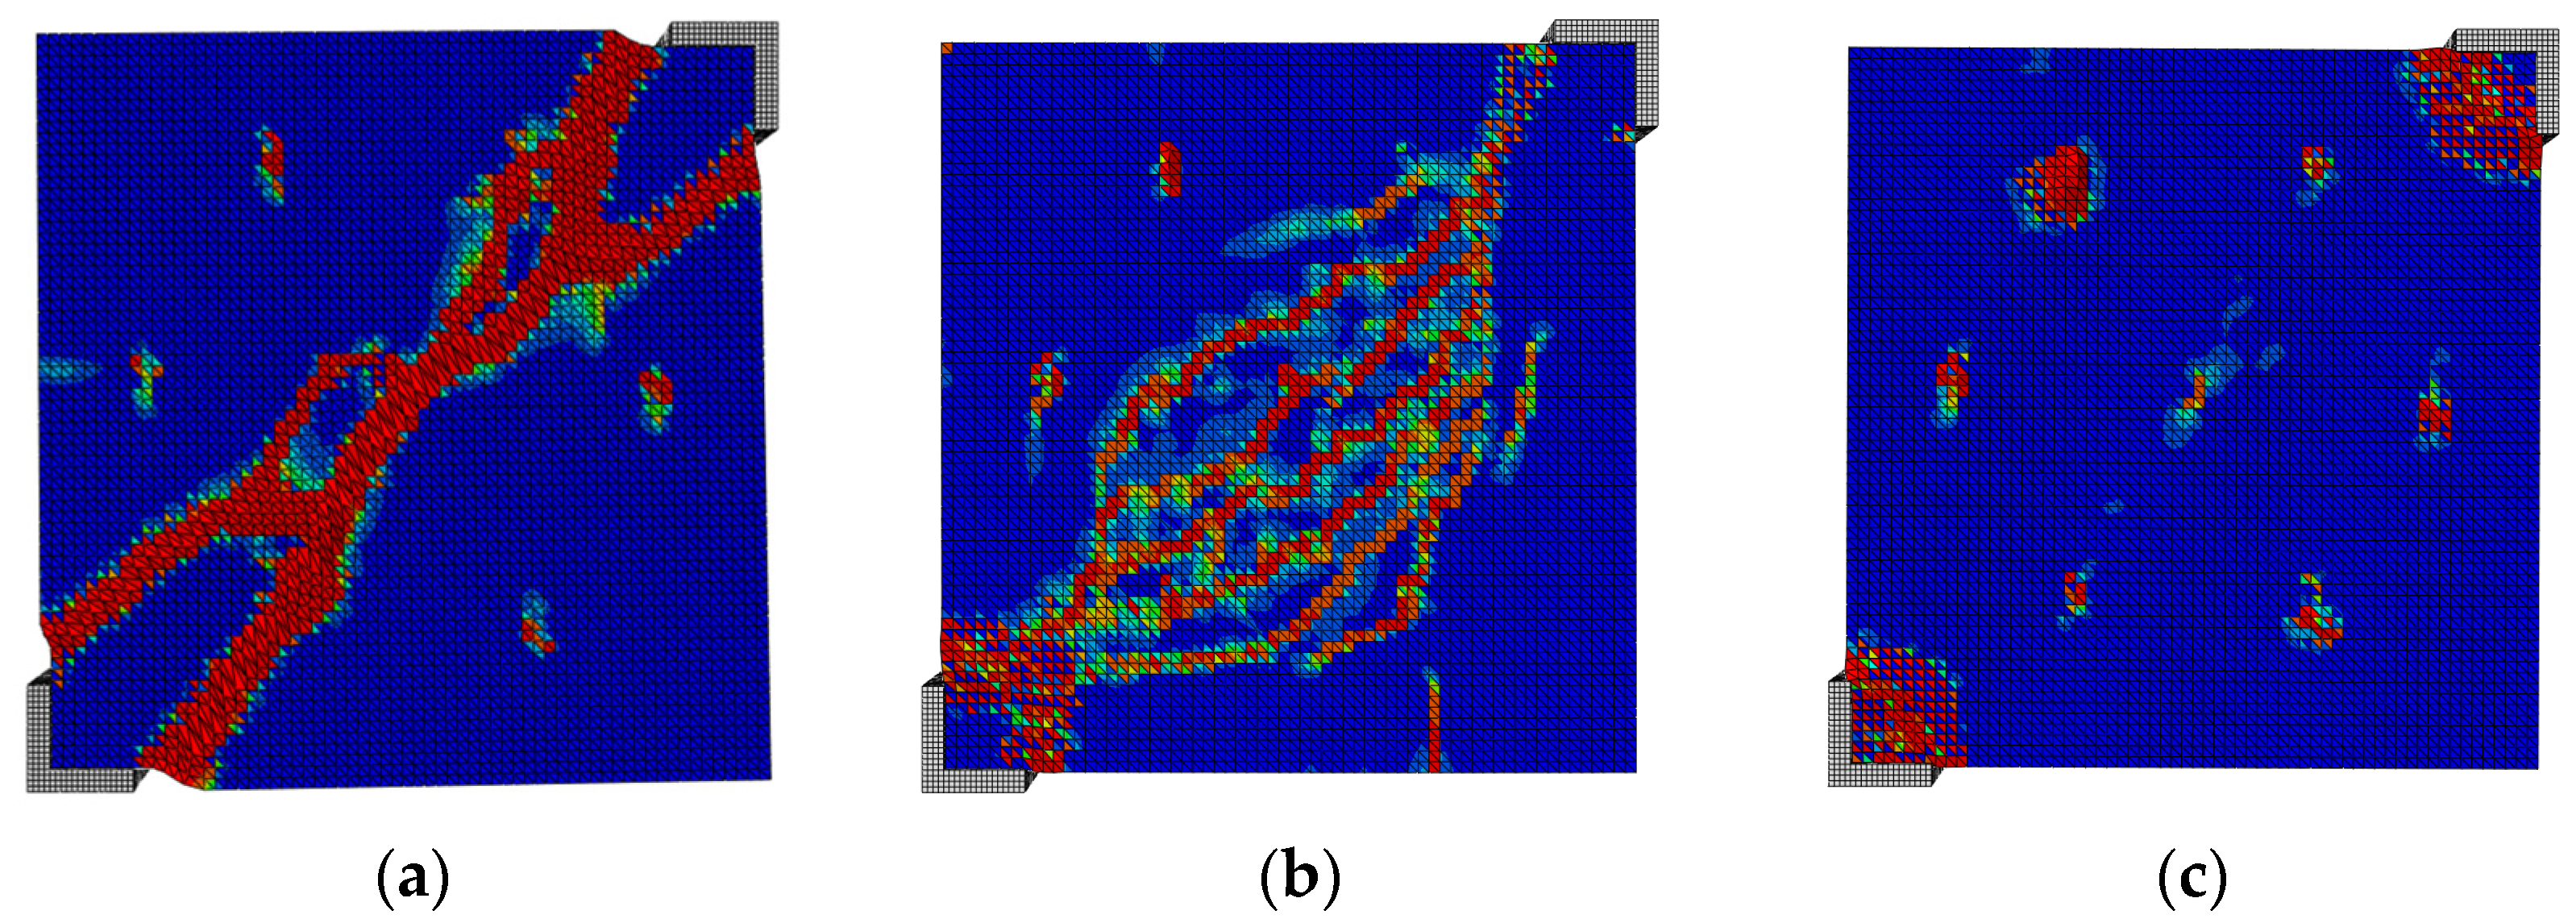
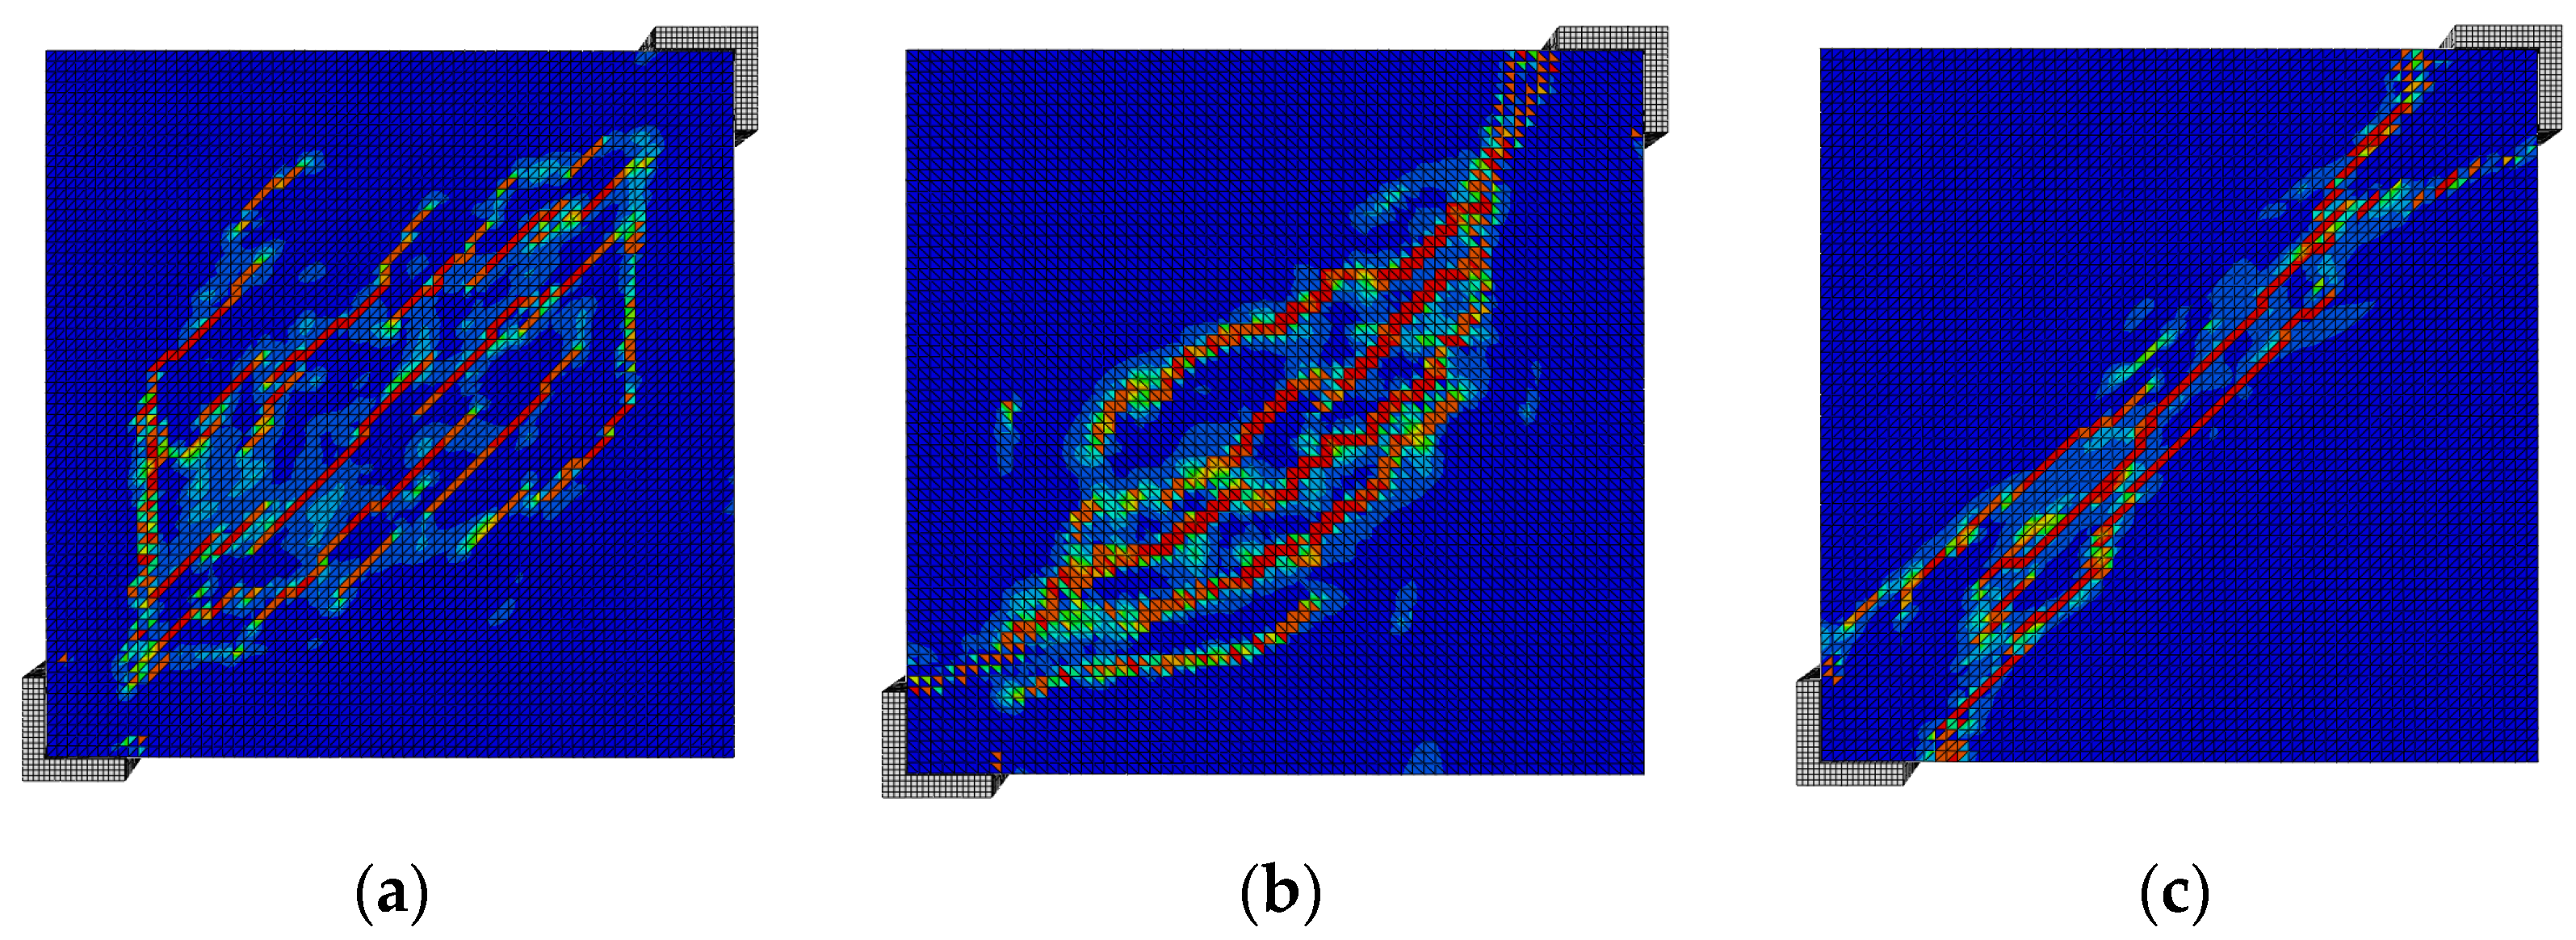
The damage pattern of the tension at the peak load and at failure are reported in Figure 24 and Figure 25. The absence of reinforcement caused the formation of a main crack localized along the diagonal, whose width increased significantly after the peak load. The use of the steel net made possible the spread of damage over a wider area, by means of multiple small cracks. After the peak, the cracks increased in number and some damage close to the loading shoes was evident, together with the punching of the connectors. With the use of the fiber-reinforced concrete, at the peak load, the plaster cover showed limited damage, which was mainly localized close to the loaded corners. At collapse, this damage in the corners became even more evident, and the punching of the anchors was also detected. Unlike the two previous configurations, no diagonal cracks are observed.
Overall, the use of steel nets is fundamental to avoid localized damage and makes it possible to significantly increase the capacity of retrofitted walls, as well as guarantying a certain resistance and ductility after the peak load. The use of steel-fiber concrete may be evaluated as a valid alternative to steel reinforcement to obtain analogous load-carrying capacity and more limited damage.
4.6. Retrofitted Masonry—Plaster Strength
In order to investigate the influence of the plaster strength on the in-plane behavior, three different models were compared by changing the mechanical properties of the plaster, according to the concrete types reported in Table 5. For the nonlinear analyses, the N7 anchor configuration was considered (Figure 20) with 30-mm plaster. The nail diameter was 10 mm, while its length was 200 mm. The mechanical and interaction properties of the other materials, loading conditions, and mesh sizes were those defined in Section 2 and Section 3.
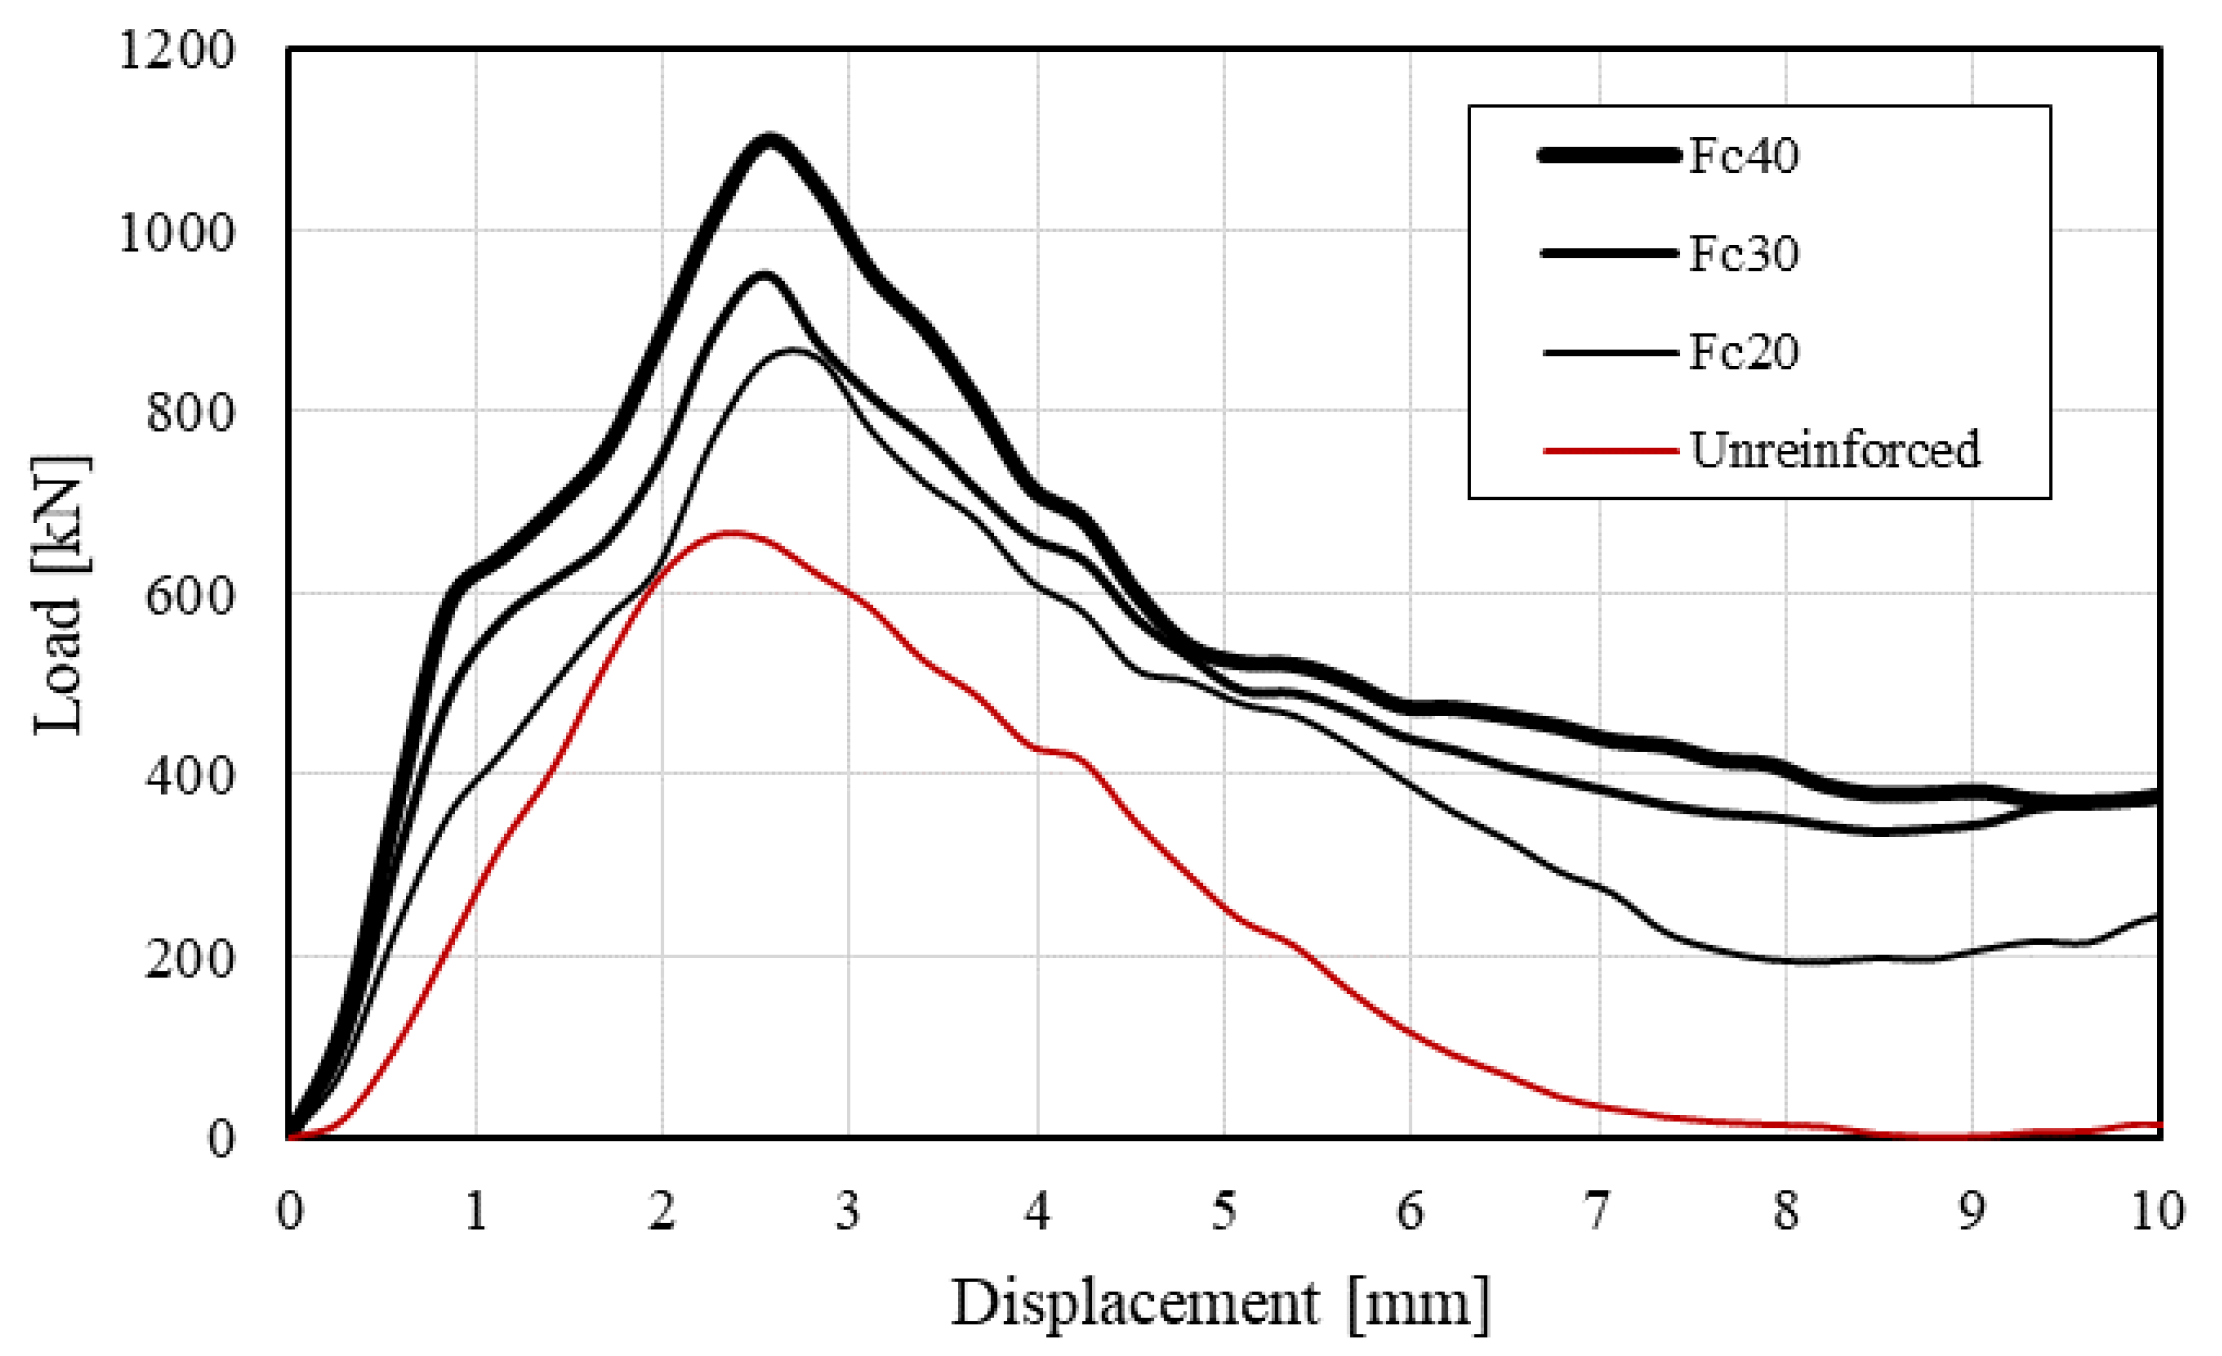
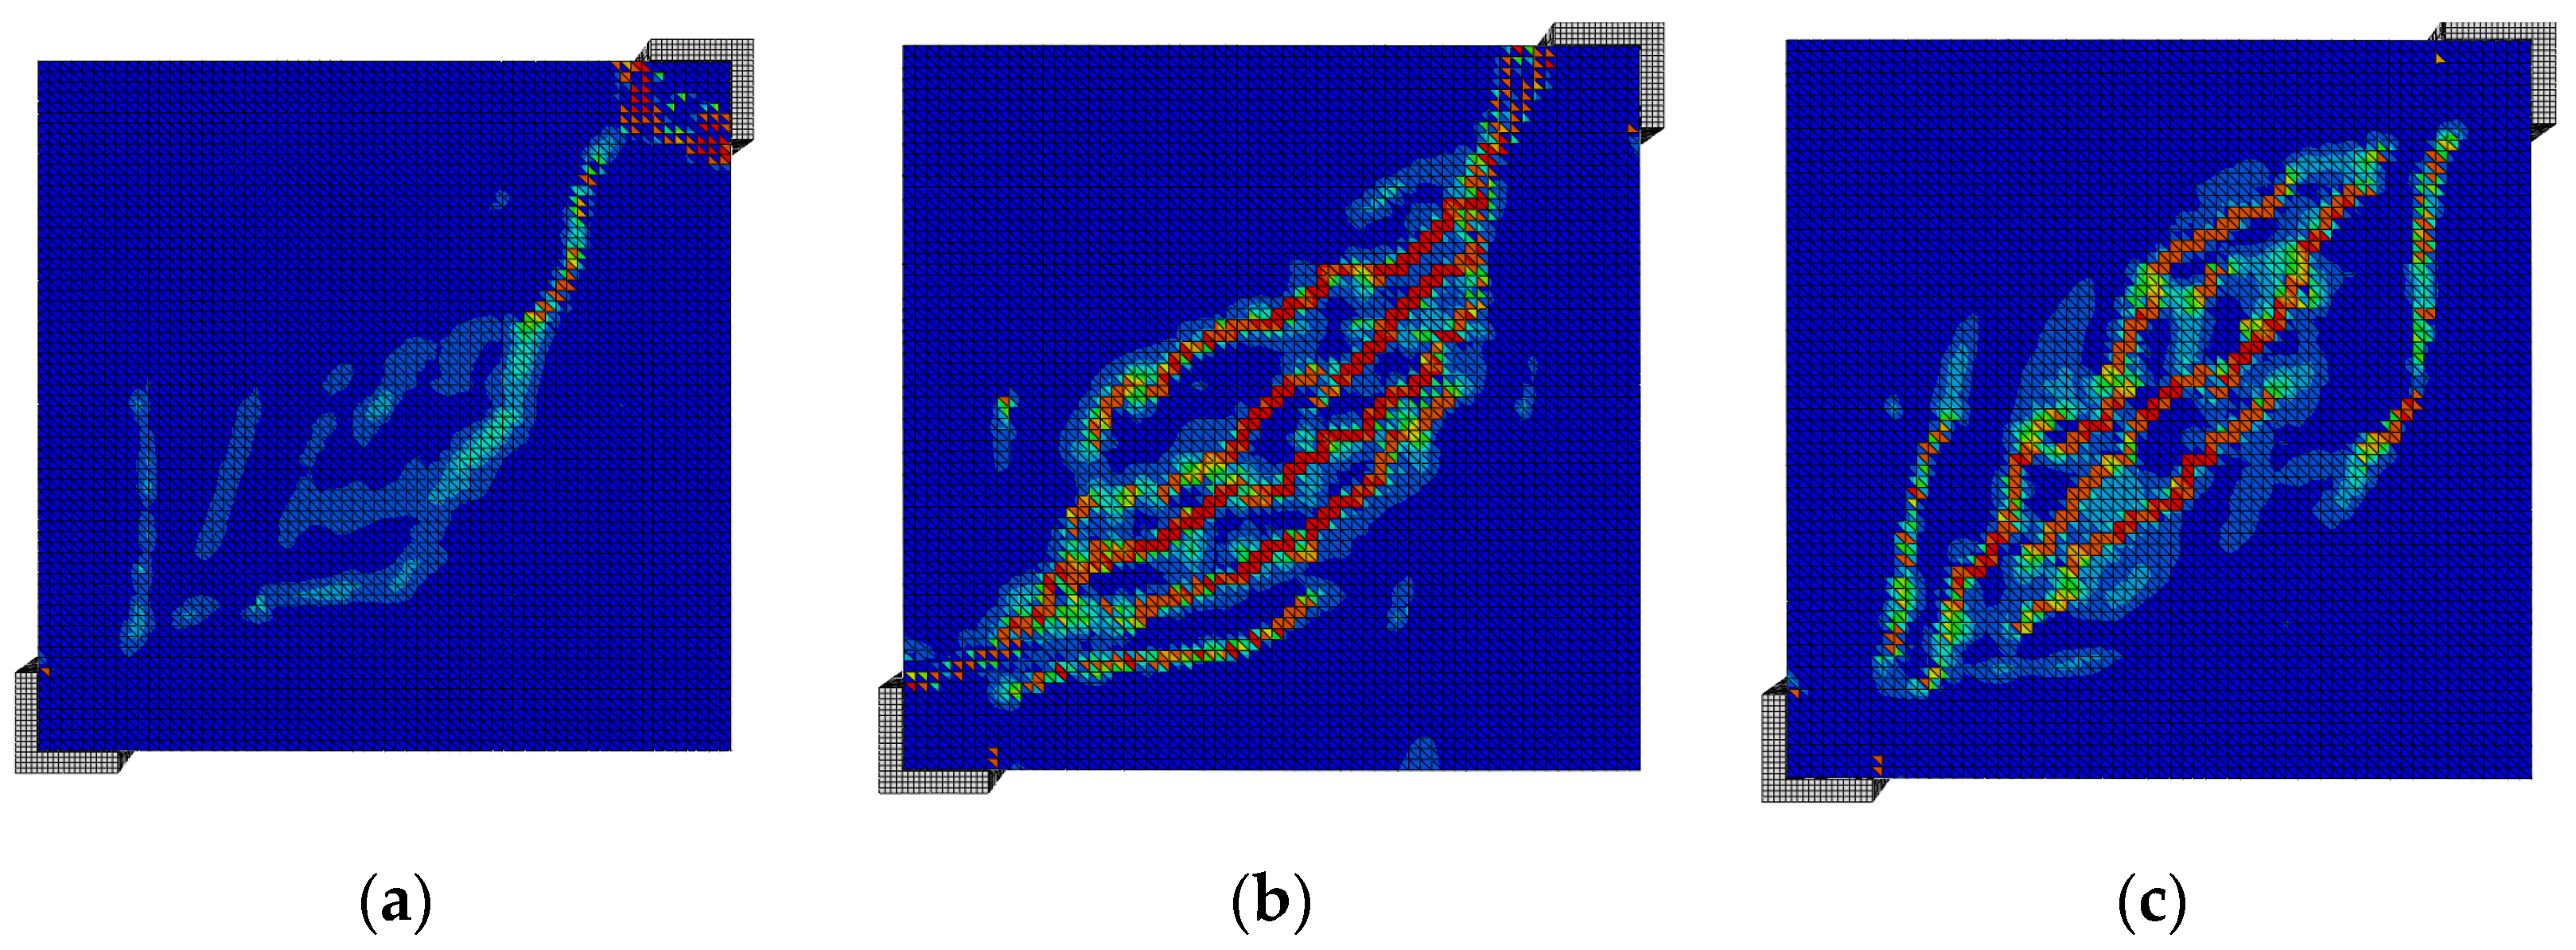
Figure 26 shows the load vs. displacement curves for the different plaster strengths. It is evident that the increase in the strength was beneficial in terms of the maximum load. Furthermore, the initial stiffness of the system was changed significantly by changing the resistance of the plaster, and it was higher for higher strength. Figure 27 and Figure 28 show the damage pattern of the tension and compression for the different configurations at the peak load. The crack distribution was clearly influenced by the strength of the plaster, so that, for lower compressive strength, the damage tended to be localized in the area close to the loading points, with evident crushing. This crushing was not evident in the fc40 configuration, in which the damage was limited to the central area of the panel, with multiple small cracks developing along the diagonal.
4.7. Retrofitted Masonry—Plaster Thickness
In this section, the effect of the plaster thickness is investigated. Three models were implemented, with 20-, 30-, and 50-mm plaster. The mechanical and interaction properties of the materials, loading conditions, and mesh sizes were those defined in Section 2 and Section 3.
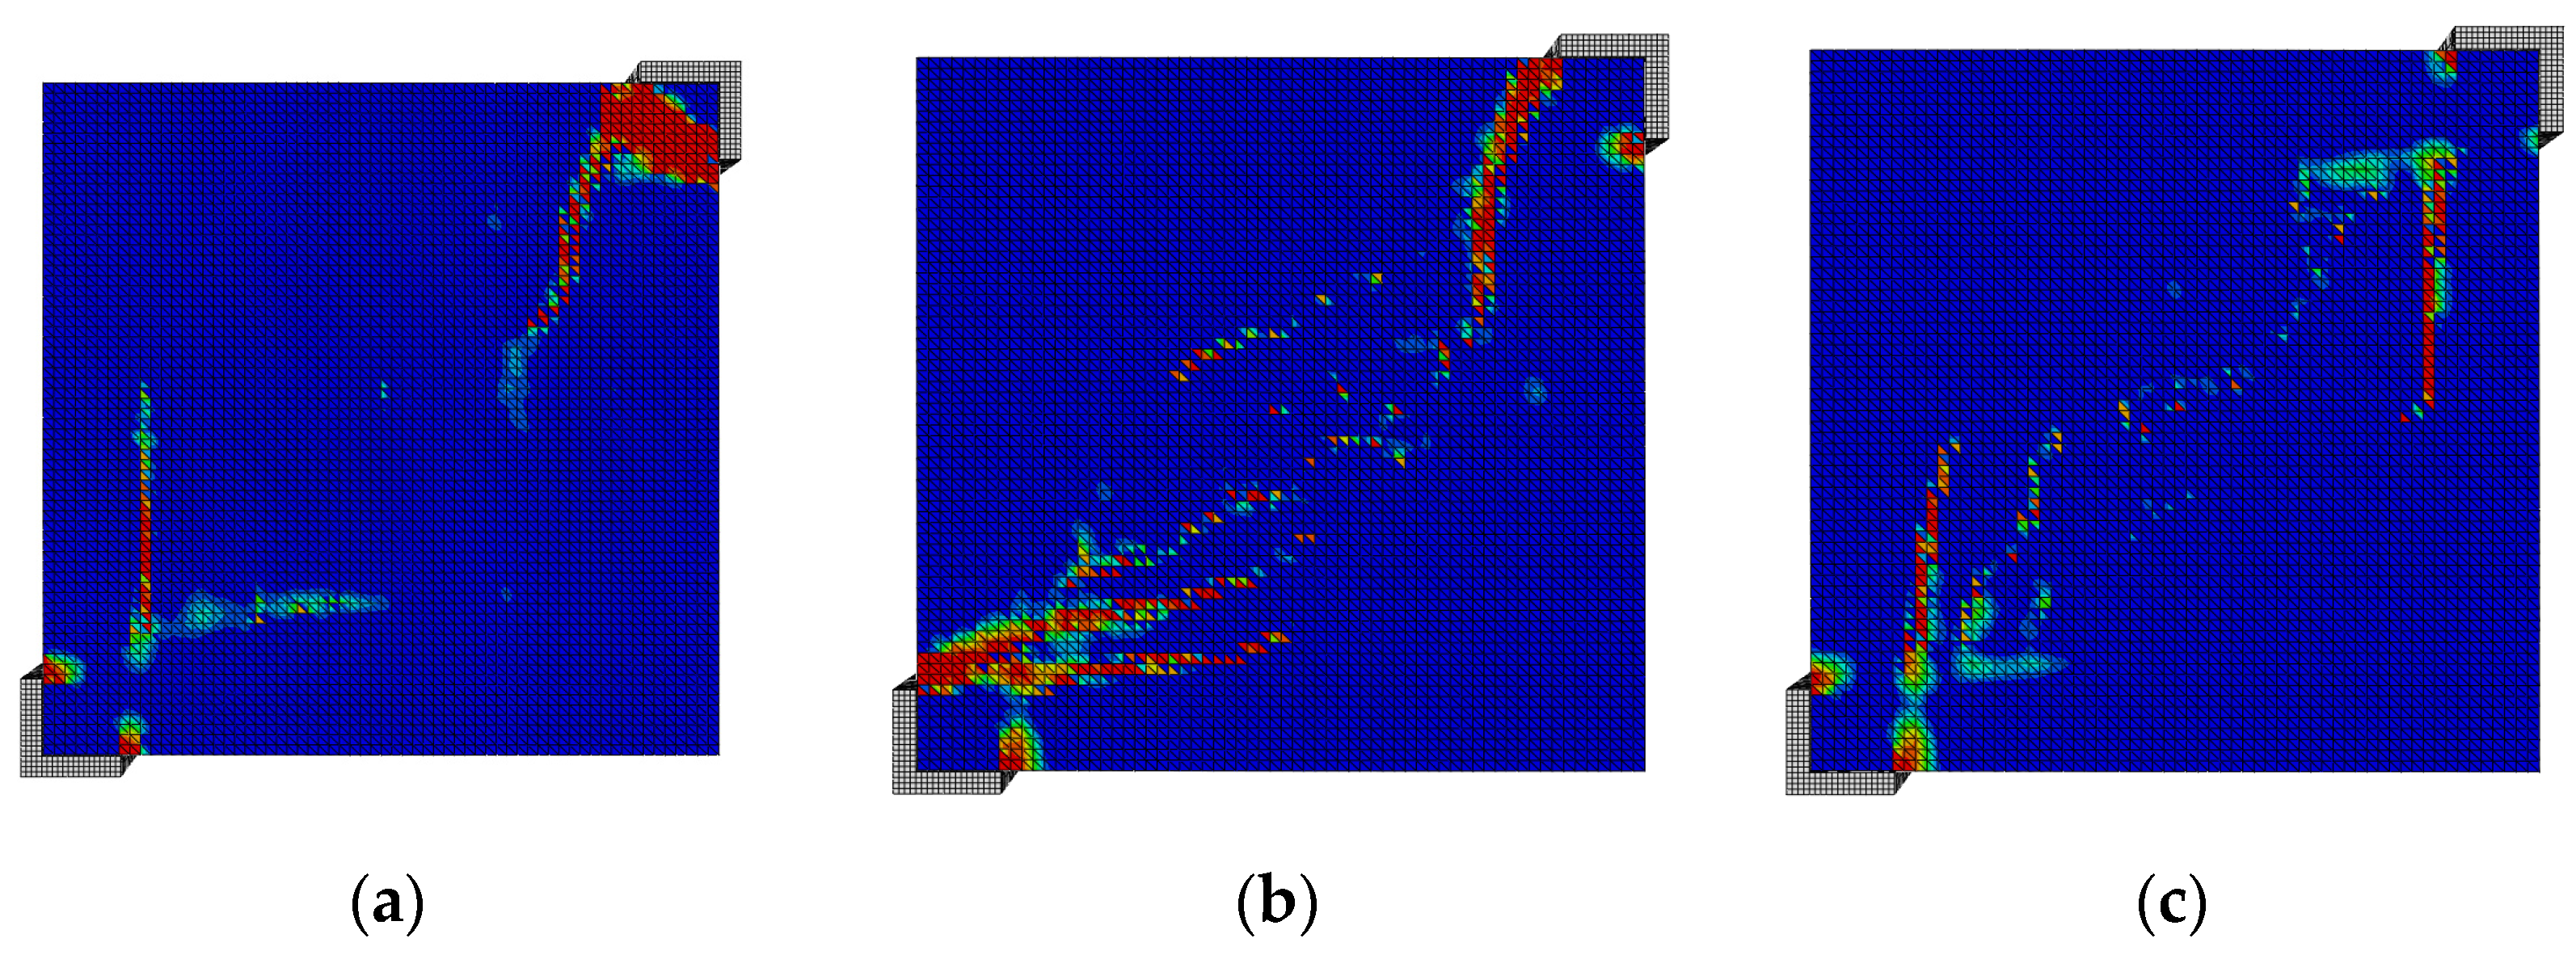
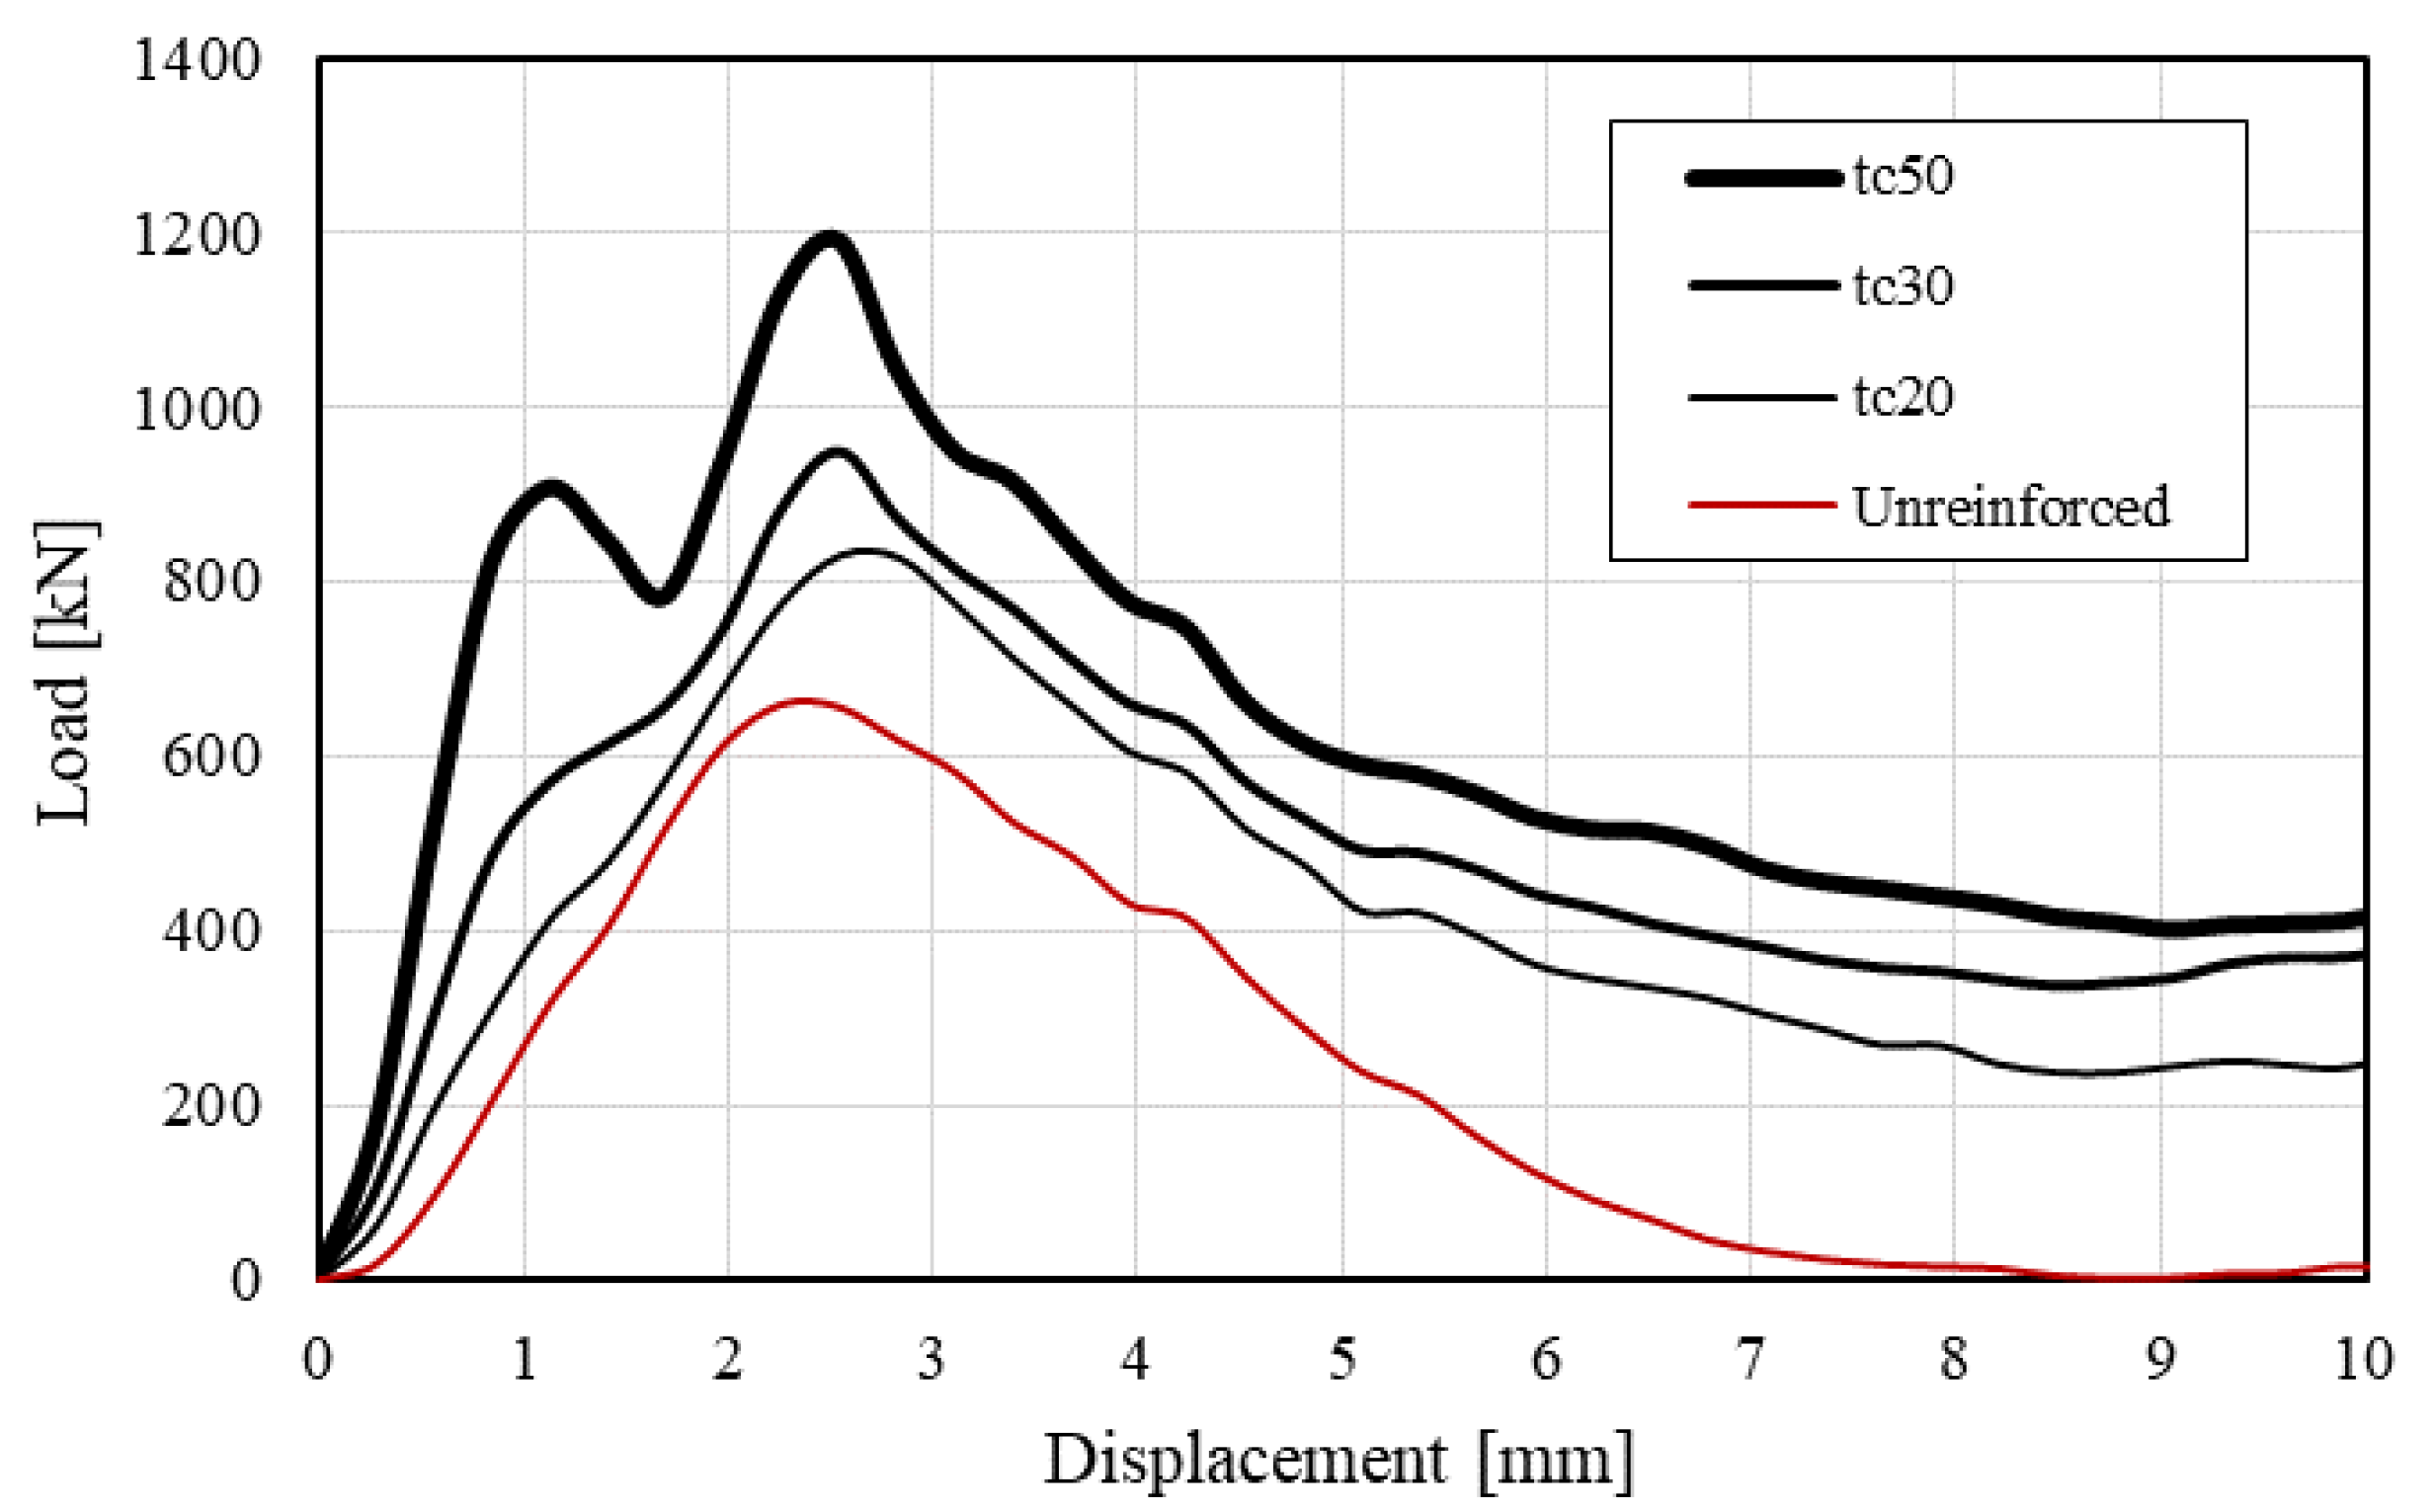
Figure 29 shows the load vs. displacement curves for the different configurations. The increase in the plaster thickness increased both the collapse load and the stiffness of the retrofitted wall. In the 50-mm configuration, a first peak was evident before the maximum load was reached, even though, as in the other configurations, a slight change in slope was detected at the same displacement value. Figure 30 shows the damage at the peak for the different thicknesses. For 20 mm, the damage was spread over a wider area, and consisted in multiple thin diagonal cracks, which often started in the anchor positions. By increasing the thickness, the damage to the plaster was more limited, and for the 50-mm configuration, the punching of the connectors was not observed.
Even though increasing the plaster thickness may be beneficial in terms of collapse load, it should be always remembered that increasing the mass of the wall is not recommended in seismic areas, where the plaster thickness should always remain limited.
5. Conclusions
Among the different strengthening techniques used to enhance the in-plane shear capacity of existing masonry walls, steel-reinforced plaster coating is very common, even though it is difficult to obtain a satisfying characterization of the method from both a theoretical and an experimental point of view in the scientific literature. The scope of this study was to numerically investigate the effect of major parameters on the in-plane behavior of brickwork masonry retrofitted with this technique. After a validation of the numerical model, which was performed by using the preliminary results of an experimental program ongoing at Politecnico di Milano, several nonlinear analyses were performed, and the main conclusions are as follows:
- In URM walls, when the strength of the mortar joint is similar to that of the brick, the response of the wall is more ductile and the damage is localized along the main diagonal; for lower mortar strengths, the capacity is clearly reduced, and the damage spreads over a wider area.
- The main parameters that influence the capacity of RP-retrofitted walls are the compressive strength and the thickness of the plaster; however, especially in seismic areas, it is recommended to limit the thickness in order to avoid a significant increase in the seismic mass.
- The number of connectors does not significantly affect the maximum load, but it plays a fundamental role in preventing instability in the coating layers (due to plaster–masonry debonding) by reducing the amount of out-of-plane displacements.
- The use of steel reinforcement in the plaster results in the distribution of damage over a wider area; the use of fiber-reinforced concrete with very low amounts of steel fiber may be considered as an alternative to steel nets, with analogous capacity but more limited damage.
Author Contributions
Conceptualization, L.B. and S.C.; methodology, L.B., S.C. and M.S.; software, N.V. and M.S.; validation, N.V. and M.S.; formal analysis, N.V. and M.S.; investigation, N.V. and M.S.; resources, S.C. and L.B.; data curation, S.C.; writing—original draft preparation, M.S.; writing—review and editing, M.S., S.C. and L.B.; visualization, N.V. and M.S.; supervision, S.C. and L.B.; project administration, S.C.; funding acquisition, S.C. All authors have read and agreed to the published version of the manuscript.
Funding
This research received no external funding.
Institutional Review Board Statement
Not applicable.
Informed Consent Statement
Not applicable.
Data Availability Statement
Not applicable.
Conflicts of Interest
The authors declare no conflict of interest.
References
- Bosiljkov, V.; Page, A.; Bokan-Bosiljkov, V.; Žarnić, R. Performance based studies of in-plane loaded unreinforced masonry walls. Mason. Int. 2003, 16, 39–50. [Google Scholar]
- Gambarotta, L.; Lagomarsino, S. Damage models for the Seismic Response of Brick Masonry Shear Wall. Part I: The Mortar Joint Model and Its Application. Earthq. Eng. Struct. Dyn. 1997, 26, 423–439. [Google Scholar] [CrossRef]
- Hendry, A.W.; Sinha, B.P.; Davies, S.R. Design of Masonry Structures; CRC Press: Boca Raton, FL, USA, 2017. [Google Scholar]
- Corradi, M.; Tedeschi, C.; Binda, L.; Borri, A. Experimental evaluation of shear and compression strength of masonry wall before and after reinforcement: Deep repointing. Constr. Build. Mater. 2008, 22, 463–472. [Google Scholar] [CrossRef] [Green Version]
- Biolzi, L. Evaluation of Compressive Strength of Masonry Walls by Limit Analysis. J. Struct. Eng. 1988, 114, 2179–2189. [Google Scholar] [CrossRef]
- Elgawady, M.A.; Lestuzzi, P. A review of conventional seismic retrofitting techniques for URM. In Proceedings of the 13th International Brick and Block Masonry Conference, Amsterdam, The Netherland, 4–7 July 2004; pp. 1–10. [Google Scholar]
- Bhattacharya, S.; Nayak, S.; Dutta, S.C. A critical review of retrofitting methods for unreinforced masonry structures. Int. J. Disaster Risk Reduct. 2014, 7, 51–67. [Google Scholar] [CrossRef] [Green Version]
- Gabor, A.; Bennani, A.; Jacquelin, E.; Lebon, F. Modelling approaches of the in-plane shear behaviour of unreinforced and FRP strengthened masonry panels. Compos. Struct. 2006, 74, 277–288. [Google Scholar] [CrossRef] [Green Version]
- Konthesingha, K.M.C.; Masia, M.J.; Petersen, R.B.; Mojsilovic, N.; Simundic, G.; Page, A.W. Static cyclic in-plane shear response of damaged masonry walls retrofitted with NSM FRP strips—An experimental evaluation. Eng. Struct. 2013, 50, 126–136. [Google Scholar] [CrossRef]
- Saileysh Sivaraja, S.; Thandavamoorthy, T.S.; Vijayakumar, S.; Moses Aranganathan, S.; Dasarathy, A.K. Preservation of Historical Monumental Structures using Fibre Reinforced Polymer (FRP)—Case Studies. Procedia Eng. 2013, 54, 472–479. [Google Scholar] [CrossRef] [Green Version]
- Casacci, S.; Gentilini, C.; Di Tommaso, A.; Oliveira, D.V. Shear strengthening of masonry wallettes resorting to structural repointing and FRCM composites. Constr. Build. Mater. 2019, 206, 19–34. [Google Scholar] [CrossRef]
- Papanicolaou, C.G.; Thanasis, A.E.; Triantafillou, C.; Kyriakos, A.E.; Ae, K.; Papathanasiou, M. Textile-reinforced mortar (TRM) versus FRP as strengthening material of URM walls: In-plane cyclic loading. Mater. Struct. 2007, 40, 1081–1097. [Google Scholar] [CrossRef]
- Al-Jaberi, Z.; Myers, J.J.; ElGawady, M.A. Pseudo-static cyclic loading comparison of reinforced masonry walls strengthened with FRCM or NSM FRP. Constr. Build. Mater. 2018, 167, 482–495. [Google Scholar] [CrossRef]
- Ministero Delle Infrastrutture e dei Trasporti. Decreto Ministeriale 17 Gennaio 2018 C.S.LL.PP. Aggiornamento Delle «Norme tecniche per le Costruzioni» 2018. Available online: https://www.certifico.com/categorie/332-costruzioni/5669-decreto-17-gennaio-2018 (accessed on 9 May 2022).
- Earthquake Planning and Protection Organization of Greece EPPO. CODE OF INTERVENTIONS (ΚAΝ.ΕPΕ.). 2013, pp. 1–337. Available online: http://ecpfe.oasp.gr/sites/default/files/files/full.pdf (accessed on 9 May 2022).
- Brignola, A.; Frumento, S.; Lagomarsino, S.; Podestá, S. Identification of shear parameters of masonry panels through the in-situ diagonal compression test. Int. J. Archit. Herit. 2009, 3, 52–73. [Google Scholar] [CrossRef]
- Calderini, C.; Cattari, S.; Lagomarsino, S. The use of the diagonal compression test to identify the shear mechanical parameters of masonry. Constr. Build. Mater. 2010, 24, 677–685. [Google Scholar] [CrossRef]
- Casolo, S.; Biolzi, L.; Carvelli, V.; Barbieri, G. Testing masonry blockwork panels for orthotropic shear strength. Constr. Build. Mater. 2019, 214, 74–92. [Google Scholar] [CrossRef]
- Segura, J.; Pelà, L.; Saloustros, S.; Roca, P. Experimental and numerical insights on the diagonal compression test for the shear characterisation of masonry. Constr. Build. Mater. 2021, 287, 122964. [Google Scholar] [CrossRef]
- Milosevic, J.; Lopes, M.; Gago, A.S.; Bento, R. Testing and modeling the diagonal tension strength of rubble stone masonry panels. Eng. Struct. 2013, 52, 581–591. [Google Scholar] [CrossRef]
- Fathalla, E.; Salem, H. Parametric study on seismic rehabilitation of masonry buildings using FRP based upon 3D non-linear dynamic analysis. Buildings 2018, 8, 124. [Google Scholar] [CrossRef] [Green Version]
- Sediek, O.A.; El-Tawil, S.; McCormick, J.P. Impact of Earthquake-Induced Debris on the Seismic Resilience of Road Networks. In Proceedings of the 17th World Conference of Earthquake Engineering, Sendai, Japan, 13–18 September 2020. [Google Scholar]
- Zucchini, A.; Lourenço, P.B. A micro-mechanical model for the homogenisation of masonry. Int. J. Solids Struct. 2002, 39, 3233–3255. [Google Scholar] [CrossRef]
- Basili, M.; Marcari, G.; Vestroni, F. Nonlinear analysis of masonry panels strengthened with textile reinforced mortar. Eng. Struct. 2016, 113, 245–258. [Google Scholar] [CrossRef]
- Pelà, L.; Aprile, A.; Benedetti, A. Seismic assessment of masonry arch bridges. Eng. Struct. 2009, 31, 1777–1788. [Google Scholar] [CrossRef]
- Parisi, F.; Balestrieri, C.; Asprone, D. Nonlinear micromechanical model for tuff stone masonry: Experimental validation and performance limit states. Constr. Build. Mater. 2016, 105, 165–175. [Google Scholar] [CrossRef]
- Chisari, C.; Macorini, L.; Amadio, C.; Izzuddin, B.A. Identification of mesoscale model parameters for brick-masonry. Int. J. Solids Struct. 2018, 146, 224–240. [Google Scholar] [CrossRef]
- Spada, A.; Giambanco, G.; Rizzo, P. Damage and plasticity at the interfaces in composite materials and structures. Comput. Methods Appl. Mech. Eng. 2009, 198, 3884–3901. [Google Scholar] [CrossRef]
- Zhang, S.; Taheri Mousavi, S.M.; Richart, N.; Molinari, J.F.; Beyer, K. Micro-mechanical finite element modeling of diagonal compression test for historical stone masonry structure. Int. J. Solids Struct. 2017, 112, 122–132. [Google Scholar] [CrossRef]
- ASTM C293/C293M-16; Standard Test Method for Flexural Strength of Concrete (Using Simple Beam with Third-Point Loading). ASTM lnternational: West Conshohocken, PA, USA, 2016; pp. 1–4. [CrossRef]
- ASTM C349-08; Standard Test Method for Compressive Strength of Hydraulic-Cement Mortars (Using Portions of Prisms Broken in Flexure). ASTM lnternational: West Conshohocken, PA, USA, 2008; pp. 1–4. [CrossRef]
- Sousa, R.; Sousa, H.; Guedes, J. Diagonal compressive strength of masonry samples—experimental and numerical approach. Mater. Struct. 2013, 46, 765–786. [Google Scholar] [CrossRef]
- Brandonisio, G.; Lucibello, G.; Mele, E.; Luca, A. De Damage and performance evaluation of masonry churches in the 2009 L’Aquila earthquake. Eng. Fail. Anal. 2013, 34, 693–714. [Google Scholar] [CrossRef]
- Barbieri, G.; Valente, M.; Biolzi, L.; Togliani, C.; Fregonese, L.; Stanga, G. An insight in the late Baroque architecture: An integrated approach for a unique Bibiena church. J. Cult. Herit. 2017, 23, 58–67. [Google Scholar] [CrossRef]
- Dassault Systèmes ABAQUS/CAE Documentation 2017. Available online: https://pdf.directindustry.com/pdf/simulia/abaqus-cae-2017/6159-949010.html (accessed on 9 May 2022).
- ASTM International ASTM E 519:02; Standard Test Method for Diagonal Tension (Shear) in Masonry Assemblages. ASTM lnternational: West Conshohocken, PA, USA, 2002. [CrossRef]
- Lubliner, J.; Oliver, J.; Oller, S.; Oñate, E. A plastic-damage model for concrete. Int. J. Solids Struct. 1989, 25, 299–326. [Google Scholar] [CrossRef]
- Valente, M.; Barbieri, G.; Biolzi, L. Damage assessment of three medieval churches after the 2012 Emilia earthquake. Bull. Earthq. Eng. 2017, 15, 2939–2980. [Google Scholar] [CrossRef]
- Albu-Jasim, Q.; Medina-Cetina, Z.; Muliana, A. Calibration of a concrete damage plasticity model used to simulate the material components of unreinforced masonry reinforced concrete infill frames. Mater. Struct. Constr. 2022, 55, 36. [Google Scholar] [CrossRef]
- Szczecina, M.; Winnicki, A. Calibration of the CDP model parameters in Abaqus. In Proceedings of the 2015 World Congress on Advances in Structural Engineering and Mechanics (ASEM15), Incheon, Korea, 25–29 August 2015; pp. 1–11. [Google Scholar]
- Kaushik, H.B.; Rai, D.C.; Jain, S.K. Stress-Strain Characteristics of Clay Brick Masonry under Uniaxial Compression Hemant. J. Mater. Civ. Eng. 2007, 19, 728–739. [Google Scholar] [CrossRef]
- Cattaneo, S.; Vafa, N. Tensile capacity of adhesive anchors in damaged masonry. Appl. Sci. 2021, 11, 135. [Google Scholar] [CrossRef]
- Prota, A.; Marcari, G.; Fabbrocino, G.; Manfredi, G.; Aldea, C. Experimental In-Plane Behavior of Tuff Masonry Strengthened with Cementitious Matrix–Grid Composites. J. Compos. Constr. 2006, 10, 223–233. [Google Scholar] [CrossRef]
- Meriggi, P.; Caggegi, C.; Gabor, A.; de Felice, G. Shear-compression tests on stone masonry walls strengthened with basalt textile reinforced mortar (TRM). Constr. Build. Mater. 2022, 316, 125804. [Google Scholar] [CrossRef]
- Lin, Y.W.; Wotherspoon, L.; Scott, A.; Ingham, J.M. In-plane strengthening of clay brick unreinforced masonry wallettes using ECC shotcrete. Eng. Struct. 2014, 66, 57–65. [Google Scholar] [CrossRef]
- Maalej, M.; Lin, V.W.J.; Nguyen, M.P.; Quek, S.T. Engineered cementitious composites for effective strengthening of unreinforced masonry walls. Eng. Struct. 2010, 32, 2432–2439. [Google Scholar] [CrossRef]
- Köksal, F.; Şahin, Y.; Gencel, O.; Yiǧit, I. Fracture energy-based optimisation of steel fibre reinforced concretes. Eng. Fract. Mech. 2013, 107, 29–37. [Google Scholar] [CrossRef]
- Biolzi, L.; Cattaneo, S.; Guerrini, G.L. Fracture of Plain and Fiber-Reinforced High Strength Mortar Slabs with EA and ESPI Monitoring. Appl. Compos. Mater. 2000, 7, 1–12. [Google Scholar] [CrossRef]
Figure 1.
(a) Unreinforced masonry specimen; (b) retrofitted specimen; (c) anchor detail.

Figure 2.
(a) Test set-up; (b) LVDT layout.

Figure 3.
Experimental load vs. displacement curve.

Figure 4.
Damage at collapse: (a) on the plaster; (b) on the masonry; (c) plaster detachment.

Figure 5.
(a) 3D model of the specimen; (b) FE mesh of reinforced masonry; (c) FE mesh of the anchor.
Figure 5.
(a) 3D model of the specimen; (b) FE mesh of reinforced masonry; (c) FE mesh of the anchor.

Figure 6.
(a) DC test set-up; (b) FE model of the wall with load and boundary conditions.

Figure 7.
Constitutive behavior of plaster, brick, and mortar: (a) stress–strain of compression; (b) post-failure stress–displacement of tension; (c) damage factor of compression; (d) damage factor of tension.
Figure 7.
Constitutive behavior of plaster, brick, and mortar: (a) stress–strain of compression; (b) post-failure stress–displacement of tension; (c) damage factor of compression; (d) damage factor of tension.

Figure 8.
Comparison between numerical and experimental load vs. displacement curves.

Figure 9.
Damage evolution of tension.

Figure 10.
Damage evolution of compression.

Figure 11.
Load vs. displacement curves for different mortar grades.

Figure 12.
Damage distribution for different mortar grades: (a) weak; (b) modified weak; (c) intermediate; (d) strong.
Figure 12.
Damage distribution for different mortar grades: (a) weak; (b) modified weak; (c) intermediate; (d) strong.

Figure 13.
Weak-brick patterns: (a) R1; (b) R2; (c) R3.

Figure 14.
Load vs. displacement curves for different weak-brick patterns.

Figure 15.
Damage of tension at failure for different weak-brick patterns: (a) R1 pattern, (b) R2 pattern, (c) R3 pattern, (d) no weak bricks.
Figure 15.
Damage of tension at failure for different weak-brick patterns: (a) R1 pattern, (b) R2 pattern, (c) R3 pattern, (d) no weak bricks.

Figure 16.
Geometry, loads, and boundary conditions.

Figure 17.
Damage of tension (a), of compression (b), and Mises stresses (c) on the nail for 0°.

Figure 18.
Damage of tension (a), of compression (b), and Mises stresses (c) on the nail for 45°.

Figure 19.
Effects of nail orientation on the vertical plaster displacement.

Figure 20.
Anchors patterns: (a) N5; (b) N7; (c) N10.

Figure 21.
Load–displacement curves for different number of anchors.

Figure 22.
Out-of-plane displacement along the diagonal for different numbers of anchors: (a) at peak load, (b) at failure.
Figure 22.
Out-of-plane displacement along the diagonal for different numbers of anchors: (a) at peak load, (b) at failure.

Figure 23.
Load–displacement curves without reinforcement, with steel-net reinforcement and with fiber-reinforced plaster.
Figure 23.
Load–displacement curves without reinforcement, with steel-net reinforcement and with fiber-reinforced plaster.

Figure 24.
Damage pattern at the peak load for different configurations of reinforcement: (a) no reinforcement; (b) steel net; (c) fiber-reinforced plaster.
Figure 24.
Damage pattern at the peak load for different configurations of reinforcement: (a) no reinforcement; (b) steel net; (c) fiber-reinforced plaster.

Figure 25.
Damage pattern at failure for different configurations of reinforcement: (a) no reinforcement; (b) steel net; (c) fiber-reinforced plaster.
Figure 25.
Damage pattern at failure for different configurations of reinforcement: (a) no reinforcement; (b) steel net; (c) fiber-reinforced plaster.

Figure 26.
Load–displacement curves for different plaster strengths.

Figure 27.
Damage pattern at the peak load of tension for (a) fc20, (b) fc30, (c) fc40.

Figure 28.
Damage pattern at the peak load of compression for (a) fc20, (b) fc30, (c) fc40.

Figure 29.
Load–displacement curves for different plaster thicknesses.

Figure 30.
Tensile damage pattern at the peak load for different plaster thicknesses: (a) 20 mm; (b) 30 mm; (c) 50 mm.
Figure 30.
Tensile damage pattern at the peak load for different plaster thicknesses: (a) 20 mm; (b) 30 mm; (c) 50 mm.


Table 1.
Mechanical properties for brick, mortar, plaster, and steel.
| Material | γ | E | υ | σcu | σt0 |
|---|---|---|---|---|---|
| (T/mm3) | (MPa) | (-) | (MPa) | (MPa) | |
| Brick | 1.56 × 10⁻⁹ | 5756 | 0.15 | 23 | 3.0 |
| Mortar | 2.40 × 10⁻⁹ | 900 | 0.20 | 5 | 1.1 |
| Plaster | 2.50 × 10⁻⁹ | 30,000 | 0.20 | 30 | 3.0 |
| Steel | 7.85 × 10⁻⁹ | 200,000 | 0.30 | - | - |
Table 2.
CDP parameters for brick, mortar and plaster.
| Material | Ψ (°) | e | σb0/σco | K | μ |
|---|---|---|---|---|---|
| Brick | 28 | 0.1 | 1.16 | 0.667 | 0.0003 |
| Mortar | 20 | 0.1 | 1.16 | 0.667 | 0.0003 |
| Plaster | 28 | 0.1 | 1.16 | 0.667 | 0.0003 |
Table 3.
Summary of the performed simulations.
| Test | Investigate Parameter | Reinforced/Unreinforced |
|---|---|---|
| 1 | Mortar strength | unreinforced |
| 2 | Presence of weak bricks | unreinforced |
| 3 | Anchors orientation | reinforced |
| 4 | Plaster reinforcement | reinforced |
| 6 | Anchor density | reinforced |
| 6 | Plaster strength and fracture energy | reinforced |
| 7 | Plaster thickness | reinforced |
Table 4.
Mechanical properties of mortars.
| Mortar (Cement:Lime:Sand) | Failure Strain | σcu (N/mm2) | E (N/mm2) |
|---|---|---|---|
| Weak (1:0:6) | 0.0102 | 3.1 | 545 |
| Modified weak (1:0.7:5.5) | 0.0092 | 5.5 | 1100 |
| Intermediate (1:0.5:4.5) | 0.0083 | 15.2 | 3300 |
| Strong (1:0:3) | 0.0099 | 20.6 | 3750 |
Table 5.
Mechanical properties of different concrete plasters.
| Concrete Type | Crushing Strain | σcu (N/mm2) | E (N/mm2) |
|---|---|---|---|
| fc20 | 0.0014 | 20 | 27,000 |
| fc30 | 0.0018 | 30 | 30,000 |
| fc40 | 0.0022 | 40 | 33,000 |
Publisher’s Note: MDPI stays neutral with regard to jurisdictional claims in published maps and institutional affiliations. |
© 2022 by the authors. Licensee MDPI, Basel, Switzerland. This article is an open access article distributed under the terms and conditions of the Creative Commons Attribution (CC BY) license (https://creativecommons.org/licenses/by/4.0/).
Share and Cite
MDPI and ACS Style
Scamardo, M.; Cattaneo, S.; Biolzi, L.; Vafa, N. Parametric Analyses of the Response of Masonry Walls with Reinforced Plaster. Appl. Sci. 2022, 12, 5090. https://0-doi-org.brum.beds.ac.uk/10.3390/app12105090
AMA Style
Scamardo M, Cattaneo S, Biolzi L, Vafa N. Parametric Analyses of the Response of Masonry Walls with Reinforced Plaster. Applied Sciences. 2022; 12(10):5090. https://0-doi-org.brum.beds.ac.uk/10.3390/app12105090
Chicago/Turabian StyleScamardo, Manuela, Sara Cattaneo, Luigi Biolzi, and Navid Vafa. 2022. "Parametric Analyses of the Response of Masonry Walls with Reinforced Plaster" Applied Sciences 12, no. 10: 5090. https://0-doi-org.brum.beds.ac.uk/10.3390/app12105090
Note that from the first issue of 2016, this journal uses article numbers instead of page numbers. See further details here.