
Numerical Studies on Rockbursts in Tunnels with High In Situ Stresses and Geothermally Rich Areas


1
State Key Laboratory of Coastal and Offshore Engineering, Dalian University of Technology, Dalian 116024, China
2
Key Laboratory of Rock Mechanics and Geohazards of Zhejiang Province, Shaoxing University, Shaoxing 312000, China
*
Author to whom correspondence should be addressed.
Appl. Sci. 2022, 12(10), 5108; https://0-doi-org.brum.beds.ac.uk/10.3390/app12105108
Submission received: 14 April 2022
/
Revised: 16 May 2022
/
Accepted: 17 May 2022
/
Published: 19 May 2022
(This article belongs to the Special Issue The Advances of Rock Dynamics)
Abstract
:To further understand the stress evolution and rockburst occurrence mechanism in geothermally rich areas in the Sichuan–Tibet railway project, this work presents a theoretical study of the influence of temperature change on the failure of rock, conducts numerical studies of the temperature and stress evolution in the surrounding rock during high-temperature tunnel excavation, and further studies the possibility of rockbursts under high in situ stress and high-temperature conditions. Rockbursts occur frequently at the junction of a face and tunnel wall, and ventilation and cooling of tunnels reduce the stress and sometimes reduce the possibility of rockbursts. Continuous cooling leads to a larger tensile stress and the possibility of failure of wall rock. In addition, the influence of the convection heat transfer coefficient, in situ stress and fault effect on the stress distribution and possibility of rockbursts are also discussed in detail. The results are beneficial for the prevention and control of rockbursts in high in situ stress and geothermally rich areas.
1. Introduction
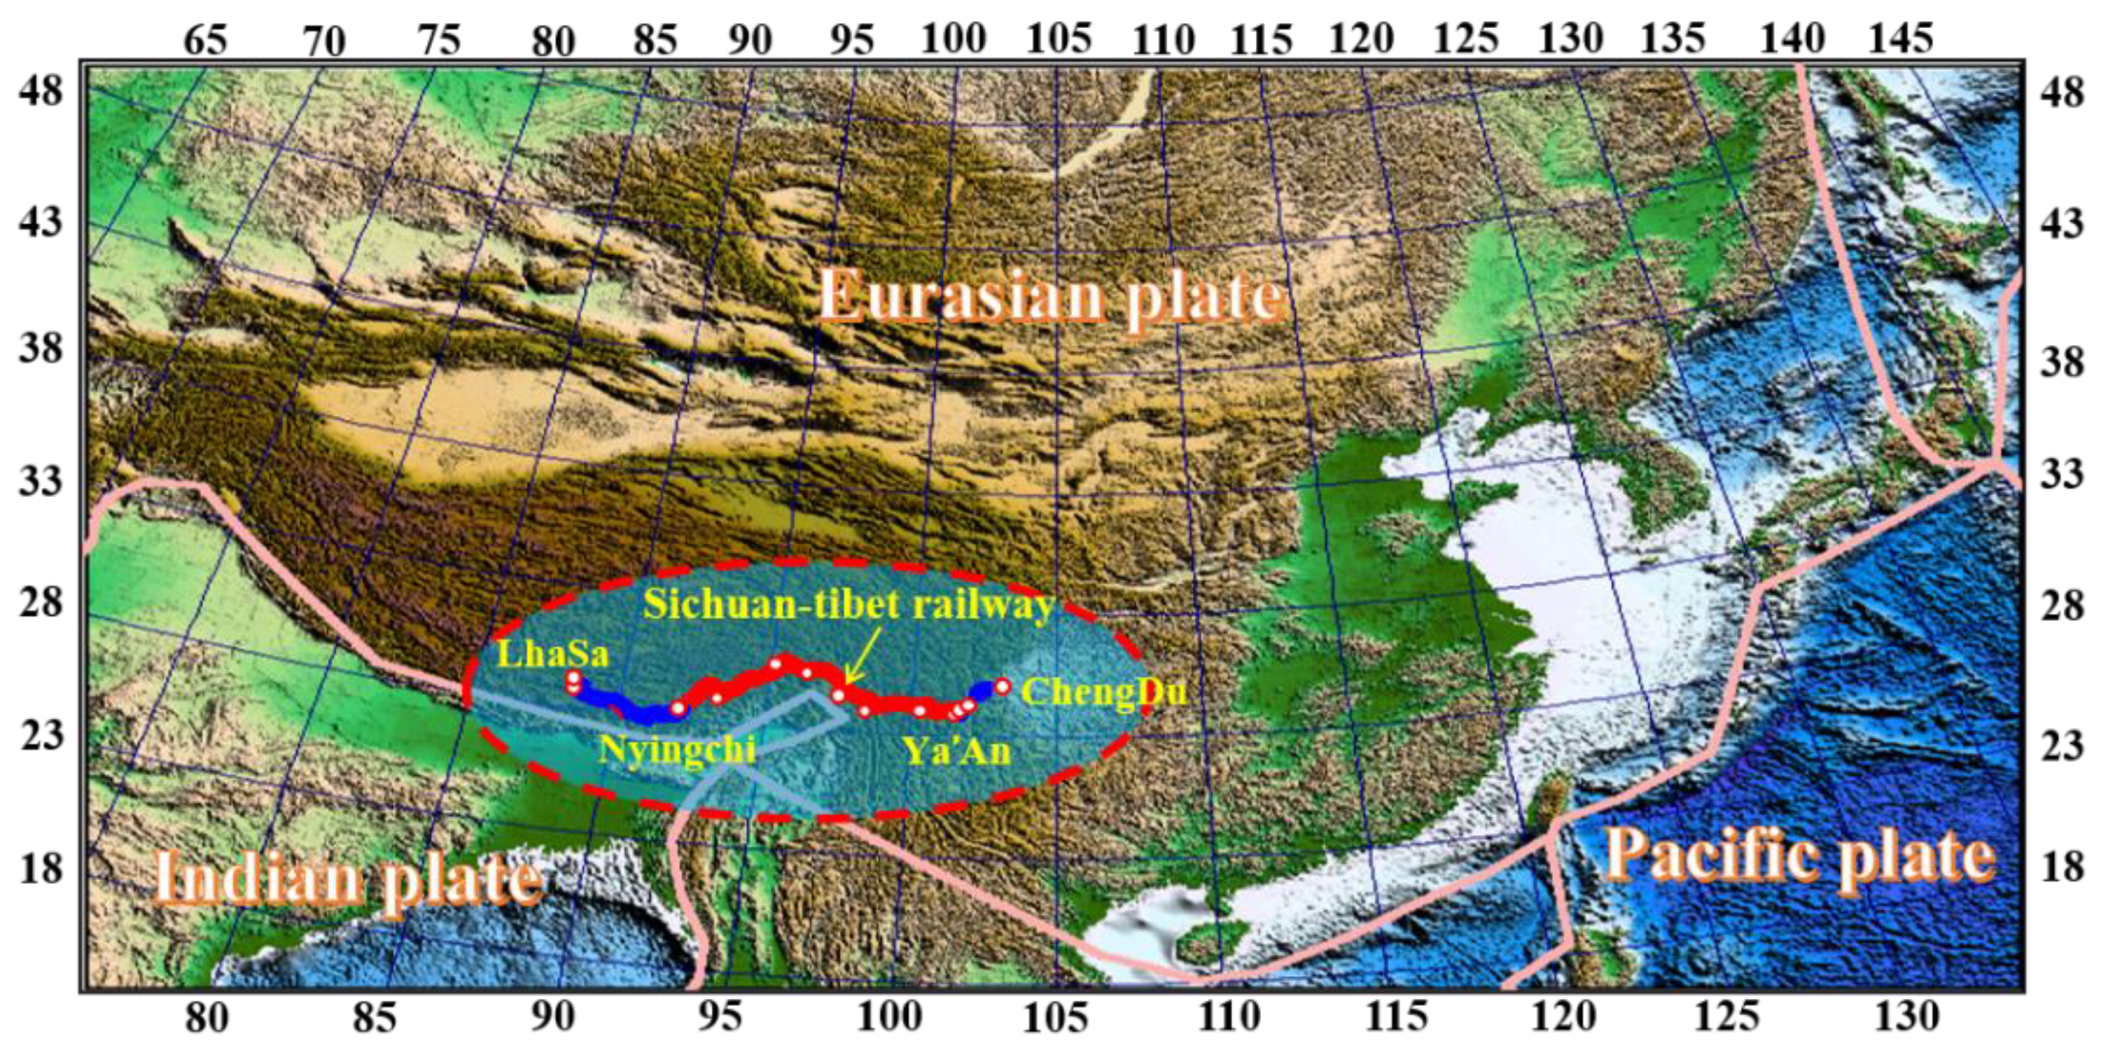
Rockbursts are a kind of geological disaster that often occur in deep mining and tunnel engineering. They not only threaten the safety of workers but also cause a delay in construction [1,2,3]. In the Sichuan–Tibet railway project in China shown in Figure 1, a large number of long and deeply buried tunnels need to be excavated, and rockbursts have occurred many times during tunnel excavation from Nyingchi to Lhasa. According to geological survey data on the Sichuan–Tibet railway project, the in situ stress of the surrounding rock can reach 42 MPa, and the geothermal temperature can be greater than 90 °C [4]. The high temperature and great in situ stress undoubtedly cause great difficulties for tunnel excavation, and rockbursts are particularly serious. To maintain the stability of the surrounding rock, it is helpful to study the stress evolution and the possibility of rockbursts occurring in the surrounding rock under both high-temperature and high in situ stress conditions during tunnel excavation.
In tunnel excavation within a geothermally rich area, the change in temperature after excavation greatly influences the stress distribution and mechanical properties of the surrounding rock [5,6,7,8]. In recent years, many studies have focused on the effect of high temperature on rock damage; however, relatively few studies have focused on the influence of temperature on rockbursts [9,10,11]. Akdag et al. [12] studied the effect of thermal damage on the rockburst strain of brittle rock under true triaxial loading, in which the specimens were uniformly heated to a specified temperature and then allowed to cool naturally to room temperature, after which the strain burst tests were performed on the cooled samples. The results indicated that thermal damage caused a delay in rockbursts but demonstrated more intense strain burst behavior when the preheating temperature increased from 100 to 150 °C. Li et al. [13] et al. developed a rockburst device under the thermodynamic coupling condition, and the results indicated that the increase in temperature enhances rockbursts; however, their experiment was performed under a uniform temperature condition, and cement, not rock, was used in the experiments, making the conditions unlike those in practical rock engineering. Yan et al. [14] estimated the temperature distribution of a tunnel at different depths according to the measured data from the Sangzhulin tunnel on the Lhasa–Nyingchi railway, and the results showed that the temperature increases with the depth of the tunnel, resulting in an increase in the possibility of rockbursts.
Most studies have indicated that an increase in temperature in rock increases the probability of the occurrence of rockbursts [15,16]. However, rockburst experiments with preheating then cooling to room temperature (i.e., heating→cooling→testing) are not consistent with the practical situation in tunnel excavation engineering in geothermally rich areas where the tunnel surface exchanges heat with the air (i.e., excavation→cooling) and forms a thermal gradient in the surrounding rock. Such a gradient would lead to thermal stress in rock and change the stress distribution, and a change in conditions would likely impact the occurrence of rockbursts [17]. To date, there have been few studies on the influence of tunnel cooling caused by ventilation on the stress distribution and rockbursts in surrounding rock. To further understand the stress evolution and the rockburst mechanism in geothermally rich areas, this study begins by theoretically studying the influence of the change in temperature on rock failure and then numerically studies the stress evolution in excavated tunnels with high temperatures to analyze the possibility of rockbursts. The related parameters, such as the convective heat transfer coefficient, in situ stress and fault effect, on the stress distribution and rockbursts are discussed in detail. The main feature that differentiates this work from most previous studies is that the material is rock, the conditions are much closer to those of practical situations, and most parameters were collected from a practical engineering project. The results obtained in this study are beneficial for the control of rockbursts in tunnels in geothermally rich areas.
2. Theoretical Studies on Failure Caused by Decreasing Temperature
After a tunnel is excavated in a geothermally rich area, the temperature of the tunnel surface will decrease over time according to the ventilation of the tunnel, and then the thermal gradient stress will be generated gradually.
The heat conduction equation in the surrounding rock is shown in Equation (1). The adiabatic boundary condition is shown in Equation (2). The boundary condition for convective heat transfer on the tunnel surface is shown in Equation (3) [18].
where are the thermal conductivities in the x, y, and z directions, respectively, ρ is the density, C is the specific heat, Q is the heat generation rate, is the convective heat transfer coefficient, is the fluid temperature, and T is the temperature field function.
The constitutive equations of the surrounding rock are as follows:
where , and are the three effective principal stresses; , and are the three principal strains; λ is the Lame constant; G is the shear modulus; and E is the elastic modulus; and μ is Poisson’s ratio. β = (3λ + 2G) α, where α is the coefficient of thermal expansion. is the change in temperature, which is written as ( is the initial temperature, which may be positive or negative).
The Mohr circle equation at a point can be written as follows:
where and are the normal and shear stresses on the failure plane, respectively.
Once the highly geothermal surrounding rock is excavated and starts to cool, the effective principal stresses , and can be written as follows:
where are the three principal stresses before cooling.
Substituting Equations (8) and (10) into Equation (7), as the following can be obtained:
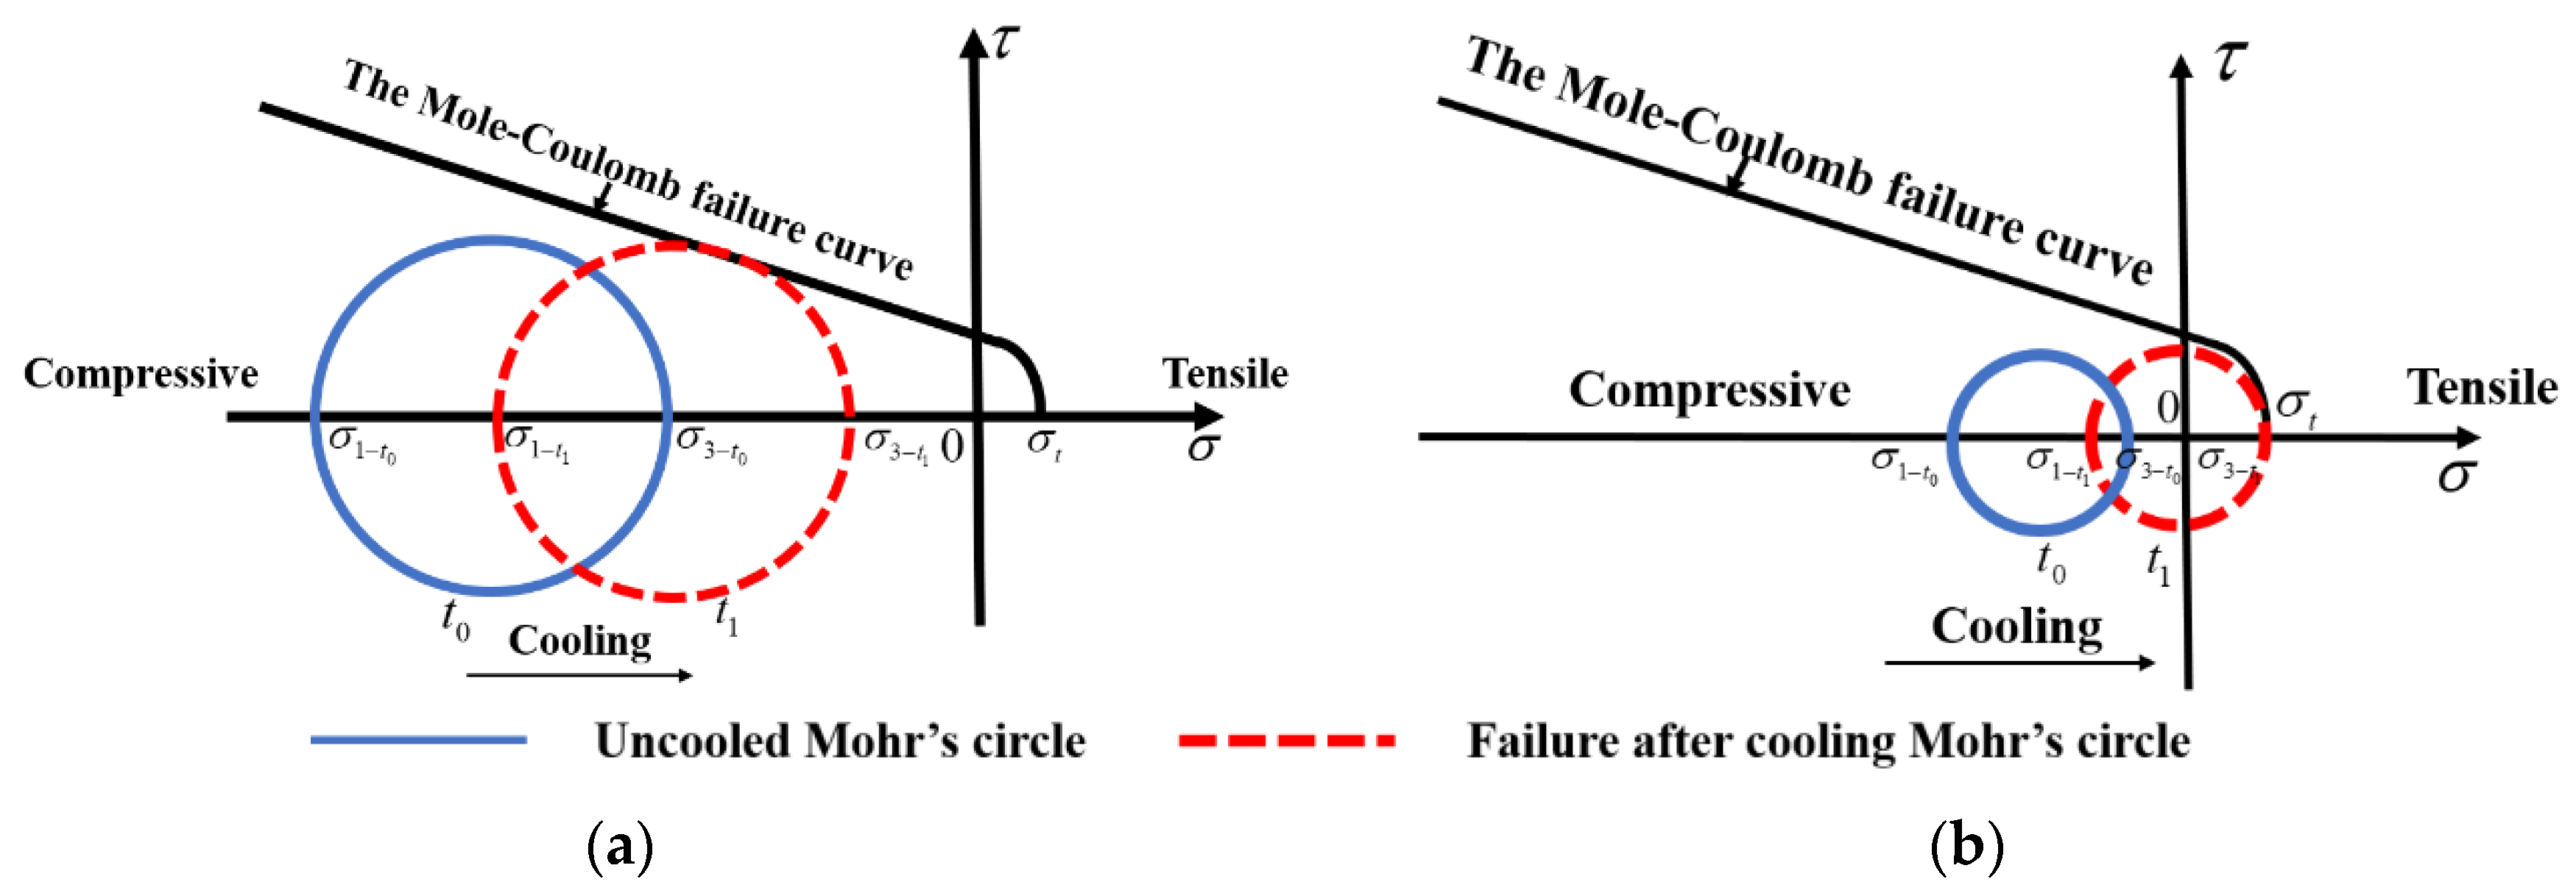
The Mohr–Coulomb criterion is used to judge whether rock failure occurs [19]. Figure 2 shows how the Mohr circle moves after cooling (only is variable) in Equation (11). This indicates that in cooling (t0 → t1), the Mohr circle moves and approaches the Mohr–Coulomb failure curve until it intersects with the curve, which is the point of rock failure. Meanwhile, when the deviatoric stress ( − ) is greater, the Mohr circle intersects the Mohr–Coulomb failure curve in the compressive area after cooling, and shear failure occurs in the rock (see Figure 2a). Similarly, when the deviatoric stress ( − ) is smaller, the Mohr circle intersects the Mohr–Coulomb failure curve in the tensile area after cooling, and tensile failure occurs in the rock (see Figure 2b). The results show that the forms of rock failure caused by cooling are different under different deviatoric stresses. At the same time, the above results show that ventilation and cooling may lead to damage to the tunnel wall after the excavation of a high-temperature tunnel, and the degree of cooling needs to be given special attention.
3. Model of Tunnel Excavation
3.1. Verification of the Accuracy of the Numerical Method
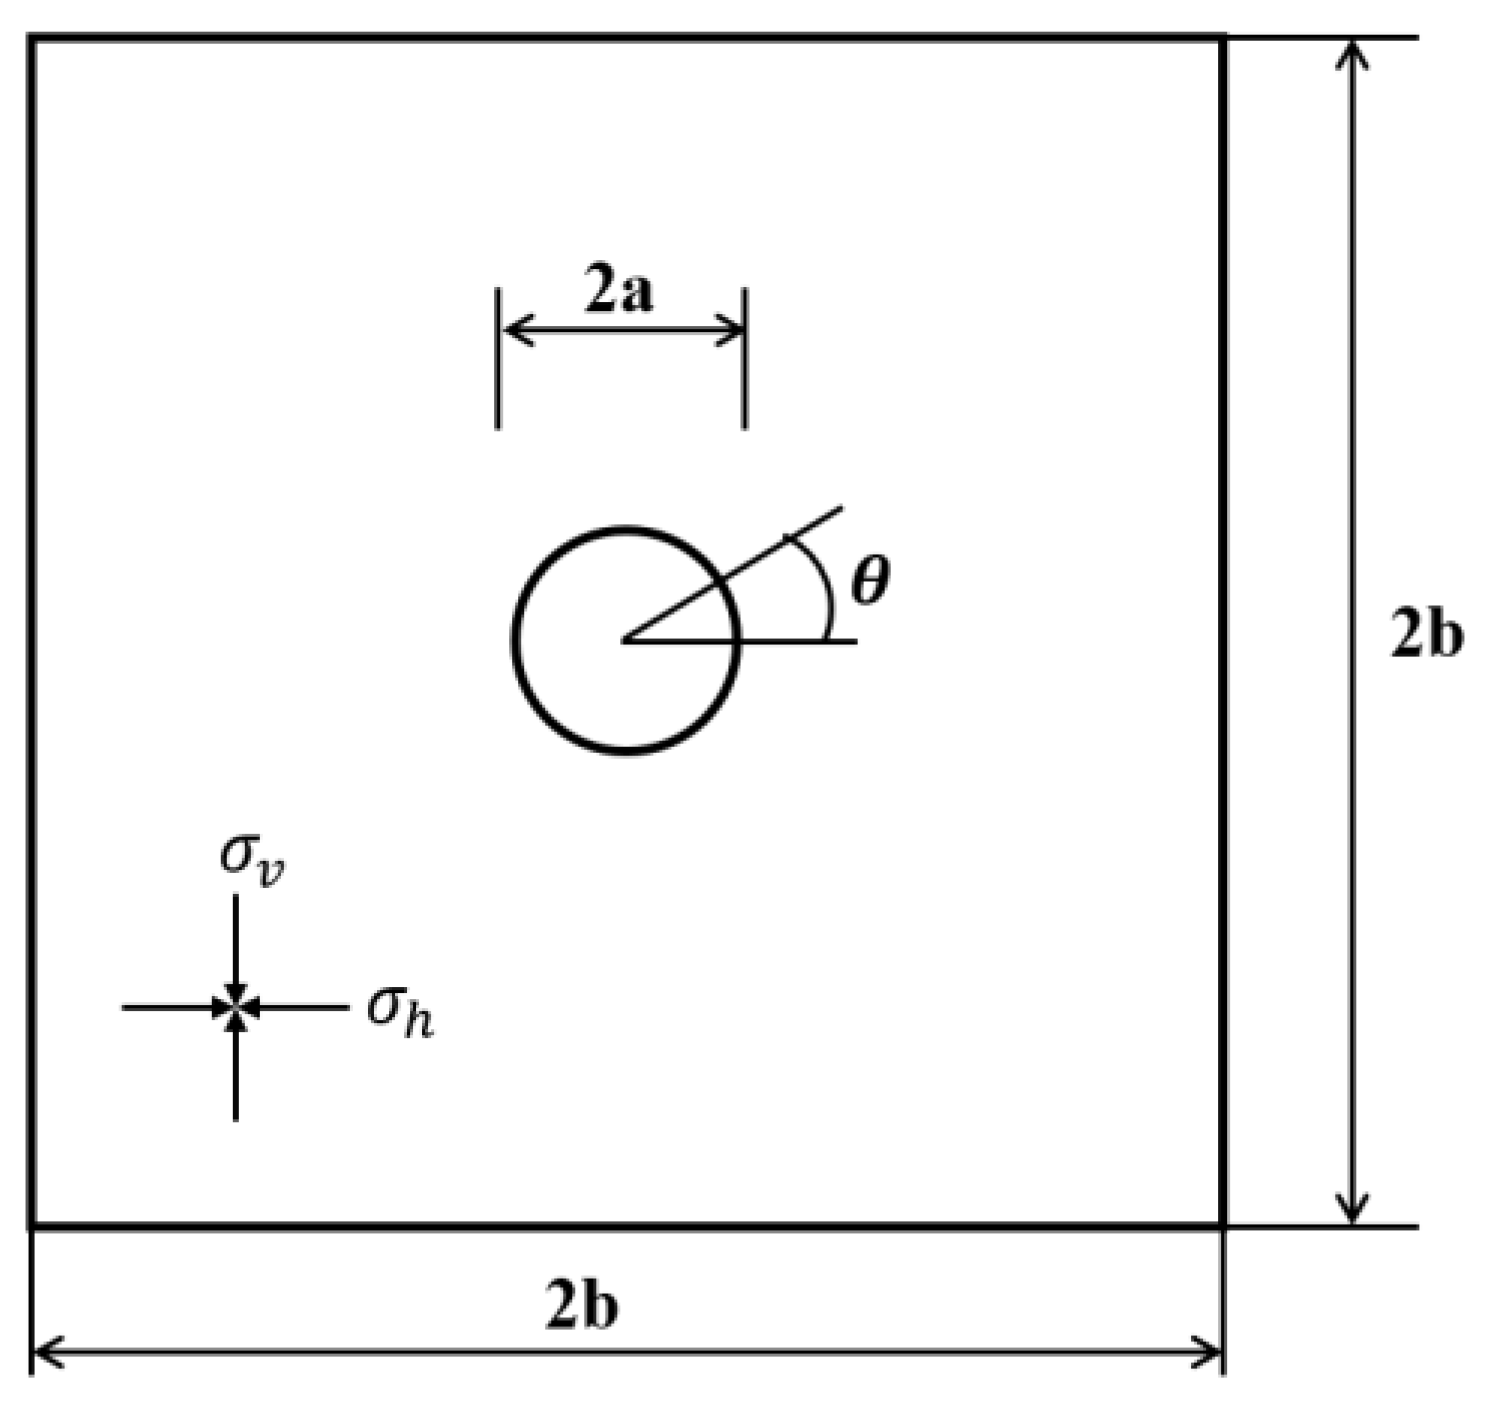
To verify the accuracy of the numerical simulation method, a model of the inner plate with a hole under the combined action of heat and external force is established for verification (see Figure 3).
The theoretical solution to the model can be seen in Equations (12)–(16):
is the temperature around the hole; is the outer boundary temperature; E is the elastic modulus; is Poisson’s ratio; a is the radius of the hole; b is half the length of the outer boundary; is the thermal expansion coefficient; is the horizontal stress; is the vertical stress; is the angle; r is the length along the diameter; and the thickness of the plate is 1 mm.
When considering the temperature–stress coupling process, the stress distribution near the hole is as follows:
Here, the parameters are set as follows: a = 30 mm; b = 750 mm; = 100 °C; = 0 °C; E = 50 GPa; = 0.24; = 10 MPa; = 15 MPa; and = 10−5 °C−1. The thermal conductivity of the rock is 10 W/(m·K), and the initial temperature of the whole model is 0 °C. Figure 4a–c shows the curves of the T, and results when = 0.
Figure 4 shows that the numerical simulation results can better conform to the theoretical results and can be used for engineering research.
3.2. Setting of the Model Calculation Parameters
Section 2 demonstrates that cooling may change the stress state of rock and cause rock damage. Next, we numerically simulate the temperature and stress evolution in the surrounding rock caused by cooling in geothermally rich tunnel excavation and then discuss the effect of cooling on rockbursts.
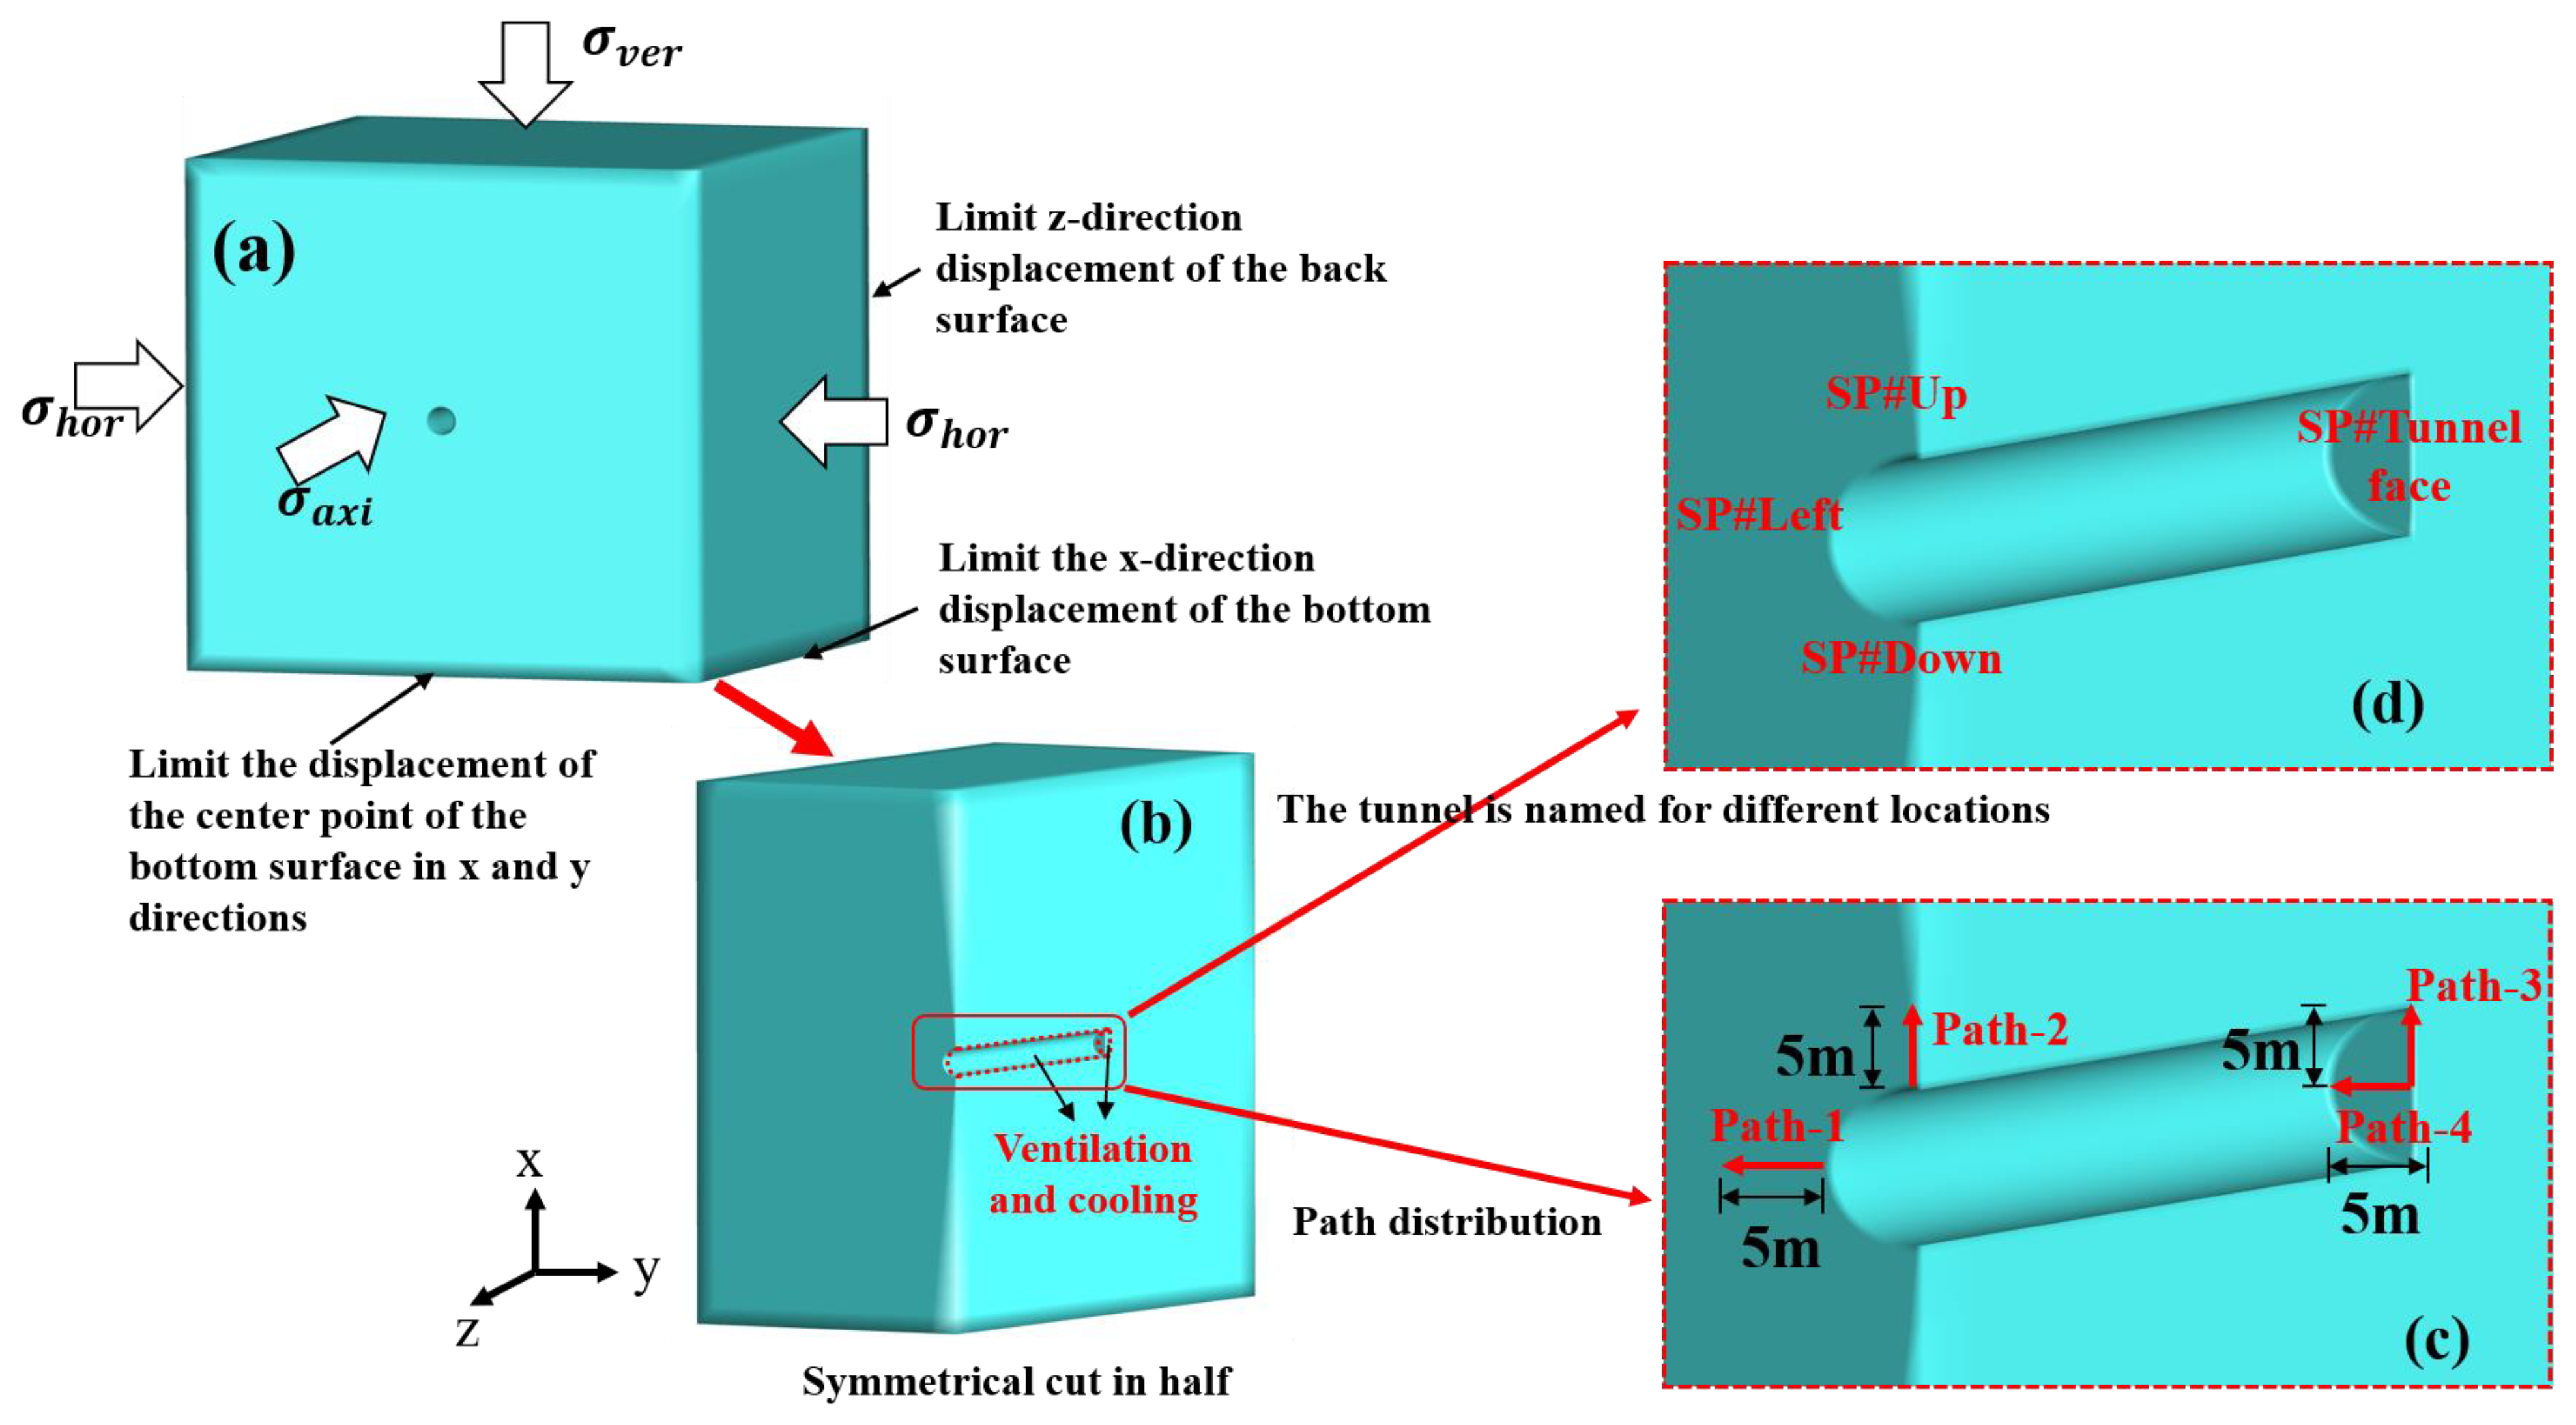
The overall size of the numerical model is 200 m × 200 m × 200 m, and the radius of the tunnel is 5 m, located at the center. The mechanical boundary conditions of the model consist of limiting the z-direction displacement of the back surface, the x-direction displacement of the bottom surface, and the x-direction and y-direction displacements of the center point of the bottom surface. In situ stress is applied on the other four outer surfaces without a displacement boundary (see Figure 5a). The initial temperature of the whole model is set to 80 °C. The adiabatic boundary is used for the other 6 outer surfaces of the model. A convective heat transfer temperature boundary is adopted for the working face and tunnel surface, and the ambient temperature is set to 20 °C (see Figure 5b). The overall model is shown in Figure 5a,b.
According to the existing geological survey data [20] of the Sichuan–Tibet railway, the material properties of the rock are set as follows: an elastic modulus of 50 GPa, a Poisson’s ratio of 0.24, a density of 2500 kg/m3, and a thermal expansion coefficient of rock of 8 × 10⁻⁶ °C−1. The thermal conductivity of the rock is 1.9 W/(m·K), and the specific heat is 750 J/(kg·K). The temperature at the initial moment of the model is 80 °C, the convective heat transfer coefficient at the working face and tunnel surface is set to 15 W·m−2·K−1, and the ambient temperature is 20 °C. is set to 25 MPa, is set to 20 MPa, and is set to 30 MPa.
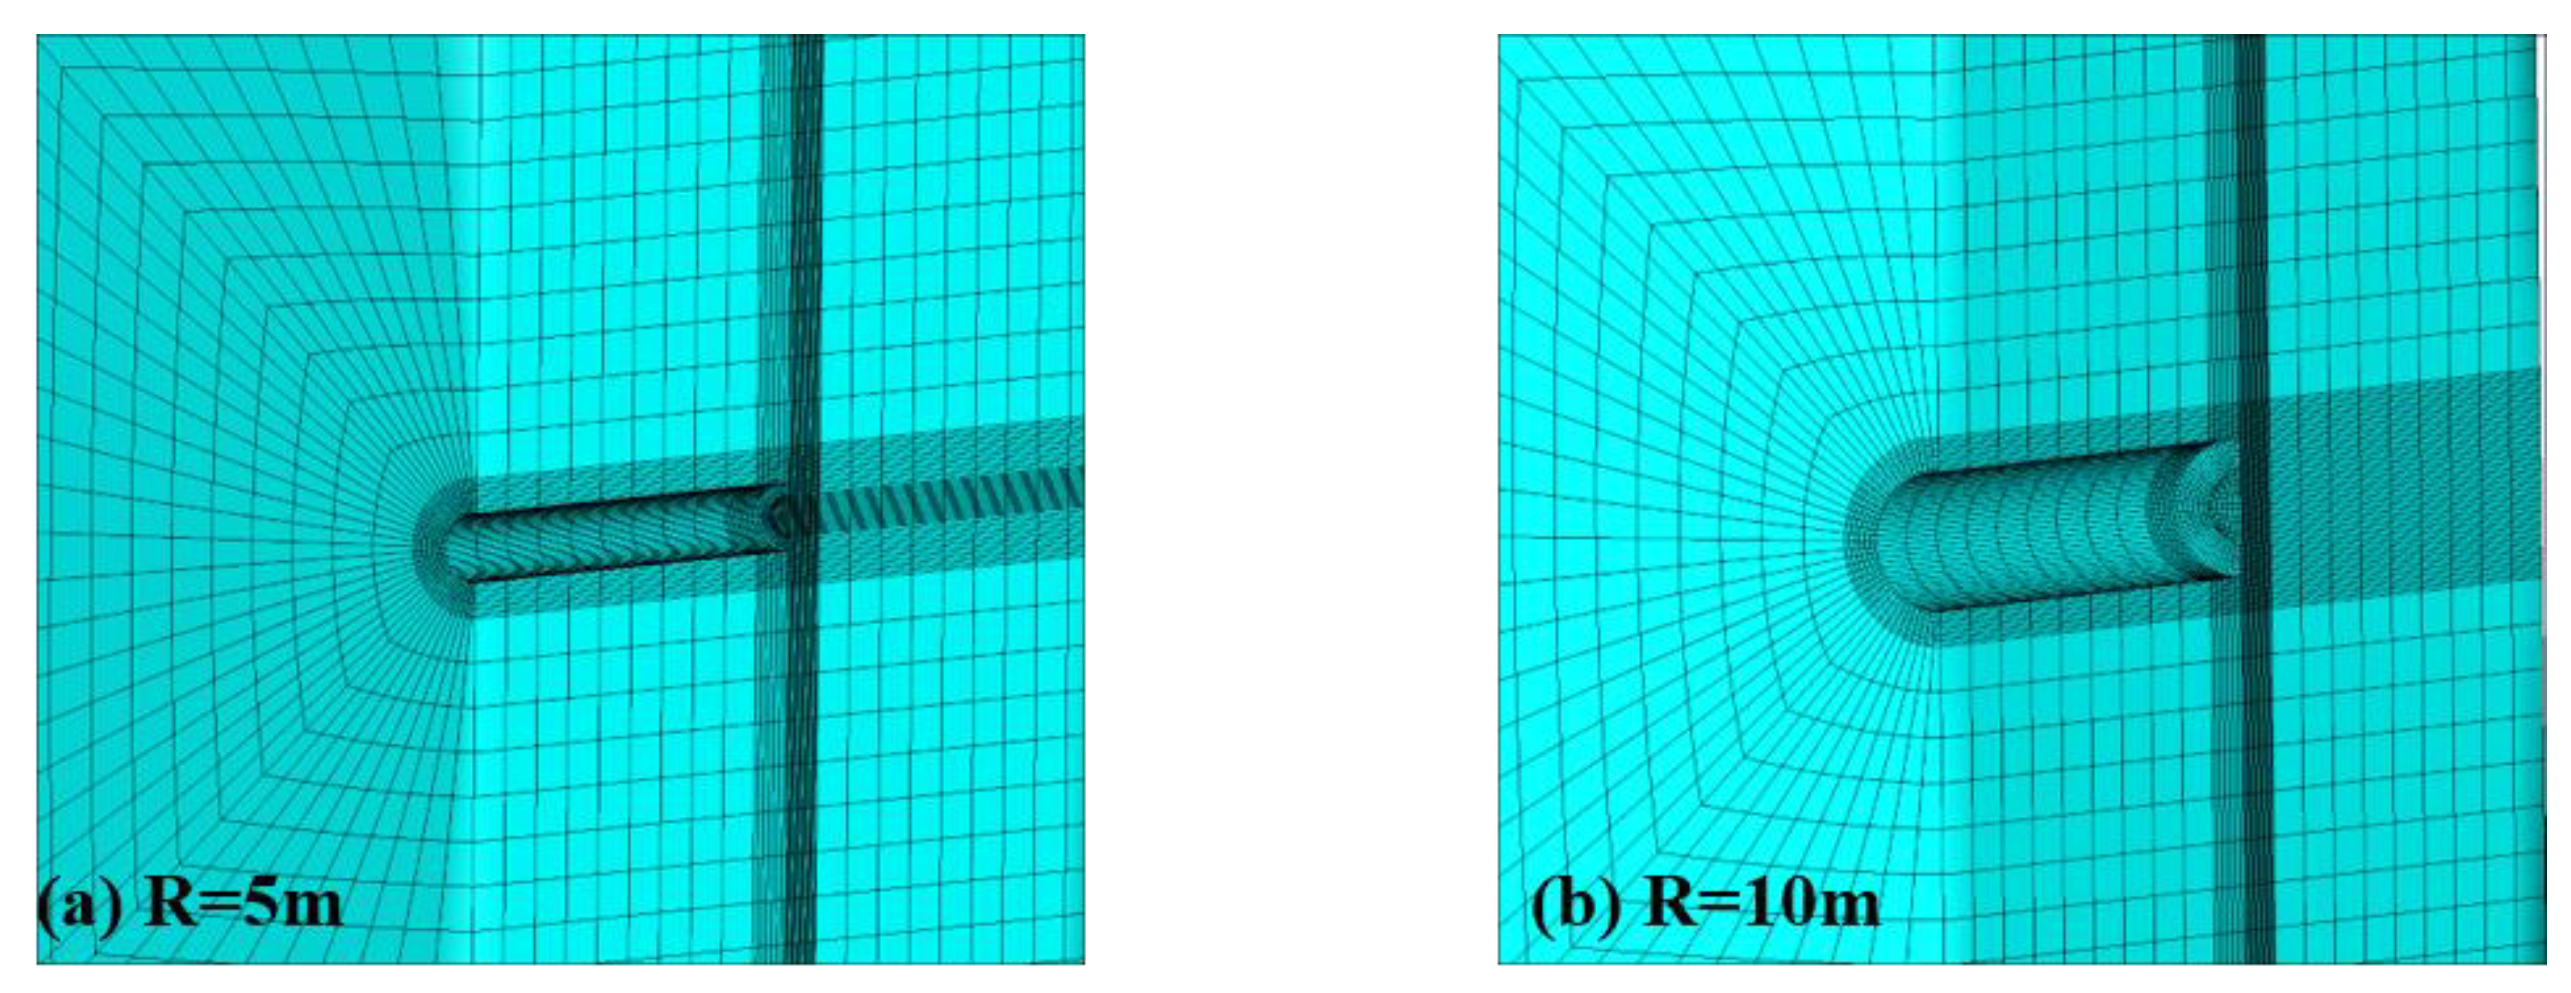
At the same time, another large tunnel model (R = 10 m) is established and compared with the above tunnel model (R = 5 m) to discuss the influence of size on the tunnel rockburst tendency (see Figure 6). All parameters of the model (R = 10 m) are consistent with the original model (R = 5 m).
Of course, the results of numerical calculation may be different from those of the actual project, but the overall change trend is consistent with the reality. In this paper, the stress evolution process of the surrounding rock is briefly analyzed by a numerical method, and the influence of model accuracy is not further studied.
4. Numerical Results
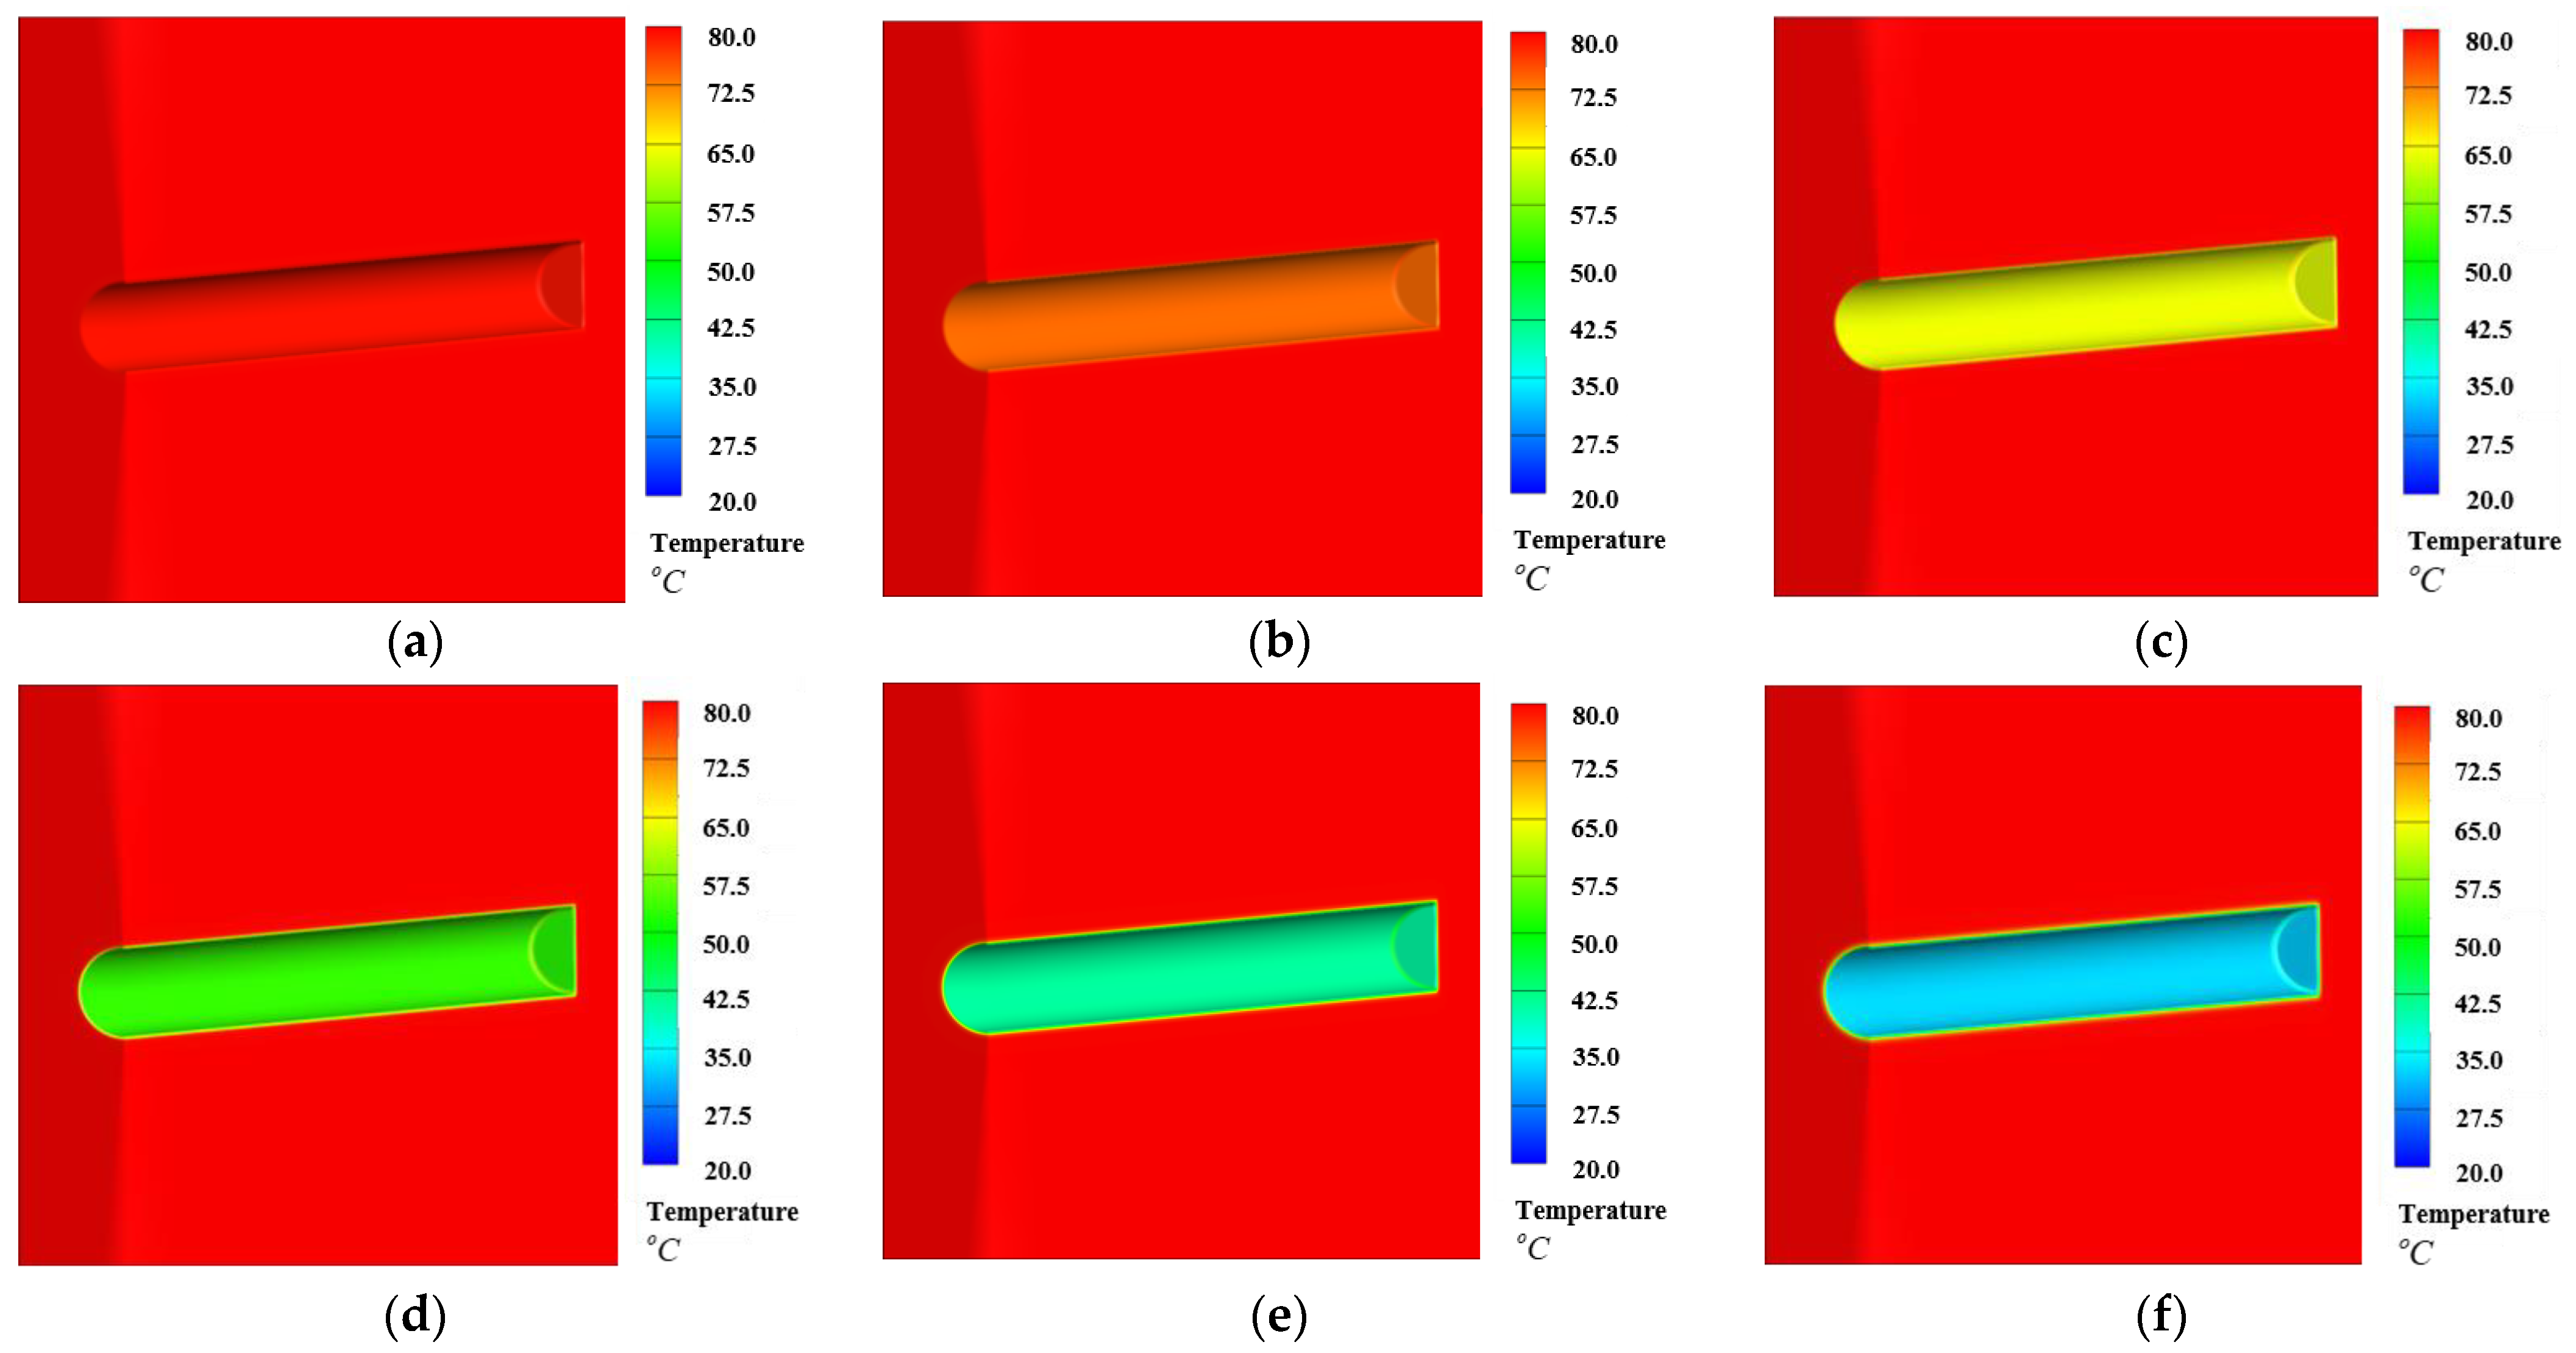
Figure 7 shows the temperature changes on the tunnel surface and working face over time. The comparison of Figure 7a,b shows that because the thermal conductivity of the rock is generally low, there is almost no change in the temperature of the tunnel wall (t = 0 h~1 h). As time continues (see Figure 7c–f), the temperature of the tunnel wall approaches the temperature of the convective air. Additionally, the temperature of the tunnel wall is close to 35 °C after a day of ventilation and cooling (see Figure 7f), and the cooling process is relatively slow.
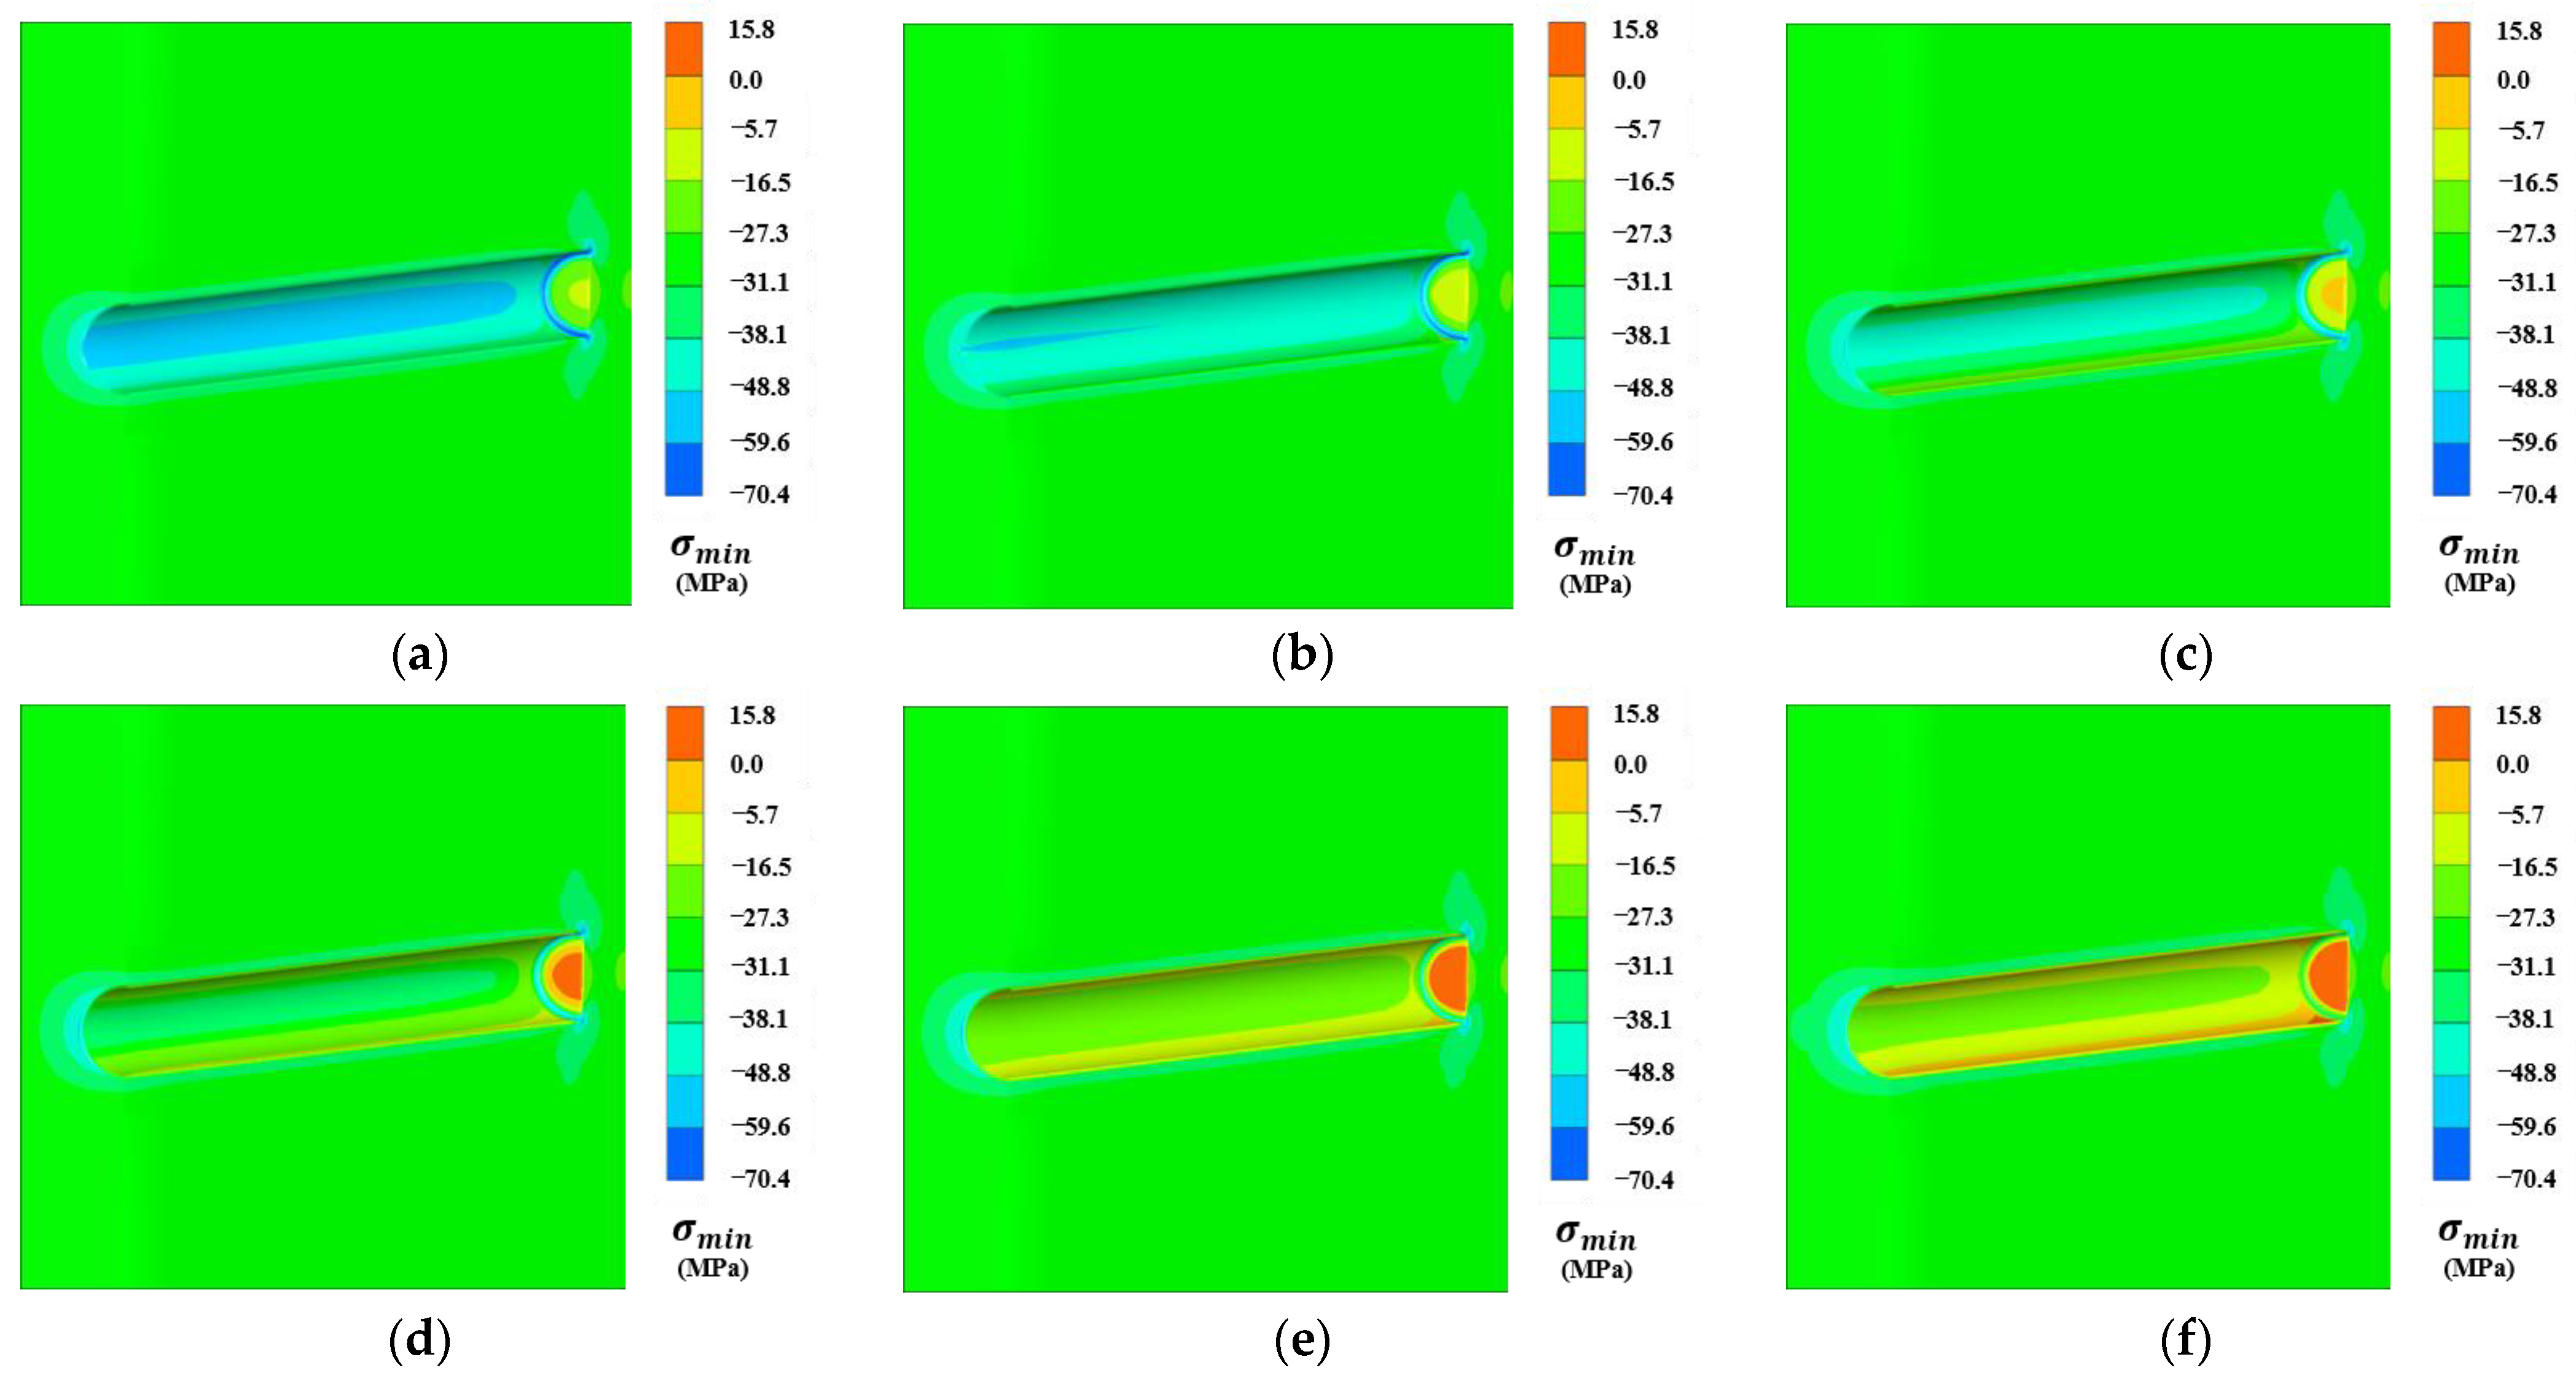
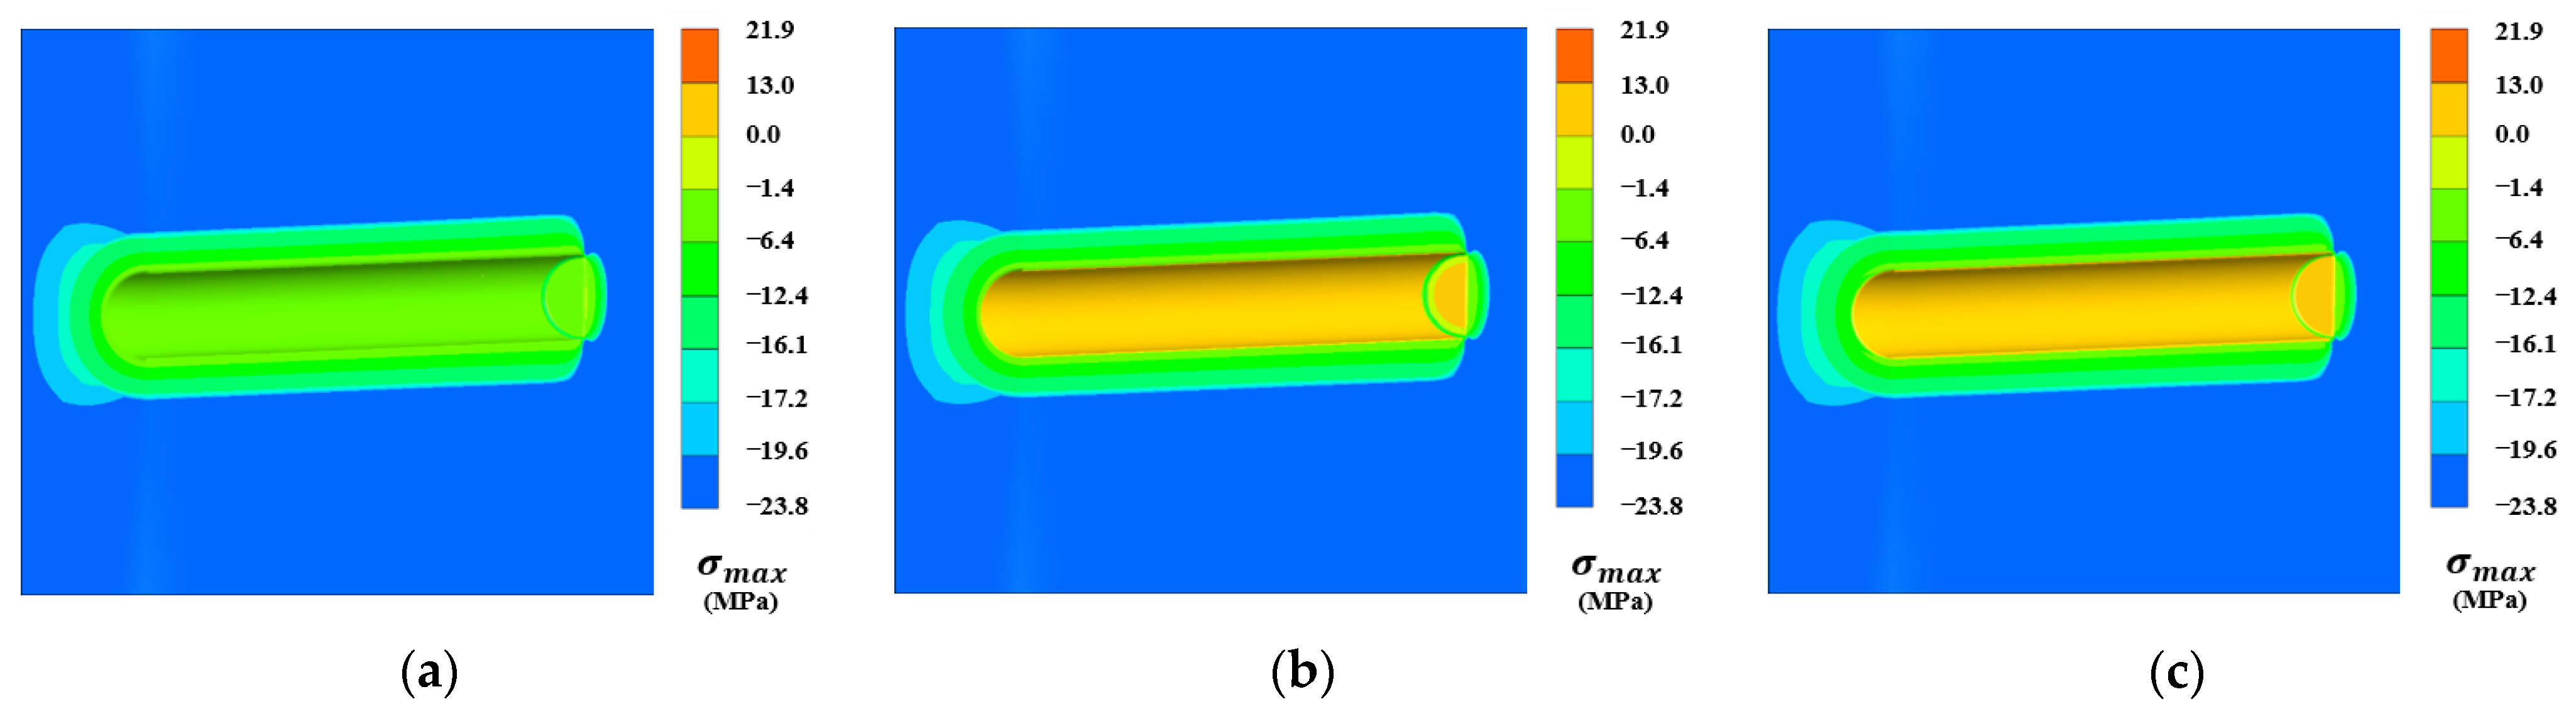
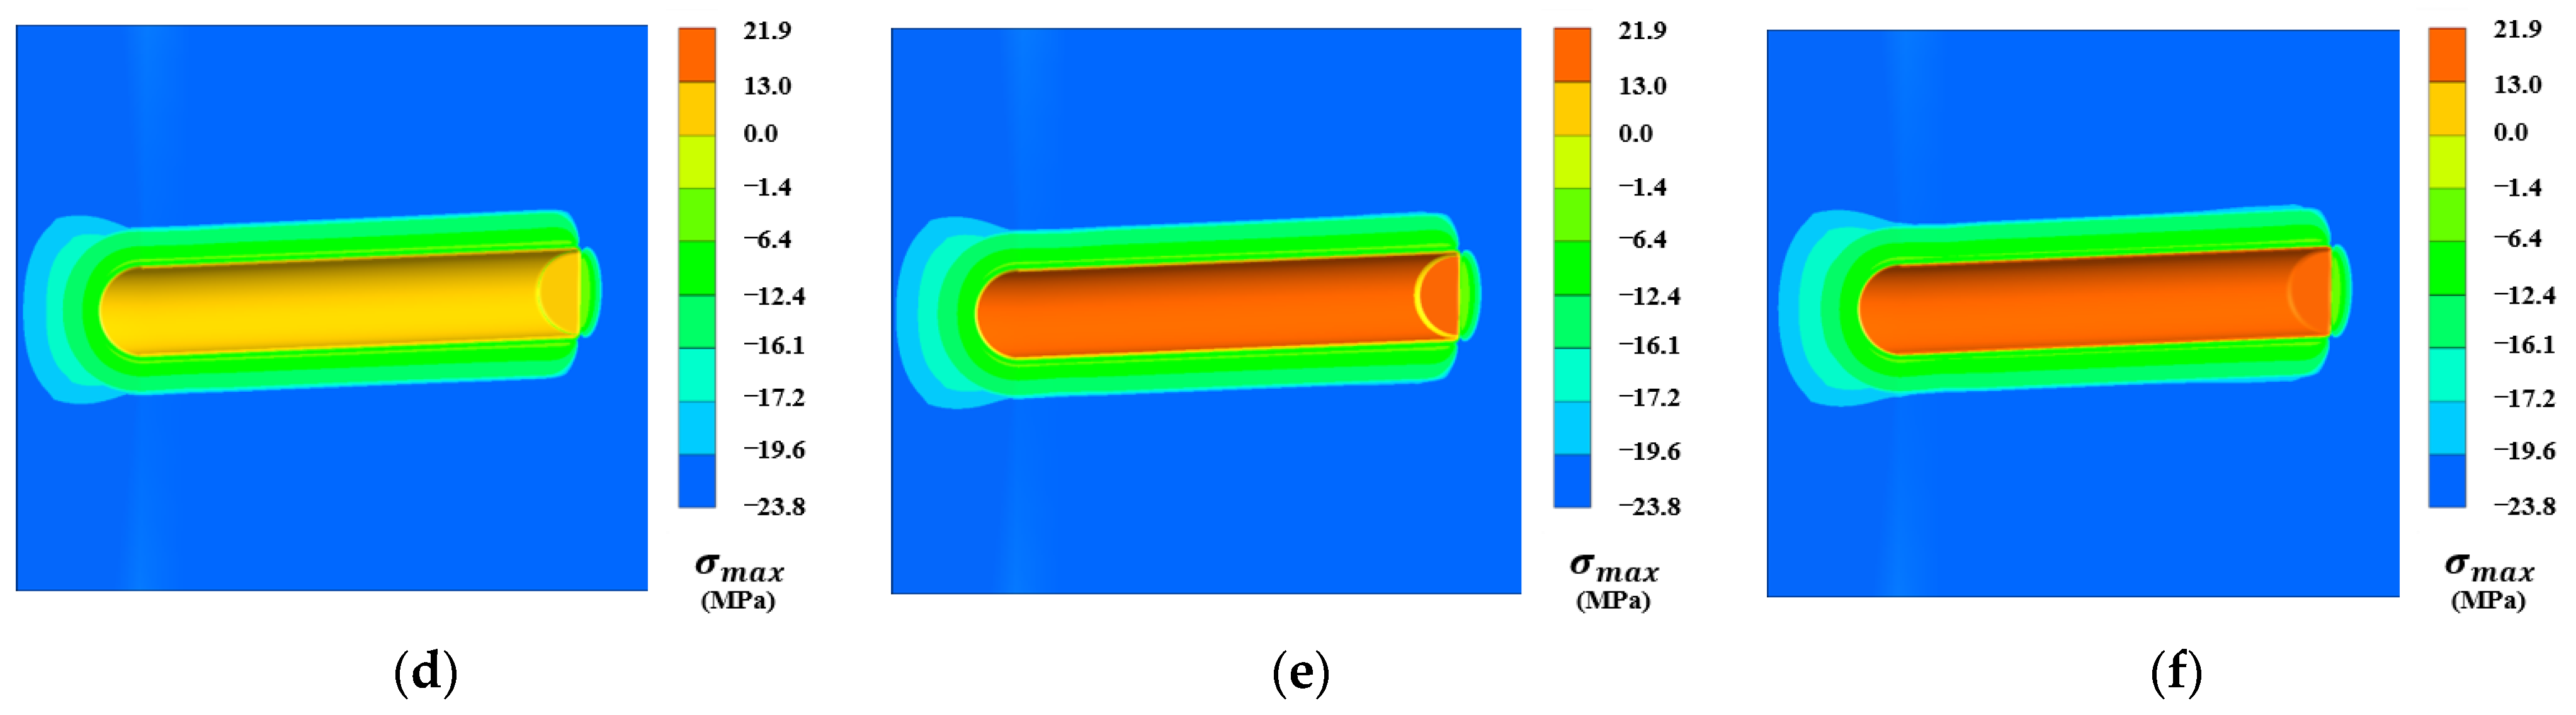
Figure 8 and Figure 9 show the change in stress of the surrounding rock during the process of cooling. In the early period of cooling (t = 0~1 h) (see Figure 8a and Figure 9a), the changes in the two principal stresses on the SP#Tunnel face (the different locations of the tunnel model are named in Figure 5d) and the tunnel wall are small. Both the maximum and the minimum principal stresses are compressive stresses. There are obvious stress concentration phenomena on the left sides of the SP#Tunnel face, and the compressive stress can reach 70 MPa (see Figure 5a). These locations of concentrated stress are highly susceptible to rockbursts [21,22]. Figure 8b–f shows that with the cooling of the tunnel (t = 1~24 h), the minimum stress (compressive) on the tunnel wall decreases gradually, including these locations of concentrated stress, which indicates that the possibility of rockbursts is reduced, so the cooling of the tunnel has an inhibitory effect on rockbursts. Figure 9b–f shows that the maximum stress changes due to cooling. In the process of cooling (t = 1~24 h), the maximum stress of the tunnel wall and SP#Tunnel face changes from compressive stress to tensile stress. At t = 24 h (see Figure 9f), the maximum tensile stress on the tunnel face can reach 21.9 MPa, and the whole tunnel wall is in tension (the maximum stress), which indicates that the rock may fail in the process of cooling according to Section 2. This implies that long-term cooling is not conducive to the stability of the tunnel in the long term.
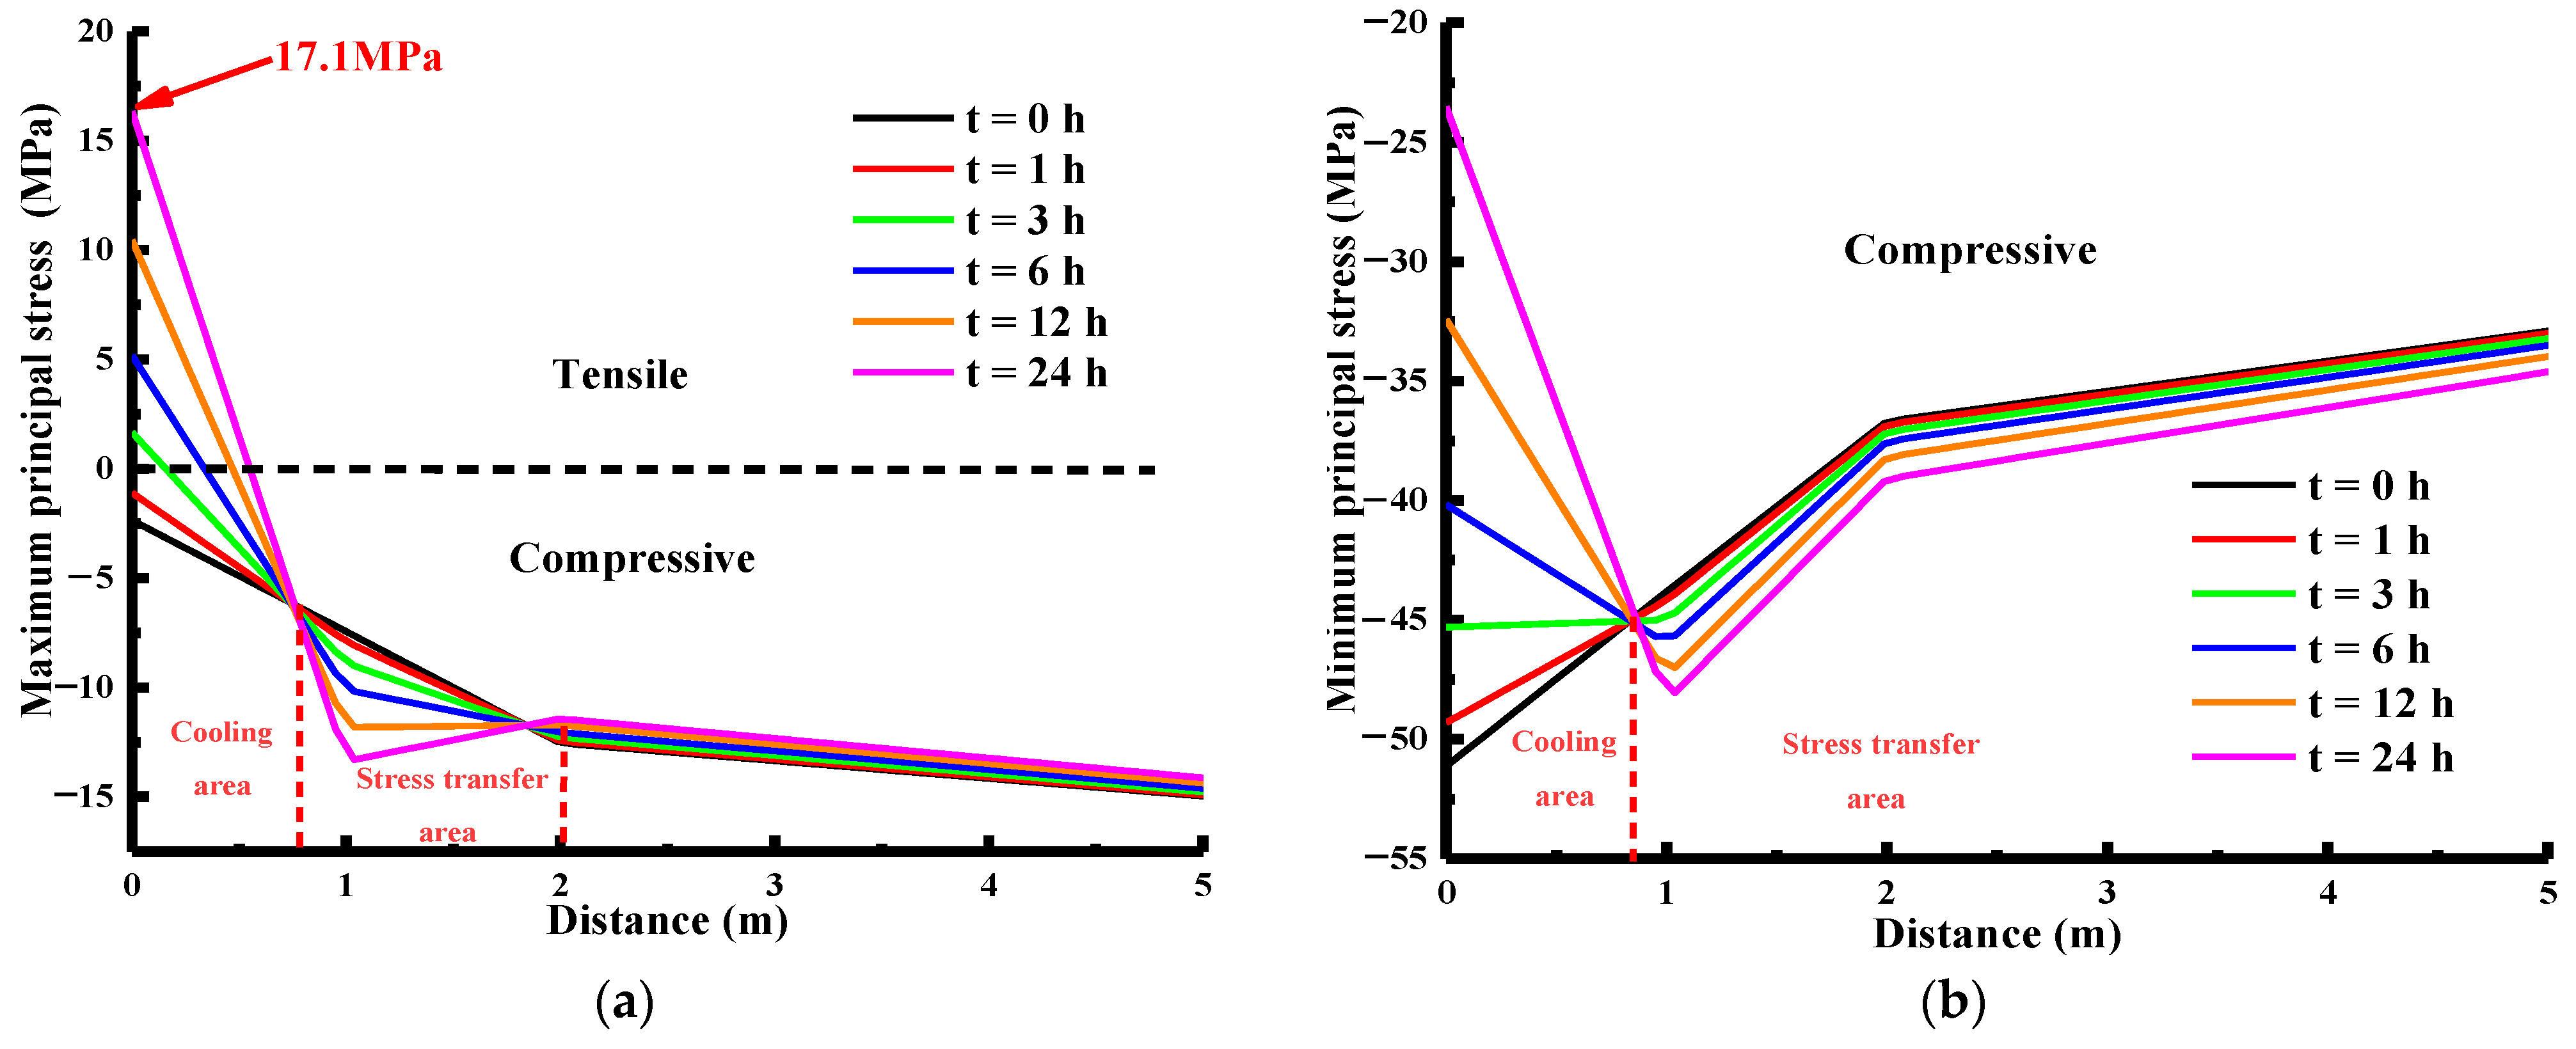
To study the evolution of stress in detail, four paths are chosen, as indicated in Figure 5c. The length of the arrow is 5 m, the starting point of the arrow represents the 0 m position point of the horizontal axis of the coordinate, and the ending point represents the 5 m position of the horizontal axis. First, we discuss the evolution of the two principal stresses of Path 1 at t = 0~24 h. Figure 10a shows the trend of the maximum principal stress in Path 1 after cooling. The maximum principal stress (compressive) on the tunnel wall (0 m position) is decreasing at t = 0~1 h, and it starts converting from compressive stress to tensile stress at t = 1~3 h. As cooling continues (t = 3~24 h), the maximum principal stress (tensile) starts increasing and can reaches 17.1 MPa (red arrow in Figure 10a). Figure 10b shows the trend of the minimum principal stress in Path 1 after cooling. The minimum principal stress (compressive) on the tunnel wall (0 m position) decreases at t = 0~24 h, and all minimum principal stresses in Path 1 are compressive, which differs from the maximum principal stress. Figure 10a shows that the maximum stress (compressive) value of some areas without cooling (see the stress transfer area in Figure 10a) increases with the cooling of the tunnel wall, and there is an obvious phenomenon of stress transfer. The same phenomenon can also be seen in Figure 10b. This is due to cooling causing the formation of a temperature gradient in the rock [17]. For the cooling area of the rock, the thermal stress is tensile stress, and for the uncooled rock near the cooling area, the thermal stress is compressive stress. However, cooling has an inhibitory effect on the occurrence of rockbursts. Figure 10c,d show the evolution of the two principal stresses in Path 2 after cooling. Comparing Figure 10c,d and Figure 10a,b shows that the trends of the two principal stresses in Path 2 are similar to those in Path 1, so they are not be explained in detail. The above results indicate that to improve the overall stability of the tunnel, the tunnel should be supported before cooling for 3 h (when tensile stress appears) to prevent rock instability and fracture in the later stage.
Figure 10e,f show the curves of the maximum and minimum principal stresses of Path 3, respectively. Figure 10e shows that with the cooling of the tunnel, the maximum principal stress (compressive) on the SP#Tunnel face starts decreasing at t = 0~1 h, and it starts converting from compressive stress to tensile stress at t = 1~3 h. As cooling continues (t = 3~24 h), the maximum principal stress (tensile) increases. Figure 10f similarly shows that with the cooling of the tunnel, the maximum principal stress (compressive) on the SP#Tunnel face starts decreasing at t = 0~6 h, and it starts converting from compressive stress to tensile stress at t = 6~12 h. As cooling continues (t = 12~24 h), the maximum principal stress (tensile) increases. The rock is in a three-dimensional tension state on the SP#Tunnel face at t = 12~24 h, so the rock will fail before cooling for 12 h. The stress evolution trend of Path 4 (Figure 10g,h) is similar to that of Path 3. Compared with that of the tunnel wall, the rock on the SP#Tunnel face is more susceptible to failure and damage. Therefore, the tunnel face should be excavated earlier to prevent subsequent cracks from affecting the construction period.
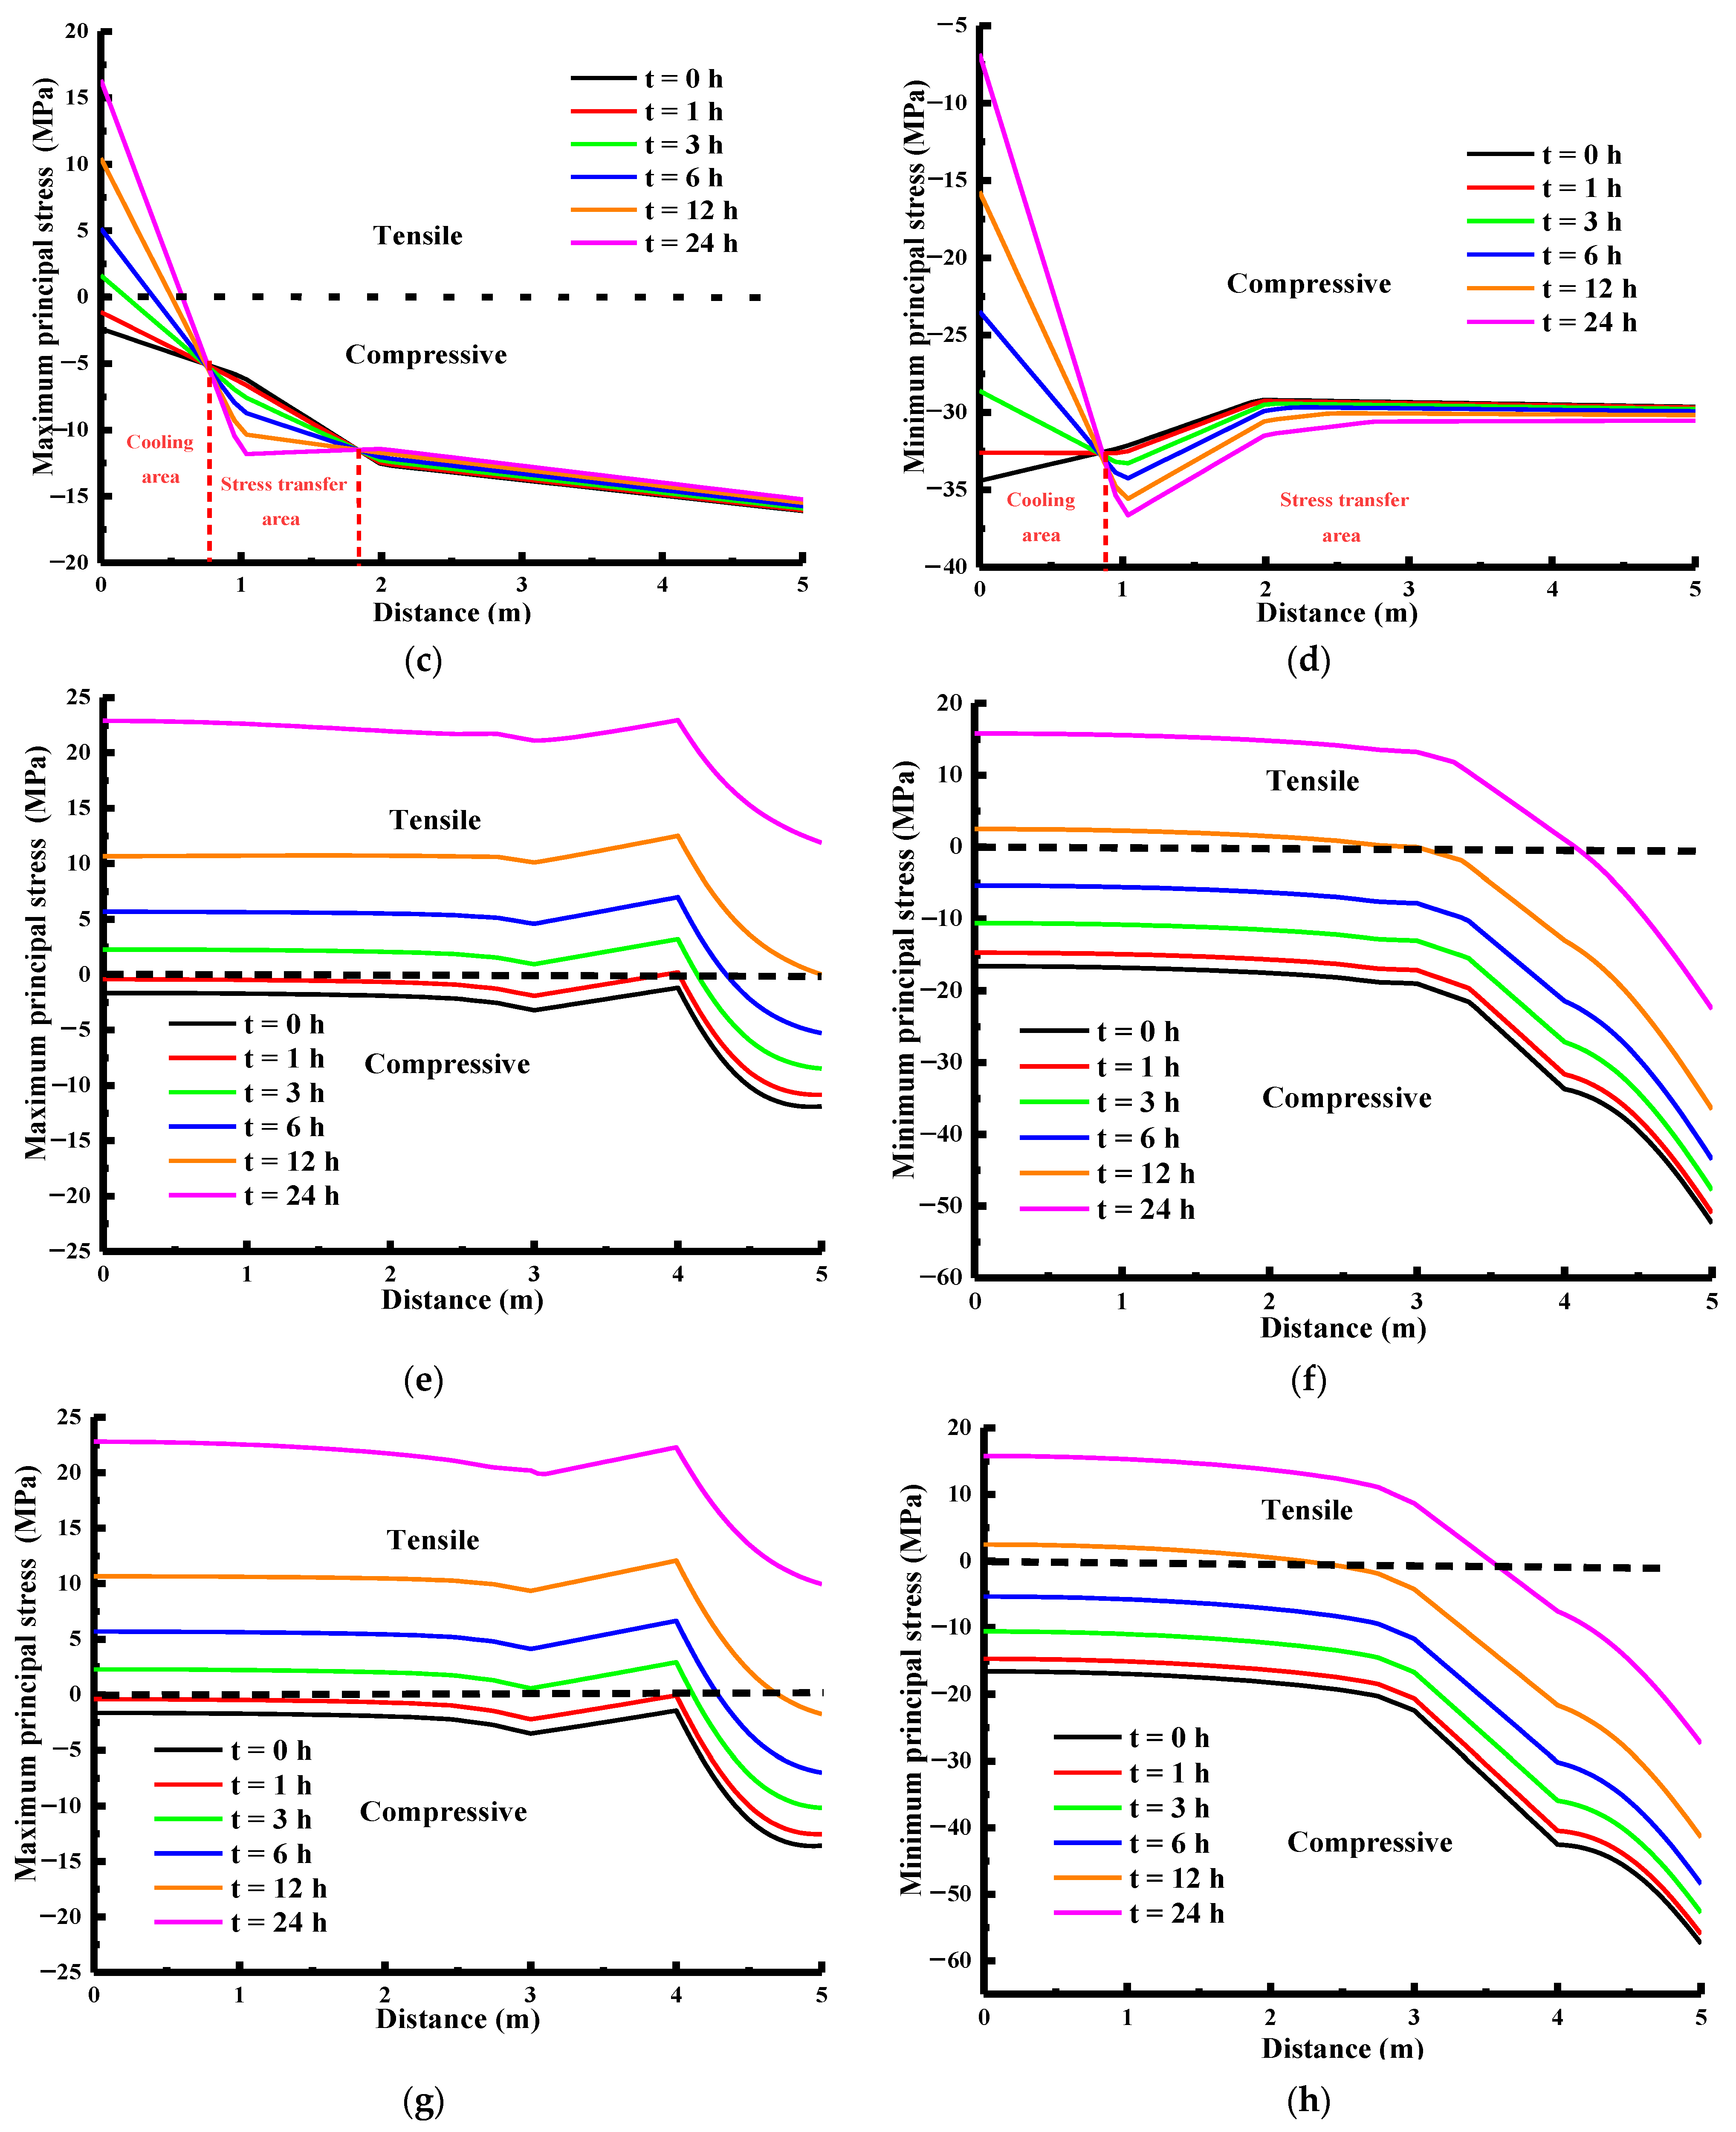
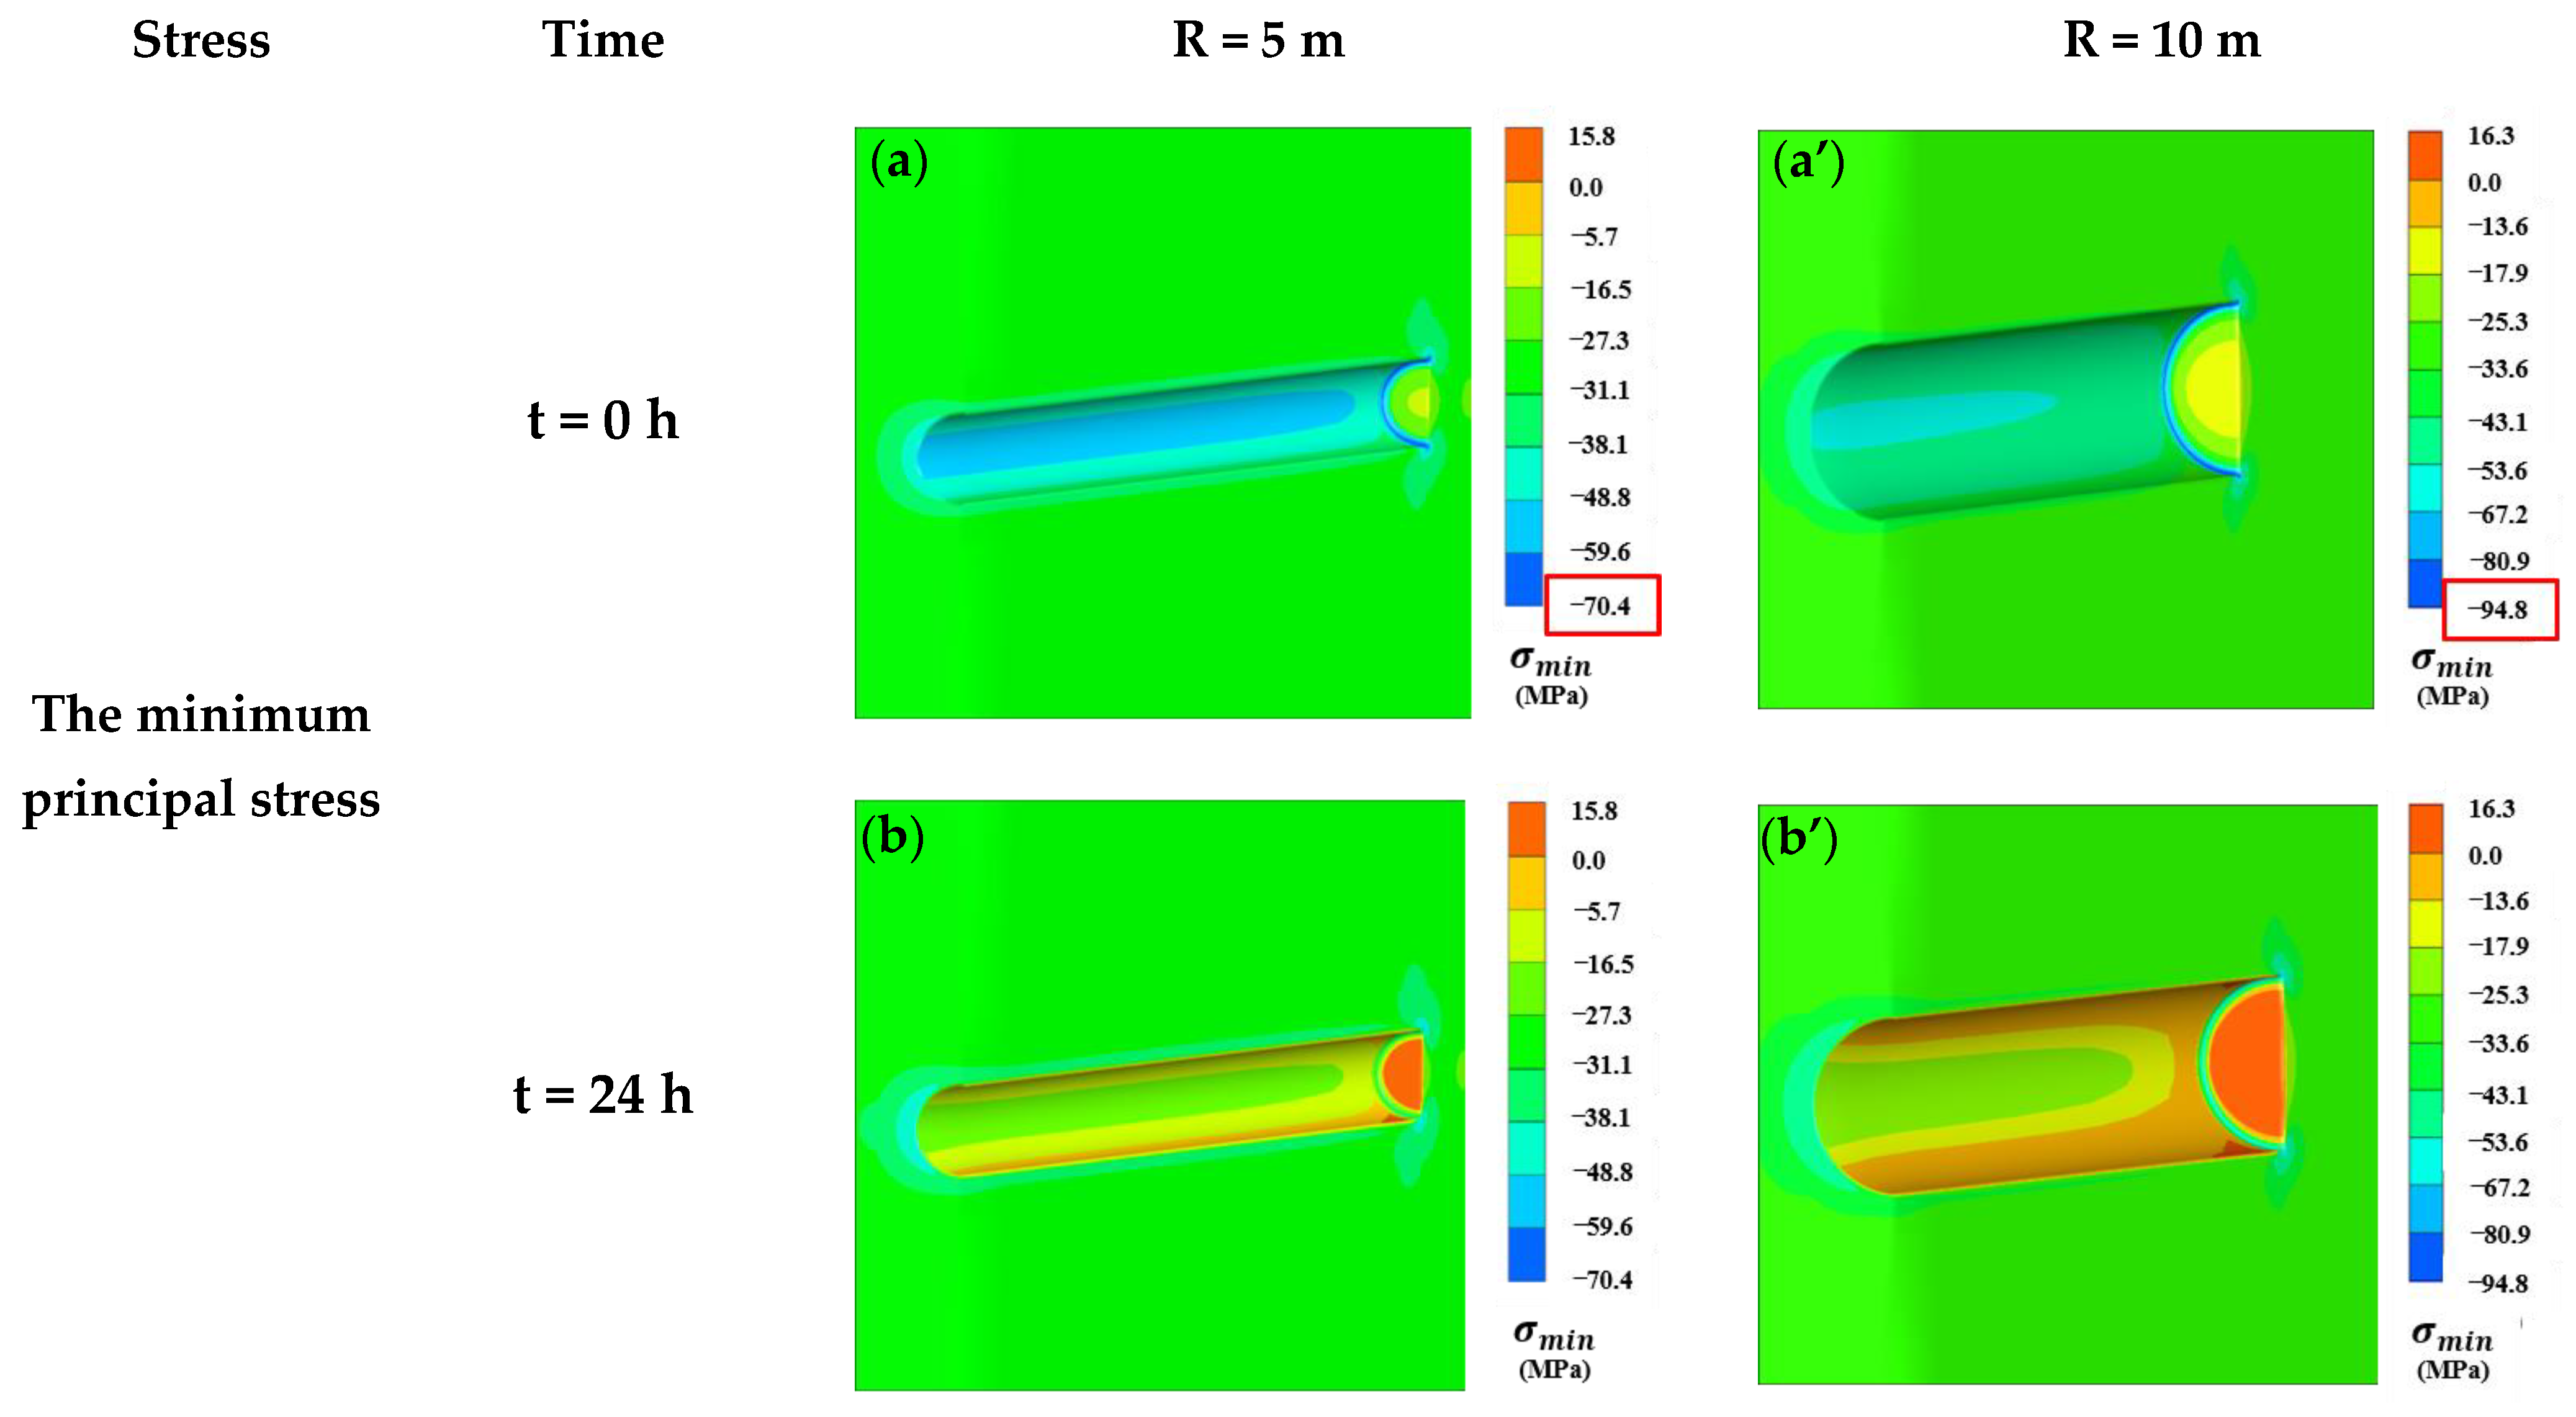
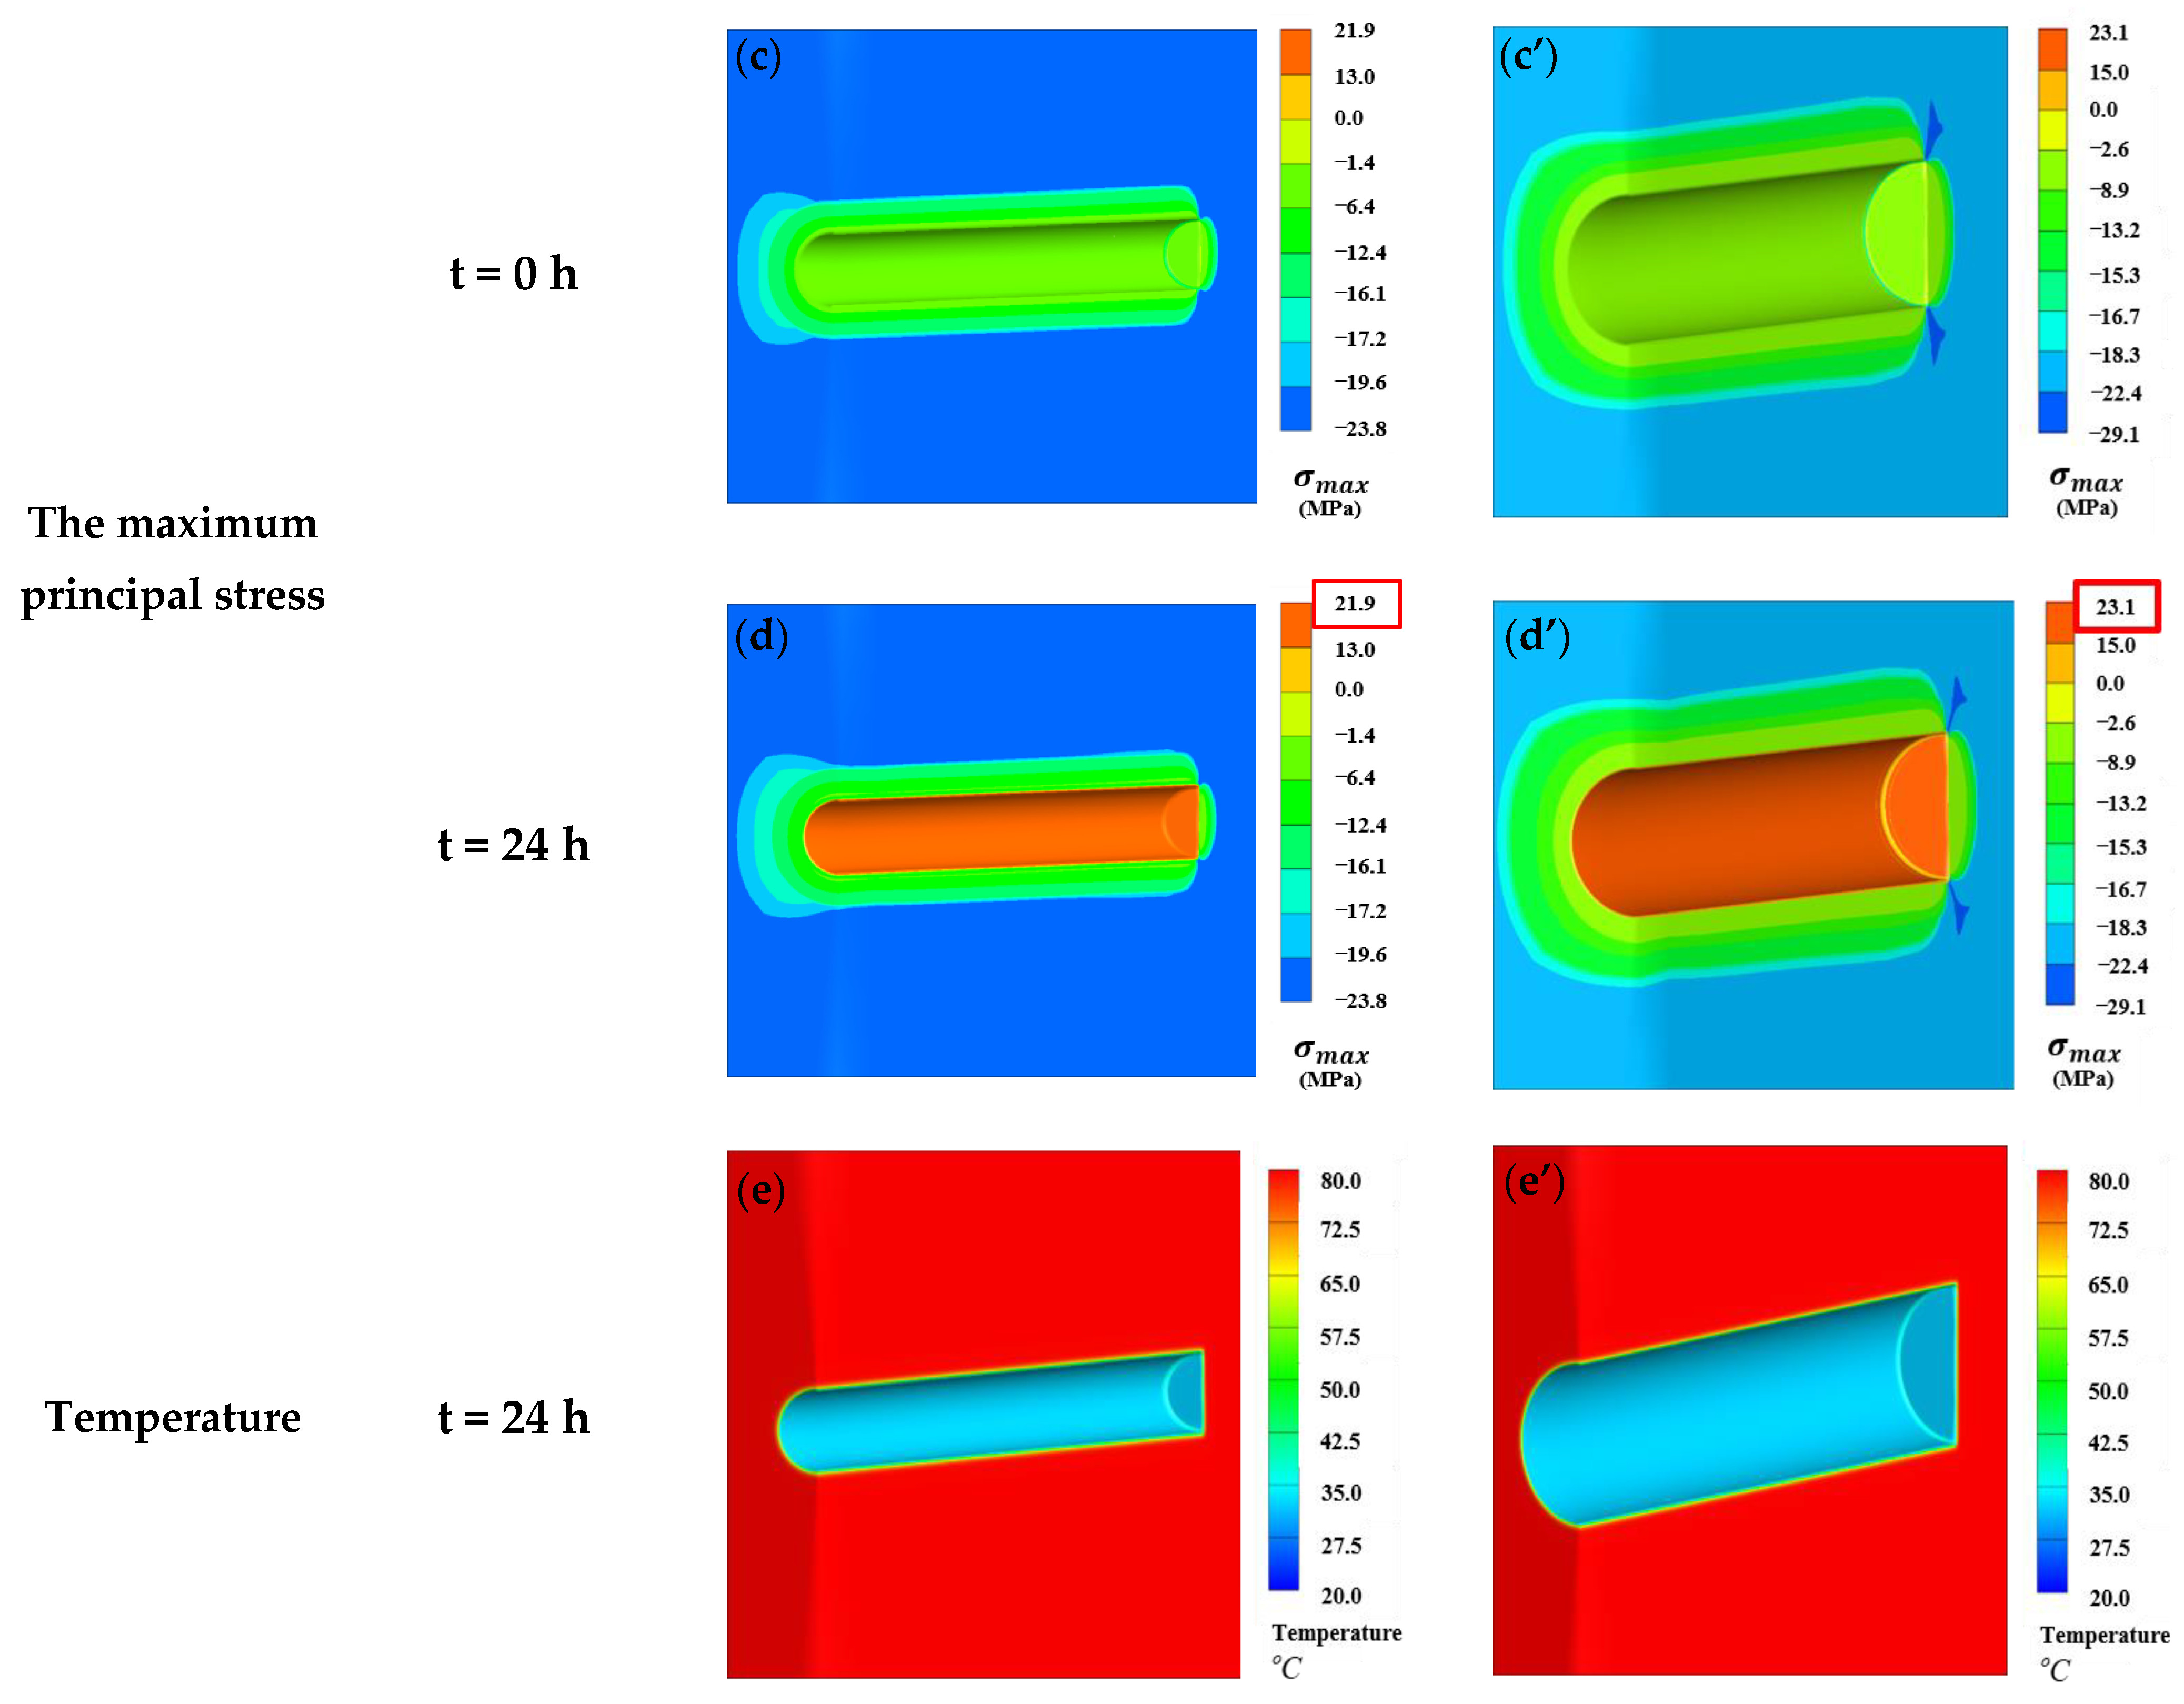
Figure 11 shows the temperature and the distribution of maximum and minimum principal stresses for tunnels with radii of 5 and 10 m. The comparison between Figure 11a–e and Figure 11a’–e’ shows that the minimum principal stress, maximum principal stress and temperature distribution behave similarly during cooling for tunnels with radii of 5 and 10 m. Figure 11a,a’ show that the stress at locations of concentrated stress in the large tunnel (R = 10 m) can reach 94.8 MPa (see the red box in Figure 11a’), but the stress of the small tunnel (R = 5 m) only reaches 70 MPa at t = 0 h; thus, it can be inferred that rockbursts more easily occurs in the large tunnel than in the small tunnel. When the tunnel is cooled for 24 h, the maximum stress in the large tunnel (R = 10 m) also converts from compressive stress to tensile stress (see Figure 11d,d’), and the maximum tensile stress can reach 23.1 MPa (see the red box in Figure 11d’), which is also larger than that of the small tunnel (R = 5 m). This indicates that rock failure more easily occurs in large tunnels than in small tunnels. Taken together, the results show that when designing the tunnel size, the diameter should be as small as possible, while still maintaining functionality to effectively reduce the possibility of rockbursts and rock failure.
5. Discussion
5.1. Effect of the Convective Heat Transfer Coefficient
Timely ventilation and heat dissipation are the keys to ensuring project progress in tunnels in geothermally rich areas. Fans are often used for ventilation and cooling, and the number of fans and the wind speed also affect the convective heat transfer coefficient. Based on the selection basis of the heat transfer coefficient proposed by Almesri et al. [23] and Chen et al. [24], the analysis values of the heat transfer coefficient are set as follows: natural ventilation of 5 W·m−2·K−1, and forced convection of 15, 25, 35, and 45 W·m−2·K−1.
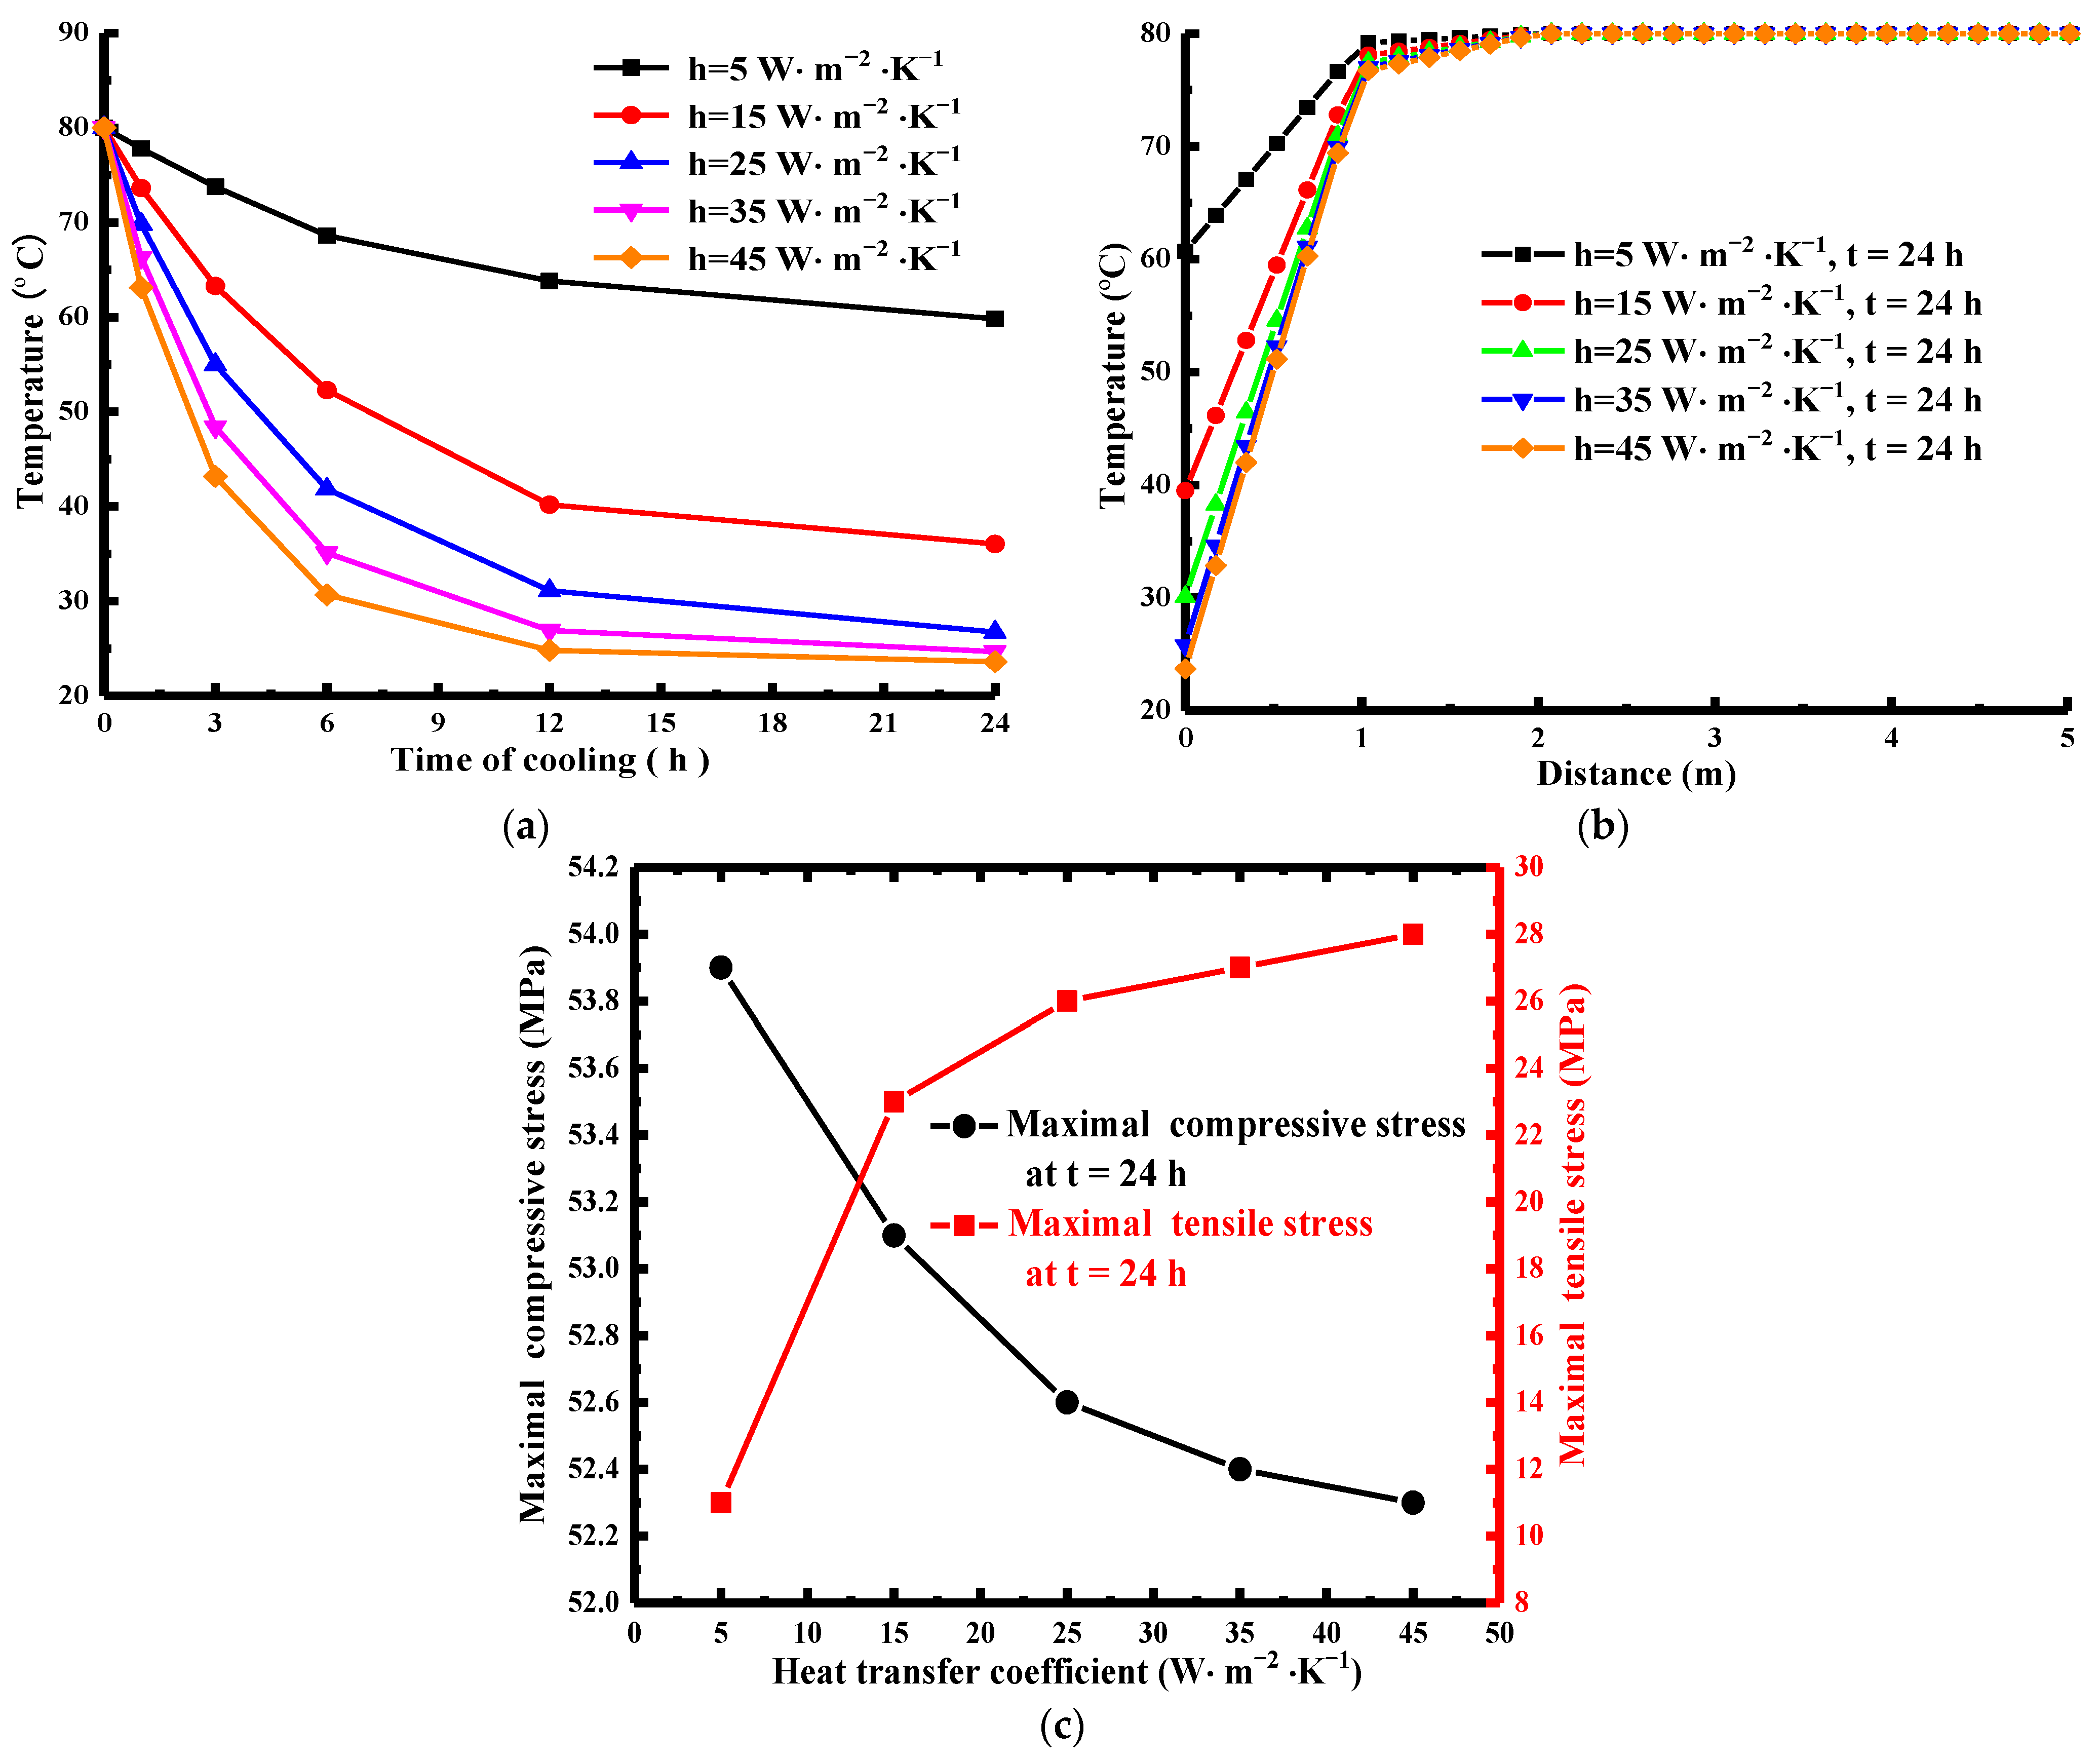
Figure 12a shows the temperature change of the tunnel wall within 24 h of cooling foe different heat transfer coefficients. The decrease in the tunnel wall temperature during cooling is not linear, and the greater the heat transfer coefficient is, the greater the temperature reduction on the tunnel wall within the same time. Compared with that of forced ventilation (h = 15, 25, 35, and 45 W·m−2·K−1), the cooling capacity of natural ventilation (h = 5 W·m−2·K−1) is much worse. Under all conditions, the cooling rate of the tunnel wall is high at first (t = 0~3 h), then gradually decreases (t = 3~12 h), and finally tends to be stable (t = 12~24 h). Figure 12b shows the internal temperature range of the surrounding rock for different heat transfer coefficients at t = 24 h. The greater the heat transfer coefficient is, the greater the temperature difference formed per unit length (the greater the thermal gradient) and the more obvious the effect of thermal stress [17]. Figure 12c shows that after cooling for 24 h, the maximum compressive stress (locations of concentrated stress are the same as the results of Section 4) decreases, and the maximum tensile stress increases with increasing heat transfer coefficient. When the heat transfer coefficient is 5 W·m−2·K−1, the maximum compressive stress is 53.9 MPa, which is only 1.7 MPa higher than that when the heat transfer coefficient is 45 W·m−2·K−1 (52.2 MPa). However, when the heat transfer coefficient is 45 W·m−2·K−1, the maximum tensile stress is 28 MPa, which is 18 MPa higher than that when the heat transfer coefficient is 5 W·m−2·K−1 (10 MPa). This indicates that, combined with the previous results (Section 4), the reduction in maximum compressive stress caused by cooling is not very obvious (the inhibitory effect on rockbursts is not enhanced) in the later stage of tunnel ventilation. In fact, it may produce large tensile stress, which will make it easier for the tunnel wall to be damaged earlier, and it is not conducive to the stability of the tunnel.
The simulation results show that although cooling with a larger heat transfer coefficient quickly reduces the temperature of the tunnel surface at the start (t = 0~3 h) and more slowly reduces the temperature after a certain time (t = 3~12 h), the cooling effect is not obvious later (t = 12~24 h). Furthermore, the inhibitory effect on rockbursts is not enhanced, but instead, the extent of damage to rock increases at t = 12~24 h. Comprehensively considering the results of the simulation, to ensure the overall stability of the tunnel without delaying the construction period, it is inconvenient to adopt a ventilation mode with a constant heat exchange coefficient. Based on the temperature variation law, a solution can be proposed in which cooling is carried out by using a larger heat transfer coefficient in the early stage (such as t = 0~3 h in Figure 12a), followed by cooling using a smaller heat transfer coefficient (such as t = (6 or 12)~24 h in Figure 12a). Cooling can inhibit the occurrence of rockbursts to a certain extent in this way and make the rock not easily damaged in the later stage, which is conducive to stability in tunnel engineering.
5.2. Effect of In Situ Stress
The geological conditions are complex along the Sichuan–Tibet railway, and the primary unfavorable factors are that the depths of the tunnels along the railway are different and that the magnitudes of in situ stresses change. Under the action of different in situ stresses, the stress distributions of the surrounding rock are also different, the location of concentrated stress changes, and the rockburst trend point of the tunnel surface differs. In actual in situ stress investigations, the hydraulic fracturing method is usually used to measure in situ stress. However, because of the complexity of geological information, it is difficult to depend on measuring the in situ stress of the tunnel route to infer the stress distribution of the surrounding rock. It is necessary to know the in situ stress information for the tunnel section, infer the dangerous points and weak points inside the tunnel, and arrange preventative measures in advance. Due to the complexity of engineering, this study discusses (1) the changes in the location and size of tunnel stress concentrations under different conditions of in situ stress and (2) the trend of stresses in the process of cooling. The in situ stress values are shown in Table 1.
5.2.1. Influence of and on the Change in Tunnel Stress
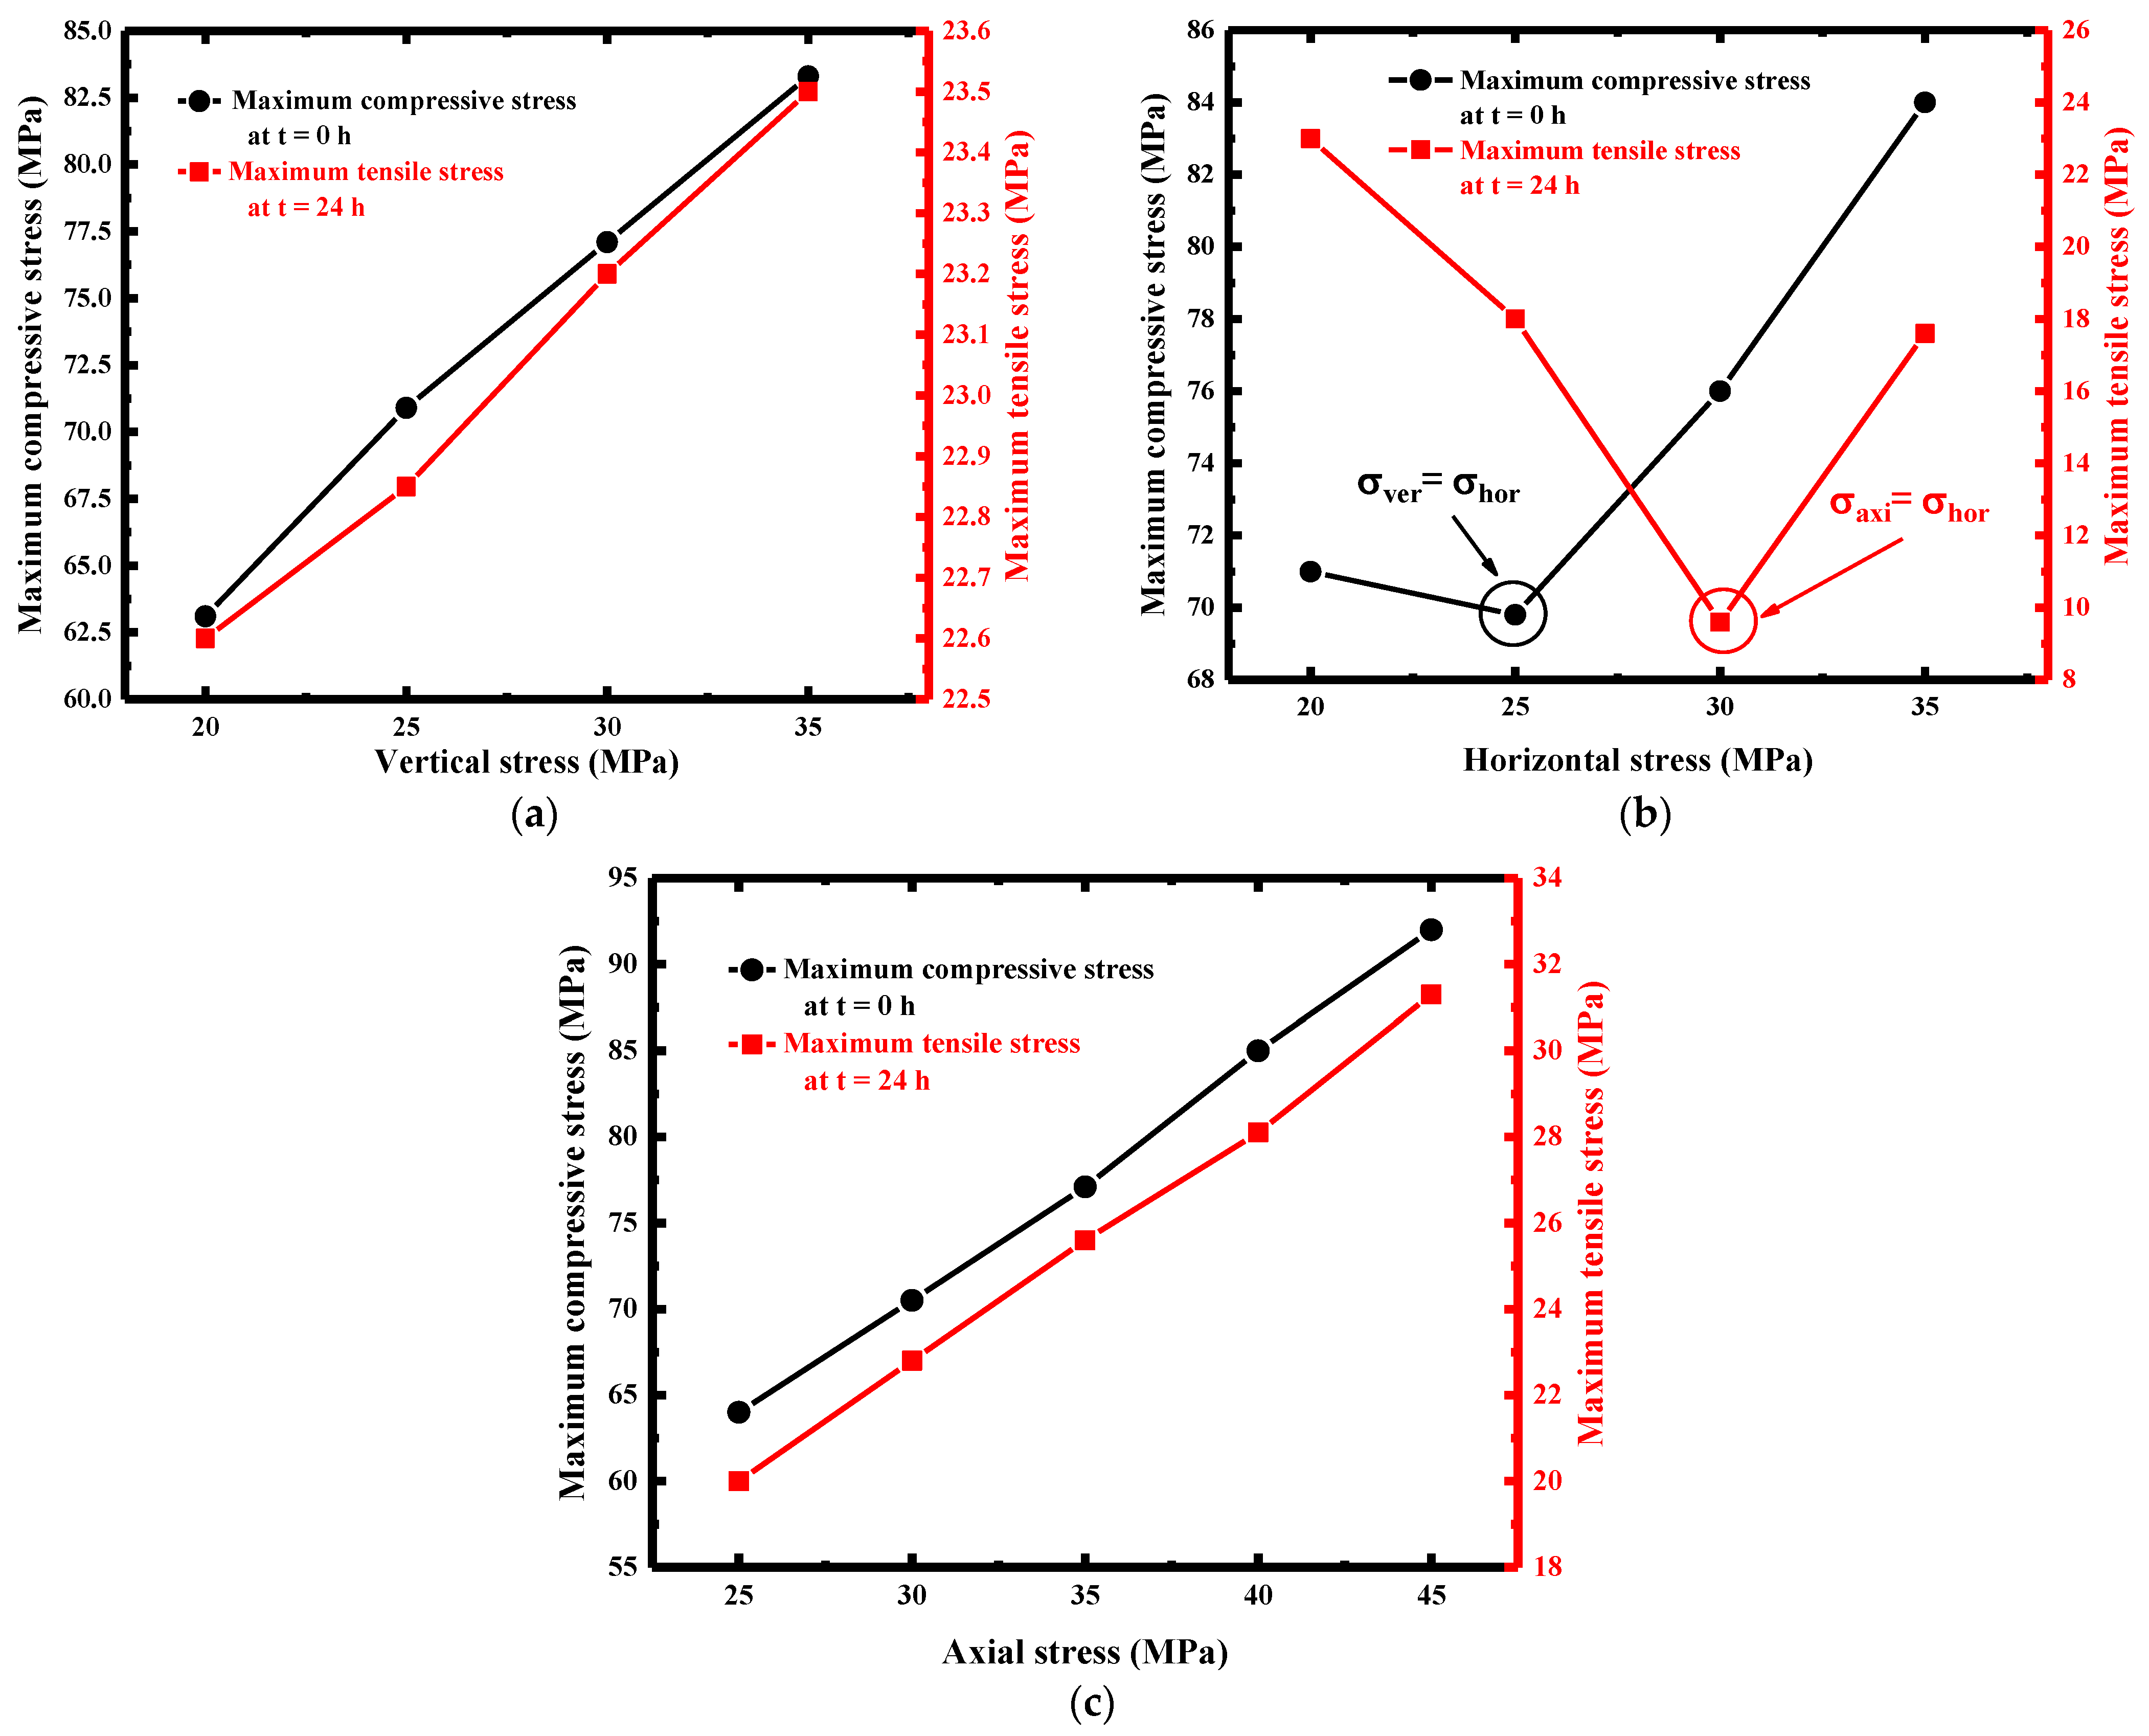
According to the results presented in Section 4, the junction of the tunnel face and tunnel wall is an area of concentrated stress (rockbursts can easily occur), and the maximum compressive stress of SP#Left is larger than that of SP#Up and that of SP#Down. However, there is a difference observed in the influence of the in situ stress change on the tunnel stress distribution by comparison, and the law of stress distribution is related to the stress concentration area position; thus, only the influences of the in situ stress change on the stress concentration area position, the maximum compressive stress (t = 0 h) and the maximum tensile stress (t = 24 h) are discussed. Figure 13a shows the maximum compressive stress at t = 0 h and maximum tensile stress at t = 24 h for the surrounding rock at different vertical stresses (). The selected stress values in the two directions are always maintained ( > ), and the maximum compressive stress of SP#Left is always larger than that of SP#Up and that of SP#Down in this case. The maximum compressive stress point is at the junction of SP#Left on the tunnel wall and SP#Tunnel face. Figure 13a shows that the larger is, the greater the maximum compressive stress of the stress concentration area at t = 0 h and the more easily rockbursts occurs. The larger is, the greater the maximum tensile stress at t = 24 h, and the more likely the rock of the tunnel face is to fail (see Section 4).
Figure 13b shows the maximum compressive stress at t = 0 h and maximum tensile stress at t = 24 h for the surrounding rock at different horizontal stresses (). Because both curves have turning points, they are analyzed separately here, and the maximum compressive stress is analyzed first. Figure 13b shows that although the horizontal stress () increases, as the ratio of horizontal stress to vertical stress changes(( > ) → ( = ) → ( < )), the location of the stress concentration point at t = 0 h also changes (the junction of SP#Left on the tunnel wall and SP#Tunnel face →the junction of the whole tunnel wall and SP#Tunnel face → the junction of SP#Up and SP#Down on the tunnel wall and SP#Tunnel face). When = , the maximum compressive stress is at its minimum, and rockbursts are less likely to occur. Additionally, with increasing horizontal stress (), the ratio of horizontal stress to axial stress changes (( > ) → ( = ) → ( < )). When = , the maximum tensile stress is at a minimum at t = 24 h, and rock is less likely to fail. In addition, the simulation results show that the larger the difference between and is, the larger the maximum compressive stress at t = 0 h and the more likely rockbursts are to occur. Similarly, the larger the difference between and is, the larger the maximum tensile stress at t = 24 h and the more likely rock is to fail.
5.2.2. Influence of on the Change in Tunnel Stress
Figure 13c shows the maximum compressive stress at t = 0 h and maximum tensile stress at t = 24 h for the surrounding rock at different axial stresses (). The variation in has no effect on the stress distribution of the surrounding rock of the tunnel (SP#Left, SP#Up and SP#Down). As Figure 13c shows, the larger is, the greater the maximum compressive stress at t = 0 h, and the maximum compressive stress can reach 90 MPa when is 45 MPa, which promotes the occurrence of rockbursts. Meanwhile, the larger is, the greater the maximum tensile stress at t = 24 h, and the maximum tensile stress can reach 32 MPa when is 45 MPa. Therefore, we conclude that rock is more prone to failure at an early stage.
According to the conclusion of this section, it is necessary to carry out in situ stress surveys in advance. If the in situ stress data of the tunnel can be obtained in advance and analyzed by numerical simulation, the stress value and the position and tendency of rockbursts in the surrounding rock after tunnel excavation can be inferred in advance, and preventative measures can be prepared in time, which can effectively reduce the damage to tunnels and promote the progression of the project.
5.3. Effect of the Dip Angle of Faults on Tunnels
The Sichuan–Tibet railway is located near the plate, and the fault structure is very complex along the line, which also brings great difficulties to tunnel construction. Li et al. [25] also describes the distribution of faults along the tunnel and the corresponding dip angle. The zone where the tunnel passes through the fault is prone to rock failure and even rockbursts. Based on the above reasons, we establish a numerical model to study the influence of the fault dip angle on the stress of the rock surrounding the tunnel.
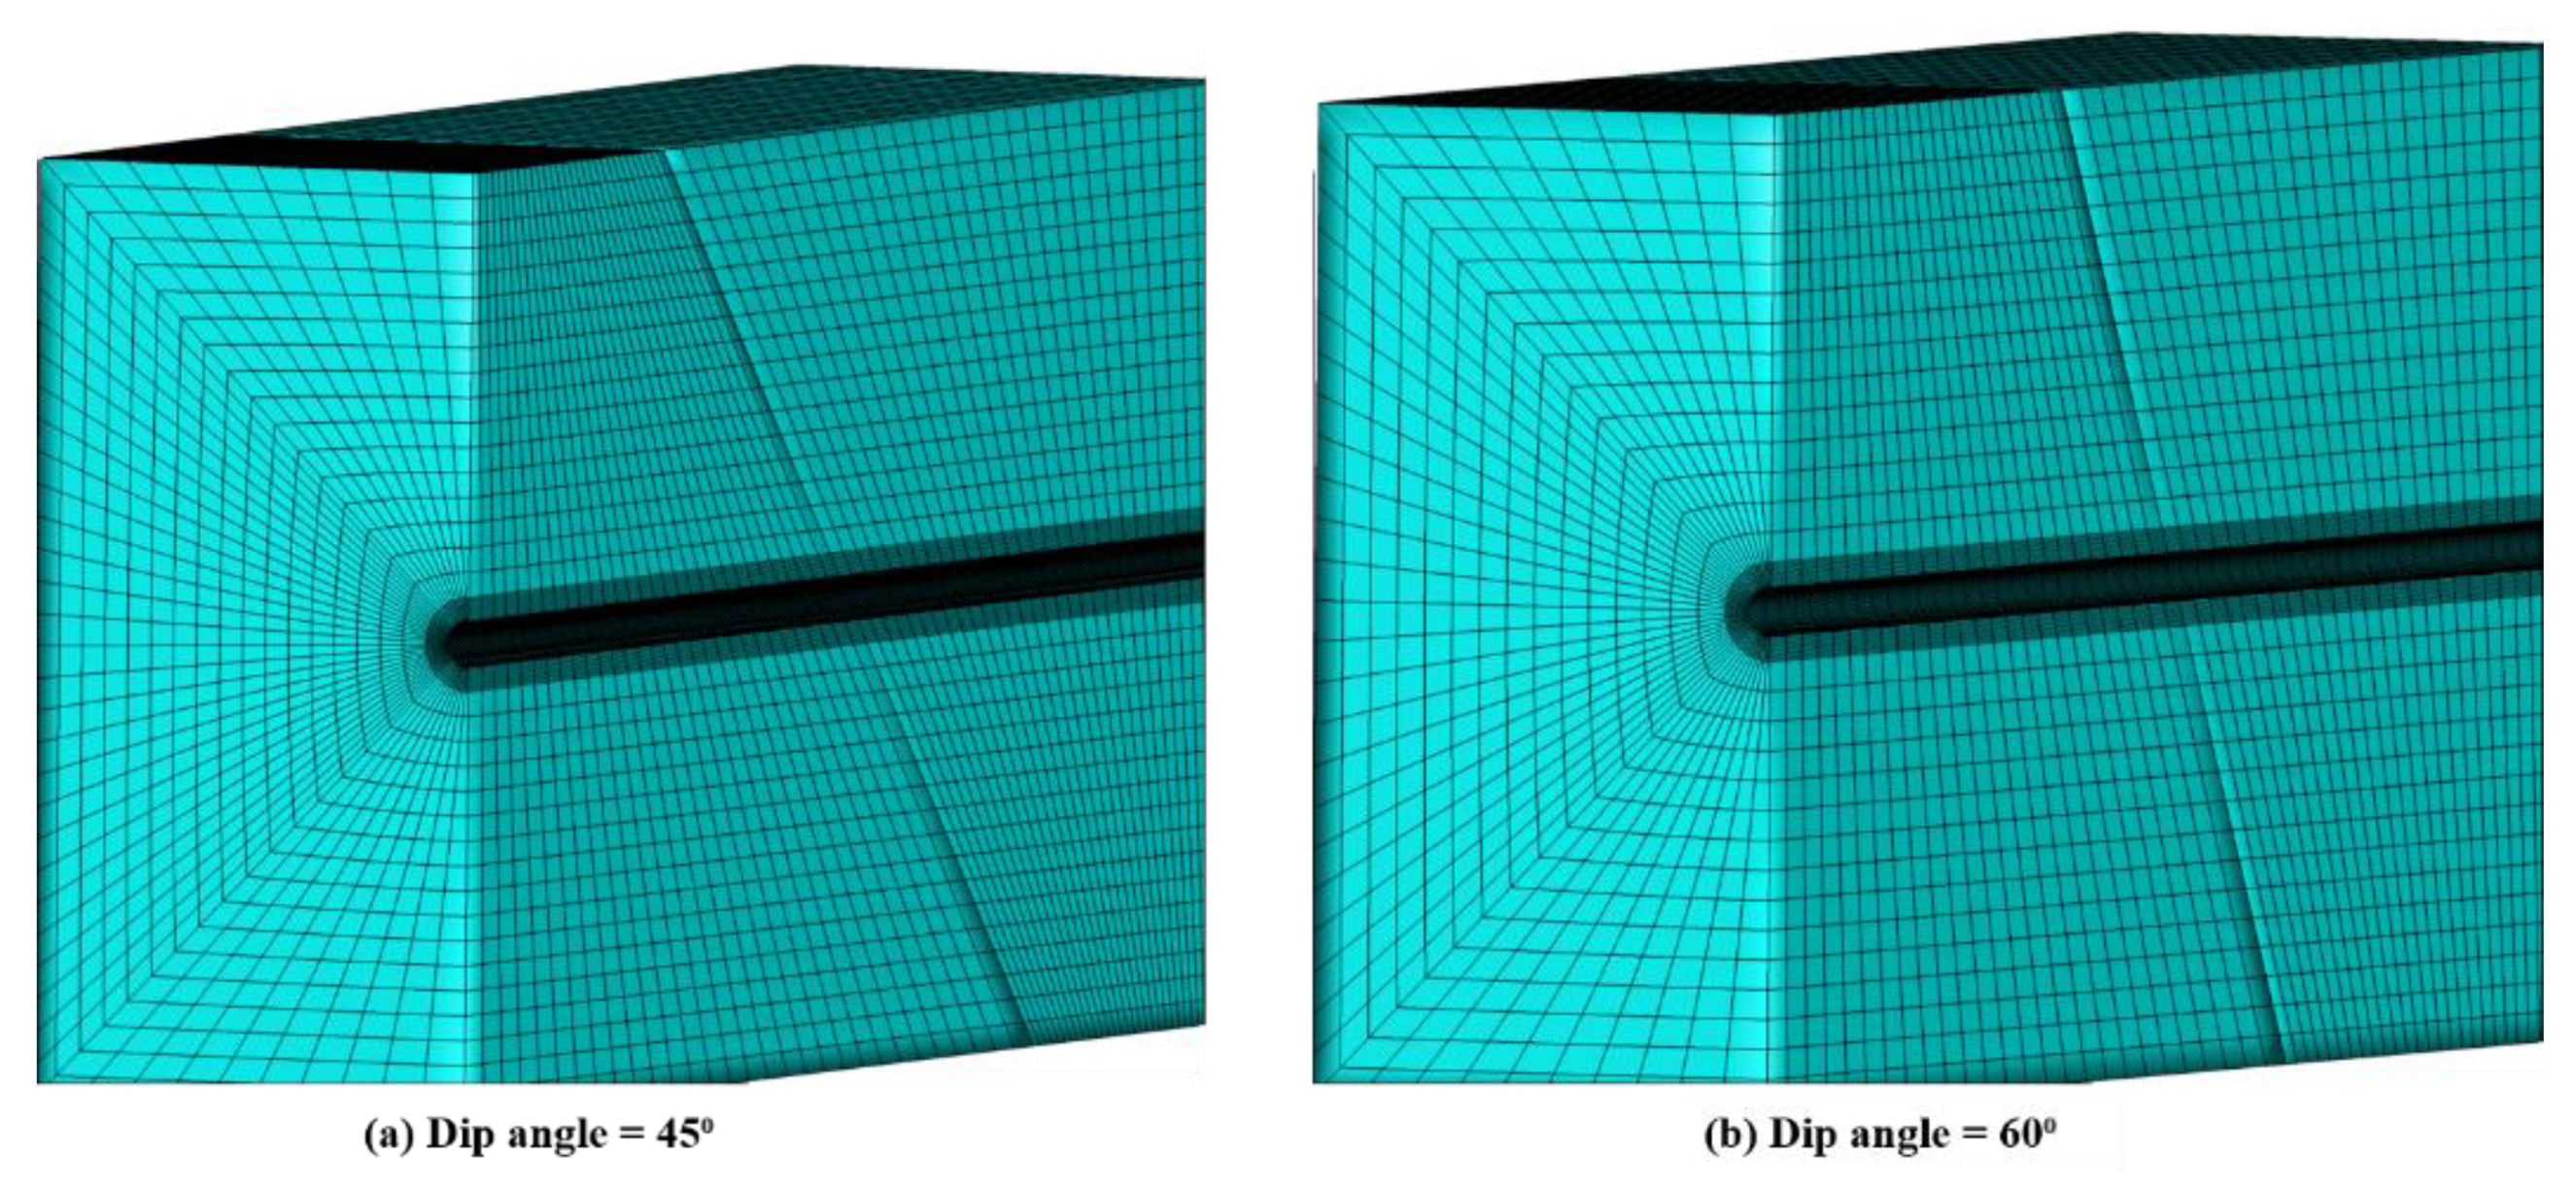
To study the distribution of the surrounding rock stress and understand the trend of its variation with cooling when the tunnel crosses faults at different angles, a new fault numerical model is built. The size of the model is 200 m × 200 m × 400 m, the fault is located in the middle of the tunnel, and the other calculation parameters and mechanical and temperature boundary conditions are consistent with those of the previous model. The fault dip angles are set to 45° and 60° (see Figure 14). To simulate the influence of the fault plane, a contact element is set between the upper and lower surfaces of the fault model in the process of model construction. The contact element can transfer heat and compressive stress but cannot transfer tensile stress. There is contact friction between the two surfaces of the fault. In this paper, the simulation of faults is relatively simple, and only the influence of closed faults on tunnels is discussed. However, the results of numerical calculation can show the change process of stress, which is convenient for subsequent relevant researchers to understand and analyze.
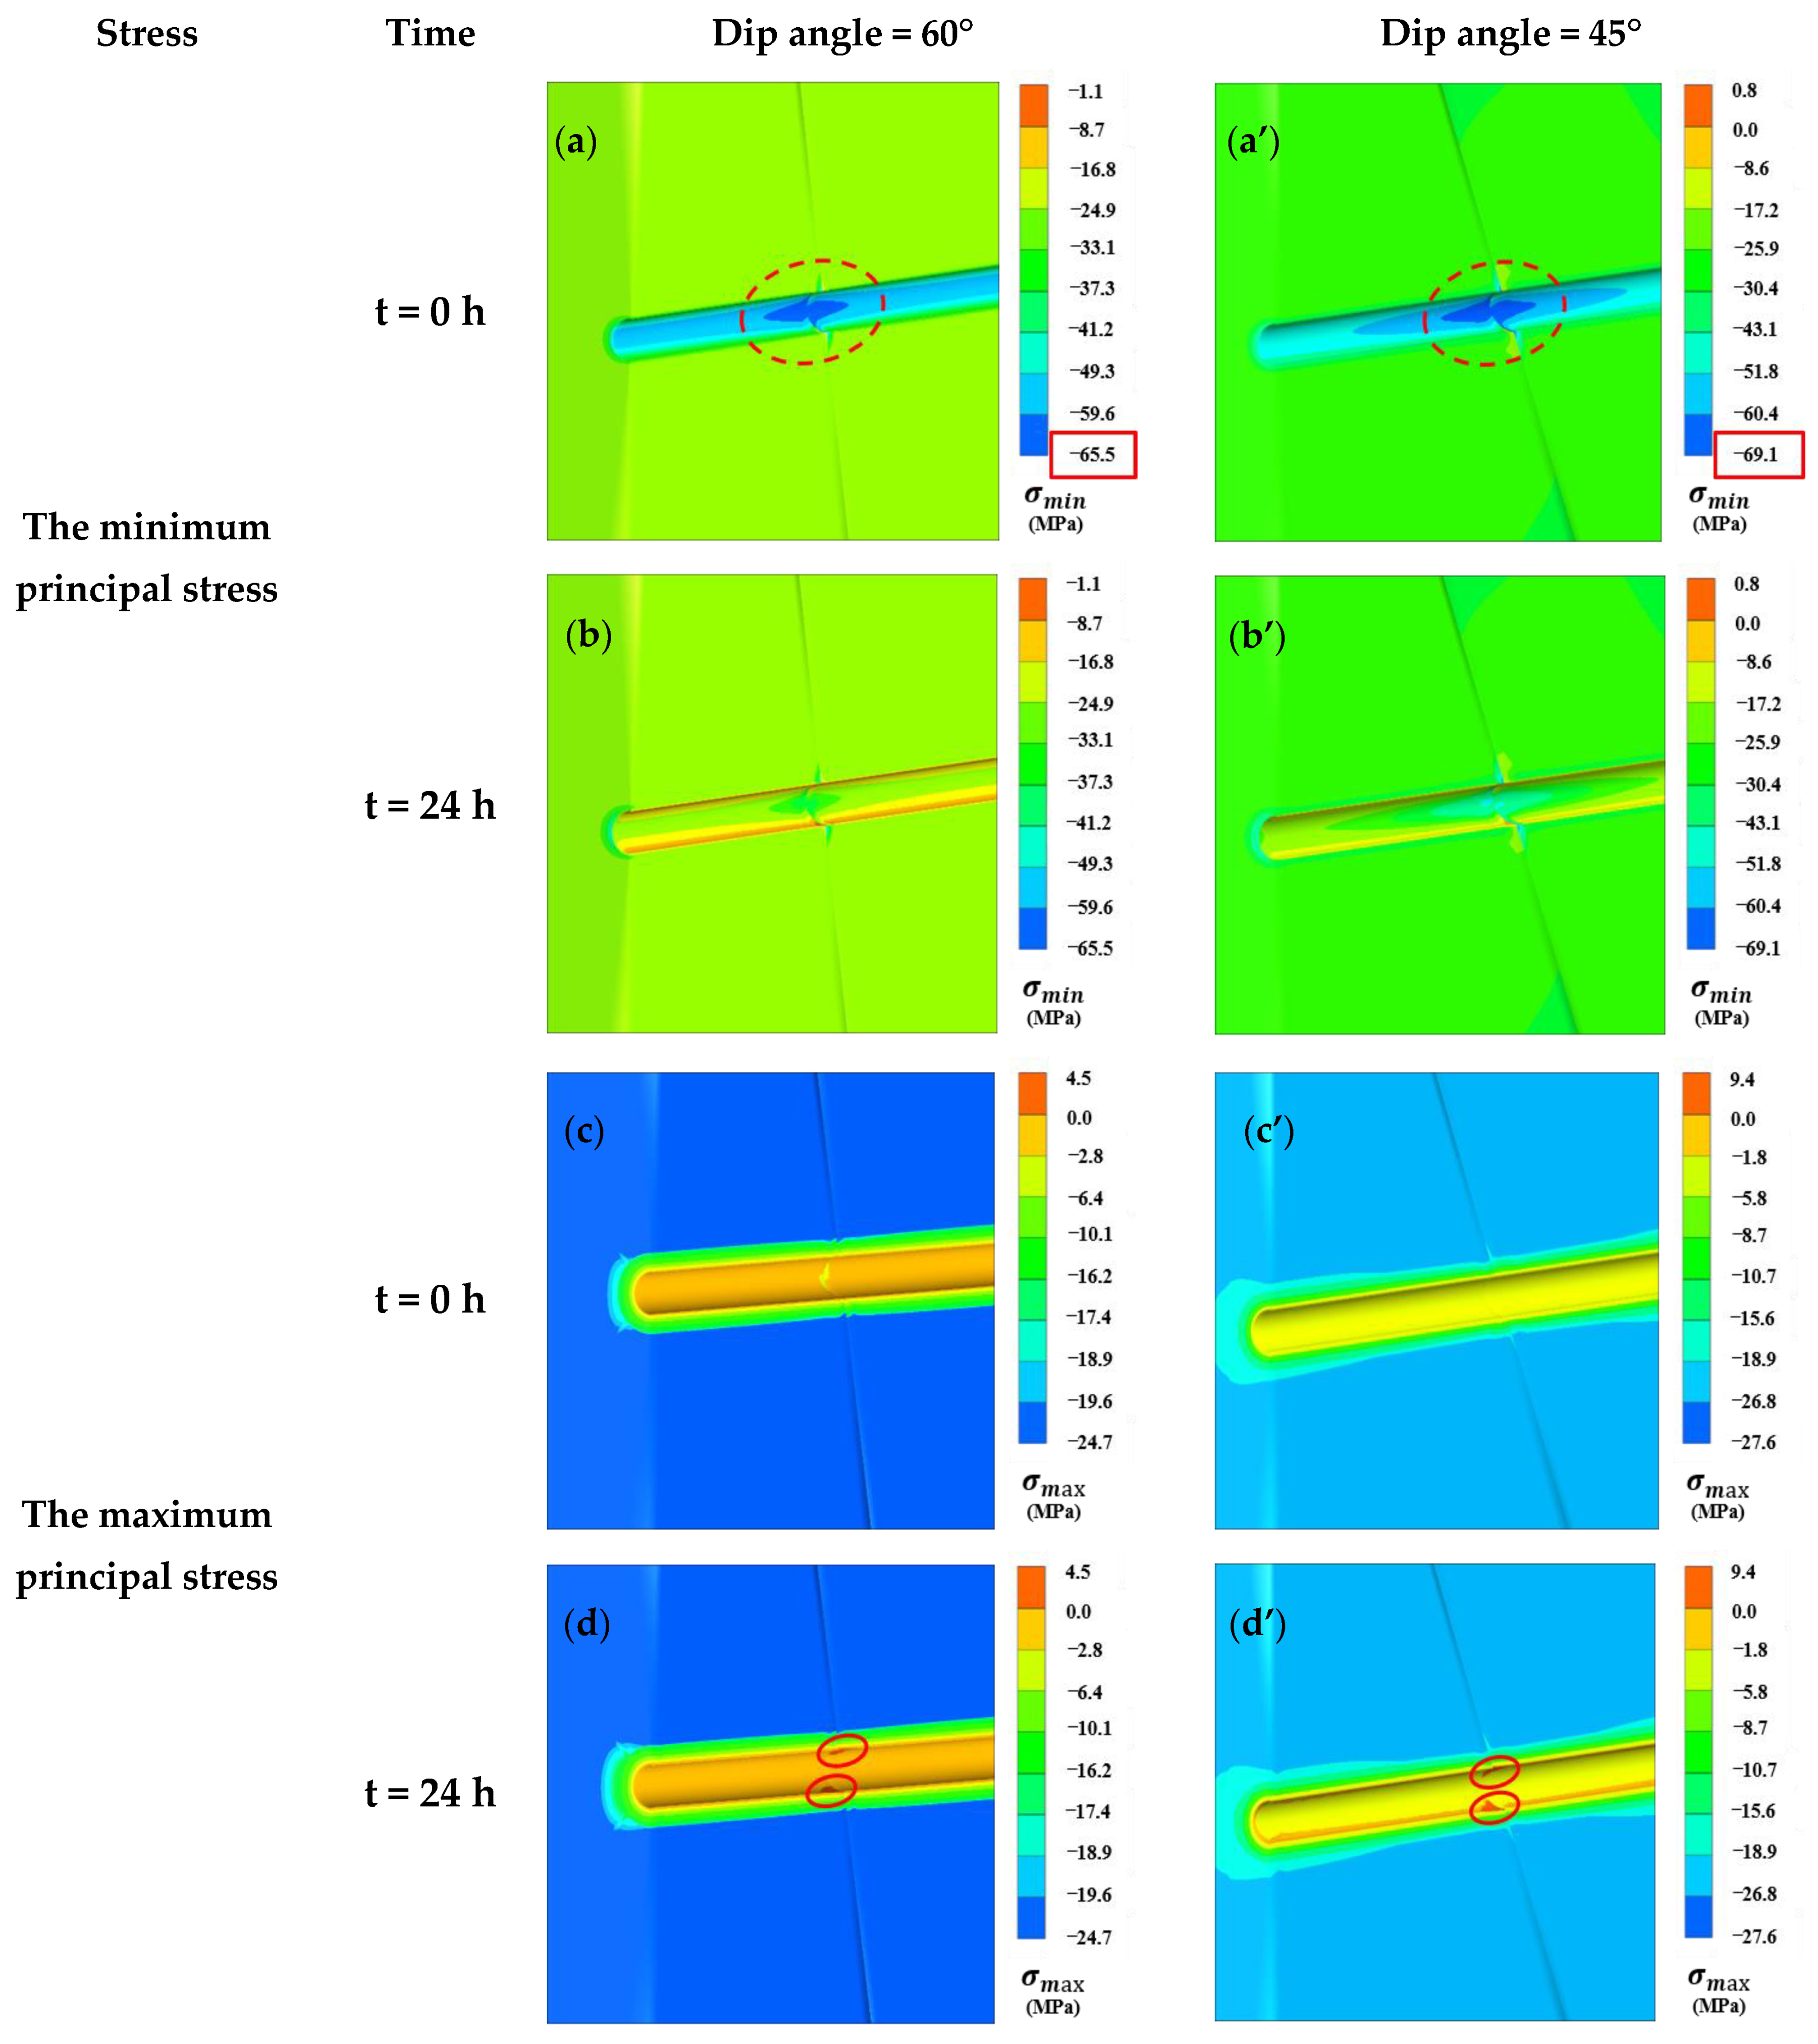
Figure 15a,a’ show that when the tunnel has just been excavated at t = 0 h, the stress is concentrated (red dotted line in Figure 15a,a’) on the left side of the junction between the tunnel surface and the fault, and rockbursts easily occurs at this position (see Section 4). At the same time, Figure 15a,a’ show that at the location of concentrated stress, the minimum stress (compressive stress) value at 45° is greater than that at 60°, which indicates that when the tunnel passes through the fault with a small incline, the location of concentrated stress is more prone to rockbursts. After cooling for 24 h, the maximum compressive stress decreases at the stress concentration point (Figure 15b,b’), and cooling unloads stress and inhibits the occurrence of rockbursts. Therefore, for the high-temperature tunnel passing through the fault, timely cooling at the fault junction is conducive to inhibiting rockbursts and ensuring the normal progress of tunnel engineering. At the same time, Figure 15c,c’,d,d’ show that tensile stress appears on the upper and lower sides of the junction between the tunnel wall and the fault after 24 h of cooling for the two dip angles, and the tensile stress value at the 45° dip angle is larger than that at the 60° dip angle. The brief analysis of the simulation results shows that for the high-temperature tunnel crossing the fault, the location of concentrated stress at the junction of the fault and the tunnel should be cooled in the initial stage, which can effectively prevent rockbursts. In the later stage, there is no need for continuous cooling to prevent rock failure on the upper and lower sides of the tunnel. The tunnel should be supported to maintain its over time.
6. Conclusions
(1) After the excavation of the high-temperature tunnel, there is obvious stress concentration at the junction of the working face and tunnel wall, which is a high-incidence area of rockbursts. Ventilation and cooling reduce the minimum stress (compressive stress) of the surrounding rock and stress concentration point in the cooling area and sometimes reduce the occurrence of rockbursts. However, with the continuous cooling of the tunnel, the tunnel wall cracks and becomes unstable due to excessive cooling in the later stage.
(2) After a large tunnel is excavated, the stress value at the stress concentration is clearly smaller than that at the stress concentration of a small tunnel, and the probability of rockbursts increases. In the normal range, with the increase in the heat transfer coefficient, the process of cooling is accelerated, the amplitude of stress reduction is larger, and the speed of restraining rockbursts also increases. However, the damage to the surrounding rock is also accelerated in the later stage.
(3) The value between the horizontal stress and vertical stress perpendicular to the tunnel affects the location of stress concentration and the magnitude of the stress in the rock surrounding the tunnel. When the horizontal stress is greater than the vertical stress, stress concentration occurs above and below the tunnel. When the horizontal stress is less than the vertical stress, stress concentration occurs at the left and right sides of the tunnel. The greater the stress deviation is, the greater the stress value at the concentration point. The failure position of the cooling tunnel wall changes with the two stresses. The greater the axial stress is, the greater the stress concentration value at the interface between the tunnel and face.
(4) According to the calculation results of the fault model in this paper, the stress concentration at the junction of the tunnel and fault is obvious, and it is prone to rockbursts and needs to be given close attention. When the dip angle of the fault is small, the stress value at the concentration point is large, and rockbursts are more likely to occur. The ventilation and cooling of the tunnel reduce the stress of the surrounding rock and inhibits the occurrence of rockbursts at the concentrated place. Similarly, continuous cooling also leads to tensile failure at the upper and lower sides of the junction between the fault and the tunnel.
Author Contributions
Conceptualization, S.T.; writing—original draft preparation, Z.L.; writing—review and editing, J.L.; and supervision, X.L. and L.Z. All authors have read and agreed to the published version of the manuscript.
Funding
This project was financially supported by the National Natural Science Foundation of China (Grant Nos. 41941018, 51874065 and U1903112).
Institutional Review Board Statement
Not applicable.
Informed Consent Statement
Not applicable.
Data Availability Statement
Not applicable.
Conflicts of Interest
The authors declare no conflict of interest.
References
- Keneti, A.; Sainsbury, B. Review of published rockburst events and their contributing factors. Eng. Geol. 2018, 246, 361–373. [Google Scholar] [CrossRef]
- Konicek, P.; Waclawik, P. Stress changes and seismicity monitoring of hard coal longwall mining in high rockburst risk areas. Tunn. Undergr. Space Technol. 2018, 81, 237–251. [Google Scholar] [CrossRef]
- Malan, D.; Napier, J. Rockburst support in shallow-dipping tabular stopes at great depth. Int. J. Rock Mech. Min. Sci. 2018, 112, 302–312. [Google Scholar] [CrossRef] [Green Version]
- Hu, Y.; Wang, Q.; Wang, M.; Liu, D. A study on the thermo-mechanical properties of shotcrete structure in a tunnel, excavated in granite at nearly 90 °C temperature. Tunn. Undergr. Space Technol. 2021, 110, 103830. [Google Scholar] [CrossRef]
- Cheng, Q.; Lu, A.; Yin, C. Analytical stress solutions for a deep buried circular tunnel under an unsteady temperature field. Rock Mech. Rock Eng. 2021, 54, 1355–1368. [Google Scholar] [CrossRef]
- Li, J.; Li, H.; Zhu, Z.; Tao, Y.; Tang, C.A. Numerical study on damage zones induced by excavation and ventilation in a high-temperature tunnel at depth. Energies 2021, 14, 4773. [Google Scholar] [CrossRef]
- Wang, H. Numerical simulation of soft rock creep behavior under coupling influence of temperature and stress. J. Phys. Conf. Ser. 2021, 1885, 022001. [Google Scholar] [CrossRef]
- Wu, X.; Guo, Q.; Li, P.; Ren, F.; Zhang, J.; Cai, M. Investigating the effect of temperature changes on the physical field of surrounding rock in a deep gold mine. Adv. Mater. Sci. Eng. 2021, 2021, 8490864. [Google Scholar] [CrossRef]
- Chen, K.; Guo, Z.; Zhu, C. Study on mechanical properties and damage evolution law of granite after high temperature cooling. IOP Conf. Ser. Earth Environ. Sci. 2020, 455, 012083. [Google Scholar] [CrossRef]
- Kang, F.; Li, Y.; Tang, C.A. Grain size heterogeneity controls strengthening to weakening of granite over high-temperature treatment. Int. J. Rock Mech. Min. Sci. 2021, 145, 104848. [Google Scholar] [CrossRef]
- Wu, X.; Huang, Z.; Zhang, S.; Cheng, Z.; Li, R.; Song, H.; Wen, H.; Huang, P. Damage analysis of high-temperature rocks subjected to LN2 thermal shock. Rock Mech. Rock Eng. 2019, 52, 2585–2603. [Google Scholar] [CrossRef]
- Akdag, S.; Karakus, M.; Taheri, A.; Nguyen, G.; Manchao, H. Effects of Thermal Damage on Strain Burst Mechanism for Brittle Rocks Under True-Triaxial Loading Conditions. Rock Mech. Rock Eng. 2018, 51, 1657–1682. [Google Scholar] [CrossRef]
- Li, T.; Pan, H.; Chen, G.; Meng, L. Physical model tests on thermo-mechanical effects in rockbursts around tunnels. Chin. J. Rock Mech. Eng. 2018, 37, 261–273. [Google Scholar]
- Yan, J.; He, C.; Zeng, Y.; Wang, B.; Zhang, J. Cooling technology and effect analysis of high ground temperature tunnel in Sichuan-Tibet Railway. China Railw. Sci. 2019, 40, 53–62. [Google Scholar]
- Chen, G.; Li, T.; Zhang, G.; Yin, H.; Zhang, H. Temperature effect of rock burst for hard rock in deep-buried tunnel. Nat. Hazards 2014, 72, 915–926. [Google Scholar] [CrossRef]
- Su, G.; Chen, Z.; Ju, J.W.; Jiang, J. Influence of temperature on the strainburst characteristics of granite under true triaxial loading conditions. Eng. Geol. 2017, 222, 38–52. [Google Scholar] [CrossRef]
- Tang, S.; Wang, J.; Chen, P. Theoretical and numerical studies of cryogenic fracturing induced by thermal shock for reservoir stimulation. Int. J. Rock Mech. Min. Sci. 2020, 125, 104160. [Google Scholar] [CrossRef]
- Tang, S.B.; Zhang, H.; Tang, C.A.; Liu, H.Y. Numerical model for the cracking behavior of heterogeneous brittle solids subjected to thermal shock. Int. J. Solids Struct. 2016, 80, 520–531. [Google Scholar] [CrossRef]
- Gong, W.; Peng, Y.; Wang, H.; He, M.; Ribeiro e Sousa, L.; Wang, J. Fracture angle analysis of rock burst faulting planes based on true-triaxial experiment. Rock Mech. Rock Eng. 2015, 48, 1017–1039. [Google Scholar] [CrossRef]
- Ren, Y.; Wang, D.; Li, T.; Ran, X.; Liu, Z.; Zhang, J. In-situ geostress characteristics and engineering effect in Ya’an-Xinduqiao section of Sichuan-Tibet Railway. Chin. J. Rock Mech. Eng. 2021, 40, 65–76. [Google Scholar] [CrossRef]
- Wu, S.; Wang, G. Rock mechanical problems and optimization for the long and deep diversion tunnels at Jinping II hydropower station. J. Rock Mech. Geotech. Eng. 2011, 3, 314–328. [Google Scholar] [CrossRef]
- Zhang, C.; Feng, X.; Zhou, H.; Qiu, S.; Wu, W. A top pilot tunnel preconditioning method for the prevention of extremely intense rockbursts in deep tunnels excavated by TBMs. Rock Mech. Rock Eng. 2012, 45, 289–309. [Google Scholar] [CrossRef]
- Almesri, I.F.; Alrahmani, M.A.; Almutairi, J.H.; Abou-Ziyan, H.Z. Effect of surface roughness on fluid flow and heat transfer characteristics of lattice brick setting in tunnel kilns. J. Therm. Sci. Eng. Appl. 2021, 13, 061006. [Google Scholar] [CrossRef]
- Chen, Q.; Zhang, H.; Zhu, Y.; Chen, S.; Ran, G. Study on distributions of airflow velocity and convective heat transfer coefficient characterizing duct ventilation in a construction tunnel. Build. Environ. 2021, 188, 107464. [Google Scholar] [CrossRef]
- Li, K.; Xu, X.; Kirby, E.; Tang, F.; Kang, W. Late Quaternary paleoseismology of the Milin fault: Implications for active tectonics along the Yarlung Zangbo Suture, Southeastern Tibet Plateau. Tectonophysics 2018, 731, 64–72. [Google Scholar] [CrossRef]
Figure 1.
Plate distribution along the Sichuan–Tibet railway.

Figure 2.
(a) Shear failure under large deviating stress after cooling. (b) Tensile failure under small deviational stress after cooling. : the moment when high-temperature rock starts to cool; : the moment when high-temperature rock fails after cooling; : rock tensile strength; : the first principal stress at t = ; : the first principal stress at t = ; : the third principal stress at t = ; and : the third principal stress at t = .

Figure 3.
Sketch of the thermal-mechanical model.

Figure 4.
Comparison of the numerical simulation results with the theoretical results. (a) The curves of the T when = 0. (b) The curves of the when = 0. (c) The curves of the when = 0.
Figure 4.
Comparison of the numerical simulation results with the theoretical results. (a) The curves of the T when = 0. (b) The curves of the when = 0. (c) The curves of the when = 0.

Figure 5.
Schematic diagram of the model and boundary conditions. (a) The setting of mechanical boundary conditions. (b) The setting of temperature boundary conditions. (c) The length and distribution of four different paths. (d) The names of the different locations of the tunnels.
Figure 5.
Schematic diagram of the model and boundary conditions. (a) The setting of mechanical boundary conditions. (b) The setting of temperature boundary conditions. (c) The length and distribution of four different paths. (d) The names of the different locations of the tunnels.

Figure 6.
Model and meshing of the tunnel with radii of 5 and 10 m.

Figure 7.
Temperature distribution at t = 0~24 h in the tunnel. (a) t = 0 h; (b) t = 1 h; (c) t = 3 h; (d) t = 6 h; (e) t = 12 h; (f) t = 24 h.
Figure 7.
Temperature distribution at t = 0~24 h in the tunnel. (a) t = 0 h; (b) t = 1 h; (c) t = 3 h; (d) t = 6 h; (e) t = 12 h; (f) t = 24 h.

Figure 8.
Magnitude and distribution of the minimum principal stress at t = 0~24 h in the tunnel. (a) t = 0 h; (b) t = 1 h; (c) t = 3 h; (d) t = 6 h; (e) t = 12 h; (f) t = 24 h.
Figure 8.
Magnitude and distribution of the minimum principal stress at t = 0~24 h in the tunnel. (a) t = 0 h; (b) t = 1 h; (c) t = 3 h; (d) t = 6 h; (e) t = 12 h; (f) t = 24 h.

Figure 9.
Magnitude and distribution of the maximum principal stress at t = 0~24 h in the tunnel. (a) t = 0 h; (b) t = 1 h; (c) t = 3 h; (d) t = 6 h; (e) t = 12 h; (f) t = 24 h.
Figure 9.
Magnitude and distribution of the maximum principal stress at t = 0~24 h in the tunnel. (a) t = 0 h; (b) t = 1 h; (c) t = 3 h; (d) t = 6 h; (e) t = 12 h; (f) t = 24 h.


Figure 10.
Variation in the maximum and minimum principal stresses for t = 0~24 h along 4 paths: maximum (a) and minimum (b) principal stresses along Path 1; maximum (c) and minimum (d) principal stresses along Path 2; maximum (e) and minimum (f) principal stresses along Path 3; and maxi-mum (g) and minimum (h) principal stresses along Path 4.


Figure 11.
Distribution of temperature and the maximum and minimum principal stresses in tunnels with 5 and 10 m radii at different times. (a) Minimum principal stress in tunnel (R = 5 m) when t = 0 h (The value in the red frame is the maximum of the minimum principal stress (compressive)). (a’) Minimum principal stress in tunnel (R = 10 m) when t = 0 h (The value in the red frame is the maximum of the minimum principal stress (compressive)). (b) Minimum principal stress in tunnel (R = 5 m) when t = 24 h. (b’) Minimum principal stress in tunnel (R = 10 m) when t = 24 h. (c) Maximum principal stress in tunnel (R = 5 m) when t = 0 h. (c’) Maximum principal stress in tunnel (R = 10 m) when t = 0 h. (d) Maximum principal stress in tunnel (R = 5 m) when t = 24 h (The value in the red frame is the maximum of the maximum principal stress (tensile)). (d’) Maximum principal stress in tunnel (R = 10 m) when t = 24 h (The value in the red frame is the maximum of the maximum principal stress (tensile)). (e) Distribution of temperature in tunnel (R = 5 m) when t = 24 h. (e’) Distribution of temperature in tunnel (R = 10 m) when t = 24 h.


Figure 12.
(a) Variation in tunnel wall temperature with cooling for 24 h for five heat transfer coefficients; (b) internal temperature range of surrounding rock for different heat transfer coefficients at t = 24 h; and (c) maximum and minimum stress of surrounding rock for different heat transfer coefficients at t = 24 h.

Figure 13.
(a) Maximum compressive stress at t = 0 h and minimum stress at t = 24 h under different vertical stresses. (b) Maximum compressive stress at t = 0 h and minimum stress at t = 24 h under different horizontal stresses. (c) Maximum compressive stress at t = 0 h and minimum stress at t = 24 h under different axial stresses.

Figure 14.
Model and meshing of the tunnel with dip angles of 45° and 60°.

Figure 15.
Distribution of the maximum and minimum principal stresses in the tunnel with a fault before and after cooling. (a) Minimum principal stress in the tunnel with a fault (Dip angle = 60°) when t = 0 h (The value in the red frame is the maximum of the minimum principal stress (compressive) and the location in red circle is stress concentration area). (a’) Minimum principal stress in the tunnel with a fault (Dip angle = 45°) when t = 0 h (The value in the red frame is the maximum of the minimum principal stress (compressive) and the location in red circle is stress concentration area). (b) Minimum principal stress in the tunnel with a fault (Dip angle = 60°) when t = 24 h. (b’) Minimum principal stress in the tunnel with a fault (Dip angle = 45°) when t = 24 h. (c) Maximum principal stress in the tunnel with a fault (Dip angle = 60°) when t = 0 h. (c’) Maximum principal stress in the tunnel with a fault (Dip angle = 45°) when t = 0 h. (d) Maximum principal stress in the tunnel with a fault (Dip angle = 60°) when t = 24 h (The location in red circle is tensile stress area). (d’) Maximum principal stress in the tunnel with a fault (Dip angle = 45°) when t = 24 h (The location in red circle is tensile stress area).


Table 1.
Reference in situ stress setting values.
| Variable | |||
|---|---|---|---|
| Initial setting value | 25 | 30 | 20 |
| In situ stress setting value when only the axial stress changes | 25 | 25 | 20 |
| 25 | 35 | 20 | |
| 25 | 40 | 20 | |
| 25 | 45 | 20 | |
| In situ stress setting value when only the vertical stress changes | 20 | 30 | 20 |
| 30 | 30 | 20 | |
| 35 | 30 | 20 | |
| In situ stress setting value when only the horizontal stress changes | 25 | 30 | 25 |
| 25 | 30 | 30 | |
| 25 | 30 | 35 |
Publisher’s Note: MDPI stays neutral with regard to jurisdictional claims in published maps and institutional affiliations. |
© 2022 by the authors. Licensee MDPI, Basel, Switzerland. This article is an open access article distributed under the terms and conditions of the Creative Commons Attribution (CC BY) license (https://creativecommons.org/licenses/by/4.0/).
Share and Cite
MDPI and ACS Style
Luo, Z.; Li, J.; Tang, S.; Li, X.; Zhang, L. Numerical Studies on Rockbursts in Tunnels with High In Situ Stresses and Geothermally Rich Areas. Appl. Sci. 2022, 12, 5108. https://0-doi-org.brum.beds.ac.uk/10.3390/app12105108
AMA Style
Luo Z, Li J, Tang S, Li X, Zhang L. Numerical Studies on Rockbursts in Tunnels with High In Situ Stresses and Geothermally Rich Areas. Applied Sciences. 2022; 12(10):5108. https://0-doi-org.brum.beds.ac.uk/10.3390/app12105108
Chicago/Turabian StyleLuo, Zhonglian, Jiaming Li, Shibin Tang, Xiaoshuang Li, and Leitao Zhang. 2022. "Numerical Studies on Rockbursts in Tunnels with High In Situ Stresses and Geothermally Rich Areas" Applied Sciences 12, no. 10: 5108. https://0-doi-org.brum.beds.ac.uk/10.3390/app12105108
Note that from the first issue of 2016, this journal uses article numbers instead of page numbers. See further details here.