
Study on Dynamic Characterization and Vibration Reduction of Scrubber Structures Using Fluid Structure Interaction Analysis


Department of Mechanical Engineering, Sunmoon University, Asan-si 31460, Korea
Appl. Sci. 2022, 12(10), 5207; https://0-doi-org.brum.beds.ac.uk/10.3390/app12105207
Submission received: 22 April 2022
/
Revised: 15 May 2022
/
Accepted: 19 May 2022
/
Published: 21 May 2022
Abstract
:A scrubber is an important structure in post-semiconductor processes. It is impossible to completely modify the entire structure of an already installed and operating scrubber if a vibration problem occurs. Therefore, it is essential to determine the cause of vibrations and reinforce the structure. Vibration is majorly caused by the pump, and as considerable vibration is generated around the pump, it is essential to analyze it. However, as various equipment is operated in buildings where scrubbers are installed, the vibration data measured by attaching sensors are invalid owing to surrounding problems. Therefore, in this study, vibration data on the periphery of a pump according to the pump driving force was confirmed using a two-way fluid structure interaction analysis. To this end, a case run was conducted within a changeable design range, and an efficient design for vibration reduction was suggested by comparing the data with a change in the design factor.
1. Introduction
The semiconductor field is considered a very important technical industrial field in modern industries. Accordingly, the supply and demand of semiconductors are in-creasing rapidly with an increase in its market size. In line with the rapid changes in the market, numerous companies globally are conducting various studies to develop semiconductor technology, and several technical studies have been conducted on related equipment for semiconductor manufacturing and production [1,2,3,4]. Among them, the scrubber, which is regarded as an essential structure for the post-processing of semiconductors, is an important structure that plays a role in refining gases and com-pounds generated inside semiconductor production equipment [5,6]. Typically, this cleaning is performed using a liquid, and the liquid used for cleaning is water. Scrubber structures are installed on the upper part of buildings and are designed for various types of facilities inside the factory.
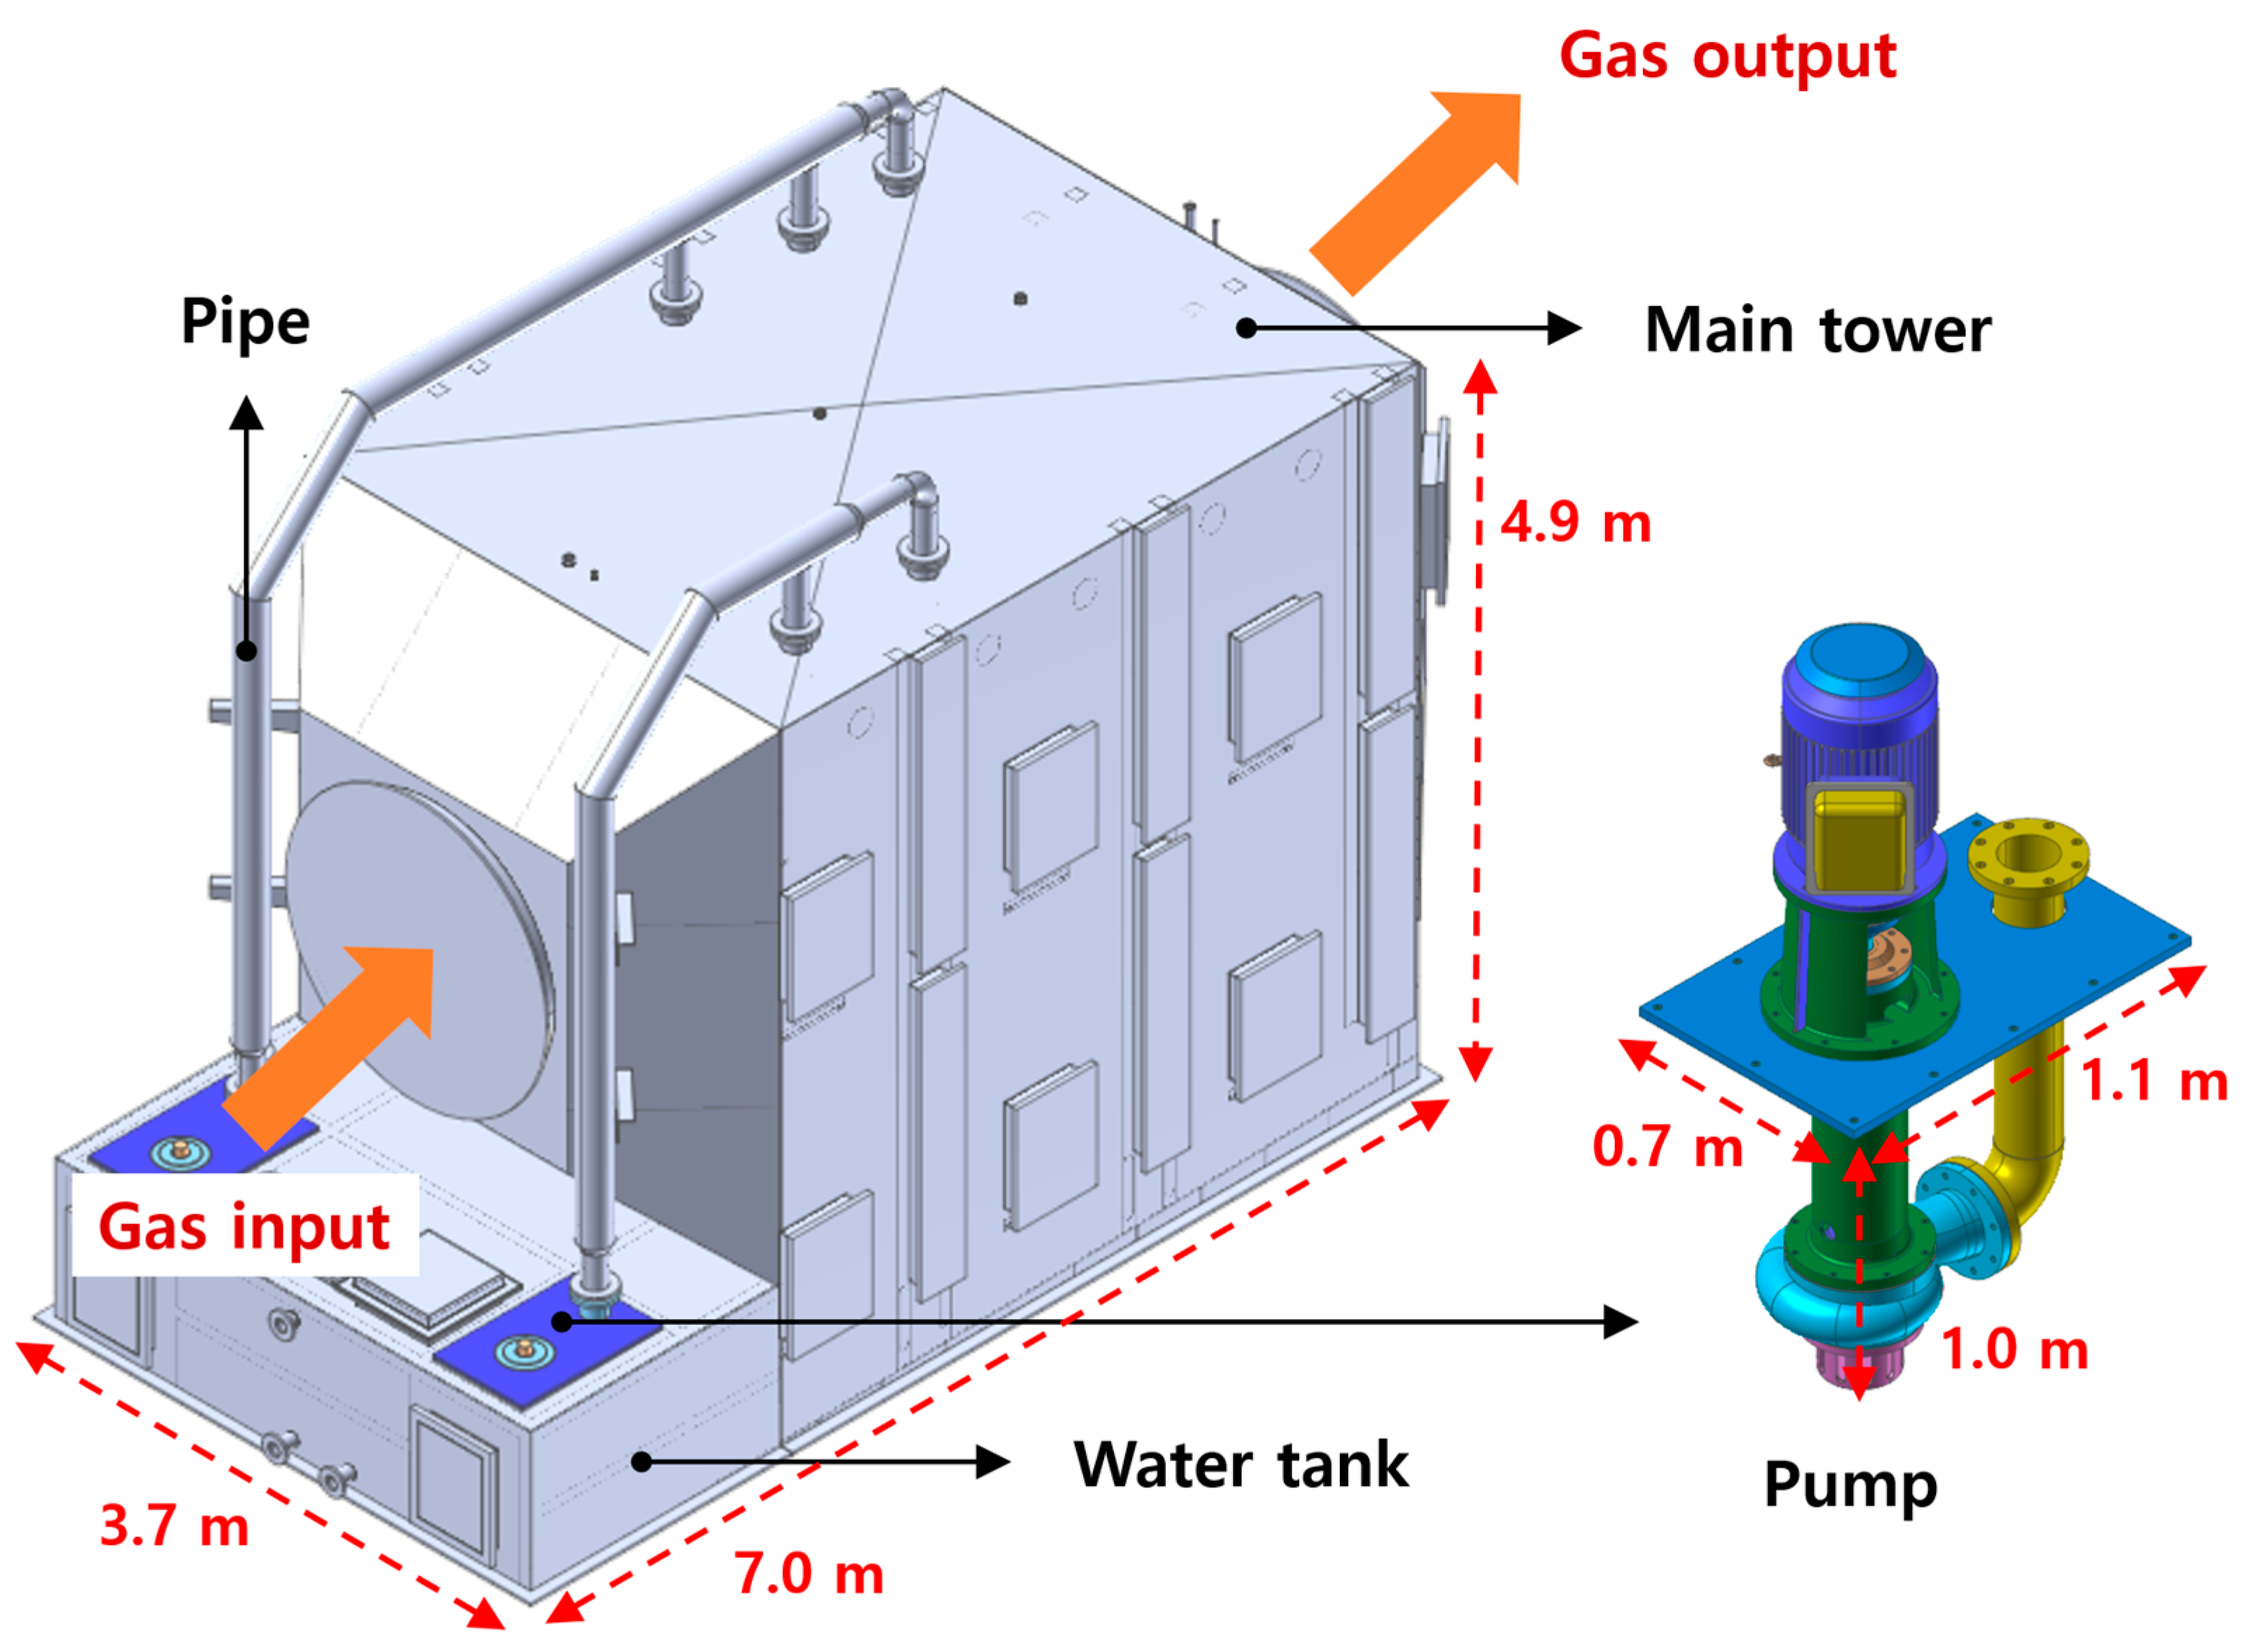
The structure of the scrubber investigated in this study is shown in Figure 1. A water tank where the cleaning liquid is stored is located at the bottom, and two circulation pumps are connected to the water tank. The maximum flow rate of one pump was 600 m3/h, and the cleaning solution was pulled into the pump by the rotation of the pump impeller located inside the water tank. Subsequently, the cleaning solution was pulled up to the upper part of the scrubber structure through a pipe connected to each pump, and the liquid was sprayed. In addition, the spray liquid purifies the contaminated gas that enters into the scrubber through the main tower installed on the rear of the structure into clean gas, which is then discharged. Scrubber structures, ranging from as few as dozens to as many as a hundred, are installed and operated in the upper part of semi-conductor processing factories. Therefore, if several equipment is operated simultaneously, the pump in the scrubber can cause vibration problems in the building itself. Particularly, owing to the nature of the pump, even if it is firmly designed, the generation of vibrations when it interacts with liquid is inevitable; thus, it is essential to design the structure around the pump, such that vibrations can be efficiently absorbed. However, it is impossible to completely modify the design of a scrubber if the vibration problem occurs when the scrubber is already installed and operating. Therefore, to solve the vibration problem, it is essential to determine the cause of vibration through vibration measurement and analyze it.
Various methods have been employed to analyze the vibration characteristics of scrubbers [7,8,9]. The scrubber investigated in this study is installed in a building with various installed and operating semiconductor-related equipment; thus it is impossible to consistently measure vibration data of the scrubber in operation owing to surrounding problems. Therefore, to analyze the vibration, the force transfer rate between the building and the scrubber should be calculated. In this research, a two-way fluid structure interaction (FSI) analysis was conducted using a CAE program to calculate the driving force of the pump and simultaneously secure the vibration data transmitted to the scrubber. Based on the data obtained through analysis, the cause of vibration of the scrubber was identified and various design parameters were analyzed to propose an efficient scrubber design for vibration reduction.
This enables the examination of the vibration characteristics of a structure using an analysis program without actual measurement, and the examination of the impact of changes in the design. This study focused on the possibility of obtaining data through interpretation in situations where experiments and measurements are impossible or difficult to perform. Particularly, if a structure needs to be analyzed based on both structure and fluid, such as a scrubber, the structure and fluid interacting with each other should be analyzed. This is because if both the structure and the fluid are converted into a finite element body, it is becomes difficult to implement sufficient physical time in the analysis, and even if implemented, the analysis will consume excessive time. Consequently, it becomes impossible to efficiently examine the impacts of design changes. Therefore, this study efficiently implemented a two-way analysis, and analyzed the vibration data of a scrubber based on sufficient physical time.
2. Dynamic Model of the System
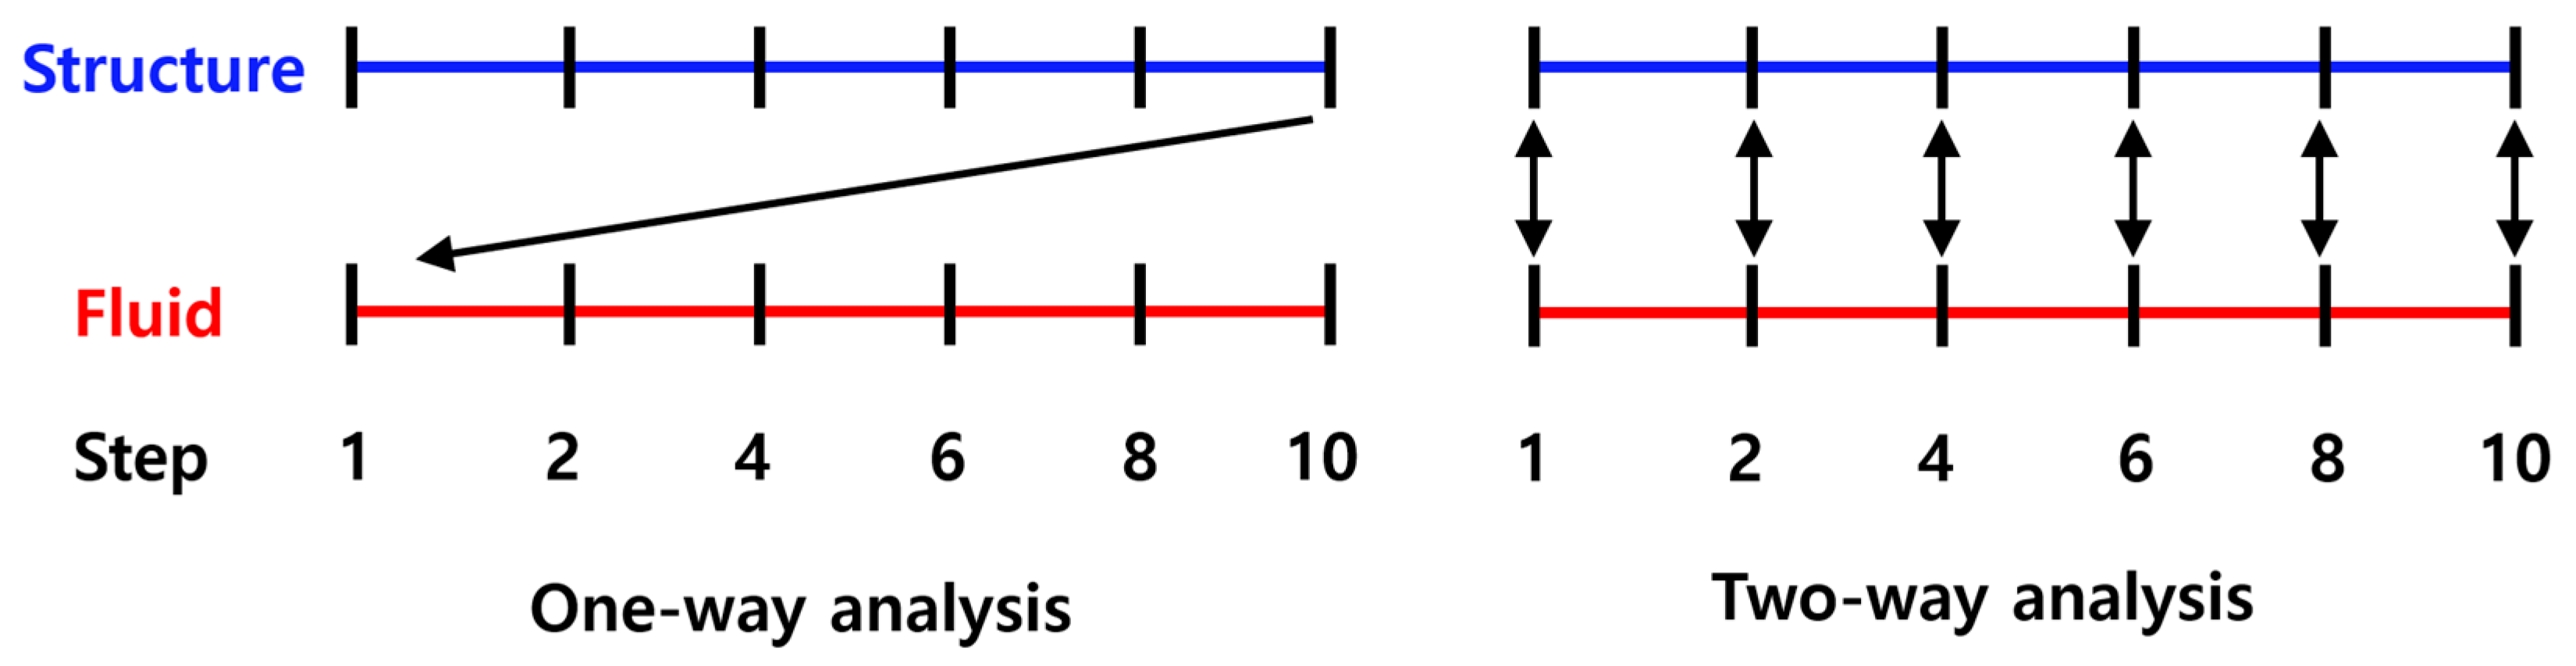
As the vibration of pumps is dominant in scrubbers, it is important to analyze the structure and fluid in a two-way manner [10,11]. To derive accurate results when per-forming FSI analysis, the data of the structure and fluid should be interacted with step-by-step with a change in time (Figure 2). If there is no interaction for all physical time, it is impossible to derive the accurate results regarding the dynamic behavior. Therefore, in this study, the structural/dynamic RecurDyn program capable of a two-way analysis, and Particleworks, a particle-based fluid program, were employed. The two programs are sufficiently verified as they have been investigated, and their results have been compared with experimental data in various fields [12,13,14,15], and are suitable for this study, which calculates the fluid force according to the operation of the pump and analyzes the vibration characteristics of the scrubber structure.
2.1. Analysis Modeling
The FSI analysis requires a three-dimensional (3D) modeling. Therefore, in this study, a 3D model of the scrubber shown in Figure 1 was constructed using Solidworks based on the 2D drawings of the scrubbers installed in the building. For the pump, a 3D model was constructed using the same specifications provided by the manufacturer. In addition, the models were modified for the analysis using a Fusion 360 program, as shown in Figure 3. If the models are not corrected, the error of the shape of the element around the pump and the number of nodes of the finite element method (FEM) body increase rapidly in a specific part, making it impossible to obtain correct analysis data [16,17]. Therefore, unnecessary elements that do not affect the analysis were removed, and the model was modified in a form suitable for the analysis. In the modified model, a mesh procedure was performed to obtain vibration data for the remaining bodies except the main tower.
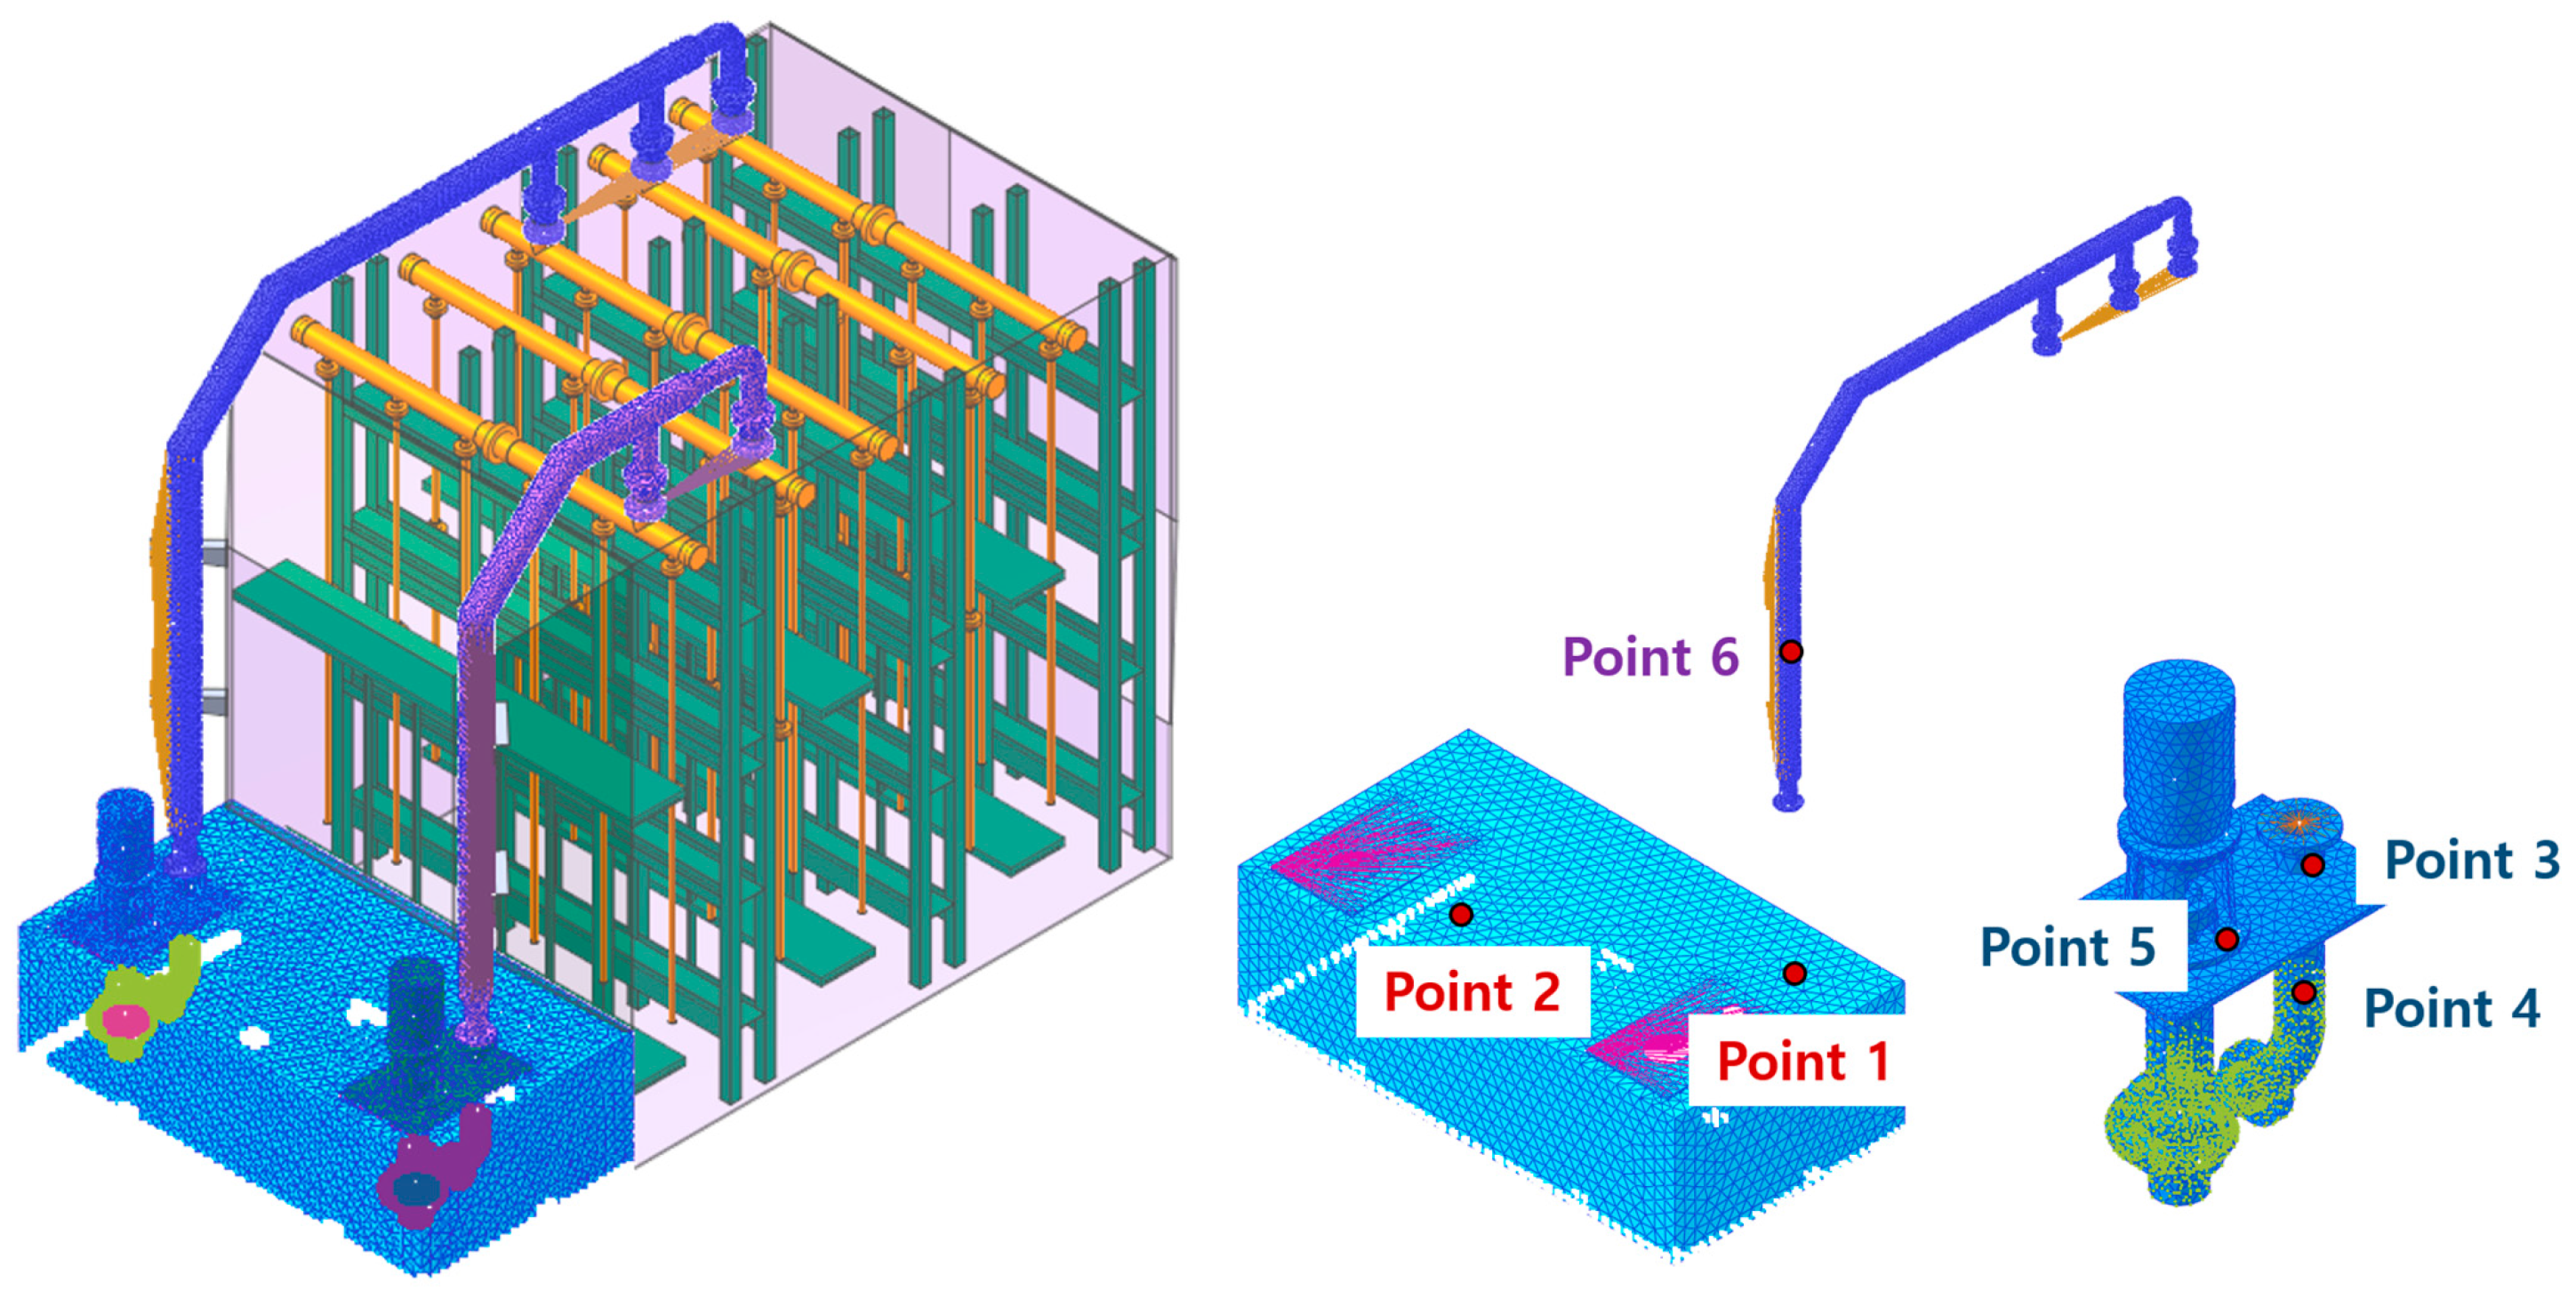
In the actual field, the vibration has been confirmed to be most severe around the pump, whereas vibration was hardly felt in the main tower even when it was in operation. The use of speed sensors results in irregularly measured data owing to the interference of the surrounding environment and cannot be used as verified data, so it was not referenced in this study. Therefore, to proceed with the analysis in the form of a multi-flexible body, a mesh procedure was performed only for the water tank, pump, and pipe body. The total number of grids of the Finite element body was 683,813, and if mesh was performed on the main tower, the number of grids increases significantly and the analysis time may increase excessively. Therefore, the main tower was considered to be a rigid body to significantly reduce the overall analysis time. Moreover, data can be rapidly obtained by focusing on the structure where vibration was generated. Figure 3 shows six locations around the pump where the greatest vibration is felt in the field, and the vibration data for these locations were obtained using analysis.
For elements in contact between bodies, the hertzian contact law infers that if the elastic modulus value is lower than that of steel, it is unnecessary for the stiffness value to exceed 100,000 N/mm [18]. The physical properties of the structure employed in this research are presented in Table 1, and the elastic moduli of the parts were lower than that of steel, so the ranges of stiffness and damping coefficients are calculated and presented in Table 2. If the Stiffness value is too low, an accurate contact between the bodies cannot be achieved, whereas if the value is too high, the analysis time significantly increases, so an appropriate range was calculated based on the hertzian contact law. This range is the range obtained through the test by applying values to the analysis program. Both the pump and pipe were composed of FRP, and the water tank was composed of steel to enable it withstand the weight of the pump as the total weight, including that of the motor of the pump, is 472 kg. In addition, the physical properties of the liquid were set to that of a general water material, as shown in Table 3.
2.2. Calculation of the Force Transmission Rate
The pump installed on the water tank generates a reaction force while interacting with the water, and this force can be measured by interpretation. A plate is generally installed between the water tank and the pump to reduce the reaction force generated during the operation of the pump. The stiffness and damping ratio of the plate are listed in Table 4. These values were employed to calculate the force transmitted from the pump to the water tank during operation using a formula, and the theoretical verification of the analysis model was performed by comparing the calculated data with the analysis data.
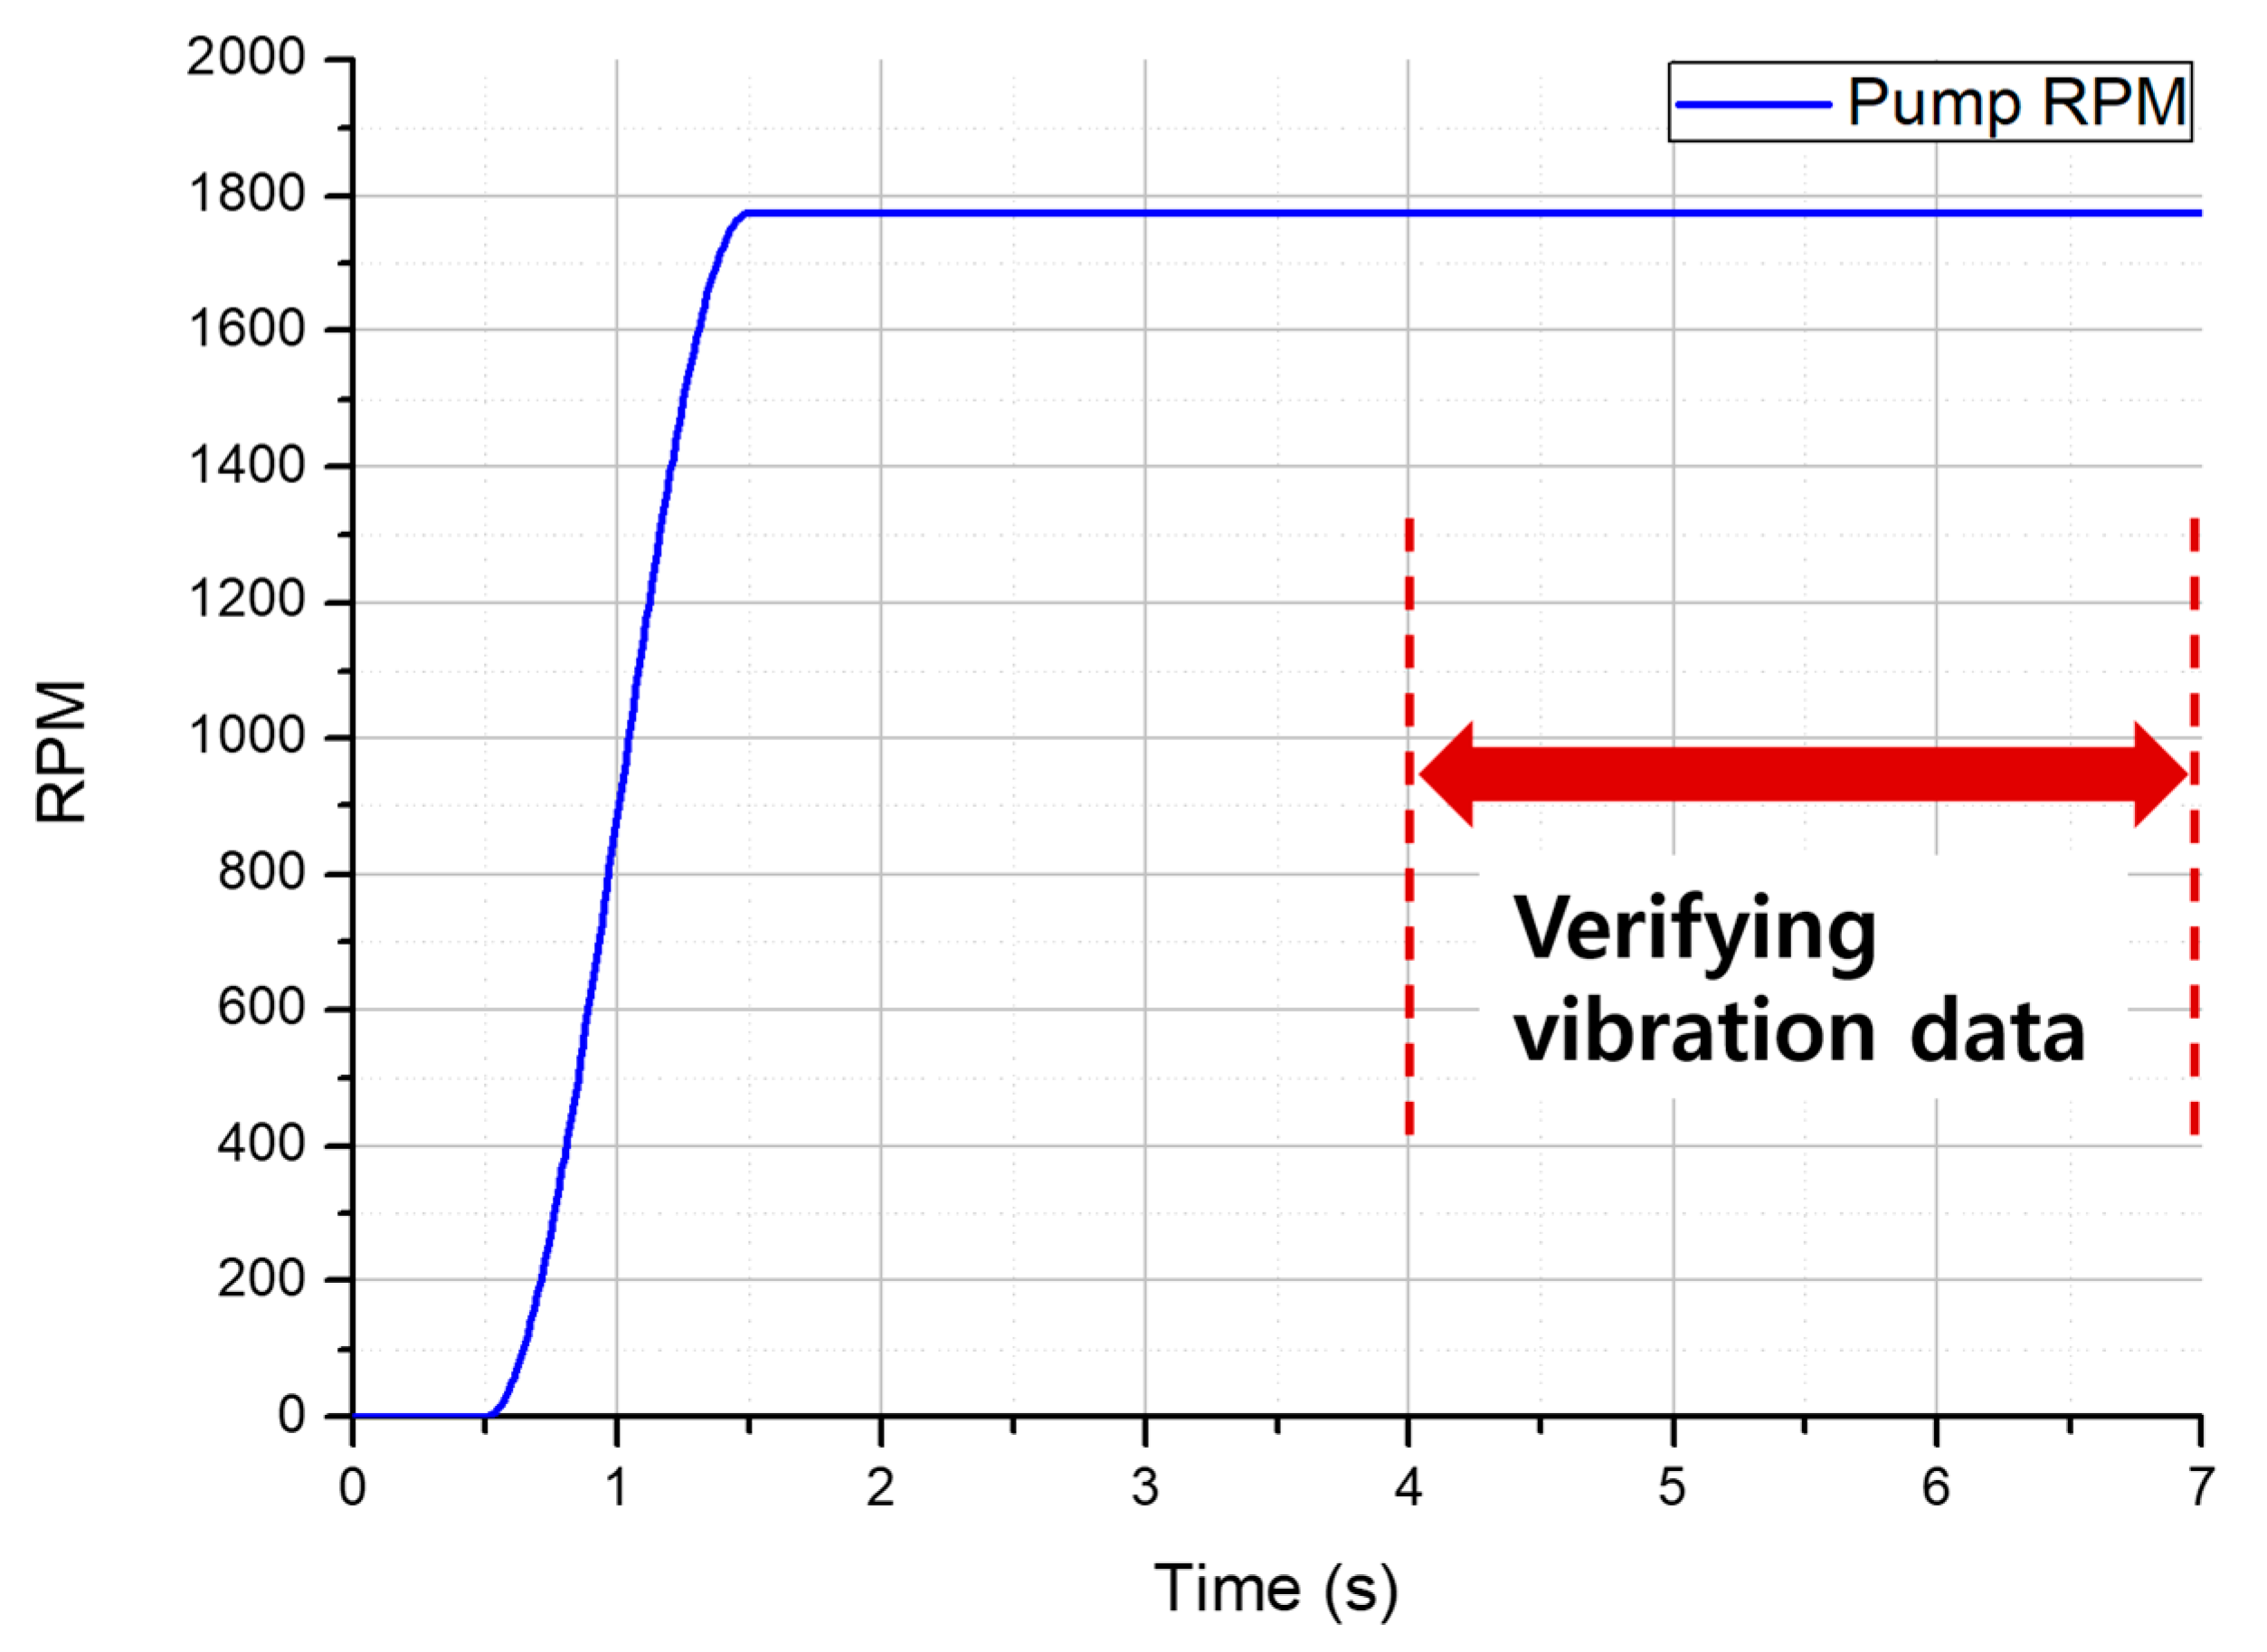
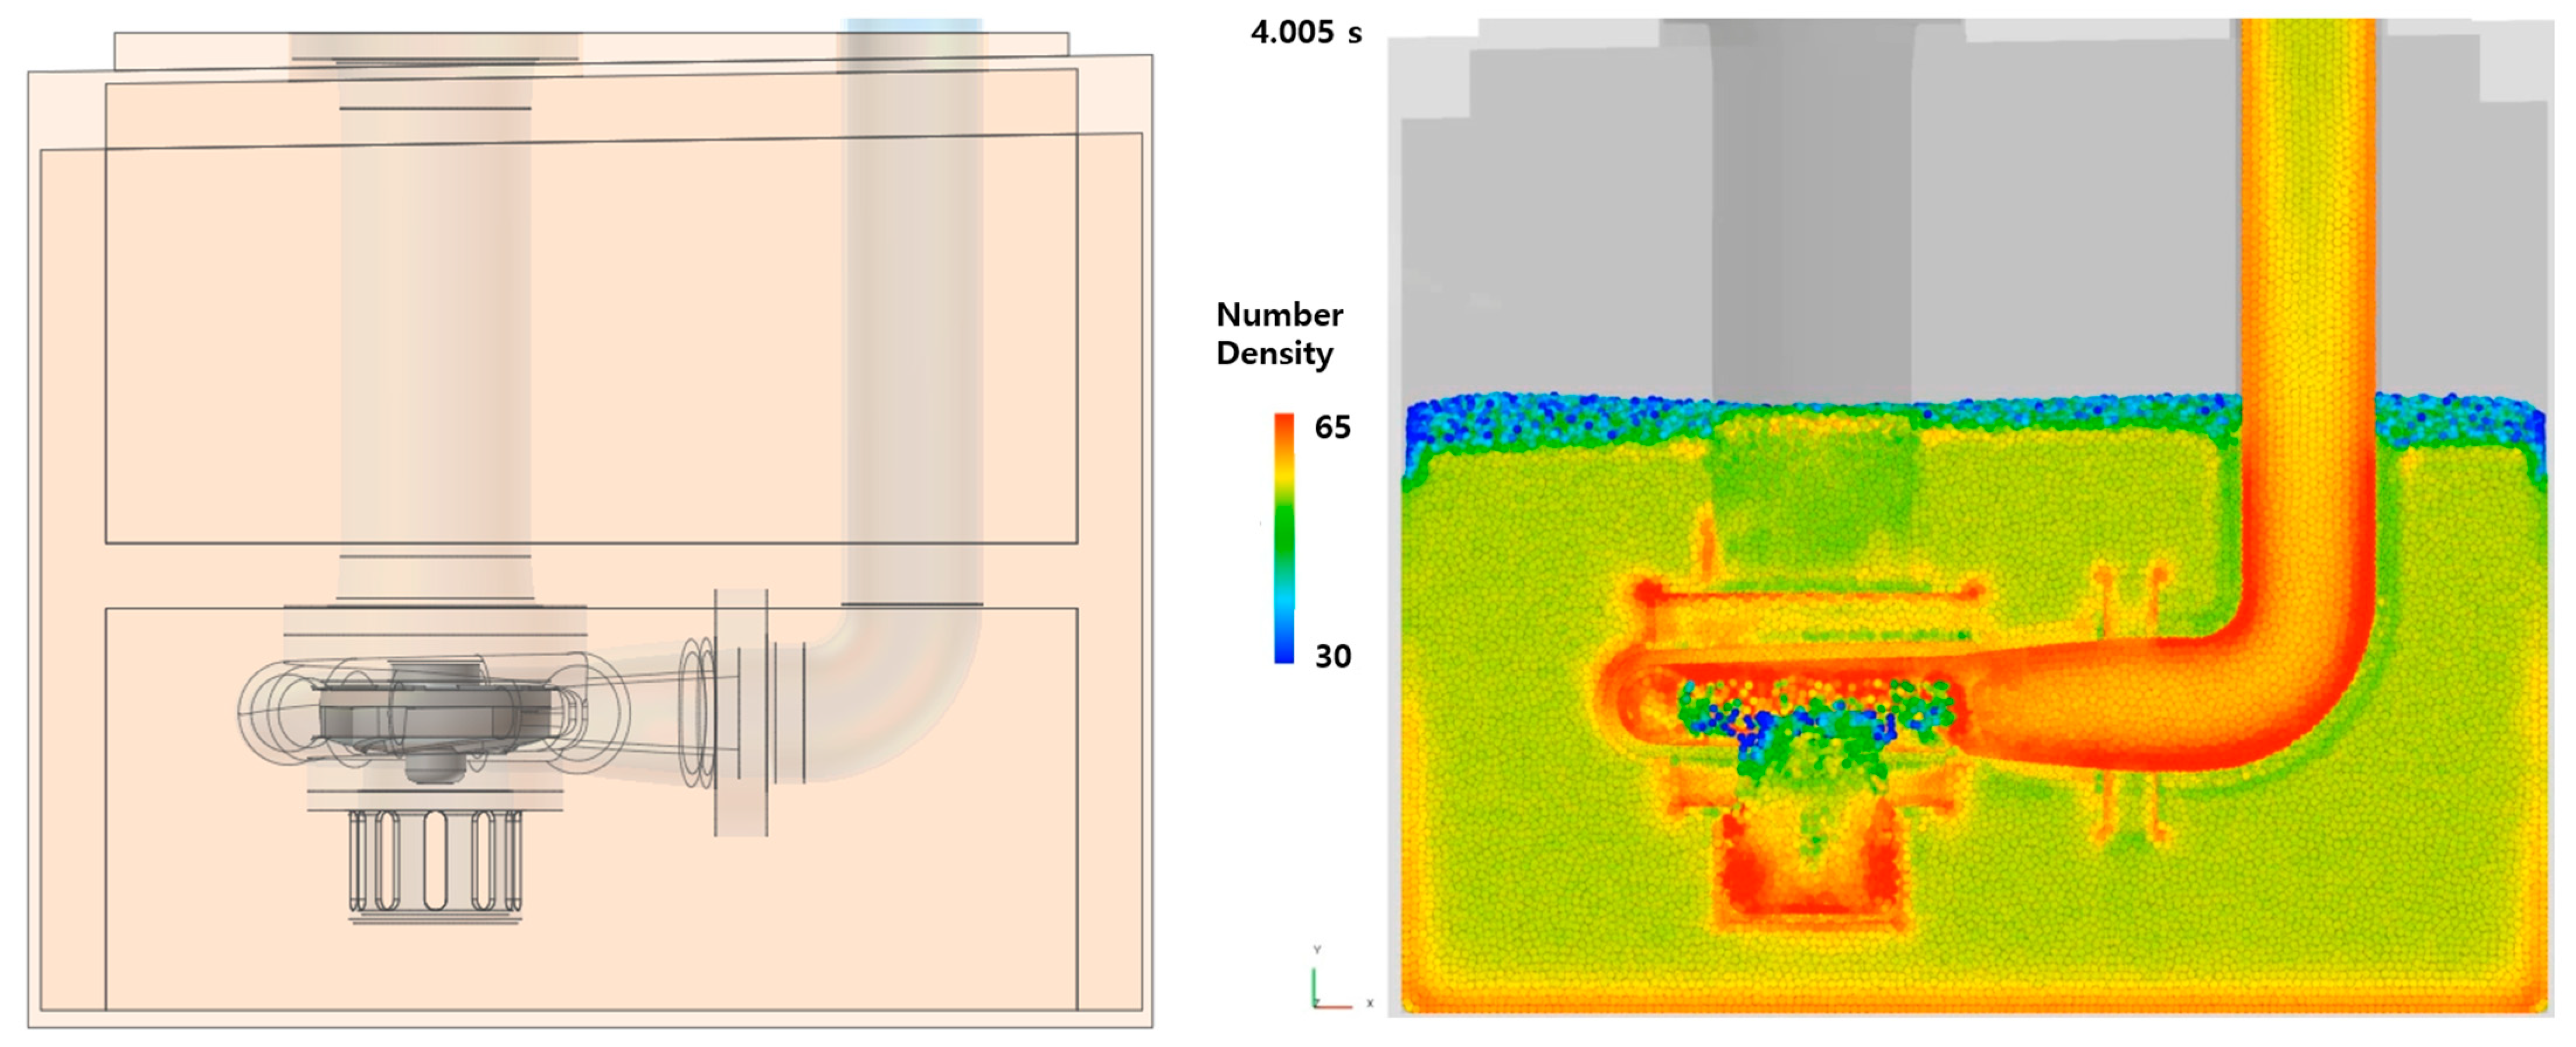
To measure the reaction force caused by the pump, as shown in Figure 4, a speed of 1775 rpm of the actual pump was applied. To stabilize the data of the analysis, the pump was not operated in the 0–0.5 s range, and the rpm speed of the pump was increased in the time range from 0.5–1.5 s. Additionally, a constant rpm was applied from 1.5–7 s, and from 4–7 s, as shown in Figure 5. As the fluid in the pump is in a state of saturation, the 4–7 s range in which the fluid was completely absorbed and operated was secured as data. Images of the impeller of the pump located inside the water tank and before driving without the washing liquid are shown in the left image of Figure 5. If the pump is driven while there is cleaning liquid inside the water tank, the cleaning liquid is pulled up through the inside of the pump and the pipe, as shown in the image on the right side. The image on the right side of Figure 5 shows the particle analysis results, and compared to the mesh, only the fluid region was composed of particles and the analysis proceeded. The number of particles used in the analysis was 1,120,788. The image on the right, which was analyzed using particles, is the image at 4 s when the fluid was in a state of saturation. Depending on the amount of density, a high density is displayed in red and a low density is displayed in blue. In the impeller part, the fluid was moved by the rotation of the impeller; thus, the density was lower than that of the peripheral part. In addition, the pushed fluid rises through the pipe, and a high-density value was observed in the region where the pipe was bent.
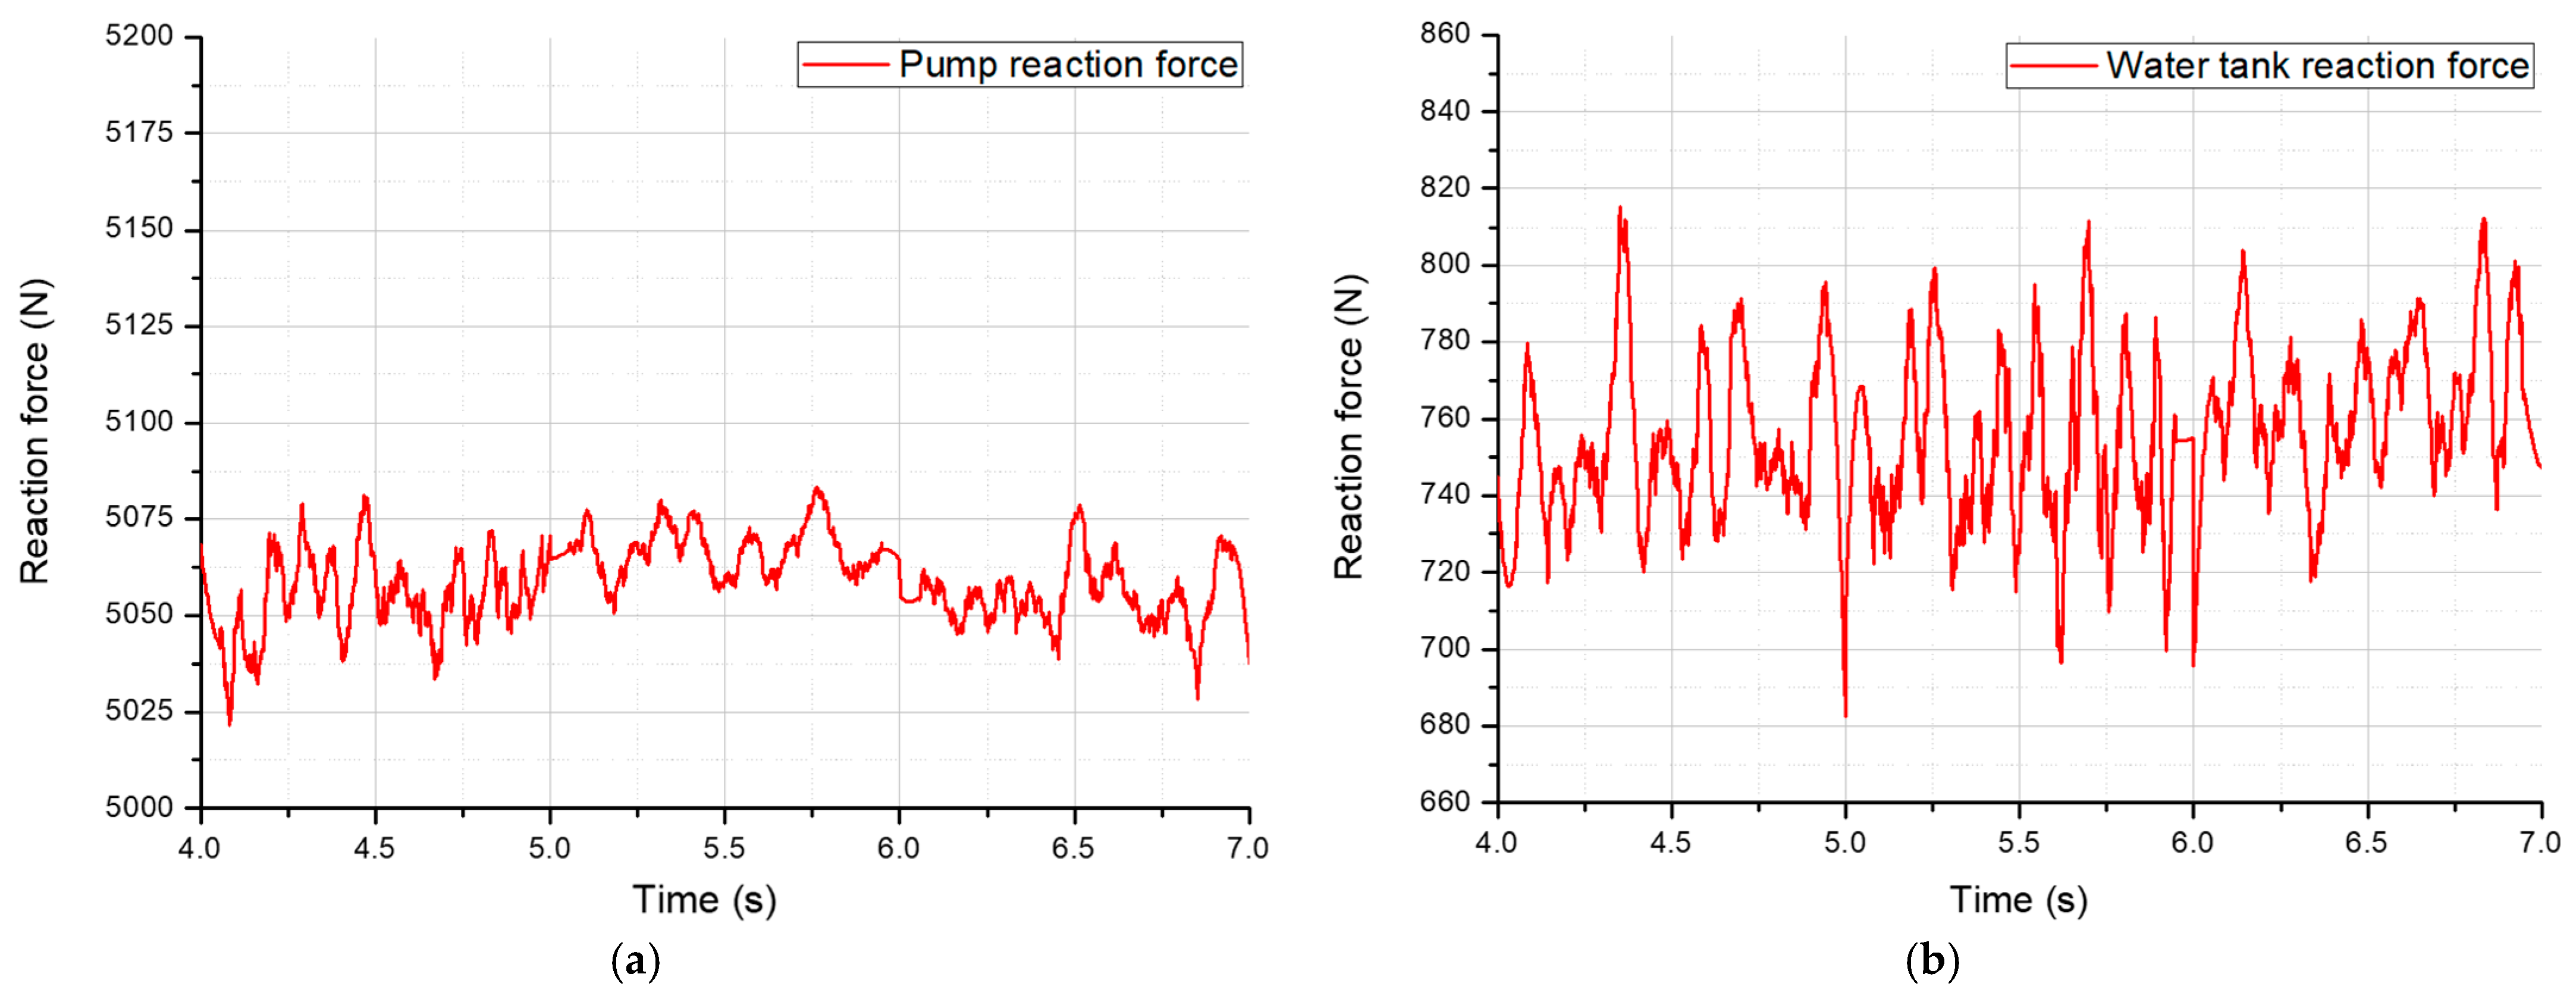
In the state in which the fluid is saturated, there is no significant change in the data over time, and the two-way FSI analysis takes a long time to analyze, so 3 s of data was obtained for 4–7 s, which is in the saturated state. The pump is placed on a water tank, and since the water is pulled up, the largest vibration is generated in the direction of gravity. This was the same when the maximum reaction force of the pump operated through analysis was calculated, and the maximum reaction force for the direction of gravity is as shown in Figure 6. The maximum reaction force of the pump obtained at this time is the reaction force value generated when the cleaning liquid was pulled up by the impeller while the fluid is satiated. As the impeller pulls up the fluid, continuous contact with the fluid occurs, and the force of the impeller pulling up the fluid increases with an increase in the density of the fluid. Therefore, the maximum reaction force of the pump was generated when the fluid is satiated, and the maximum excitation force of the pump, which can be confirmed through data, was 5083 N, as shown in the left graph of Figure 6.
Based on the calculated reaction force of the pump, the maximum value of the force transmitted to the water tank is expressed as Equations (1)–(9). The pump mounted on the water tank generates a large vibration in the direction of gravity, and to meet the specifications of the scrubber, it is necessary to reduce the vibration of the water tank. Therefore, it is essential to verify the analysis data by comparing the maximum reaction force value of the water tank calculated for the direction of gravity with the theoretical value, such as the data on the right side of Figure 6. Equation (1) was used to calculate the kinetic equation with a 1 degree of freedom system to obtain the maximum force of the water tank transmitted in the direction of gravity. If the forced oscillation caused by the excitation of a one-degree-of-freedom system is expressed as a motion equation, it can be represented using Equation (1), and if the two sides are divided by m and the steady-state response is obtained, the amplitude can be calculated using Equation (2). In addition, as the pump was mounted on a water tank and a plate was placed between them, Equation (1) can be modified into Equation (3). Assuming that the transient response is 0, Equation (4) can be substituted into Equation (3) to obtain Equation (5), which can be summarized using sine synthesis to obtain Equation (6). Here, the maximum transfer force through which the reaction force of the pump is transmitted to the water tank can be expressed as Equation (7). By substituting Equation (2) into Equation (7) and applying and summarizing Equation (8) can be obtained.
where is the ratio of the maximum value, of the force transmitted to the floor to the maximum value, , of the reaction force applied to the water tank. To minimize the force transmitted by the reaction force of the pump to the water tank, the value of should be minimized. The second term, , on the right side of Equation (8) can be removed from the equation if the vibration in the horizontal direction of the pump is excluded. In addition, when the denominator and molecule are divided into , and making it dimensionless with the frequency ratio , they can be summarized as expressed in Equation (9). The force transmission rate () according to the reaction force of the pump in the direction of gravity can be expressed as Equation (9).
To calculate the maximum value of the force transmitted in the direction of gravity to the water tank, the coefficients of Equation (9) must be obtained. As the rotation speed of the pump is 1775 RPM, the exciting frequency, , is 185.8 rad/s. In addition, the natural frequency is calculated as 49.9 rad/s when considering the stiffness value in Table 4 because the weight of the pump is 472 kg. Therefore, the frequency ratio was calculated as 3.72, and when the calculated coefficients are reflected in Equation (9), the calculated maximum force transmitted to the water tank was 827.5 N. Based on this, the rate of force transmission from the pump to the water tank was calculated as 0.139, and it can be confirmed that the force was transmitted only for 13.9%. To compare this with the analysis data, the reaction force against the direction of gravity in the water tank was measured, as shown in Figure 6. The maximum reaction force measured was 815.1 N, and Table 5 shows the comparison of this value with the value calculated using the theoretical formula. Both values exhibited a relatively small error rate of 1.5%, indicating that the modeling conditions implemented by the analysis program were correctly applied.
3. Selection of Design Factors for Vibration Reduction
3.1. Configuring an Analysis Case
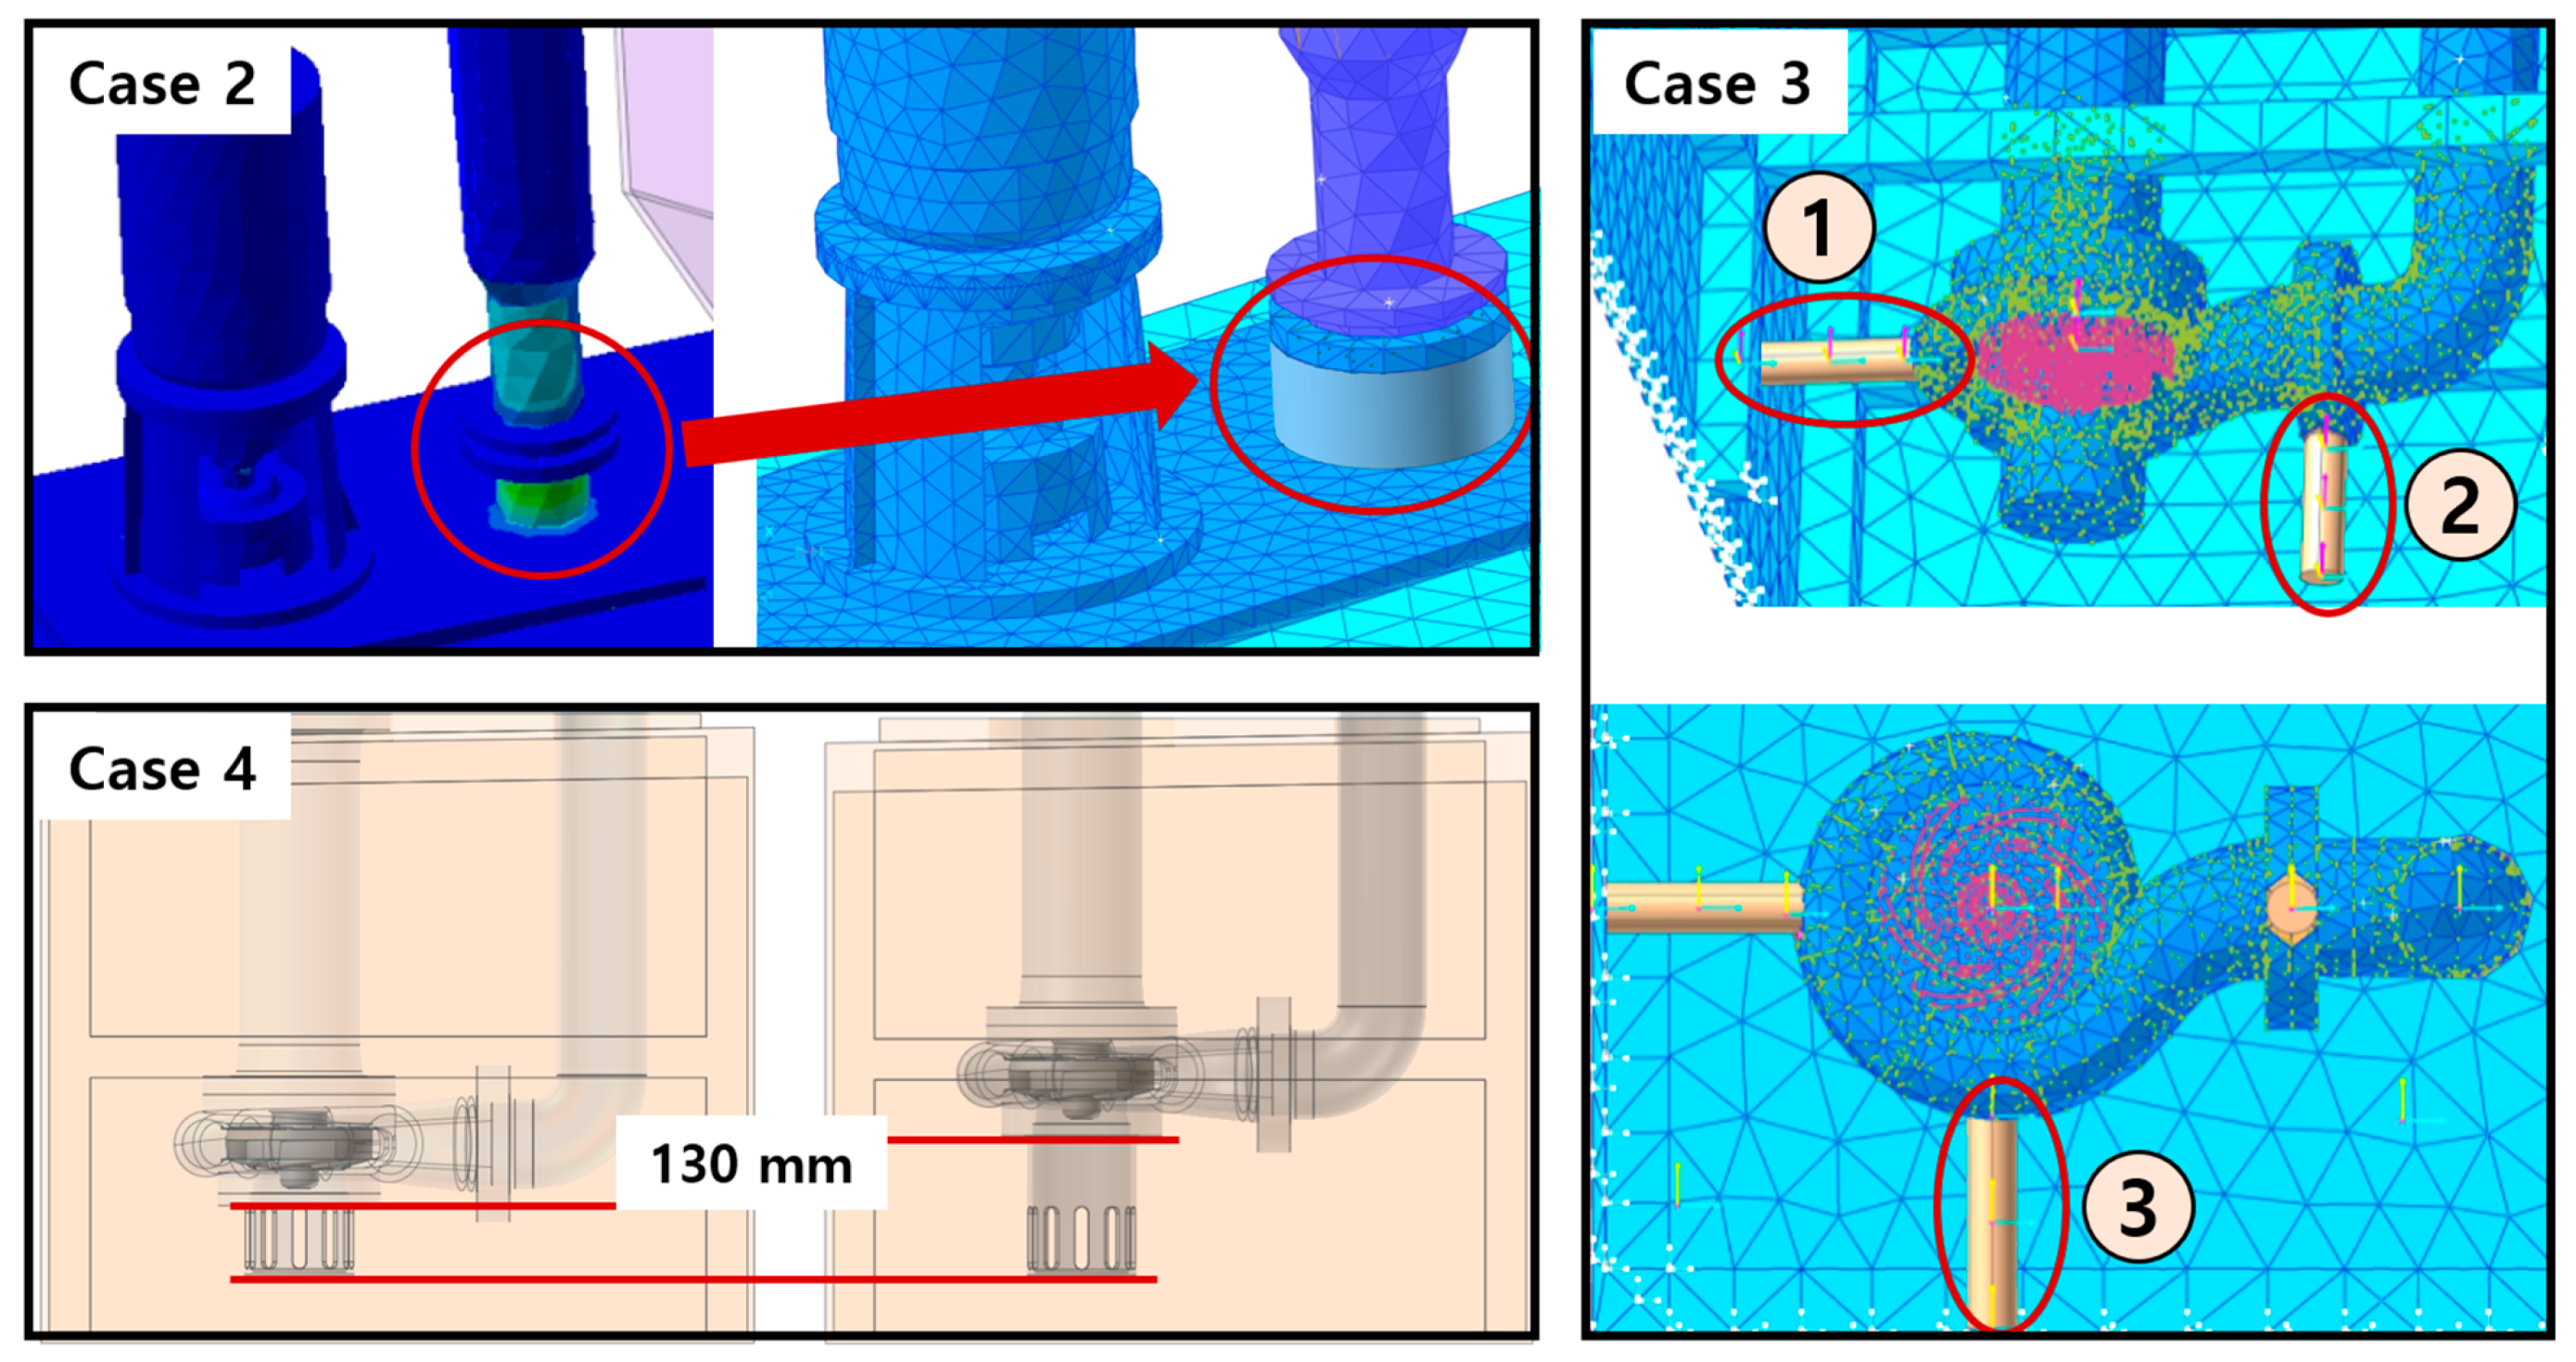
To reduce the vibration of an already installed and operating scrubber, it is essential to select some design factors and reinforce the structure as it is difficult to change the overall design. The design factors were selected within the range that can be reinforced in reality, and are listed in Table 6. However, simultaneously applying all the selected design factors is not cost effective; thus, it is essential to determine and apply the most efficient design factor for vibration reduction. Five cases were investigated in this study. Case 1 was not been structurally reinforced, and the vibration data of the other cases with a change in the design were compared to that of case 1. The part where the upper end of the pump is connected to the pipe was reinforced in Case 2, and the stress distribution caused by the operation of the pump revealed that the stress was concentrated on the connection part of the upper end of the pump (Figure 7). As the stress size was small, it had no effect on the structural safety, but it may affect vibration owing to the occurrence of displacement due to stress. Therefore, this part was reinforced with cast iron, which exhibits an excellent vibration damping ability. Further, in Case 3, as vibration is generated while the impeller pushes out the fluid, the structure of Case 3 was reinforced in the three-axis direction between the impeller and the water tank (Figure 7). In addition, as vibration displacement could be transferred to the water tank, the structure in Case 3 was reinforced using the same cast iron used in case 2. The reinforced structure enabled the reduction of the displacement of the impeller in each direction due to the operation of the pump as much as possible, thus reducing the vibration.
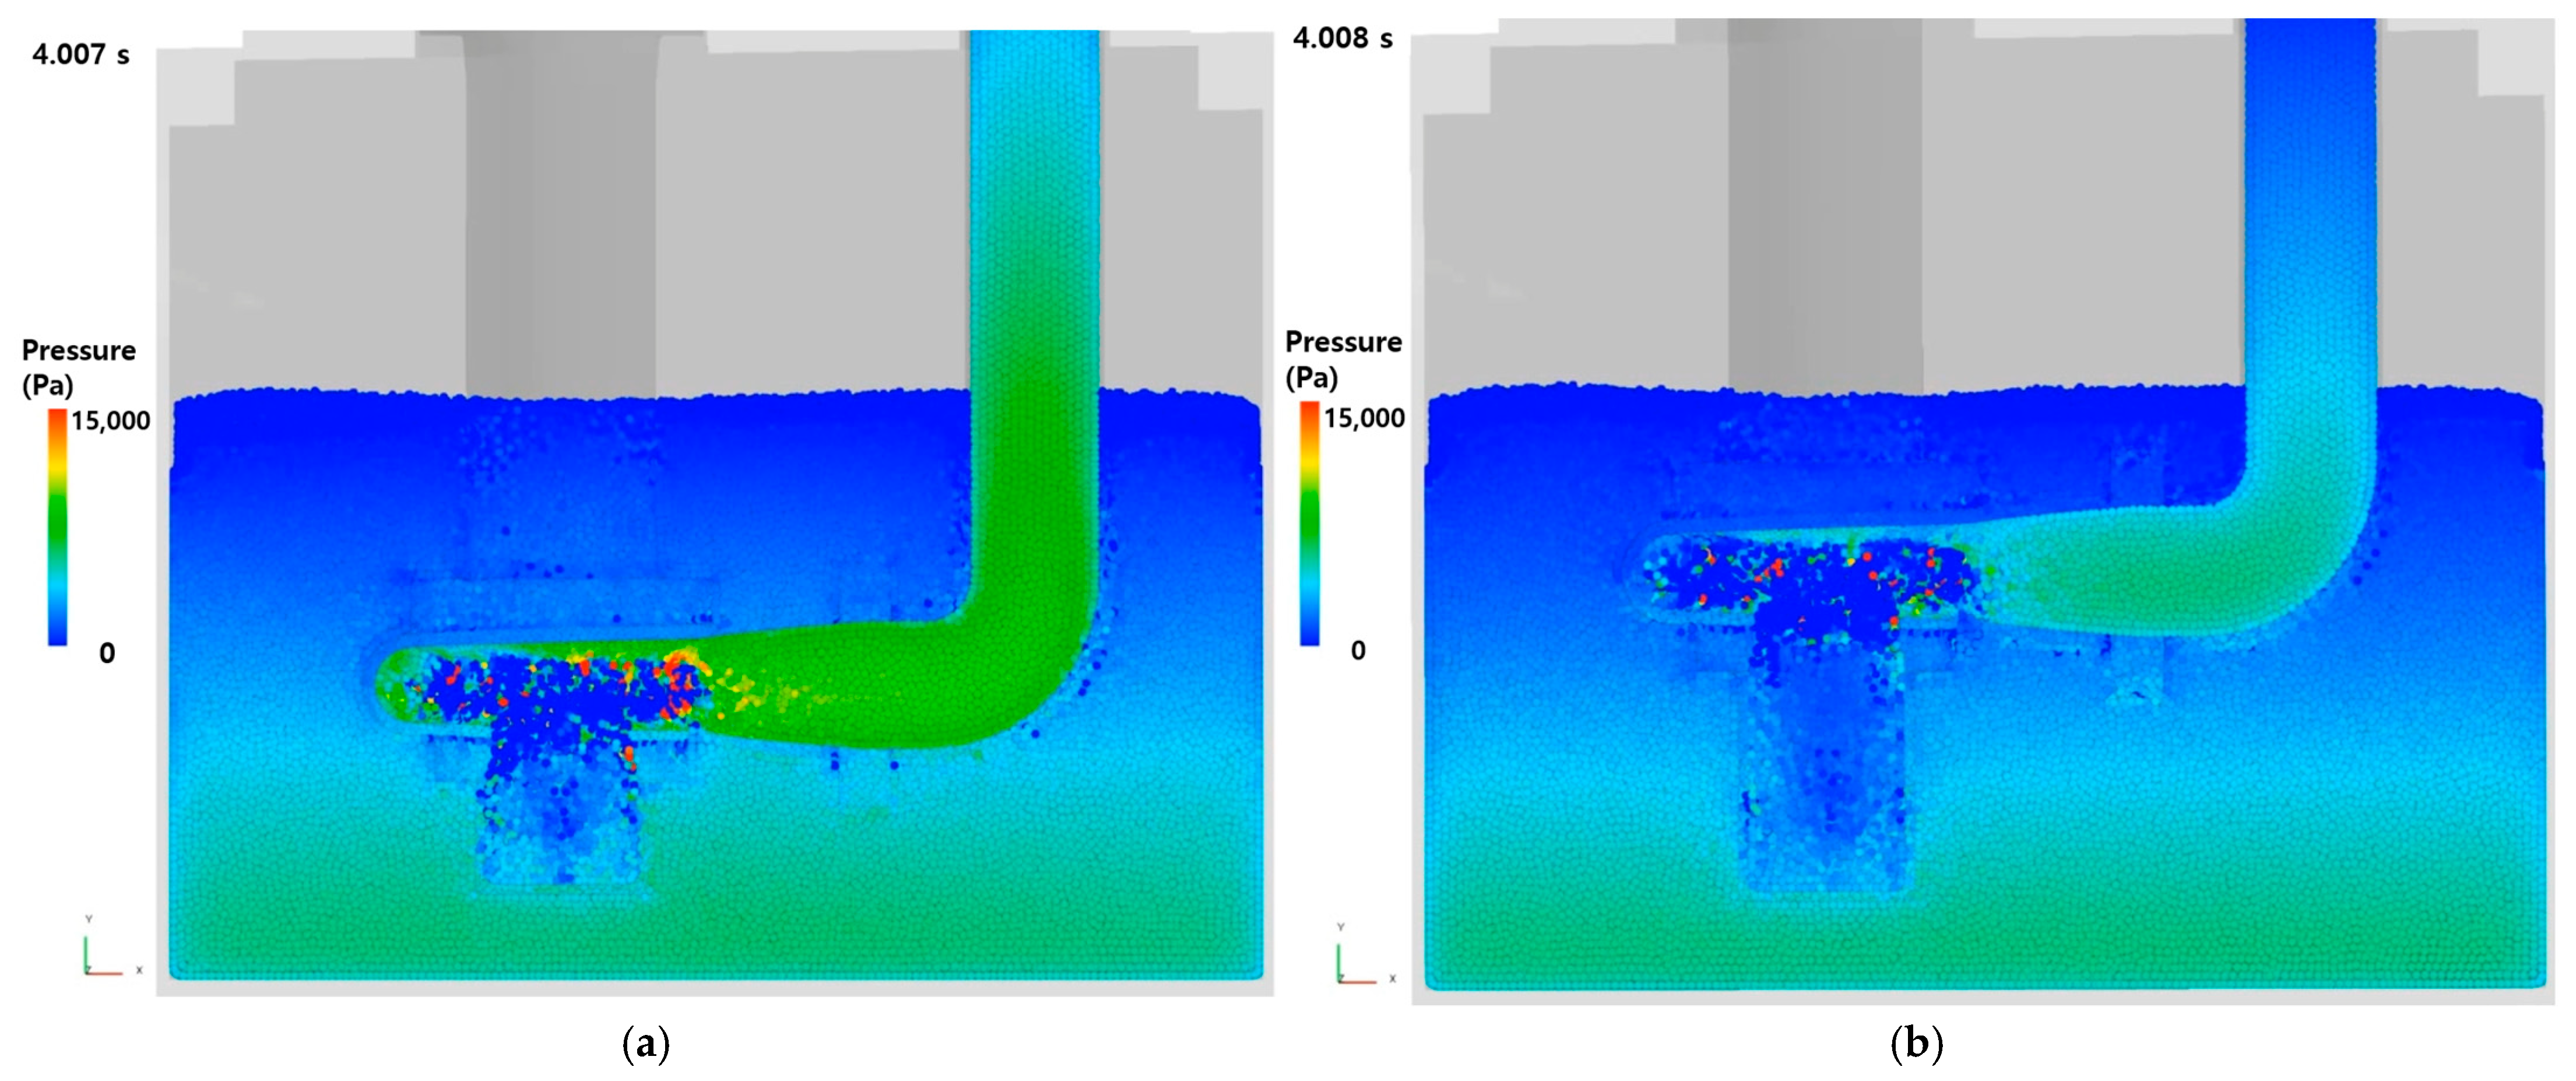
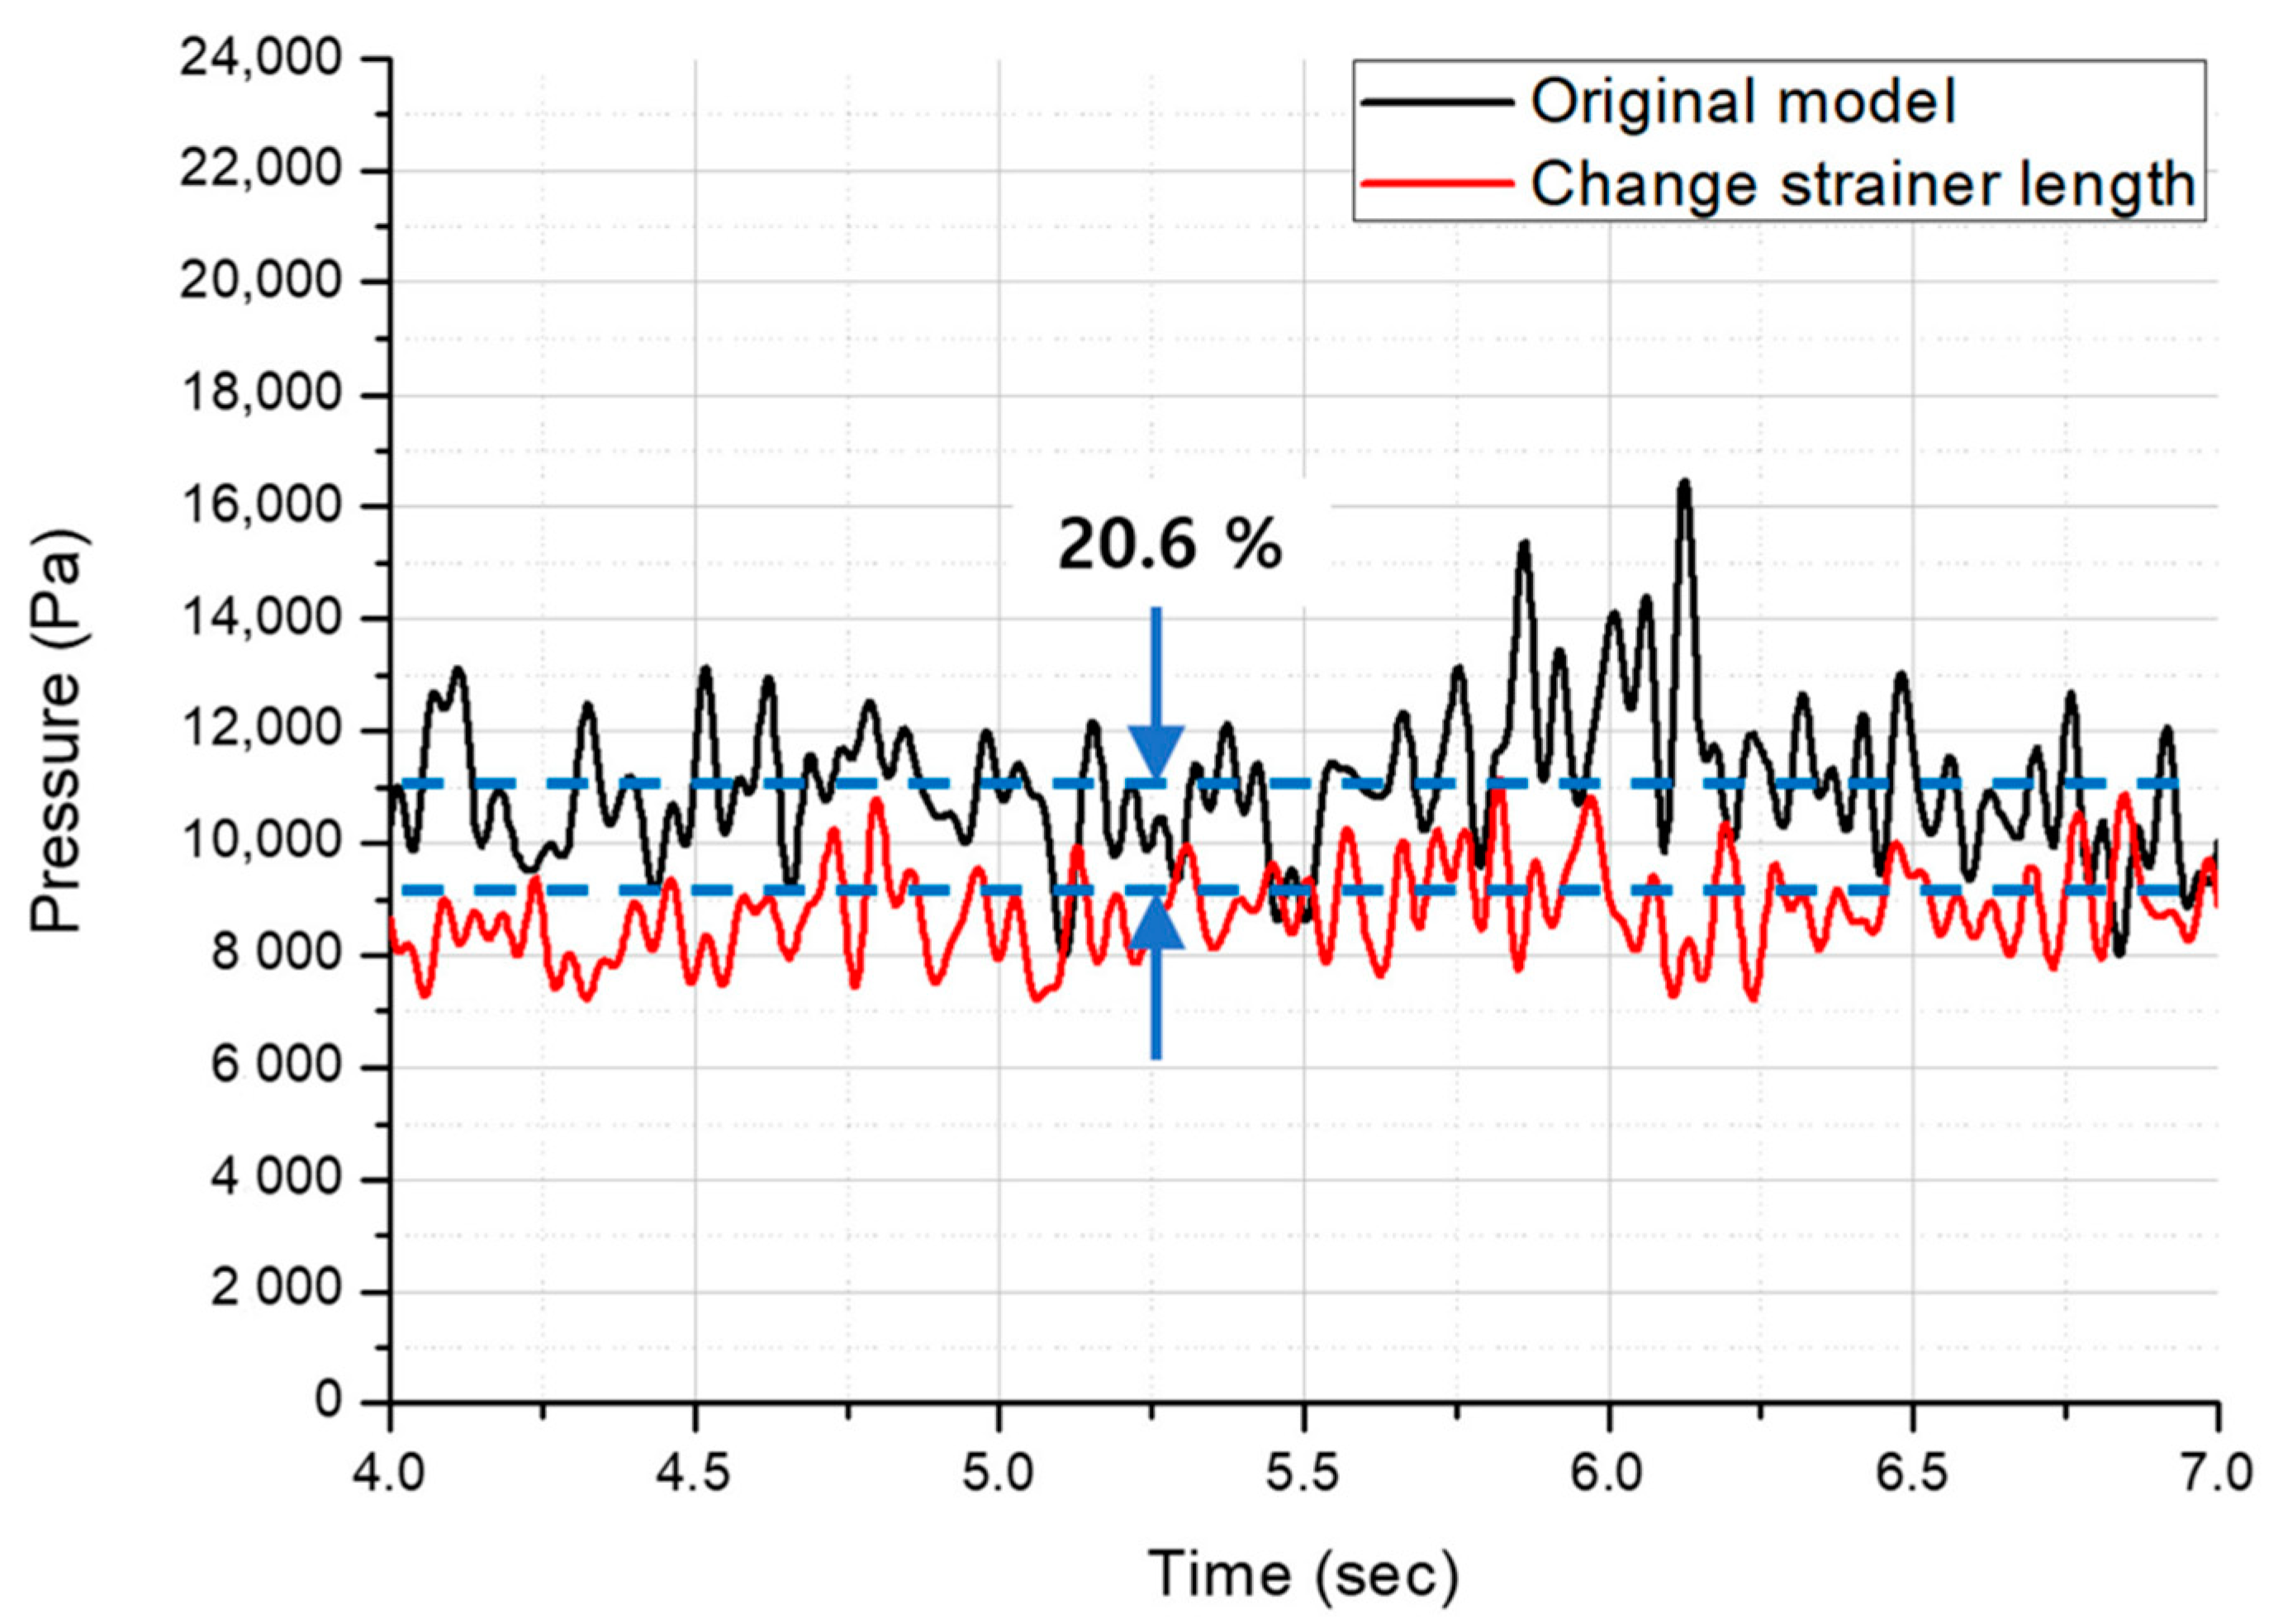
For case 4, the length of the strainer at the bottom of the pump was increased to reduce the flow rate and pressure transferred to the pipe (Figure 7). This was intended to reduce vibration by reducing the loads applied per unit area, and if the flow rate transmitted by the pump is reduced, cavitation that may occur in the pipe can be minimized. Figure 8 shows the pressure image at 4 s, where the fluid in the pump and pipe was in a saturation state. If the pressure is high or low, the image is displayed close to red or blue, respectively. The overall pressure reduced with an increase in the length of the strainer, and the average value of the pump internal pressure can be numerically confirmed using Figure 9. The graph presents the average value of the internal pressure of the pump for 4–7 s, which is the saturation state, and compared the average value of the data. As shown in the image, the pressure reduces by approximately 20.6% with an increase in the strainer length.
3.2. Modal Analysis
As the pump was installed and operated on the upper part of the water tank, the water tank must be designed to withstand the weight and vibration of the pump. However, it is impossible to change the shape or modify the height of the water tank of already installed and operating scrubbers. Therefore, this should be approached by reinforcing the support inside the water tank. Table 6 presents the contents of case 5 corresponding to this. This research performed a modal analysis to efficiently reinforce the support, and the mode shape according to the natural frequency was confirmed. The natural frequencies were measured from the 1st to the 6th orders, and the frequency data for each order is shown in Table 7. Figure 10 shows the part to be structurally supplemented through the mode shape for each order, and shows the mode shape before and after reinforcement. The image at the top is the mode shape of case 1 without any reinforcement. The image located in the middle shows the case where only the periphery of the impeller was reinforced, and in this case, the central part of the water tank was not reinforced; thus, the displacement characteristics due to vibration were generally unstable. Therefore, the reinforcement of the inside of the water tank as a whole was a more efficient design in terms of vibration when considering the mode shape.
4. Analysis of Vibration Data
Semiconductor-related equipment is very sensitive to vibration, and there are vibration specifications that must each be satisfied. This study investigated a scrubber with a vibration velocity of 4.5 mm/s or less. As regulations on allowing vibration of some semiconductor equipment in buildings where scrubbers are installed have been strengthened, the standards for vibration specifications according to the operation of the scrubber have been changed. The vibration velocity should be reduced to 4 mm/s or less, and as it is already installed and in operation, the vibration specification should be matched using structural reinforcement within the possible range. Therefore, this study performed an analysis based on the design variables listed in Table 6, and the results were compared to suggest an efficient vibration design.
4.1. Comparison of Data According to Design Factors
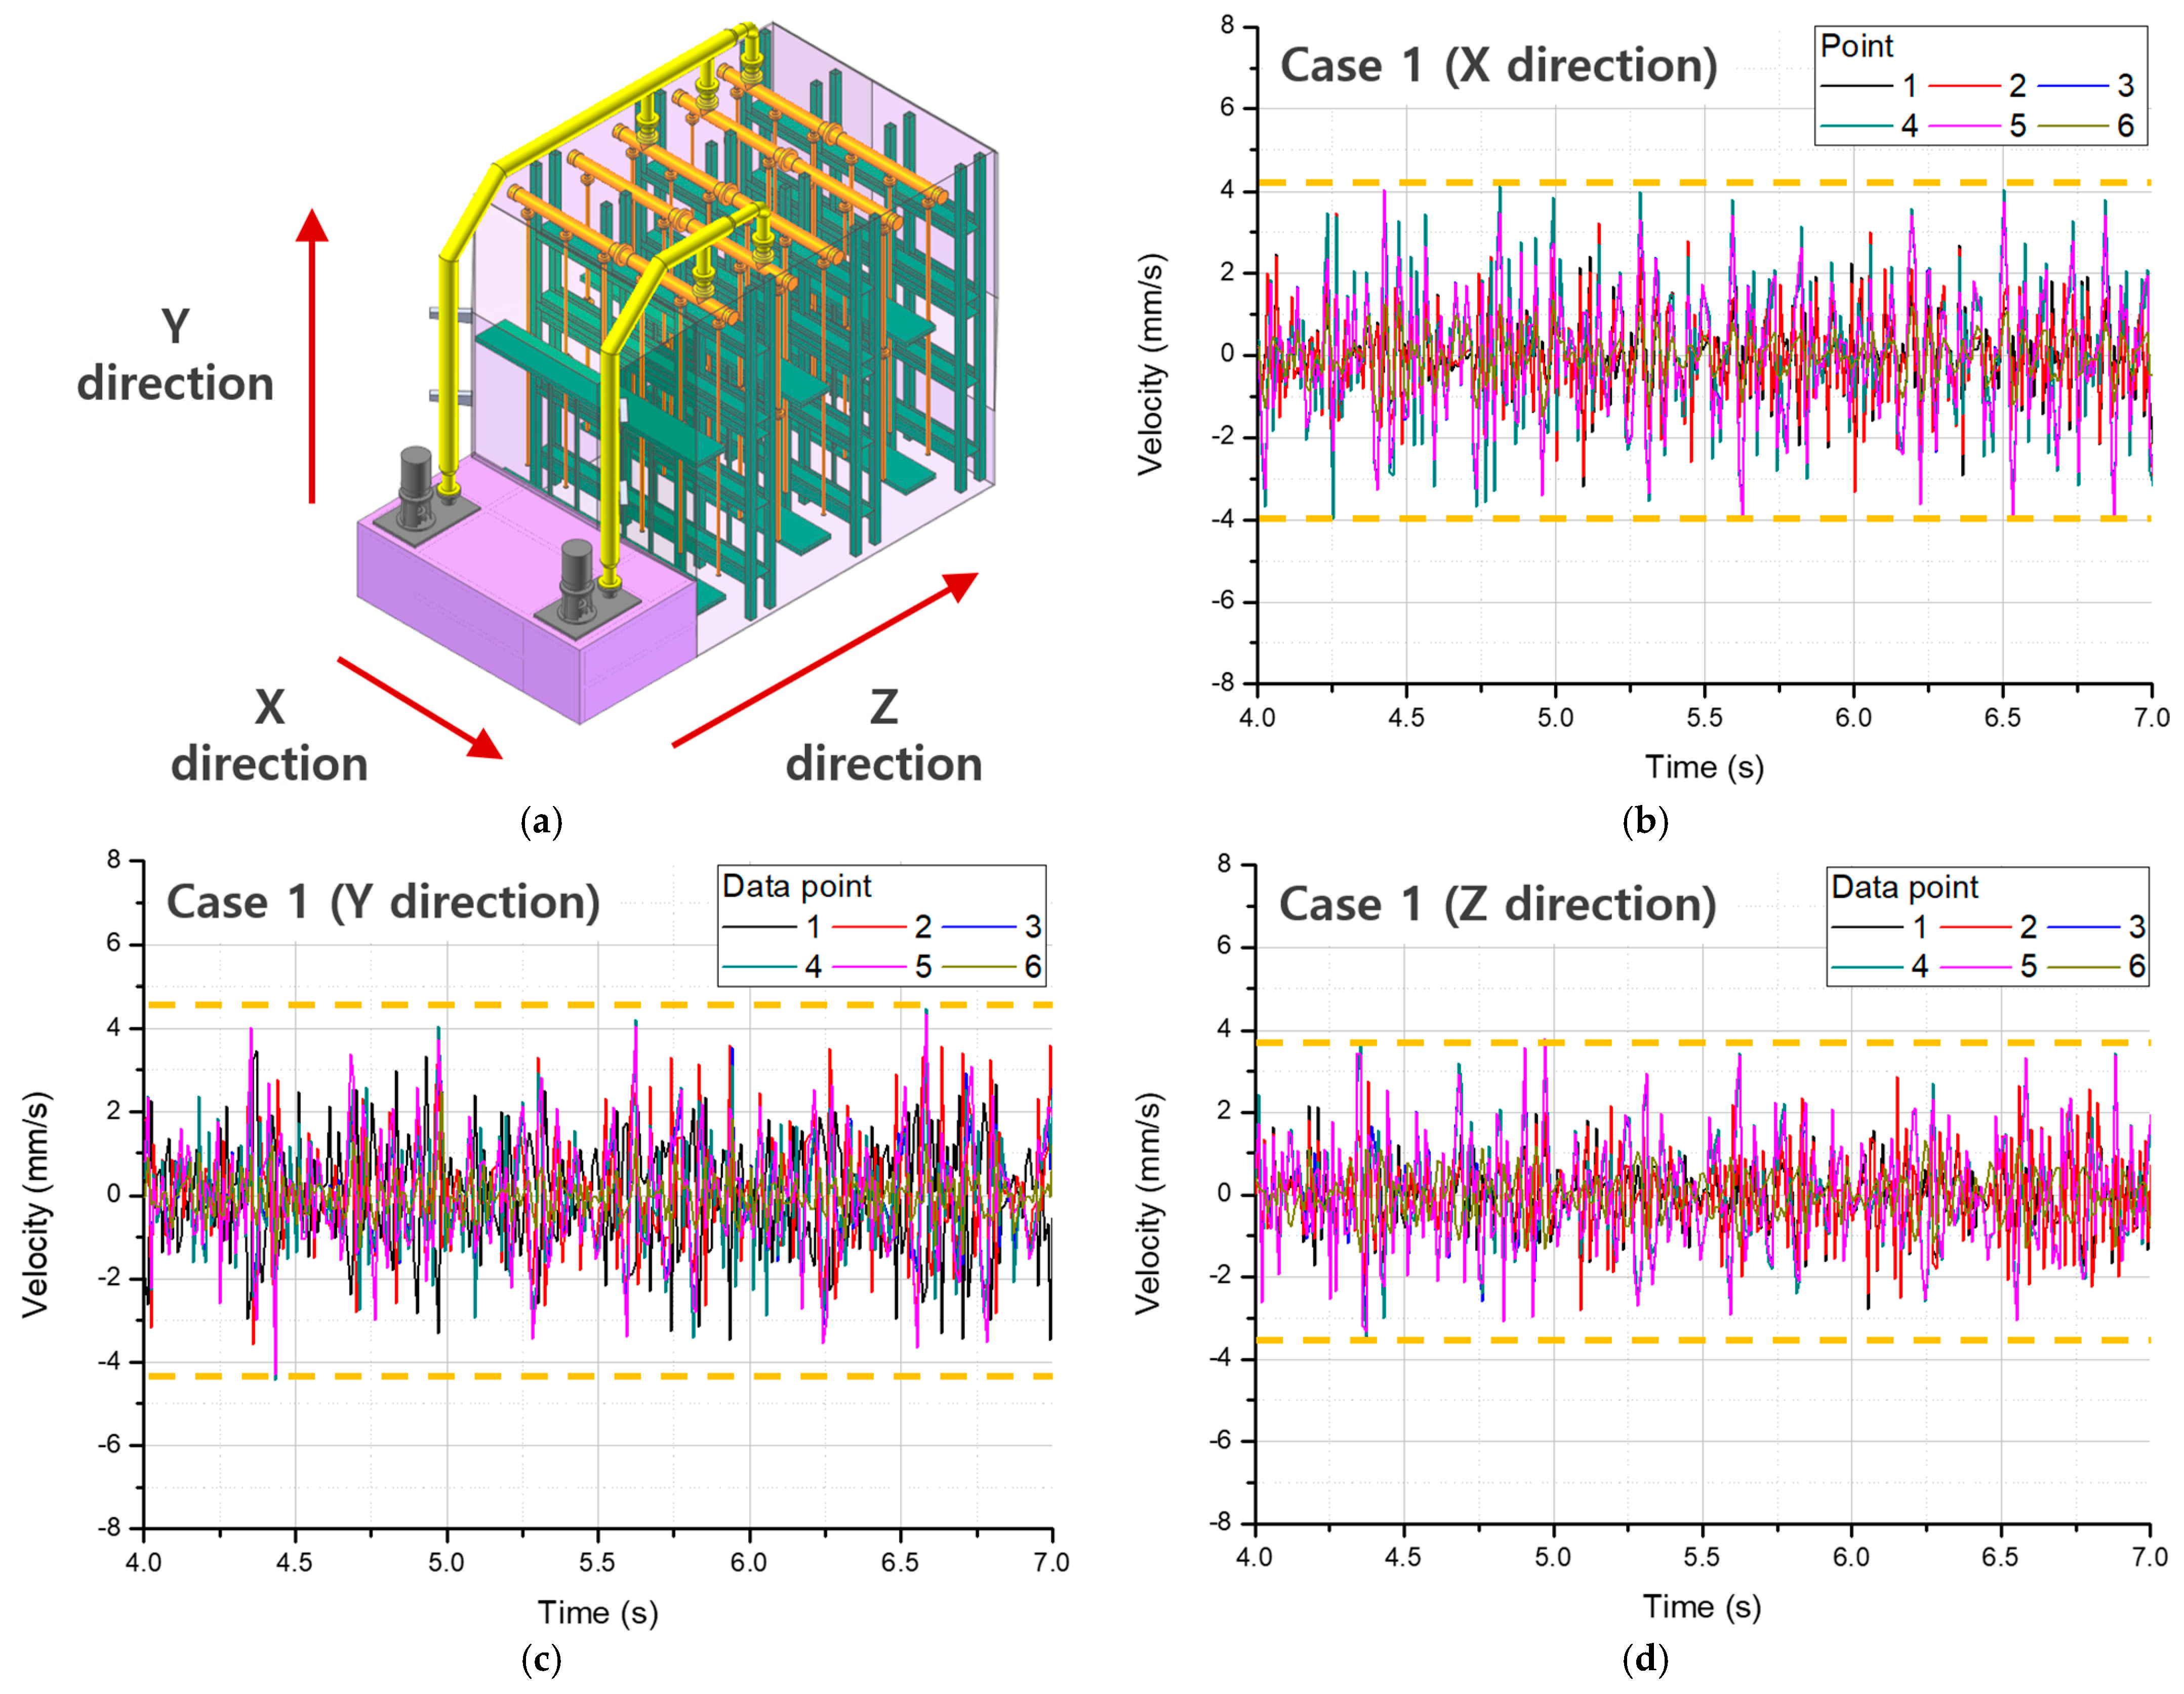
Figure 11 shows the vibration data for the original model (case 1) without structural reinforcement. This data was confirmed based on the six points shown in Figure 3, and data were secured for 4–7 s when the fluid was in the saturation state. The maximum vibration velocity along the X, Y, and Z-axis was 4.14, 4.46, and 3.71 mm/s, respectively, and the largest vibration value was observed in the Y direction, which is the gravity direction. This indicates that the design satisfied the vibration velocity requirement of 4.5 mm/s or less, which is the reference value before the change. Therefore, the results of the reinforced structures were analyzed based on the vibration value of Case 1.
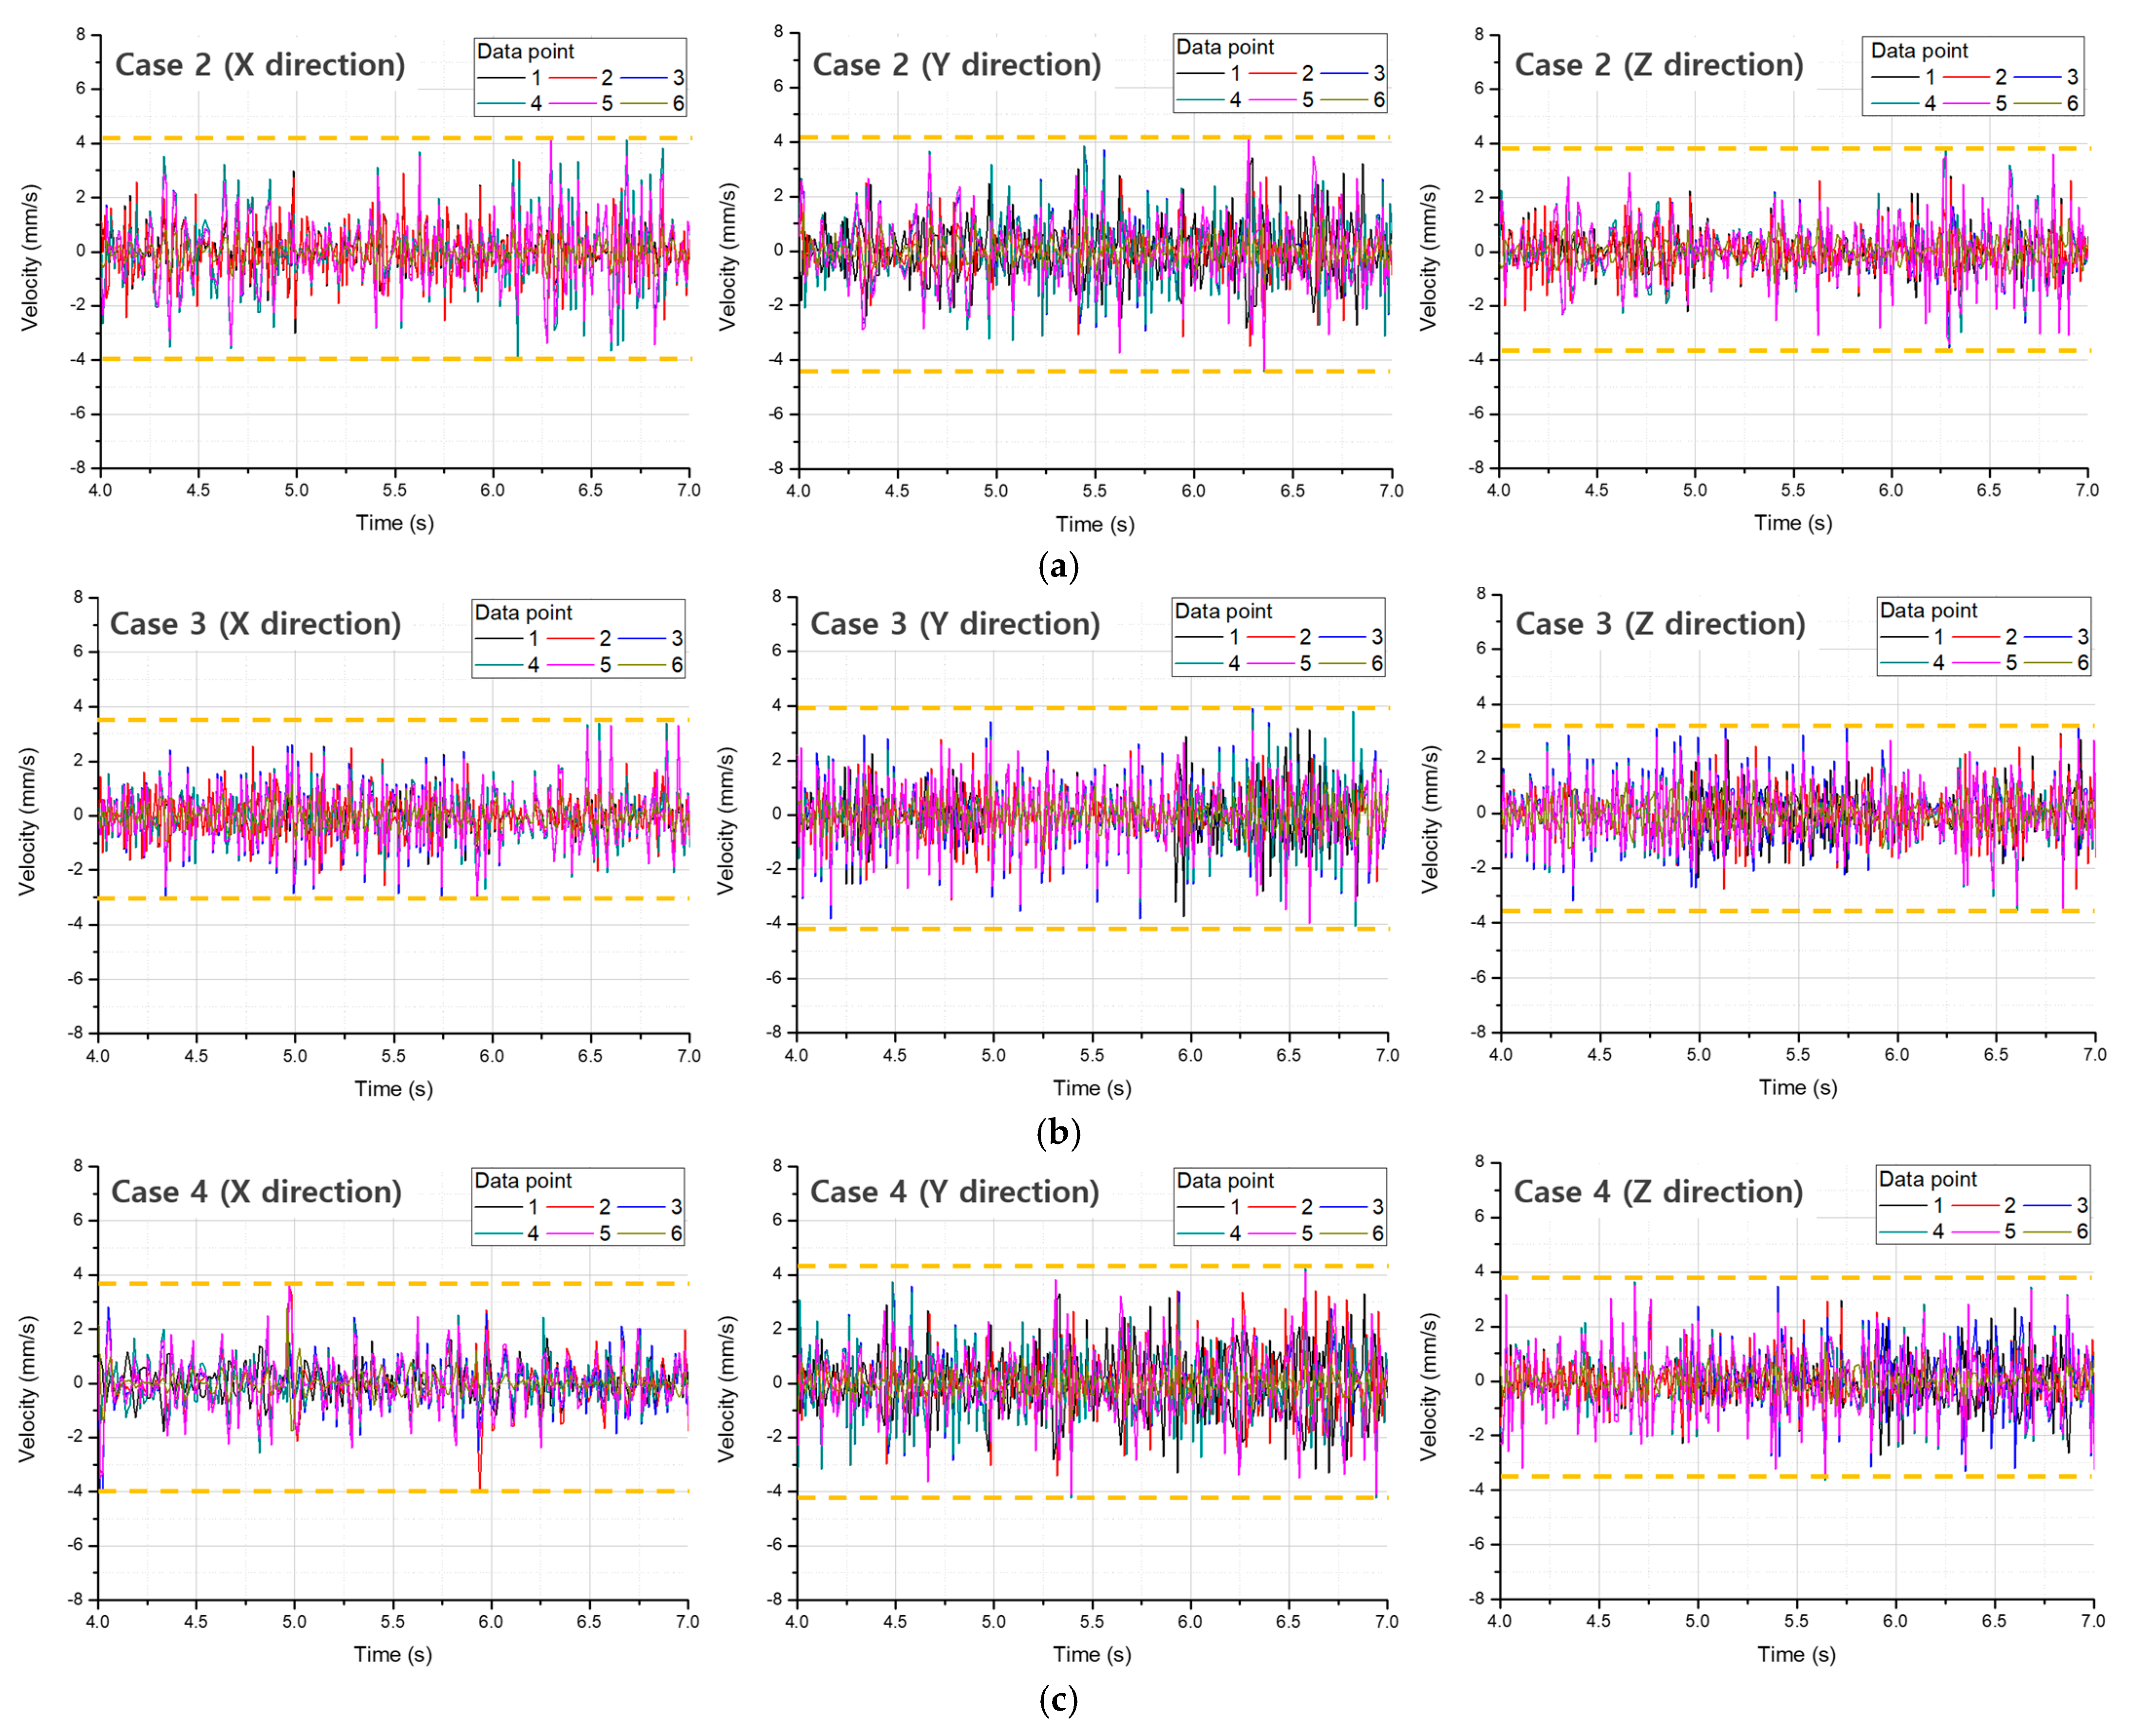
Figure 12 shows the vibration data for each axial direction of Cases 2 to 4. For Case 2, in which the upper part of the pump connected to the pipe was reinforced, a maximum vibration velocity of 4.42 mm/s was observed in the Y direction. Compared to that of the original model, this corresponded to a decrease of approximately 0.9%, indicating that the design did not efficiently reduce vibration. In addition, for Case 3 in which the impeller part was reinforced in each axial direction, a maximum vibration velocity of 4.07 mm/s was observed in the Y direction. This indicates that if the impeller part is fixed, the vibration reduced by approximately 9%; however, this is unsuitable for the design because the vibration value is higher than 4 mm/s. For Case 4 in which the length of the strainer at the lower end of the pump was increased, a reduction in vibration was expected owing to a decrease in pressure; however, a maximum vibration velocity of 4.25 mm/s was observed in the Y direction. Although the vibration reduced by approximately 4.6%, it cannot be regarded as an efficient design compared to Case 2.
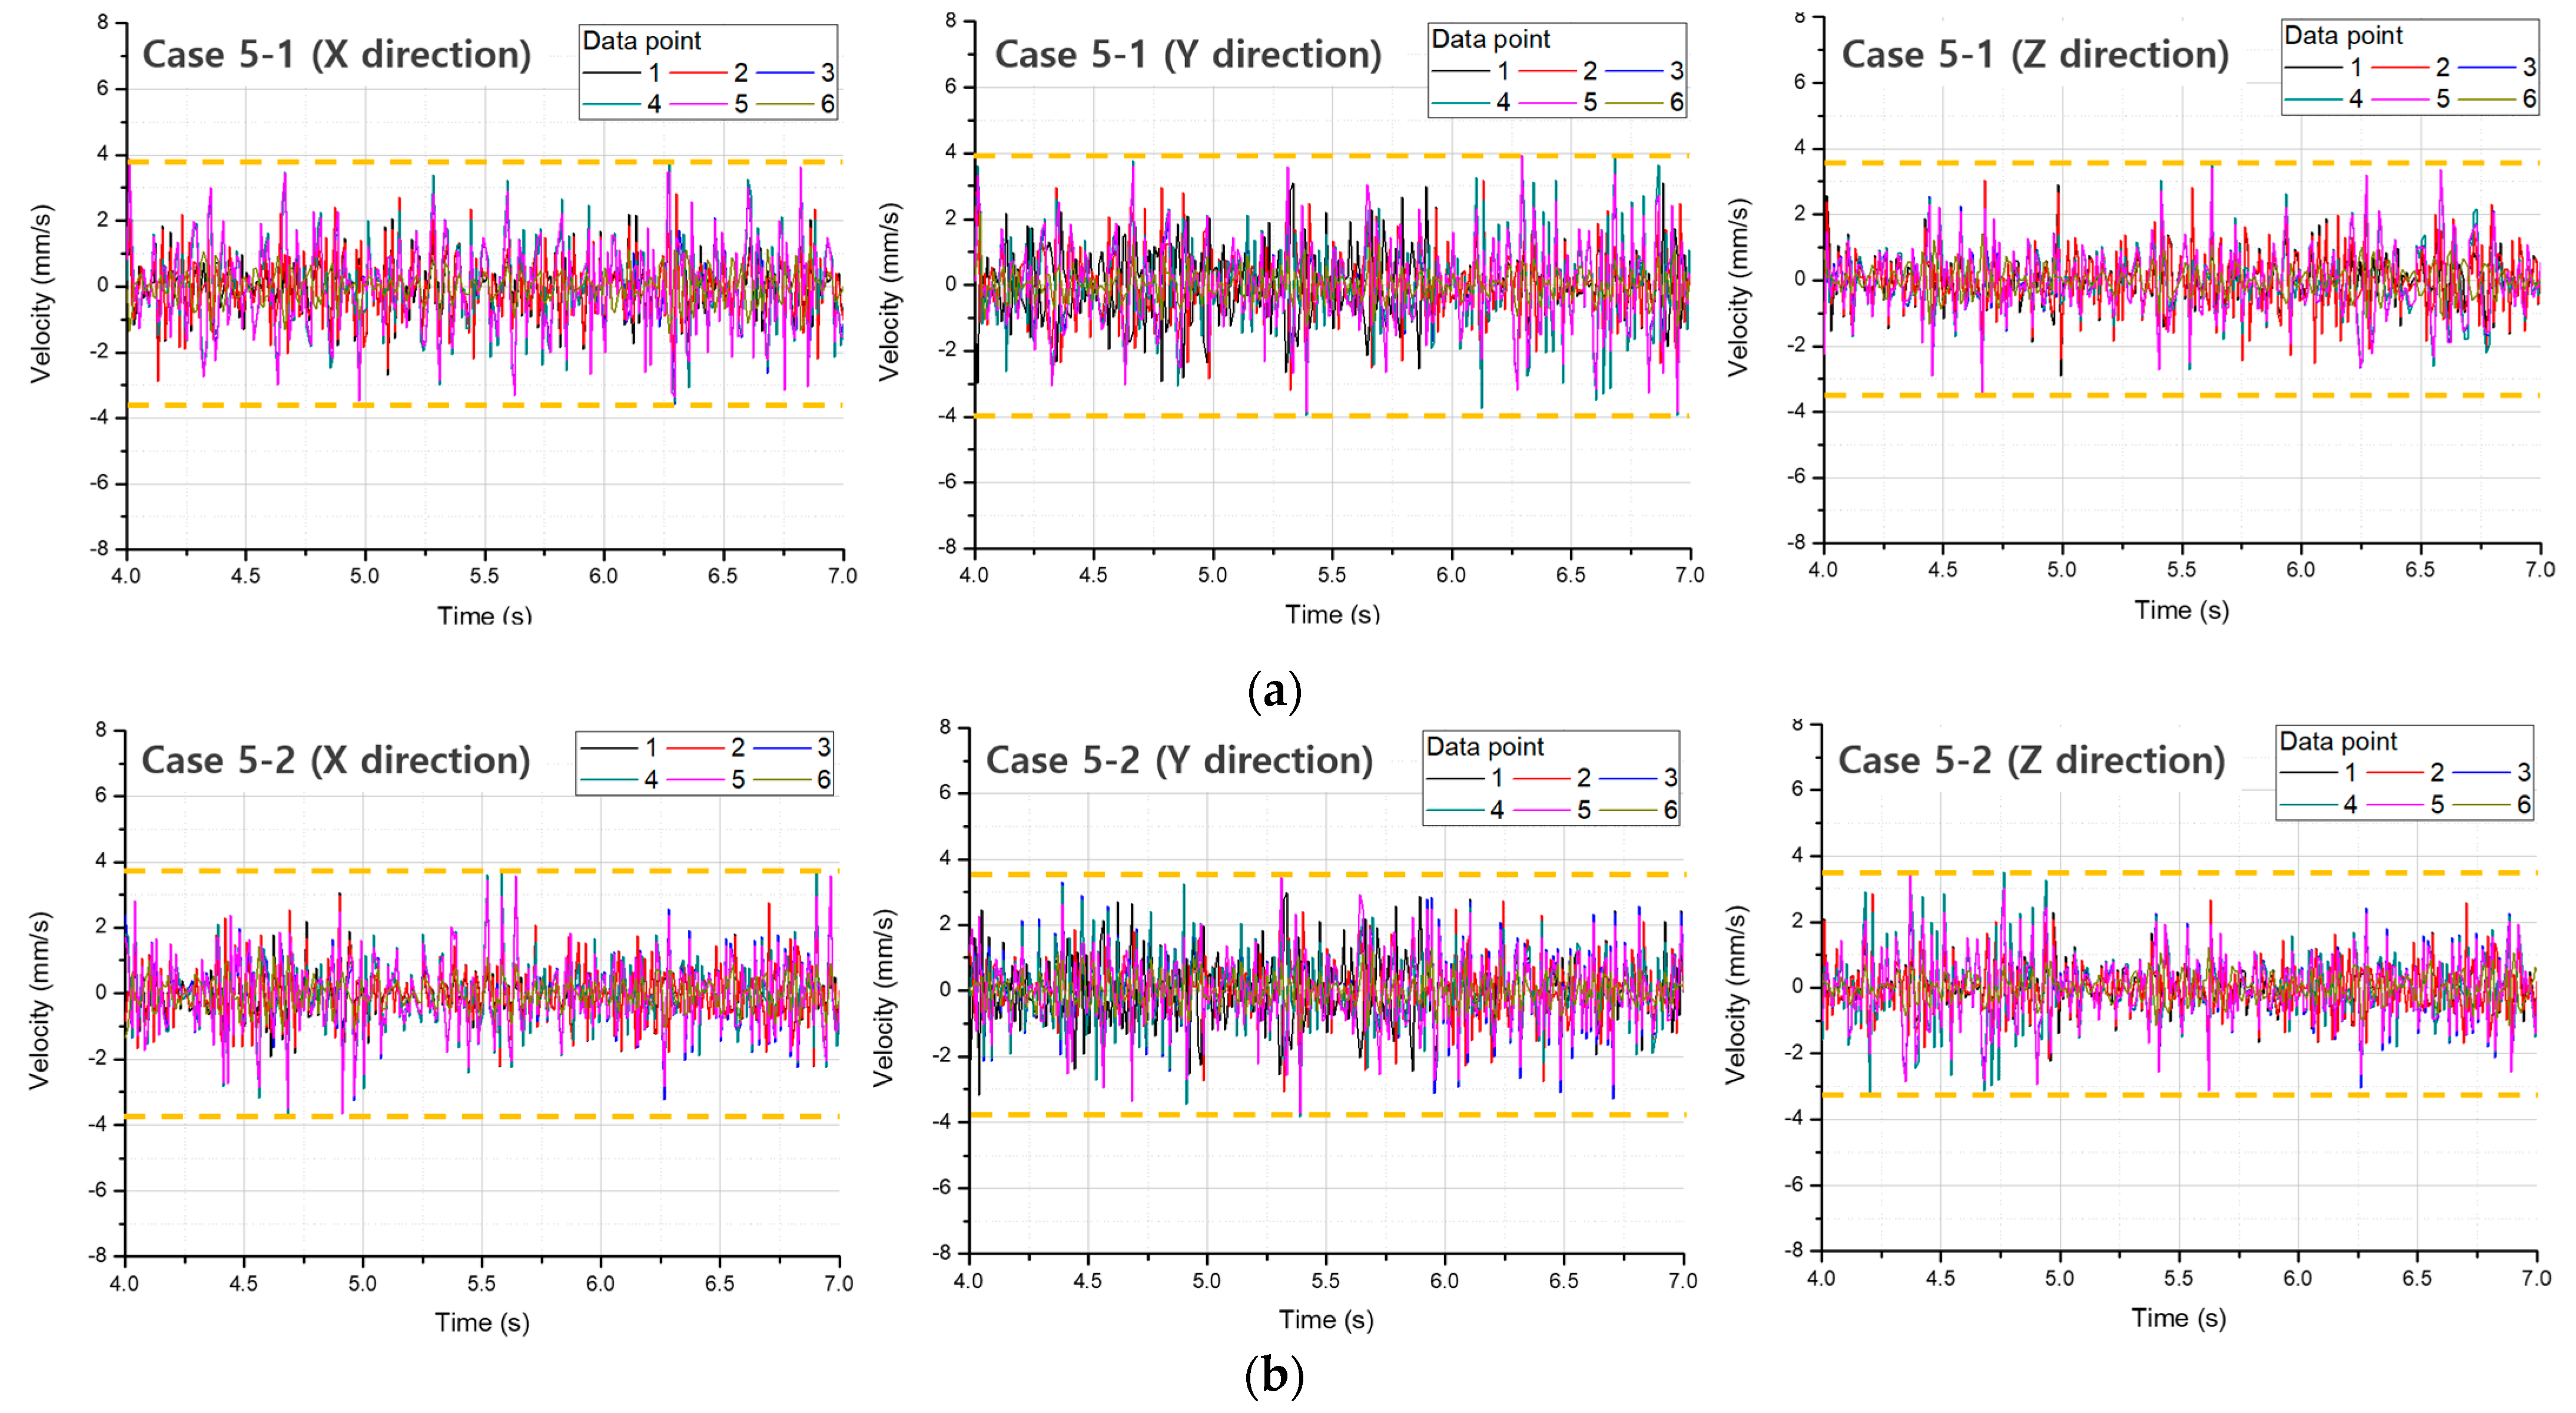
For Case 5, the analysis was performed by dividing the internal support of the water tank into the case where only the impeller part was reinforced and the case where the entire support was reinforced. While the overall reinforced form was more stable in terms of vibration when performing the modal analysis, it is also important to consider the cost aspect. Therefore, if the vibration regulations are satisfied when only the periphery of the impeller part is reinforced, it is unnecessary to reinforce the entire structure. Figure 13 shows the results for Case 5. Case 5-1 is a case where only the periphery of the impeller was reinforced, and a maximum vibration velocity of 3.97 mm/s was observed in the Y direction. In addition, Case 5-2 achieved a maximum vibration velocity of 3.82 mm/s. Compared to the original model, the vibration of Case 5-1 and 5-2 reduced by 11 and 14.3%, respectively. As the vibration velocity of both Cases 5-1 and 5-2 was less than 4 mm/s, the results indicated that the reinforcement of the internal support of the water tank effectively reduced the vibration.
4.2. Efficeint Vibration Design
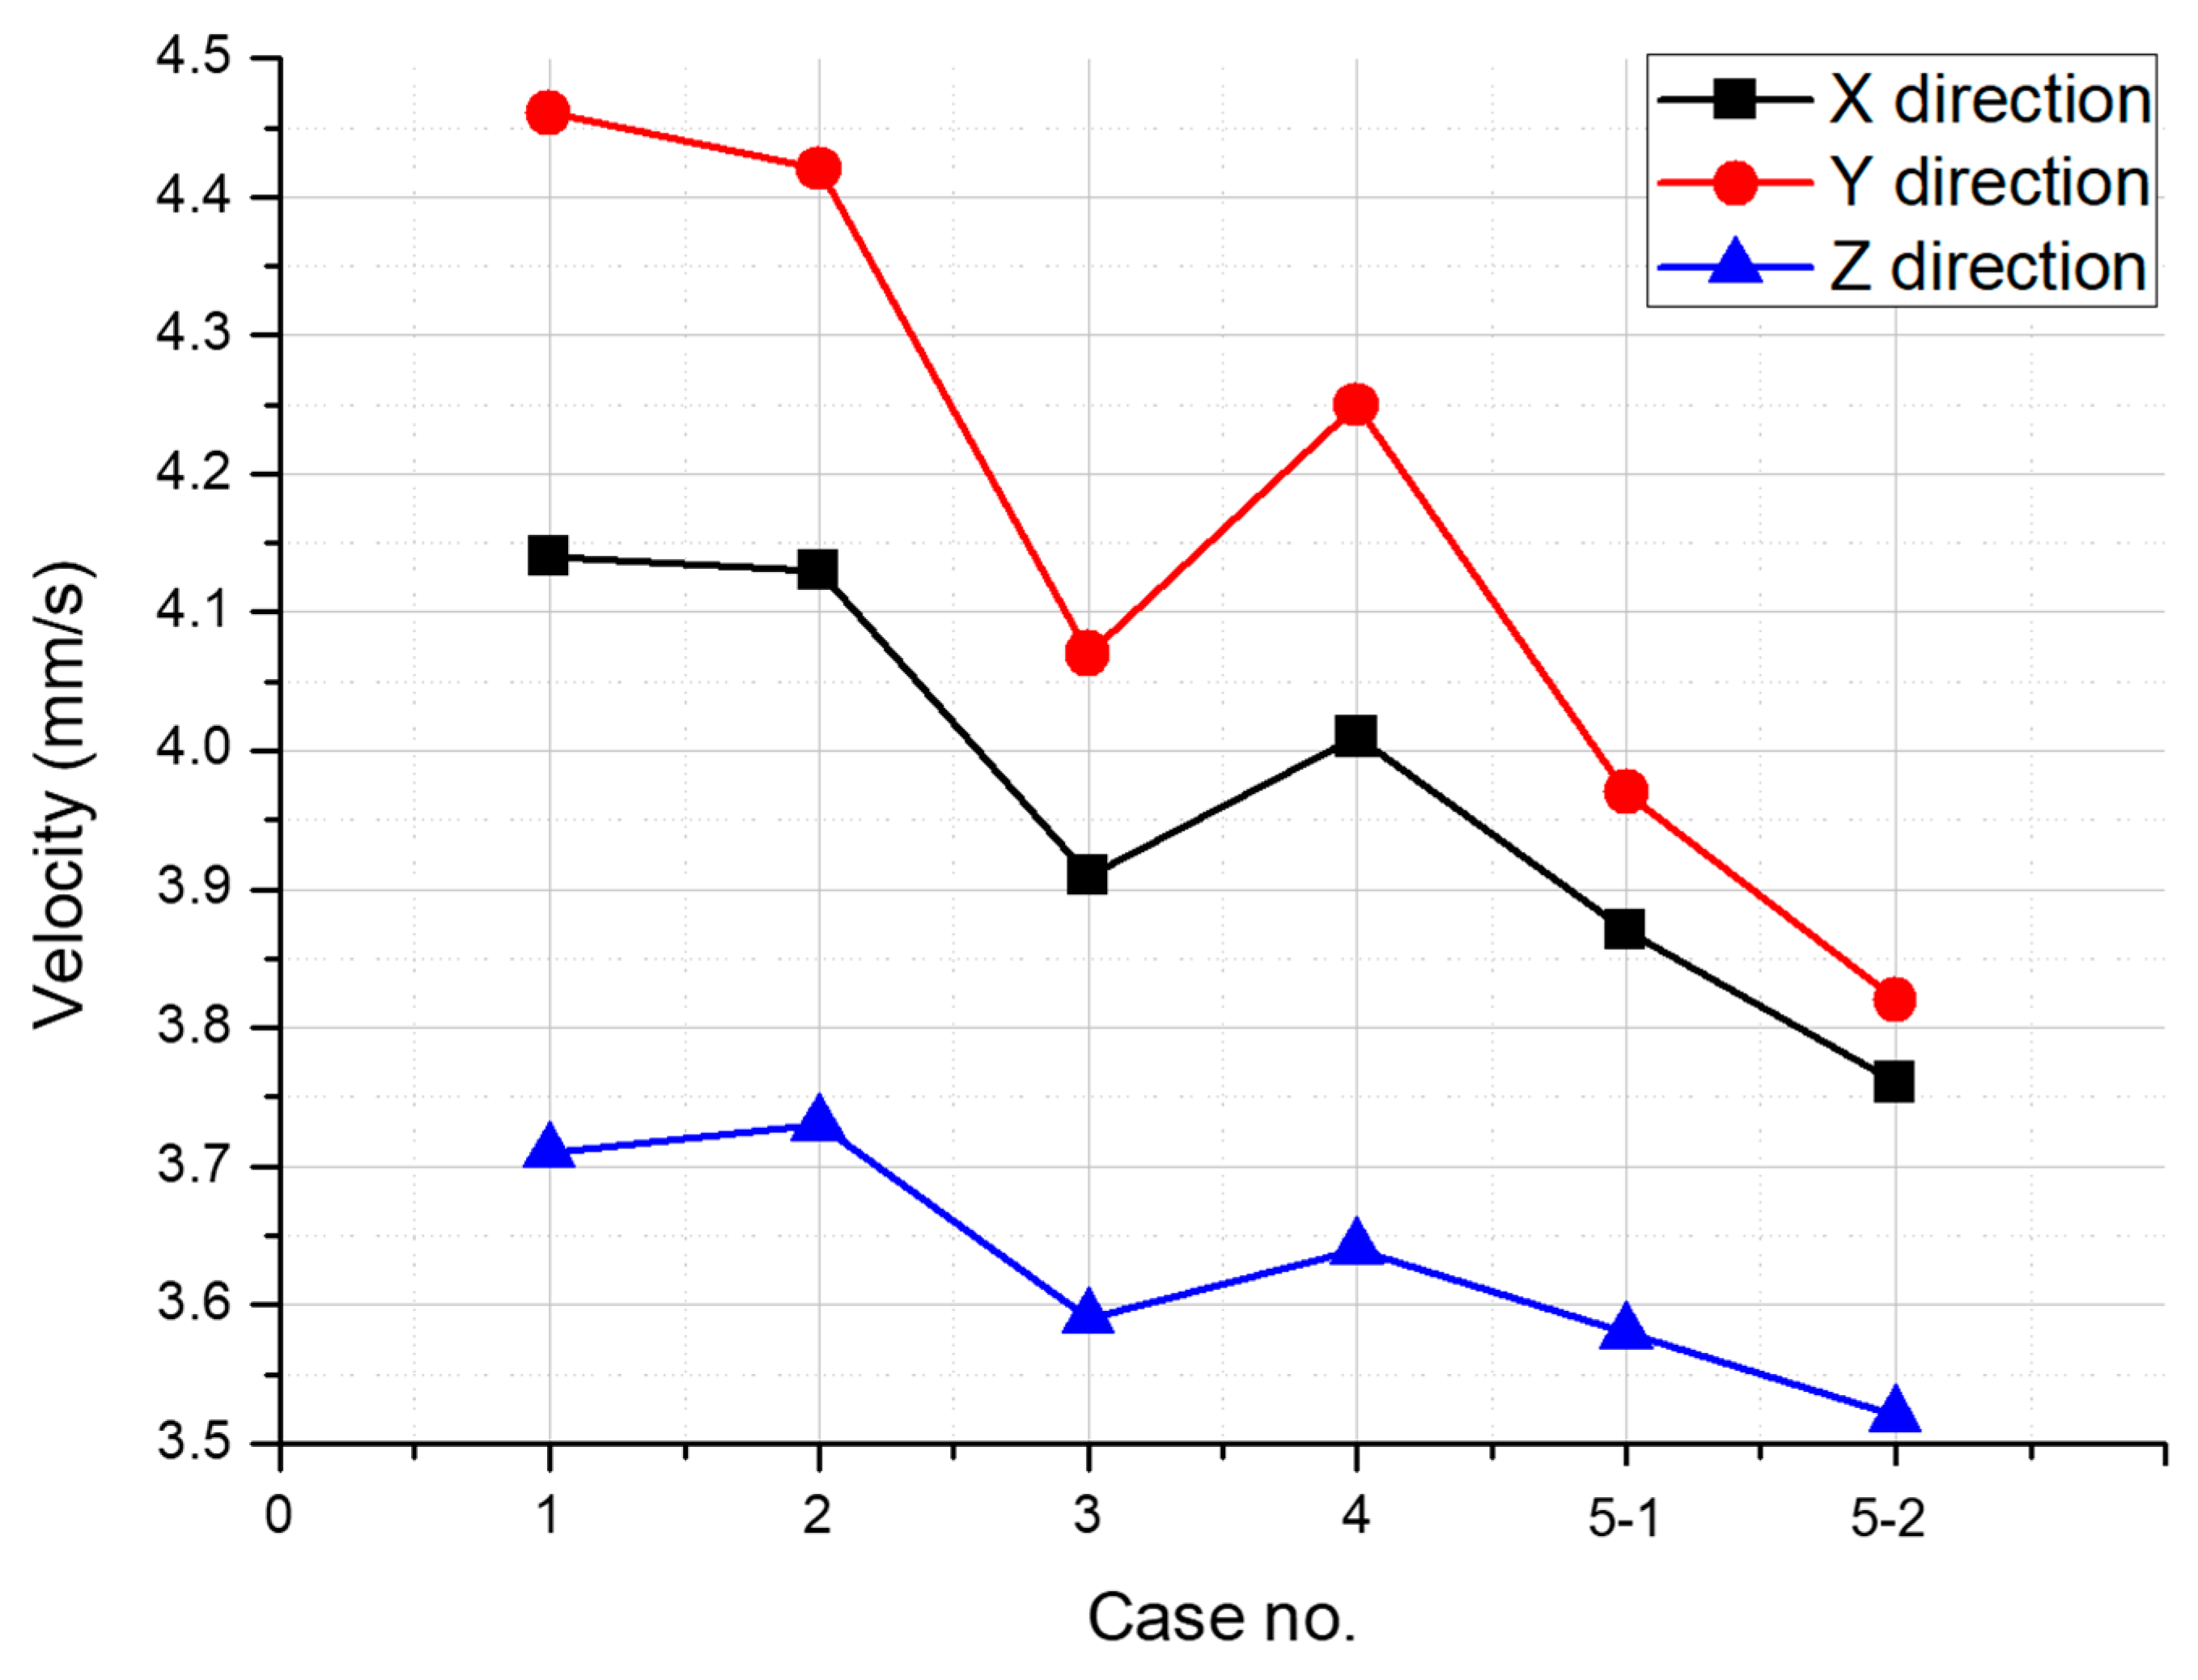
Table 8 summarizes the vibration velocity values after applying and analyzing the changed design from Cases 1 to 5. The vibration value of the original model was set as the reference value, and the results of the other cases were compared to that of Case 1. The results revealed that the reinforcement of the internal support of the water tank was the most efficient design for vibration reduction. In addition, the maximum vibration value for each axial direction according to the case was represented in a graph, as shown in Figure 14. When only the upper end of the pump connected to the pipe was reinforced, the vibration reduced in the Y direction, but slightly increased in the Z direction. Additionally, if the structure is reinforced in each axial direction between the impeller part and the water tank, there is an overall vibration reduction effect, but the vibration velocity does not satisfy the requirement of 4 mm/s or less. When the length of the strainer is increased, the pressure reduced and there was a slight vibration reduction effect, but the flow rate reduced significantly, and an increase in the existing RPM value is required to increase the flow rate. This is not an effective design change because it eventually results in a vibration increase problem.
Among the designs, Case 5, in which the internal support of the water tank was reinforced, satisfied the vibration velocity requirement of 4 mm/s or less. As a value close to 4 mm/s was achieved in the Y direction when the periphery of the impeller was reinforced, the most efficient design is to reinforce the internal support of the water tank as a whole to achieve a notable vibration reduction effect. Nevertheless, if the vibration regulations are satisfied, it is efficient to reinforce only the periphery of the impeller in consideration of the cost aspect.
5. Conclusions
A scrubber was designed to conform to the vibration regulations before construction. In this study, a scrubber with a maximum vibration velocity of 4.5 mm/s or less was designed, but the vibration regulation changes to 4 mm/s after construction. Therefore, it is essential to reinforce the structure of scrubbers and determine an appropriate design reinforcement method. The scrubber is installed on the upper part of the building where various semiconductor equipment is operated, and it is impossible to accurately measure vibration using sensors owing to surrounding environmental problems. Therefore, a two-way FSI analysis was performed to solve the vibration problem of the scrubber. As a one-way method does not interact step-by-step over time, a program capable of a two-way process was employed.
The vibration of scrubbers is mainly caused by the pump, and the vibration transmission force of the pump was theoretically calculated and compared with the analysis data. Through this, the analysis modeling was verified and a case run according to the design variable was performed. For an already constructed scrubber, the design factors that can be changed are limited, and cases were selected within the possible range. The vibration data according to the design change was compared based on the vibration value of the original model, in which the design was maintained. The comparative analysis results revealed that the reinforcement of the internal support of the water tank is the most effective design for vibration reduction. In addition, as it meets the changed vibration regulation of 4 mm/s or less, it can be considered that an appropriate design plan was suggested in this study via analysis.
This study indicates that it is possible to obtain data using FSI analysis not only in scrubbers but also in various industrial fields. We believe that it can be a good guide for various industries because it can reduce significant losses in terms of time and cost.
Funding
This study was supported by RecurDyn of FunctionBay, Inc. in Korea and Particleworks program of Prometech Software, Inc. in Japan.
Institutional Review Board Statement
Not applicable.
Informed Consent Statement
Not applicable.
Data Availability Statement
Not applicable.
Conflicts of Interest
The author declares no conflict of interest.
References
- Chouichi, A.; Blue, J.; Yugma, C.; Pasqualini, F. Chamber-to-Chamber Discrepancy Detection in Semiconductor Manufacturing. Trans. Semicond. Manuf. 2020, 33, 86–95. [Google Scholar] [CrossRef]
- Haq, A.A.U.; Djurdjanovic, D. Dynamics-inspired feature extraction in semiconductor manufacturing processes. J. Ind. Inf. Integr. 2019, 13, 22–31. [Google Scholar]
- Tonke, D.; Grunow, M. Maintenance, shutdown and production scheduling in semiconductor robotic cells. Int. J. Prod. Res. 2018, 56, 3306–3325. [Google Scholar] [CrossRef]
- Arba’in, A.N.; Belaidan, S.L.M. Fault Detection and Prediction in the Semiconductor Manufacturing Process. Int. J. Manag. 2020, 11, 2023–2028. [Google Scholar]
- Hu, S.; Gao, Y.; Hu, F.; Liu, C.; Li, J. Experimental study of the dust-removal performance of a wet scrubber. Int. J. Coal Sci. Technol. 2021, 8, 228–239. [Google Scholar] [CrossRef]
- Shaisundaram, V.S.; Chandrasekaran, M.; Raj, S.M.; Muraliraha, R.; Vinodkumar, T. Control of carbon dioxide emission in automobile vehichles using CO2 scrubber. Int. J. Ambient. Energy 2019, 40, 699–703. [Google Scholar] [CrossRef]
- Lu, Z.; Rath, A.; Amini, S.H.; Noble, A.; Shahab, S. A computational fluid dynamics investigation of a novel flooded-bed dust scrubber with vibrating mesh. Int. J. Min. Sci. Technol. 2022, in press. [Google Scholar] [CrossRef]
- Dinora, M.M. Effect of Ultrasonic Vibration on the Mass Transfer Coefficient in a Sieve Plate Scrubber. Ph.D. Thesis, Clemson University, Clemson, SC, USA, 2010. [Google Scholar]
- Kim, N.Y.; Hong, M.S. Diagnosis and Reduction of Robot Arm Vibration for 12-Inch Wafer Spin Scrubber. Key Eng. Mater. 2004, 270–273, 884–889. [Google Scholar] [CrossRef]
- Benra, F.K.; Dohmen, H.J.; Schuster, S.; Wan, B. A Comparison of One-Way and Two-Way Coupling Methods for Numerical Analysis of Fluid-Structure Interactions. J. Appl. Math. 2011, 2011, 853560. [Google Scholar] [CrossRef]
- Dhande, D.Y.; Pande, D.W. A two-way FSI analysis of multiphase flow in hydrodynamic journal bearing with cavitation. J. Braz. Soc. Mech. Sci. Eng. 2017, 39, 3399–3412. [Google Scholar] [CrossRef]
- Gummer, A.; Sauer, B. Modeling planar slider-crank mechanisms with clearance joints in RecurDyn. Multibody Syst. Dyn. 2014, 31, 127–145. [Google Scholar] [CrossRef]
- Cheng, K.; Liu, Y.; Xu, X.; Xie, H. Virtual Prototyping of Belt Conveyor Based on RecurDyn. Appl. Mech. Mater. 2009, 16–19, 776–780. [Google Scholar]
- Hattori, M. An attempt to apply mathematical foundation of Moving Particle Simulation to the MPS software “Particleworks”. Proc. Symp. Educ. Appl. Inf. Technol. 2015, 9, 59–62. [Google Scholar]
- Ojala, S.; Oy, W.F. Designing and analysing the cooling of a medium speed engine piston using MPS method. In Proceedings of the International CAE Conference and Exhibition, Vicenza, Italy, 8–9 October 2018. [Google Scholar]
- Mobley, A.V.; Carroll, M.P.; Canann, S.A. An Object Oriented Approach to Geometry Defeaturing for Finite Element Meshing. IMR 1998, 547–563. [Google Scholar]
- Mounir, H.; Nizar, A.; Abdelmajid, B. CAD model simplification using a removing details and merging faces technique for a FEM simulation. J. Mech. Sci. Technol. 2012, 26, 3539–3548. [Google Scholar] [CrossRef]
- Fischer-Cripps, A.C. The Hertzian contact surface. J. Mater. Sci. 1999, 34, 129–137. [Google Scholar] [CrossRef]
Figure 1.
Structure of a scrubber.

Figure 2.
Schematic of the fluid structure interaction (FSI) analysis method.

Figure 3.
A multi-flexible body and its data points.

Figure 4.
RPM of the pump.

Figure 5.
Before and after pump operation. (right image, 4-s section).

Figure 6.
Reaction force data according to pump operation: (a) Pump reaction force in saturated state; (b) Water tank reaction force due to pump operation.
Figure 6.
Reaction force data according to pump operation: (a) Pump reaction force in saturated state; (b) Water tank reaction force due to pump operation.

Figure 7.
Image showing the design variables (case 2–4).

Figure 8.
Pressure image according to pump driving force: (a) Original model; (b) change strainer length.
Figure 8.
Pressure image according to pump driving force: (a) Original model; (b) change strainer length.

Figure 9.
Average value of the pump internal pressure.

Figure 10.
Comparison of mode shape according to structural reinforcement.

Figure 11.
Case 1—vibration velocity according to the axial direction: (a) Axial direction display; (b) X direction; (c) Y direction; (d) Z direction.
Figure 11.
Case 1—vibration velocity according to the axial direction: (a) Axial direction display; (b) X direction; (c) Y direction; (d) Z direction.

Figure 12.
Vibration velocity according to the axial direction: (a) Case 2; (b) Case 3; (c) Case 4.

Figure 13.
Vibration velocity based on the axial direction: (a) Case 5-1; (b) Case 5-2.

Figure 14.
Vibration data by axial direction.


Table 1.
Material properties of the parts of the scrubber.
| Target | Density (kg/m3) | Young’s Modulus (GPa) | Poisson’s Ratio |
|---|---|---|---|
| Water Tank | 7850 | 200 | 0.285 |
| Pump | 1940 | 17.2 | 0.32 |
| Pipe | 1750 | 5.8 | 0.32 |
Table 2.
Contact conditions.
| Target | Coefficient |
|---|---|
| Stiffness (N/mm) | 50,000–100,000 |
| Damping (kg/s) | 5–10 |
Table 3.
Fluid material property.
| Target | Surface Tension (N/m) | ||
|---|---|---|---|
| Water | 1000 | 0.072 |
Table 4.
Properties of the plate.
| Stiffness (N/m) | Damping Ratio |
|---|---|
| 0.25 |
Table 5.
Comparison of reaction force data of water tank according to pump operation.
| Data | Numerical | Analysis | Error Rate |
|---|---|---|---|
| Reaction Force (N) | 827.5 | 815.1 | 1.5% |
Table 6.
Design variables.
| Case No. | Contents |
|---|---|
| 1 | Original model |
| 2 | Pump top reinforcement |
| 3 | Structural reinforcement of impeller part |
| 4 | Change in the strainer length |
| 5 | Water tank structure reinforcement |
Table 7.
Natural frequency (Hz) of the water tank.
| Mode Response | Original Model | Reinforcement of the Impeller Part | Internal Overall Reinforcement |
|---|---|---|---|
| 1st | 98.47 | 101.26 | 138.42 |
| 2nd | 118.54 | 140.11 | 141.29 |
| 3rd | 122.18 | 149.72 | 144.73 |
| 4th | 137.51 | 152.93 | 157.25 |
| 5th | 151.04 | 163.56 | 169.75 |
| 6th | 151.81 | 173.19 | 172.55 |
Table 8.
Vibration velocity data according to design change.
| Case No. | Contents | Max. Vibration Velocity (mm/s) | Vibration Reduction Rate Based on Max. Value (%) | ||
|---|---|---|---|---|---|
| X Direction | Y Direction | Z Direction | |||
| 1 | Original model | 4.14 | 4.46 | 3.71 | Default value |
| 2 | Pump top reinforcement | 4.13 | 4.42 | 3.73 | 0.9 |
| 3 | Structural reinforcement of the impeller part | 4.91 | 4.07 | 3.59 | 9 |
| 4 | Change strainer length | 4.01 | 4.25 | 3.64 | 4.6 |
| 5-1 | Water tank structure reinforcement (1) | 3.87 | 3.97 | 3.58 | 11 |
| 5-2 | Water tank structure reinforcement (2) | 3.76 | 3.82 | 3.52 | 14.3 |
Publisher’s Note: MDPI stays neutral with regard to jurisdictional claims in published maps and institutional affiliations. |
© 2022 by the author. Licensee MDPI, Basel, Switzerland. This article is an open access article distributed under the terms and conditions of the Creative Commons Attribution (CC BY) license (https://creativecommons.org/licenses/by/4.0/).
Share and Cite
MDPI and ACS Style
Cha, W.-Y. Study on Dynamic Characterization and Vibration Reduction of Scrubber Structures Using Fluid Structure Interaction Analysis. Appl. Sci. 2022, 12, 5207. https://0-doi-org.brum.beds.ac.uk/10.3390/app12105207
AMA Style
Cha W-Y. Study on Dynamic Characterization and Vibration Reduction of Scrubber Structures Using Fluid Structure Interaction Analysis. Applied Sciences. 2022; 12(10):5207. https://0-doi-org.brum.beds.ac.uk/10.3390/app12105207
Chicago/Turabian StyleCha, Woon-Yong. 2022. "Study on Dynamic Characterization and Vibration Reduction of Scrubber Structures Using Fluid Structure Interaction Analysis" Applied Sciences 12, no. 10: 5207. https://0-doi-org.brum.beds.ac.uk/10.3390/app12105207
Note that from the first issue of 2016, this journal uses article numbers instead of page numbers. See further details here.