
A Second Harmonic Wave Angle Sensor with a Collimated Beam of Femtosecond Laser
by
 , and
, and
Wijayanti Dwi Astuti
1,2, 
Kuangyi Li
1,
Ryo Sato
1,
Hiraku Matsukuma
1,
Yuki Shimizu
3,* and
Wei Gao
1 1
Precision Nanometrology Laboratory, Department of Finemechanics, Tohoku University, Sendai 980-8579, Japan
2
Department of Electrical Engineering and Informatics, Universitas Gadjah Mada, Yogyakarta 55281, Indonesia
3
Laboratory of Precision Metrology and Robotics, Graduate School of Engineering, Hokkaido University, Sapporo 060-8628, Japan
*
Author to whom correspondence should be addressed.
Appl. Sci. 2022, 12(10), 5211; https://0-doi-org.brum.beds.ac.uk/10.3390/app12105211
Submission received: 18 April 2022
/
Revised: 15 May 2022
/
Accepted: 19 May 2022
/
Published: 21 May 2022
(This article belongs to the Special Issue State-of-the-Art of Optical Micro/Nano-Metrology and Instrumentation)
Abstract
:An optical angle sensor based on the collimated mode-locked femtosecond laser (Fs) beam, in which the angle measurement is carried out by observing the second harmonic wave generated by irradiating the Fs beam towards MgO:LiNbO3 crystal, is proposed. The angle detection is demonstrated by identifying the second harmonic generation (SHG) spectrum peaks against the angular position of the rotating stage-mounted MgO:LiNbO3 crystal that represents the measurement object. The MgO:LiNbO3 with a length of 2 mm, a cut-off angle of 47°, a diameter of 5 mm, and 5% of MgO:LN, is rotated within the phase-matching angle over a wavelength range from 1480 nm to 1640 nm. Angle measurement is also carried out by placing the crystal at different positions along the laser beam propagation direction to confirm the feasibility of the angle sensor where the measurement range, measurement sensitivity, and resolution of the proposed method are also evaluated. The result shows that the proposed angle sensor can overcome the working distance limitation of conventional angle sensors and has no specific material target requirement. Since the configuration of the proposed angle sensor is not limited by the specification of the measurement target, it is expected to have wide potential applications, especially in the manufacturing process and inspection process.
1. Introduction
Angle sensors, a critical piece of equipment in the industry for design, assembly, and quality control, are continuously being developed with the increasing need for real-time, high precision, and high sensitivity measurement [1,2]. Various studies are still being carried out to improve the performance of angle sensors, even though many types of angle sensors have been established and commercialized with various measurement methods and models for specific measurement purposes [3,4,5,6]. Research on the conventional angle sensor, such as inductive angle positioning sensors [7,8], autocollimators [9,10], and rotary encoders [11,12], is no exception. The angle-sensing technology is still being challenged to meet the need for current trends in technology that lead to the manufacturing of high complexity products, yet shrinking in dimensions. It requires a suitable angle sensor that is not limited by the type of material being measured, has minimal potential damage to the material during the measurement process, and is expected to have minimal maintenance costs [13,14]. An inductive angle positioning sensor, for example, has limitations for detecting the metal target only. Meanwhile, the autocollimator is time-consuming in operation as it is hardly positioned and requires regular maintenance, and the rotational magnetic encoder commonly contains fine parts that are sensitive to contamination. These reasons encourage more intensive research on new angle measurement methods, especially non-contact angle sensors, as the solution to bridge these problems.
A second harmonic wave angle sensor, a non-contact optical-based angle sensor, offers a well-suited measurement configuration system to satisfy the aforementioned requirements [15,16]. The second harmonic generation (SHG) is a phenomenon, in which the optical wave source passes through a nonlinear optical material and generates a frequency-doubled harmonic wave where the power of the second harmonic wave is highly dependent on the wavelength and the incident angle of the source toward the nonlinear material [17]. SHG has attracted attention as advantages can be found in many fields of study, especially in the biological and medical sciences for bioimaging spectroscopy [18,19,20], nonlinear microendoscope [21,22], and surface chemistry sensing [23,24]. However, the application of SHG in angle displacement measurement is relatively new, and related research is still limited.
In the previous study by the authors’ group, a new angle measurement based on the SHG by focusing a Femtosecond laser (Fs) laser beam with lenses [15] and a parabolic mirror [16] into a nonlinear optical (NLO) crystal serving as a measurement target has been proposed. The focused beam method is one practical way to obtain highly intense fundamental waves of Fs laser for generating harmonic waves. A good performance has been achieved when the NLO crystal is placed at the focal point or within the Rayleigh length region of the parabolic mirror, where the beam can be treated to have a plan wave nature. This measurement method holds promise in the angle shift detection of fixed-positioned measurement targets, but could encounter problems when the target has misalignment along the laser propagation direction. To accommodate the possibility of positional changes over the axis, a new SHG angle sensor configuration is needed.
This study proposes an angle sensor using the SHG generated not by a focused Fs laser beam, but by a collimated Fs laser beam. A collimated beam is expected to have no significant change in physical properties during propagation. The Fs laser beam is highly collimated, but a more intense laser beam is required to generate the second harmonic wave. Therefore, a Keplerian lens configuration is needed to intensify the laser beam while keeping the beam collimated. Theoretical calculations are carried out to predict the sensor’s performance, and the feasibility of the angle sensor is confirmed experimentally. In the experiment, the beams are aligned so that they propagated through the NLO crystal to produce SHG, where the NLO crystal is mounted on a rotary stage representing the target to be measured. Since the SHG in the crystal is strongly related to the angle and the wavelength, the small angular change of the crystal can be directly detected by the SHG spectrum change in a given wavelength range. The peak of the SHG spectral evolution as the angular position of the crystal changes is then evaluated to determine the sensitivity of the angle sensor. Finally, to confirm the feasibility of the measurement method where the target does not have to be placed in one position, experiments are carried out at several positions of the NLO crystal along the beam propagation direction.
2. Angle Sensor Principle
The proposed angle sensor is based on SHG, which occurs when an NLO crystal is irradiated with a laser beam of a certain frequency ω producing radiation at twice the initial frequency 2ω [17,25]. Since the light frequency is inversely proportional to the light wavelength, the fundamental wave (FW) having a wavelength λ generates a second harmonic wave having a wavelength λ’ = λ/2. SHG can be employed in angle measurement due to the birefringence in the uniaxial NLO crystal that divides the laser beam into two different rays, the ordinary ray (referred to as the o-ray in the following) and the extraordinary ray (referred to as the e-ray in the following). Both the rays experience their respective refractive indices inside the crystal. In a certain condition where the optical path lengths of these beams are identical inside the crystal, phase-matching occurs, and the light intensity of the second harmonic wave is maximized. Note that for any given λ, the phase-matching condition could arise in its corresponding matching angle θm, which can be estimated by the following equation [16,26].
where no denotes the refractive index of an o-ray and Ne refers to the refractive index of an e-ray. Regarding the usage of the NLO crystal in the proposed angle sensor, the NLO crystal is required to have a large angular dispersion for the wavelength range of an Fs laser to be employed in the angle sensor. In this paper, an Fs laser whose optical spectrum ranges from 1480 nm to 1640 nm is used. MgO:LiNbO3 is thus one of the suited crystals that fulfill the requirement [15,16] regarding the following Sellmeier equations with the parameters associated with MgO:LiNbO3:
and
.
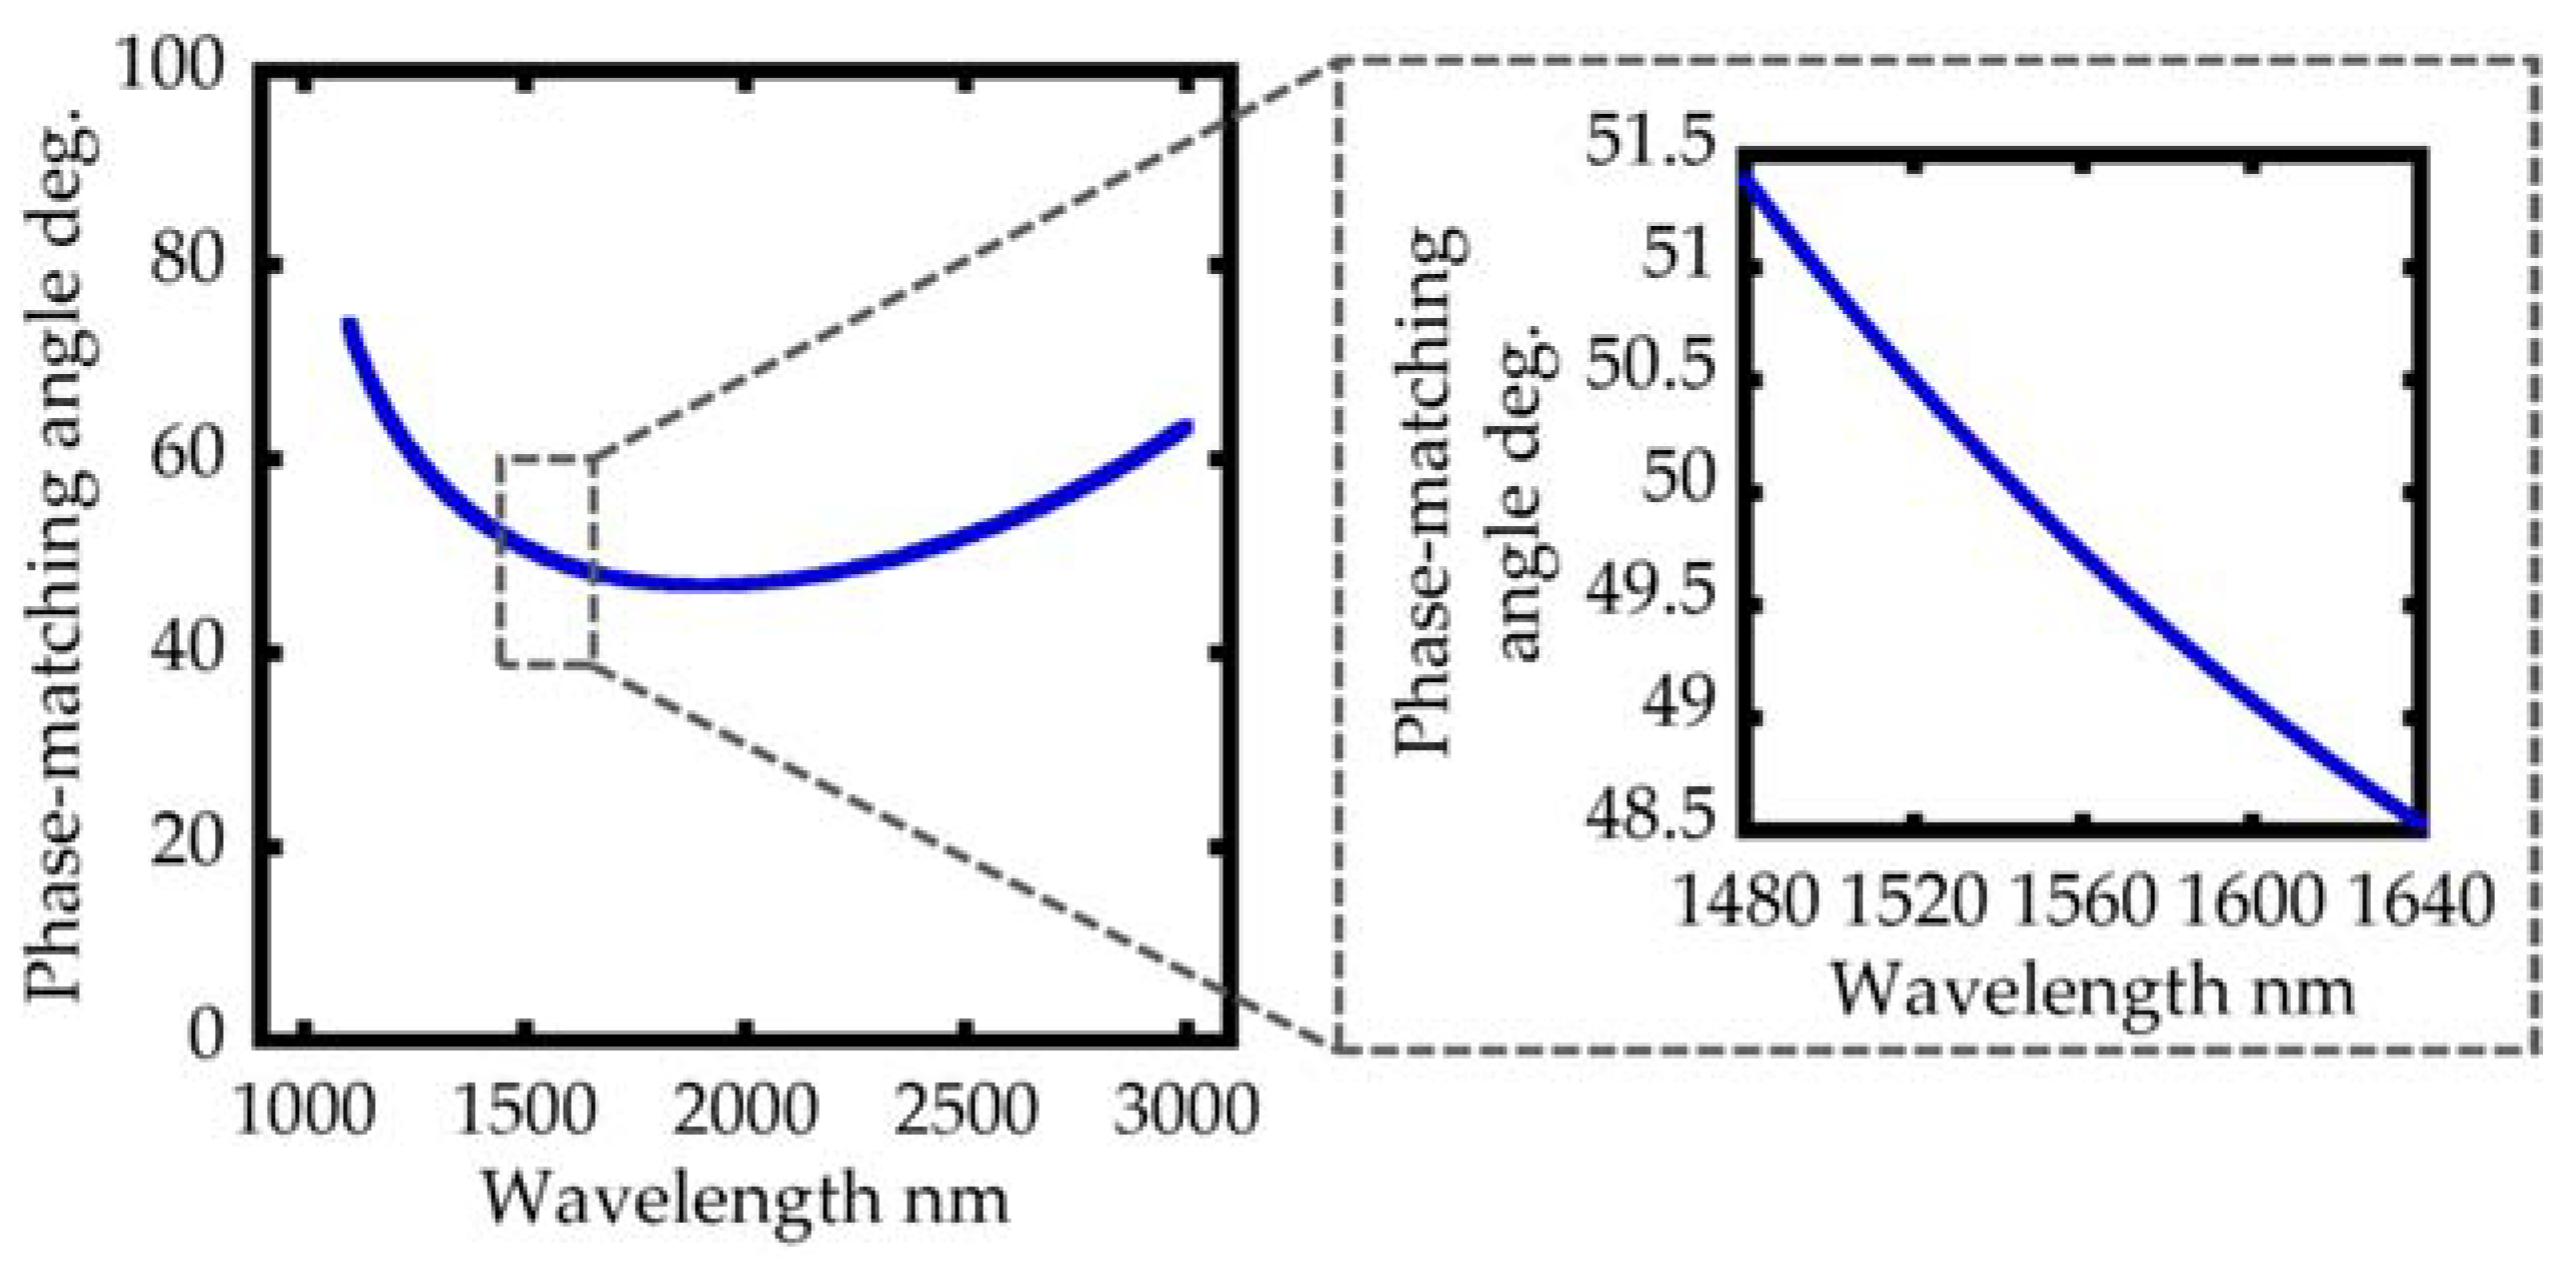
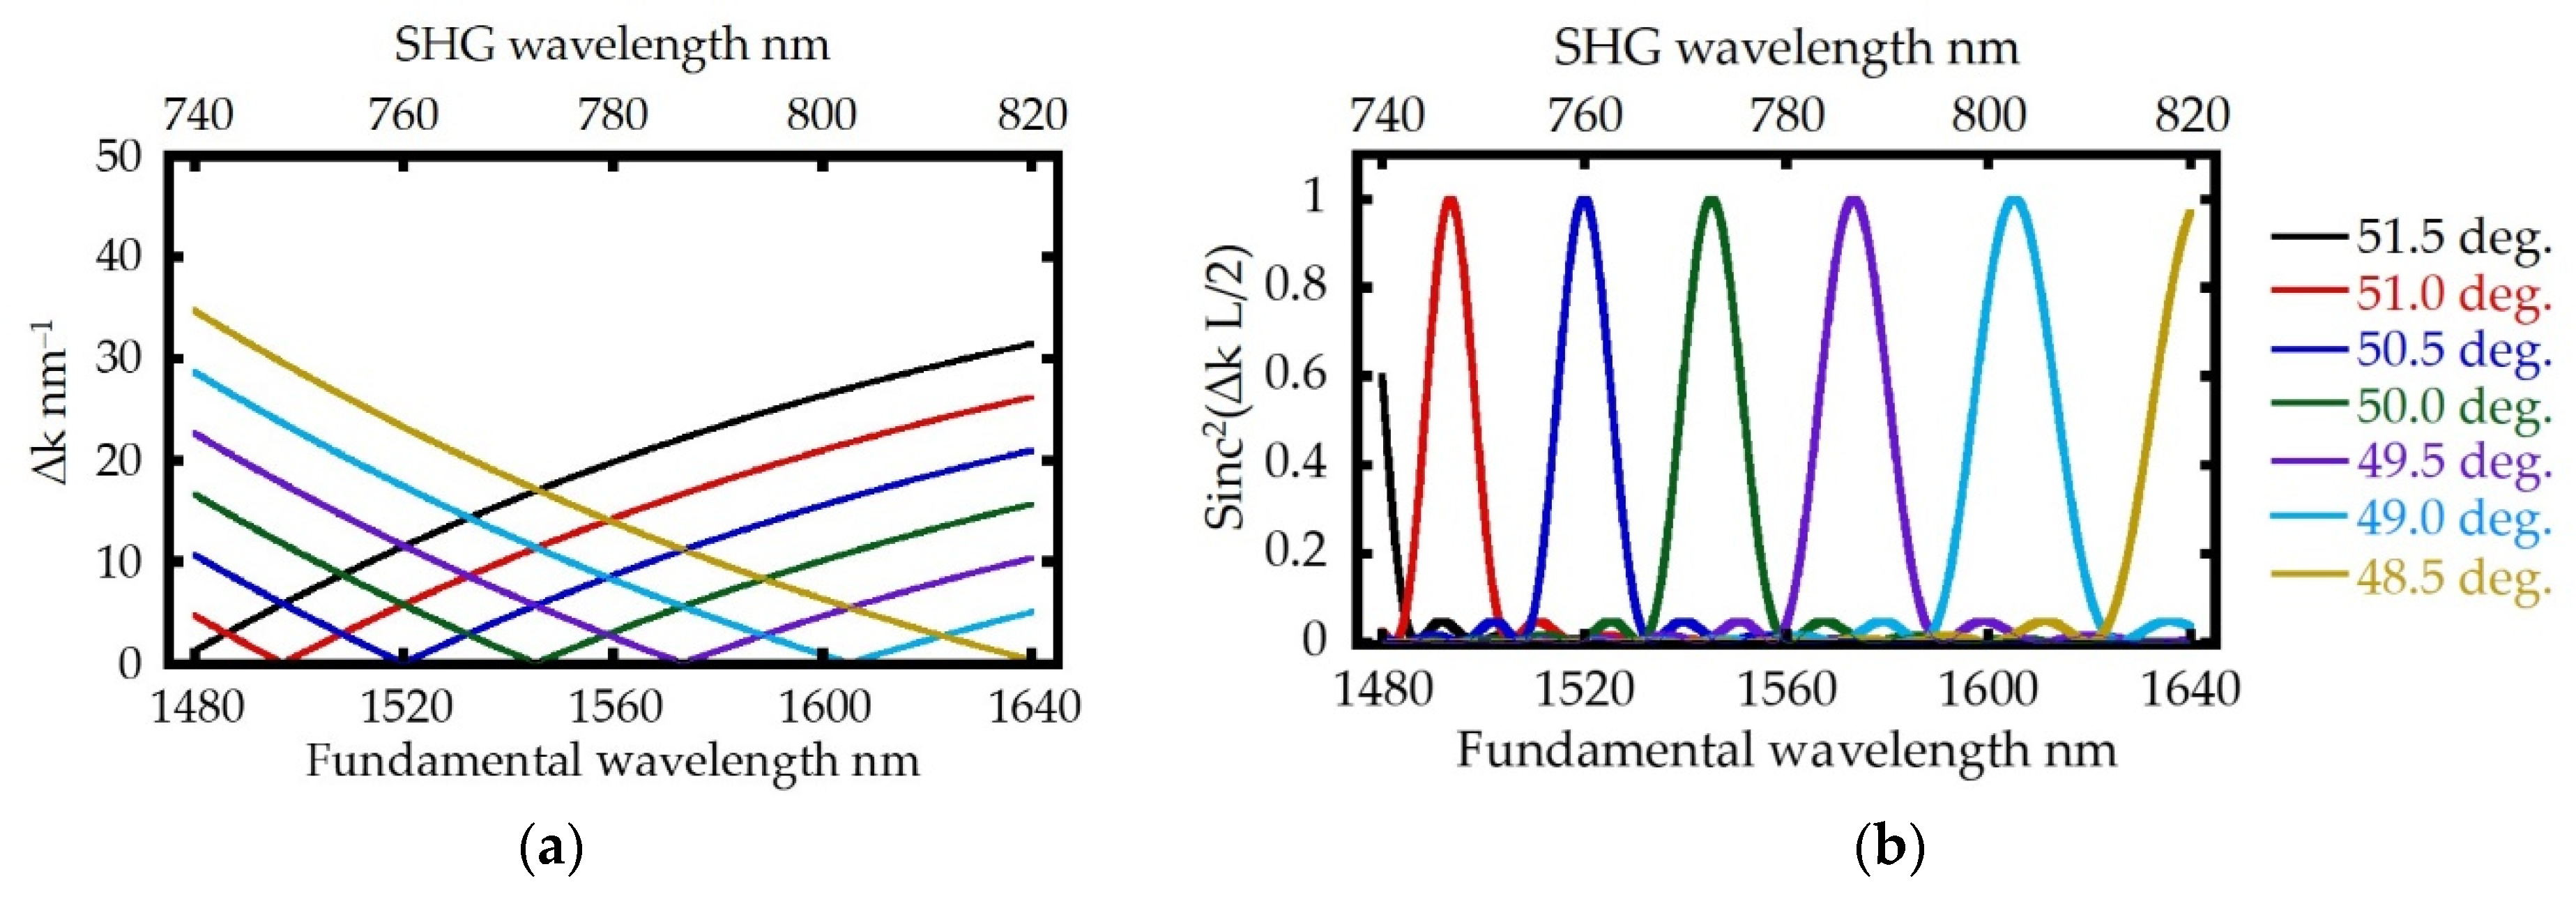
Figure 1 shows the trend line of the matching angle with respect to λ. As can be seen in the figure, an angular dispersion of approximately 2.87° between the angular positions of 48.50° and 51.37° from the optical axis of the crystal, can be observed in the wavelength range from 1480 nm to 1640 nm.
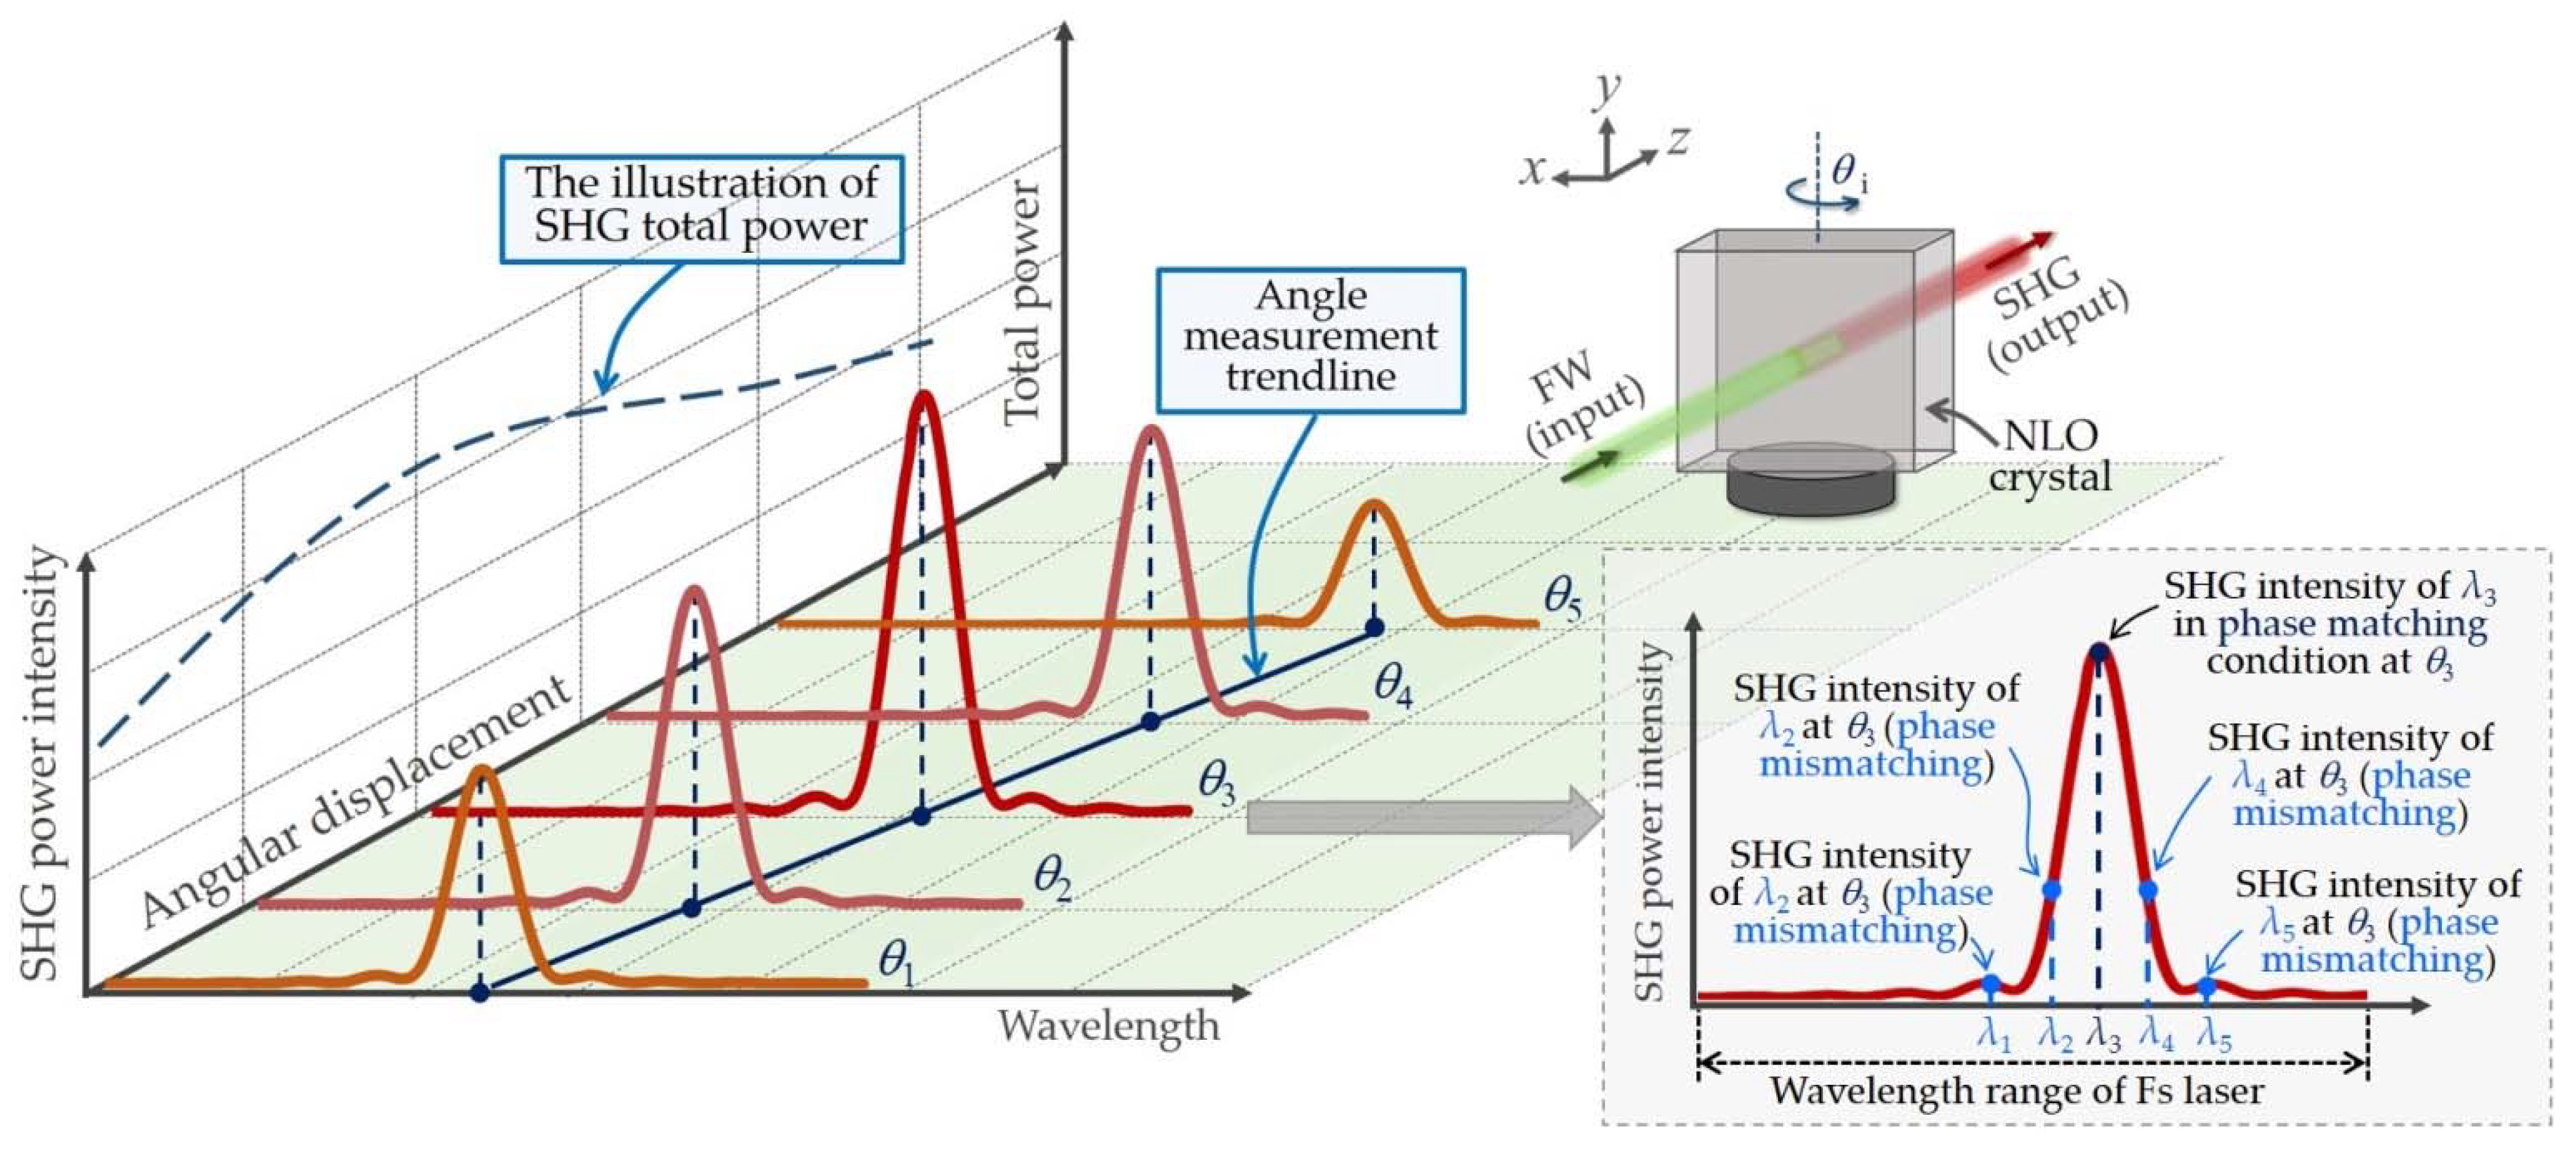
Figure 2 shows a schematic of the angle measurement based on the proposed method. Since Fs laser has a wide range of wavelength, when a certain wavelength is at a matching angle, in which high SHG intensity is achieved due to high efficiency, other wavelengths in the same angle undergo phase mismatch with lower intensity. The phase matching and phase mismatch features of the SHG will appear simultaneously in optical spectrum analyzer (OSA) in the form of a spectrum [27], as shown in the inset image in Figure 2. The phase-matching of other wavelengths can thus be satisfied when the MgO:LiNbO3 crystal experiences angular displacement about its Y-axis. By utilizing this characteristic, angle measurement can be carried out by monitoring the peak wavelength of the second harmonic wave.
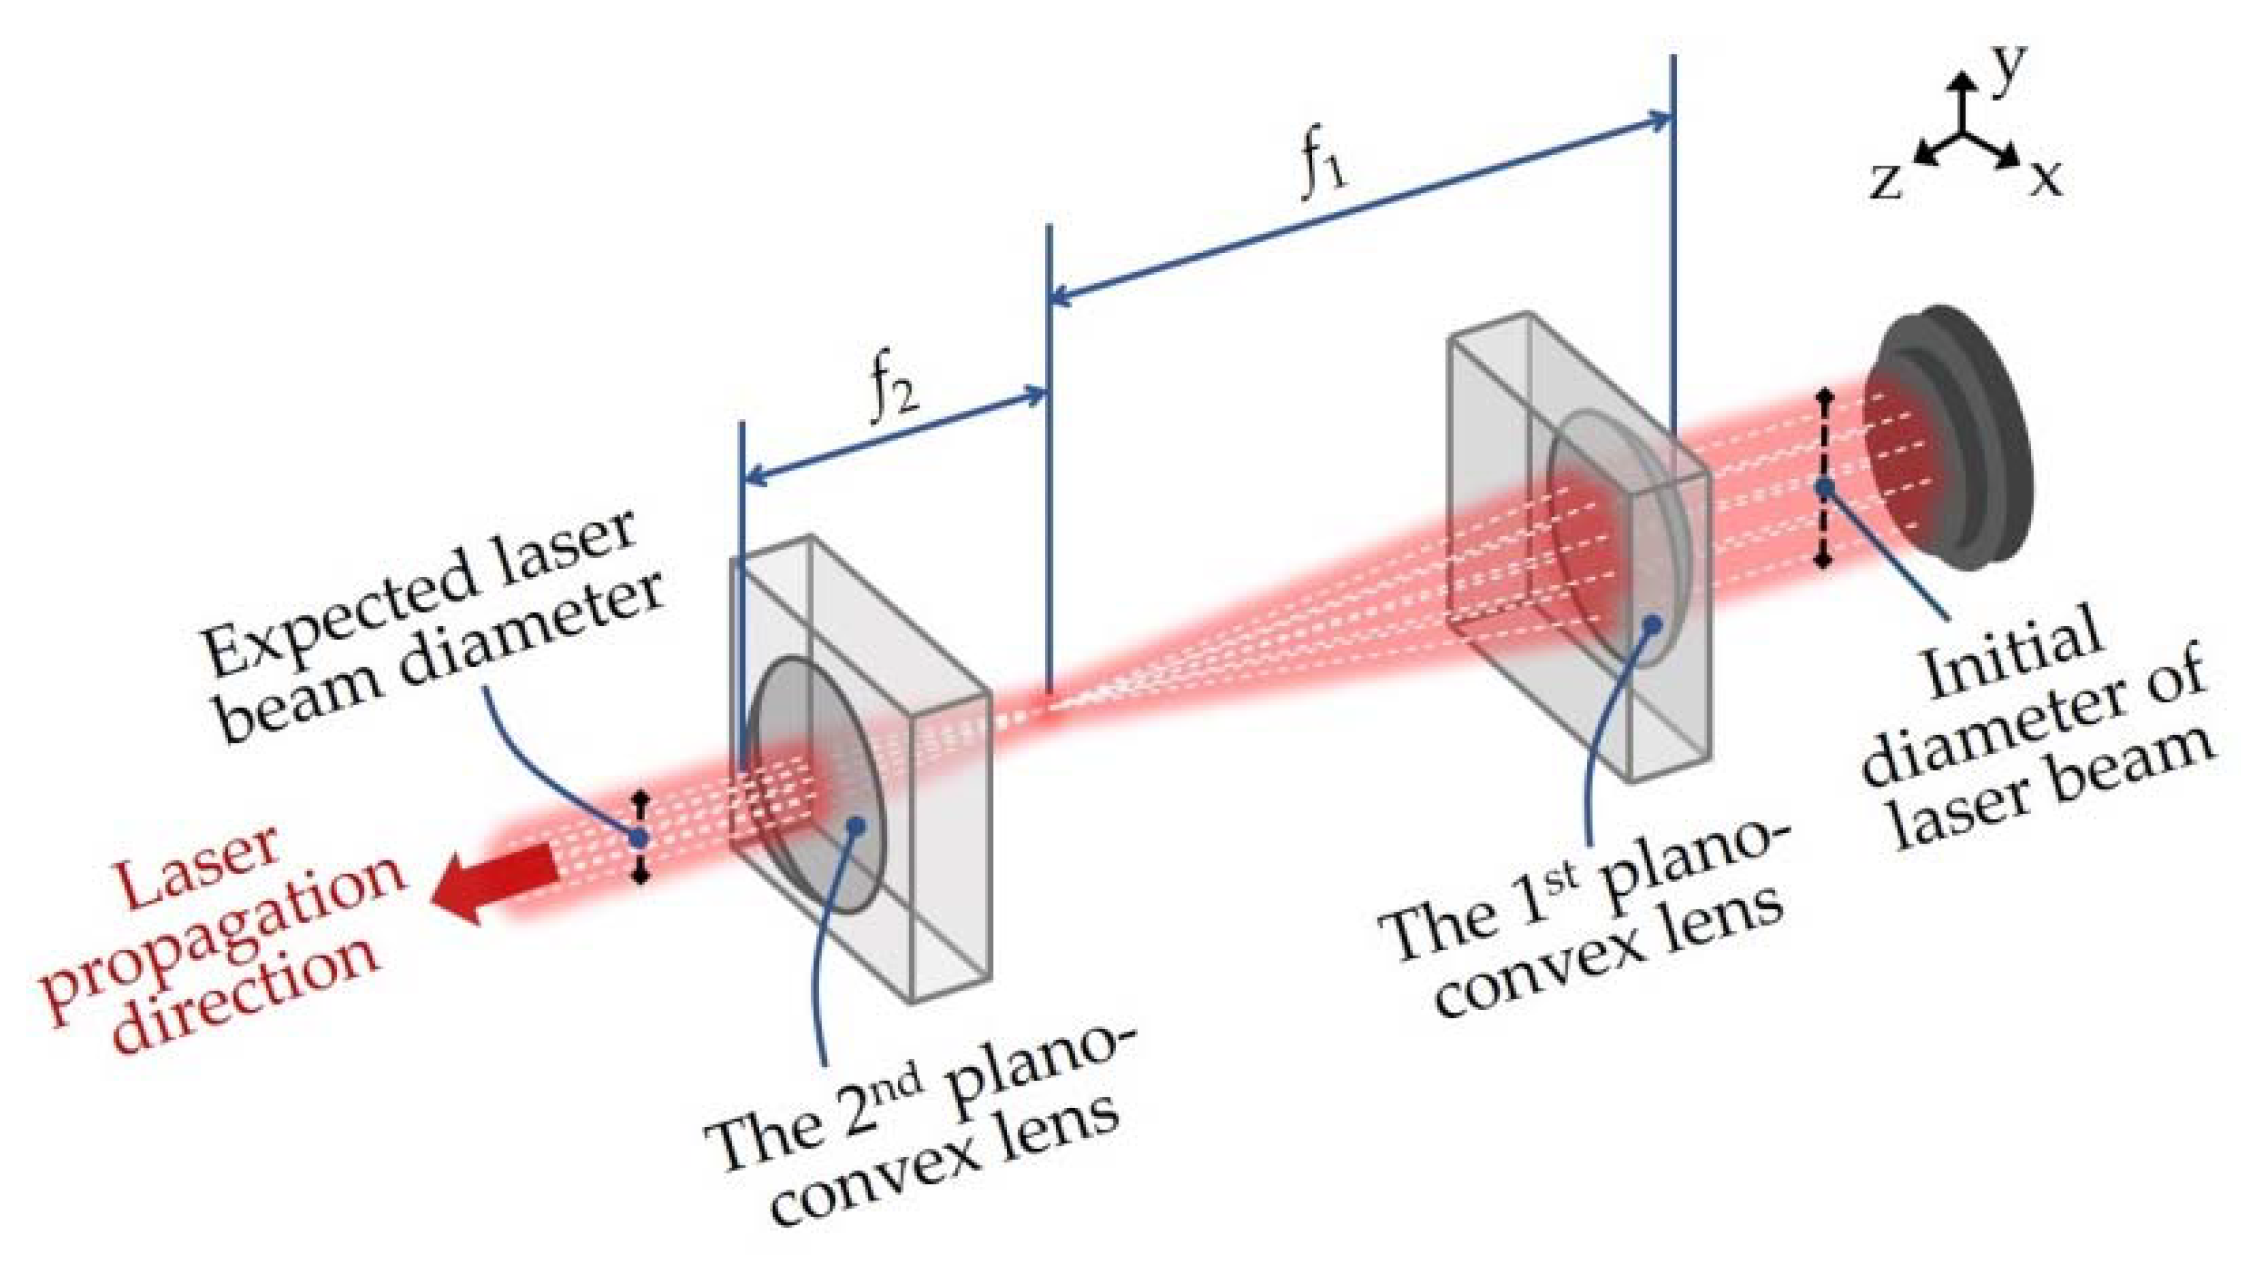
Aside from the NLO crystal preference, high intensity of the fundamental wave is required to generate a second harmonic wave with microwatts to milliwatts power. In previous work by the authors’ team, a focused fundamental wave was employed to generate a second harmonic wave [15,16]. However, the optical configuration with the focused fundamental wave made the alignment of the optical setup complicated. Furthermore, due to the limitation of the crystal size and the depth-of-focus of the focusing lens employed in the setup, the working distance of the second harmonic wave angle sensor was also limited. In this paper, a collimated fundamental wave whose light intensity is intensified by reducing the beam diameter is employed to address the issues. Figure 3 shows an example of the optical setup based on the Keplerian configuration that reduces the beam width. The following relationship can be found between the initial beam diameter d1 and the expected beam d2:
where the focal lengths of the first lens and the second lens are denoted by f1 and f2, respectively.
By using the intensified collimated fundamental wave, the angular displacement of the NLO crystal is expected to be carried out even when the working distance is set to be lengthy. Through the plane wave approximation, power intensity of the second harmonic wave with the ith wavelength and the jth angular position can be estimated by the following equation:
where deff is the effective nonlinear coefficient, ε0 is vacuum permittivity, c is the speed of light in vacuum, L is the length of the crystal, and S is the cross-sectional area. These quantities are considered to be constant and be ignored to simplify the calculation since they remain the same despite the changes of other physical quantities. It should be noted that restricting factors such as heat effect, walk-off effect, and dispersive spreading are not taken into consideration in the above equation [25]. The FW power intensity can be determined in the experiments where every mode in the fundamental wave has its deterministic power intensity. Furthermore, it should be noted that is proportional to the quadratic of FW power (2) and the quadratic of sinc function. The sinc function describes the behavior of the laser propagation inside the crystal. Taking the birefringent effect and phase mismatching ∆k into consideration, it can be expressed as follows:
where
The refractive indices of extraordinary ray ne (θ, λ’) can be calculated by the following equation:
The matching angle in Equation (1) is satisfied when Δk(θpm) = 0 and no(λ) = ne (θpm, λ). After all the calculations are fulfilled, the matrix P2 can be built as follows:
The matrix rows represent the calculated second-harmonic power intensity related to angular displacement. Meanwhile, the matrix column represents the second harmonic power intensity associated with the wide range of Fs laser wavelength. The calculated angle measurement trend can be decided by the peak of the calculated spectrum of the second harmonic wave concerning the angular displacement. Finally, the sensitivity can be determined by the slope of the calculated peaks trend line of the second harmonic wave.
3. Design of the Second Harmonic Wave Angle Sensor and Experiments
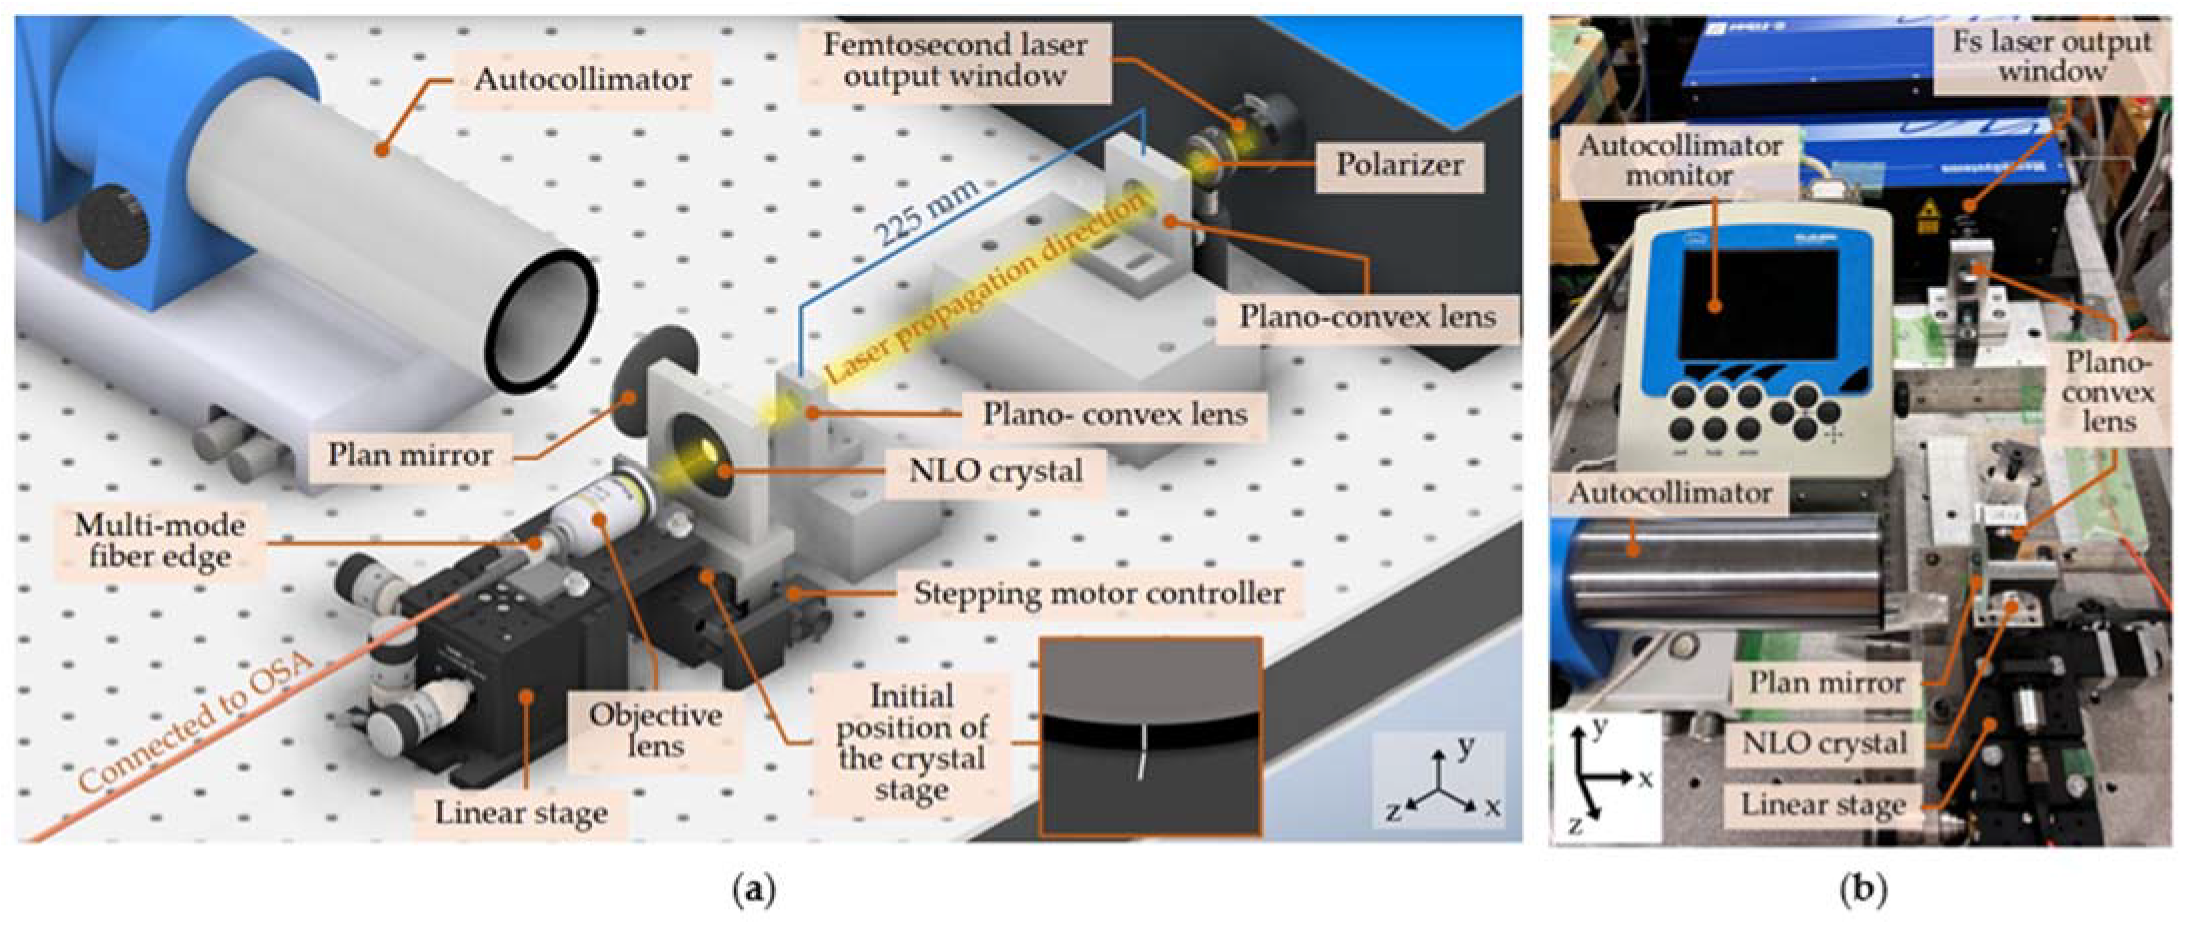
Figure 4a exhibits the schematic setup of the proposed angle sensor, and Figure 4b shows a photograph of the experimental setup. A commercial mode-locked Fs laser (C-Fiber High Power, Menlo Systems, Planegg, Germany) was employed as the FW source with an average power of >500 mW, a pulse repetition rate of 100 MHz, a pulse width of <150 fs, and a spectral range from 1480 nm to 1640 nm. The emitted laser beam travels through the polarizer and the plano-convex lenses (f1 = 150 mm and f2 = 75 mm) before passing through a rotary-stage-mounted MgO:LiNbO3 crystal (Castech Inc., Fujian, China) with a length L of 2 mm, cut-off angle of 47°, a diameter of 5 mm, and 5% MgO:LN. The laser beam consists of FW and generated second harmonic wave eventually reaches a multimode fiber (M42L02, Thorlabs Japan Inc., Tokyo, Japan) connected to an optical spectrum analyzer/OSA (highest wavelength resolution of 0.02 nm, AQ6370C, Yokogawa Electric, Tokyo, Japan), in which FW and SHG spectra were recorded. The rotary stage with a travel range of ±8.5° and a resolution of 0.0067° (KRB04017C, Suruga Seiki Co., Ltd., Shizuoka, Japan) was driven by the stepping motor controller (DS102MS, Suruga Seiki Co., Ltd., Shizuoka, Japan) to ensure the angular shift of the target was restrained. The data was collected for every 100 pulses given to the rotary stage, which is equivalent to approximately 121 arc-second. The alignment stage (MBT613D/M, Thorlabs Japan Inc., Tokyo, Japan) was equipped with an objective lens that can be shifted independently in the XYZ axis to guide the beam to the multimode fiber. A commercial laser autocollimator (Elcomat 3000, Moller-Wedel Optical GmbH, Wedel, Germany) was employed as the external angle sensor to evaluate the angular shift of the rotary stage.
As can be seen in Figure 4a, the initial position of the rotary stage was set such that the two indicator lines on the rotary plate and the surface of the stepping motor controller met. The incident laser was assumed to be perpendicular to the crystal surface at this initial position. The detection of the angular displacement was carried out by observing the evolution of the SHG spectrum with respect to the changes in the angular position of the crystal. The detection continued by varying the Z-position of the crystal. The autocollimator ensured the angular position of the crystal throughout the entire experiment. The sensitivity of the angle sensor was determined by concerning the slope of the measurement trend based on the SHG peaks changing versus respective angle shifts.
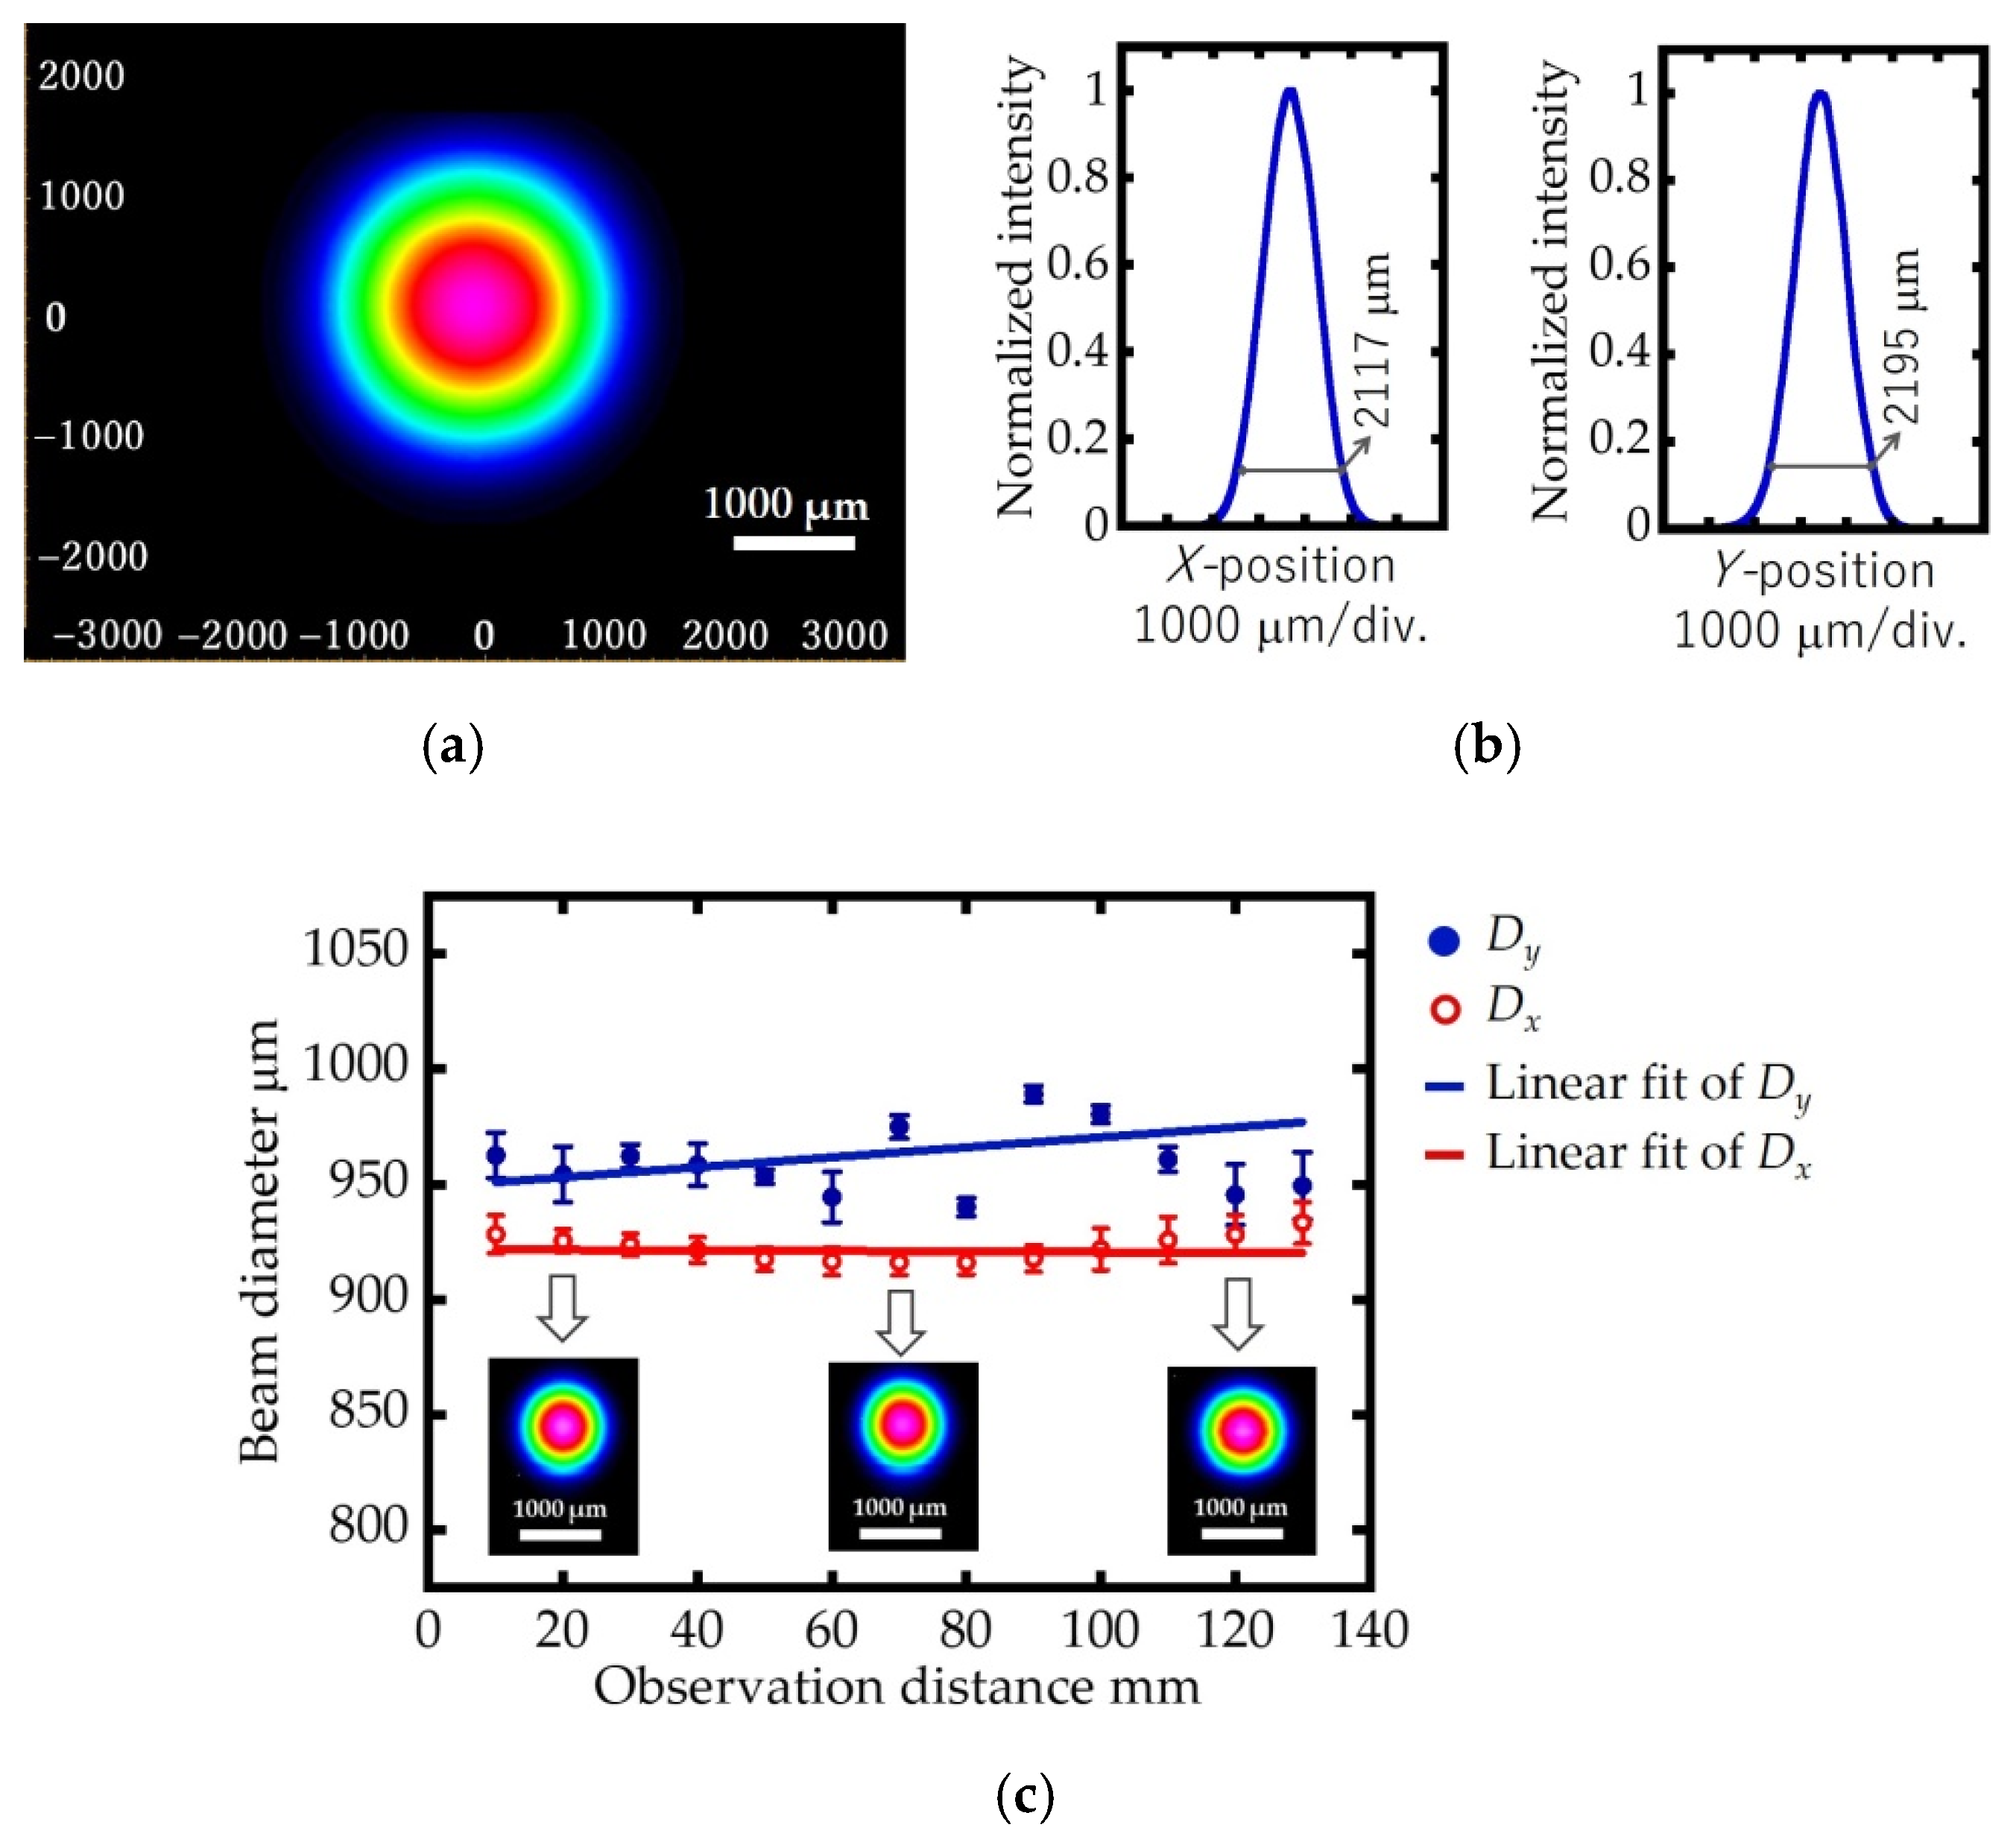
As one of the first steps to produce a collimated laser beam, the initial Fs laser output profile was observed. Figure 5a shows the profile of the collimated laser beam at the initial condition, which was observed at the cross-sectional Z-axis, and Figure 5b shows its cross-sectional profile. The beam width can be defined as the 1/e2 value of those Gaussian-like intensities. The beam width was evaluated to be 2117 μm and 2195 μm along with the X and Y-directions, respectively.
High input power is required when the Fs laser with the initial beam width is employed directly, as explained in the previous section. A reduction in the beam width is thus required. The reduction in the beam width was successfully carried out using the setup shown in Figure 4. Figure 5c shows the change in the beamwidth as the increase in observation distance. As shown in the figure, the X-directional diameter showed more consistent results than the Y-directional diameter upon the variation of observation distance. Since the dispersion angle was small at the observation distance from 10 mm to 140 mm, the produced laser was treated as a collimated laser beam. The evaluation of this collimated beam is tabulated in Table 1. It should be noted that the beamwidth was to be smaller than the value estimated by Equation (1), 1058.5 μm in the X-direction and 1097.5 μm in the Y-direction. This discrepancy was due to the initial profile of the Fs laser beam; as the profiler was positioned farther than the first plano-convex lens, the beam at this position could experience dispersion, resulting in the detection of the profile with a larger diameter.
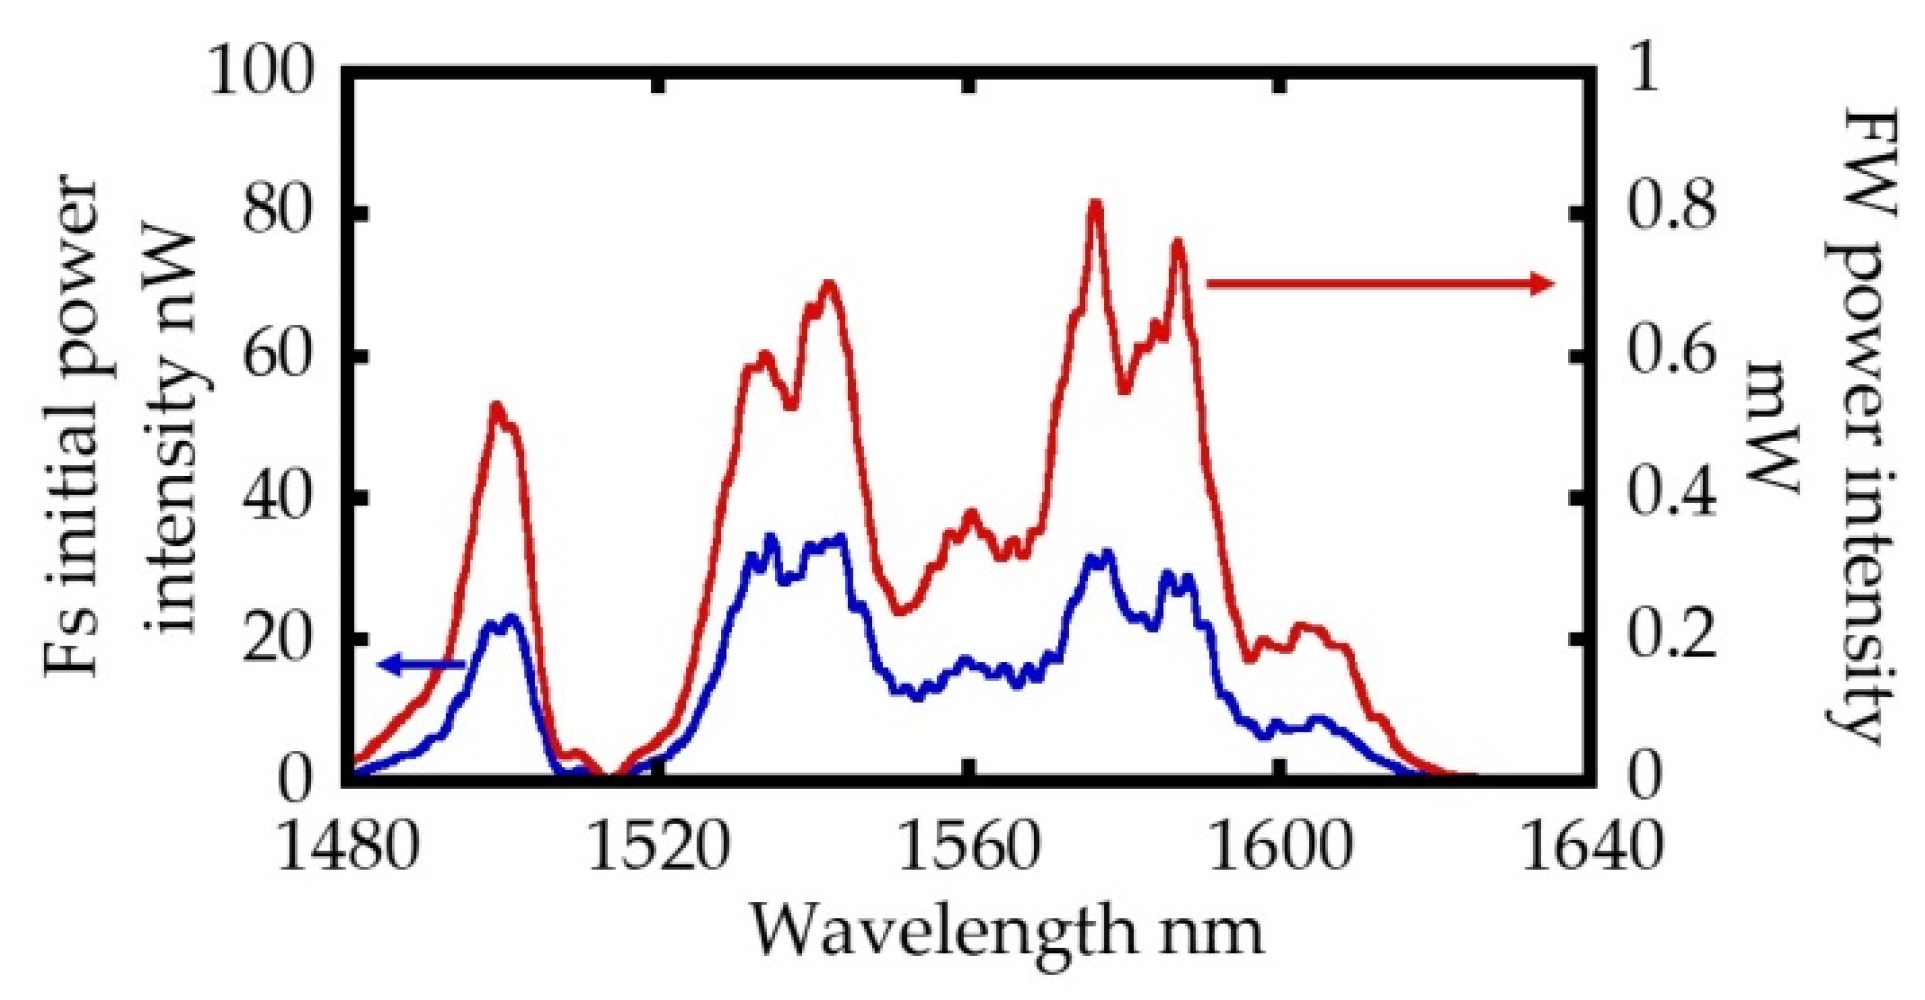
Figure 6 shows the spectral characteristics of the initial Fs laser output and the Fs laser output after the reduction in the beam diameter. The initial Fs laser output had a power density of 0.35 W/cm2. In contrast, a smaller beam width produced a high-power intensity with a power density of 19.17 W/cm2. This spectral characteristic in Figure 6 was later used for the calculation.
Figure 7a shows the intensity of the second harmonic wave to be generated by the FW estimated based on Equation (5). The angular displacement calculated based on the change in the spectral peak is presented in Figure 7b; this result indicates the measurement trend. As can be seen in Figure 7c, a sensitivity of 0.00725 arc-second/nm was observed in the most extended measurement range, while a sensitivity of 0.00226 arc-second/nm was observed in the least measurement range, as shown in Figure 7d. Recalling that the cut-off angle of MgO:LiNbO3 crystal is 47.5° and Fs wavelength range is 1480 nm to 1640 nm, the measurement trend in Figure 7b theoretically occurs at an angle of incidence between 1.00° to 3.87°. Although the calculated yield trendline was not as smooth as the calculated MgO:LiNbO3 phase-matching angle shown in Figure 1, it still showed a nearly similar angle–wavelength dependence tendency.
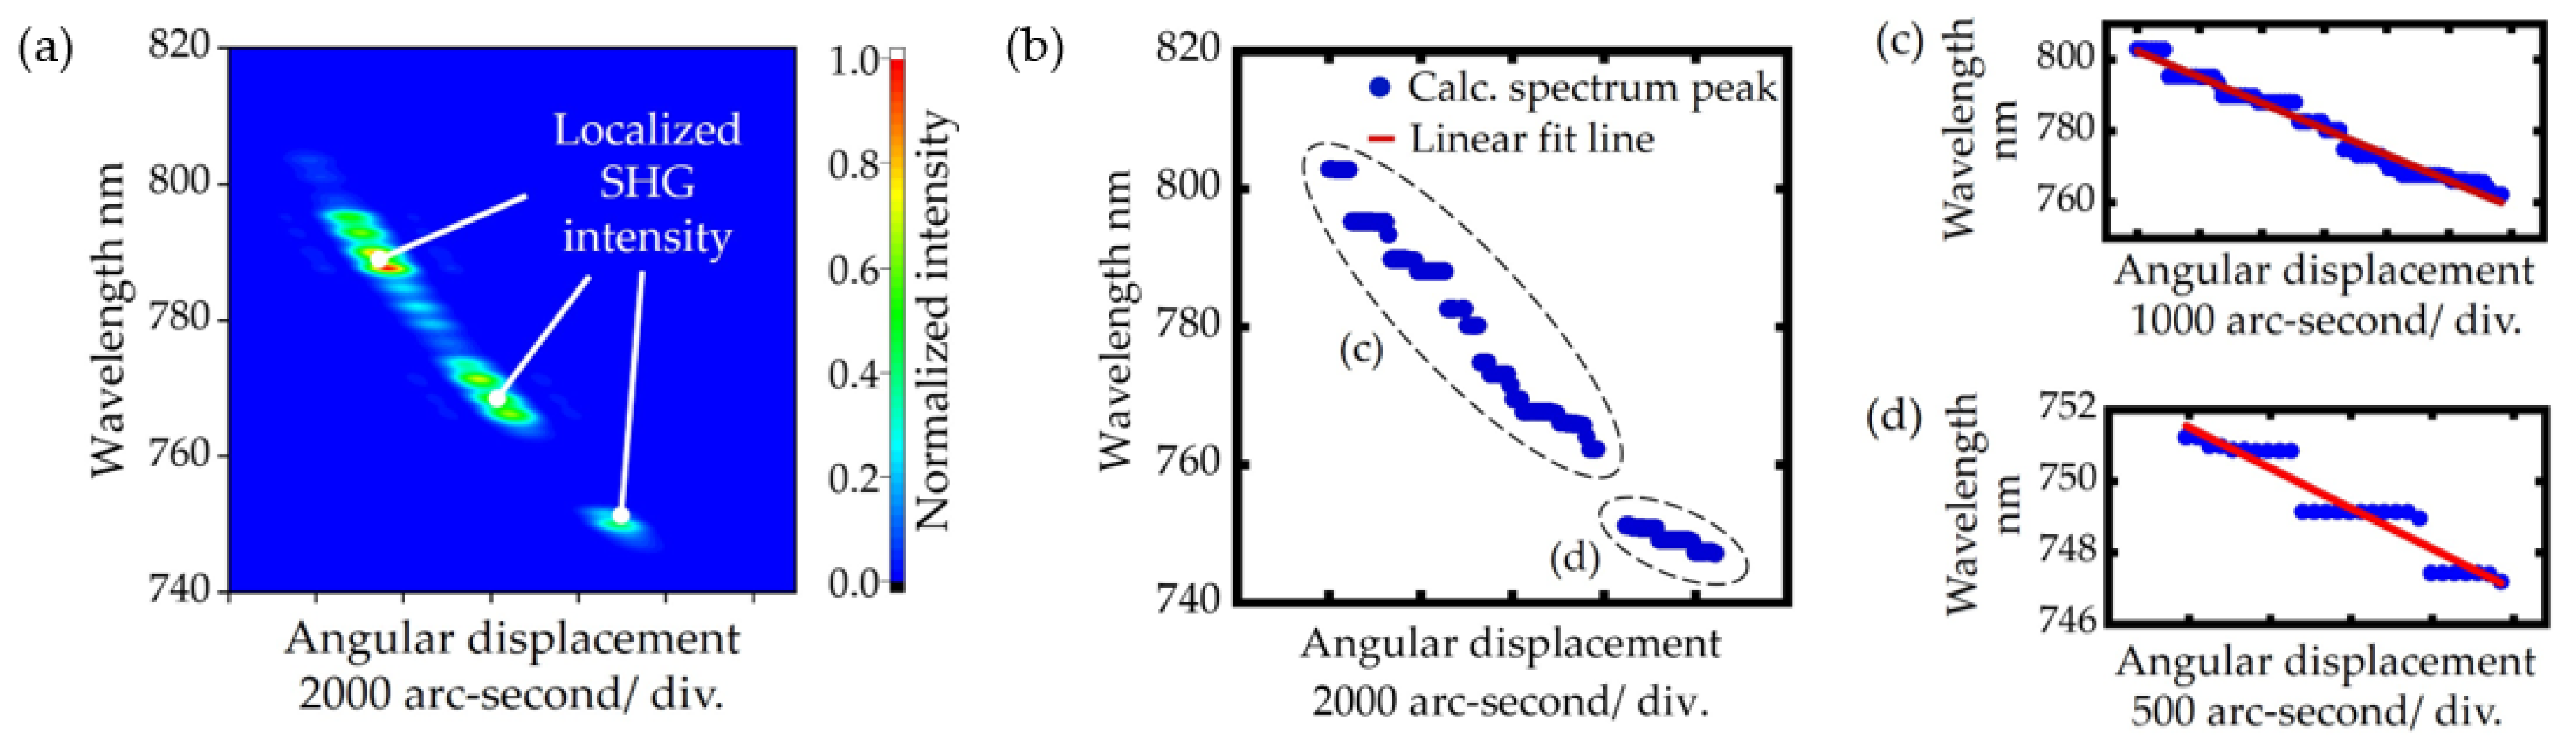
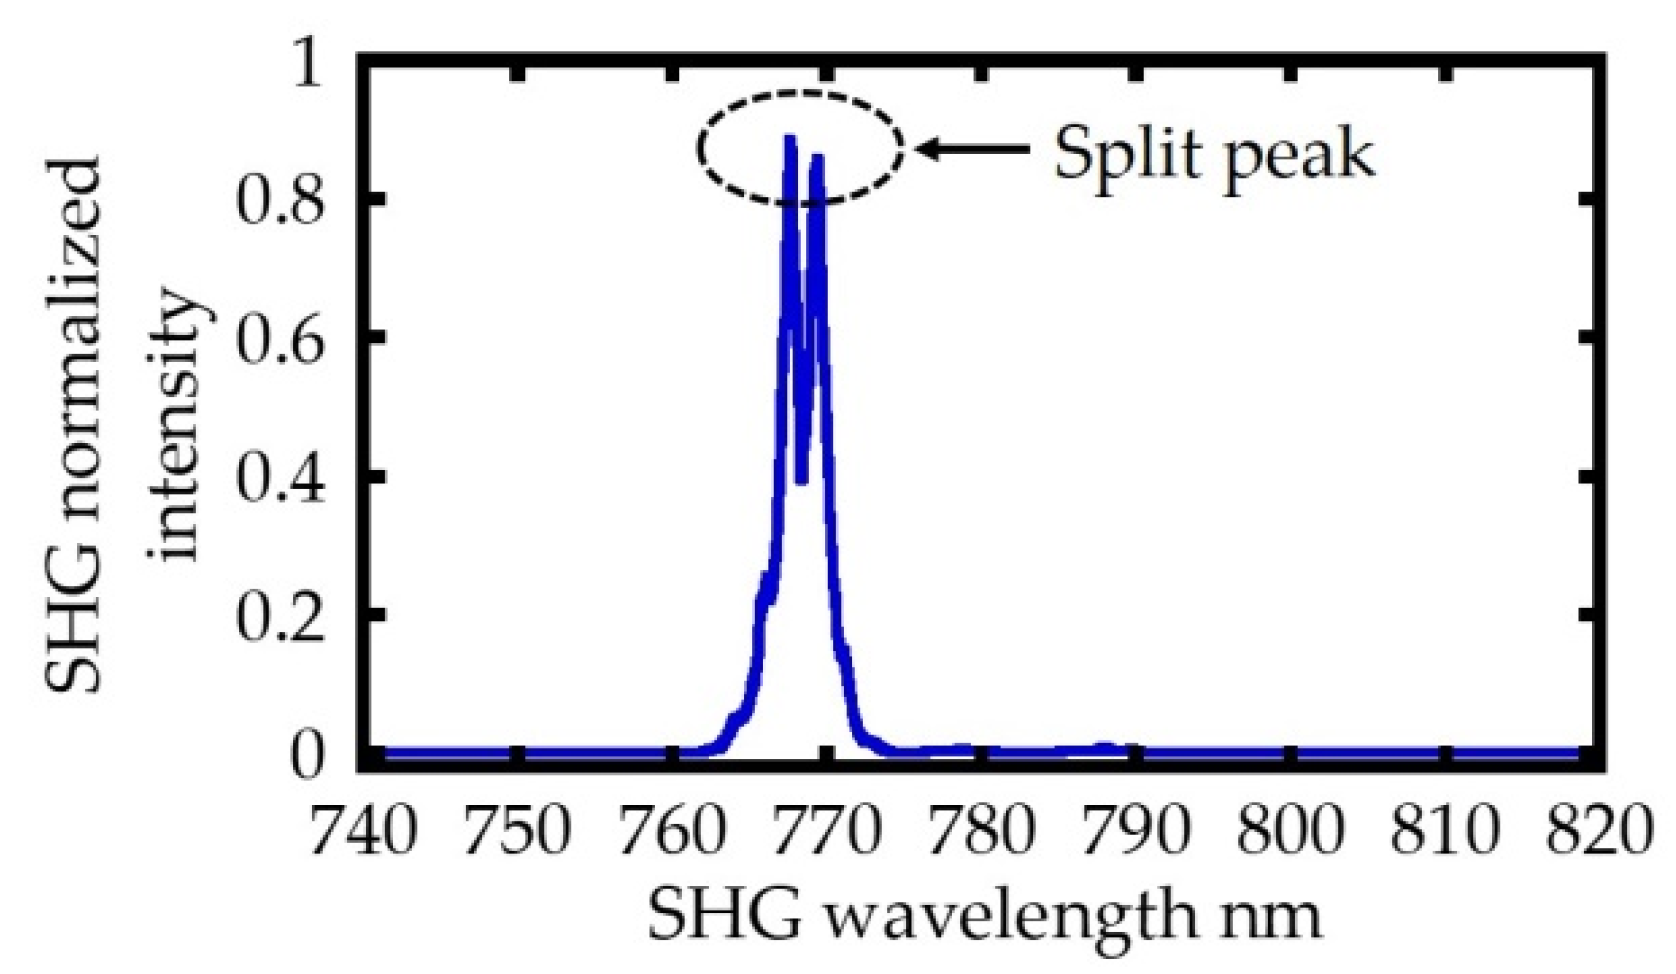
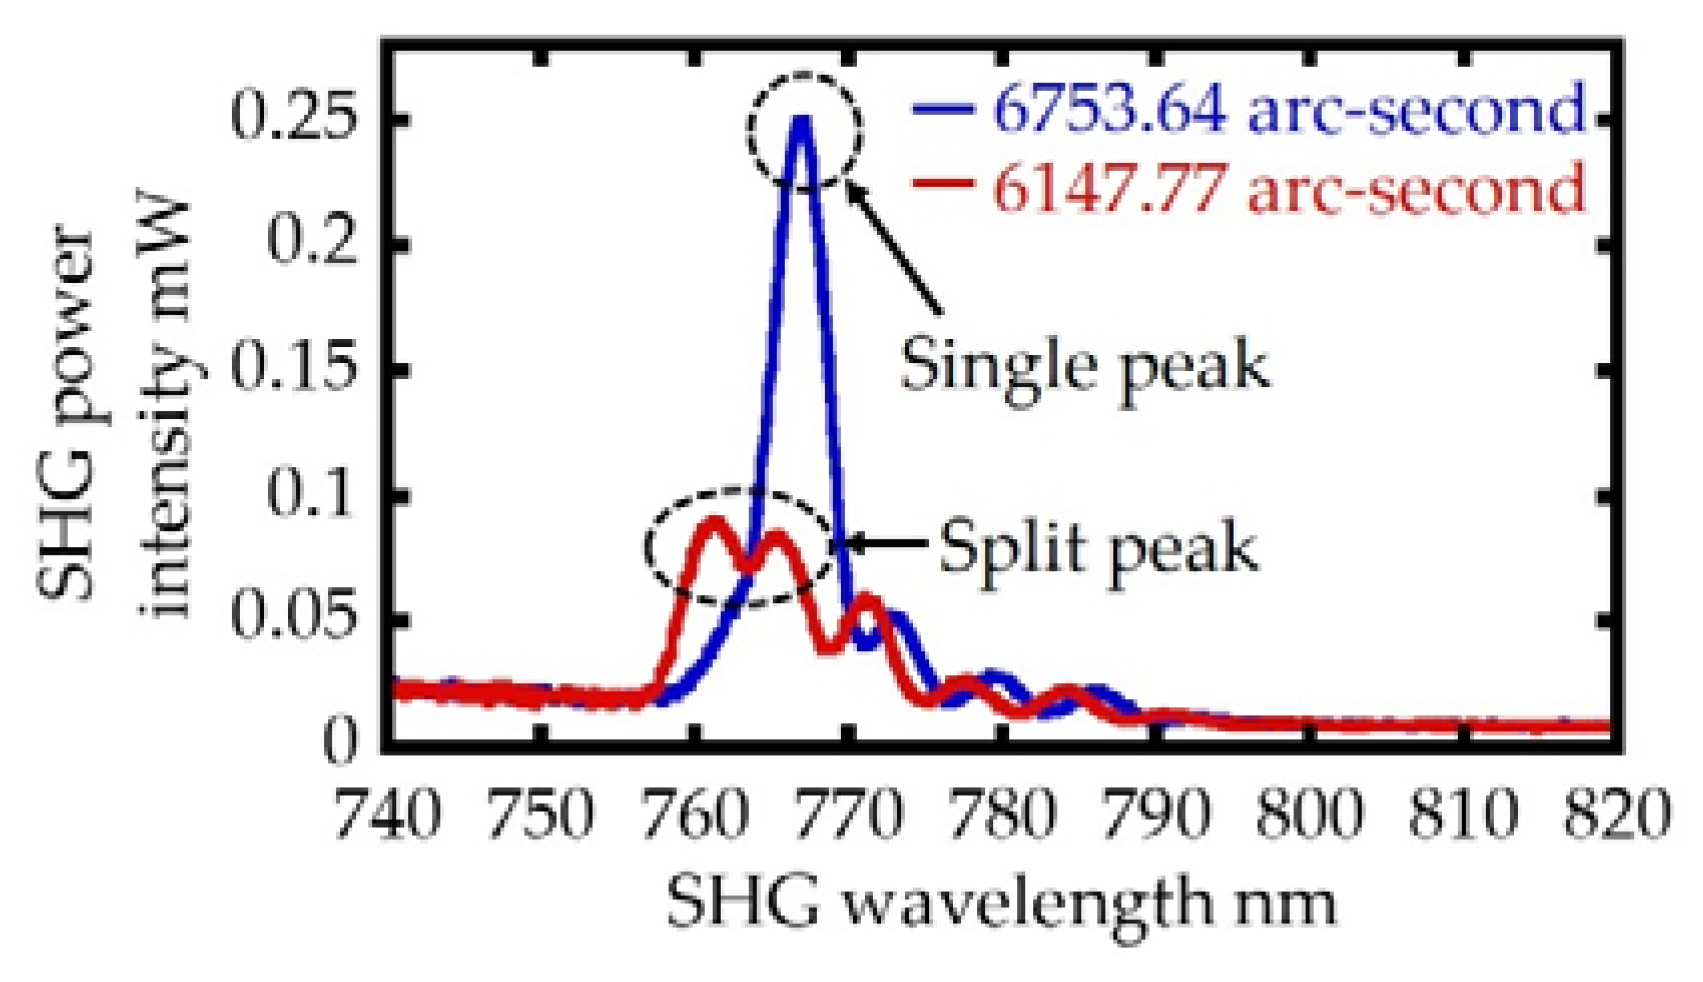
A close observation of the results shows the presence of the split peaks that causes the localized SHG intensities and discrepancy of the measurement trend line. For instance, Figure 8 shows one of the split peaks that appeared at the matching angle of 50.18°. The split peak caused two peaks of the SHG spectrum to detect a specific angle position simultaneously.
Further analysis of the calculations was carried out to explore the measurement dynamics. Figure 9a shows the dynamics of phase mismatch for a certain angle and Figure 9b shows the dynamics of the sinc quadratic function. As shown in Figure 9a, a certain angular phase mismatch for a given wavelength established a pattern that affected the sinc quadratic function in Figure 9b. The peaks of sinc quadratic function gradually narrowed with the increase in angle. Since the sinc quadratic function was applied to the FW spectrum in Figure 6 consisting of peaks and valleys, the second harmonic wave spectrum was dynamically changed, and the split peaks were unavoidable.
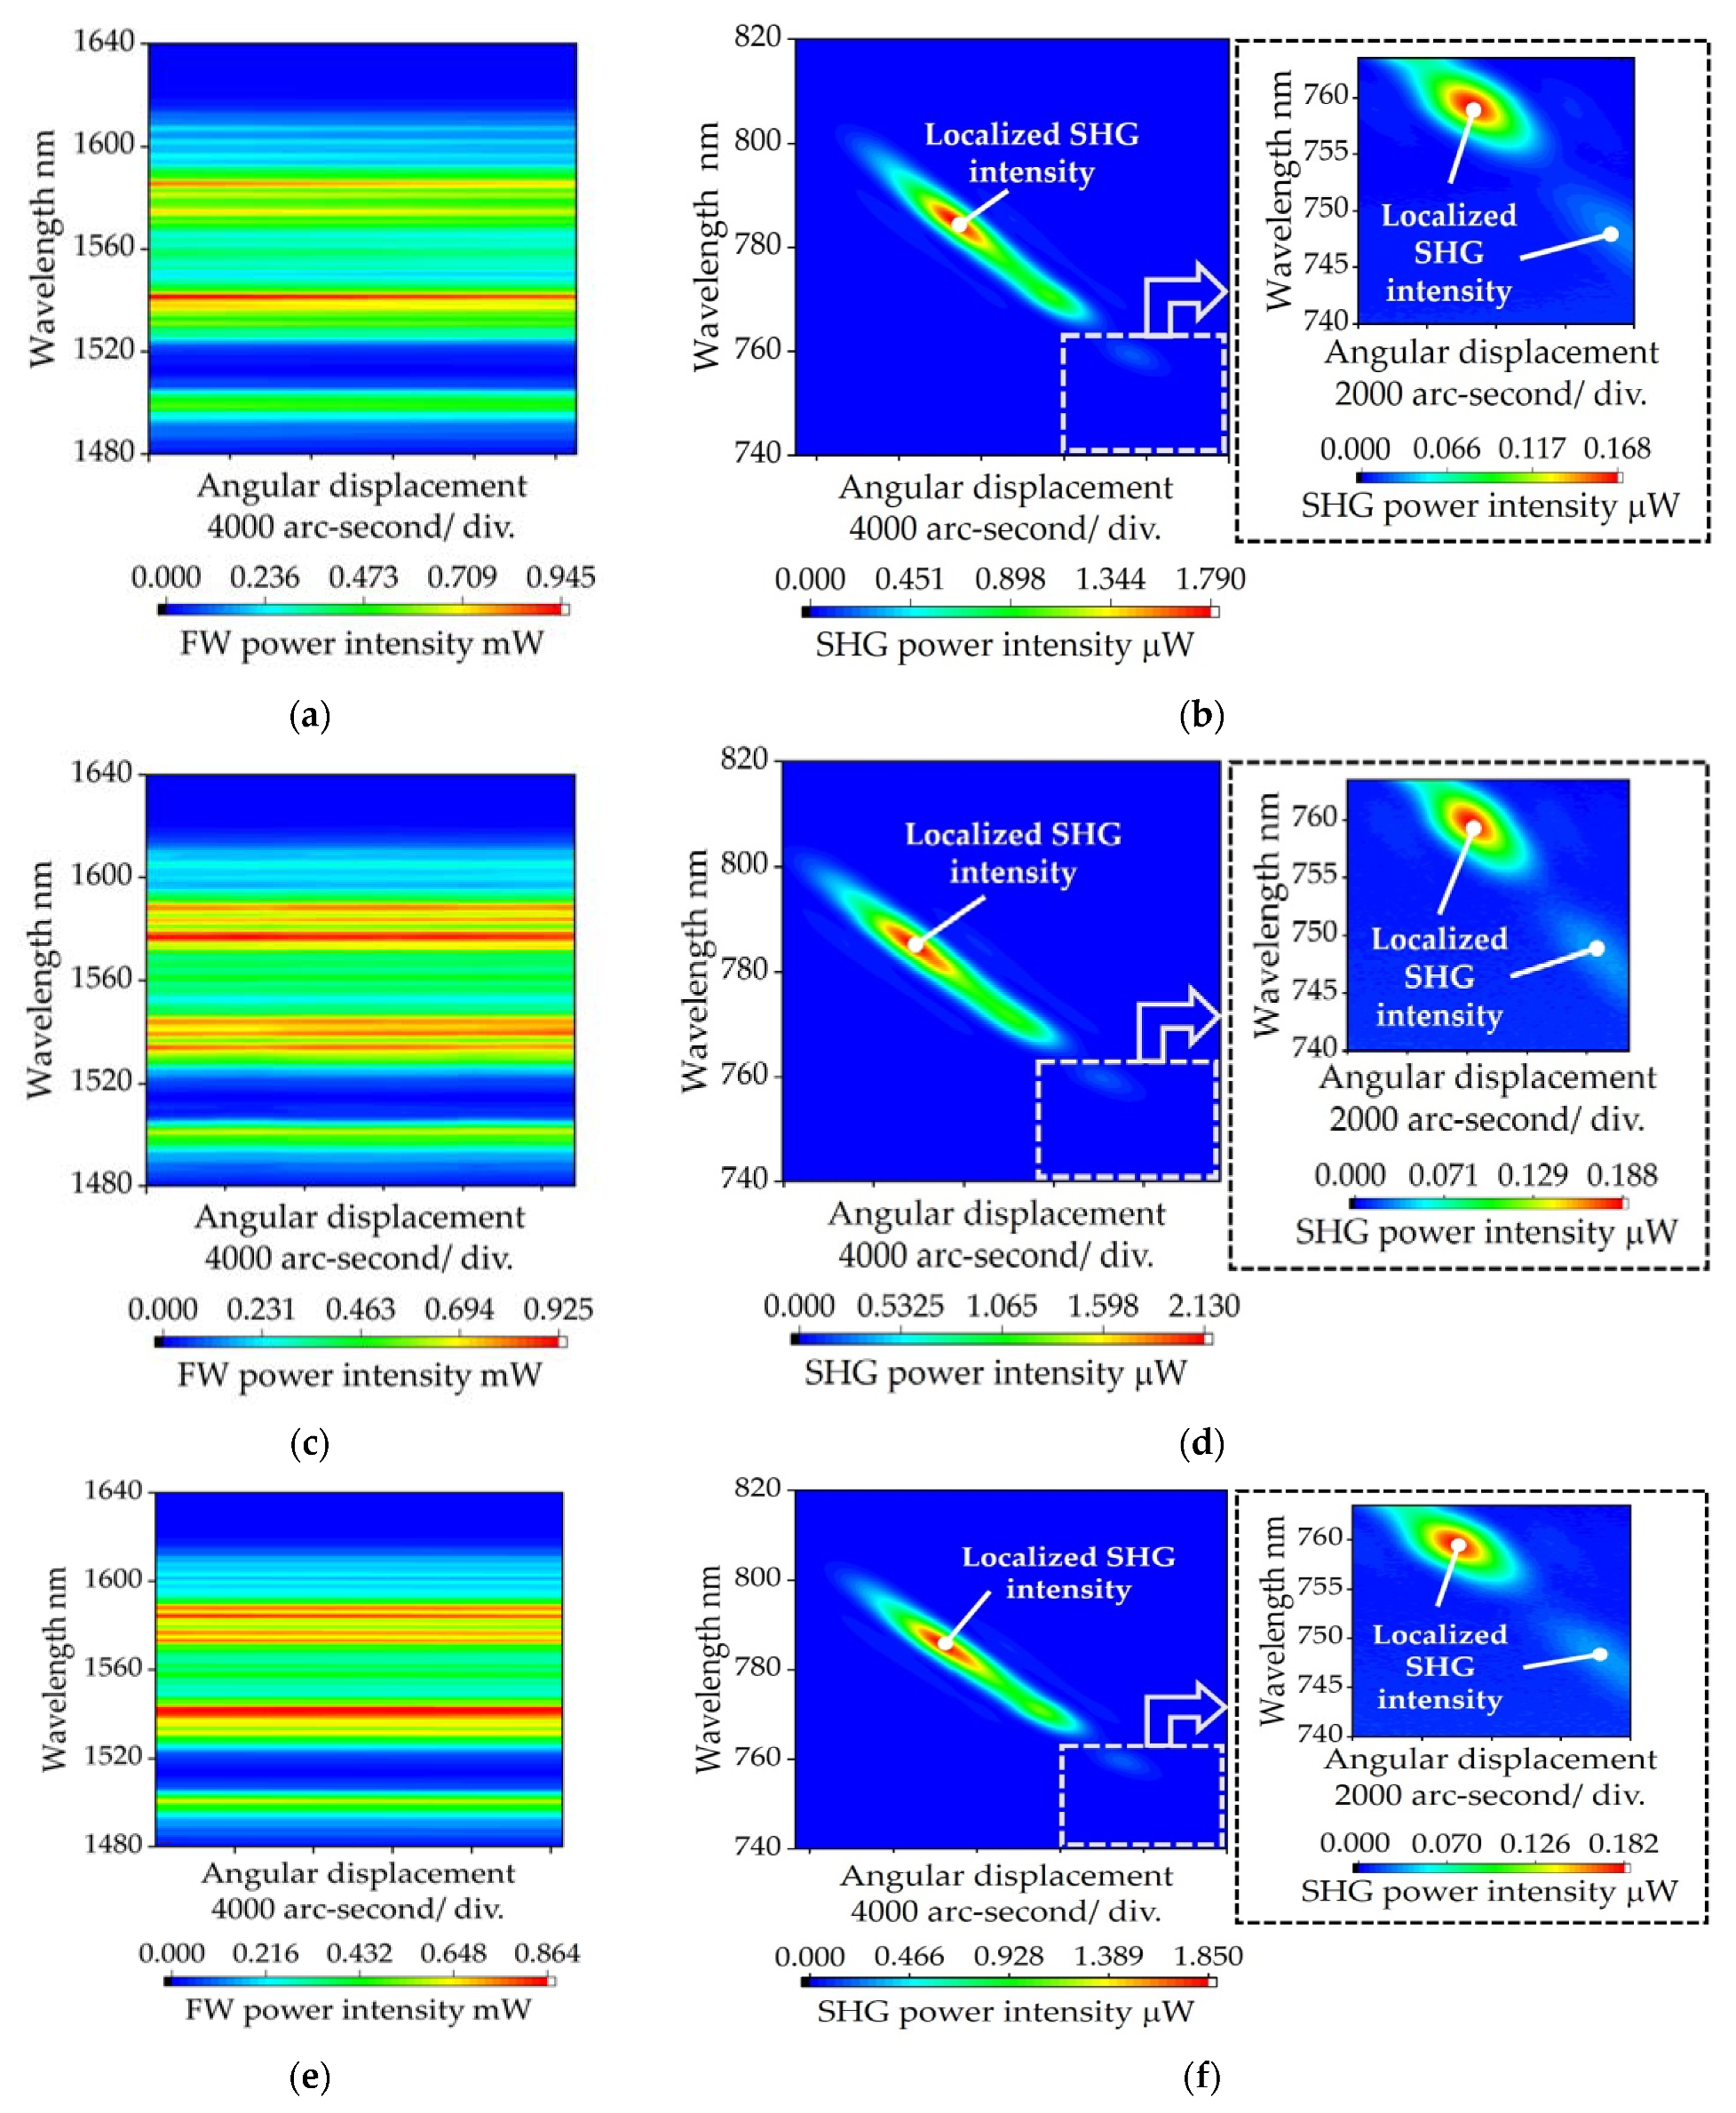
Figure 10 shows the performance of the proposed angle sensor. The performance was validated by the characteristic of the detected FW and second harmonic wave associated with angular change and the variation of the crystal position. The observed second harmonic wave in Figure 10b,d,f revealed a different contour profile compared to the calculation result in Figure 7a. Inconsistency in the FW intensity and second harmonic wave was found when the crystal position was changed. Such inconsistencies were frequently encountered in the use of lasers, especially when re-alignment of the experimental setup was carried out. A different start point and endpoint of the angle measurement were observed in the figures as the initial position of the crystal was manually adjusted. However, it did not affect the sensor performance. The localized SHG intensity appeared in all variations in crystal position. The augmented contour graphs give a better view of the lower wavelength range area where the localized intensities are also spotted. Compared to one another, those results have a resemblance in characteristics and tendencies. It indicates that variations in crystal position along the laser beam propagation direction had no significant impact on the FW and SHG spectra.
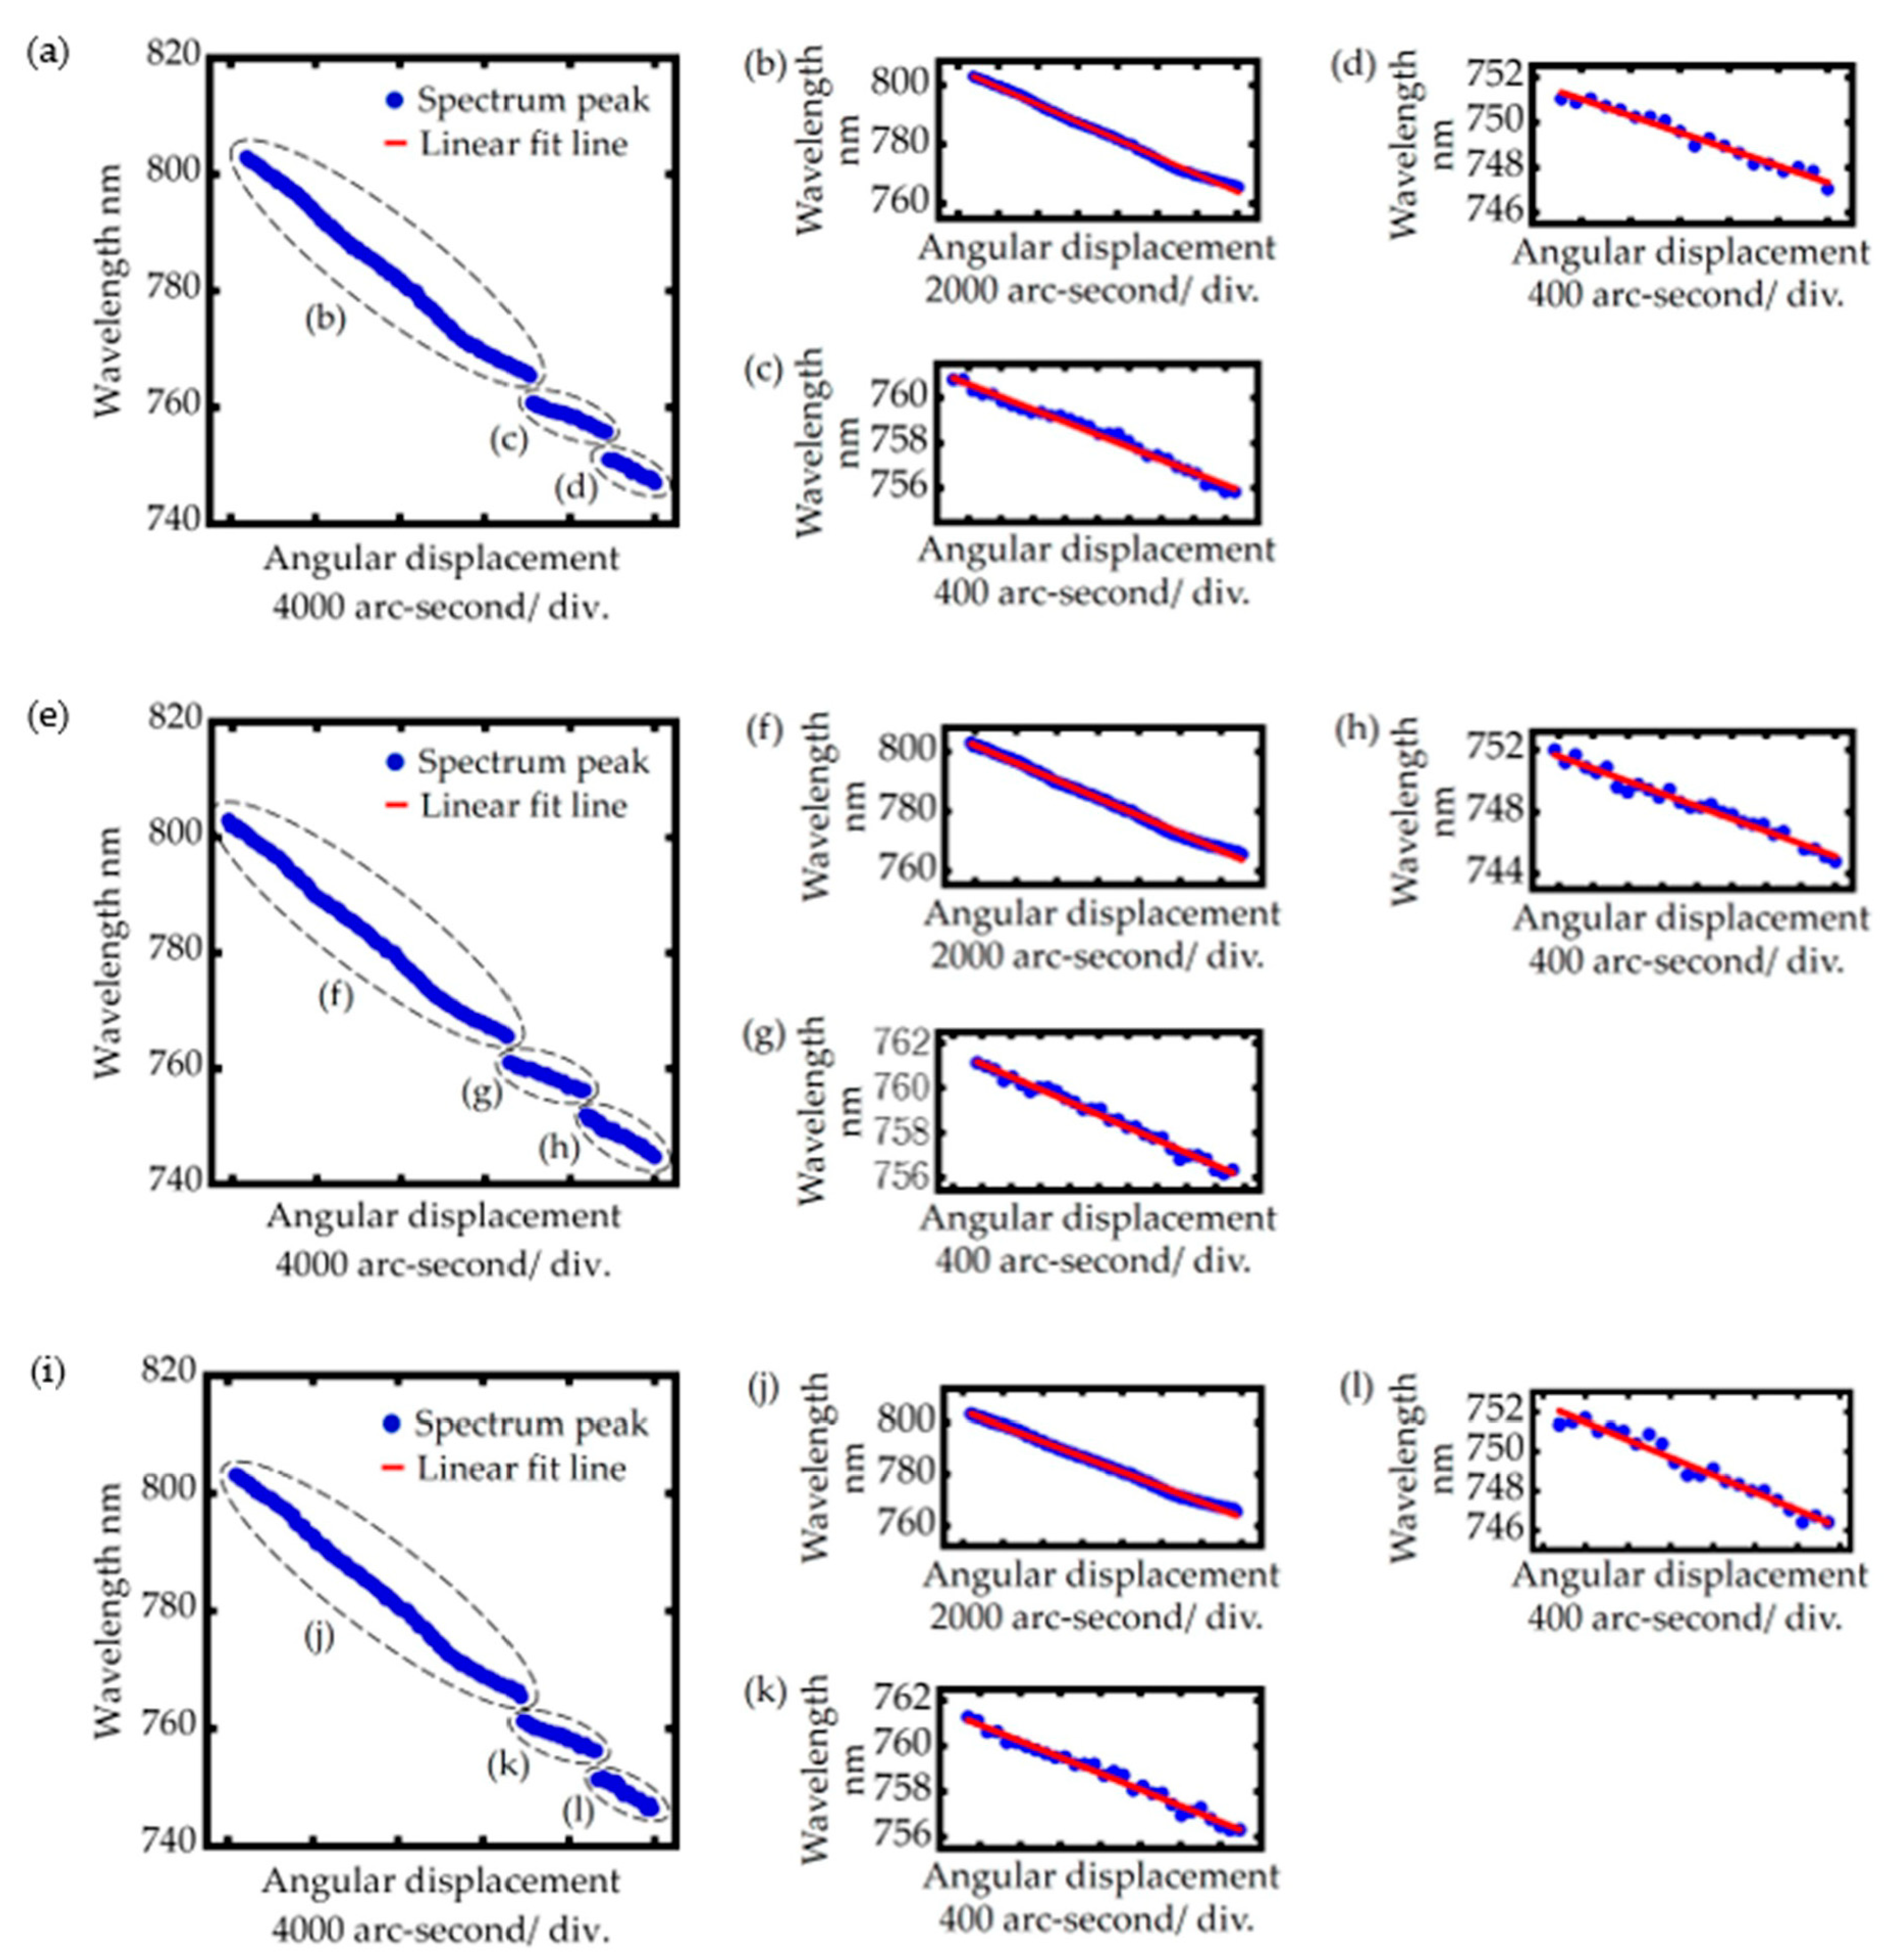
Figure 11 shows the measurement trend of the proposed angle sensor, determined by estimating the SHG peak with respect to the angle transition. By considering the SHG peak only, the problem of intensity inconsistency at the crystal position variations mentioned earlier can be solved. The thorough measurement trend results in Figure 11a,c,e revealed different measurement trends compared to calculation results in Figure 7b. The calculation could not confirm the measurement trend in the least intensity of localized SHG due to the very low efficiency in this range.
The measurement trends in Figure 11 are tabulated in Table 2. The most extended measurement range of all crystal positions changes showed identical sensitivity and resolution. In this area, the measurement target represented by the crystal position could be placed at any position along the collimated beam propagation direction. Meanwhile, the intensity was not steady throughout the experiment in areas with a lesser measurement range, resulting in inconsistent measurement sensitivity. The angle measurement range of 18,998.31 arc-second, 19,948.44 arc-second, and 19,256.59 arc-second was achieved at the crystal position of 30 mm, 50 mm, and 70 mm, respectively. It is also noticed in Table 2 that the experiment results afforded lower measurement sensitivity but had a wider-angle range than that predicted in the calculation results. The main cause of the discrepancy was down to the optical factor in the calculations being ignored. For example, it is assumed that the laser propagated through the air before entering the crystal, where the refractive index of the crystal is greater than that of air. The direction of Fs laser propagation could thus change when it entered the crystal. However, the difference in the refractive index was not taken into account in the calculation. The calculation can be modified by considering Snell’s law as it has been reported in the previous study [16]. Even so, Snell’s law can only explain changes in the measurement sensitivity and angle range based on the measurement trend line. However, it cannot explain the difference in the contours of the SHG spectrum.
Table 3 shows the result of the previous study related to the SHG concept for detecting angle displacement. Compared to the results of the previous frequency domain angle sensor [16] by using a focused beam method with a similar type of crystal, the current result has a twice wider measurable angle range in total with three different sensitivities, in which the previous study only reported one measurement sensitivity. Another previous study of SHG angle sensors in the domain of time [15] utilizing beta barium borate (BBO) crystal has reported an even narrower measurement range (1040 arc-second).
Taking closer identification in the measurement trend line, the split peak was the main cause of the measurement sensitivity discrepancy, as was shown in the calculation. Figure 12 shows an exemplification of the split peak. The single peak is also plotted in the figure for comparison. A split peak of the second harmonic wave spectrum appeared when the crystal was rotated by 6147.77 arc-second from its initial position. In contrast, only one peak appeared when the crystal was rotated by 6753.64 arc-second.
4. Conclusions
The SHG angle sensor with collimated Fs beam has been demonstrated by evaluating the SHG spectral peak upon the angular position of MgO:LiNbO3 crystal that represents the measurement target. A measurement sensitivity of 0.000294 nm/arc-second and a resolution of 6.80 arc-second was achieved in the most extended observable angle range at all crystal positioned variations on the Z-axis. It indicates that the proposed angle sensor can overcome the problem of target misalignment along the Fs laser propagation direction. The configuration of the angle sensor is suitable for non-contact inspection as well as not being limited by the type of material target, providing the solution to the problems encountered in the use of conventional angle sensors. For these reasons, the proposed angle sensor is expected to have many potential applications, especially in the inspection process in manufacturing industry.
Author Contributions
Conceptualization, W.G. and Y.S.; methodology, W.G. and H.M.; software, W.D.A. and R.S.; validation, W.G., Y.S. and H.M.; formal analysis, W.D.A., K.L. and R.S.; investigation, W.D.A. and K.L.; resources, W.G., Y.S. and H.M.; data curation, W.G. and H.M.; writing—original draft preparation, W.D.A. and Y.S.; writing—review and editing, W.G. and Y.S.; visualization, W.G. and Y.S.; supervision, W.G.; project administration, W.G.; funding acquisition, W.G., Y.S., H.M. All authors have read and agreed to the published version of the manuscript.
Funding
This research was funded by the Japan Society for the Promotion of Science (JSPS): 20H00211.
Institutional Review Board Statement
Not applicable.
Informed Consent Statement
Not applicable.
Data Availability Statement
The data presented in this study are available on request from the corresponding author.
Conflicts of Interest
The authors declare no conflict of interest.
References
- Javaid, M.; Haleem, A.; Singh, R.P.; Rab, S.; Suman, R. Significance of sensors for industry 4.0: Roles, capabilities, and applications. Sens. Int. 2021, 2, 100110. [Google Scholar] [CrossRef]
- Kalsoom, T.; Ramzan, N.; Ahmed, S.; Ur-Rehman, M. Advances in sensors technologies in the era of smart factory and industry 4.0. Sensors 2020, 20, 6783. [Google Scholar] [CrossRef] [PubMed]
- Kumar, A.S.A.; George, B.; Mukhopadhyay, C. Technologies and applications of angle sensors: A review. IEEE Sens. J. 2021, 6, 7195–7206. [Google Scholar] [CrossRef]
- Wan, B.F.; Zhou, Z.W.; Xu, Y.; Zhang, H.F. A theoretical proposal for a refractive index and angle sensor based on one-dimensional photonic crystals. IEEE Sens. J. 2021, 21, 331–338. [Google Scholar] [CrossRef]
- Hou, B.; Zhou, B.; Song, M.; Lin, Z.; Zhang, R. A novel single-excitation capacitive angular position sensor design. Sensors 2016, 16, 1196. [Google Scholar] [CrossRef] [PubMed]
- Kumar, A.S.A.; George, B. A noncontact angle sensor based on Eddy current technique. IEEE Trans. Instrum. Meas. 2020, 64, 1275–1283. [Google Scholar] [CrossRef]
- Brajon, B.; Lugani, L.; Close, G. Hybrid magnetic-inductive angular sensor with 360° range and stray-field immunity. Sensors 2022, 22, 2153. [Google Scholar] [CrossRef]
- Ripka, P.; Blažek, J.; Mirzaei, M.; Lipovský, P.; Šmelko, M.; Draganowá, K. Inductive position and speed sensors. Sensors 2019, 20, 65. [Google Scholar] [CrossRef] [Green Version]
- Li, R.; Zhou, M.; Konyakhin, I.; Di, K.; Lu, Y.; Guo, J.; Liu, Y. Cube-corner autocollimator with expanded measurement range. Opt. Express 2019, 25, 5. [Google Scholar] [CrossRef]
- Matsukuma, H.; Asumi, Y.; Nagaoka, M.; Shimizu, Y.; Gao, W. An autocollimator with a mid-infrared laser for angular measurement of rough surfaces. Precis. Eng. 2021, 67, 89–99. [Google Scholar] [CrossRef]
- Peredes, F.; Herrojo, C.; Martin, F. Position sensors for industrial applications based on electromagnetic encoders. Sensors 2020, 21, 2738. [Google Scholar] [CrossRef] [PubMed]
- Li, X.; Ye, G.; Liu, H.; Ban, Y.; Shi, Y.; Yin, L.; Lu, B. A novel optical rotary encoder with eccentricity self-detection ability. Rev. Sci. Instrum. 2017, 88, 115005. [Google Scholar] [CrossRef] [PubMed]
- Smith, S.T.; Seugling, R.M. Sensor and actuator considerations for precision, small machines. Precis. Eng. 2006, 30, 245–264. [Google Scholar] [CrossRef]
- Zhang, Z.; Yan, J.; Kuriyagawa, T. Manufacturing technologies toward extreme precision. Int. J. Extrem. Manuf. 2019, 1, 022001. [Google Scholar] [CrossRef] [Green Version]
- Matsukuma, H.; Madokoro, S.; Astuti, W.D.; Shimizu, Y.; Gao, W. A new optical angle measurement method based on second harmonic generation with a mode-locked femtosecond laser. Nanomanufacturing Metrol. 2019, 2, 187–198. [Google Scholar] [CrossRef]
- Astuti, W.D.; Matsukuma, H.; Nakao, M.; Li, K.; Shimizu, Y.; Gao, W. An optical frequency domain angle measurement method based on second harmonic generation. Sensors 2021, 21, 670. [Google Scholar] [CrossRef]
- Boyd, R.W. Nonlinear Optics, 4th ed.; Academic Press: San Diego, CA, USA, 2020; pp. 1–63. [Google Scholar]
- Kato, N. Optical second harmonic generation microscopy’ application to the sensitive detection of cell membrane damage. Biophys. Rev. 2019, 3, 399–408. [Google Scholar] [CrossRef]
- Nuriya, M.; Fukushima, S.; Momotake, A.; Shinotsuka, T.; Yasui, M.; Arai, T. Multimode two-photon imaging using a second harmonic generation-specific dye. Nat. Commun. 2016, 7, 11557. [Google Scholar] [CrossRef] [Green Version]
- Bonacina, L.; Brevet, P.F.; Finazzi, M. Harmonic generation at the nanoscale. J. Appl. Phys. 2020, 127, 230901. [Google Scholar] [CrossRef]
- Baskey, S.J.; Andreana, M.; Lanteigne, E.; Ridsdale, A.; Stolow, A.; Schweitzer, M.E. Pre-clinical translation of second harmonic microscopy of meniscal and articular cartilage using a prototype nonlinear microendoscope. Med. Imaging Diagn. Radiol. 2019, 7, 1800211. [Google Scholar] [CrossRef]
- Chen, X.; Sanchez, G.N.; Schnitzer, M.J.; Delp, S.L. Microendoscopy detects altered muscular contractile dynamics in a mouse model of amyotrophic lateral sclerosis. Sci. Rep. 2020, 10, 457. [Google Scholar] [CrossRef] [PubMed] [Green Version]
- Hooper, S.C.; Kuppe, C.; Wang, D.; Wang, W.; Guan, J.; Odom, T.W.; Valev, V.K. Second harmonic spectroscopy of surface lattice resonances. Nano Lett. 2019, 19, 165–172. [Google Scholar] [CrossRef]
- Aharon, H.; Shavit, O.; Galanty, M.; Salomon, A. Second harmonic generation for moisture monitoring in dimethoxyethane at a gold-solvent interface using plasmonic structures. Nanomaterials 2019, 9, 1788. [Google Scholar] [CrossRef] [PubMed] [Green Version]
- Dmitriev, V.G.; Gurzadyan, G.G.; Nikogosyan, D.N. Handbook of Nonlinear Optical Crystals, 3rd ed.; Springer: Berlin/Heidelberg, Germany, 1999; pp. 5–66. [Google Scholar]
- Sutherland, R.L. Handbook of Nonliear Optics, 2nd ed.; CRC Press: Boca Raton, FL, USA, 2003; pp. 55–74. [Google Scholar]
- Zhu, H.; Wang, T.; Zheng, W.; Yuan, P.; Qian, L. Efficient second harmonic generation of femtosecond laser at 1 μm. Opt. Express 2004, 12, 2150–2155. [Google Scholar] [CrossRef] [PubMed]
Figure 1.
The phase-matching angle characteristic of MgO:LiNbO3 crystal.

Figure 2.
Principle of SHG angle sensor method with Fs laser.

Figure 3.
A schematic of the setup reducing the collimated beam width with a pair of plano-convex lenses.
Figure 3.
A schematic of the setup reducing the collimated beam width with a pair of plano-convex lenses.

Figure 4.
Experimental setup: (a) A schematic of the proposed angle sensor; (b) A photograph of the experimental setup.
Figure 4.
Experimental setup: (a) A schematic of the proposed angle sensor; (b) A photograph of the experimental setup.

Figure 5.
The initial beam profile of the Fs laser: (a) Light intensity distribution; (b) Cross-sectional profiles; (c) The change in the beam width as the increase in observation distance.
Figure 5.
The initial beam profile of the Fs laser: (a) Light intensity distribution; (b) Cross-sectional profiles; (c) The change in the beam width as the increase in observation distance.

Figure 6.
The comparison spectrum of initial Fs laser output and the Fs laser output after reduction in the beamwidth.
Figure 6.
The comparison spectrum of initial Fs laser output and the Fs laser output after reduction in the beamwidth.

Figure 7.
Calculation results of angle measurement based on the birefringence equation: (a) The contour graph of calculated SHG; (b) The measurement trend based on the peak of the calculated SHG; (c) The measurement trend in the most extended measurement range area; (d) The measurement trend in the least measurement range area.

Figure 8.
Calculated SHG spectrum in the split peak region.

Figure 9.
(a) The dynamics of phase mismatch for a certain angle: (b) The sinc2 function characteristic due to the dynamics of phase mismatch for a certain angle.
Figure 9.
(a) The dynamics of phase mismatch for a certain angle: (b) The sinc2 function characteristic due to the dynamics of phase mismatch for a certain angle.

Figure 10.
The contour graphs of the observed spectrum: (a) FW of 30 mm; (b) SHG of 30 mm; (c) FW of 50 mm; (d) SHG of 50 mm; (e) FW of 70 mm; (f) SHG of 70 mm.
Figure 10.
The contour graphs of the observed spectrum: (a) FW of 30 mm; (b) SHG of 30 mm; (c) FW of 50 mm; (d) SHG of 50 mm; (e) FW of 70 mm; (f) SHG of 70 mm.

Figure 11.
Angle measurement trend based on the peaks of SHG at several crystal positions: (a) 30 mm; (b) the most extended measurement area of 30 mm; (c) the middle range measurement area of 30 mm; (d) the least measurement area of 30 mm; (e) 50 mm; (f) the most extended measurement area of 50 mm; (g) the middle range measurement area of 50 mm; (h) the least measurement area of 30 mm; (i) 70 mm; (j) the most extended measurement area of 70 mm; (k) the middle range measurement area of 70 mm; (l) the least measurement area of 70 mm.

Figure 12.
The comparison spectrum of the split peak and single peak area.


Table 1.
The generated collimated laser beam.
| Profile Direction | Diameter | Angle of Dispersion |
|---|---|---|
| X | (921.83 ± 3.00) μm | 2.53 arc-seconds |
| Y | (948.70 ± 13.47) μm | 44.79 arc-seconds |
Table 2.
Angle measurement results in several crystal positions.
| Crystal Position mm | Peak Wavelength Range nm | Angle Range Arc-Second | Sensitivity nm/Arc-Second | Resolution Arc-Second |
|---|---|---|---|---|
| 30 | 765.44–802.88 | 13,328.38 | 0.00294 | 6.80 |
| 755.84–760.80 | 3506.75 | 0.00139 | 14.39 | |
| 747.04–751.04 | 2163.18 | 0.00185 | 10.81 | |
| 50 | 765.60–802.88 | 13,203.10 | 0.00294 | 6.80 |
| 756.32–761.12 | 3499.81 | 0.00142 | 14.08 | |
| 747.84–752.00 | 3245.53 | 0.00202 | 9.90 | |
| 70 | 765.44–803.20 | 13,339.97 | 0.00294 | 6.80 |
| 756.32–761.28 | 3382.52 | 0.00143 | 13.99 | |
| 746.40–751.36 | 2534.10 | 0.00223 | 8.97 |
Table 3.
Benchmarking against previous studies.
| Domain | Type of Laser Beam | Crystal | Angle Range Arc-Second | Sensitivity | Resolution Arc-Second |
|---|---|---|---|---|---|
| Time [15] | Focused | BBO | 1040 | 1.18 mV/arc-second | 0.36 |
| Frequency [16] | Focused | MgO:LiNbO3 | 10,752 | 0.00314 nm/arc-second | 3.00 |
| Frequency (in this study) | Collimated | MgO:LiNbO3 | 13,340 | 0.00294 nm/arc-second | 6.80 |
Publisher’s Note: MDPI stays neutral with regard to jurisdictional claims in published maps and institutional affiliations. |
© 2022 by the authors. Licensee MDPI, Basel, Switzerland. This article is an open access article distributed under the terms and conditions of the Creative Commons Attribution (CC BY) license (https://creativecommons.org/licenses/by/4.0/).
Share and Cite
MDPI and ACS Style
Astuti, W.D.; Li, K.; Sato, R.; Matsukuma, H.; Shimizu, Y.; Gao, W. A Second Harmonic Wave Angle Sensor with a Collimated Beam of Femtosecond Laser. Appl. Sci. 2022, 12, 5211. https://0-doi-org.brum.beds.ac.uk/10.3390/app12105211
AMA Style
Astuti WD, Li K, Sato R, Matsukuma H, Shimizu Y, Gao W. A Second Harmonic Wave Angle Sensor with a Collimated Beam of Femtosecond Laser. Applied Sciences. 2022; 12(10):5211. https://0-doi-org.brum.beds.ac.uk/10.3390/app12105211
Chicago/Turabian StyleAstuti, Wijayanti Dwi, Kuangyi Li, Ryo Sato, Hiraku Matsukuma, Yuki Shimizu, and Wei Gao. 2022. "A Second Harmonic Wave Angle Sensor with a Collimated Beam of Femtosecond Laser" Applied Sciences 12, no. 10: 5211. https://0-doi-org.brum.beds.ac.uk/10.3390/app12105211
Note that from the first issue of 2016, this journal uses article numbers instead of page numbers. See further details here.