
Assessment of Bioactive Surfactant Levels in Selected Cereal Products
by
 , and
, and
Magdalena Surma
1,* ,
,
Katarzyna Sznajder-Katarzyńska
1,
Wiesław Wiczkowski
2 and
Henryk Zieliński
2 1
Department of Plant Products Technology and Nutrition Hygiene, Faculty of Food Technology, University of Agriculture in Krakow, Balicka St. 122, 30-149 Krakow, Poland
2
Department of Chemistry and Biodynamics of Food, Institute of Animal Reproduction and Food Research, Polish Academy of Sciences, Tuwima St.10, 10-748 Olsztyn, Poland
*
Author to whom correspondence should be addressed.
Appl. Sci. 2022, 12(10), 5242; https://0-doi-org.brum.beds.ac.uk/10.3390/app12105242
Submission received: 4 May 2022
/
Revised: 20 May 2022
/
Accepted: 20 May 2022
/
Published: 22 May 2022
(This article belongs to the Special Issue Bioactive Potential of Plants)
Abstract
:Per- and polyfluoroalkyl substances (PFASs) are bioactive surfactants that are widespread in the environment and living organisms. This study presents measurements of PFAS in selected food of plant origin that are part of the healthy eating pyramid, including bread, rolls, flour, bran, buckwheat, millet, rice, and noodles. A simple and reliable analytical method was developed for the simultaneous determination of seven perfluorocarboxylic acids (PFCAs) and three perfluoroalkane sulfonates (PFSAs) in cereal-based products. Out of the 10 PFASs, 5 PFASs were detected at levels above LOQ. The most frequently detected compound was perfluorooctanoic acid (PFOA), which was quantified in 65.2% of samples, while none of the others were present in more than 40.0% of tested products. Perfluorobutanoic acid (PFBA) was the predominant PFAS in cereal-based products, and its maximum measured concentration was 202.85 ng/g for wheat bran. The soil–root–shoot interactions in relation to PFAS transfer to the above-ground parts of plants and PFAS’s ability to interfere with proteins are most likely the sources of these compounds in commonly consumed cereal products. As PFBA contributes greatly to total PFAS concentration, this food group should be included in future dietary exposure assessments.
1. Introduction
Perfluoroalkyl and polyfluoroalkyl substances (PFASs) are purely synthetic organic compounds that have been produced and used since the 1950s. In general, PFASs are aliphatic substances in which some or all hydrogen atoms have been replaced by fluorine atoms (polyfluorinated or perfluorinated, respectively) [1]. Their chemical structure makes them highly resistant to most methods of degradation, especially thermal, chemical, and microbial (biochemical) [2]. Thus, PFASs have been declared persistent organic pollutants (POPs). Due to their amphiphilic features, which result from the combination of PFAS molecules’ polar and non-polar structures, PFASs demonstrate low aqueous surface tension and the property of associating with both water and oil phases. As a result of their widespread use in household and industrial commodities, as well as their high persistence and good water solubility, PFASs are spread quickly through the environment, wildlife, and humans [3,4]. Many investigators confirmed that PFASs accumulate at different levels of the trophic web. Therefore, they may pose a significant risk both for plants that accumulate high PFAS concentrations and also for humans due to the dominant negative biological activity. Some scientific reports indicate the over-generation of reactive oxygen species (ROS) in plants upon PFAS exposure [5,6]. Thus, PFAS-contaminated plants may display hypersensitive symptoms at physiological, biochemical, and molecular levels, causing the loss of biomass, disorders of the cellular system, and metabolic anomalies [7]. These pollutants enter the human body and accumulate preferentially in the liver and lungs, but their presence has also been confirmed in the brain, bone, kidney, and serum [8,9]. Consumption of PFAS-contaminated agricultural products could perturb some life processes by their biological activities in human cells. PFASs’ toxicity is associated with a number of harmful health effects, including cancer and developmental and reproductive damage [10].
Cereals and cereal products are staple foods in the everyday human diet [11]. They consist of carbohydrates (75%) and protein (6–15%), thus providing a major proportion of dietary energy and nutrients [12]. Scientific findings indicate that the inclusion of cereals and their derivatives in the diet could supply folate, dietary fiber, proteins, B-group vitamins, and some minerals, such as iron, manganese, and zinc [13,14,15]. Moreover, the consumption of wholegrains is preferential as they are more beneficial and improve the quality of the diet. These nutrient-dense foods may be described as contributors to lipids, vitamin E, and other minerals (e.g., Ca, Mg, K, P Na) [16]. Currently, global consumption of cereals is projected to grow at 1.2% a year over the period under consideration in the OECD-FAO Agricultural Outlook 2021–2030 [17]. After fruits and vegetables, consumption of this group of foodstuffs was highest, which is in good agreement with the Pyramid of Healthy Nutrition and Physical Activity recommendations [18].
Globally, many PFASs have been found in a wide range of environmental and biological matrices, such as ambient air [19], soils and sediments [20], surface waters and groundwaters [21], wastewaters [22], and biota [23]. Therefore, these substances have been indicated in many edible plant species, including fruits and vegetables or agricultural crops [24,25,26,27]. The main sources of PFASs in the environment are considered to be industries that produce and use them [28], effluents from wastewater treatment plants (WWTPs) [29], sewage sludge used as a soil conditioner [30], leaches from landfills [31], waters close to fire-training locations and airports [32], and field irrigation with contaminated waters [33]. In general, organic substances may enter plant tissues via the roots and foliar uptake from soil/water and the atmosphere, respectively [34]. An octanol–water partitioning coefficient (Kow) was adopted to assess the equilibrium distribution of non-ionic organic contaminants between plant roots and external media [35]. For perfluoroalkyl acids (PFAAs), due to their hydrophobic and oleophobic nature and the presence of an ionogenic functional group that increases water solubility, the determined Kow coefficient is not appropriate for PFAS because it may be imprecise [32]. Nevertheless, log Kow of 1–4 may account for the increased uptake of PFAS [36]. A more comprehensive parameter used to compare different plant species with respect to their ability to accumulate PFAS could be the bioconcentration factor (BCF), which is commonly described as the ratio of analyte concentration in soil/substrate and a given plant tissue [37]. In general, as PFAS chain length increases, water solubility decreases [38]. Moreover, some PFASs with chain lengths C < 6 and C < 7 for PFSAs and PFCAs, respectively, are regarded as non-bioaccumulative and highly soluble, with reduced sorption tendency in solids which results in greater mobility in the environment [39,40]. Some studies indicate that PFASs’ affinity to phospholipids could play a significant role in plant tissue distribution [41]. The recent literature shows that there are wide variations in terms of PFASs’ accumulation abilities and their distribution patterns in plant tissues. Nevertheless, with respect to edible parts, protein and lipid contents play a major role in these variations [42].
To the best of our knowledge, the existing literature provides little information on the determination of PFAS levels in cereal-based products. Thus, the aim of the study was to investigate the presence of 10 PFASs (the PFCAs were perfluorobutanoic acid (PFBA), perfluoropentanoic acid (PFPeA), perfluorohexanoic acid (PFHxA), perfluoroheptanoic acid (PFHpA), perfluorooctanoic acid (PFOA), perfluorononanoic acid (PFNA) and perfluorodecanoic acid (PFDA); the PFSAs were perfluorobutane sulfonate (PFBS), perfluorohexane sulfonate (PFHxS) and perfluorooctane sulfonate (PFOS)) in various cereal products, such as flour, bran, bread and rolls, buckwheat, millet, rice, and noodle. The structures of the investigated analytes are shown in Figure S1 (Supplementary Materials). The broad scope of this study should help to indicate the range of PFAS contaminations, their levels, and the potential hazard to human health posed by a diet containing cereal-based products. Samples were treated by using a modified QuEChERS method with a dispersive solid-phase extraction step, after which they underwent chromatographic analysis (with a micro-HPLC-MS/MS system).
The results of this research constitute part of a project grant which covers the analysis of levels of perfluoroalkyl substances in food groups that form a healthy eating pyramid. Based on current and previous results, a model daily food intake may be calculated.
2. Materials and Methods
2.1. Reagents and Materials
MS grade chemicals (acetonitrile (MeCN), methanol (MeOH), water (H2O), and formic acid (FA)) were supplied by Sigma Chemical Co. (St. Louis, MO, USA). HPLC grade MeCN (for the extraction step) was purchased from Merck KGaA (Darmstadt, Germany). Magnesium sulfate anhydrous p.a. (MgSO4) and sodium chloride p.a. were obtained from POCh SA (Gliwice, Poland). The ENV (styrene-divinylbenzene) SPE Bulk Sorbent that was used for the clean-up process (d-SPE step) was sourced from Agilent Technologies (Santa Clara, CA, USA). A Milli-Q system derived from Millipore (Bedford, MA, USA) was applied for water purification. For sample pretreatment, a number of instruments, especially a crusher (Phillips, Warsaw, Poland), vortex mixer (IKA Poland, Warsaw, Poland), ultrasonic bath (POLSONIC, Warsaw, Poland), MPW-352R centrifuge (MPW Med. Instruments, Warsaw, Poland), and Vacuum Concentrator Plus (Eppendorf AG, Hamburg, Germany) were employed in this study.
A native standard mixture consisting of 10 PFASs (7 PFCAs: PFBA, PFPeA, PFHxA, PFHpA PFOA, PFNA, and PFDA; 3 PFSAs: PFBS, PFHxS, and PFOS) was supplied as 5 µg/mL methanolic solution with purity above 98% by Wellington Laboratories, Inc., (Guelph, ON, Canada). Perfluoro-n-[13C8] octanoic acid (L-PFOA) and sodium perfluoro-1-[13C8] octanesulfonate (L-PFOS), mass-labeled internal standards (IS), hereinafter referred to as IS1 and IS2, respectively, were also purchased from Wellington Laboratories, Inc., (Guelph, ON, Canada). A total of 1.2 mL of each standard was supplied as a methanolic solution (purity above 98%) with a concentration of 49 µg/mL and 50 µg/mL for IS1 and IS2, respectively. The intermediate and working-standard solutions of native PFASs were prepared in an 80:20 (v:v) water/methanol mixture with 1% (v:v) of FA addition at a concentration of 100 ng/mL and 1 ng/mL, respectively. Internal standard solutions were prepared in line with the abovementioned procedure.
2.2. Sample Collection
In this study, a total of 89 food samples containing cereals and cereal products that are commonly available on the Polish market were examined. Samples were purchased locally in 2017 in different types of stores. Different types of foodstuffs, such as flour (wheat and rye), bran (wheat and rye), bread (boltona type and wholemeal type), rolls (wheat and graham), buckwheat (unroasted and roasted), millet, rice (white and brown), and pasta/noodles (plain and durum) were included in the trial. All of them were carefully selected from the entire range available in shops. Products were stored in accordance with their recommended storage conditions and analyzed before the end of the expiry date on the packaging. Ten grams of each representative sample was collected, except for bran, for which five grams of sample was taken for analysis. Each sample was examined in triplicate.
2.3. Sample Preparation
In the solid sampling analysis, a modified QuEChERS method with dispersive Solid Phase Extraction (d-SPE) was used according to a previously described method [22]. Micro-high-performance liquid chromatography–tandem mass spectrometry (micro-HPLC-MS/MS) was applied for the simultaneous determination of 10 PFASs. This procedure, which was the same for samples and for sample blanks, consisted of the following steps: (1) All the samples, except flour, were ground; (2) An amount of 5g (for bran) or 10 g (for the other products) of sample was accurately weighed into a 50 mL polypropylene (PP) centrifuge tube; (3) The samples were fortified with 10 µL of IS1 and IS2 solutions, both with a concentration of 2.5 µg/mL; (4) An amount of 10 mL of deionized water and then 10 mL of extraction solvent (MeCN with 150 µL of FA) was added; (5) The tubes were placed in an ultrasonic bath for 2.5 min and then mixed vigorously for 1 min (using a vortex mixer); (6) An amount of 4 g MgSO4 and 1 g NaCl were added to each tube, and the mixture was immediately vortex-mixed for 1 min; (7) The mixture was centrifuged for 15 min at 8700 RCF and 4 °C; (8) An amount of 6 mL of MeCN extract was transferred to a 15 mL PP centrifuge tube containing 0.15 g ENV SPE Bulk Sorbent and 0.90 g MgSO4; (9) The mixture was vortexed immediately for 30 sec; (10) The tubes were centrifuged (5 min, 5000 RCF and 4 °C) for phase separation; (11) An amount of 4 mL of supernatant was put into round-bottom tubes just after passing through a paper filter with 12–15 µm pore size (MUNKTELL-FILTRAK, Germany); (12) The tubes containing extract were put into vacuum concentration, where they were evaporated to dryness at a temperature of 40 °C; (13) The residue was reconstituted with 1 mL of MeOH and diluted fivefold with deionized water with 1% (v/v) of FA addition; (14) Finally, each sample was injected into the micro-HPLC-MS/MS. All samples were prepared in triplicate.
For the construction of calibration curves, wheat flour was used as a blank sample extract. A series of standard solutions at concentrations ranging from 0.01 to 20 ng/mL were prepared to create a matrix-matched calibration curve in accordance with EU recommendations (2010/161/EU) [43]. To each standard solution, 10 μL of L-PFOA and L-PFOS (concentration of both: 2.5 μg/mL) was added. Blank samples were prepared in parallel in MeCN.
Due to the lack of suitable certified reference materials for laboratories analyzing PFAS in cereal products and related foods, the recovery ratio of the analyzed compounds was investigated. Recovery studies involved spiking the samples of wheat flour with the standard solution of PFAS to a fortification level of 5 ng/g.
2.4. Instrumental Analysis
PFASs were analyzed by micro-high-performance liquid chromatography–tandem mass spectrometry (micro-HPLC-MS/MS). Chromatographic separation was performed on an Eksigent LC200 System (AB SCIEX, Concord, ON, Canada) equipped with a column oven containing a HALO C18 analytical column with dimensions of 50 mm × 0.5 mm and 2.7 µm particle diameter (Eksigent, Concord, ON, Canada). The temperatures of the column oven and the autosampler were kept at a constant 45 °C and 4 °C, respectively. The mobile phases were A) water with 0.1% (v/v) of FA, and B) MeCN with 0.1% (v/v) of FA at a flow rate of 20 µL/min. The gradient elution changed according to the following conditions: we started with a 0.5 min isocratic step at 40% of solvent B; this was ramped up to 90% over 2.5 min, held at 90% for 1 min, then ramped down to 40% over 0.2 min; finally, it was held at 40% for 0.8 min. Quantifications of PFASs were carried out using a QTRAP 5500 (AB SCIEX, Concord, Canada). The negative ESI mode was chosen due to the better signal-to-noise ratio. Multiple reaction monitoring (MRM) mode was employed in the experiment. The retention times and MRM ion pairs of analyzed PFAS are summarized in Table S1 (Supplementary Materials). The parameters of the instrumental analysis were as follows: curtain and collision gas flow were 25 L/min and 9 L/min, respectively; ionspray voltage was −4500 V; the temperature was set to 350 °C; 1 ion source and 2 ion source gas flow was 30 L/min and 35 L/min, respectively; declustering potential ranged from −30 to −85 V; entrance potential was −10 V; collision energy ranged between −10 and −65 eV; and the collision cell exit potential range was from −10 to −38 V [44]. The analytical data were recorded using Analyst Software (AB SCIEX, Concord, ON, Canada) (version 1.5.2).
2.5. Statistical Analysis
All statistical tests were performed with Statistica 12.0 software (StatSoft Inc., Tulsa, OK, USA). The normal distribution of variances was checked using the Shapiro–Wilk test. Levene’s test was used to examine the normality of variances. Subsequently, the Kruskal–Wallis H non-parametric test was performed to test for statistically significant differences between variables. The significance level was set at p < 0.05. Additionally, hierarchical cluster analysis (HCA) was conducted.
3. Results
3.1. Validation and Quality Control
The PFAS determination method was tested in terms of its recovery, repeatability, linearity, sensitivity, the limit of detection (LOD), and limit of quantification (LOQ), according to the general requirements set out in ISO standard 17025.
The accuracy of the method was verified by recovery studies by spiking the test sample of wheat flour with the standard solution mixture. PFAS native standard mixture (100 ng/mL) was inserted into the sample at a volume of 62.5 μL to obtain a fortification level of 5 ng/g. The recovery value was determined based on the following equation (Equation (1)):
where:
R = (c/c0) × 100%
- c—mean analyte concentration in the reference material;
- c0—nominal concentration of the analyte in the reference material [45].
The recovery values were in good agreement with Commission Recommendation 2010/161/EU on the monitoring of perfluoroalkyl substances in food (of 70–120%); it varied from 87% for PFBA to 102% for PFOA. The repeatability was assessed to be below 10% for all analytes. The linearity of the method was tested by designating the equations of the calibration curves (y = ax + b) and computing the corresponding coefficient of determination (R2) for all analyzed PFAS in the concentration range from 0.01 to 20 ng/mL. The calibration slope coefficient (a) was a determinant of the sensitivity of the method. The highest sensitivity was calculated for PFHS (7.786); the lowest was for PFDA (0.965).
The limit of detection (LOD) was calculated as three times higher than the level of noise using the qualifier ion, and the limit of quantification (LOQ) was equal to ten times the noise level. The level of noise was measured from the chromatograms obtained for the standard solutions with the lowest concentration, i.e., 0.01 ng/mL. The LOQ for the used method was calculated as the signal-to-noise ratio, which ranged from 0.043 ng/g for PFHS to 0.072 ng/g for PFHxA. The results correspond well with the value specified in Commission Recommendation 2010/161/EU (1 μg/kg).
The calibration curves were constructed by plotting the ratio of the peak areas of particular analytes, divided by the peak area of the L-PFOA (for PFCA) and L-PFOS (for PFSA) against the concentrations of the analytes. The analyte signal from the blank matrix was subtracted from the corresponding analyte signal from the fortified samples.
Table 1 summarizes the obtained results and contains the recovery values, limits of detection (LODs), limits of quantification (LOQs), coefficients of determination (R2), and calibration slopes (a) determined for PFAS.
3.2. Analysis of Real Samples
In order to improve the transparency of the data and provide a better demonstration of the results, the analyzed food items were divided into three subgroups. Thus, three separate tables were prepared: Table 2—flours and brans; Table 3—noodles, rices, and groats; Table 4—bread and rolls (baked cereal-based products). The presence of 10 PFASs was examined in this study. Only five of them were found in concentrations above LOQ, namely PFBA, PFPeA, PFHxA, PFOA, and PFOS. PFOA was indicated as the most frequently detected perfluoroalkyl substance during the experiment. PFOA was detected (at a level above LOQ) in 65.2% of samples, followed by PFBA (39.3%), PFHxA (21.3%), PFOS (14.6%), and PFPeA (11.2%). In the group of flours and brans, only PFBA was found at levels above LOQ at the concentration range of 0.88 to 202.85 ng/g for wheat flour and wheat brans, respectively. The presence of four of the five detected compounds (PFBA, PFPeA, PFOA, and PFOS) was confirmed in the subgroup of noodles, rices, and groats (PFHxA levels were below LOQ for all samples). In the case of baked cereal products, PFOA and PFHxA were found at detectable levels. PFOA was identified in all the analyzed samples, but PFHxA was detected only in bread samples.
In the group of PFCAs, PFBA was the compound with the highest individual measured concentrations, which reached the level of 202.85 ng/g ww for wheat bran. The highest mean concentrations of PFBA were found in wheat bran, rye bran, and rye flour and were estimated to be 119.68, 63.31, and 20.05 ng/g, respectively. Despite the fact that PFOA was the most abundant compound, its concentration was not higher than 0.430 ng/g. PFPeA and PFHxA were found more rarely. PFHxA was detected only in bread samples within the concentration range of <LOQ–0.44 ng/g, while PFPeA was found in white rice and millet groats at concentrations not exceeding 0.34 ng/g. In the family of PFSAs, only PFOS was detected at levels above the LOQ value. This compound was detected in both types of noodles, white rice, and millet groats. Its concentrations ranged from <LOQ to 8.39 ng/g for millet groats. The major contributor to the total PFCA concentration in the investigated cereal-based foods was PFBA (99.1%); the proportions of the other compounds did not exceed 0.7% (PFOA).
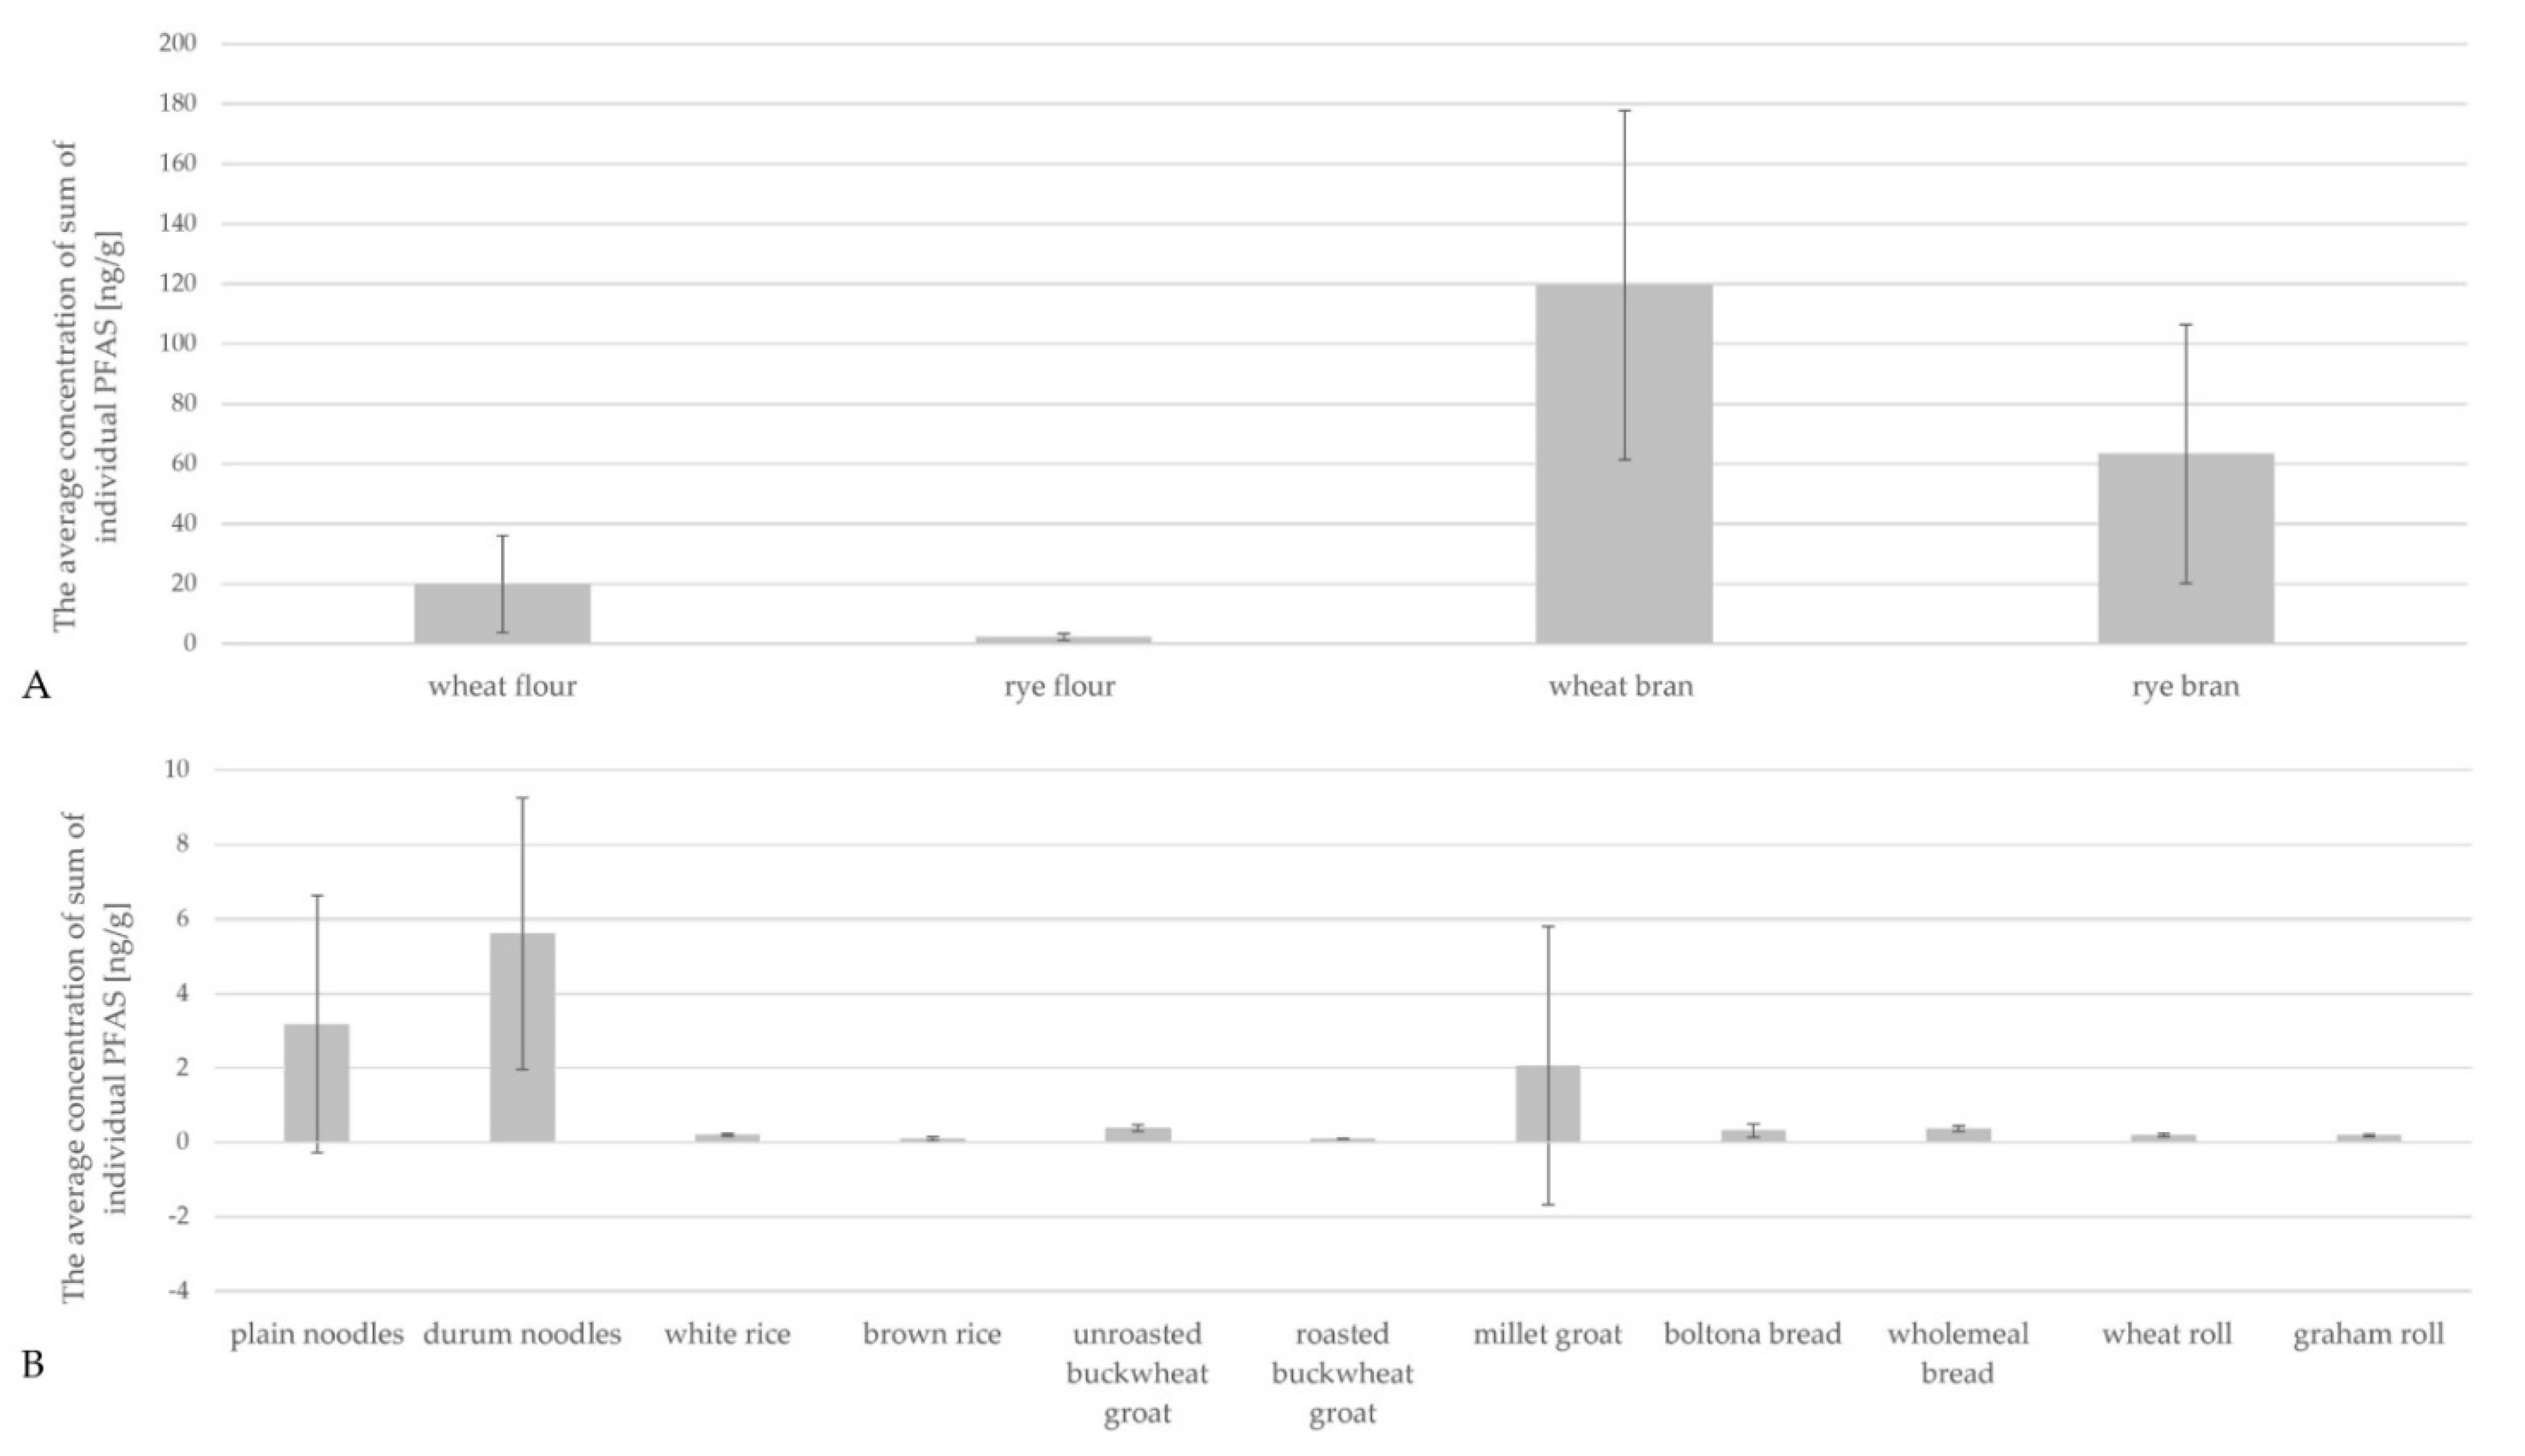
The average concentrations of the sum of individual PFASs are displayed in Figure 1. The highest average concentrations were observed for wheat and rye bran; these concentrations resulted only from the presence of PFBA in the analyzed samples. For samples for which more than one PFAS was determined at levels above LOQ, the highest average concentrations were calculated for plain noodles (3.17 ng/g), durum noodles (5.60 ng/g), and millet groats (2.07 ng/g).
The Kruskal–Wallis H non-parametric test was conducted to determine whether there were any differences among the analyzed groups for each of the 10 variables. The results of the Kruskal–Wallis H non-parametric test for detected variables are depicted in Figure S2 (Supplementary Materials). The Kruskal–Wallis H test (H(14, 89) = 87.19836, p < 0.05) performed for PFBA was statistically significant, and multiple comparison tests showed significant differences between the investigated groups. Significant differences were confirmed between wheat bran and, successively, wholemeal (p = 0.0037) and boltona bread (p = 0.0037), wheat (p = 0.0052) and graham roll (p = 0.0361), white (p = 0.0361) and brown (p = 0.0361) rice, roasted buckwheat groats (p = 0.0361), and millet groats (p = 0.0361). For rye bran, statistically significant differences were determined between both types of bread (wholemeal and boltona at p = 0.0116) and wheat roll (p = 0.0155). Moreover, there were significant differences between rye flour and both wholemeal and boltona bread, both with a p level equal to 0.0492. For PFHxA, the statistical test was also significant (H(14, 89) = 80.86452, p < 0.05), and significant differences were revealed between wheat roll and two types of analyzed bread (wholemeal (p = 0.0327), boltona (p = 0.0458)). Moreover, as demonstrated on the basis of the Kruskal–Wallis test (H(14, 89) = 76.29295, p < 0.05), statistically significant differences in PFOA concentrations were observed between wholemeal bread samples and, successively, wheat noodle (p = 0.0044), unroasted buckwheat (p = 0.0004), wheat (p = 0.0004) and rye bran (p = 0.0004), and wheat (p = 0.0004) and rye flour (p = 0.0004). No significant differences were found for the other variables.
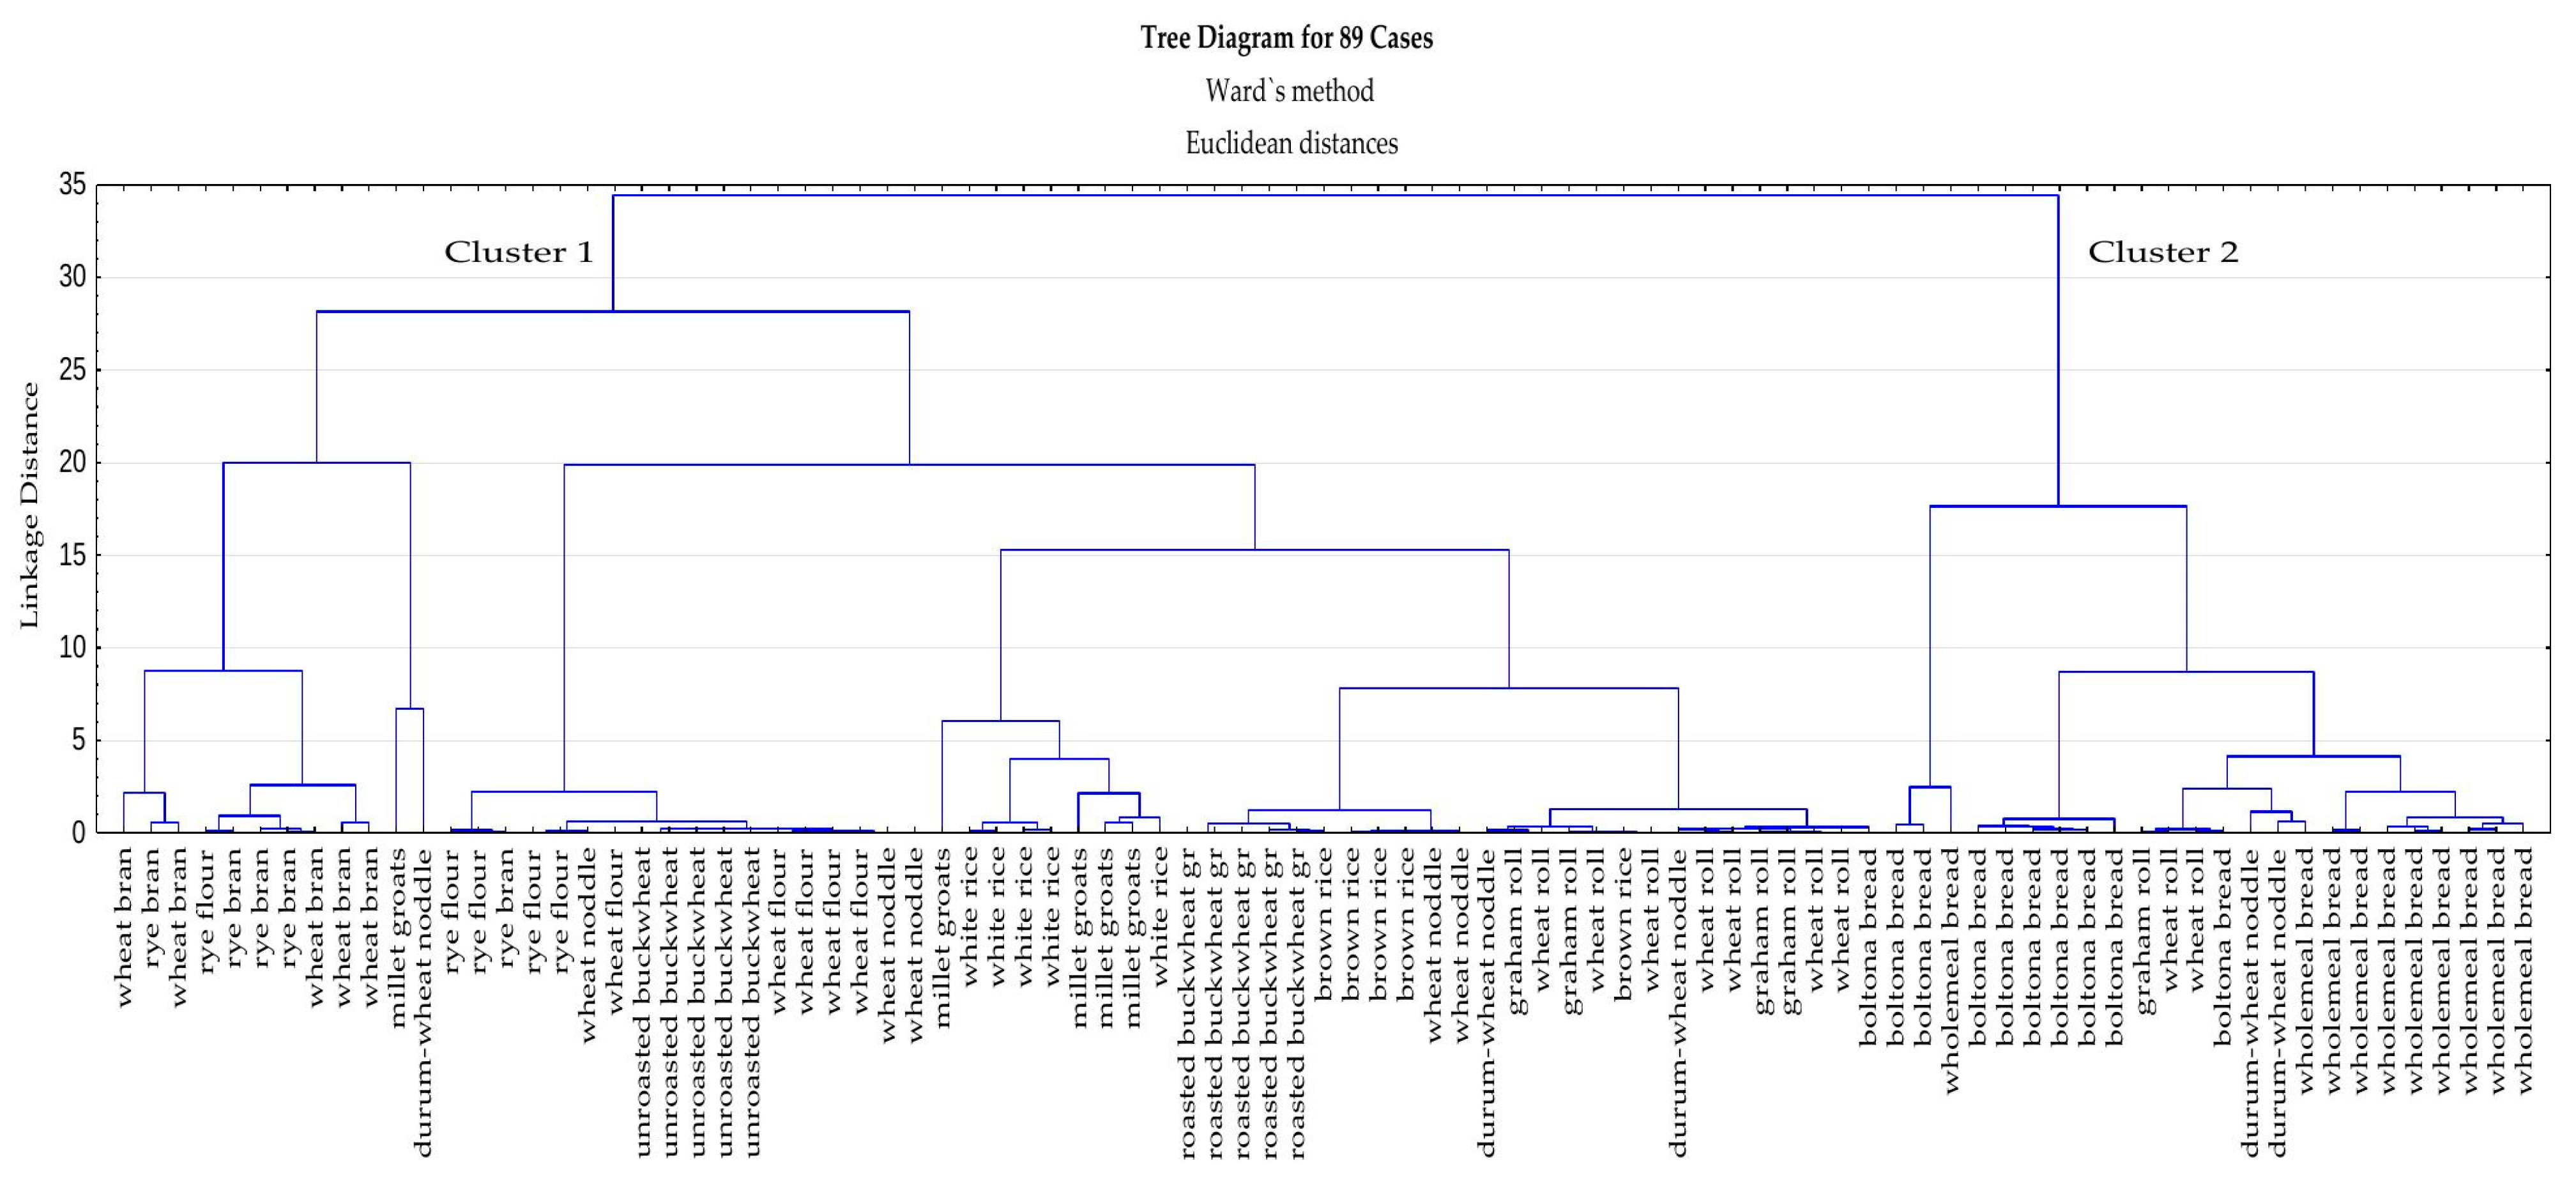
Hierarchical cluster analysis (HCA) was used to evaluate the relative proportions of PFAS concentrations in cereal-based products and to identify groups of samples that share similar concentration compositions. The HCA based on Euclidean distance and the Ward linkage algorithm was applied to cluster cereal product quality data. The results of cluster analysis are shown in Figure 2. Based on the visual observation of the dendrogram, cereal product samples may be classified into two groups, representing high homogeneity within the clusters and high heterogeneity between the clusters. Group 1 is represented by 65 products and contributes 63% of analyzed samples, while group 2 accounts only for 27% of analyzed samples (24 products). The mean concentrations of individual PFAS assessed for each cluster are summarized in Table 5. In respect of cluster 2, cluster 1 is characterized by higher mean PFBA and PFOS concentrations, which are 16.21 ng/g and 0.25 ng/g, respectively. In the case of cluster 2, only PFOA and PFHxA had higher mean concentrations, but their values did not exceed the level of 0.25 ng/g calculated for PFOA. In general, products included in cluster 1 are more contaminated than those belonging to cluster 2, especially in terms of PFBA contamination. Table S2 (Supplementary Materials) shows the classification of analyzed products to a given cluster/group.
3.3. Discussion
Extensive research on PFASs has highlighted their global distribution in environmental matrices and confirmed their impact on ecosystems and human health. Differences in the accumulation levels of PFAS in plants may depend on a number of factors. It is worth emphasizing the importance of environmental factors, such as emissions from industry, fertilization of soils with biosolids, quality of water used for irrigation, or application of pesticides. Moreover, compounds’ physicochemical properties, such as carbon chain length, type of functional group, mobility related to water solubility, and sorption tendency, are significant. Additionally, the water transpiration rate from plant compartments and the protein and/or lipid content of plant tissues should not be neglected.
Although the available literature is rather focused on PFAS analysis of raw crops such as wheat, maize, or oat, an additional search of existing publications was carried out to determine whether anything similar has been conducted previously. Unfortunately, this review of the literature concerning contamination of cereal-based products by PFAS did not provide much information. For this reason, some works related to cereals were reviewed to conduct an objective discussion. The uptake of PFAS from the environment into plant tissues and its transport within plant structures is mainly related to protein and lipid content due to the amphiphilic properties of these compounds [46,47]. As cereals contain about 6–15% protein [11], the scientifically proven high affinity of PFAS to proteins may contribute to their accumulation in this kind of food. Wen et al.’s study showed that tissue distribution of PFAS in plants was correlated with the protein transport process (root-to-shoot translocation) for both PFOA and PFOS [48]. This could be the result of an interaction between PFAS and fatty acid-binding proteins found in plants [49], as well as PFAS’s strong association potential with soy peptone (plant protein) [50]. Thus, root uptake and the interaction with proteins may play a major role in PFAS accumulation in plant compartments [51]. Moreover, the diversity in translocation or uptake pathways of PFAS by different crop species may be due to the variability of the climatic parameters (specific to their cultivation) that affect the amount of water transpired from plants during growth [52]. As summarized in Table 2, there are considerable differences between the PFBA levels in the analyzed products. The mean concentration of PFBA calculated for wheat flour is ten times lower than that of rye flour, but PFBA levels identified for wheat bran are twice the level of those for rye bran. This might be caused by different water transpiration processes due to the blade construction of wheat and rye. Krippner et al. confirmed that PFAS accumulation rates in plant tissues are linked to chain length; these rates decrease as the number of carbon atoms in PFAS chains increases [53]. Moreover, Krippner’s research showed that PFCAs have greater accumulation rates than PFSAs. The recent literature highlighted the relevance of the bioconcentration factor (BCF) with regard to plants’ ability to accumulate pollutants [33]. PFBA has the highest BCF of the considered analytes, which may indicate the background of high PFBA concentrations in cereal-based products. Recently published data supported these conclusions. Liu et al.’s work reported that PFBA, on average, contributed 56.5% of the total PFAS concentrations in edible crops [54]. The presence of PFBA and other perfluoroalkyls in cereal products may also be explained by the additional processing required to obtain a product intended for human consumption, as well as the migration of PFAS from packaging materials. Nevertheless, PFAS levels, except PFBA, do not seem to be of concern. PFOA was the most frequently detected compound among the five PFASs, but its concentration did not exceed 0.430 ng/g. Similar maximum levels were obtained for both PFPeA and PFHxA (0.339 ng/g and 0.440 ng/g, respectively). The maximum concentration of PFOS reached the level of 8.39 ng/g, but its detection frequency was lower than 15%. This may be due to the fact that the transfer of PFAS into reproductive and storage organs is comparatively low, as evidenced by some recent studies [54,55,56], all of which reported that PFASs have a tendency to concentrate more in the vegetative compartments of plants than in the storage organs. Wen et al. examined the associations between PFAS concentrations in wheat grains with respect to PFAS concentration in the soils where plants were grown [26]. The results obtained by Wen et al. led to the conclusion that PFAS concentration increases with increasing soil contamination. Moreover, bioaccumulation in storage organs did not only occur for C4–C7 perfluoroalkyls but also for longer-chain PFASs (≥C8). The highest increase in the concentration was recorded for PFPeA and PFBA, and it decreased as carbon chain length increased. These conclusions correspond well with our study.
A healthy human diet should mainly include the following: fruit and vegetables, legumes (e.g., lentils and beans), nuts, and whole grains (e.g., unprocessed maize, millet, oats, wheat, and brown rice). Thus, grains and grain products are a necessary part of any healthy diet. Worldwide, cereals account for approximately 50% of plant production. In accordance with OECD-FAO Agricultural Outlook 2021–2030, global cereal production has been increasing in recent years and is projected to increase even more by 2027 [17]. The same trend can be observed for levels of cereal consumption, and demand might surpass supply in this regard [57]. Crop production growth was also observed in Poland over the years 2010–2019 [58]. In the same period, cereal grain consumption in terms of processed products decreased from 108 kg per capita per year in 2010 to 101 kg per capita per year in 2019. Table 6 summarizes the average monthly consumption of selected foodstuffs in households. In most cases (except for pasta, pasta products, groats, and flakes), the consumption level trend is descending.
This was the first cross-sectional study covering such a wide range of cereal-based food items. The reported burden of PFAS in cereal products was not very high. Of the ten investigated PFASs, only five were found at detectable levels, but, with the exception of PFBA, these levels were relatively low. Nevertheless, due to the existing TWI (tolerable week intake) levels of PFOA and PFOS, which are currently set at 6 ng/kg bw/week and 13 ng/kg bw/week [59], respectively, even small amounts could pose a threat to public health. Contaminated crops could contribute to human exposure to PFAS through direct ingestion in the form of cereal-based products. Bioconcentration and bioaccumulation of these compounds may lead to an increase in body burden, which may cause toxic effects. Indicating the specific sources of contamination of cereal-based products is not possible due to the substantial variability of the factors that influence PFAS contamination levels (aerial deposition, uptake from crops via soil or water, processing, packaging, and food preparation). Regarding the existing European TWI standards, as well as the results of the current study, PFAS levels, especially PFBA, should be subject to monitoring and evaluation in order to improve knowledge regarding their further environmental dissemination.
4. Conclusions
This paper is the first cross-sectional study on the occurrence of ten perfluoroalkyl substances in widely available and consumed cereal-based products such as bread, rolls, flour, bran, buckwheat, millet, rice, and noodle. The QuEChERS method with a d-SPE purification step followed by LC–MS/MS detection was successfully applied. Throughout the trial, PFOA proved to be the most abundant compound, but individual PFBA concentrations were the highest. Five PFASs (PFBA, PFPeA, PFHxA, PFOA, and PFOS) were detected in cereal-based products, indicating that plants have the ability to take up PFAS from soils via the root system and translocate PFAS to the above-ground parts. One mechanism that is possibly responsible for the accumulation of PFAS in plant compartments, especially in protein-rich grains, is the interaction of these compounds with proteins. The preferential accumulation of C4–C7 homologs characterized by higher BAF was observed. PFAS are found in air, water, soil, vegetation, and livestock, and thus can also be found in food products if not properly regulated and managed. In terms of PFAS contamination of food items, the top quality of products should be maintained by very strict control conducted over the production process, starting with seed selection, field monitoring, processing, and final packaging. Except for PFBA, the indicated PFAS concentrations were relatively low; nevertheless, with regards to the existing TWI standards laid down by EFSA and the high level of consumption of cereal products, it is important to implement further investigations to control PFAS distribution and evaluate the environmental risks. In the future, food manufacturers should perhaps consider periodic testing of food ingredients that may be potentially contaminated with PFAS and investigate possible sources of these contaminants.
Supplementary Materials
The following supporting information can be downloaded at https://0-www-mdpi-com.brum.beds.ac.uk/article/10.3390/app12105242/s1: Figure S1: The structures of the investigated analytes; Figure S2: The results of the Kruskal–Wallis H non-parametric test for detected variables (PFBA, PFPeA, PFHxA, PFOA, and PFOS); Table S1: Retention times and MRM ion pairs of analyzed PFAS; Table S2: Clustering of samples using hierarchical sample clustering analysis.
Author Contributions
Conceptualization, M.S. and K.S.-K.; methodology, M.S. and K.S.-K.; software, W.W.; validation, K.S.-K.; formal analysis, K.S.-K. and W.W.; investigation, M.S. and K.S.-K.; resources, K.S.-K.; data curation, M.S.; writing—original draft preparation, K.S.-K.; writing—review and editing, M.S. and H.Z.; visualization, K.S.-K.; supervision, M.S. and H.Z.; project administration, M.S.; funding acquisition, M.S. All authors have read and agreed to the published version of the manuscript.
Funding
This work was supported by project grants No. 2015/17/B/NZ9/01623 from the National Science Center, Poland.
Institutional Review Board Statement
Not applicable.
Informed Consent Statement
Not applicable.
Data Availability Statement
Not applicable.
Acknowledgments
This article is part of the Ph.D. Thesis of Katarzyna Sznajder-Katarzyńska.
Conflicts of Interest
The authors declare no conflict of interest.
References
- Buck, R.C.; Franklin, J.; Berger, U.; Conder, J.M.; Cousins, I.T.; de Voogt, P.; Jensen, A.A.; Kannan, K.; Mabury, S.A.; van Leeuwen, S.P. Perfluoroalkyl and polyfluoroalkyl substances in the environment: Terminology, classification, and origins. Integr. Environ. Assess. Manag. 2011, 7, 513–541. [Google Scholar] [CrossRef] [PubMed]
- Krafft, M.P.; Riess, J.G. Selected physicochemical aspects of poly- and perfluoroalkylated substances relevant to performance, environment and sustainability-Part one. Chemosphere 2015, 129, 4–19. [Google Scholar] [CrossRef] [PubMed]
- Wang, Z.; Cousins, I.T.; Scheringer, M.; Buck, R.C.; Hungerbühler, K. Global emission inventories for C4–C14 perfluoroalkyl carboxylic acid (PFCA) homologues from 1951 to 2030, Part I: Production and emissions from quantifiable sources. Environ. Int. 2014, 70, 62–75. [Google Scholar] [CrossRef] [PubMed]
- Zareitalabad, P.; Siemens, J.; Hamer, M.; Amelung, W. Perfluorooctanoic acid (PFOA) and perfluorooctanesulfonic acid (PFOS) in surface waters, sediments, soils and wastewater—A review on concentrations and distribution coefficients. Chemosphere 2013, 91, 725–732. [Google Scholar] [CrossRef] [PubMed]
- European Food Safety Authority. Perfluorooctane sulfonate (PFOS), Perfluorooctanoic Acid (PFOA) and Their Salts. Scientific Opinion of the Panel on Contaminants in the Food Chain. EFSA J. 2008, 653, 1–131. [Google Scholar] [CrossRef]
- Pérez, F.; Nadal, M.; Navarro-Ortega, A.; Fàbrega, F.; Domingo, J.L.; Barceló, D.; Farré, M. Accumulation of perfluoroalkyl substances in human tissues. Environ. Int. 2013, 59, 354–362. [Google Scholar] [CrossRef]
- Sunderland, E.M.; Hu, X.C.; Dassuncao, C.; Tokranov, A.K.; Wagner, C.C.; Allen, J.G. A review of the pathways of human exposure to poly- and perfluoroalkyl substances (PFASs) and present understanding of health effects. J. Expo. Sci. Environ. Epidemiol. 2019, 29, 131–147. [Google Scholar] [CrossRef] [Green Version]
- McKevith, B. Nutritional aspects of cereals. Nutr. Bull. 2004, 29, 111–142. [Google Scholar] [CrossRef]
- Food and Agriculture Organization of the United Nations; World Health Organization. Diet, Nutrition and the Prevention of Chronic Diseases. Report of a Joint WHO/FAO Expert Consultation. WHO Technol. Rep. Ser. 2003, 916, 1–200. [Google Scholar]
- Food and Agriculture Organization of the United Nations. FAMILY NUTRITION GUIDE by Ann Burges FAO Consultant with Peter Glasauer FAO Food and Nutrition Division. 2004. Available online: https://www.fao.org/3/y5740e/y5740e00.htm (accessed on 11 November 2021).
- Papanikolaou, Y.; Fulgoni, V. Certain Grain Foods Can Be Meaningful Contributors to Nutrient Density in the Diets of U.S. Children and Adolescents: Data from the National Health and Nutrition Examination Survey, 2009–2012. Nutrients 2017, 9, 160. [Google Scholar] [CrossRef]
- Rubio, C.; Gutiérrez, Á.J.; Revert, C.; Reguera, J.I.; Burgos, A.; Hardisson, A. Daily dietary intake of iron, copper, zinc and manganese in a Spanish population. Int. J. Food Sci. Nutr. 2009, 60, 590–600. [Google Scholar] [CrossRef] [PubMed]
- Jacobs, D.R.; Andersen, L.F.; Blomhoff, R. Whole-grain consumption is associated with a reduced risk of noncardiovascular, noncancer death attributed to inflammatory diseases in the Iowa Women’s Health Study. Am. J. Clin. Nutr. 2007, 85, 1606–1614. [Google Scholar] [CrossRef] [PubMed] [Green Version]
- Organisation for Economic Co-Operation Development; Food and Agricultural Organization of the United Nations. OECD-FAO Agricultural Outlook 2021–2030; OECD Publishing: Paris, France, 2021. [CrossRef]
- National Center for Nutrition Education. A Healthy Lifestyle Pyramid. National Food and Nutrition Institute 2016, Warsaw, Poland. Available online: https://ncez.pzh.gov.pl/abc-zywienia/piramida-zdrowego-zywienia-i-aktywnosci-fizycznej-dla-osob-doroslych/ (accessed on 11 November 2021).
- Liu, B.; Zhang, H.; Yao, D.; Li, J.; Xie, L.; Wang, X.; Wang, Y.; Liu, G.; Yang, B. Perfluorinated compounds (PFCs) in the atmosphere of Shenzhen, China: Spatial distribution, sources and health risk assessment. Chemosphere 2015, 138, 511–518. [Google Scholar] [CrossRef] [PubMed]
- Rankin, K.; Mabury, S.A.; Jenkins, T.M.; Washington, J.W. A North American and global survey of perfluoroalkyl substances in surface soils: Distribution patterns and mode of occurrence. Chemosphere 2016, 161, 333–341. [Google Scholar] [CrossRef]
- Banzhaf, S.; Filipovic, M.; Lewis, J.; Sparrenbom, C.J.; Barthel, R. A review of contamination of surface-, ground-, and drinking water in Sweden by perfluoroalkyl and polyfluoroalkyl substances (PFASs). Ambio 2017, 46, 335–346. [Google Scholar] [CrossRef] [Green Version]
- Stroski, K.M.; Luong, K.H.; Challis, J.K.; Chaves-Barquero, L.G.; Hanson, M.L.; Wong, C.S. Wastewater sources of per- and polyfluorinated alkyl substances (PFAS) and pharmaceuticals in four Canadian Arctic communities. Sci. Total Environ. 2020, 708, 134494. [Google Scholar] [CrossRef]
- Houde, M.; De Silva, A.O.; Muir, D.C.G.; Letcher, R.J. Monitoring of Perfluorinated Compounds in Aquatic Biota: An Updated Review: PFCs in Aquatic Biota. Environ. Sci. Technol. 2011, 45, 7962–7973. [Google Scholar] [CrossRef]
- Liu, Z.; Lu, Y.; Shi, Y.; Wang, P.; Jones, K.; Sweetman, A.J.; Johnson, A.C.; Zhang, M.; Zhou, Y.; Lu, X.; et al. Crop bioaccumulation and human exposure of perfluoroalkyl acids through multi-media transport from a mega fluorochemical industrial park. China Environ. Int. 2017, 106, 37–47. [Google Scholar] [CrossRef] [Green Version]
- Sznajder-Katarzyńska, K.; Surma, M.; Cieślik, E.; Wiczkowski, W. The perfluoroalkyl substances (PFASs) contamination of fruits and vegetables. Food Addit. Contam. Part A 2018, 35, 1776–1786. [Google Scholar] [CrossRef]
- Wen, B.; Li, L.; Zhang, H.; Ma, Y.; Shan, X.-Q.; Zhang, S. Field study on the uptake and translocation of perfluoroalkyl acids (PFAAs) by wheat (Triticum aestivum L.) grown in biosolids-amended soils. Environ. Pollut. 2014, 184, 547–554. [Google Scholar] [CrossRef]
- Zhang, M.; Wang, P.; Lu, Y.; Lu, X.; Zhang, A.; Liu, Z.; Zhang, Y.; Khan, K.; Sarvajayakesavalu, S. Bioaccumulation and human exposure of perfluoroalkyl acids (PFAAs) in vegetables from the largest vegetable production base of China. Environ. Int. 2020, 135, 105347. [Google Scholar] [CrossRef] [PubMed]
- Gredelj, A.; Nicoletto, C.; Polesello, S.; Ferrario, C.; Valsecchi, S.; Lava, R.; Barausse, A.; Zanon, F.; Palmeri, L.; Guidolin, L.; et al. Uptake and translocation of perfluoroalkyl acids (PFAAs) in hydroponically grown red chicory (Cichorium intybus L.): Growth and developmental toxicity, comparison with growth in soil and bioavailability implications. Sci. Total Environ. 2020, 720, 137333. [Google Scholar] [CrossRef] [PubMed]
- Lin, Q.; Zhou, C.; Chen, L.; Li, Y.; Huang, X.; Wang, S.; Qiu, R.; Tang, C. Accumulation and associated phytotoxicity of novel chlorinated polyfluorinated ether sulfonate in wheat seedlings. Chemosphere 2020, 249, 126447. [Google Scholar] [CrossRef] [PubMed]
- Li, J.; Sun, J.; Li, P. Exposure Routes, Bioaccumulation and Toxic Effects of per- and Polyfluoroalkyl Substances (PFASs) on Plants: A Critical Review. Environ. Int. 2022, 158, 106891. [Google Scholar] [CrossRef] [PubMed]
- Hu, X.C.; Andrews, D.Q.; Lindstrom, A.B.; Bruton, T.A.; Schaider, L.A.; Grandjean, P.; Lohmann, R.; Carignan, C.C.; Blum, A.; Balan, S.A.; et al. Detection of Poly- and Perfluoroalkyl Substances (PFASs) in U.S. Drinking Water Linked to Industrial Sites, Military Fire Training Areas, and Wastewater Treatment Plants. Environ. Sci. Technol. Lett. 2016, 3, 344–350. [Google Scholar] [CrossRef] [PubMed]
- Hamid, H.; Li, L. Role of wastewater treatment plant (WWTP) in environmental cycling of poly- and perfluoroalkyl (PFAS) compounds. Ecocycles 2016, 2, 43–53. [Google Scholar] [CrossRef]
- Sepulvado, J.G.; Blaine, A.C.; Hundal, L.S.; Higgins, C.P. Occurrence and Fate of Perfluorochemicals in Soil Following the Land Application of Municipal Biosolids. Environ. Sci. Technol. 2011, 45, 8106–8112. [Google Scholar] [CrossRef]
- Weber, R.; Watson, A.; Forter, M.; Oliaei, F. Review Article: Persistent organic pollutants and landfills—A review of past experiences and future challenges. Waste Manag. Res. 2011, 29, 107–121. [Google Scholar] [CrossRef]
- Ahrens, L. Polyfluoroalkyl compounds in the aquatic environment: A review of their occurrence and fate. J. Environ. Monit. 2011, 13, 20–31. [Google Scholar] [CrossRef]
- Ghisi, R.; Vamerali, T.; Manzetti, S. Accumulation of perfluorinated alkyl substances (PFAS) in agricultural plants: A review. Environ. Res. 2019, 169, 326–341. [Google Scholar] [CrossRef]
- Jiao, X.; Shi, Q.; Gan, J. Uptake, accumulation and metabolism of PFASs in plants and health perspectives: A critical review. Crit. Rev. Environ. Sci. Technol. 2021, 51, 2745–2776. [Google Scholar] [CrossRef]
- Briggs, G.G.; Bromilow, R.H.; Evans, A.A. Relationships between lipophilicity and root uptake and translocation of non-ionised chemicals by barley. Pestic. Sci. 1982, 13, 495–504. [Google Scholar] [CrossRef]
- Collins, C.; Fryer, M.; Grosso, A. Plant uptake of non ionic organic chemicals. Environ. Sci. Technol. 2006, 40, 45–52. [Google Scholar] [CrossRef] [PubMed]
- Zhao, H.; Guan, Y.; Qu, B. PFCA uptake and translocation in dominant wheat species (Triticum aestivum L.). Int. J. Phytoremediation 2018, 20, 68–74. [Google Scholar] [CrossRef]
- Bhhatarai, B.; Gramatica, P. Prediction of Aqueous Solubility, Vapor Pressure and Critical Micelle Concentration for Aquatic Partitioning of Perfluorinated Chemicals. Environ. Sci. Technol. 2011, 45, 8120–8128. [Google Scholar] [CrossRef]
- Wang, Z.; Cousins, I.T.; Scheringer, M.; Hungerbuehler, K. Hazard assessment of fluorinated alternatives to long-chain perfluoroalkyl acids (PFAAs) and their precursors: Status quo, ongoing challenges and possible solutions. Environ. Int. 2015, 75, 172–179. [Google Scholar] [CrossRef]
- Zhao, P.; Xia, X.; Dong, J.; Xia, N.; Jiang, X.; Li, Y.; Zhu, Y. Short- and long-chain perfluoroalkyl substances in the water, suspended particulate matter, and surface sediment of a turbid river. Sci. Total Environ. 2016, 568, 57–65. [Google Scholar] [CrossRef] [Green Version]
- Armitage, J.M.; Arnot, J.A.; Wania, F. Potential Role of Phospholipids in Determining the Internal Tissue Distribution of Perfluoroalkyl Acids in Biota. Environ. Sci. Technol. 2012, 46, 12285–12286. [Google Scholar] [CrossRef]
- Zhou, Y.; Zhou, Z.; Lian, Y.; Sun, X.; Wu, Y.; Qiao, L.; Wang, M. Source, transportation, bioaccumulation, distribution and food risk assessment of perfluorinated alkyl substances in vegetables: A review. Food Chem. 2021, 349, 129137. [Google Scholar] [CrossRef]
- European Commission. Commission Recommendation (2010/161/EU) of 17 March 2010 on the Monitoring of Perfluoroalkylated Substances in food. Off. J. Eur. Union 2010, L68, 22–23. [Google Scholar]
- Surma, M.; Gizejewski, Z.; Zieliński, H. Determination of perfluorinated sulfonate and perfluorinated acids in tissues of free-living European beaver (Castor fiber L.) by d-SPE/ micro-UHPLC-MS/MS. Ecotoxicol. Environ. Saf. 2015, 120, 436–444. [Google Scholar] [CrossRef] [PubMed]
- Konieczka, P.; Namieśnik, J.; Zygmunt, B.; Bulska, E.; Świtaj-Zawadka, A.; Naganowska, A.; Kremer, E.; Rompa, M. Niepewność. In Ocena i Kontrola Jakości Wyników Analitycznych, 1st ed.; Konieczka, P., Namieśnik, J., Eds.; PWN: Warsaw, Poland, 2004; Chapter 8.7. [Google Scholar]
- Yu, P.-F.; Xiang, L.; Li, X.-H.; Ding, Z.-R.; Mo, C.-H.; Li, Y.-W.; Li, H.; Cai, Q.-Y.; Zhou, D.-M.; Wong, M.-H. Cultivar-Dependent Accumulation and Translocation of Perfluorooctanesulfonate among Lettuce (Lactuca sativa L.) Cultivars Grown on Perfluorooctanesulfonate-Contaminated Soil. J. Agric. Food Chem. 2018, 66, 13096–13106. [Google Scholar] [CrossRef] [PubMed]
- Zhang, L.; Sun, H.; Wang, Q.; Chen, H.; Yao, Y.; Zhao, Z.; Alder, A.C. Uptake mechanisms of perfluoroalkyl acids with different carbon chain lengths (C2-C8) by wheat (Triticum acstivnm L.). Sci. Total Environ. 2019, 654, 19–27. [Google Scholar] [CrossRef] [PubMed]
- Wen, B.; Wu, Y.; Zhang, H.; Liu, Y.; Hu, X.; Huang, H.; Zhang, S. The roles of protein and lipid in the accumulation and distribution of perfluorooctane sulfonate (PFOS) and perfluorooctanoate (PFOA) in plants grown in biosolids-amended soils. Environ. Pollut. 2016, 216, 682–688. [Google Scholar] [CrossRef]
- Arondel, V.; Vergnolle, C.; Tchang, F.; Kader, J.C. Bifunctional lipid-transfer: Fatty acid-binding proteins in plants. Mol. Cell Biochem. 1990, 98, 49–56. [Google Scholar] [CrossRef]
- Xia, X.; Rabearisoa, A.H.; Jiang, X.; Dai, Z. Bioaccumulation of Perfluoroalkyl Substances by Daphnia magna in Water with Different Types and Concentrations of Protein. Environ. Sci. Technol. 2013, 47, 10955–10963. [Google Scholar] [CrossRef]
- Wang, W.; Rhodes, G.; Ge, J.; Yu, X.; Li, H. Uptake and accumulation of per- and polyfluoroalkyl substances in plants. Chemosphere 2020, 261, 127584. [Google Scholar] [CrossRef]
- Blaine, A.C.; Rich, C.D.; Sedlacko, E.M.; Hundal, L.S.; Kumar, K.; Lau, C.; Mills, M.A.; Harris, K.M.; Higgins, C.P. Perfluoroalkyl acid distribution in various plant compartments of edible crops grown in biosolids-amended soils. Environ. Sci. Technol. 2014, 48, 7858–7865. [Google Scholar] [CrossRef]
- Krippner, J.; Brunn, H.; Falk, S.; Georgii, S.; Schubert, S.; Stahl, T. Effects of chain length and pH on the uptake and distribution of perfluoroalkyl substances in maize (Zea mays). Chemosphere 2014, 94, 85–90. [Google Scholar] [CrossRef]
- Liu, Z.; Lu, Y.; Song, X.; Jones, K.; Sweetman, A.J.; Johnson, A.C.; Zhang, M.; Lu, X.; Su, C. Multiple crop bioaccumulation and human exposure of perfluoroalkyl substances around a mega fluorochemical industrial park, China: Implication for planting optimization and food safety. Environ. Int. 2019, 127, 671–684. [Google Scholar] [CrossRef]
- Blaine, A.C.; Rich, C.D.; Hundal, L.S.; Lau, C.; Mills, M.A.; Harris, K.M.; Higgins, C.P. Uptake of perfluoroalkyl acids into edible crops via land applied biosolids: Field and greenhouse studies. Environ. Sci. Technol. 2013, 47, 14062–14069. [Google Scholar] [CrossRef] [PubMed]
- Lesmeister, L.; Lange, F.T.; Breuer, J.; Biegel-Engler, A.; Giese, E.; Scheurer, M. Extending the knowledge about PFAS bioaccumulation factors for agricultural plants—A review. Sci. Total Environ. 2021, 766, 142640. [Google Scholar] [CrossRef] [PubMed]
- United States Department of Agriculture. Grain: World Markets and Trade. The USDA Foreign Agricultural Service, Global Market Analysis. 2021. Available online: https://usda.library.cornell.edu/concern/publications/zs25x844t?locale=en (accessed on 11 November 2021).
- Statistics Poland. Available online: https://stat.gov.pl/obszary-tematyczne/roczniki-statystyczne/roczniki-statystyczne/rocznik-statystyczny-rolnictwa-2021,6,15.html (accessed on 18 October 2021).
- European Food Safety Authority. Risk to human health related to the presence of perfluorooctane sulfonic acid and perfluorooctanoic acid in food. EFSA J. 2018, 16, 5194. [Google Scholar] [CrossRef]
Figure 1.
(A) The average concentration of the sum of individual PFASs in flours and brans; (B) The other analyzed products.
Figure 1.
(A) The average concentration of the sum of individual PFASs in flours and brans; (B) The other analyzed products.

Figure 2.
Dendrogram of cereal products data with hierarchical cluster analysis based on the Euclidean distance and the Ward linkage algorithm.
Figure 2.
Dendrogram of cereal products data with hierarchical cluster analysis based on the Euclidean distance and the Ward linkage algorithm.


Table 1.
Data of the quantification of determined PFAS.
| PFAS | a | R2 | LOD [ng/g] | LOQ [ng/g] | Recovery [%] |
|---|---|---|---|---|---|
| PFBA | 3.552 | 0.998 | 0.018 | 0.061 | 87 |
| PFPeA | 4.026 | 0.999 | 0.019 | 0.064 | 89 |
| PFHxA | 2.715 | 0.999 | 0.022 | 0.072 | 93 |
| PFHpA | 1.662 | 0.999 | 0.014 | 0.047 | 97 |
| PFOA | 2.506 | 0.999 | 0.016 | 0.052 | 102 |
| PFNA | 1.626 | 0.999 | 0.015 | 0.050 | 94 |
| PFDA | 0.965 | 0.999 | 0.018 | 0.061 | 89 |
| PFBS | 7.709 | 0.999 | 0.021 | 0.070 | 99 |
| PFHxS | 7.786 | 0.997 | 0.013 | 0.043 | 96 |
| PFOS | 2.940 | 0.999 | 0.017 | 0.057 | 94 |
Abbreviations: a—calibration slope; R2—coefficients of determination; LOD—limit of detection; LOQ—limit of quantification.
Table 2.
PFAS content in analyzed flour and bran samples.
| Content of PFAS [ng/g] | |||||
|---|---|---|---|---|---|
| Sample Number | Wheat Flour | Rye Flour | Wheat Bran | Rye Bran | |
| PFBA | 1 | 2.15 | 6.16 | 103.27 | 42.18 |
| 2 | 3.56 | 22.99 | 56.03 | 133.27 | |
| 3 | 0.88 | 5.93 | 84.18 | 17.80 | |
| 4 | 2.05 | 45.58 | 152.11 | 64.49 | |
| 5 | 3.31 | 19.61 | 202.85 | 58.82 | |
| range (mean ± SD) | 0.88–3.56 (2.39 ± 1.08) | 6.16–45.58 (20.05 ± 16.22) | 56.03–202.85 (119.68 ± 58.20) | 17.80–133.27 (63.31 ± 43.11) | |
Table 3.
PFAS content in noodles, rice, and groats.
| Content of PFAS [ng/g] | |||||
|---|---|---|---|---|---|
| Product | Sample Number | PFBA | PFPeA | PFOA | PFOS |
| plain noodles | 1 | 1.63 | <LOQ | <LOQ | <LOQ |
| 2 | 1.60 | <LOQ | <LOQ | <LOQ | |
| 3 | 9.32 | <LOQ | <LOQ | <LOQ | |
| 4 | 2.00 | <LOQ | 0.07 | <LOQ | |
| 5 | 1.09 | <LOQ | 0.06 | 0.07 | |
| range (mean ± SD) | 1.09–9.32 (3.13 ± 3.48) | - | <LOQ–0.07 (0.026 ± 0.04) | <LOQ–0.07 (0.01 ± 0.03) | |
| durum noodles | 1 | 2.89 | <LOQ | 0.31 | <LOQ |
| 2 | 7.77 | <LOQ | 0.43 | 0.09 | |
| 3 | 3.97 | <LOQ | 0.14 | 6.51 | |
| 4 | 2.07 | <LOQ | 0.20 | <LOQ | |
| 5 | 3.37 | <LOQ | 0.16 | 0.100 | |
| range (mean ± SD) | 2.07–7.77 (4.01 ± 2.21) | - | 0.14–0.43 (0.25 ± 0.12) | <LOQ–6.51 (1.34 ± 2.89) | |
| white rice | 1 | <LOQ | 0.12 | 0.09 | 0.04 |
| 2 | <LOQ | 0.06 | 0.10 | 0.04 | |
| 3 | <LOQ | 0.04 | 0.10 | 0.08 | |
| 4 | <LOQ | 0.06 | 0.08 | 0.03 | |
| 5 | <LOQ | 0.04 | 0.11 | 0.03 | |
| range (mean ± SD) | - | 0.04–0.12 (0.06 ± 0.03) | 0.08–0.11 (0.09 ± 0.01) | 0.03–0.08 (0.04 ± 0.02) | |
| brown rice | 1 | <LOQ | <LOQ | 0.06 | <LOQ |
| 2 | <LOQ | <LOQ | 0.07 | <LOQ | |
| 3 | <LOQ | <LOQ | 0.06 | <LOQ | |
| 4 | <LOQ | <LOQ | 0.11 | <LOQ | |
| 5 | <LOQ | <LOQ | 0.18 | <LOQ | |
| range (mean ± SD) | - | - | 0.06–0.18 (0.09 ± 0.05) | - | |
| unroasted buckwheat groat | 1 | 0.50 | <LOQ | <LOQ | <LOQ |
| 2 | 0.48 | <LOQ | <LOQ | <LOQ | |
| 3 | 0.30 | <LOQ | <LOQ | <LOQ | |
| 4 | 0.34 | <LOQ | <LOQ | <LOQ | |
| 5 | 0.35 | <LOQ | <LOQ | <LOQ | |
| range (mean ± SD) | 0.30–0.50 (0.39 ± 0.09) | - | - | - | |
| roasted buckwheat groat | 1 | <LOQ | <LOQ | 0.09 | <LOQ |
| 2 | <LOQ | <LOQ | 0.12 | <LOQ | |
| 3 | <LOQ | <LOQ | 0.10 | <LOQ | |
| 4 | <LOQ | <LOQ | 0.08 | <LOQ | |
| 5 | <LOQ | <LOQ | 0.09 | <LOQ | |
| range (mean ± SD) | - | - | 0.08–0.12 (0.10 ± 0.02) | - | |
| millet groat | 1 | <LOQ | 0.16 | <LOQ | <LOQ |
| 2 | <LOQ | 0.34 | <LOQ | 8.39 | |
| 3 | <LOQ | 0.10 | 0.19 | <LOQ | |
| 4 | <LOQ | 0.12 | 0.15 | <LOQ | |
| 5 | <LOQ | 0.29 | <LOQ | 0.61 | |
| range (mean ± SD) | - | 0.10–0.34 (0.20 ± 0.11) | <LOQ–0.19 (0.07 ± 0.10) | <LOQ–8.39 (1.80 ± 3.69) | |
Table 4.
PFAS content in baked cereal-based products—bread and rolls.
| Content of PFAS [ng/g] | |||
|---|---|---|---|
| Product | Sample Number | PFHxA | PFOA |
| boltona bread | 1 | <LOQ | 0.27 |
| 2 | 0.09 | 0.19 | |
| 3 | 0.10 | 0.15 | |
| 4 | 0.11 | 0.12 | |
| 5 | 0.09 | 0.15 | |
| 6 | 0.09 | 0.13 | |
| 7 | 0.08 | 0.12 | |
| 8 | 0.01 | 0.14 | |
| 9 | 0.41 | 0.21 | |
| 10 | 0.44 | 0.23 | |
| range (mean ± SD) | <LOQ–0.44 (0.14 ± 0.15) | 0.12–0.27 (0.17 ± 0.05) | |
| wholemeal bread | 1 | 0.07 | 0.31 |
| 2 | 0.13 | 0.29 | |
| 3 | 0.04 | 0.35 | |
| 4 | 0.06 | 0.24 | |
| 5 | 0.05 | 0.29 | |
| 6 | 0.12 | 0.30 | |
| 7 | 0.04 | 0.27 | |
| 8 | 0.05 | 0.23 | |
| 9 | 0.28 | 0.27 | |
| 10 | 0.07 | 0.25 | |
| range (mean ± SD) | 0.04–0.28 (0.09 ± 0.07) | 0.23–0.35 (0.28 ± 0.04) | |
| wheat roll | 1 | <LOQ | 0.16 |
| 2 | <LOQ | 0.16 | |
| 3 | <LOQ | 0.25 | |
| 4 | <LOQ | 0.18 | |
| 5 | <LOQ | 0.19 | |
| 6 | <LOQ | 0.15 | |
| 7 | <LOQ | 0.26 | |
| 8 | <LOQ | 0.15 | |
| 9 | <LOQ | 0.18 | |
| range (mean ± SD) | - | 0.15–0.26 (0.19 ± 0.04) | |
| graham roll | 1 | <LOQ | 0.25 |
| 2 | <LOQ | 0.19 | |
| 3 | <LOQ | 0.16 | |
| 4 | <LOQ | 0.17 | |
| 5 | <LOQ | 0.16 | |
| range (mean ± SD) | - | 0.16–0.25 (0.19 ± 0.04) | |
Table 5.
Mean PFAS concentrations for the two principal product groups (determined from HCA).
| Group/Cluster | PFBA | PFPeA | PFHxA | PFOA | PFOS |
|---|---|---|---|---|---|
| 1 | 16.21 | 0.02 | 0.0002 | 0.07 | 0.25 |
| 2 | 0.44 | - | 0.10 | 0.25 | 0.004 |
All the PFAS values are shown in ng/g. Concentrations are displayed if higher than LOQ.
Table 6.
Average monthly consumption of selected cereal products in Poland in the years 2010–2019 [58].
Table 6.
Average monthly consumption of selected cereal products in Poland in the years 2010–2019 [58].
| Product | Average Monthly Consumption of Selected Foodstuffs in Households [kg/capita] | ||
|---|---|---|---|
| 2010 | 2018 | 2019 | |
| Bread and cereals (total) | 7.05 | 5.48 | 5.36 |
| Rice | 0.20 | 0.15 | 0.15 |
| Bread | 4.69 | 3.15 | 2.98 |
| Pasta and pasta products | 0.37 | 0.38 | 0.40 |
| Flour | 0.89 | 0.60 | 0.59 |
| Groats and flakes | 0.21 | 0.27 | 0.27 |
Publisher’s Note: MDPI stays neutral with regard to jurisdictional claims in published maps and institutional affiliations. |
© 2022 by the authors. Licensee MDPI, Basel, Switzerland. This article is an open access article distributed under the terms and conditions of the Creative Commons Attribution (CC BY) license (https://creativecommons.org/licenses/by/4.0/).
Share and Cite
MDPI and ACS Style
Surma, M.; Sznajder-Katarzyńska, K.; Wiczkowski, W.; Zieliński, H. Assessment of Bioactive Surfactant Levels in Selected Cereal Products. Appl. Sci. 2022, 12, 5242. https://0-doi-org.brum.beds.ac.uk/10.3390/app12105242
AMA Style
Surma M, Sznajder-Katarzyńska K, Wiczkowski W, Zieliński H. Assessment of Bioactive Surfactant Levels in Selected Cereal Products. Applied Sciences. 2022; 12(10):5242. https://0-doi-org.brum.beds.ac.uk/10.3390/app12105242
Chicago/Turabian StyleSurma, Magdalena, Katarzyna Sznajder-Katarzyńska, Wiesław Wiczkowski, and Henryk Zieliński. 2022. "Assessment of Bioactive Surfactant Levels in Selected Cereal Products" Applied Sciences 12, no. 10: 5242. https://0-doi-org.brum.beds.ac.uk/10.3390/app12105242
Note that from the first issue of 2016, this journal uses article numbers instead of page numbers. See further details here.