
Low-Cost RSAC and Adsorption Characteristics in the Removal of Copper Ions from Wastewater


School of Civil Engineering, Southeast University, Nanjing 210096, China
*
Author to whom correspondence should be addressed.
Appl. Sci. 2022, 12(11), 5612; https://0-doi-org.brum.beds.ac.uk/10.3390/app12115612
Submission received: 29 April 2022
/
Revised: 28 May 2022
/
Accepted: 28 May 2022
/
Published: 1 June 2022
(This article belongs to the Special Issue Water Quality Modelling, Monitoring and Mitigation)
Abstract
:Adsorption is a typical method for treating copper-containing wastewater. Fly ash and steel slag both have a good adsorption performance, and activated clay is added in this study, too. In this study, the performance of residue and soil adsorption composite (RSAC) particles for copper ion adsorption was discussed through the substrate ratio and the influence mechanism, to achieve the win–win effect of industrial waste reuse and copper ion wastewater treatment. The results indicated that adsorption time, dosage, initial copper ion concentration, coexisting ions, and temperature showed different effects on the adsorption, respectively. Additionally, the adsorption kinetic study showed the removal of copper ions by adsorption of RSAC particles was in accordance with quasi-primary kinetic model and quasi-secondary kinetic model. The adsorption thermodynamics study shows the adsorption process of < 0, > 0 and > 0, indicating that the process of copper ion adsorption by RSAC particles was spontaneous, heat-absorbing, and entropy-increasing. The research demonstrates that RSAC particles have a certain adsorption capacity for copper ion.
1. Introduction
Water contamination through heavy metal ions is an environmental problem of great concern [1]. Adsorption is one of the most efficient methods to remove noxious heavy metal ions, especially for wastewater with large volumes and low heavy metal ion concentrations [2]. Adsorption is spontaneous and the basic principle is that the surface energy of substances could change the concentration at the phase interface. Adsorption usually relies on some adsorbent materials with a large specific surface area and a high surface energy to remove heavy metal ions [3,4]. Adsorption has two major advantages: the reaction rate is fast, and no other reagents are needed. Therefore, adsorption is regarded as an important and promising method for addressing heavy metal ions such as copper in wastewater.
The key issue of adsorption is the adsorbent. Adsorbents with good adsorption performance have such qualities as: a fast adsorption reaction rate, stable physical and chemical properties, good solid–liquid separation, an economical cost, easy recovery and regeneration, and reusability [5]. However, industrial adsorbents could not meet all of these qualities. Therefore, the core of the adsorption method focusing on treating wastewater with heavy metal ions is to find efficient adsorbents at a low cost [6,7].
Currently, common adsorbents in the water treatment domain include activated carbon, fly ash, etc. Activated carbon has a large surface area, fast filtration rate, stable structure, large adsorption capacity, a wide range of applications, and good adsorption performance. However, activated carbon has a short service life, high sludge treatment cost, and low recycling performance [8,9]. Fly ash, a waste product from power plants that use coal as the main fuel, has a loose and porous structure. It can intercept pollutant molecules and bind pollutants to the active sites on the surface by a chemical bond, resulting in excellent adsorption [10]. Whereas, Andersson et al. [11] have also considered fly ash a low-cost material for adsorption. It has been found that steel slag has a good adsorption effect on copper, nickel and zinc ions, which mainly relies on the generation of hydroxide complexes [12]. Under optimal conditions, the adsorption efficiency of modified steel slag for uranium was 98% [13]. Activated white clay is an adsorbent made from clay minerals by inorganic acidification and other means, and dried by water rinsing. It is mainly made of bentonite clay as a raw material; its appearance is presented as a milky white powder, which is a non-toxic, tasteless, odorless, strong adsorption; and it can adsorb colored substances and organic matter [14]. Bentonite is considered to be an excellent adsorbent for Cu2+, and the maximum adsorption capacity was 248.9 mg/g [15].
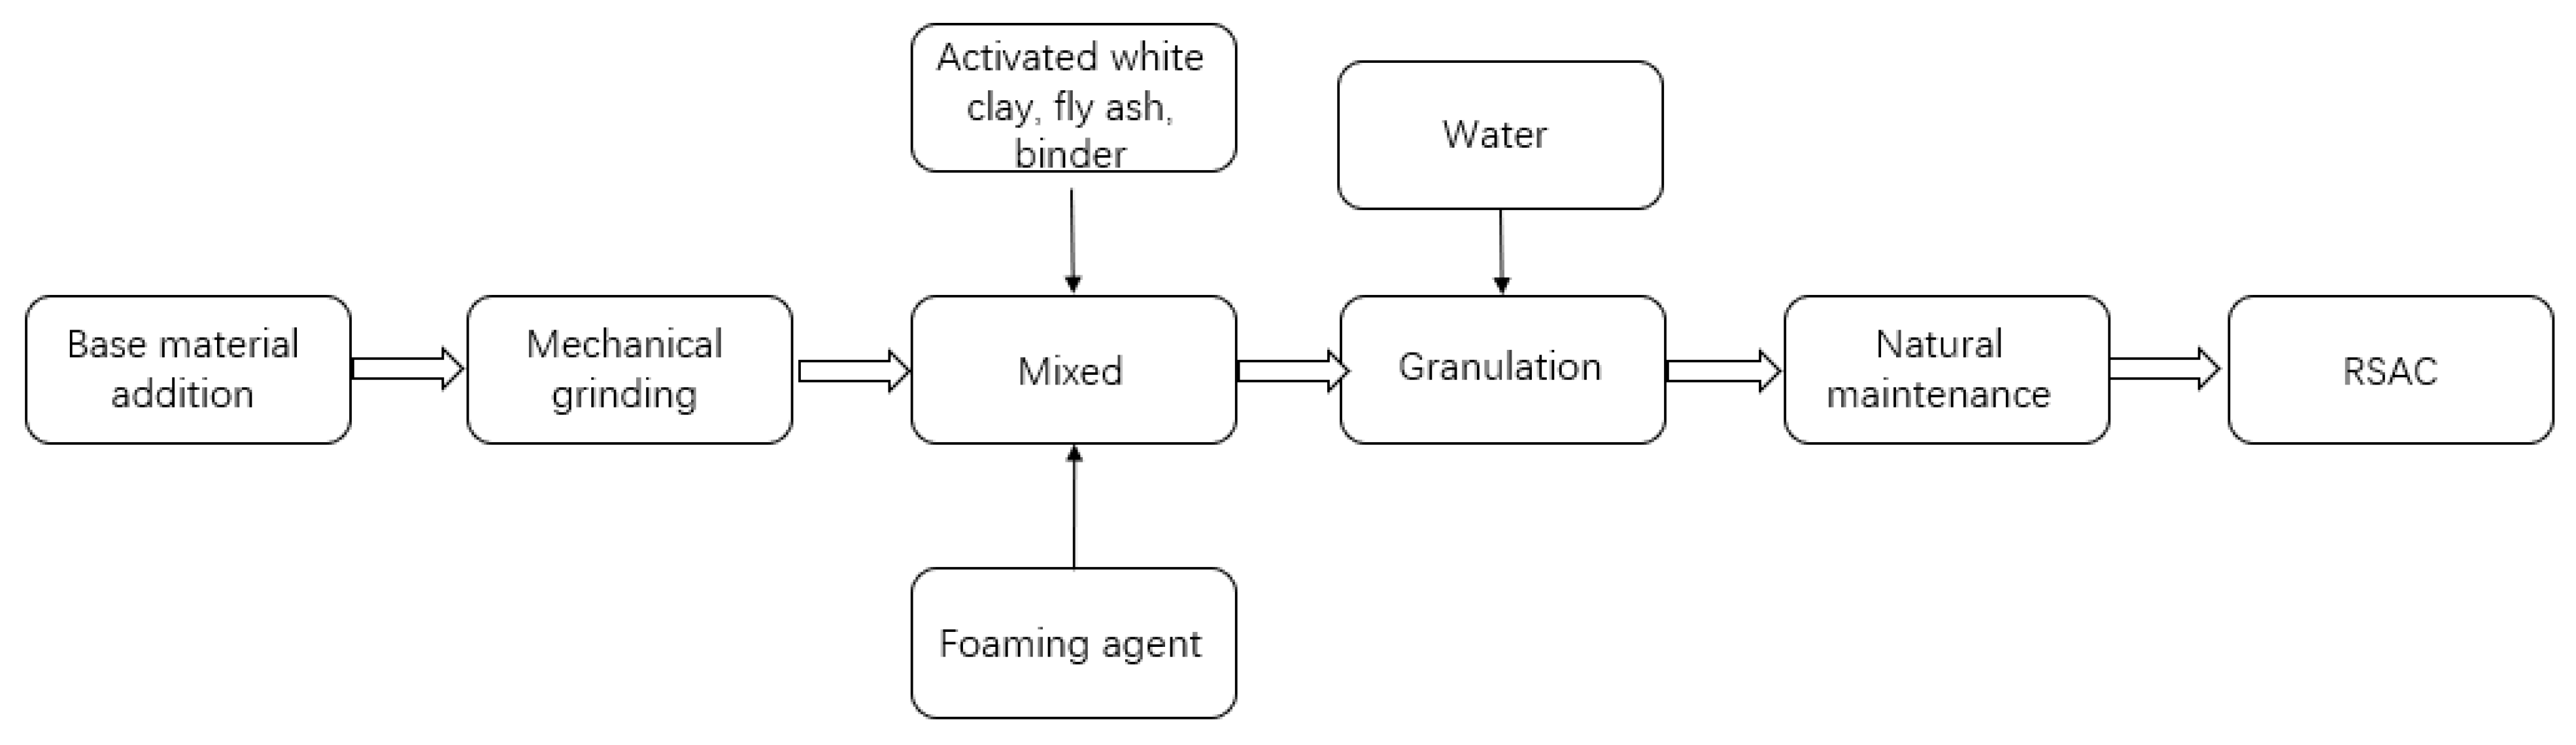
The residue and soil adsorption composite (RSAC) particle consists of solid waste and natural minerals. The raw materials used in the preparation of RSAC granules are fly ash, steel slag, activated white clay, bonding agent, and porogenic agents. The main raw materials are fly ash, steel slag, and activated white clay, the first two of which are industrial waste substrates [16].
2. Materials and Methods
2.1. RSAC Preparation
The fly ash used in this study was obtained from a power plant in Nanjing, China, and the steel slag was from a steel mill in Nanjing, China. Table 1 presents the main physical properties of the fly ash and the steel slag, Table 2 provides the particle size distribution of the fly ash and the steel slag, and Table 3 provides the chemical composition of the fly ash and the steel slag as measured by X-ray fluorescence analysis (XRF).
Additionally, the physical properties and the chemical composition of the activated white clay used in this experiment are presented in Table 4 and Table 5.
The binder used in the experiments was 525R ordinary silicate cement, which has the characteristics of a slow thickening rate, fast setting, and high strength. It can significantly improve the early strength of the composites [17]. The porogenic agent used in the experiment was a plant-based foaming agent. It is made by a saponification reaction with rosin and sodium hydroxide as the main raw materials, and it has a light yellow-brown viscous liquid appearance. The use of a plant-based foaming agent makes the adsorbent structure lose and porous, which can enhance the adsorption performance of RSPRC particles [18]. After comprehensive consideration of the adsorption and mechanical properties, the following substrate proportioning methods were set, which are shown in Table 6.
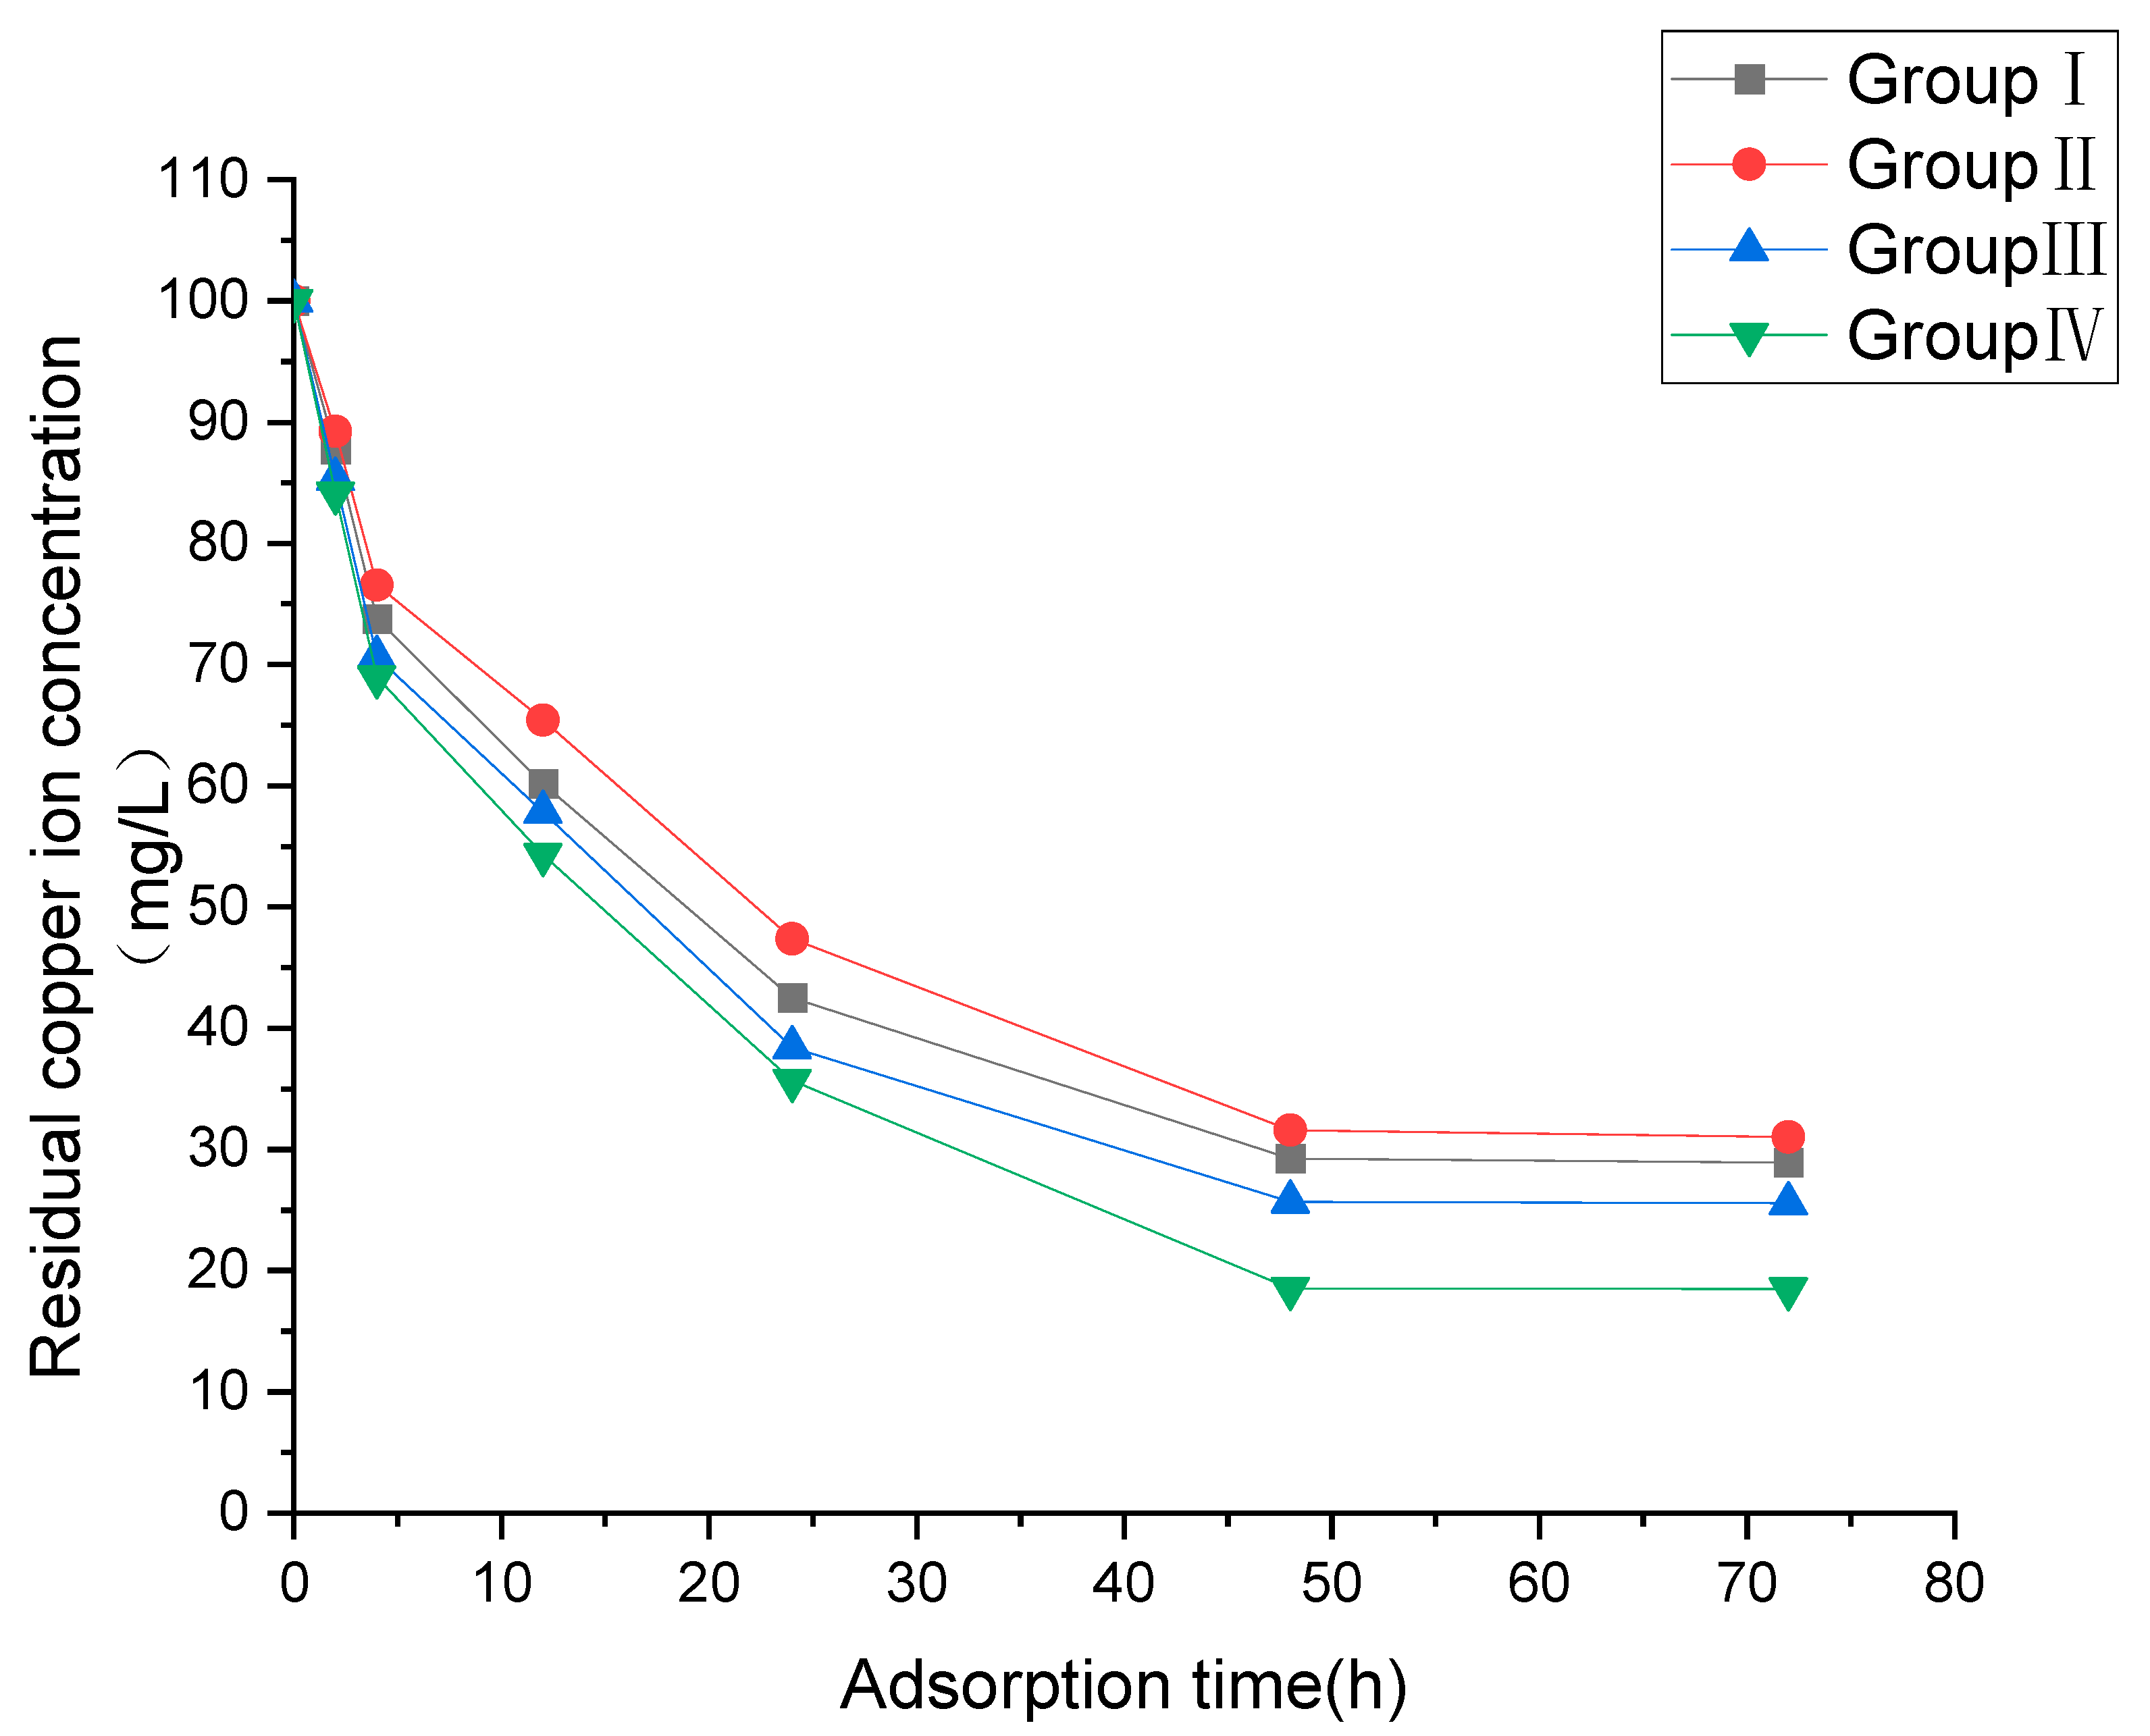
After the groups of adsorbents were maintained and shaped, static adsorption tests were performed. The results of the experiments are shown in Table 7 and Figure 1. The RSAC particle morphology and the residual liquid shape were observed after the completion of static adsorption experiments.
The properties of the RSAC particles in each group were observed after the adsorption of copper ions. The residuals of Groups I, II, and III were clear, the RSAC particles were not abnormal, and the hardness did not change significantly. The residuals of group IV were somewhat turbid, with slight precipitation, the surface of RSAC particles showed signs of shedding, and the hardness decreased.
Although Group IV had the best adsorption effect on copper ions, it was found that the residual solution had slight precipitation and the strength of the RSAC particles was reduced to break easily. On balance, Group III with the second highest removal rate was selected as the best ratio for the subsequent experiments. The process flow of the pellet is shown in Figure 2.
2.2. Determination of Copper Ion Concentration
2.2.1. Measurement Methods
The method used for the determination of copper ion concentration was the bisglyoxal oxaldihydrazone spectrophotometric method (GB/T 5750.6-2006). The measurement instrument used was a 752 UV-Vis spectrophotometer, which had a minimum detection mass concentration of 0.04 mg/L. At pH 9, copper ions (Cu2+) could react with bis (cyclohexanone oxaldihydrazone) and acetaldehyde. The reaction product is a purple bis (acetaldehyde oxaldihydrazone) chelate, and the copper ion concentration is determined by the relationship between absorbance and copper ion concentration in direct proportion.
2.2.2. Reagents for Experiments
The reagents for the experiments were: copper sulfate (CuSO4), acetaldehyde solution (W(CH3CHO) = 40%), ammonium chloride (NH4CI), ammonium hydroxide (NH4OH), ammonium citrate ((NH4)3C6H5O7), ethyl alcohol (C2H6O), and bis(cyclohexanone)oxaldihydrazone(BCO). All reagents were supplied by Sinopharm Chemical Reagent Co., Ltd., Nanjing, China. All solutions in these experiments were prepared with analytical grade water (R = 18 M/cm) using grade A glassware unless otherwise stated.
2.2.3. Determination Procedure
Absorb 25.0 mL water sample in 50 mL glass plug colorimetric tube; another 50 mL colorimetric tube 5, respectively, adding copper standard solution 0 mL, 0.50 mL, 1.00 mL, 1.50 mL, and 2.00 mL, diluted with deionized water to 25 mL.
Absorbing 2.0 mL ammonium citrate solution, adding each colorimetric tube, mixing evenly and adjusting pH to 9.0 with (1 + 1) ammonia. Then, 5.0 mL ammonia-ammonium chloride buffer solution was added and mixed evenly. Then, 5.0 mL BCO solution and 1.0 mL acetaldehyde were added successively. Finally, deionized water was added to the scale and mixed evenly.
Heat for 10 min in a 50 °C water bath, remove, and cool. After cooling to room temperature (standing for 20 min), under the condition of wavelength of 546 nm, the absorbance of the sample to be tested and the standard series was determined using a colorimetric dish with an optical path of 1 cm and deionized water as the reference.
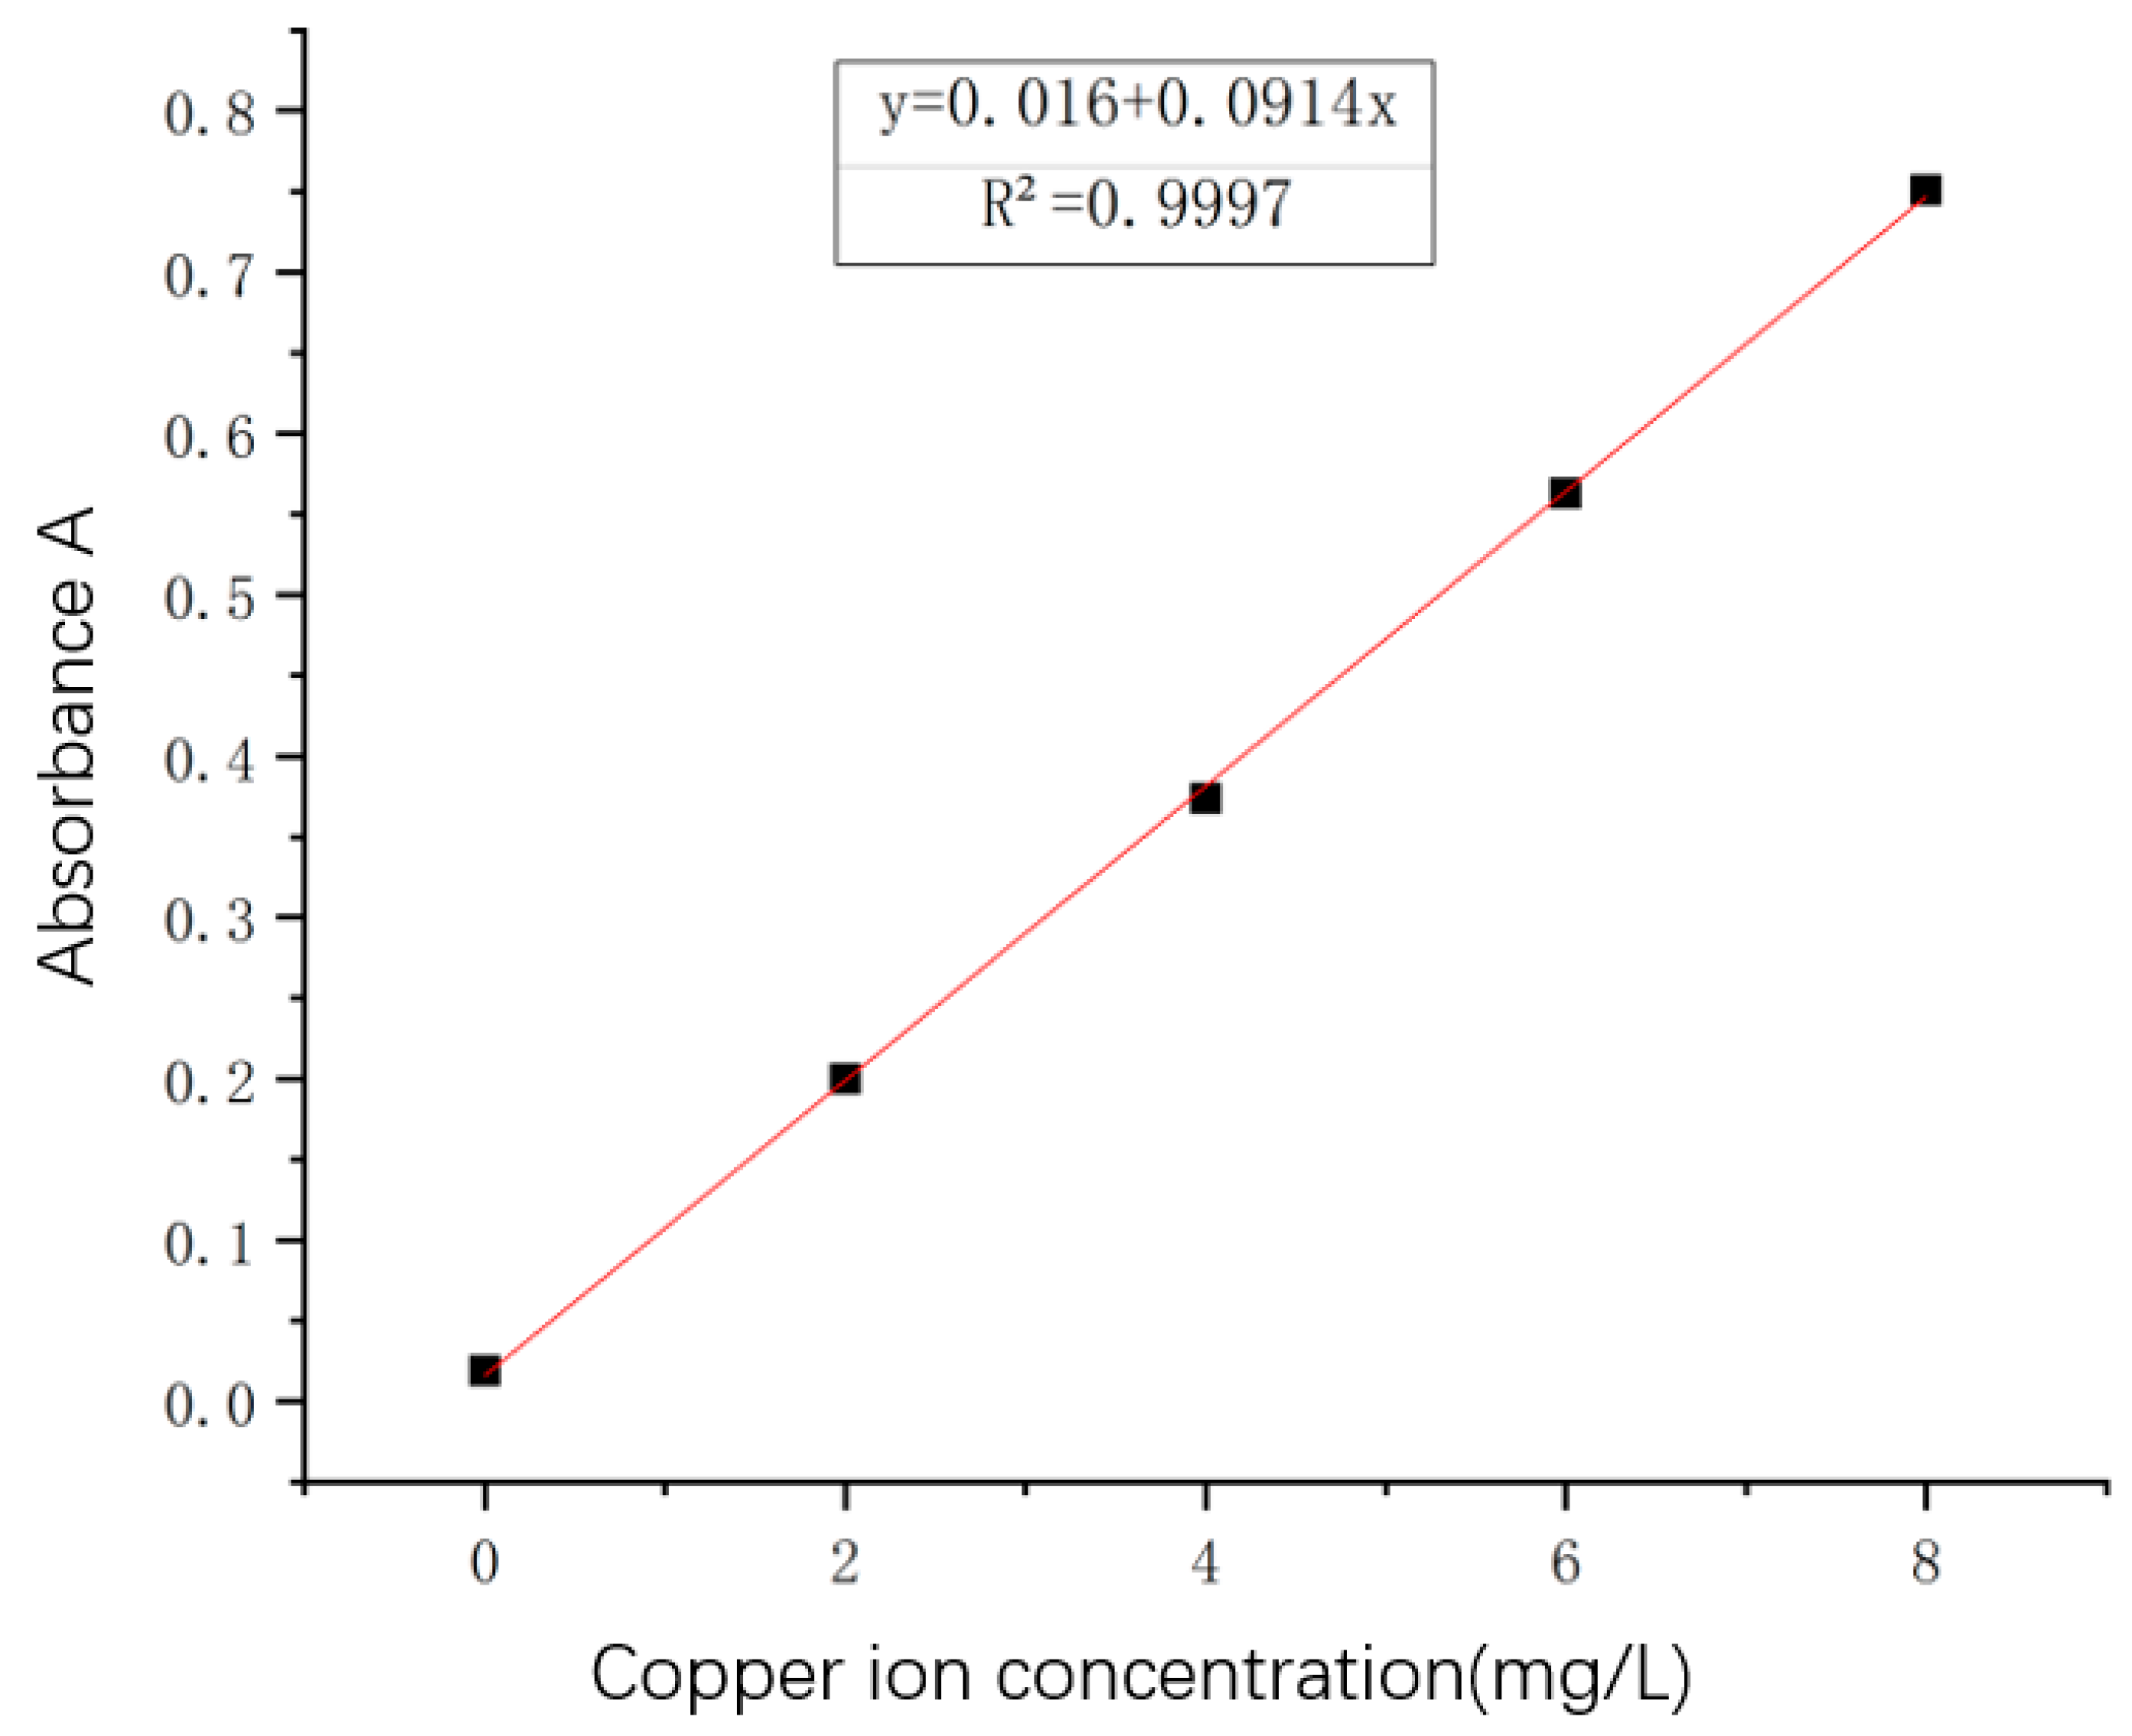
The standard curve was plotted with the copper ion concentration of the standard series as the abscissa and the corresponding absorbance as the ordinate. The corresponding copper ion concentration was determined from the standard curve according to the absorbance of the water sample to be measured.
The results of the standard series measurements are presented in Table 8.
The standard curve was plotted as shown in Figure 3 and the linear regression equation (Equation (1)):
y = 0.0914x + 0.016, R2 = 0.9997
2.3. Copper Ion Removal Effect Examination Index
The adsorption effect of RSAC particles on copper ions is mainly reflected in two aspects, namely the copper ion removal rate and the adsorption amount. Removal rate (η) and adsorption amount (Γ) are used in this paper to investigate the copper ion removal effect and the adsorption performance of RSAC particles, respectively.
In Equations (2) and (3), η is the removal rate of copper ions (%), C0 is the initial copper ion concentration of the solution (mg/L), Ce is the concentration of copper ions in solution at equilibrium (mg/L), Γ is the amount of copper adsorbed per unit mass of adsorbent (mg/g), V is the volume of the solution (L), and m is the mass of adsorbent (g).
2.4. Effect of Time on Adsorption
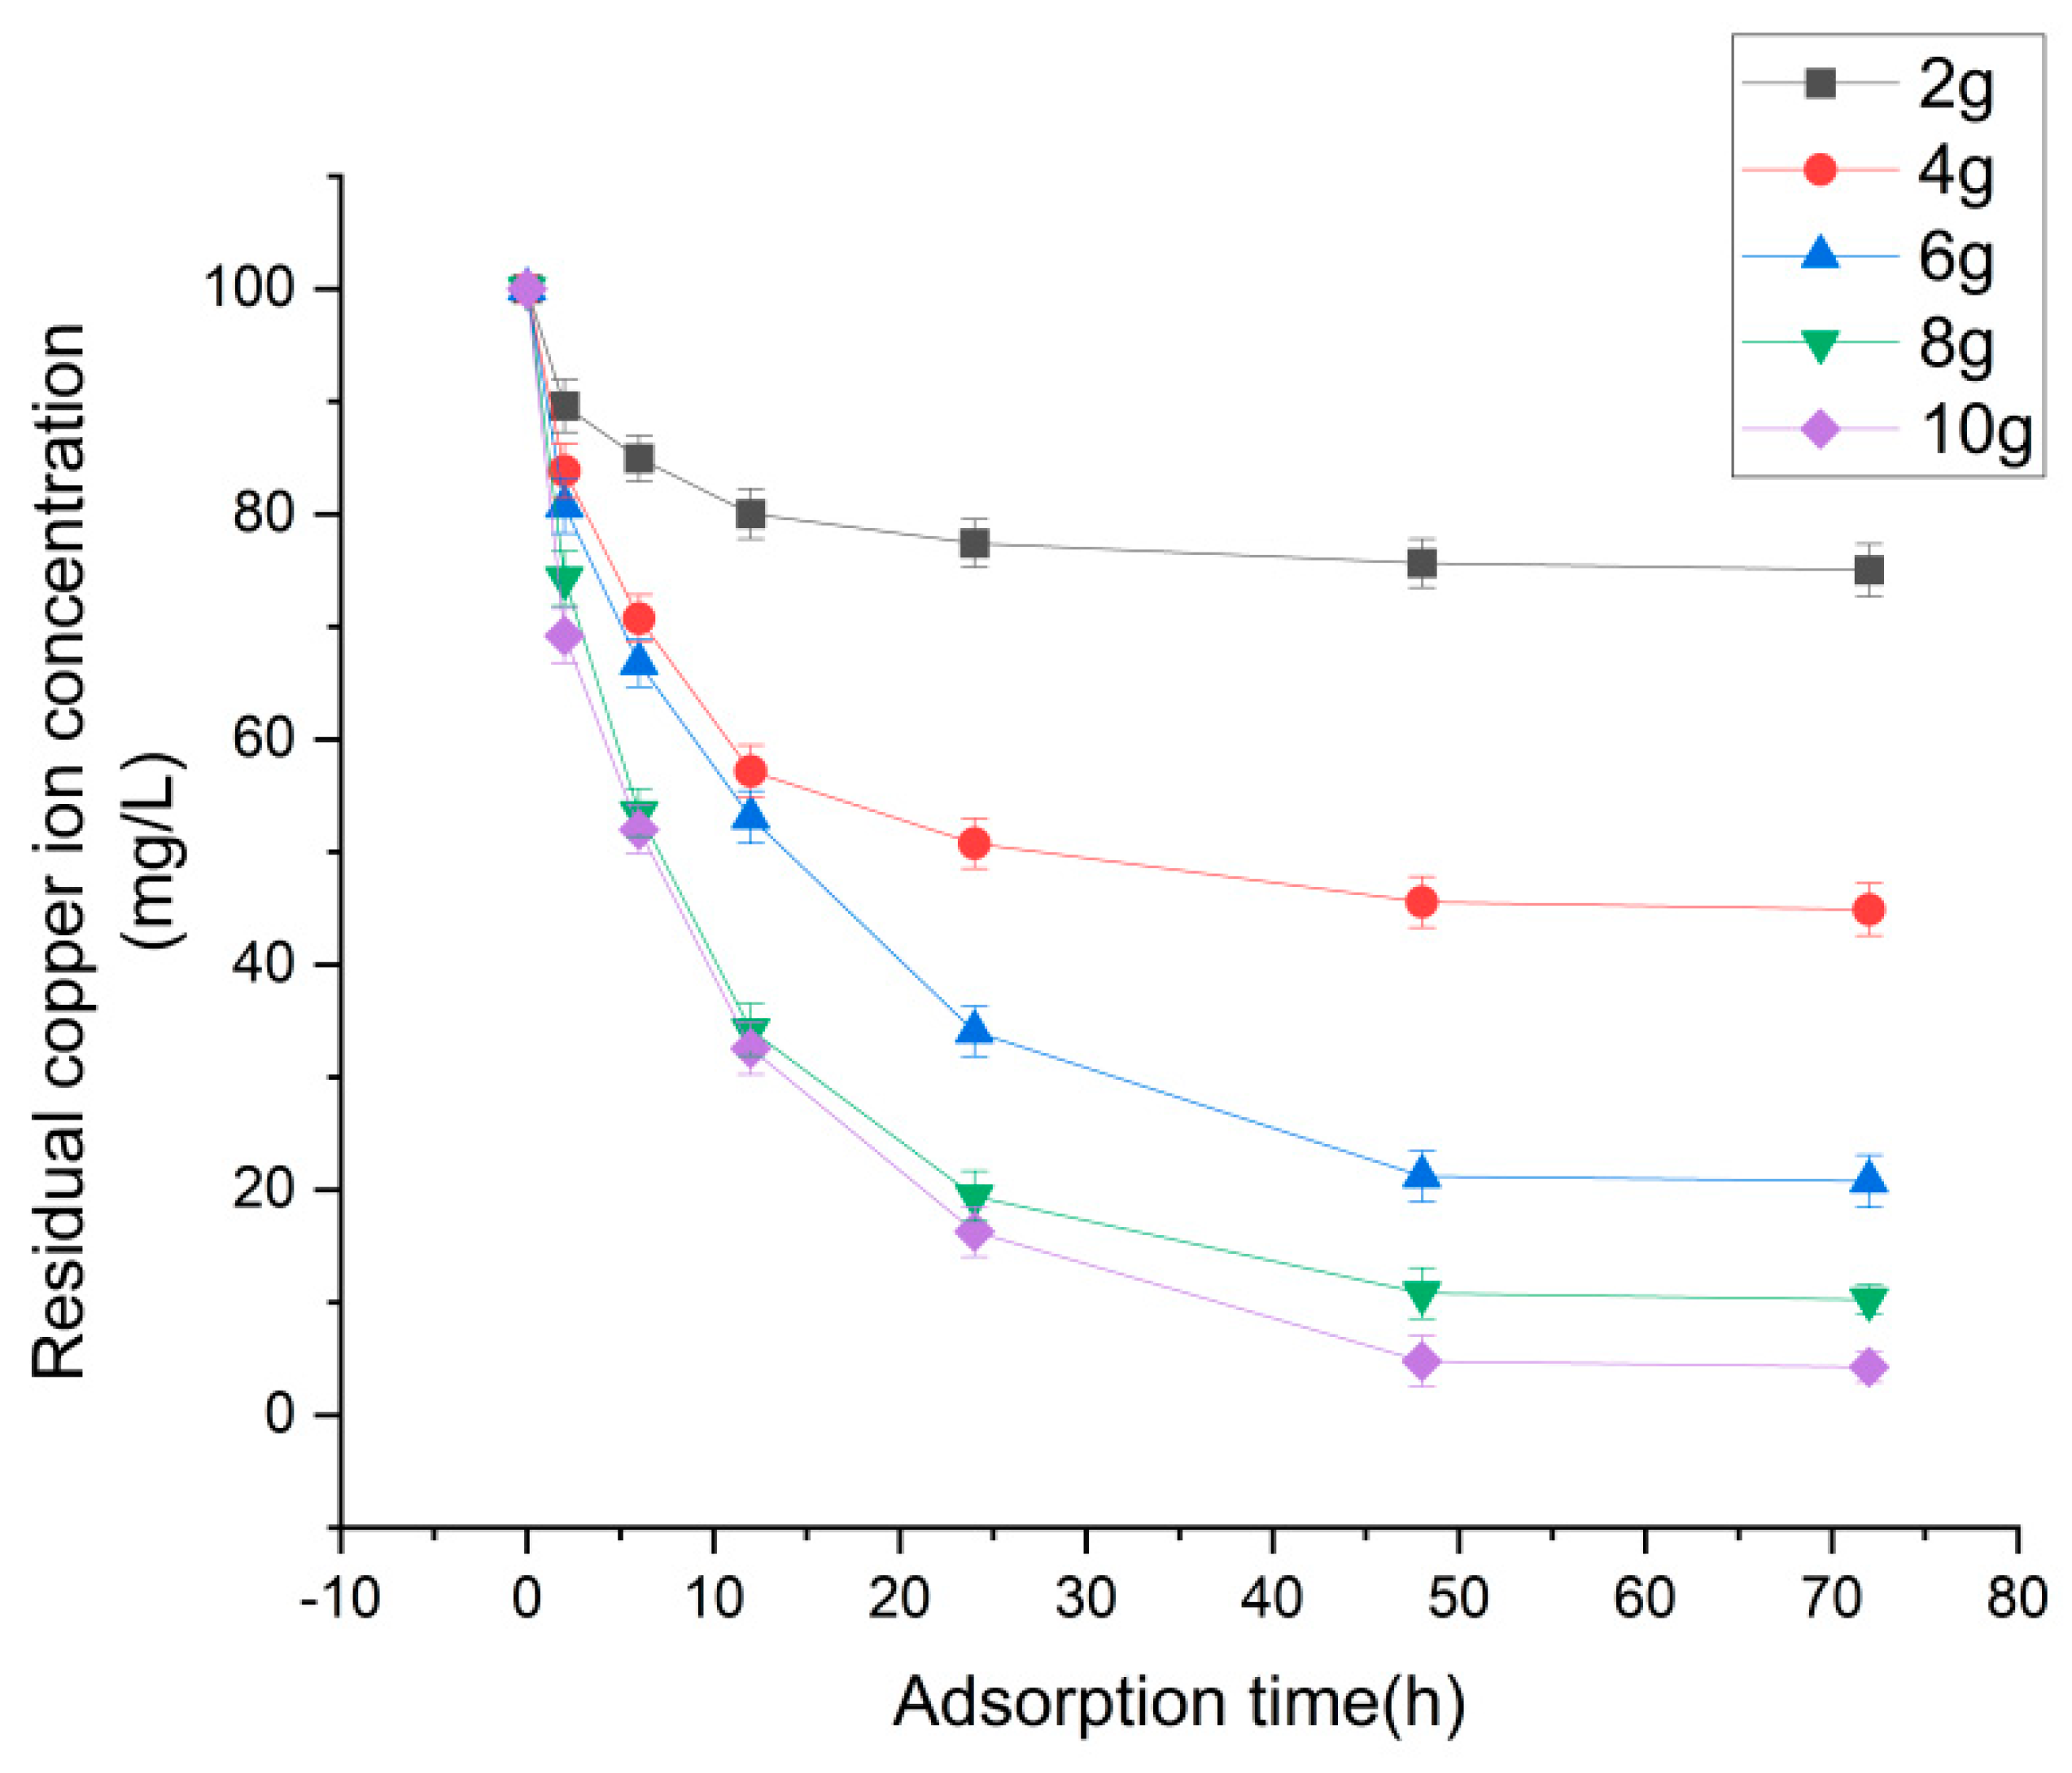
RSAC particles were weighted and divided into five groups: 2, 4, 6, 8, and 10 g. The groups were put into conical flasks, respectively, with 150 mL of 100 mg/L copper ion solution. Then, all the samples were mixed at room temperature (25 ± 1 °C). The concentration of residual copper ion in the supernatant of each sample was measured at a specific time and the relationship was investigated.
2.5. Effect of Dosage on Adsorption
The same samples were prepared and oscillated at room temperature (25 ± 1 °C). The concentration of residual copper ions in the supernatant of each sample was measured when the adsorption time reached 48 h.
2.6. Study of Initial Concentration on Adsorption
A series of 10, 50, 100, and 150 mg/L copper ion solutions were prepared separately. Then, a 5 g RSAC adsorbent was added into the solution series. Finally, the copper ion concentration in the supernatant of each sample was measured when the static adsorption time reached 2, 6, 12, 24, 48, and 72 h.
2.7. Study of Coexisting Metal Cations on Adsorption
A series of 150 mL of 100 mg/L copper ion solutions were prepared with the coexistence of Na+, Mg2+, Ca2+, and Fe3+, respectively. To each sample 5 g RSAC particles was added and then mixed at room temperature (25 ± 1 °C). The cooper ion concentration in the supernatant of each sample was measured when the adsorption time reached 48 h.
2.8. Study of Ambient Temperature on Adsorption
Three groups of 150 mL solutions with 10, 40, 80, 120, 160, and 200 mg/L cooper ion were prepared. To each sample was added 5 g RSAC particles. The three groups were mixed at 15 °C, 25 °C, and 35 °C separately. To each sample was measured a cooper ion concentration of the supernatant when reaching adsorption equilibrium.
The Freundlich and Langmuir models are often used to describe the adsorption behavior in solid–liquid systems [19]. Therefore, the adsorption isotherms of the Freundlich and the Langmuir models were plotted using nonlinear fits based on the experimental results of heavy metal ion adsorption by RSAC particles.
The expression for the Langmuir model equation is (Equation (4)):
In Equation (4), qe is the adsorption equilibrium adsorption capacity (mg/g), Ce is the equilibrium concentration (mg/L), qmax is the maximum adsorption capacity (mg/g), and KL is the Langmuir adsorption constant.
The expression for the Freundlich model equation is (Equation (5)):
In Equation (5), qe is the adsorption equilibrium adsorption capacity (mg/g), Ce is the equilibrium concentration (mg/L), KF is the Freundlich adsorption constant, and n is a constant related to the adsorption capacity.
2.9. Kinetic Study of Copper Ion Adsorption by RSAC
Currently, quasi-primary and quasi-secondary kinetic models are often used to describe the adsorption kinetic behavior of adsorbents in solid–liquid static adsorption systems [20].
The expression for the quasi-level kinetic model equation is (Equation (6)):
In Equation (6), qe is the amount of solute adsorbed on the adsorbent surface at adsorption equilibrium (mg/g), qt is the amount of solute adsorbed on the adsorbent surface at the specified moment (t) during the adsorption process (mg/g), and k1 is the adsorption rate constant (h−1).
The expression for the quasi-secondary kinetic model equation is (Equation (7)):
In Equation (7), qe is the amount of solute adsorbed on the adsorbent surface at adsorption equilibrium (mg/g), qt is the amount of solute adsorbed on the adsorbent surface at the specified moment (t) during the adsorption process (mg/g), and k2 is the adsorption rate constant (g/(mg·h)).
A 150 mL sample of a 100 mg/L copper ion was prepared and 5 g RSAC particles were added. Then, the sample was mixed at room temperature (25 ± 1 °C). The rest copper ion concentration was measured at different times to calculate the adsorbed copper ion. The experimental data of static adsorption of copper ions were fitted to the curve using quasi-primary and quasi-secondary kinetic models in turn.
2.10. Thermodynamic Study of the Adsorption of Copper Ions by RSAC
The thermodynamic equations are as follows (Equations (8) and (9)):
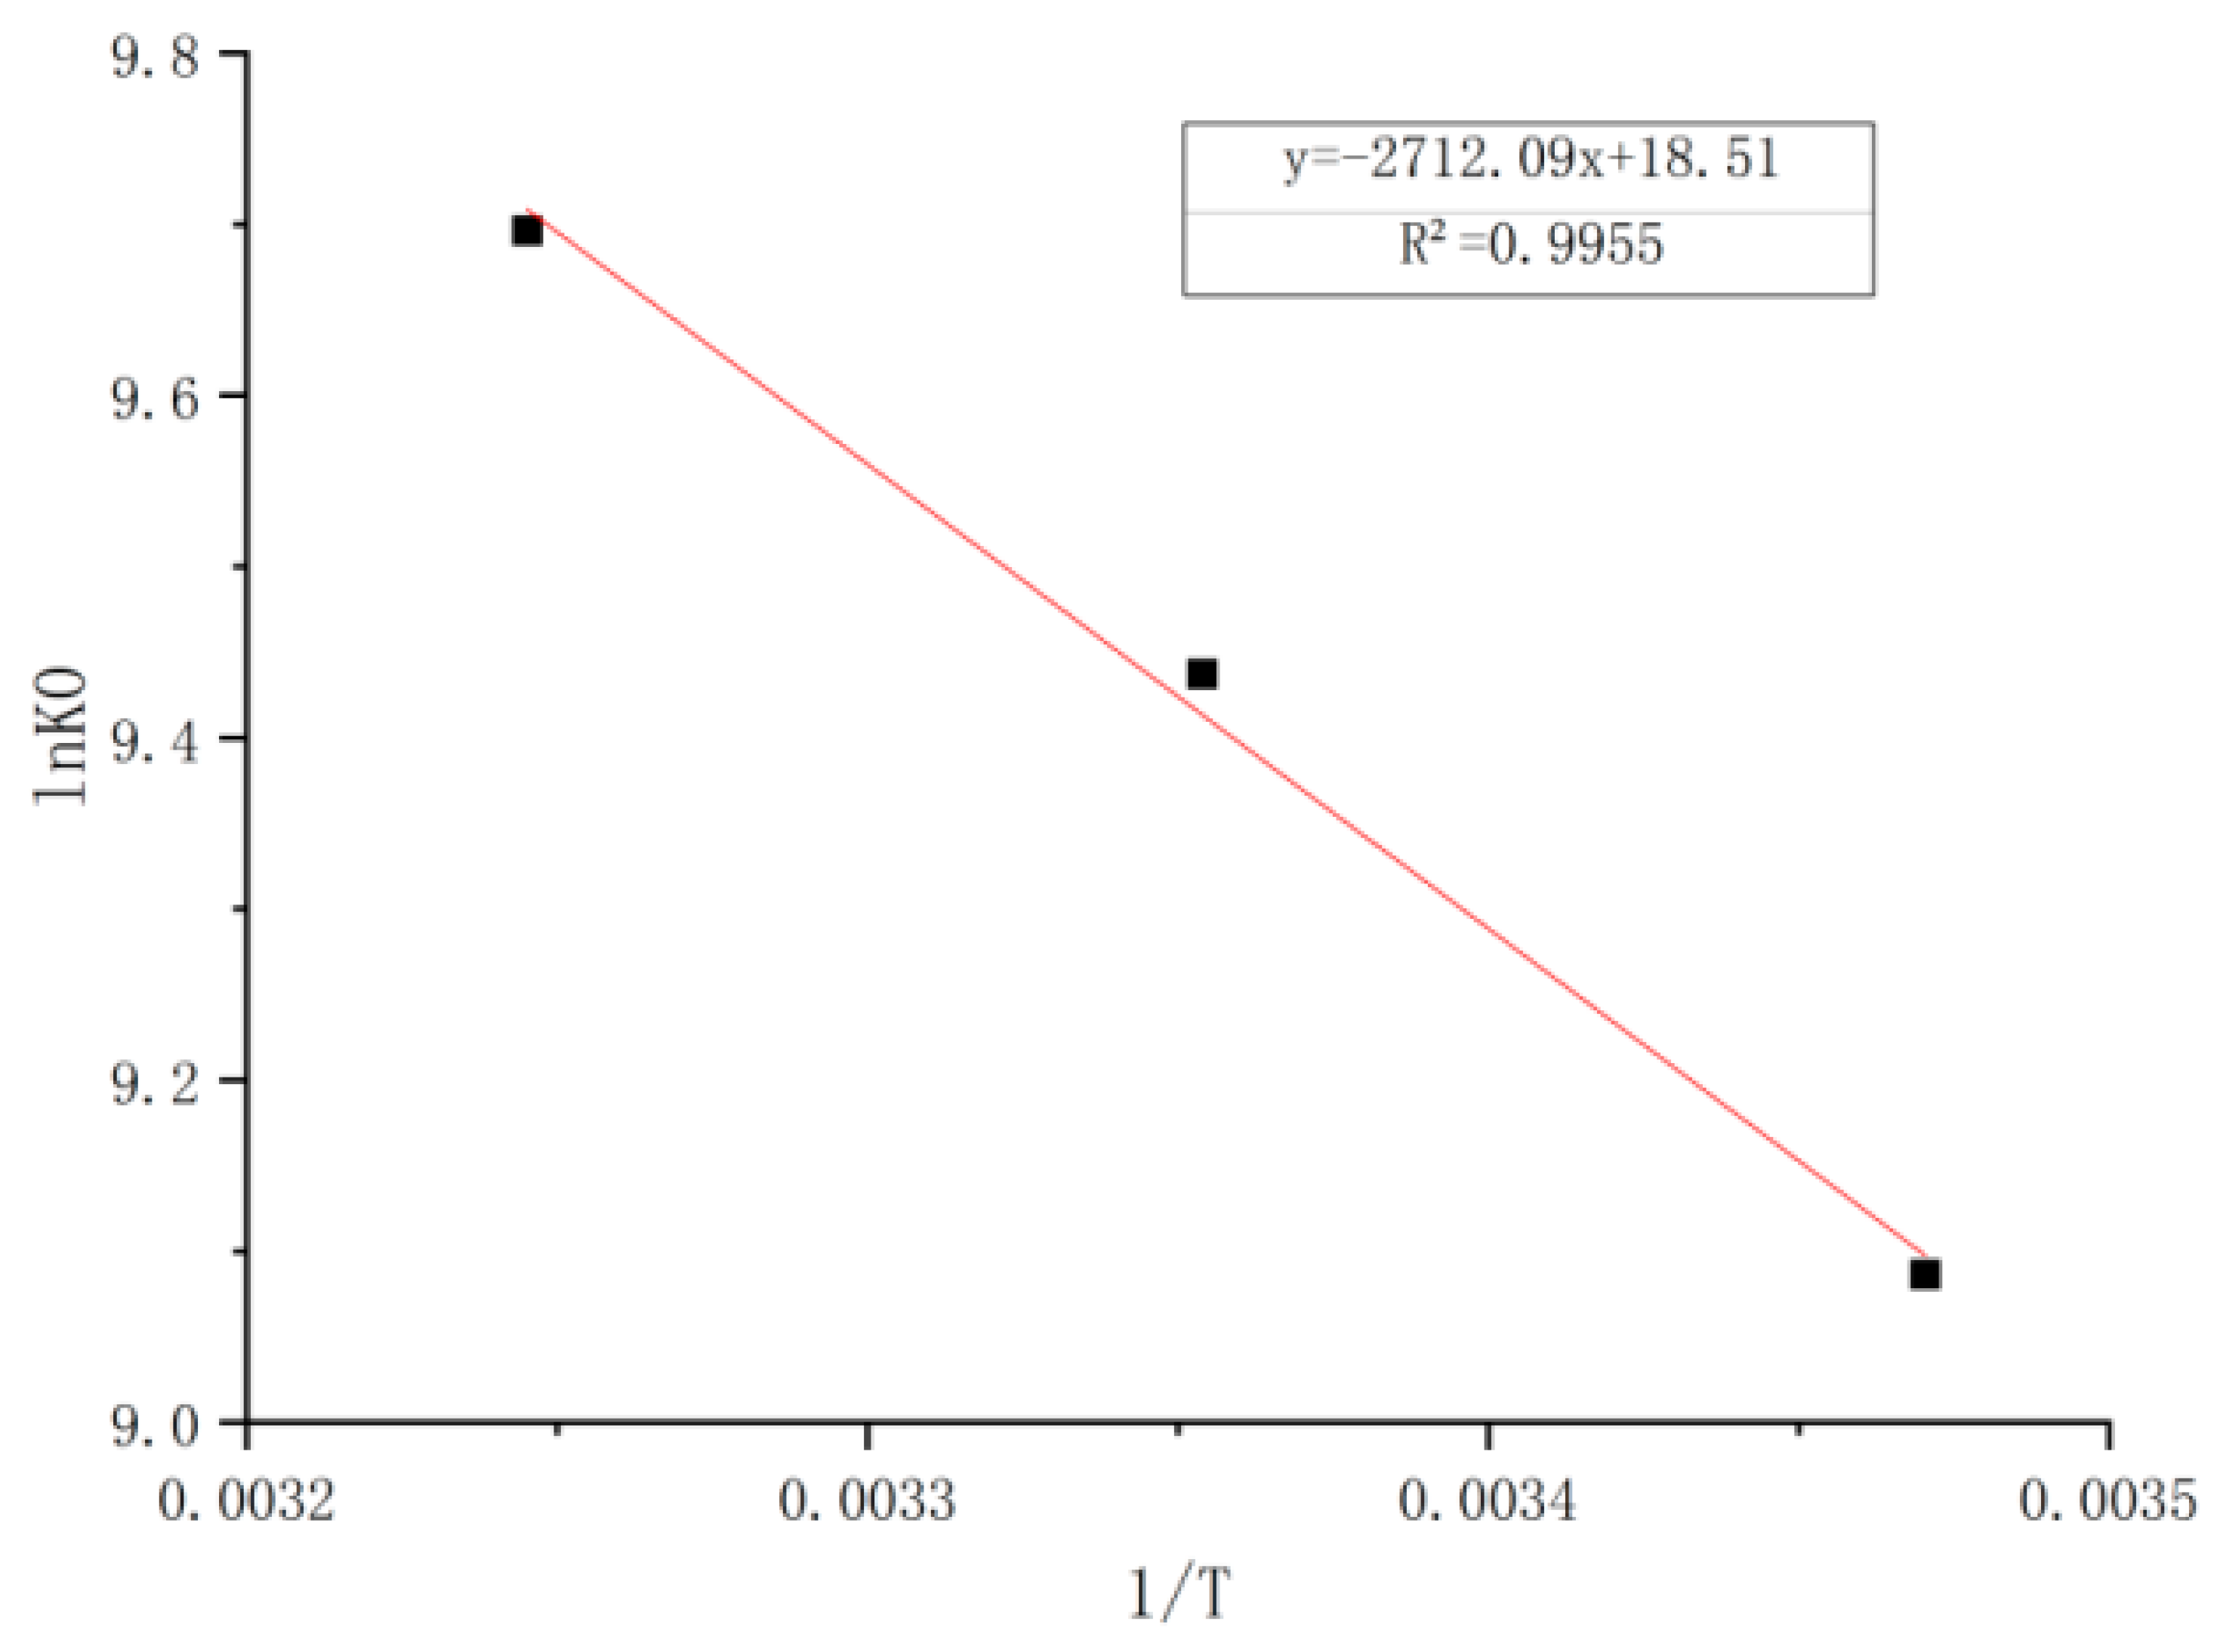
In Equations (8) and (9), T is the thermodynamic temperature (K), is the enthalpy change of adsorption (kJ/mol), is the free energy of adsorption (kJ/mol), is the change in entropy of adsorption [J/(mol·K)], R is the molar volume constant 8.314 J/(mol·K), and K0 is the adsorption partition coefficient, usually taken as the Langmuir constant KL. Using the isothermal adsorption experimental data of RSAC particles at different temperatures, the adsorption equilibrium coefficient K0 was calculated [21]. A straight line could be fitted by using the inverse of the temperature 1/T as the horizontal coordinate and lnK0 as the vertical coordinate for the graph.
3. Results and Discussion
3.1. Adsorption Experiments
3.1.1. Effect of Adsorption Time
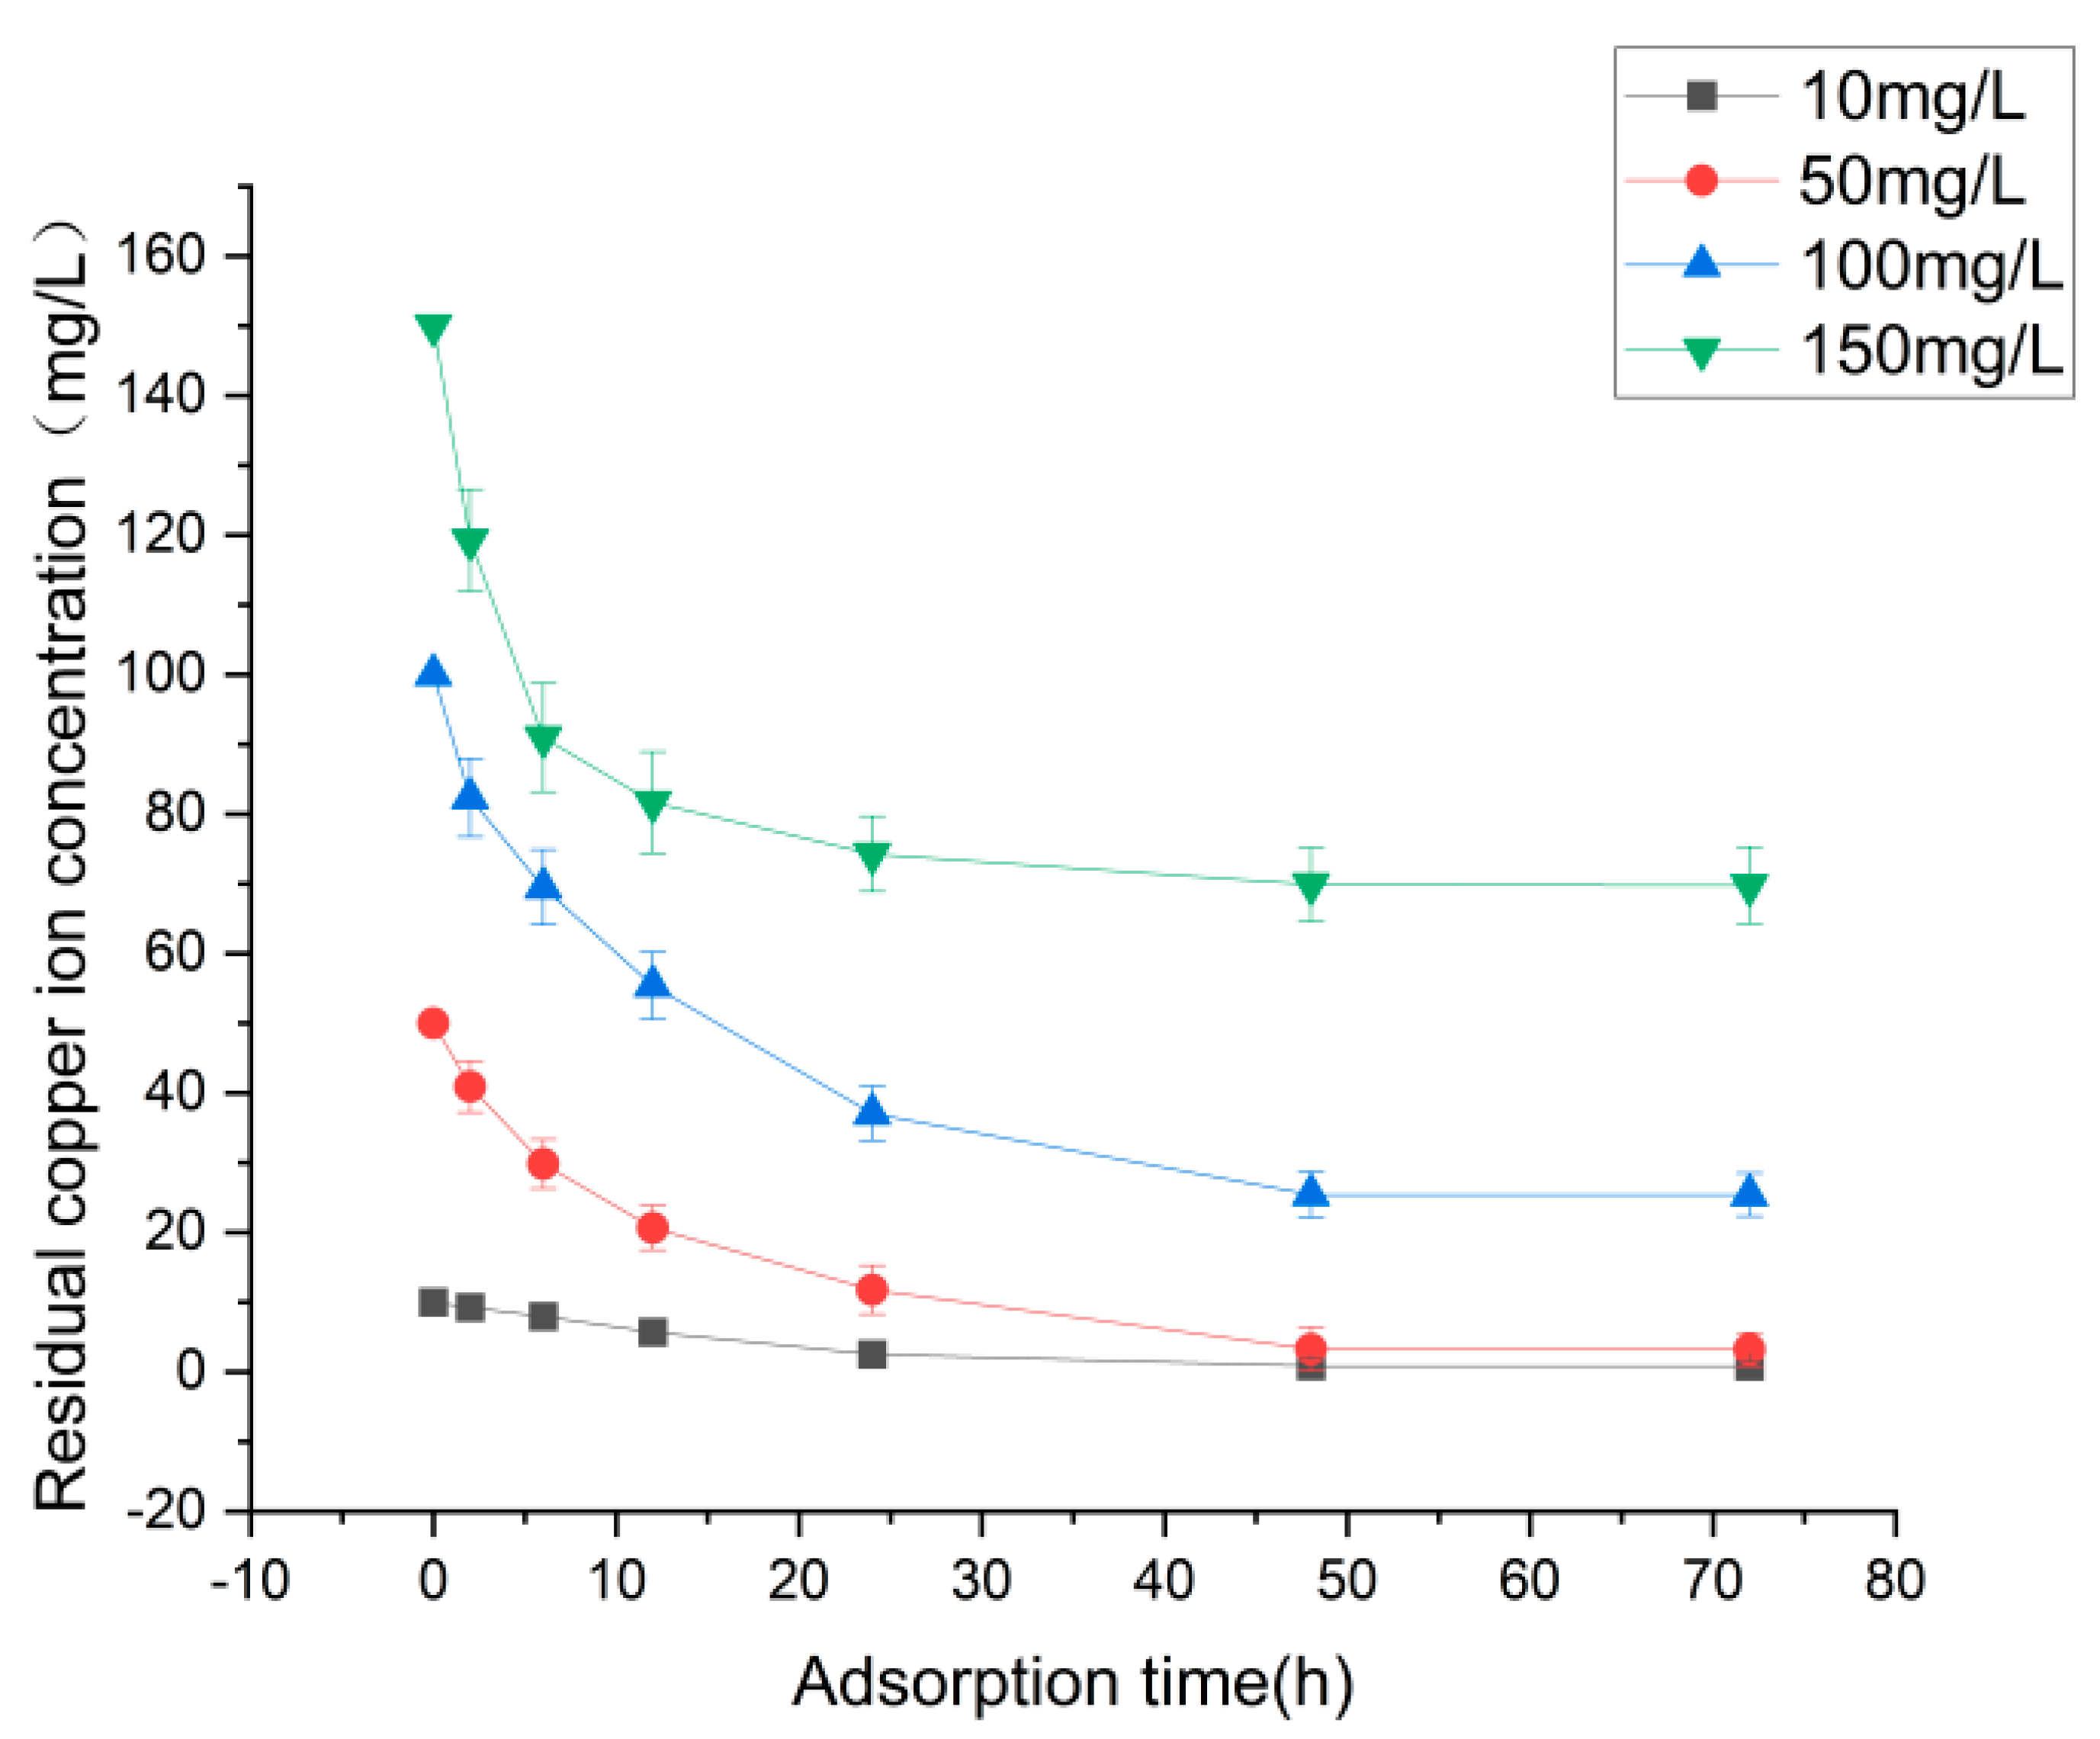
The concentration of the residual copper ion in the supernatant of each sample as a function of adsorption time is shown in Figure 4. The residual copper ion concentration showed a similar trend for different dosage amounts. At the beginning of the adsorption reaction (0–12 h), the residual copper ion concentration decreased significantly with the increasing time; at the middle of the adsorption reaction (12–48 h), the residual copper ion concentration decreased slowly with time; at the end of the adsorption reaction (48–72 h), the adsorption equilibrium state was reached. The reason for this trend could be that the initial adsorption occurs mainly on the surface and in the pores of RSAC particles. In the initial adsorption stage, there are many active sites on the surface and in the pores of RSAC particles so copper ions could occupy the active sites rapidly and show the characteristics of a fast adsorption rate [22]. With the extension of time and the increase of adsorption capacity, the active sites become fewer [23]. It was also found that there were large functional groups on the surface of FA and MFA, such as O-H, C=C, and Si-O-Si, which played a crucial role in the process of adsorption of heavy metal ions [24]. It could be inferred that the adsorption equilibrium time of copper ions on RSAC particles is 48 h. This is consistent with the experimental results to explore the optimal ratio of RSAC particles. Therefore, the adsorption time could be set as 48 h in the subsequent static adsorption experiments.
3.1.2. Effect of Adsorbent Amount
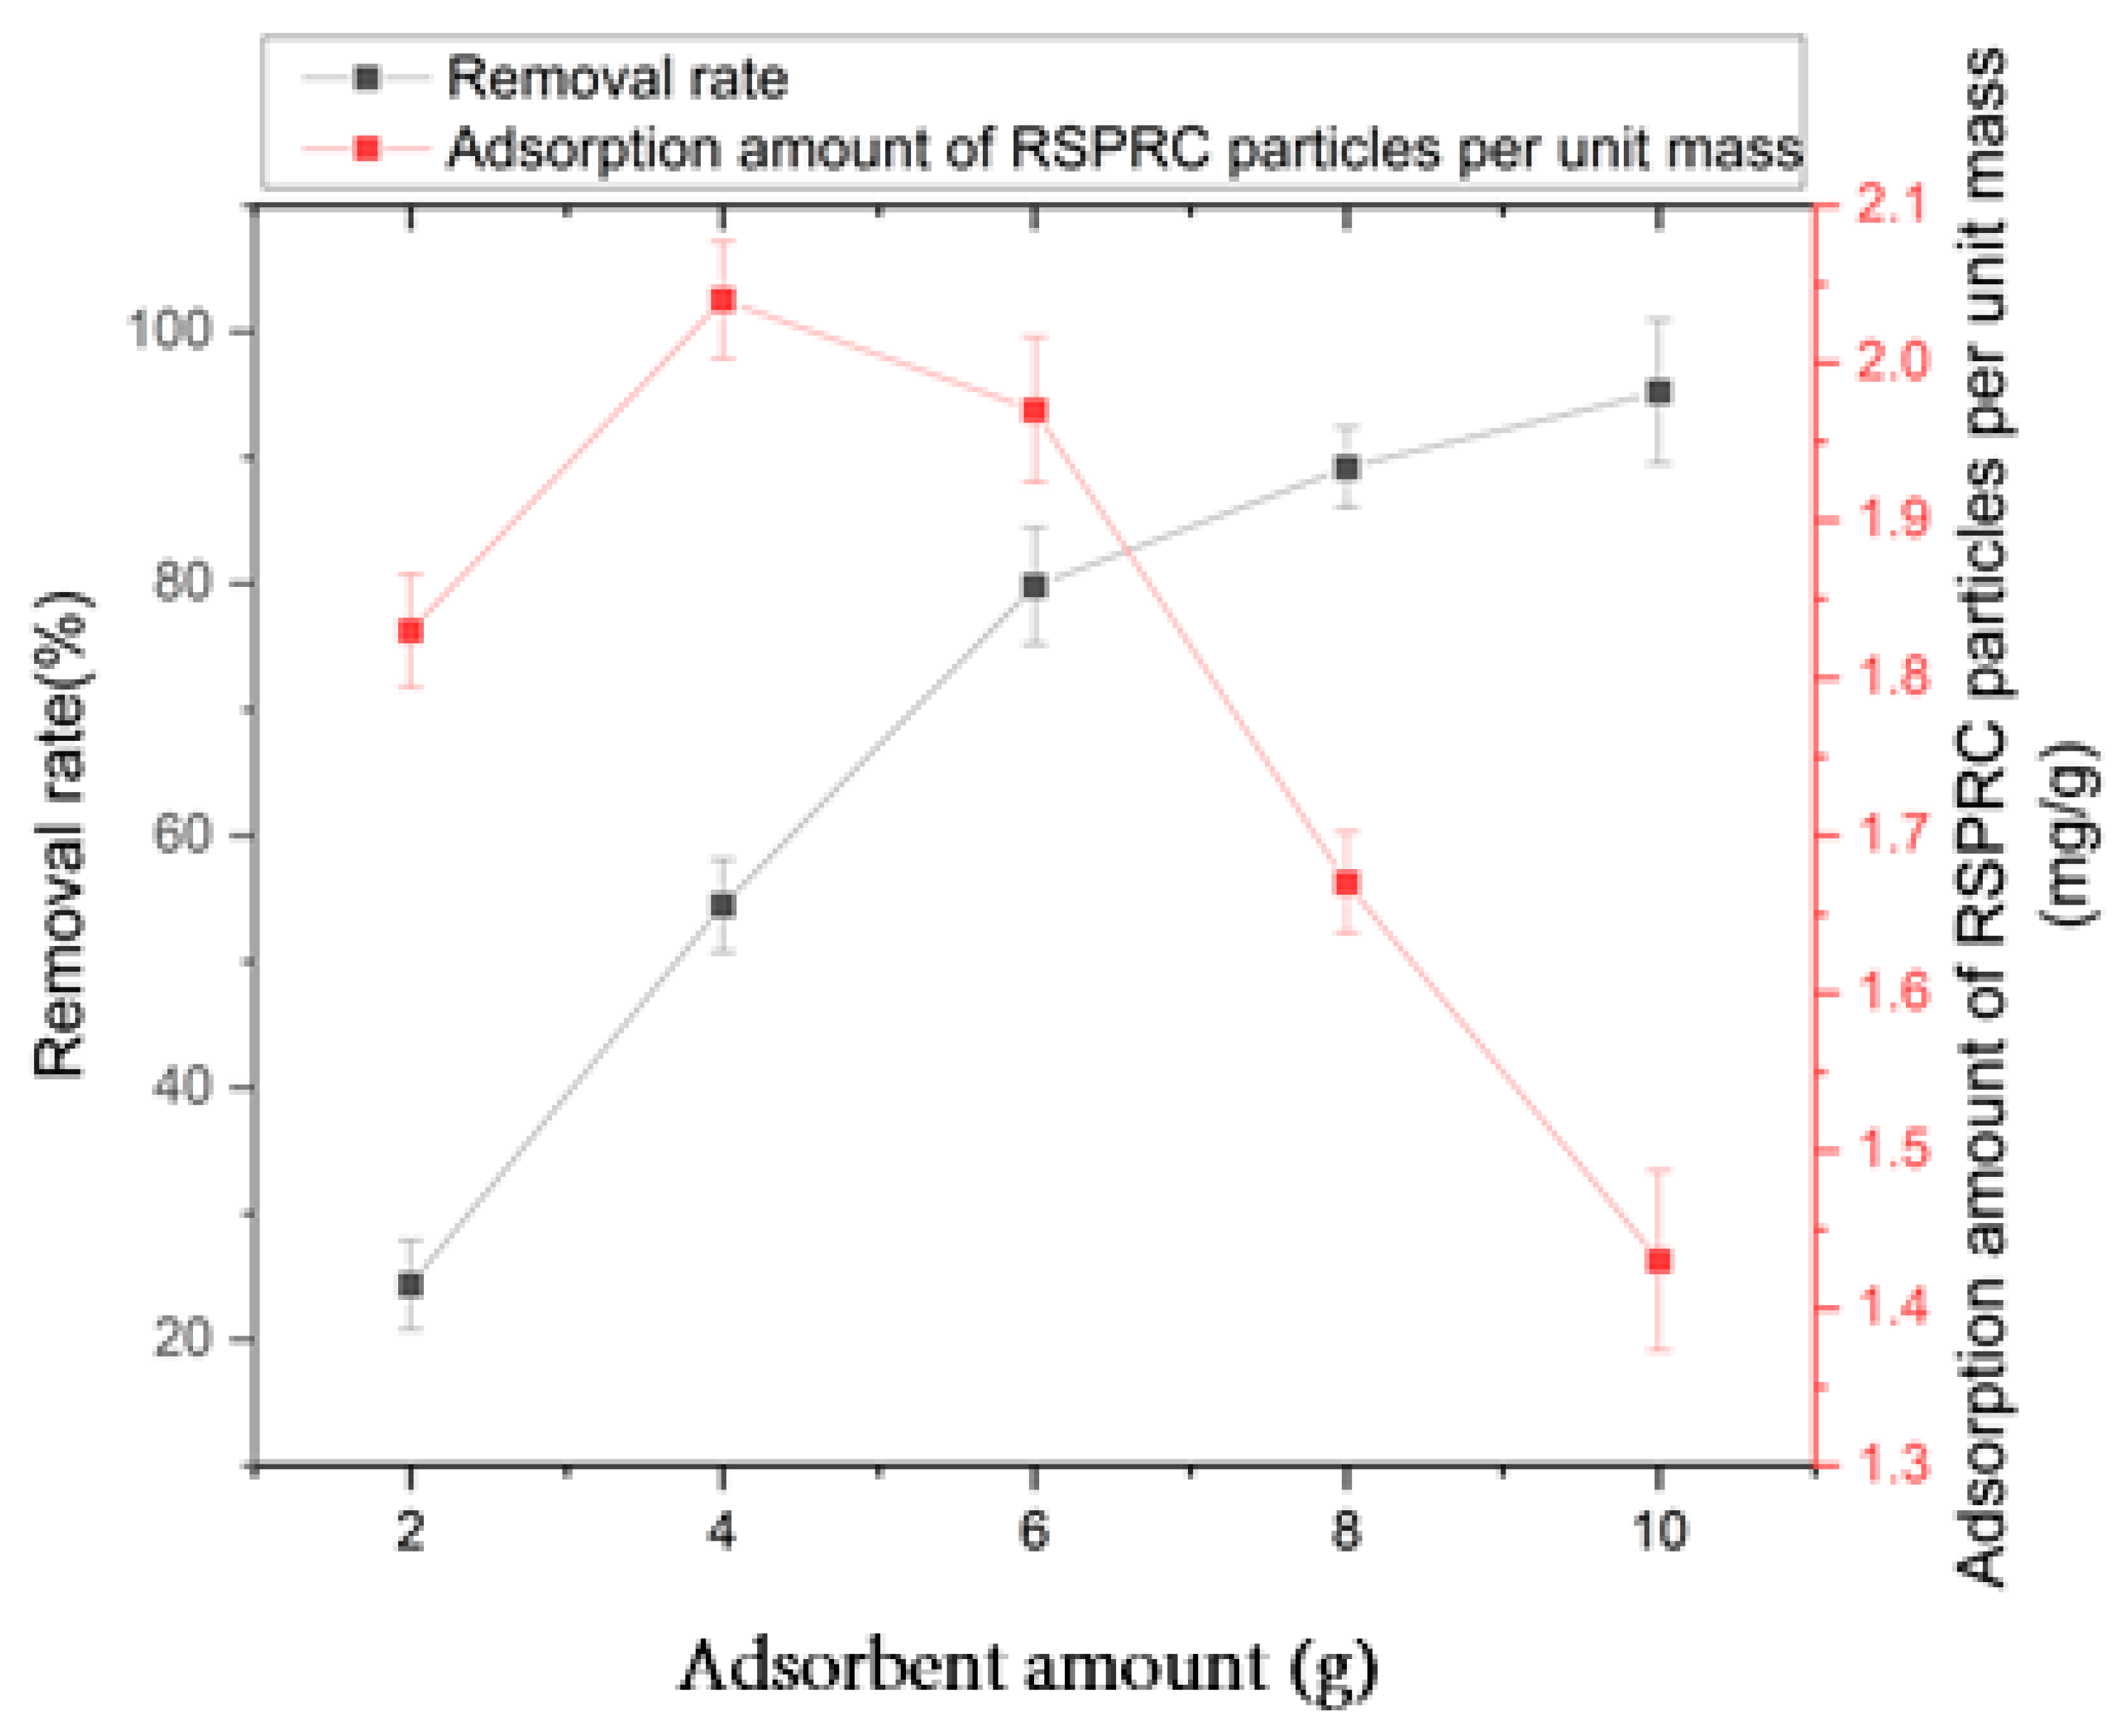
Figure 5 shows the correlation between adsorbent amount and copper ion adsorption. Firstly, the copper ion removal rate increased continuously with the increase of the RSAC particle amount, but the slope decreased at the same time. Meanwhile, the adsorption amount per unit mass of RSAC particles showed a different trend: the adsorption amount per unit mass of RSAC particles increased at the beginning stage and decreased after reaching a specific point with the increase of the adsorbent amount. The two trends indicated that there was a balance point between efficiency and performance. The amount aimed best removal rate may lead to inefficient usage of RSAC particles: the adsorption capacity per mass of RSAC particles was only 1.43 mg/g at 10 g, which indicated that the adsorption performance of RSAC particles was not fully utilized. The reason may be that the copper ion removal rate increased because of the increase of RSPRC particle amount, the increase in contact area, and the increase in the number of adsorption sites [25].
The adsorption amount of copper ions per unit mass of adsorbent showed a different trend. This may be due to the fact that when the concentration of copper ions in the solution is constant and the adsorbent dosage is low, the adsorption sites are not significant in driving the diffusion and adsorption reaction caused by the atmosphere of copper ion concentration. With the increase in the dosage, the total adsorption sites provided to copper ions in the solid-liquid system increased and the adsorption amount per unit mass of RSPRC particles also increased [26]. Considering economic factors, the dosage of 5 g/150 mL was chosen as a balance point and used in the subsequent experiments.
3.1.3. Effect of Initial Concentration
The relationship between the initial concentration and the residual concentration of copper ions is shown in Figure 6. The removal rate of copper ions and the adsorption amount per unit mass of RSAC particles in each sample after adsorption for 72 h is presented in Table 9. As shown in Figure 6, a high initial copper ion concentration led to a corresponding steep adsorption curve and a fast adsorption rate compared with a low initial concentration sample in the pre-sorption stage. This could be attributed to high initial copper ion concentration providing a sufficient driving force for mass transport, which could make ions occupy the active site on adsorbents rapidly, facilitating the adsorption of copper ions by RSAC particles [27,28].
3.1.4. Effect of Coexisting Metal Cations
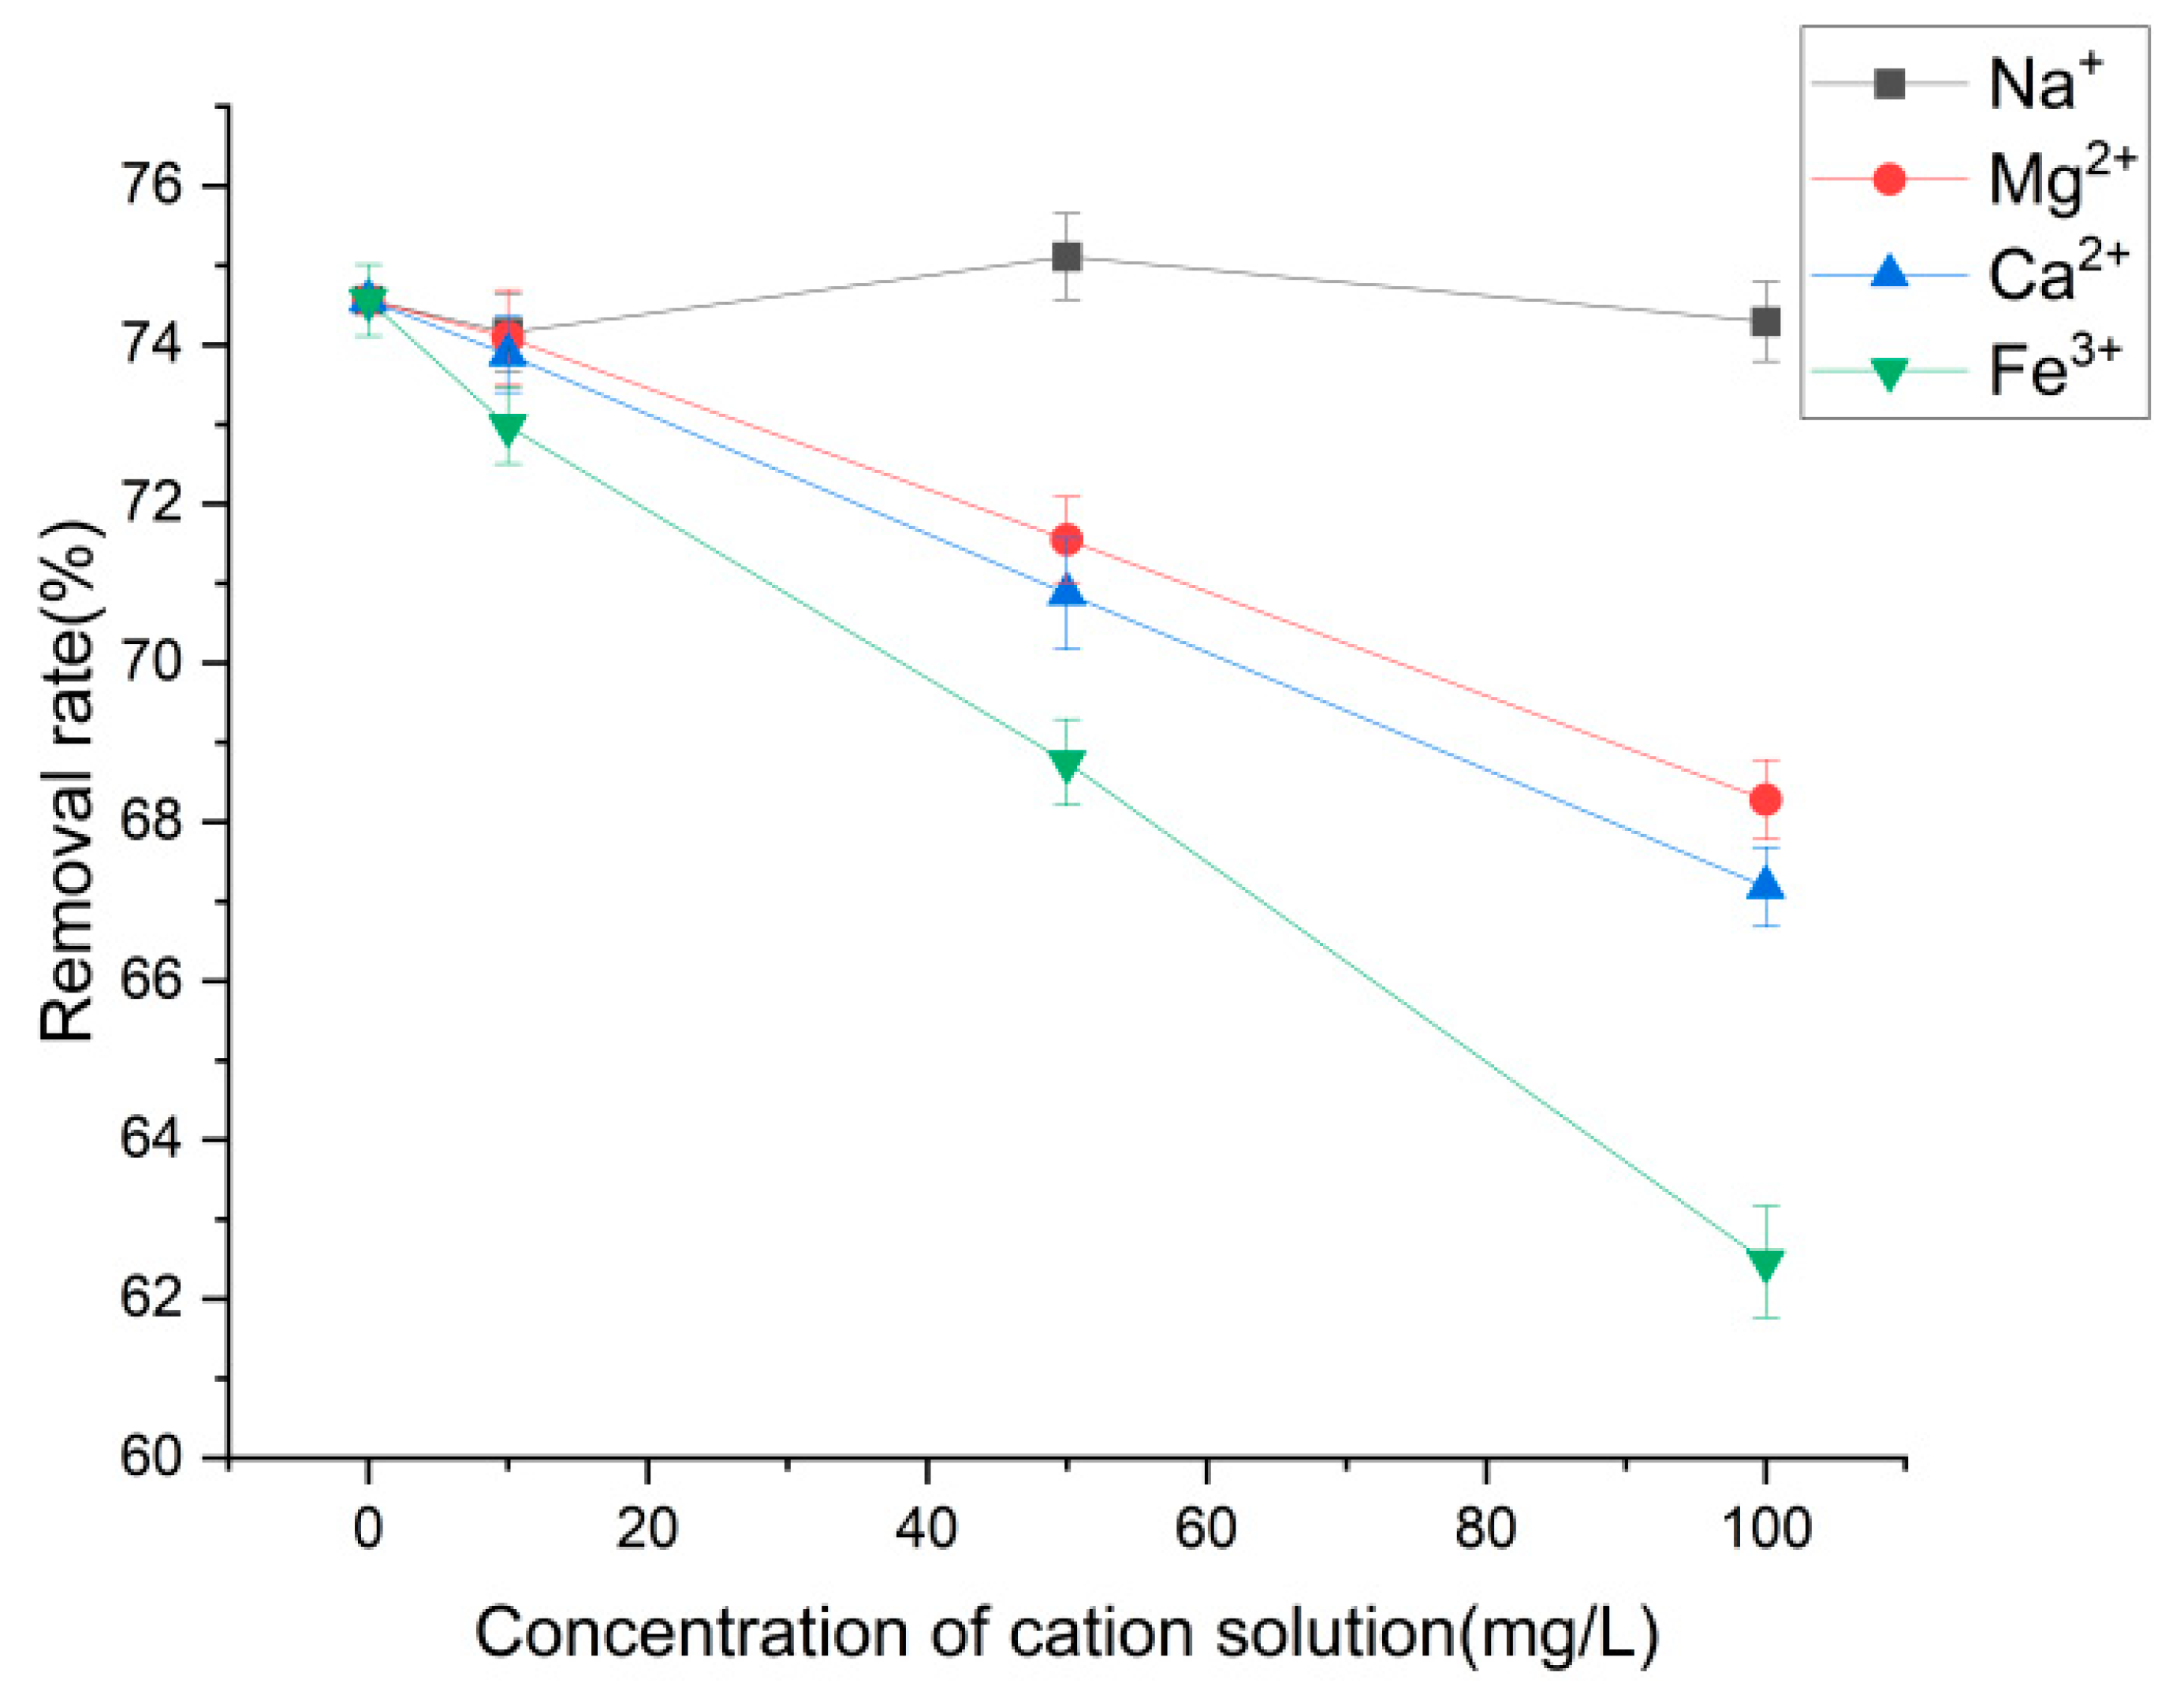
Figure 7 shows the relationship between the metal cation concentration and the effect on the removal of copper ions. The results revealed that the adsorption removal rate of copper ions by RSAC particles fluctuates in a small range with the increase of Na+ concentration, which indicated that Na+ has a weak competitive behavior against RSAC particles. The adsorption removal rate of copper ions by RSAC particles decreases with the increase of Mg2+ and Ca2+ concentration, which indicated that Mg2+ and Ca2+ may have some effect on the removal rate. The adsorption removal rate decreased significantly with the increase of Fe3+ concentration, from 74.65% to 62.47%, which indicated that Fe3+ had a significant inhibitory effect on the adsorption of copper ions.
The experimental results may be interpreted as that metal cations can replace the original cations in the RSAC particles by ion exchange into the adsorbent surface and pore channels, affecting the adsorption of copper ions on the RSAC particles by changing the adsorbent environment [29]. A higher charge number of the metal cation may result in a stronger ability to replace the original cation [30]. Ion exchange and surface adsorption may be involved in the adsorption process of copper [31].
3.1.5. Effect of Ambient Temperature
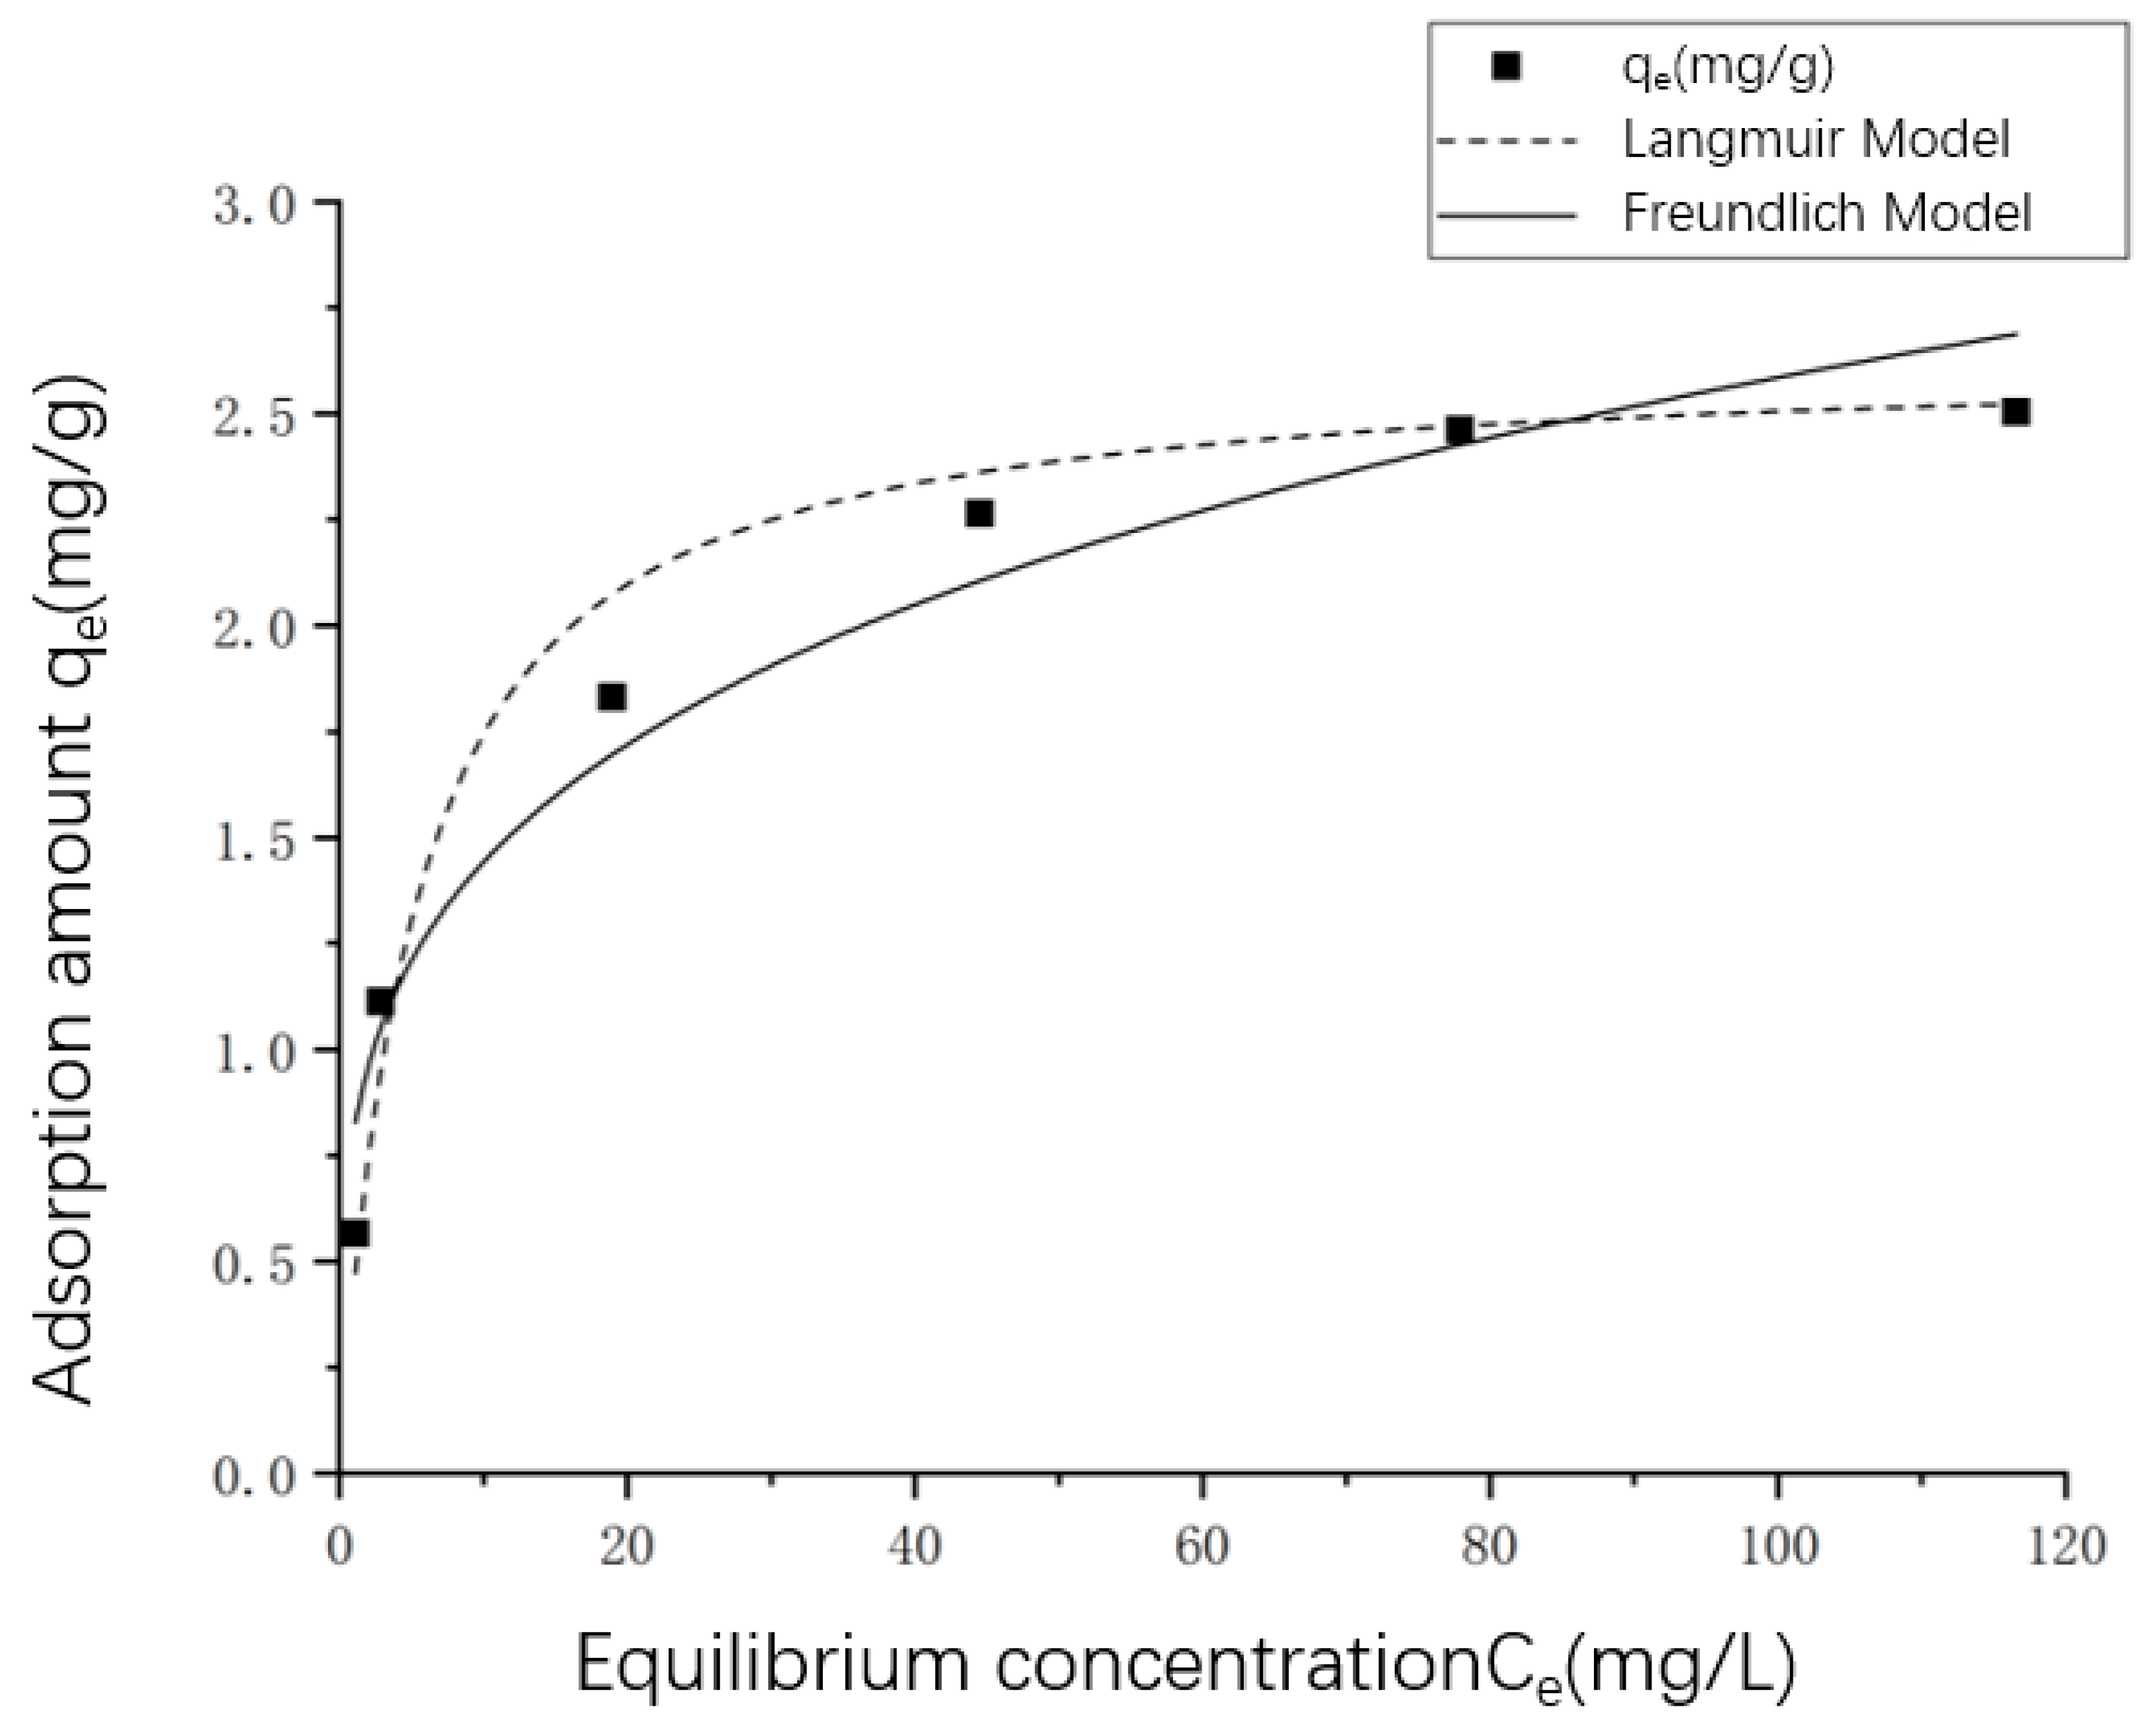
The fitted curves at 25 °C are shown in Figure 8. The fitting parameters can be obtained from the adsorption isotherm. It can be observed from Table 10 that the fit coefficients R2 of both Langmuir and Freundlich models are greater than 0.95 at different temperatures, which indicates that both models could well express the isothermal characteristics of the adsorption of copper ions by RSAC particles. This also implies that the adsorption isotherm characteristics of the adsorbent for copper ions could fit two or more adsorption isotherm models under certain conditions [32]. Based on the Langmuir model, the KL and the qmax which increase as temperature increases indicates that the intermolecular binding and the adsorption capacity may increase as temperature increases. Based on Freunlich model, the low 1/n value indicates that the adsorption process could undertake easily. Meanwhile, the KF which represents the absorbability increases as temperature increases [33]. The two models show that the adsorption of copper ions by RSAC particles is a heat-absorbing process. This could be explained from different aspects. Firstly, the cooper ion needs the energy to approach the RSAC particles and overcome the resistance from the liquid film of the particles to reach the internal active sites. Secondly, the physical adsorption may release heat since the intermolecular force (Van der Waals force) between adsorbates and adsorbents contributed to the main effect during adsorption, which made the molecular kinetic energy decrease by releasing thermal energy [34]. Another study also found that the adsorption process of fly ash involves physical adsorption [35]. In conclusion, chemisorption is an endothermic reaction while physical adsorption is an exothermic reaction, and the adsorbed thermal is more than the released thermal, causing the increase in temperature to promote the adsorption reaction, which is consistent with previous research conclusions [36,37].
3.2. Kinetic Study of Copper Ion Adsorption by RSAC
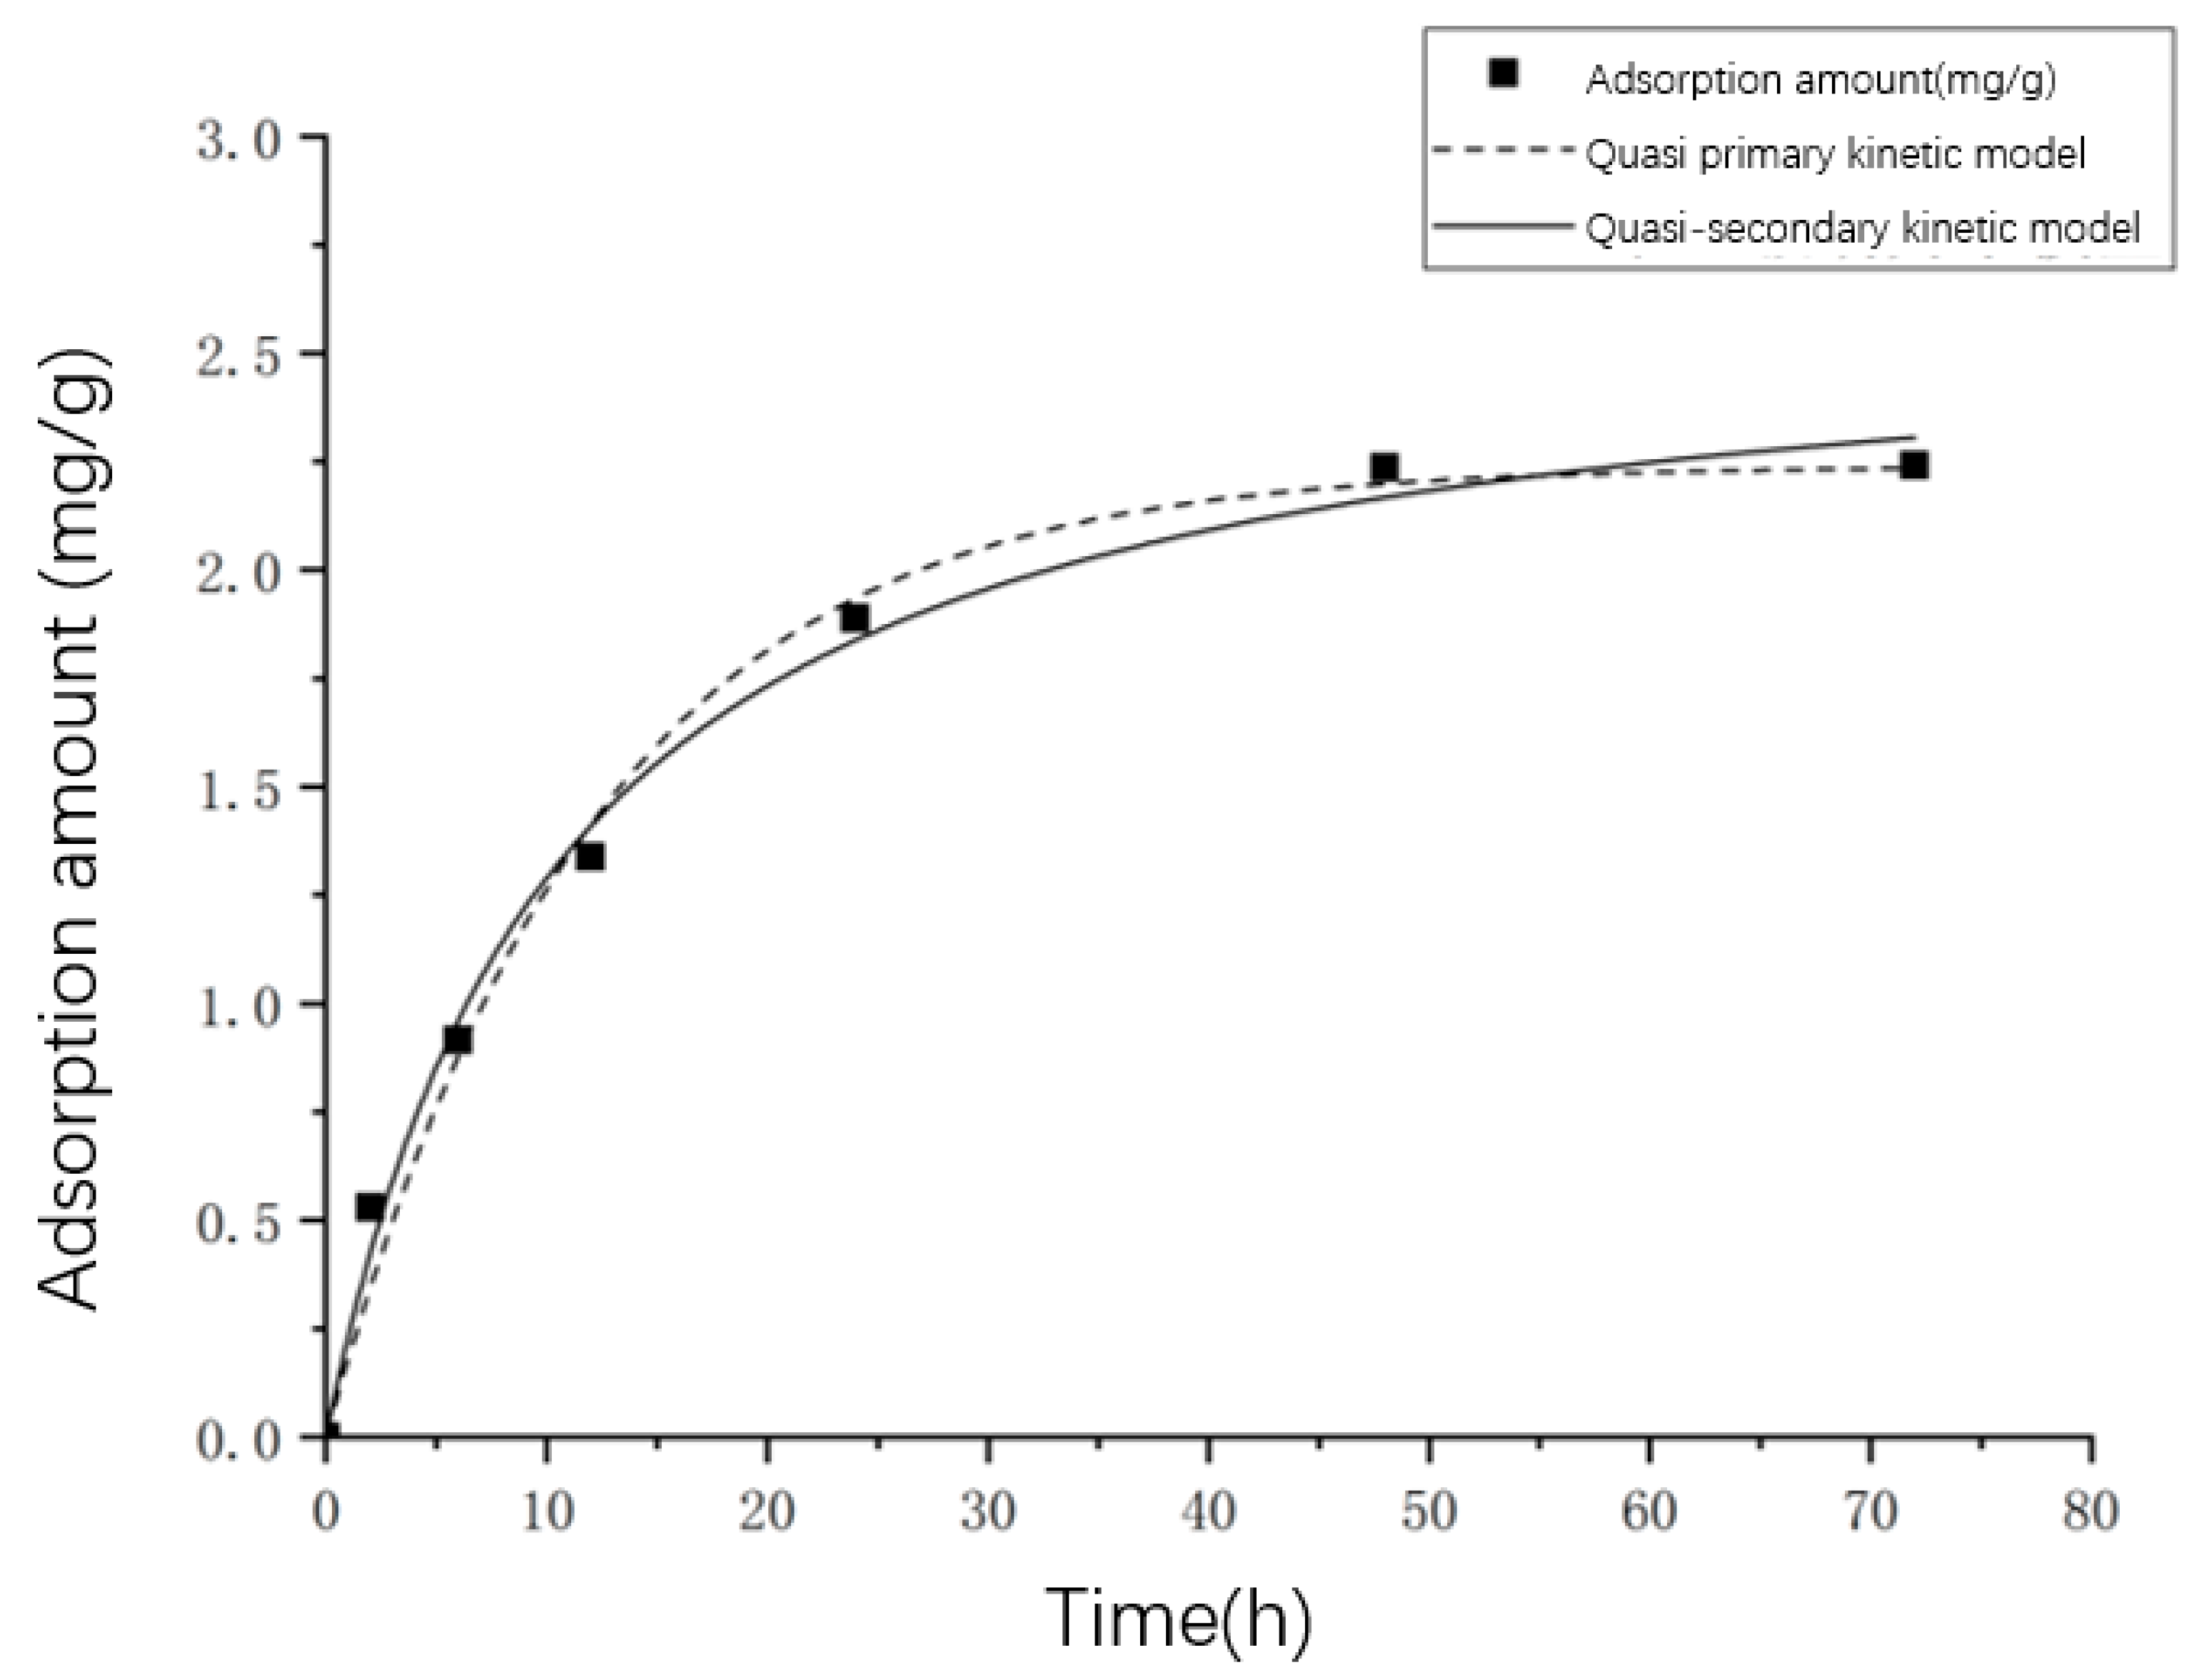
The fitted curves are shown in Figure 9 and the fitted parameters of the two kinetic models are shown in Table 11. As shown in Figure 9, the adsorption amount of copper ions by RSAC particles increases rapidly with the increase of adsorption time in the early stage of the adsorption reaction. The increase of adsorption amount decreases gradually to almost 0 in the middle and the late stage of the adsorption reaction, which means the adsorption reaches the equilibrium state. In the preliminary stage of adsorption reaction, the adsorbent mainly adsorbs copper ions at the solid–liquid interface [38]. After the preliminary stage, copper ions diffuse from the adsorbent surface to the internal micropores and lattice, reach and are fixed by the internal surface active-sites, thus the adsorption rate decreases slowly [39]. Another study found that the adsorption of fly ash involves both boundary-layer diffusion and intraparticle diffusion [11]. Kai-sung Wang et al. also found fast surface adsorption was followed by a slow intra-particle diffusion adsorption of fly ash [40]. The adsorption process of copper ions by RSAC particles can reach the equilibrium state at 48 h.
The R2 of both models is greater than 0.95 and the difference between them is not significant (Table 11), which indicates that both kinetic models could describe the adsorption process of copper ions on RSAC particles well. It could be further inferred that the adsorption process of copper ions on RSAC particles is a mixed control: both surface diffusion and internal fine pore diffusion are important.
3.3. Thermodynamic Study of the Adsorption of Copper Ions by RSAC
As shown in Figure 10, the intercept and the slope of the straight line were calculated by and ; then, we proceeded to calculate the different temperatures of , and Table 12 presents the various thermodynamic parameters obtained. The adsorption free energy of copper ions adsorbed by RSAC particles at different temperatures is negative, and the absolute value of increases gradually with the increase of temperature (Table 12). This indicates that the adsorption of copper ions in solution by RSAC particles is a spontaneous reaction and the spontaneity increases with the increase of temperature [41]. The enthalpy change during the adsorption of copper ions by RSAC particles is positive, which indicates that the adsorption process is a heat absorption reaction and therefore the increase in temperature contributes to the adsorption [42]. As presented in Table 5, the maximum adsorption capacity of copper ions increases with the increasing temperature, which also confirms that the adsorption of copper ions by RSAC particles is a heat absorption reaction.
4. Conclusions
This study aimed to prepare and to apply RSAC to remove copper ions from wastewater and to discuss the influence mechanism and the microstructure for adsorption by RSAC particles. One of the more significant findings to emerge from this study is that the adsorption of copper ions in a solution by RSAC particles is a spontaneous, heat absorption reaction. The mechanism of copper ion removal by RSAC particles includes an ion exchange reaction and chemical precipitation in addition to physical adsorption. The second major finding is that metal cations can replace the original cations in the RSAC particle ion exchange, change the environment of the adsorbent, and affect the adsorption of copper ions on RSAC particles. This study has also indicated that both Langmuir and Freundlich models can well describe the isothermal characteristics of the adsorption of copper ions by RSAC particles. Both the quasi-primary kinetic model and the quasi-secondary kinetic model can describe the adsorption process of copper ions on RSAC particles well. It can be further inferred that the adsorption process of copper ions on RSAC particles is a mixed control, and both surface diffusion and internal fine pore diffusion are important.
Author Contributions
Conceptualization, Y.L.; methodology, Y.L.; software, Y.L. and Q.C.; validation, Y.L. and Q.C.; formal analysis, Q.C.; investigation, Q.C.; resources, Q.C.; data curation, Q.C.; writing—original draft preparation, Q.C. and R.P.S.; writing—review and editing, R.P.S. and Q.C.; visualization, Y.L. and Q.C.; supervision, Y.L. and R.P.S.; project administration, Y.L. All authors have read and agreed to the published version of the manuscript.
Funding
This research received no external funding.
Institutional Review Board Statement
Not applicable.
Informed Consent Statement
Not applicable.
Data Availability Statement
Not applicable.
Acknowledgments
The authors would like to show their gratitude to all those who helped during the experimental period and with the writing of this manuscript. Q.C. would like to gratefully acknowledge the help of Rajendra Prasad Singh, School of Civil Engineering, Southeast University, and appreciate his guidance, patience, encouragement, and professional instructions.
Conflicts of Interest
The authors declare no conflict of interest.
References
- Maryam, H.; Mohammad, H. Application of three-dimensional porous aerogels as adsorbent for removal of heavy metal ions from water/wastewater: A review study. Adv. Colloid Interface Sci. 2020, 284, 102247. [Google Scholar]
- Burakov, A.E.; Galunin, E.V.; Burakova, I.V.; Kucherova, E.A.; Agarwal, S.; Tkachev, A.G.; Gupta, V.K. Adsorption of heavy metals on conventional and nanostructured materials for wastewater treatment purposes: A review. Ecotoxicol. Environ. Saf. 2018, 148, 702–712. [Google Scholar] [CrossRef] [PubMed]
- Chai, W.S.; Cheun, J.Y.; Kumar, P.S.; Mubashir, M.; Zaheed, M.; Banat, F.; Ho, S.; Pau, L.S. A review on conventional and novel materials towards heavy metal adsorption in wastewater treatment application. J. Clean. Prod. 2021, 296, 126589. [Google Scholar] [CrossRef]
- Kumar, A.; Jigyasu, D.K.; Subrahmanyam, G.; Mondal, R.; Shabnam, A.A.; Cabral-Pinto, M.M.; Malyan, S.K.; Chaturvedi, A.K.; Gupta, D.K.; Fagodiya, R.K.; et al. Nickel in terrestrial biota: Comprehensive review on contamination, toxisity, tolerance and its remediation approaches. Chemosphere 2021, 275, 129996. [Google Scholar] [CrossRef]
- Rezaei Kahkha, M.R.; Kaykhaii, M.; Rezaei Kahkha, B.; Khosravi, H.; Tohidlou, E. Simultaneous removal of heavy metals from wastewater using modified sodium montmorillonite nanoclay. Anal. Sci. 2020, 36, 1039–1043. [Google Scholar] [CrossRef] [Green Version]
- Tamjidi, S.; Ameri, A. A review of the application of sea material shells as low cost and effective bio-adsorbent for removal of heavy metals from wastewater. Environ. Sci. Pollut. Res. 2020, 27, 31105–31119. [Google Scholar] [CrossRef]
- Kumar, A.; Gupta, H. Activated carbon from sawdust for naphthalene removal from contaminated water. Environ. Technol. Innov. 2021, 20, 101080. [Google Scholar] [CrossRef]
- Aniagor, C.O.; Elshkankery, M.; Fletcher, A.J.; Morsy, O.M.; Abdel-Halim, E.S.; Hashem, A. Equilibrium and kinetic modelling of aqueous cadmium ion and activated carbon adsorption system. Water Conserv. Sci. Eng. 2021, 6, 3. [Google Scholar] [CrossRef]
- Singh, S.; Kumar, A.; Gupta, H. Activated banana peel carbon: A potential adsorbent for Rhodamine B decontamination from aqueous system. Appl. Water Sci. 2020, 10, 185. [Google Scholar] [CrossRef]
- Gadore, V.; Ahmaruzzaman, M. Tailored fly ash materials: A recent progress of their properties and applications for remediation of organic and inorganic contaminants from water. J. Water Process Eng. 2021, 41, 101910. [Google Scholar] [CrossRef]
- Ansdersson, K.I.; Eriksson, M.; Norgren, M.; Kerstin, I. Andersson. Removal of lignin from wastewater generated by mechanical pulping using activated charcoal and fly ash: Adsorption kinetics. Ind. Eng. Chem. Res. 2011, 50, 7722–7732. [Google Scholar] [CrossRef]
- Dimitrova, S.V. Metal sorption on blast-furnace slag. Water Res. 1996, 30, 228–232. [Google Scholar] [CrossRef]
- Chen, Q.; Wang, H.Q.; Hu, E.M.; Lei, Z.W.; Liu, W.J.; Jiang, X.Y.; Hou, W.; Wang, Q.L. Efficient adsorption of uranium (VI) from aqueous solution by a novel modified steel slag adsorbent. J. Radioanal. Nucl. Chem. 2020, 323, 73–81. [Google Scholar] [CrossRef]
- Meng, B.; Guo, Q.; Men, X.; Ren, S.; Jin, W.; Shen, B. Modified bentonite by polyhedral oligomeric silsesquioxane and quaternary ammonium salt and adsorption characteristics for dye. J. Saudi Chem. Soc. 2020, 24, 334–344. [Google Scholar] [CrossRef]
- Chang, Y.S.; Au, P.I.; Mubarak, N.M.; Khalid, M.; Jagadish, P.; Walvekar, R.; Abdullah, E.C. Adsorption of Cu(II) and Ni(II) ions from wastewater onto bentonite and bentonite/GO composite. Environ. Sci. Pollut. Res. 2020, 27, 33270–33296. [Google Scholar] [CrossRef]
- Pranoto; Martini, T.; Sunardi, B.M.W.; Anandita, P. Optimization of the use of fly ash and natural zeolite activated as composite for an adsorbent of lead heavy metal (Pb). IOP Conf. Ser. Mater. Sci. Eng. 2019, 578, 012022. [Google Scholar] [CrossRef]
- Samarakoon, M.H.; Ranjith, P.G.; Rathnaweera, T.D.; Perera, M.S.A. Recent advances in alkaline cement binders: A review. J. Clean. Prod. 2019, 227, 70–87. [Google Scholar] [CrossRef]
- Zhu, W.; Song, H.; Jia, C.; Yao, S. Fabrication and adsorption property of novel adsorbent for potential application to wastewater with Fe (III) ions. J. Cent. South Univ. 2014, 21, 2832–2836. [Google Scholar] [CrossRef]
- Olusegun, S.J.; de Sousa Lima, L.F.; Mohallem, N.D.S. Enhancement of adsorption capacity of clay through spray drying and surface modification process for wastewater treatment. Chem. Eng. J. 2018, 334, 1719–1728. [Google Scholar] [CrossRef]
- Wang, J.; Guo, X. Adsorption kinetic models: Physical meanings, applications, and solving methods. J. Hazard. Mater. 2020, 390, 122156. [Google Scholar] [CrossRef]
- Zhao, G.; Li, J.; Wang, X. Kinetic and thermodynamic study of 1-naphthol adsorption from aqueous solution to sulfonated graphene nanosheets. Chem. Eng. J. 2011, 173, 185–190. [Google Scholar] [CrossRef]
- Pizarro, J.; Castillo, X.; Jara, S.; Ortiz, C.; Navarro, P.; Cid, H.; Rioseco, H.; Barros, D.; Belzile, N. Adsorption of Cu2+ on coal fly ash modified with functionalized mesoporous silica. Fuel 2015, 156, 96–102. [Google Scholar] [CrossRef]
- Appiah-Hagan, E.; Chen, Y.; Yu, X.; Arteca, G.A.; Pizarro, J.; Mercier, L.; Wei, O.; Belzile, N. Simple and energy-saving modifications of coal fly ash to remove simultaneously six toxic metal cations from mine effluents. J. Environ. Chem. Eng. 2018, 6, 5498–5509. [Google Scholar] [CrossRef]
- Jiang, X.; Fan, W.; Li, C.; Wang, Y.; Bai, J.; Yang, H.; Liu, X. Removal of Cr (VI) from wastewater by a two-step method of oxalic acid reduction-modified fly ash adsorption. RSC Adv. 2019, 9, 33949–33956. [Google Scholar] [CrossRef] [PubMed] [Green Version]
- Li, W.; Zhao, F.; Ma, H.; Li, J.; Han, Q.; Chen, Y. Research on the adsorption treatment of the malachite green simulated wastewater on fallen acer monoes leaves. IOP Conf. Ser. Earth Environ. Sci. 2018, 186, 12010. [Google Scholar] [CrossRef]
- Taylor, M.L.; Morris, G.E.; Self, P.G.; Smart St., R.C. Kinetics of Adsorption of High Molecular Weight Anionic Polyacrylamide onto Kaolinite: The Flocculation Process. J. Colloid Interface Sci. 2002, 250, 28–36. [Google Scholar] [CrossRef]
- Jia, P.; Tan, H.; Liu, K.; Gao, W. Adsorption behavior of methylene blue by bone char. Int. J. Mod. Phys. B 2017, 31, 1744099. [Google Scholar] [CrossRef]
- Li, B.; Ma, C. Study on the mechanism of SO2 Removal by activated carbon. Energy Procedia 2018, 153, 471–487. [Google Scholar] [CrossRef]
- Efome, J.E.; Rana, D.; Matsuura, T.; Lan, C.Q. Effects of operating parameters and coexisting ions on the efficiency of heavy metal ions removal by nano-fibrous metal-organic framework membrane filtration process. Sci. Total Environ. 2019, 674, 355–362. [Google Scholar] [CrossRef]
- Dong, L.; Liang, J.; Li, Y.; Hunang, S.; Wei, Y.; Bai, X.; Jin, Z.; Zhang, M.; Qu, J. Effect of coexisting ions on Cr (VI) adsorption onto surfactant modified Auricularia auricula spent substrate in aqueous solution. Ecotoxicol. Environ. Saf. 2018, 166, 390–400. [Google Scholar] [CrossRef]
- Zheng, W.; Li, X.M.; Yang, Q.; Zeng, G.M.; Shen, X.X.; Zhang, Y.; Liu, J.J. Adsorption of Cd(II) and Cu(II) from aqueous solution by carbonate hydroxylapatite derived from eggshell waste. J. Hazard. Mater. 2007, 147, 534–539. [Google Scholar] [CrossRef] [PubMed]
- Harja, M.; Buema, G.; Lupu, N.; Chiriac, H.; Herea, D.; Ciobanu, G. Fly Ash Coated with Magnetic Materials: Improved Adsorbent for Cu (II) Removal from Wastewater. Materials 2020, 14, 63. [Google Scholar] [CrossRef] [PubMed]
- Zia, Q.; Tabassum, M.; Lu, Z.; Khawar, M.T.; Song, J.; Gong, H.; Meng, J.; Li, Z.; Li, J. Porous poly(L–lactic acid)/chitosan nanofibres for copper ion adsorption. Carbohydr. Polym. 2020, 227, 115343. [Google Scholar] [CrossRef] [PubMed]
- Ahmadifar, Z.; Koohi, A.D. Characterization, preparation, and uses of nanomagnetic Fe3O4 impregnated onto fish scale as more efficient adsorbent for Cu2+ ion adsorption. Environ. Sci. Pollut. Res. 2018, 25, 19687–19700. [Google Scholar] [CrossRef] [PubMed]
- Wang, N.; Zhao, Q.; Xu, H.; Niu, W.; Ma, L.; Lan, D.; Hao, L. Adsorptive treatment of coking wastewater using raw coal fly ash: Adsorption kinetic, thermodynamics and regeneration by Fenton process. Chemosphere 2018, 210, 624–632. [Google Scholar] [CrossRef]
- Li, Y.; Yue, Q.Y.; Gao, B.Y. Adsorption kinetics and desorption of Cu (II) and Zn (II) from aqueous solution onto humic acid. J. Hazard. Mater. 2010, 178, 455–461. [Google Scholar] [CrossRef]
- Hsu, T.C. Experimental assessment of adsorption of Cu2+ and Ni2+ from aqueous solution by oyster shell powder. J. Hazard. Mater. 2009, 171, 995–1000. [Google Scholar] [CrossRef]
- Jung, K.W.; Lee, S.Y.; Choi, J.; Lee, Y.J. A facile one-pot hydrothermal synthesis of hydroxyapatite/biochar nanocomposites: Adsorption behavior and mechanisms for the removal of copper (II) from aqueous media. Chem. Eng. J. 2019, 369, 529–541. [Google Scholar] [CrossRef]
- Huang, Q.; Liu, M.; Zhao, J.; Chen, J.; Zeng, G.; Huang, H.; Tian, J.; Wen, Y.; Zhang, X.; Wei, Y. Facile preparation of polyethylenimine-tannins coated SiO2 hybrid materials for Cu2+ removal. Appl. Surf. Sci. 2018, 427, 535–543. [Google Scholar] [CrossRef]
- Wang, K.; Wei, M.; Peng, T.; Li, H.; Chao, S.; Hsu, T.; Lee, H.; Chang, S. Treatment and toxicity evaluation of methylene blue using electrochemical oxidation, fly ash adsorption and combined electrochemical oxidation-fly ash adsorption. J. Environ. Manag. 2010, 91, 1778–1784. [Google Scholar] [CrossRef]
- Ben-Ali, S.; Jaouali, I.; Souissi-Najar, S.; Ouederni, A. Characterization and adsorption capacity of raw pomegranate peel biosorbent for copper removal. J. Clean. Prod. 2017, 142, 3809–3821. [Google Scholar] [CrossRef]
- Guiza, S. Biosorption of heavy metal from aqueous solution using cellulosic waste orange peel. Ecol. Eng. 2017, 99, 134–140. [Google Scholar] [CrossRef]
Figure 1.
Comparison of adsorption effect of different groups of adsorbents.

Figure 2.
Experimental RSAC pellet fabrication process.

Figure 3.
Copper ion standard curve.

Figure 4.
Effect of adsorption time on the adsorption of copper ions by RSAC particles.

Figure 5.
Effect of adsorbent amount on the adsorption of copper ions by RSAC particles.

Figure 6.
Effect of initial concentration on the adsorption of copper ions by RSAC particles.

Figure 7.
Effect of metal cations on the adsorption of copper ions by RSAC particles.

Figure 8.
Adsorption isotherm of copper ions (25 °C).

Figure 9.
Adsorption kinetic curve of copper ions (25 °C).

Figure 10.
Relationship between lnK0 − 1/T for the process of copper ion adsorption by RSAC particles.
Figure 10.
Relationship between lnK0 − 1/T for the process of copper ion adsorption by RSAC particles.


Table 1.
Physical properties of waste substrates.
| Waste Substrates | Density (g/cm3) | Specific Surface Area (m2/g) | Particle Size (μm) | Color |
|---|---|---|---|---|
| Fly ash | 2.91 | 580 | 150 or more | Grey |
| Steel slag | 2.10 | 3653 | 210 or more | Brown |
Table 2.
Particle size distribution of waste substrates.
| Fly ash particle size (μm) | >3350 | 3350~880 | 880~325 | 325~212 | <212 |
| Proportion (%) | 7.45 | 12.76 | 42.93 | 23.55 | 11.87 |
| Steel slag particle size (μm) | >1400 | 1400~180 | 180~45 | <45 | - |
| Proportion (%) | 2.49 | 7.68 | 32.40 | 57.36 | - |
Table 3.
Chemical composition of waste substrates (%).
| Chemical Composition | Fly Ash | Steel Slag |
|---|---|---|
| CaO | 1.31 | 55.0 |
| Fe2O3 | 4.39 | 21.5 |
| Al2O3 | 45.9 | 1.51 |
| SiO2 | 44.4 | 13.4 |
| MgO | 0.261 | 3.65 |
| MnO | 0.026 | 1.75 |
| SO3 | 0.666 | 0.512 |
| V2O5 | 0.038 | 0.417 |
| TiO2 | 1.26 | 0.296 |
| Na2O | 0.094 | 0.077 |
| ZnO | 0.021 | - |
| CuO | 0.02 | - |
Table 4.
Physical properties of activated white clay.
| Ingredients | Density (g/cm3) | Particle Size (Through 75 μm Sieve) | Moisture (%) | Free Acid (as H2SO4) | Color |
|---|---|---|---|---|---|
| Activated white clay | 0.7–1.1 | ≥95% | 12 | ≤0.2% | pale |
Table 5.
Chemical composition of activated white clay.
| SiO2 | Al2O3 | MgO | Fe2O3 | |
|---|---|---|---|---|
| Content (%) | 50–70 | 10–16 | 1–6 | 2–4 |
Table 6.
Ratio of base material to binder for different groups (%).
| Groups | Fly Ash | Steel Slag | Activated White Clay | Bonding Agent |
|---|---|---|---|---|
| Group I | 65 | 15 | 10 | 10 |
| Group II | 70 | 10 | 10 | 10 |
| Group III | 65 | 10 | 15 | 10 |
| Group IV | 60 | 10 | 20 | 10 |
Table 7.
Copper ion removal by different groups of adsorbents.
| Groups | Initial Copper Ion Concentration (mg/L) | Residual Copper Ion Concentration (mg/L) | Removal Rate (%) |
|---|---|---|---|
| Group I | 100 | 28.92 | 71.08 |
| Group II | 100 | 31.04 | 69.96 |
| Group III | 100 | 25.54 | 74.46 |
| Group IV | 100 | 18.48 | 81.52 |
Table 8.
Measurement results for the standard series.
| Absorbance A | 0.019 | 0.020 | 0.374 | 0.563 | 0.751 |
|---|---|---|---|---|---|
| Copper ion concentration (mg/L) | 0 | 2 | 4 | 6 | 8 |
Table 9.
Copper ion removal for different initial concentrations.
| Initial Concentration (mg/L) | Removal Rate (%) | Adsorption of RSAC Particles per Unit Mass (mg/g) |
|---|---|---|
| 10 | 91.90 | 0.28 |
| 50 | 93.58 | 1.40 |
| 100 | 74.61 | 2.24 |
| 150 | 53.50 | 2.41 |
Table 10.
Parameters for the adsorption isotherm model fit.
| Temp. (°C) | Langmuir Model | Freundlich Model | ||||
|---|---|---|---|---|---|---|
| KL | qmax | RL2 | KF | 1/n | RF2 | |
| 15 | 0.138 | 2.438 | 0.974 | 0.737 | 0.248 | 0.960 |
| 25 | 0.196 | 2.633 | 0.967 | 0.805 | 0.253 | 0.952 |
| 35 | 0.254 | 2.862 | 0.954 | 0.874 | 0.262 | 0.956 |
Table 11.
Sorption kinetic model fitting parameters.
| Initial Concentration (mg/L) | Quasi-One Dynamical Model | Quasi-Secondary Dynamical Model (QSDM) | ||||
|---|---|---|---|---|---|---|
| qe | k1 | R12 | qe | k2 | R22 | |
| 100 | 2.241 | 0.0713 | 0.990 | 2.640 | 0.0955 | 0.993 |
Table 12.
Thermodynamic parameters of copper ion adsorption on RSAC particles.
| Temp. (K) | qmax (mmol/g) | KL × 10−3 (L/mol) | (kJ/mol) | (kJ/mol) | (J/mol-K) | R2 |
|---|---|---|---|---|---|---|
| 288.15 | 0.0381 | 8.832 | −21.79 | 22.55 | 153.89 | 0.9955 |
| 298.15 | 0.0411 | 12.544 | −23.33 | |||
| 308.15 | 0.0447 | 16.256 | −24.87 |
Publisher’s Note: MDPI stays neutral with regard to jurisdictional claims in published maps and institutional affiliations. |
© 2022 by the authors. Licensee MDPI, Basel, Switzerland. This article is an open access article distributed under the terms and conditions of the Creative Commons Attribution (CC BY) license (https://creativecommons.org/licenses/by/4.0/).
Share and Cite
MDPI and ACS Style
Liu, Y.; Chen, Q.; Singh, R.P. Low-Cost RSAC and Adsorption Characteristics in the Removal of Copper Ions from Wastewater. Appl. Sci. 2022, 12, 5612. https://0-doi-org.brum.beds.ac.uk/10.3390/app12115612
AMA Style
Liu Y, Chen Q, Singh RP. Low-Cost RSAC and Adsorption Characteristics in the Removal of Copper Ions from Wastewater. Applied Sciences. 2022; 12(11):5612. https://0-doi-org.brum.beds.ac.uk/10.3390/app12115612
Chicago/Turabian StyleLiu, Yan, Qin Chen, and Rajendra Prasad Singh. 2022. "Low-Cost RSAC and Adsorption Characteristics in the Removal of Copper Ions from Wastewater" Applied Sciences 12, no. 11: 5612. https://0-doi-org.brum.beds.ac.uk/10.3390/app12115612
Note that from the first issue of 2016, this journal uses article numbers instead of page numbers. See further details here.