
Numerical Analysis of the Factors Influencing the Erosion of the Valve Port of a High-Speed On/Off Valve

1
School of Mechanical Engineering and Automation, Fuzhou University, Fuzhou 350108, China
2
Key Laboratory of Fluid Power and Intelligent Electro-Hydraulic Control, School of Mechanical Engineering and Automation, Fuzhou University, Fuzhou 350108, China
*
Author to whom correspondence should be addressed.
Appl. Sci. 2022, 12(12), 6212; https://0-doi-org.brum.beds.ac.uk/10.3390/app12126212
Submission received: 29 April 2022
/
Revised: 10 June 2022
/
Accepted: 16 June 2022
/
Published: 18 June 2022
(This article belongs to the Special Issue Recent Advances in Flow Control)
Abstract
:Aiming at the problem of valve port erosion caused by contaminated particles, a three-dimensional prediction model of valve orifice erosion was established based on computational fluid dynamics (CFD) and erosion theory, considering the influence of the valve port eddy current on the oil flow. The discrete phase model (DPM) of fluent is used to obtain the orifice erosion location and erosion rate, and the causes of erosion of the high-speed on/off valve are analyzed. On this basis, several factors influencing valve port erosion are simulated to investigate the relationship between particle collision behavior and valve port erosion morphology under different factors, and the change rule of valve port erosion under different factors is analyzed. The results show that the high-speed on/off valve service life decreases with a larger cone angle of the spool, a larger pressure difference at the valve port, a larger proportion of large particle contaminants in the oil, a higher oil contamination level, and a larger filter aperture. In addition, the grey relational analysis method is used to clarify the pressure difference at the valve port, the particle size, and the filter aperture as the three most important factors affecting the erosion of the valve port of a high-speed on/off valve.
1. Introduction
As an important control element in digital hydraulic systems, high-speed on/off valves are widely used in the energy, chemical, aerospace, and automotive fields due to their simple structure, fast response, and low cost. However, in practice, contaminated particles, such as metal filings and dust in the oil fluid, will hit the wall with high kinetic energy driven by the fluid medium, resulting in erosion at the valve port of the high-speed on/off valve, which severely affects the control accuracy and service life of the high-speed on/off valve.
Numerous studies have been carried out to address the problem of valve orifice erosion caused by contaminated particles. Askari, A. et al. [1] found that with increases in the particle diameter of 25%, 50%, and 75% in the open state of the ball valve, the rate of erosion is increased. On the contrary, the opposite rule governs in a completely open state of the ball valve. Wallace, M. S. et al. [2] used a developed empirical equation for mass removal to examine erosion in choke valve components for aqueous slurry flows. While flow characteristics and erosion locations were identified satisfactorily, erosion rates were seriously underestimated. Yin Yaobao et al. [3] established a two-dimensional slide valve model and solved the trajectory of particles based on a stochastic separated flow model, and then obtained the wear profile using the time-discrete and spatial-discrete update methods. Kun Zhang et al. [4] analyzed the erosion wear of electro-hydraulic servo valves under different contaminated fluid conditions and explored the variation law of servo valve pressure gain and zero leakage with the erosion wear of the valve port. Based on the erosion theory, a mathematical model and a simulation model of the erosion wear of the servo valve of the jet pipe were established [5,6], obtaining the simulated predicted life and the theoretically calculated life of the jet pipe servo valve. Liu Xinqiang et al. [7] established a two-dimensional cone valve model, then performed the numerical calculation of solid–liquid two-phase flow using the DPM model, and analyzed the causes of erosion at the valve port.
Some scholars have used the two-dimensional model to simulate valve orifice erosion and have obtained good simulation results, which proved the feasibility and accuracy of numerical simulation in erosion prediction. However, due to the characteristics of the high-speed jet and the special orifice structure of the high-speed on/off valve, large-scale fluid vortices are easily generated at the valve orifice. The fluid vortices not only affect the flow state of the fluid near the vortices but also cause changes in the flow of the fluid at other locations of the valve orifice due to the vortex effect, which aggravates the erosion at the valve orifice. The two-dimensional model is not applicable, and a three-dimensional model was employed to simulate the effect of fluid vortices on the orifice erosion of high-speed on/off valves in this study.
In addition, at this stage, there have been few studies on the effects of changes in the internal flow field and particle motion caused by changes in different factors on valve port erosion. Therefore, the orifice erosion locations and erosion rates were obtained for different orifice erosion-influencing factors in this topic to reveal the relationship between particle collision behavior and orifice erosion morphology and provide a reference for the optimization design of high-speed on/off valves against erosion by investigating the changes in orifice erosion under different factors.
2. CFD Prediction Model for High-Speed On/Off Valve Orifice Erosion
2.1. High-Speed On/Off Valve Flow Field Simulation
The high-speed on/off valve studied was driven by PWM, the valve opening was only fully open or fully closed, and the process of spool opening and closing took a very short time. When the high-speed on/off valve is in the fully open state, the particle erosion wear is maximal. Therefore, the simulation conditions of fixed opening and steady-state were adopted to study the erosion law of particles on the valve orifice when the high-speed on/off valve is in the fully open state. Assuming that the volume of oil is incompressible, the equations of continuity and conservation of momentum for the flow of oil in the valve cavity under the conditions of constant flow and incompressibility are
where represents the Hamiltonian counters, is the oil pressure, and is the mass forces acting on the fluid micelles.
The turbulent flow of fluid in a high-speed on/off valve is described using the standard k-ε model:
where represents the enthalpy flow energy term produced by the average velocity gradient; and are the constants, and their values are 1.44 and 1.92, respectively; is the turbulence Prandtl number of the equation, taken as 1.0; is the turbulence Prandtl number of the equation, taken as 1.3 [8]. and are source items, and they are defined in Equation (6).
2.2. Particle–Fluid Interactions
The general hydraulic system is equipped with filters, and the volume percentage of contaminated particles in the filtered hydraulic fluid is much less than 10%, which can be regarded as a dilute medium. Therefore, the DPM model was used to track the trajectory of particles in this study.
The DPM model uses the Lagrangian method to track the trajectory of the particles. Firstly, the magnitude and direction of the acceleration of the particles were obtained by monitoring the force of the particles; then the displacement of the particles at each time interval was calculated, and finally, the displacements of the particles at each time interval were connected by integration. Thus, the trajectory of contaminated particles throughout the fluid domain of the high-speed on/off valve was obtained.
Particles in the flow field are mainly subject to the action of forces, such as traction and pressure gradient forces, and the equation of motion of a single polluted particle is
where is the steady drag force, are the forces due to gravity, is the pressure-gradient force, is the lift force, and is the virtual mass force, is the drag coefficient, which was introduced in detail by Clift [9], and is the relative Reynolds number. For general hydraulic systems, lift forces and virtual mass forces are negligible [10,11,12].
2.2.1. Particle Dissipation in Turbulent Flows
Powerful velocity pulsations generated by turbulent flow have a significant impact on the trajectory of the particles. Therefore, the discrete random walk (DRW) model [13] was introduced to simulate the effect of fluid turbulence on particle trajectories when particle trajectory tracking was performed. The DRW model tracks the trajectory of contaminated particles by considering the transient velocity caused by fluid velocity pulsation. The instantaneous velocity of the fluid is expressed as
2.2.2. Bidirectional Coupling of the Continuous Phase and Discrete Phase
The bidirectional coupling of continuous and discrete phases is considered in fluent when calculating the erosion. The influence of the fluid medium on the contaminated particles is mainly reflected by changing the traction on the particles and the turbulence affecting the particle motion, while the influence of the particles on the fluid mainly affects the momentum and turbulence energy of the continuous phase by adding source terms to the momentum and turbulence equations.
- (1)
- Momentum coupling
The momentum exchange of the fluid medium to the particles was obtained by calculating the change in the momentum of the particles as they pass through each control body [14]:
- (2)
- Turbulent coupling
2.3. Particle–Wall Interactions
During the impact of the particles on the wall, energy loss occurs and the velocity decreases. Therefore, the Grant [17] particle–wall collision rebound model was introduced to simulate the change of particle velocity before and after the collision:
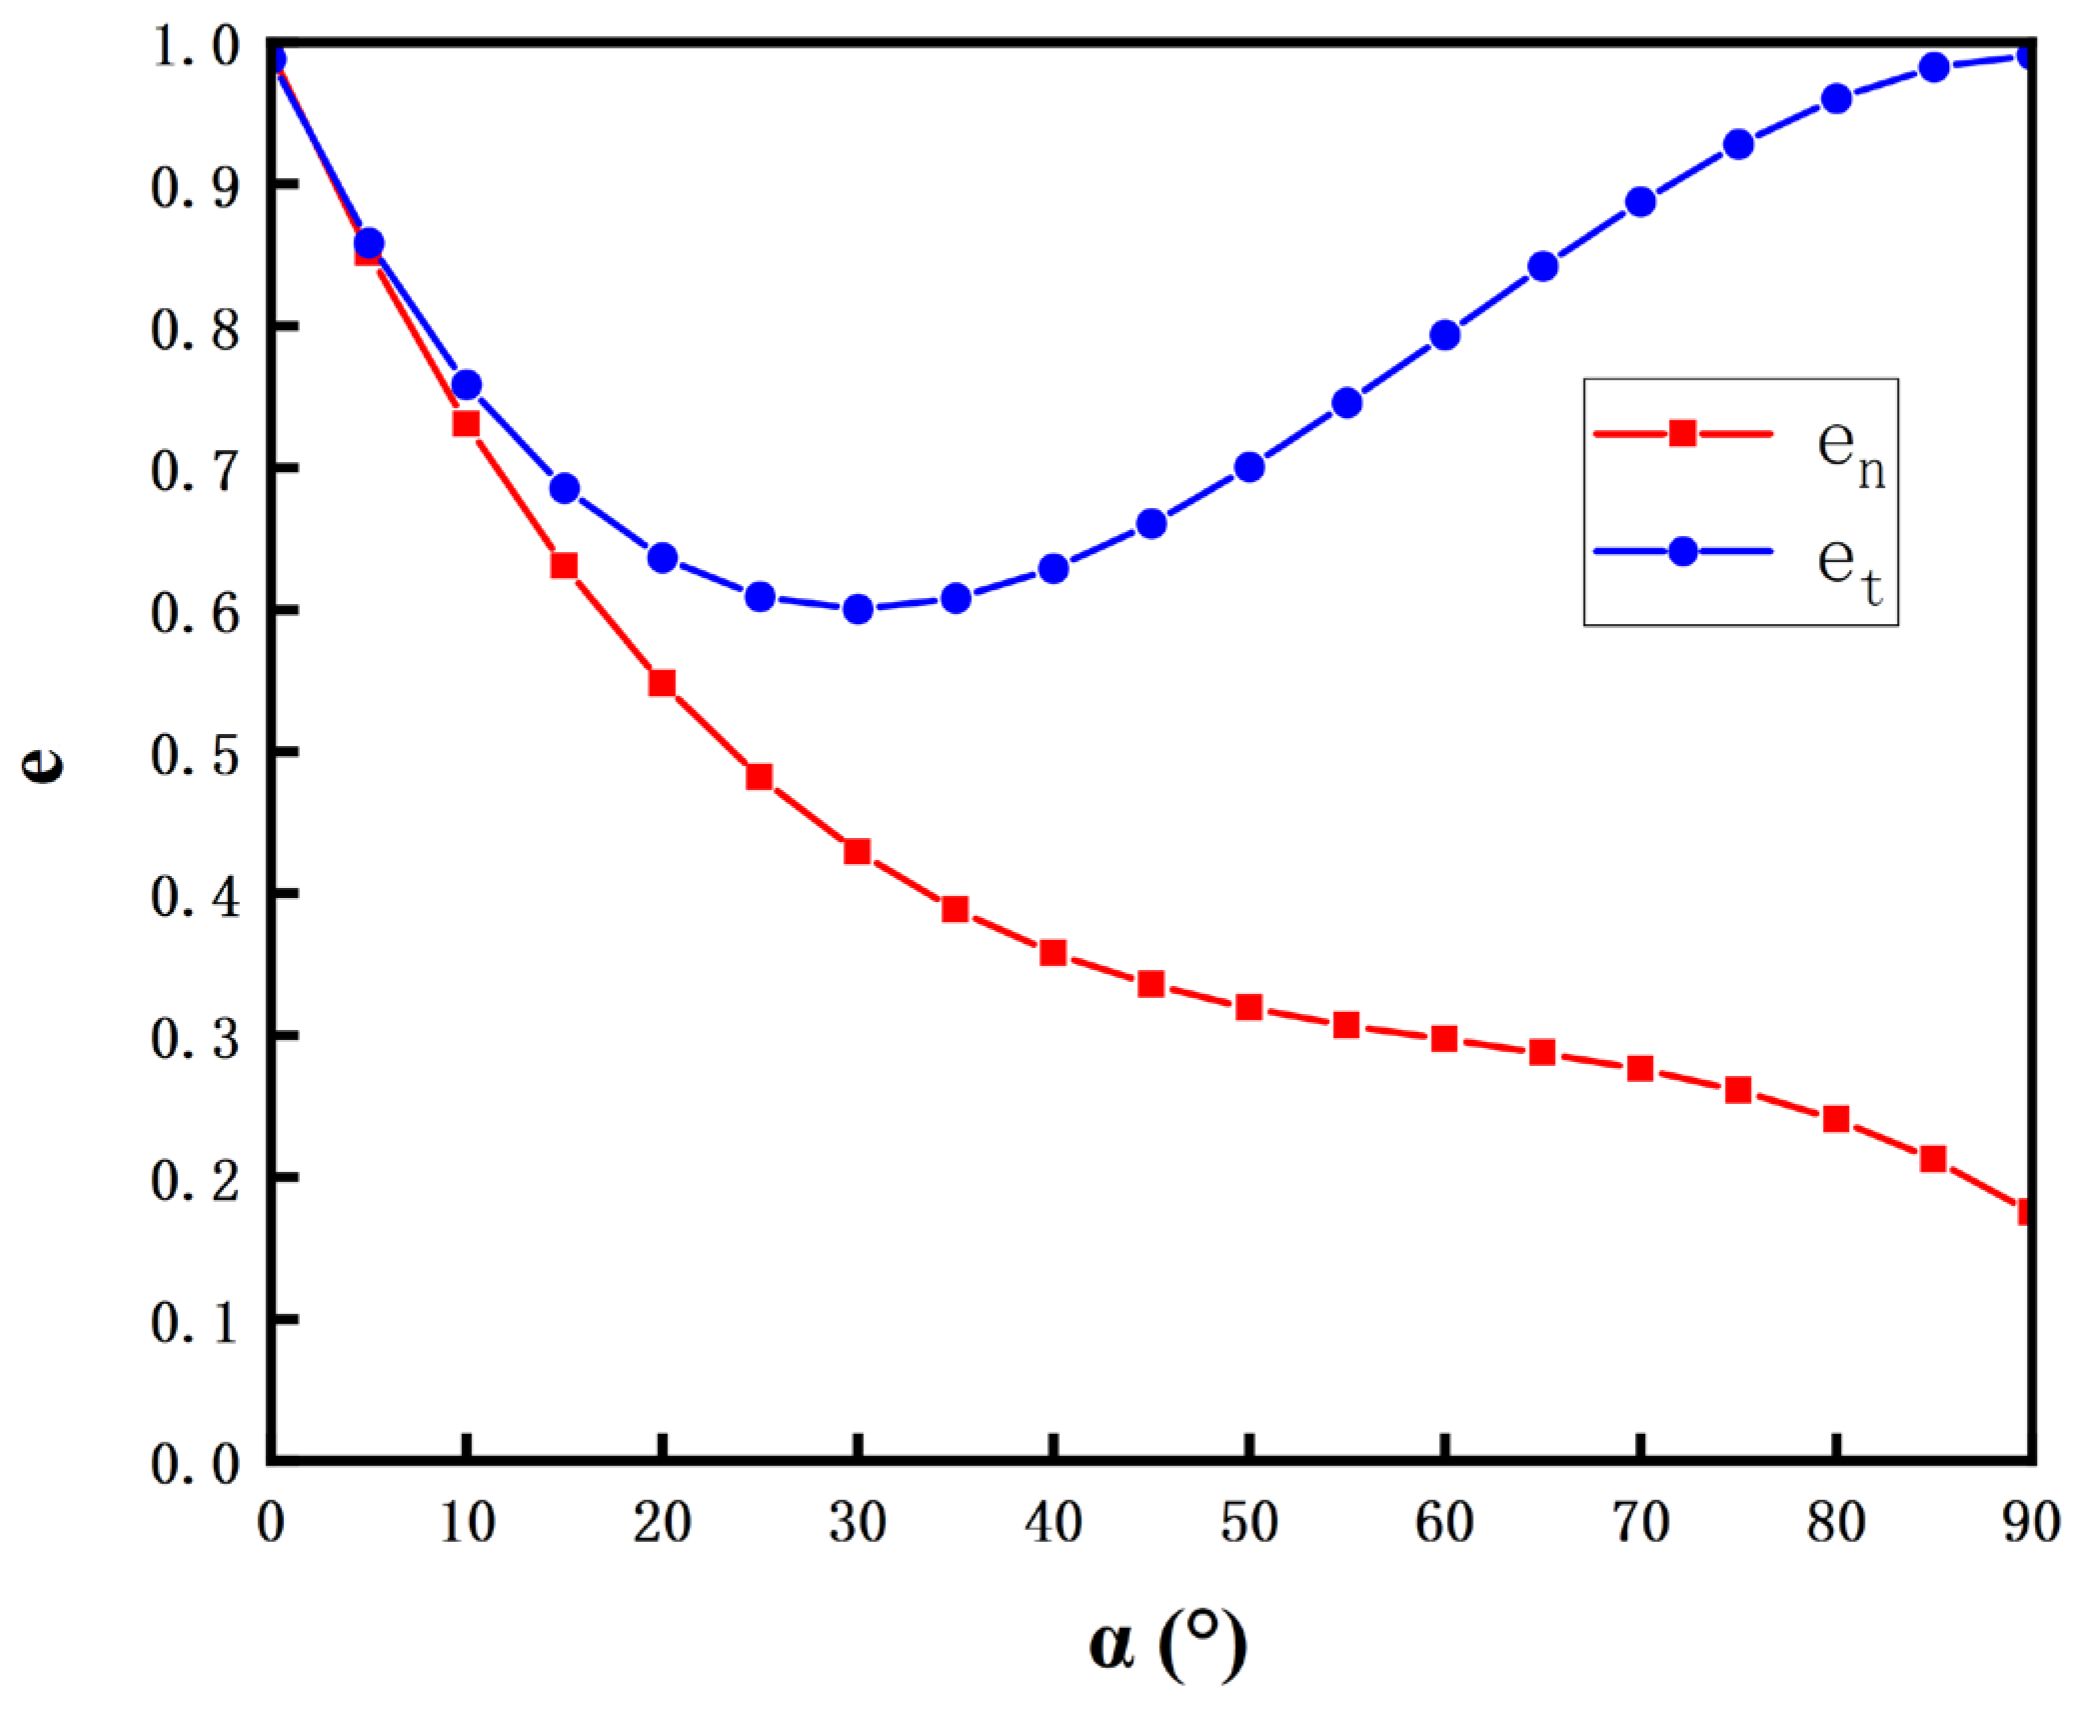
where and are the normal bounce coefficient and tangential bounce coefficient, respectively; and are the normal components of the velocity before and after the particle collision, respectively; and are the tangential components of the velocity before and after the particle collision, respectively; is the angle between the particle and the wall when it hits the wall.
The curve of the rebound coefficient with the collision angle is shown in Figure 1. The smaller the rebound coefficient, the smaller the velocity component in that direction after the particle hits the wall, which means the greater the kinetic energy lost in that direction when the particle hits, and the greater the erosion attack on the material surface in that direction.
The erosion wear is generally represented by the erosion rate. Edwards’ [18] plastic material erosion rate calculation model is used to calculate the valve port erosion rate:
where is the erosion wear rate, is the number of particles, is the function of the particle diameter and takes the empirical value of 1.8 × 10⁻⁹; is the velocity index and takes the empirical constant 2.31; is the erosion angle function described by the segmental function, when the impact angle is 0°, 20°, 30°, 45°, and 90°, 0, 0.8, 1, 0.5, and 0.4, respectively; is the area of the wall calculation unit.
2.4. Numerical Simulation of High-Speed On/Off Valve Orifice Erosion
2.4.1. Establishment of Fluid Domain and Meshing
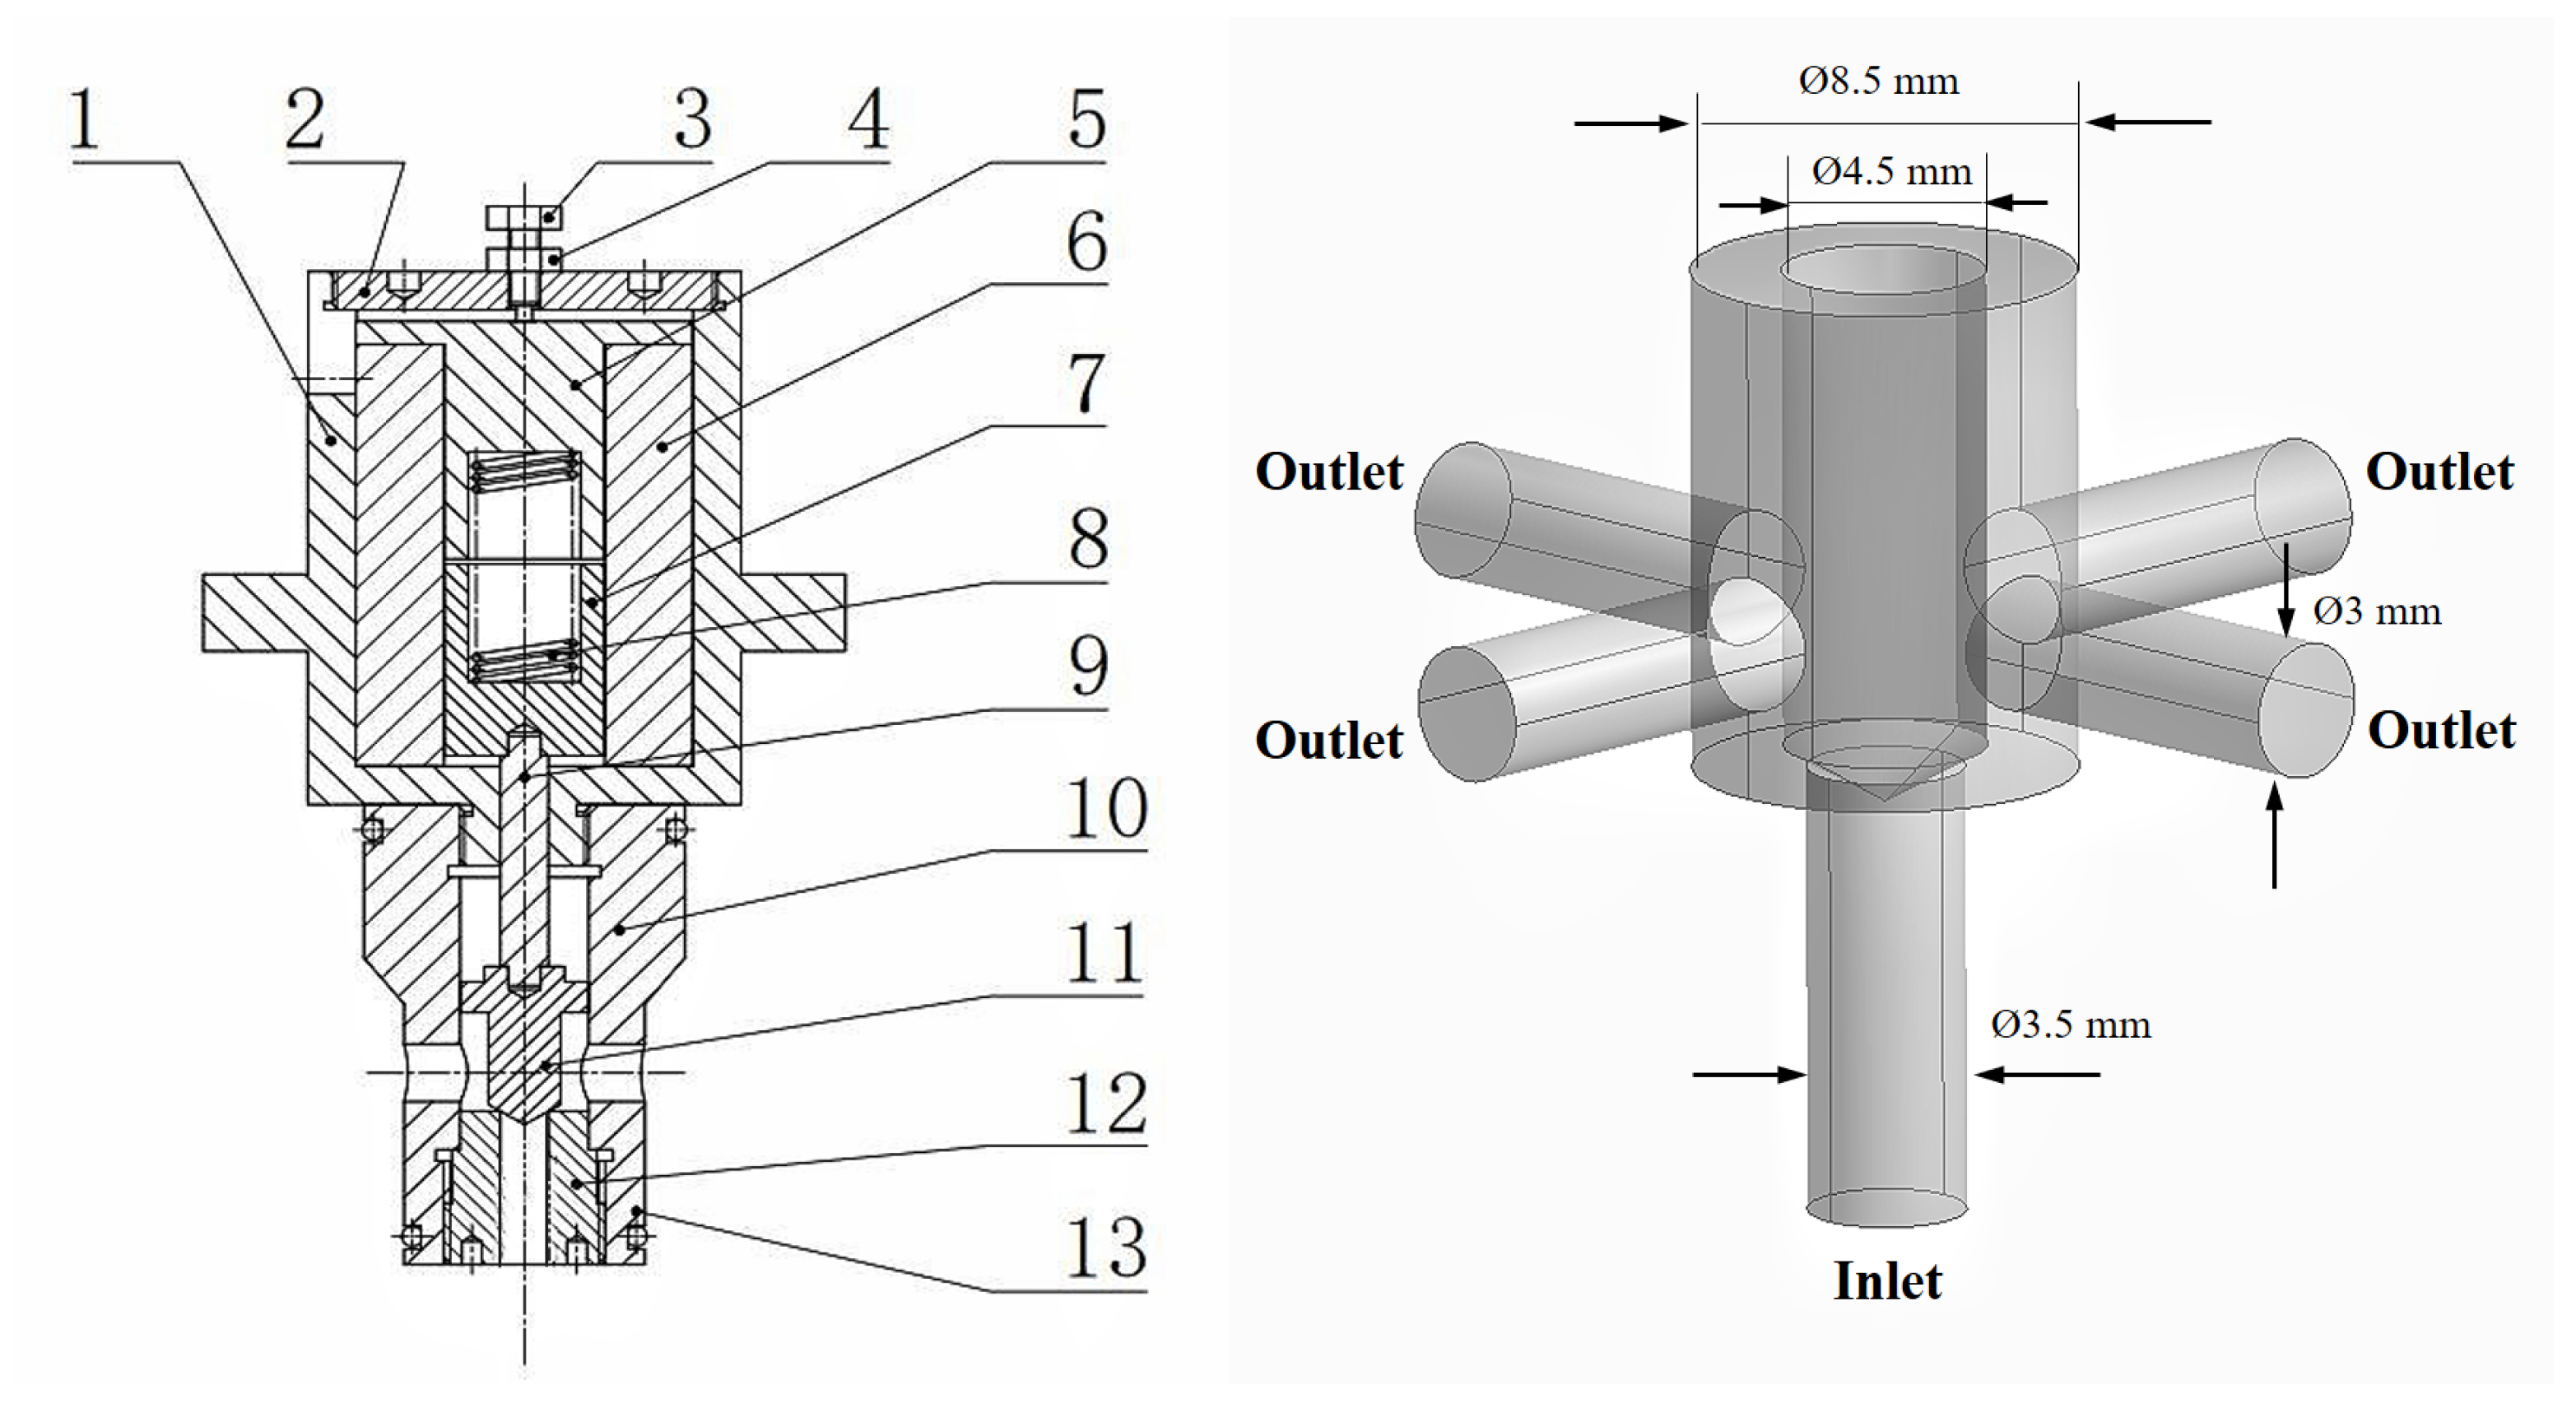
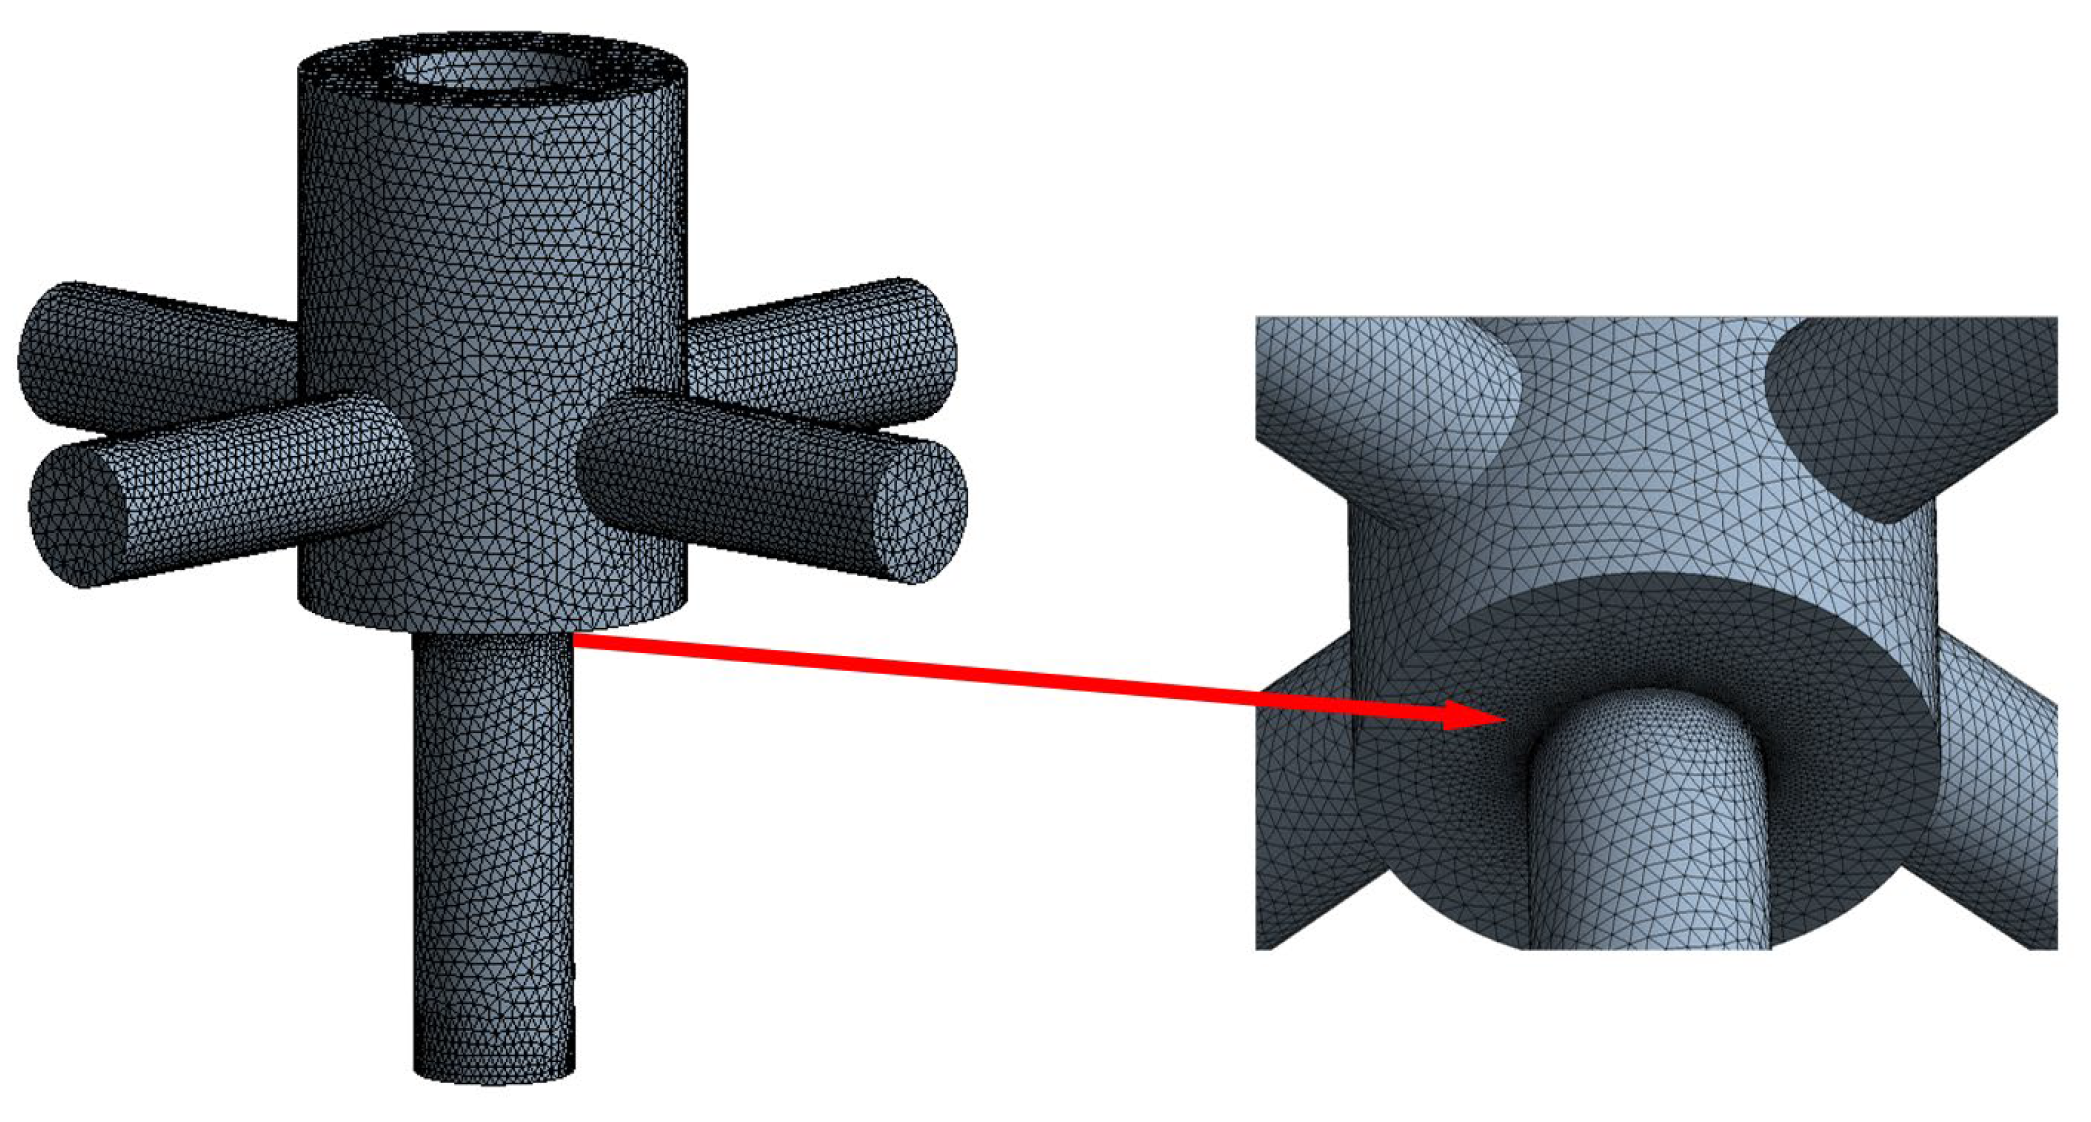
The rated operating pressure of the high-speed on/off valve (Figure 2) was 5 MPa, the rated flow rate was 3.9 L/min, the maximum opening of the valve port was 0.2 mm during operation, and the material of both the spool and the seat was 1Cr18Ni9. Due to the presence of the tapered tip of the high-speed on/off valve spool, the unstructured mesh (tetrahedral mesh) type was adopted for delineation. The velocity and other fluid parameters at the valve port changed more drastically, and the mesh at this point needed to be encrypted to capture more details of the flow field elements (Figure 3).
2.4.2. Boundary Conditions
The turbulence model for the simulation adopted the standard k-ε model with pressure boundary conditions for both the inlet and outlet. The inlet pressure was set to 5 MPa, the outlet pressure was set to 4 MPa, and the valve body wall was a non-slip wall boundary. The SIMPLE algorithm was used for pressure–velocity coupling, and the discretization of the momentum and turbulent kinetic energy were in second-order windward format.
The particle trajectory was traced by steady-state, and the particle incidence using a surface jet source (surface). The boundary conditions of the DPM model at the inlet and outlet are defined as the Escape conditions, and the walls are defined as the Reflect conditions. The particles were assumed to be in spinless motion, and the mutual collisions among particles were neglected. The material properties of the hydraulic oil and solid particles are shown in Table 1.
2.4.3. Particle Parameters
The particle parameters were set according to GJB 420B-2006 contamination class 10. Due to the lack of specific data on particle distribution in the particle size interval, the number of particles distributed in the interval of 5–10 μm was assumed to be half of the number of particles in the interval of 5–15 μm, and the particle size distribution followed the Rosin–Rammler distribution, with a minimum particle size of 1 μm, a maximum particle size of 10 μm, an average particle size of 5 μm, and a particle size distribution coefficient of 3.5.
When setting the particle mass flow rate for DPM, a flow field simulation was required to calculate the particle mass flow rate based on the obtained inlet oil flow rate. To calculate the total mass of particles in the 1–5 μm particle size range, the mass of a median single particle size of 3 μm was multiplied by the total number of particles in the range as the total mass of particles in the range. Similarly, the total mass of particles in the interval of the 5–10 μm particle size distribution was calculated. The inlet fluid mass flow rate obtained by simulation was 0.063346 kg/s under the pressure difference at the valve port of 1 MPa, and the calculated particle mass flow rate was 1.39659 × 10⁻⁷, kg/s.
2.4.4. Estimation of Uncertainty Due to Discretization
Roache [19] proposed to evaluate the discretization error by calculating the grid convergence index (GCI). The smaller the GCI value is, the smaller the discretization error is. Three different groups of grids were divided for flow field simulation, and the outlet flow rate was selected as the observed variable. When the number of cells was greater than 110,684, the value of the percentage change of the outlet flow was less than 0.41%. The calculation results [20,21,22] of the discrete errors are shown in Table 2. The calculated value of the GCI was 1.94%, which means that the uncertainty error was only 1.94%.
2.4.5. Particle Independence Verification
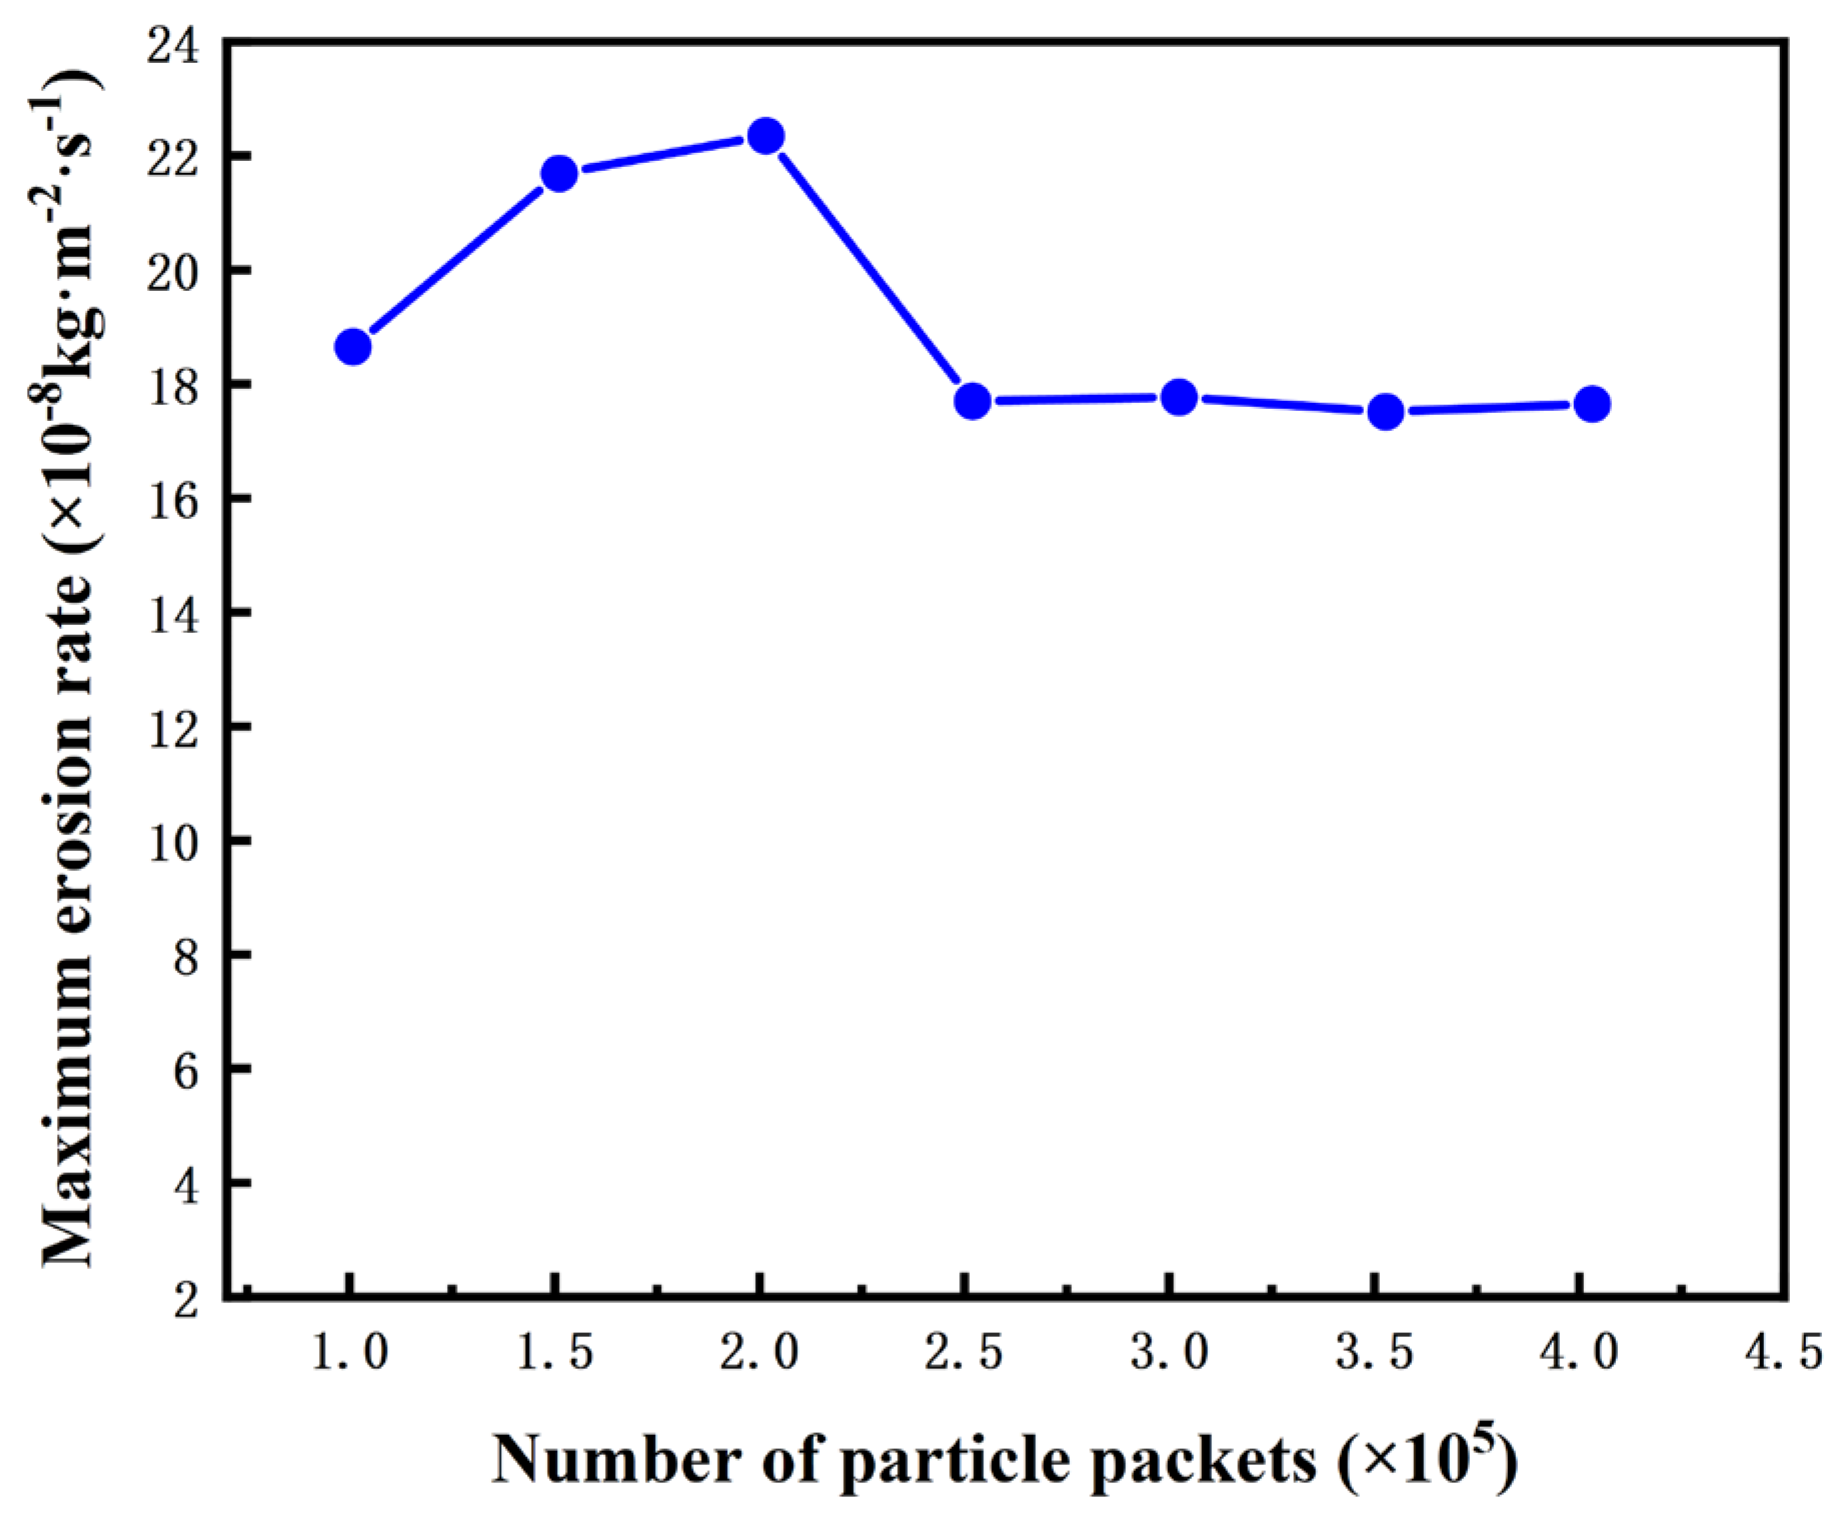
Chen et al. [23] showed that the number of particle packets incident to the model has a significant effect on the calculation of the erosion rate, and if the number of tracked particle packets is small, it will lead to a large calculation error. Therefore, to obtain accurate erosion prediction results, the irrelevance of the particles needed to be verified. The curve of the erosion rate with the number of particle packages was obtained, as shown in Figure 4. The figure shows that the erosion rate stabilized after the number of tracked particle packets reached 252,000, indicating that the numerical calculation results were already independent of the number of particle packets.
3. Calculation Results and Analysis
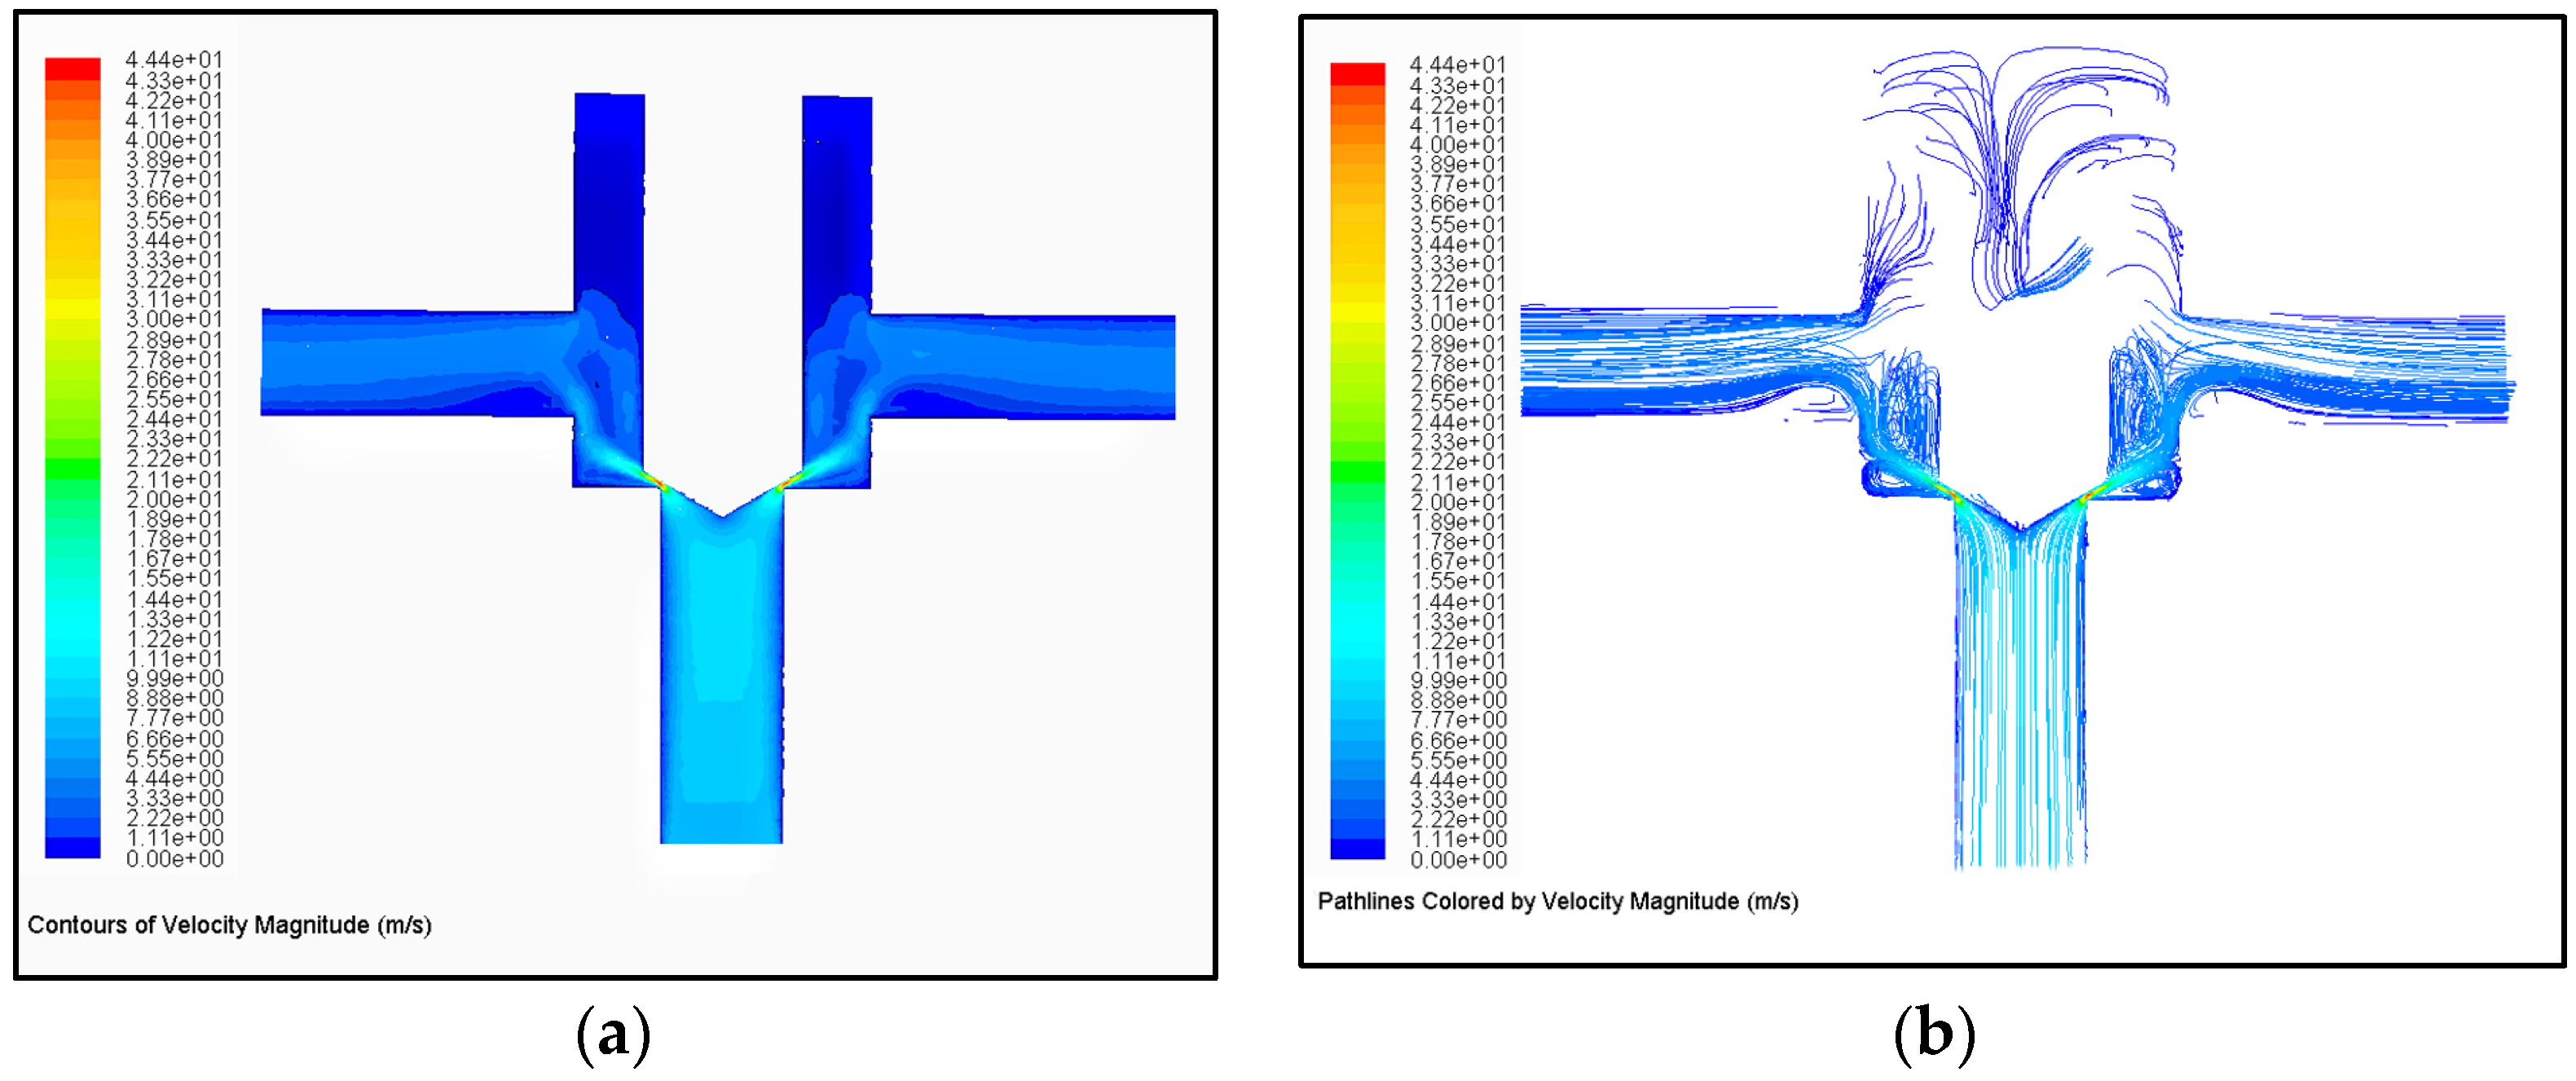
As shown in Figure 5 and Figure 6, the oil started to divert after reaching the cone surface of the valve spool due to the deflecting effect of the cone part of the spool [24]. After the mainstream bundle of oil flowed out from the valve orifice, it directly hit the inner wall of the valve body due to its inertia and flowed along the inner wall to the outlet direction. While the oil at the edge of the mainstream bundle flowed out of the valve orifice due to the larger flow-through area, this part of the oil spread around, and the direction of motion changed greatly, forming vortices at the two ends of the mainstream bundle.
Due to the small opening of the high-speed on/off valve port, the fluid velocity at the valve port increased rapidly and the maximum velocity reached 44.4 m/s.
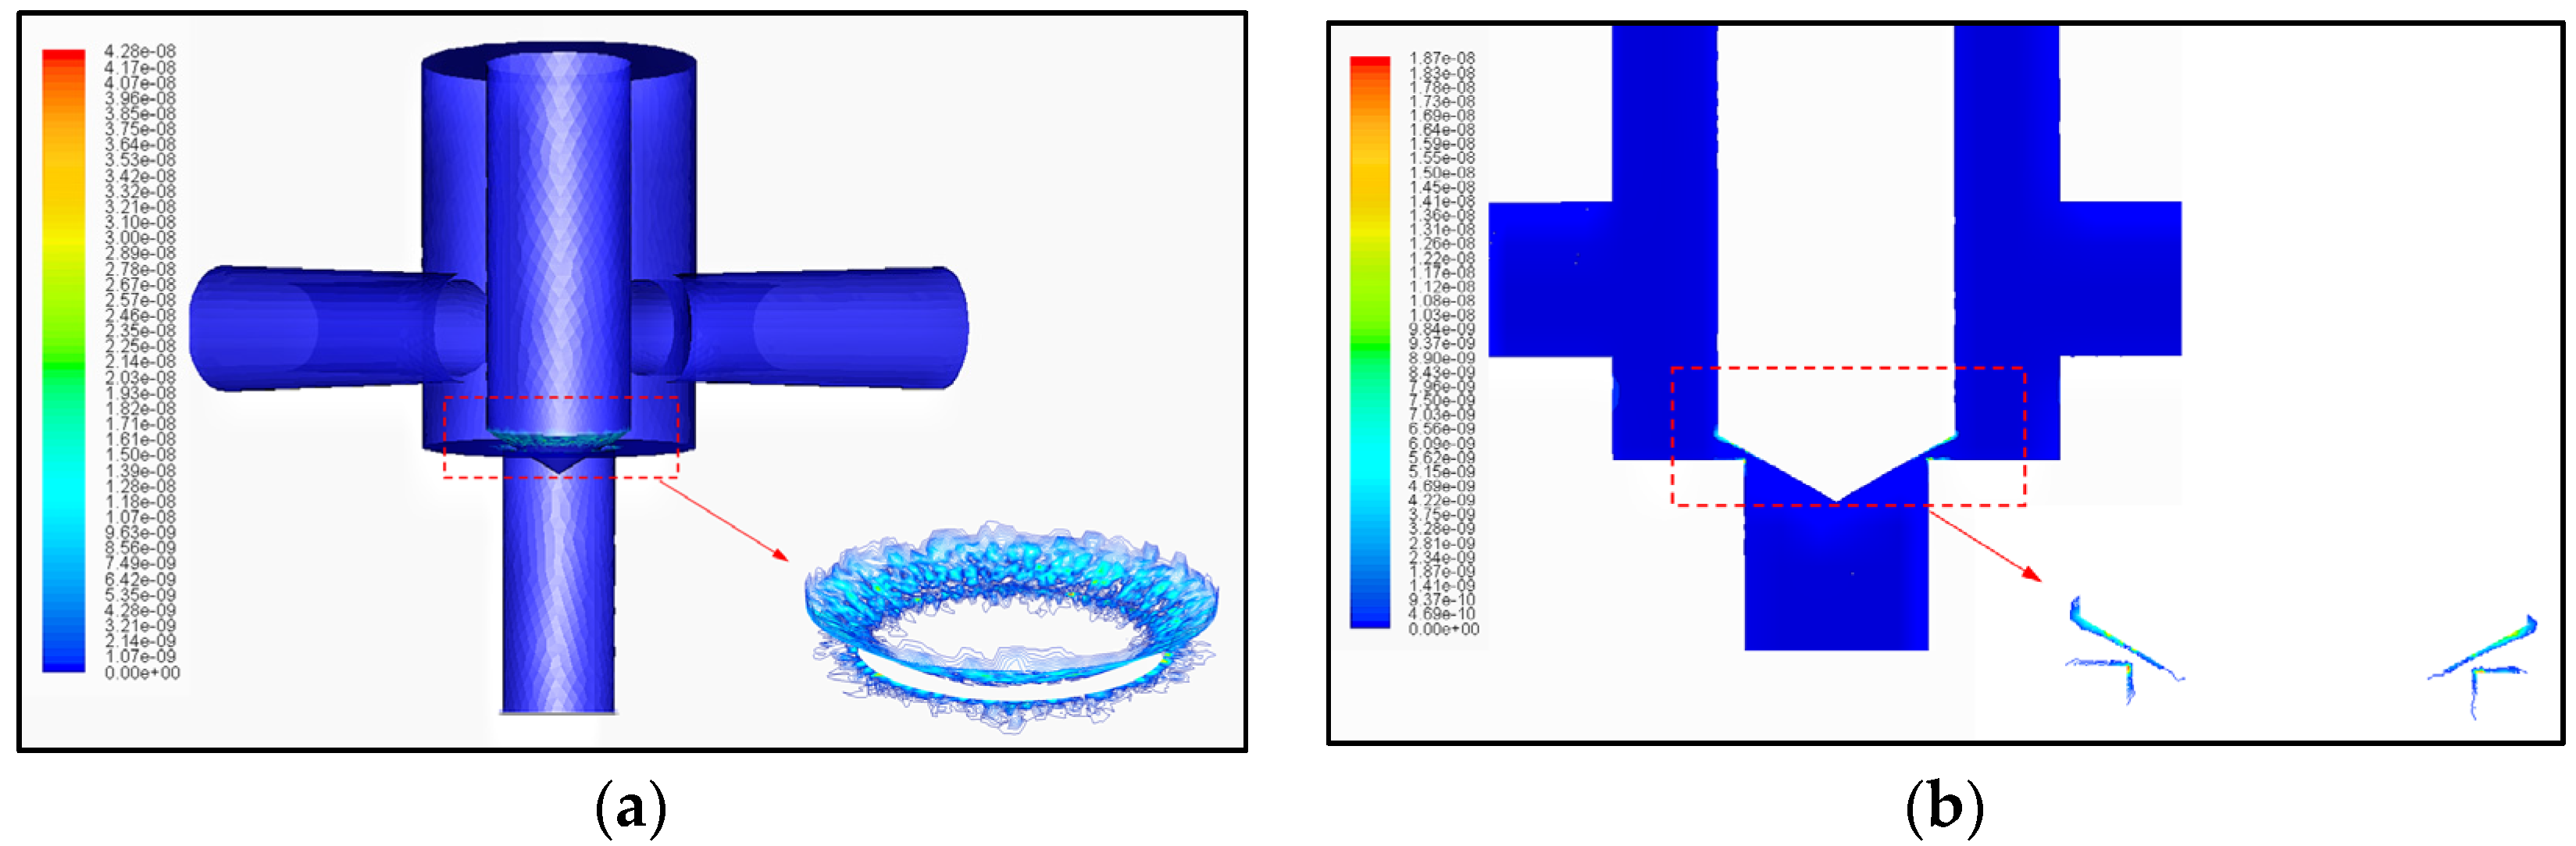
As Figure 7a shows, the erosion morphology at the valve orifice of the high-speed on/off valve is mainly characterized by a “scale-like” lip, where the material surface is subjected to the impact of particles, resulting in the accumulation of material at the erosion wear site, and as the erosion wear continued, the material accumulation site tended to develop into a “scale-like “lip [25].
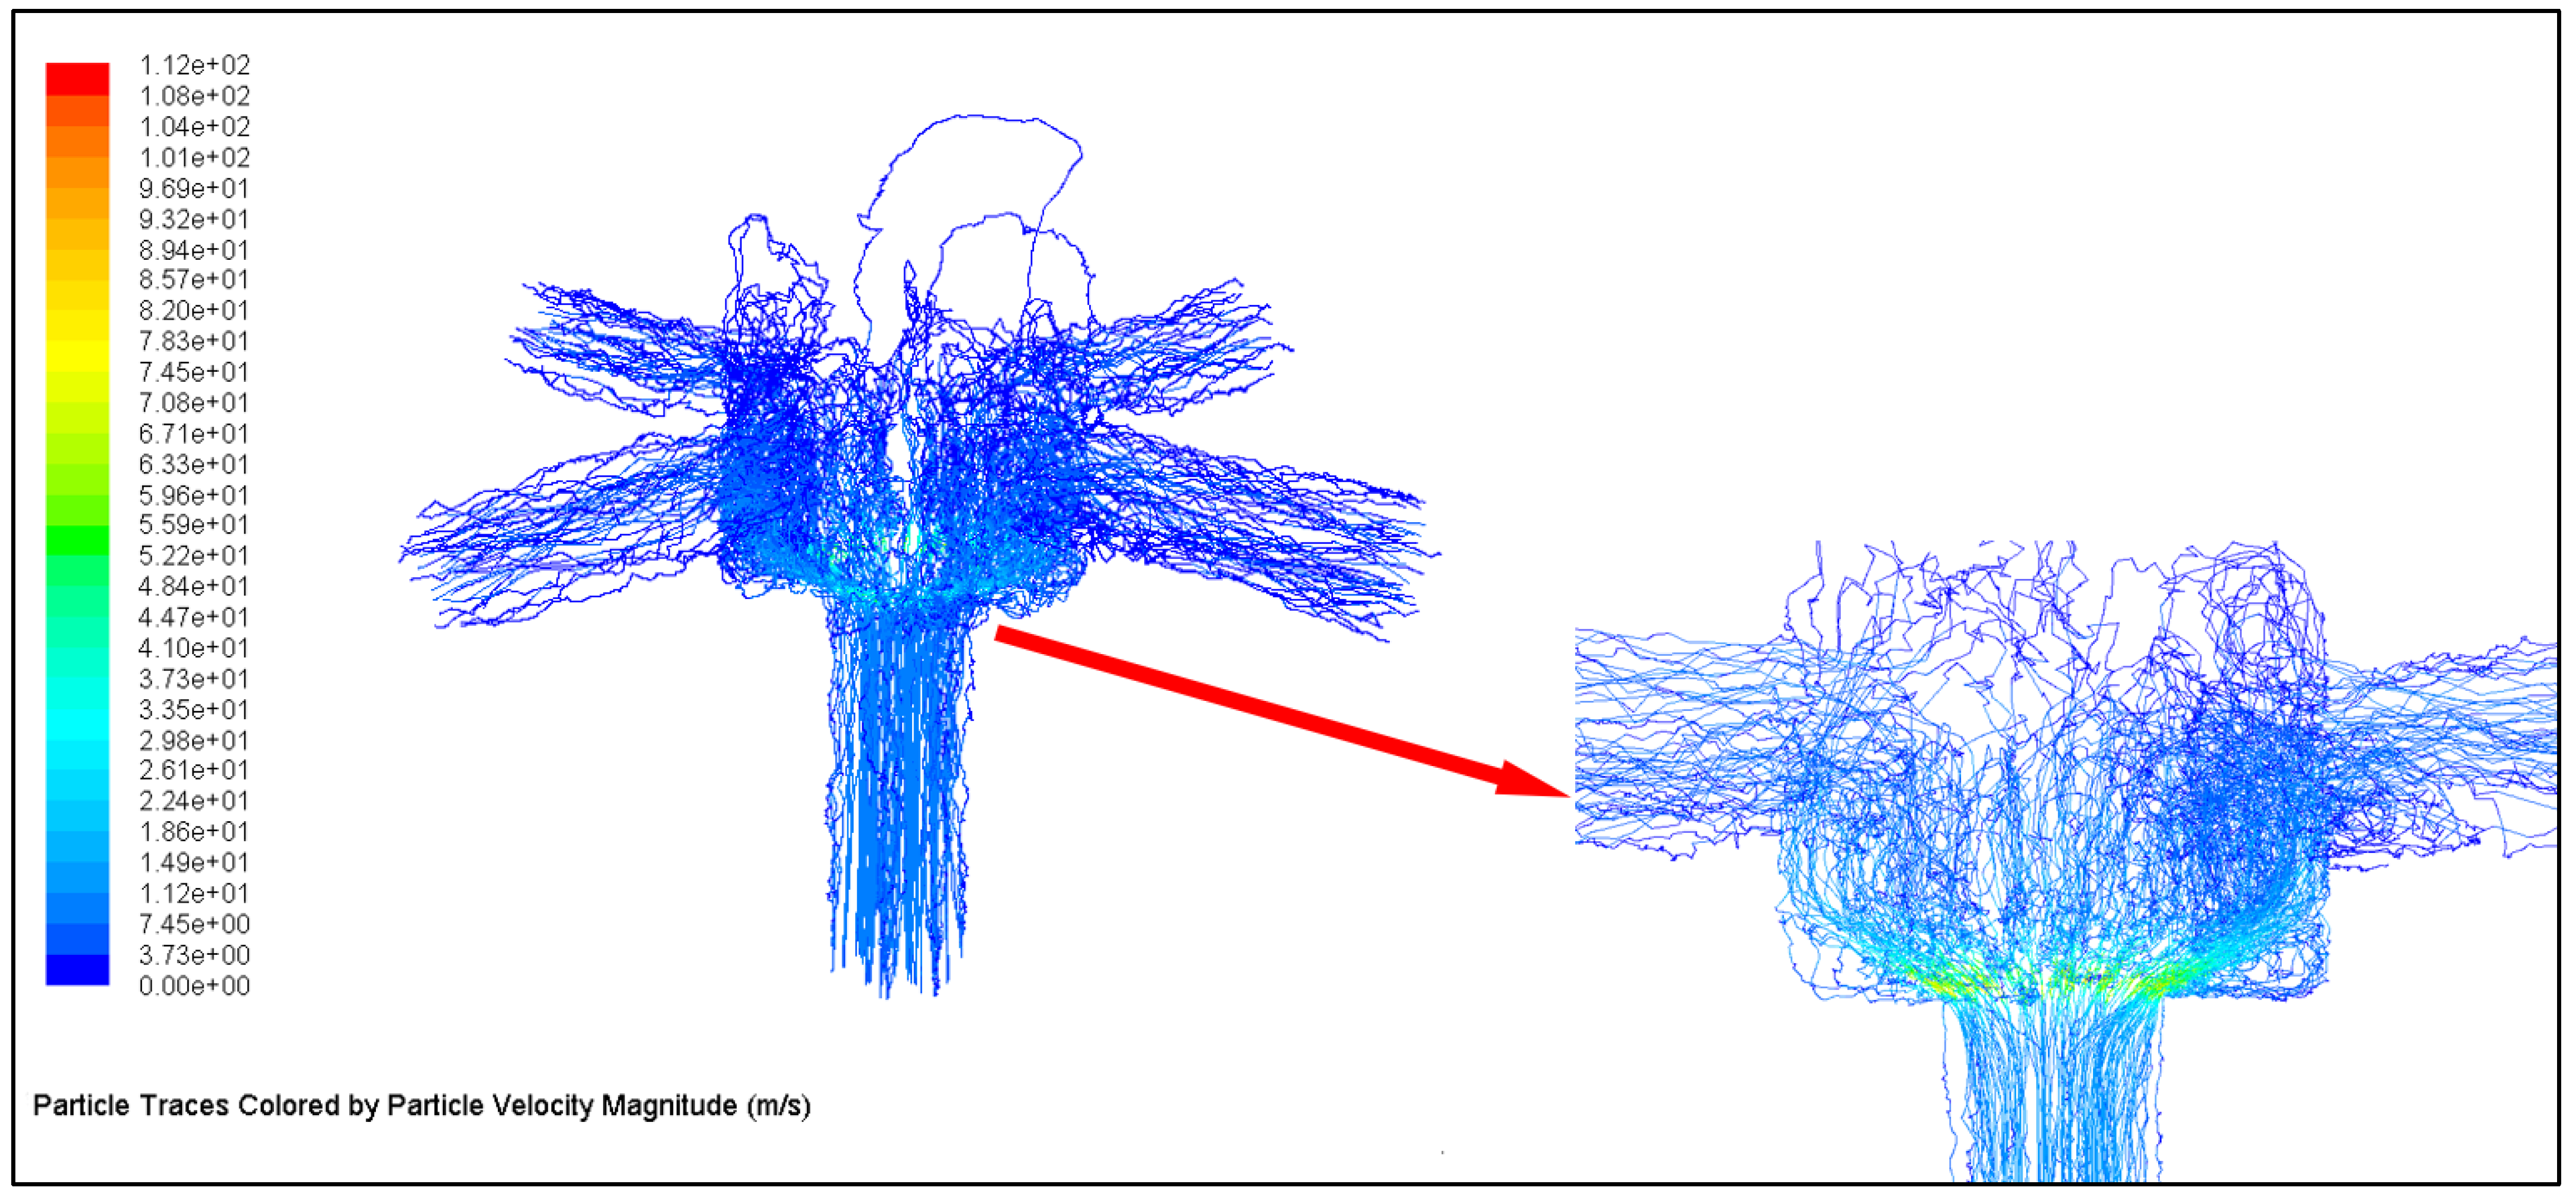
The erosion parts of the spool were mainly concentrated at the valve orifice, while there was little erosion wear in the tip region of the spool taper. This is because the velocity of the particles impacting the tip region and the impact angle were small, and the erosion damage of the particles on the wall surface was negligible. When the particles flowed out of the valve orifice, the direction of motion changed significantly. The impact velocity and impact angle of the particles are also large, causing varying degrees of erosion and wear on the spool cone extending from near the seal line to the end of the spool cone.
The direct impact of the particles on the valve front area and the impact of swirling centrifugal particles on the valve cavity combined caused more severe erosion wear at the ends of the valve seat corners. In addition, Figure 7b shows that the maximum erosion wear of the valve port occurred on the sharp edge of the valve seat.
In summary, the high-speed on/off valve orifice erosion was mainly caused by the mainstream beam and the valve cavity vortex centrifugal particle erosion together.
4. High-Speed On/Off Valve Orifice Erosion Influence Factors Analysis
4.1. Effect of Spool Taper Angle on Orifice Erosion
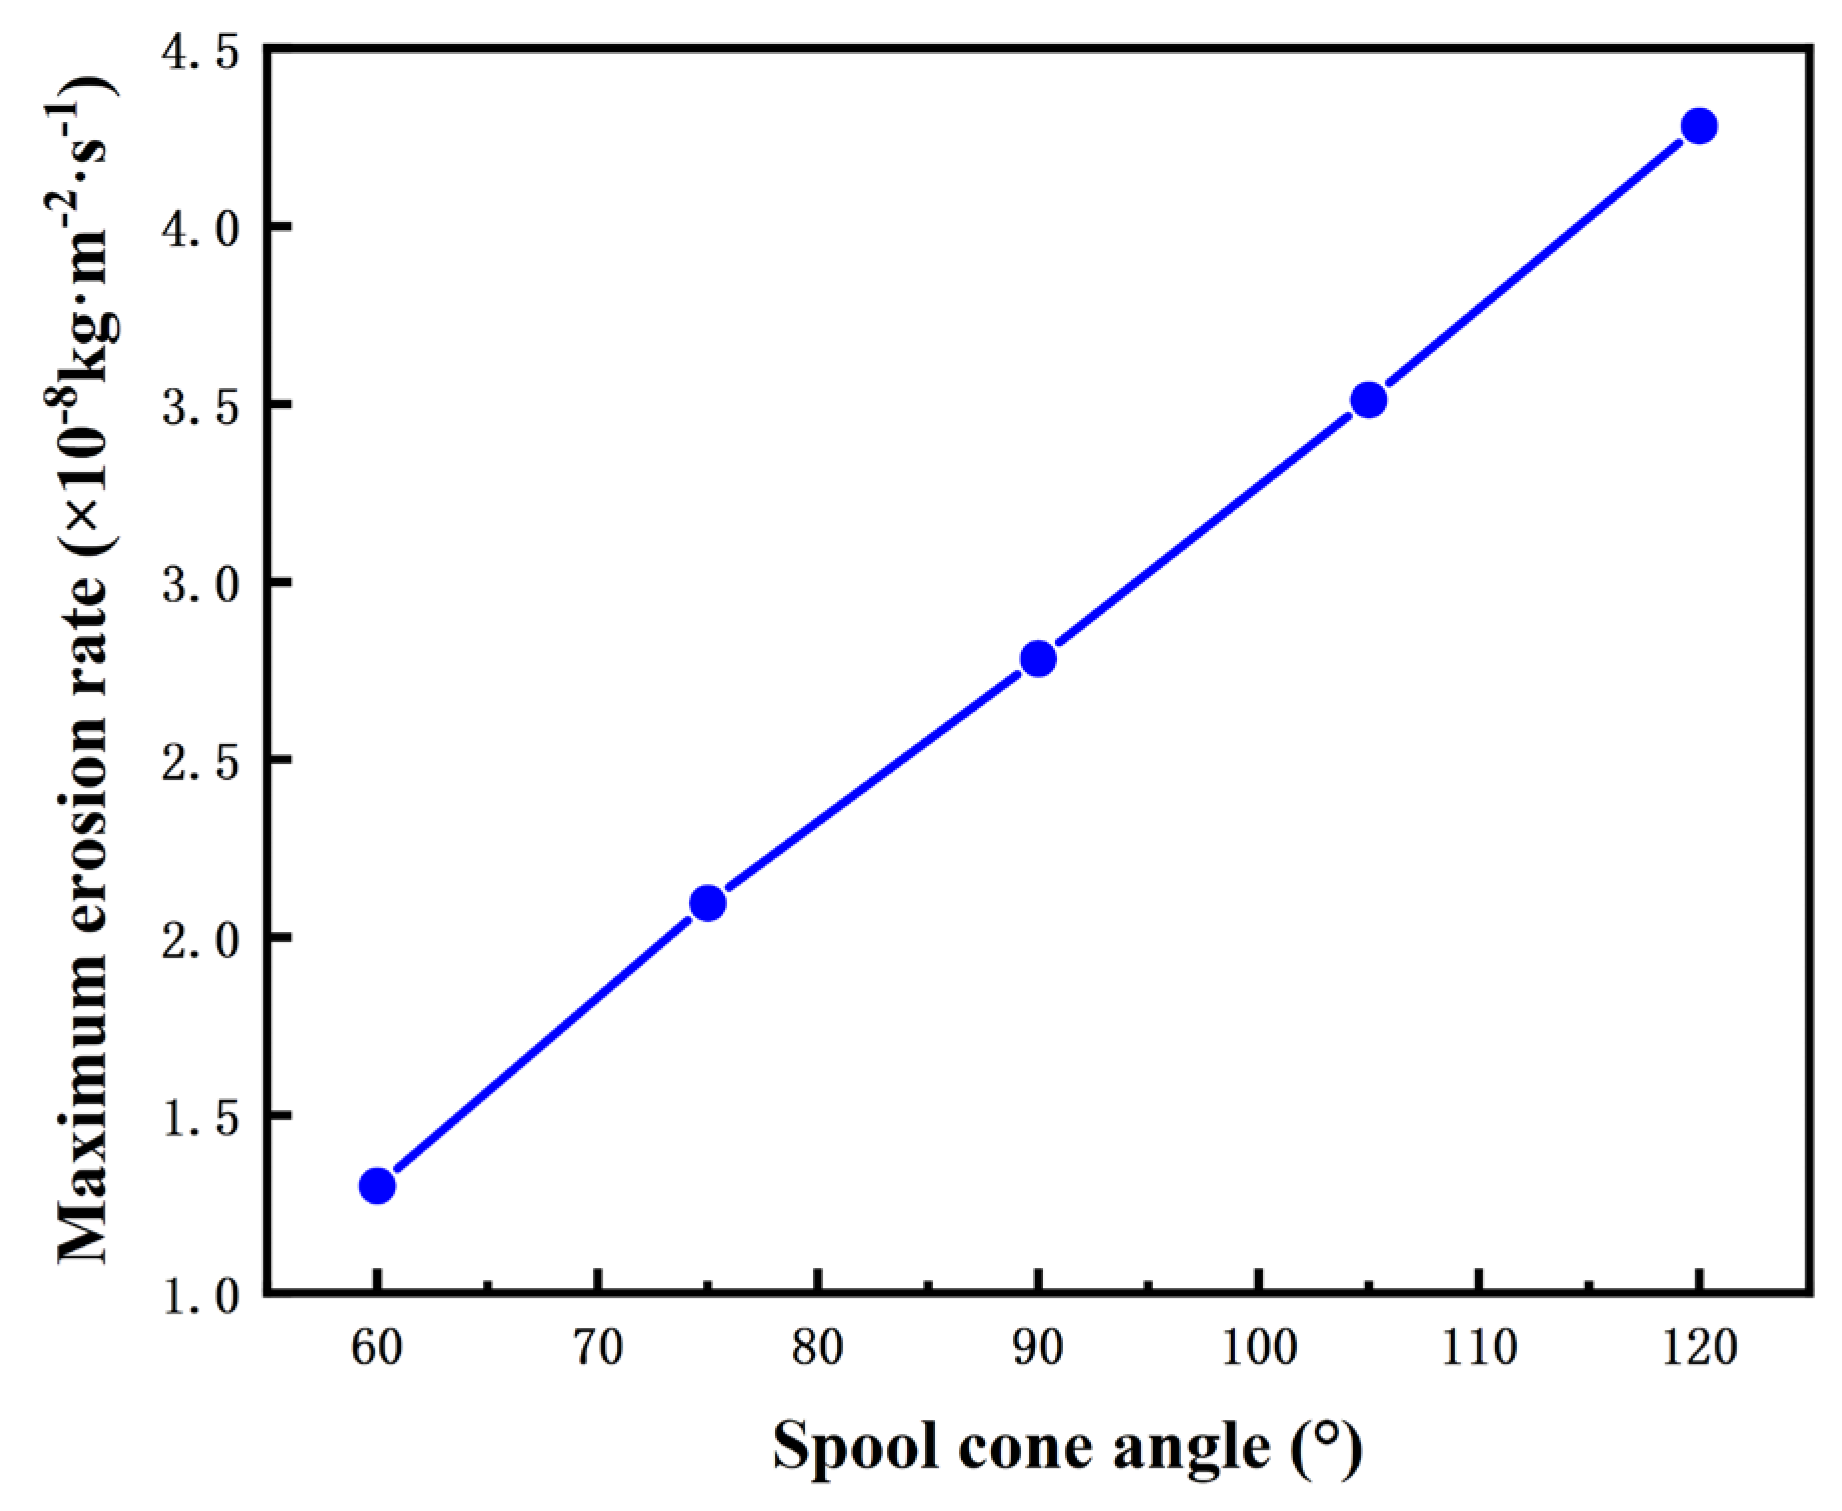
The curve of the maximum erosion rate with the spool cone angle is shown in Figure 8. With the increase in the spool cone angle, the maximum erosion rate of the valve port grew linearly, and the maximum erosion rate of a spool cone angle of 120° was about four times that of a cone angle of 60°. With data fitting by least squares, the relationship between the maximum erosion rate and the spool taper angle was obtained as .
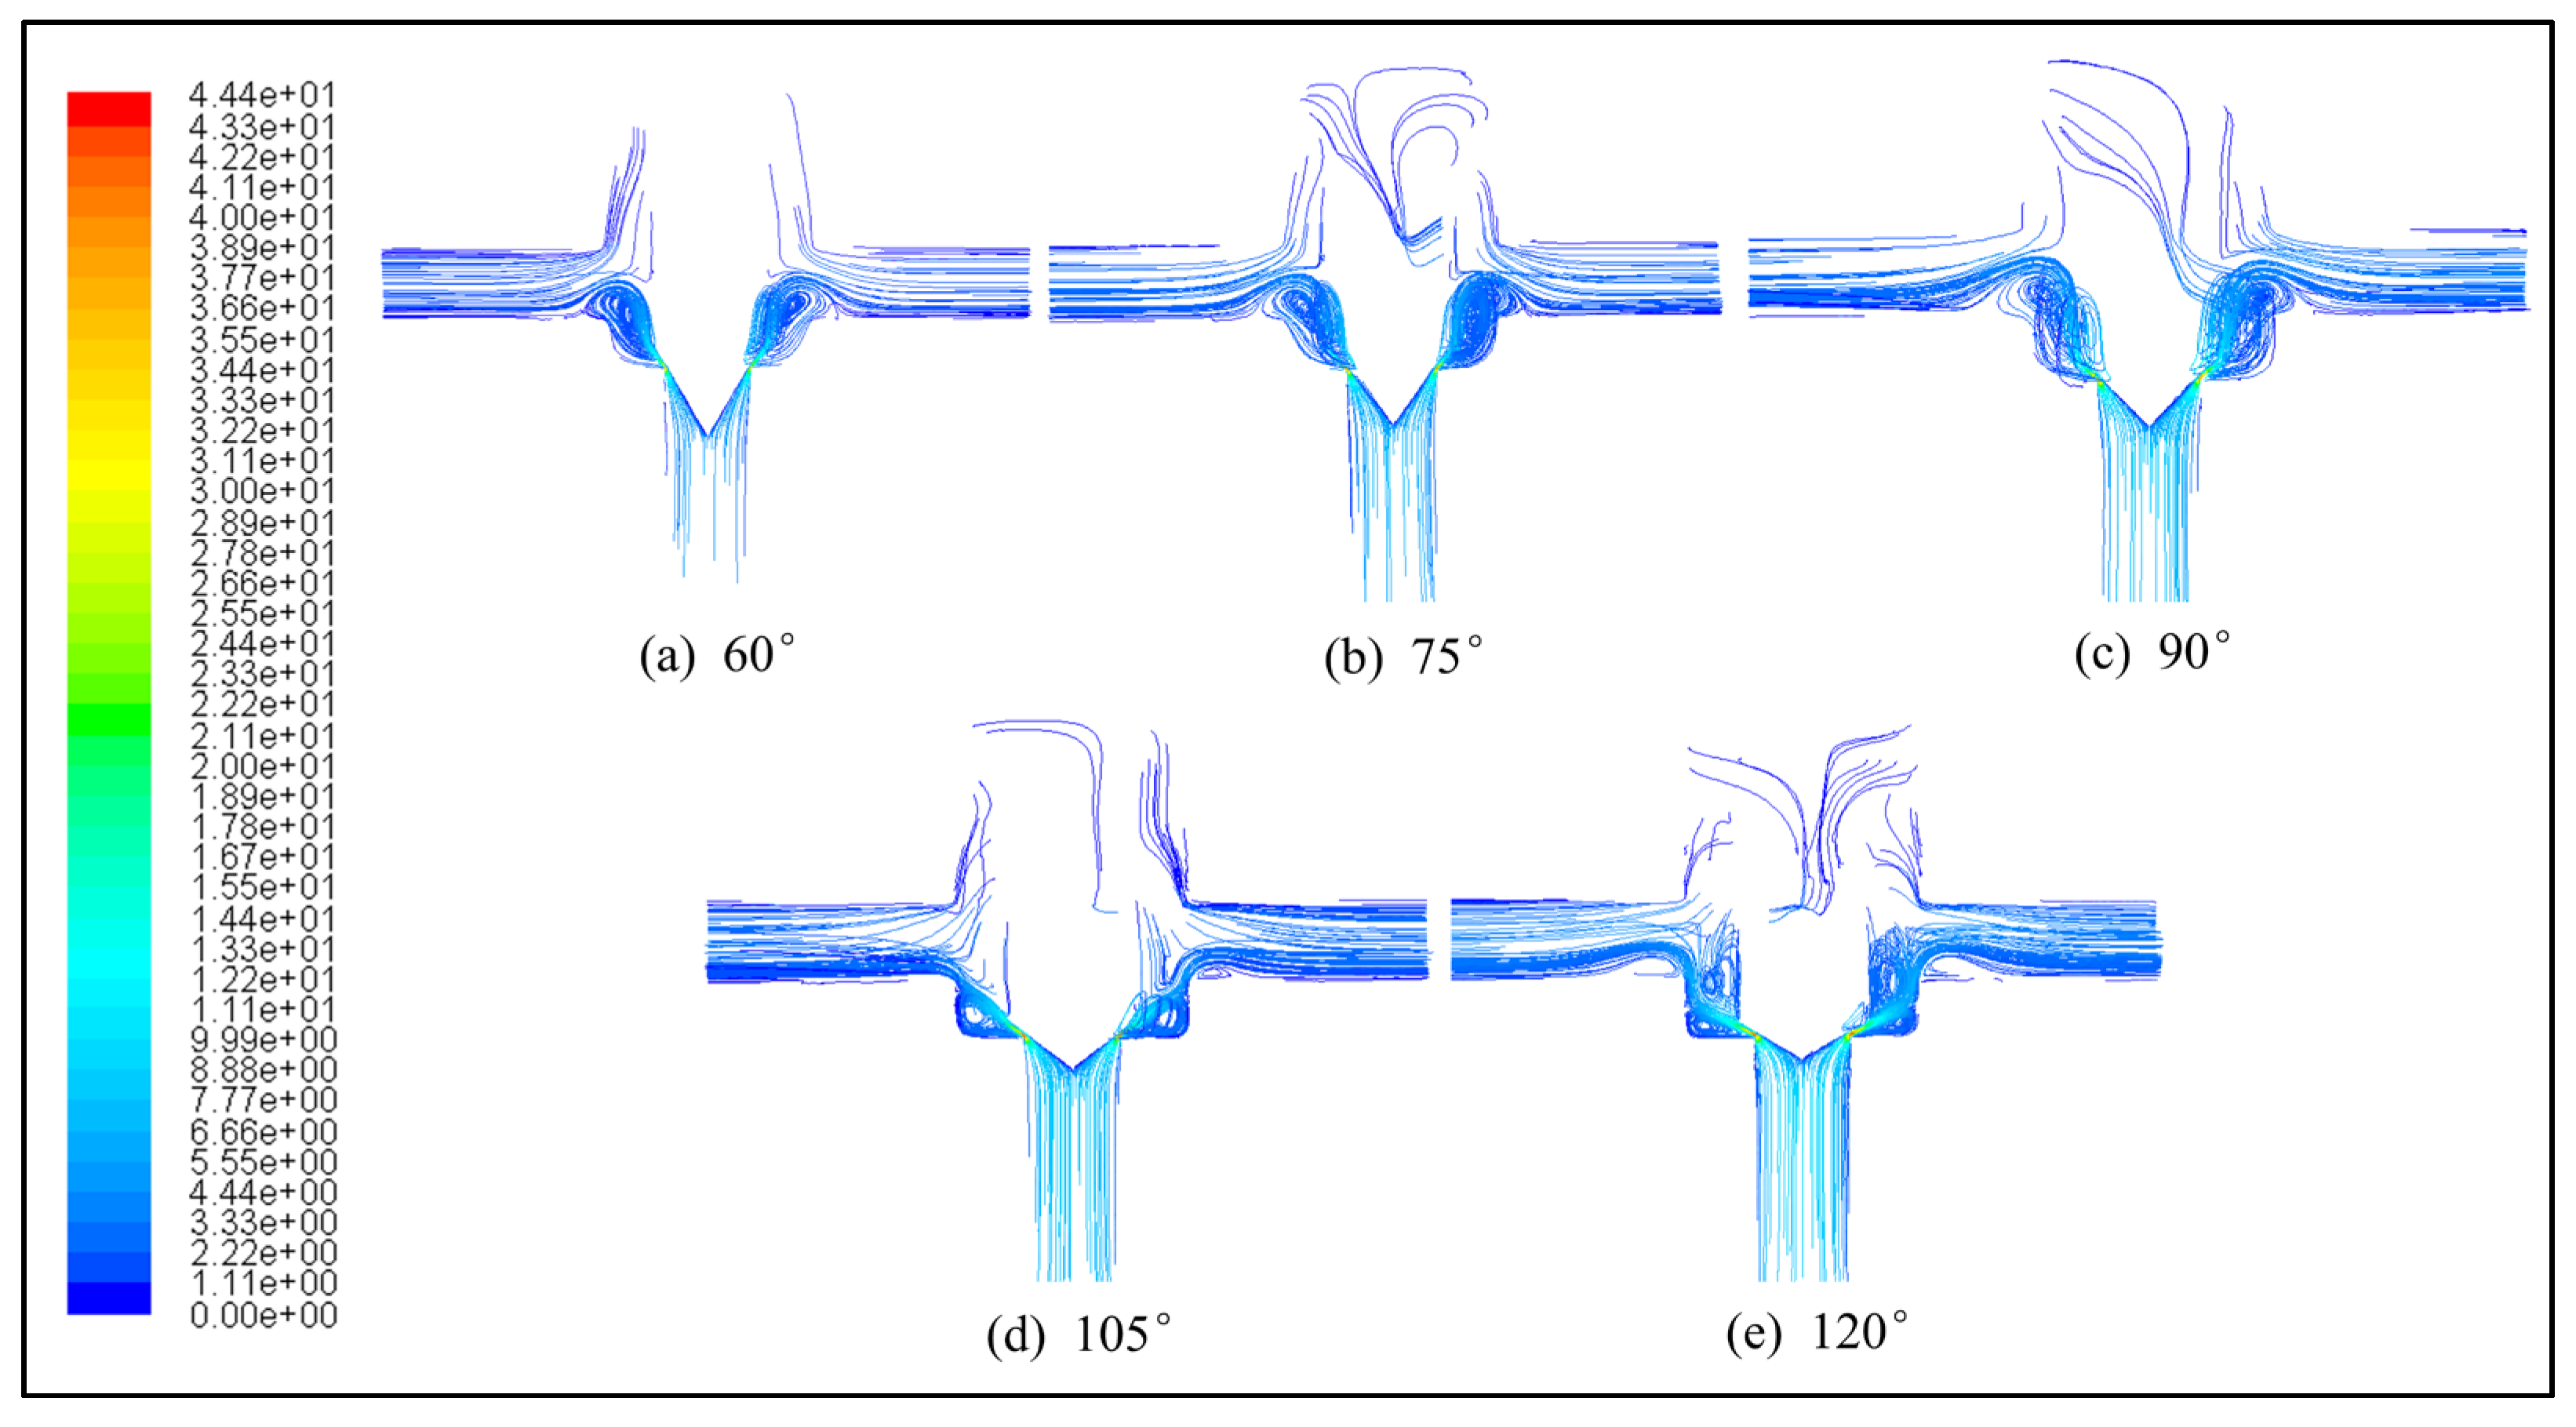
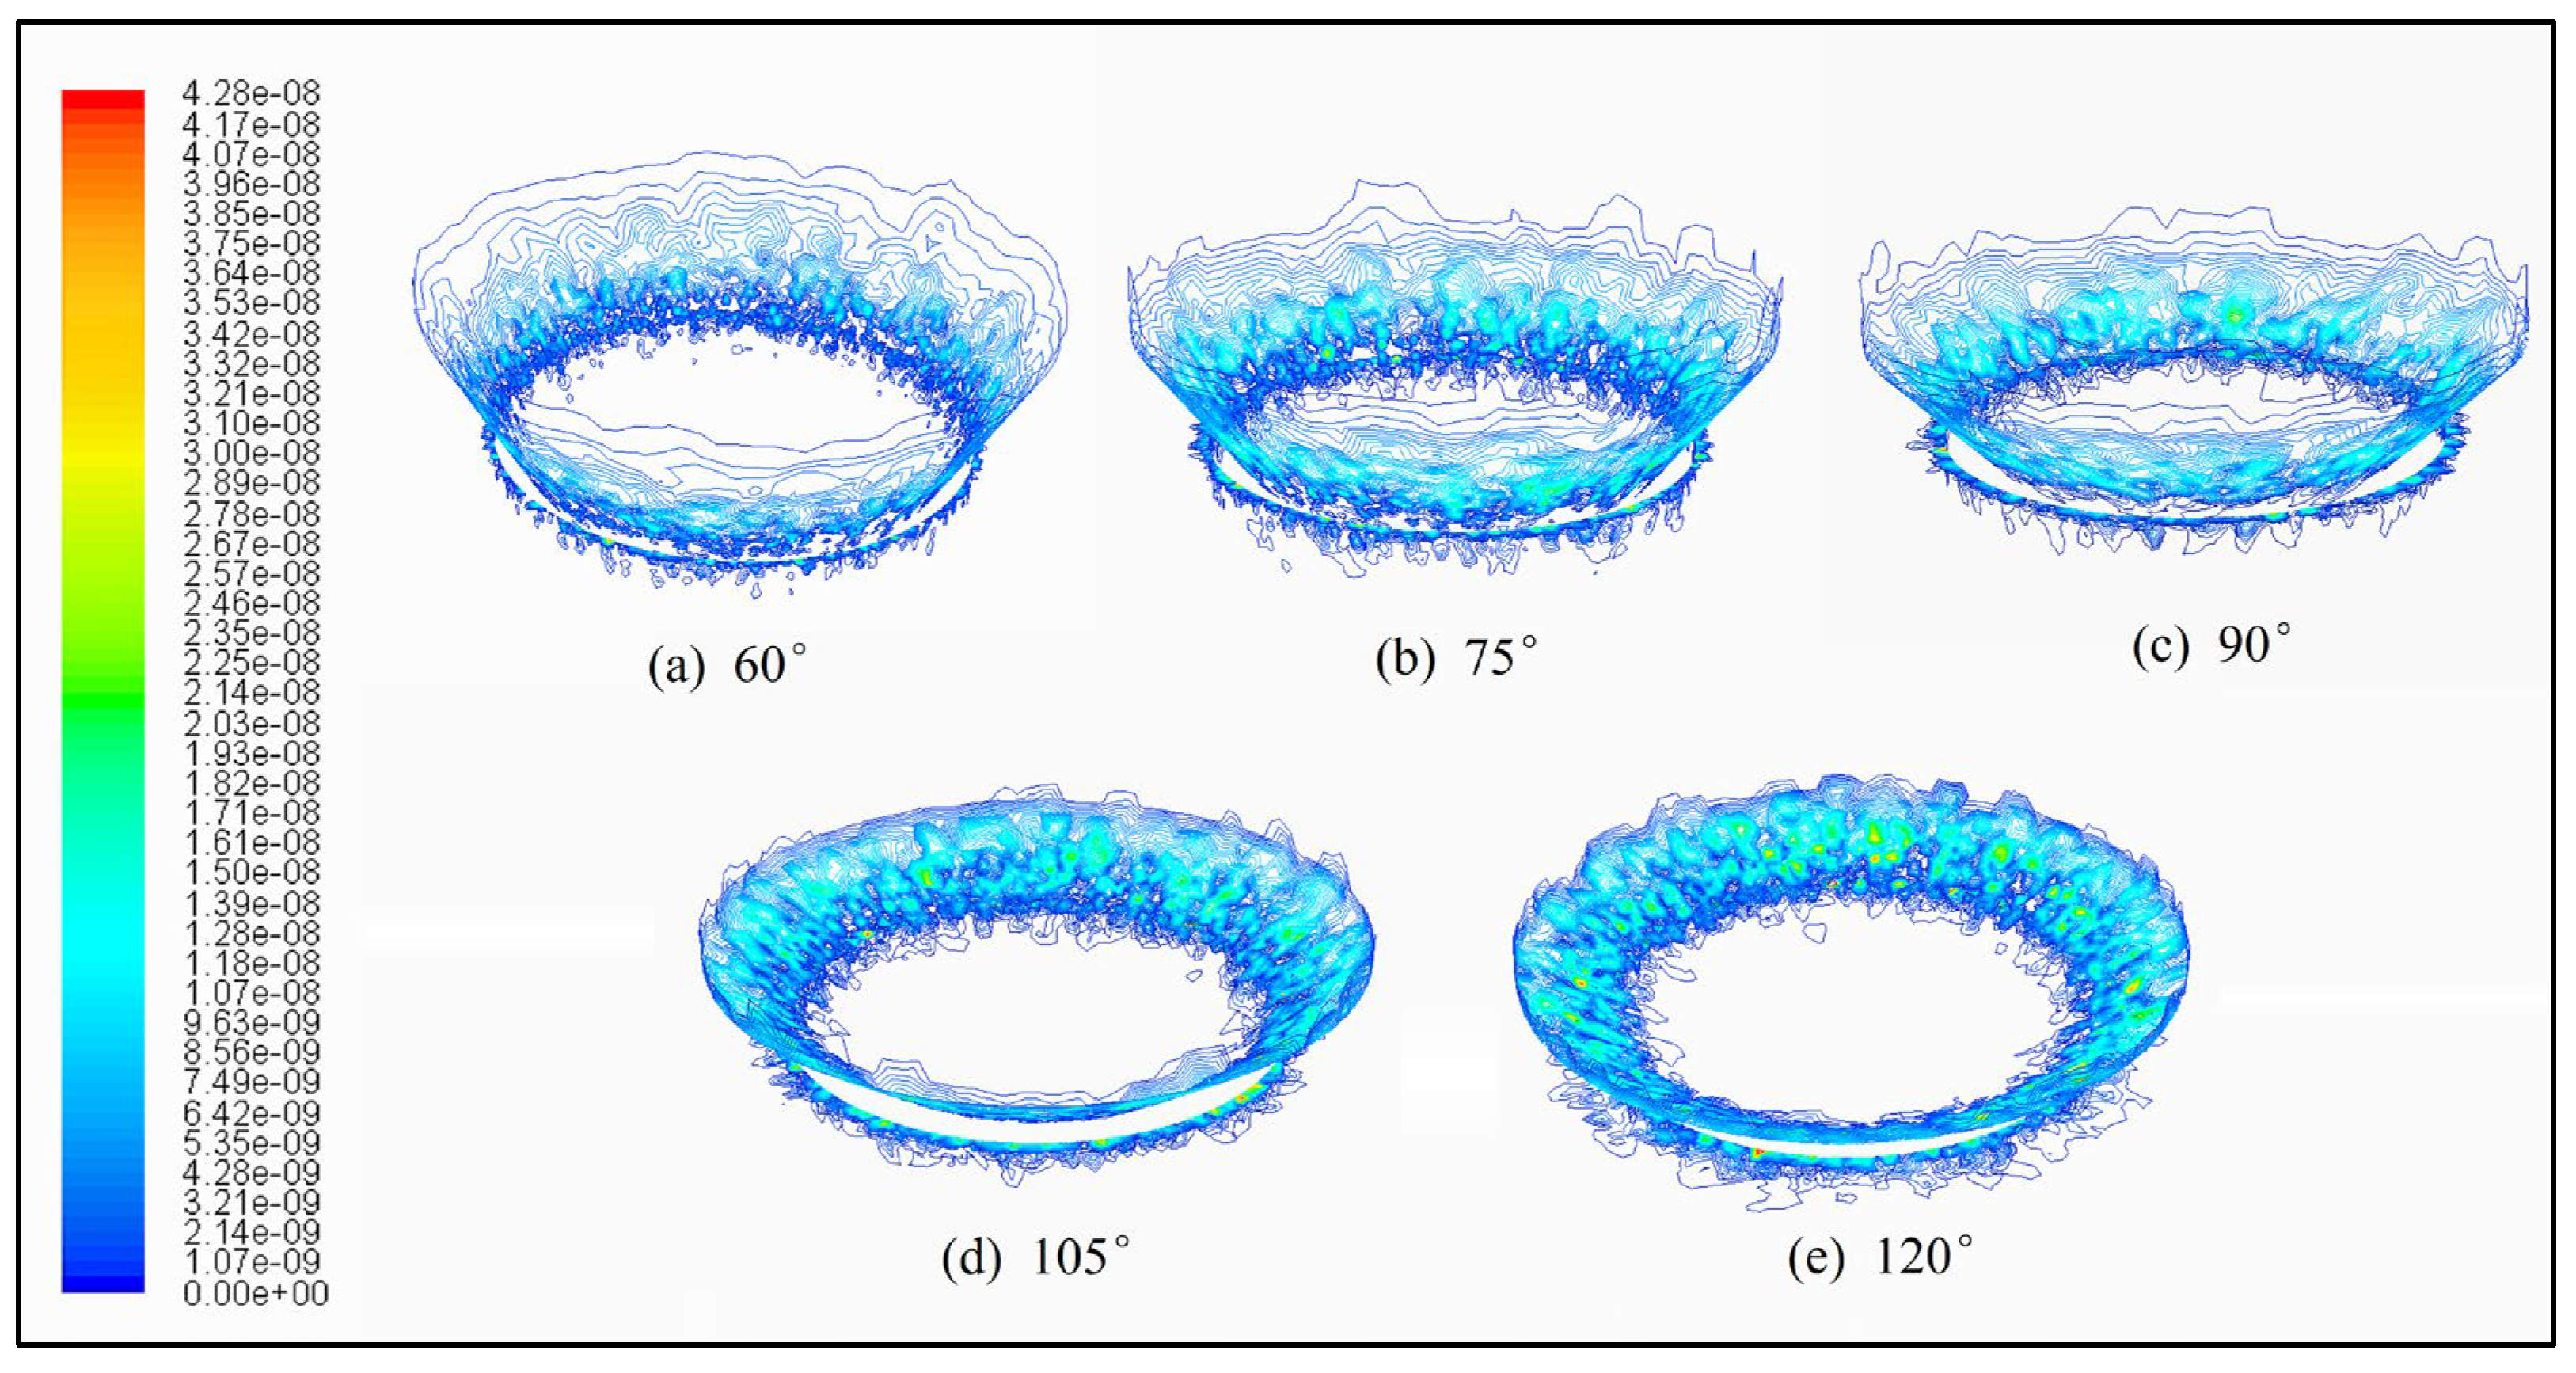
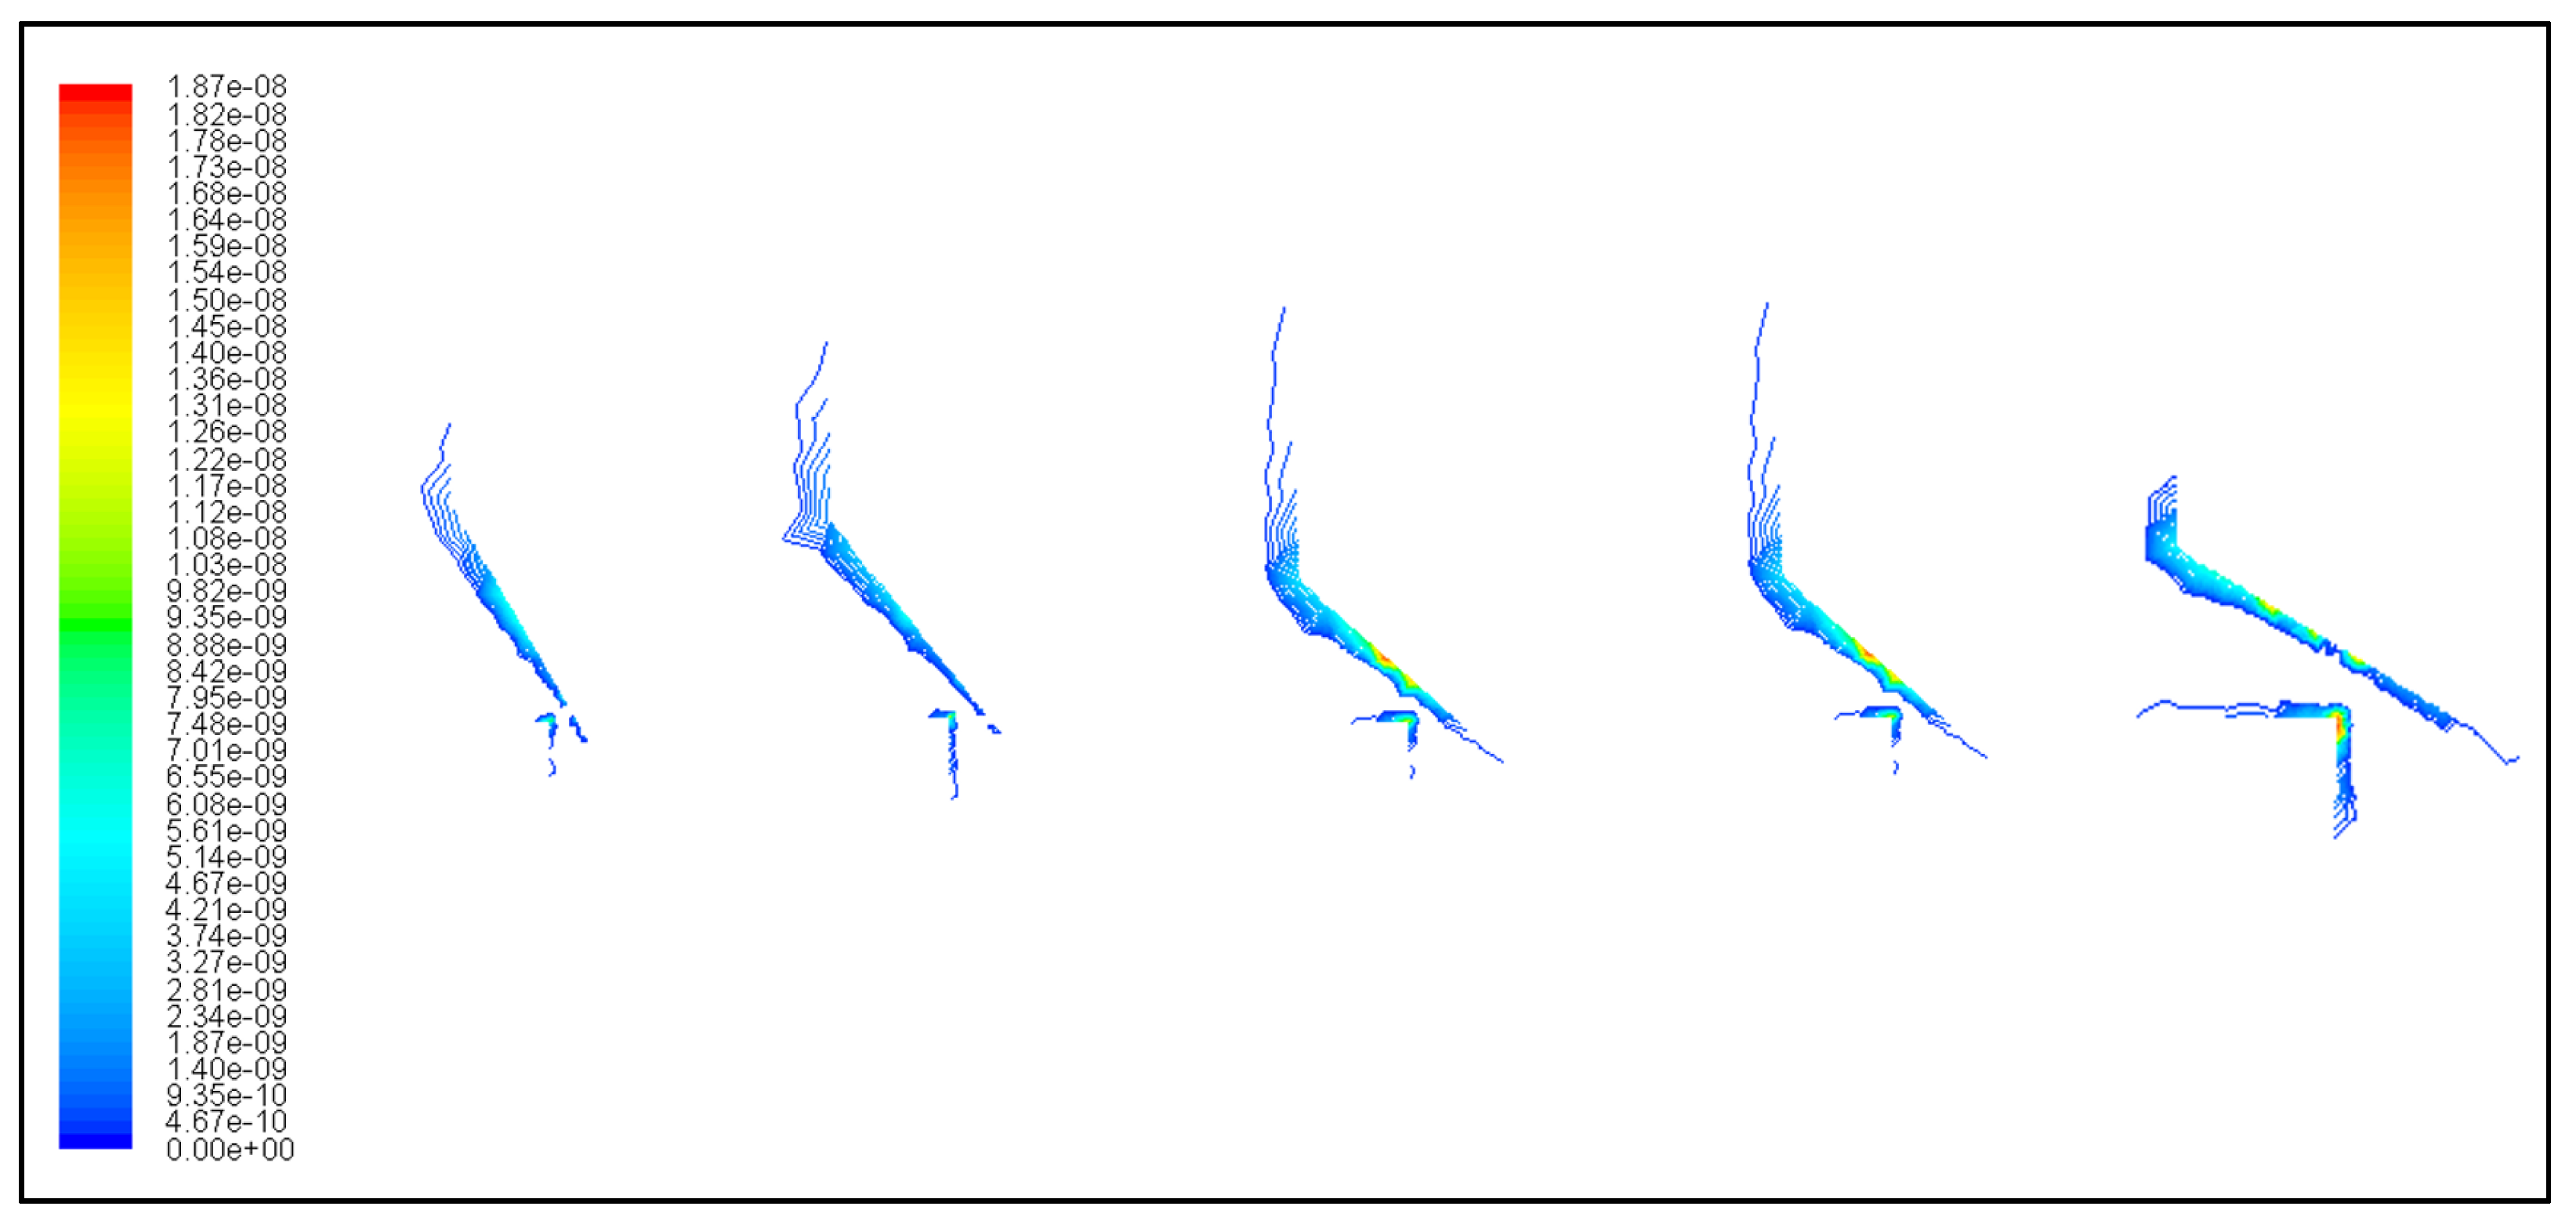
The change in the spool taper angle led to a change in the valve orifice structure, and there were great differences in the impact behavior of the particles flowing through different cone angle orifices. Combining Figure 9, Figure 10 and Figure 11 for analysis, we can conclude that:
- ①
- When the spool taper angle was small, the flow of oil was smoother and could be discharged in time after flowing through the valve orifice. Thus, the particles hit the wall of the orifice less often and the impact angle was smaller;
- ②
- Figure 1 shows that when the impact angle of the particles was 20–50°, the normal and tangential rebound coefficients were small, and the erosion damage of the particles on the material surface was great. The erosion angle of the particles on the taper angle of 90° and the 105° taper surface fell exactly in this angle range, resulting in serious erosion wear in the area near the sealing line of the taper angle of 90° and the 105° taper surface compared to other locations;
- ③
- With the increase in the spool taper angle, the valve orifice structure changed, causing increases in the particle number and speed, impacting the spool and valve seat, which intensified the erosion wear at the valve orifice and resulted in “the larger the spool cone angle, the more serious the erosion wear of the valve port” phenomenon.
The maximum velocity of fluid flow at the orifice increased from 39.6 m/s at the taper angle of 60° to 44.4 m/s at the taper angle of 120°, and the maximum velocity of particles increased from 83.6 m/s at the taper angle of 60° to 112 m/s at the taper angle of 120°. Therefore, reducing the angle of the spool taper angle reduced the velocity of particles hitting the wall, thus reducing the erosion damage of particles on the wall.
4.2. Effect of Pressure Difference at the Valve Port on Valve Port Erosion
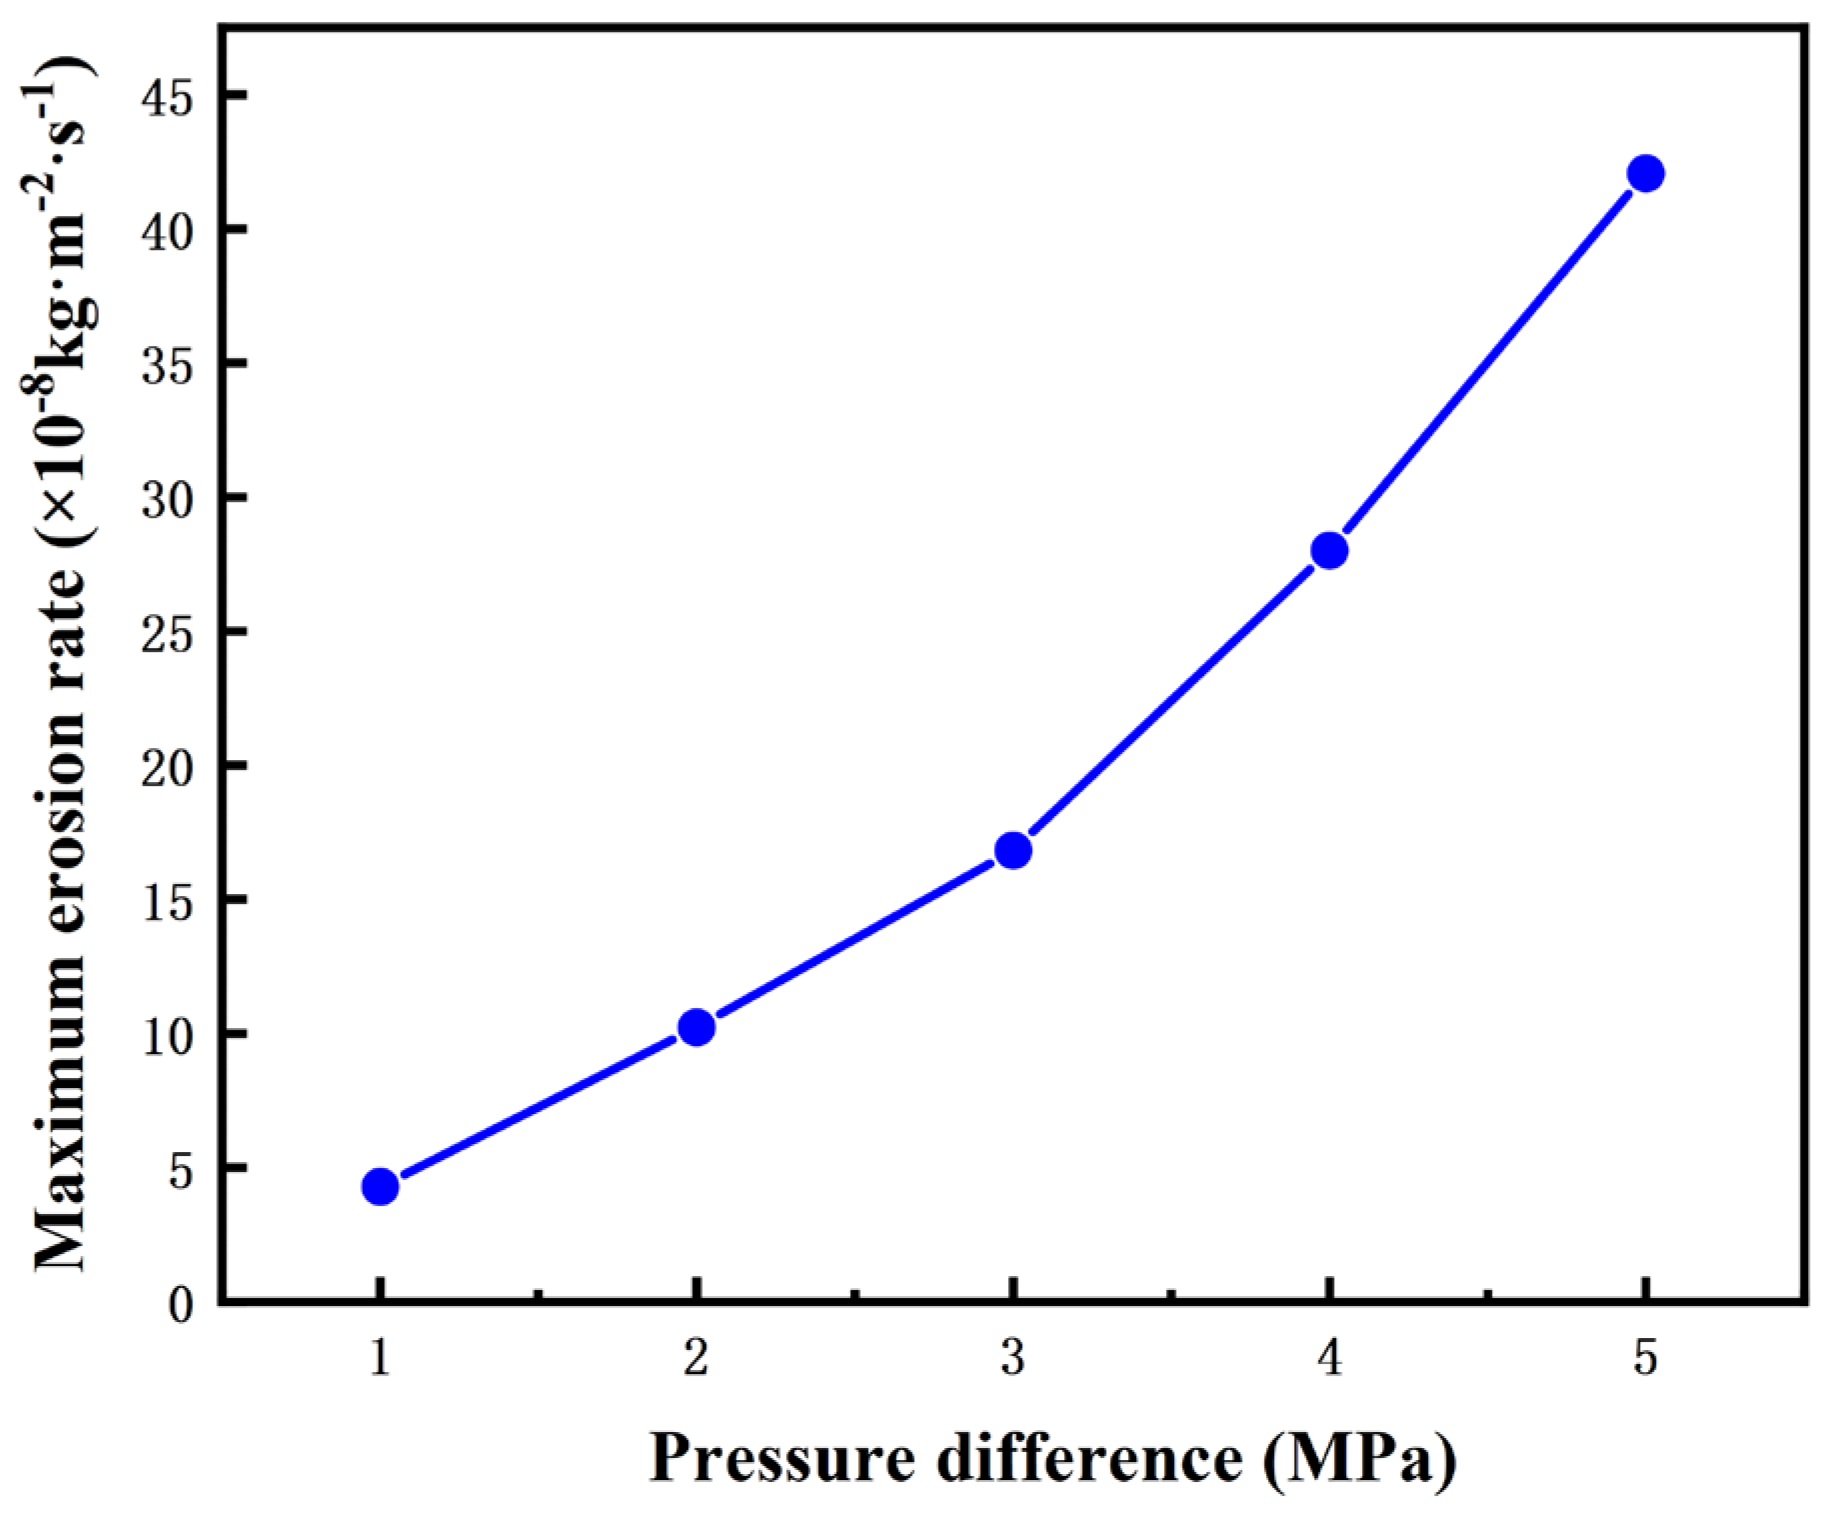
As the pressure difference at the valve port increased, the inlet flow rate and particle mass flow rate of the high-speed on/off valve also increased rapidly, and the number of particles impacting the wall per unit time increased, resulting in severe erosion wear at the valve port. As shown in Figure 12, the maximum erosion rate at a pressure difference of 5 MPa was about 10 times higher than that at a pressure difference of 1 MPa. This shows that the pressure difference at the valve port had a significant effect on the erosion.
By fitting the data with the least-squares method, the relationship between the maximum erosion rate and the pressure difference at the valve port was obtained as
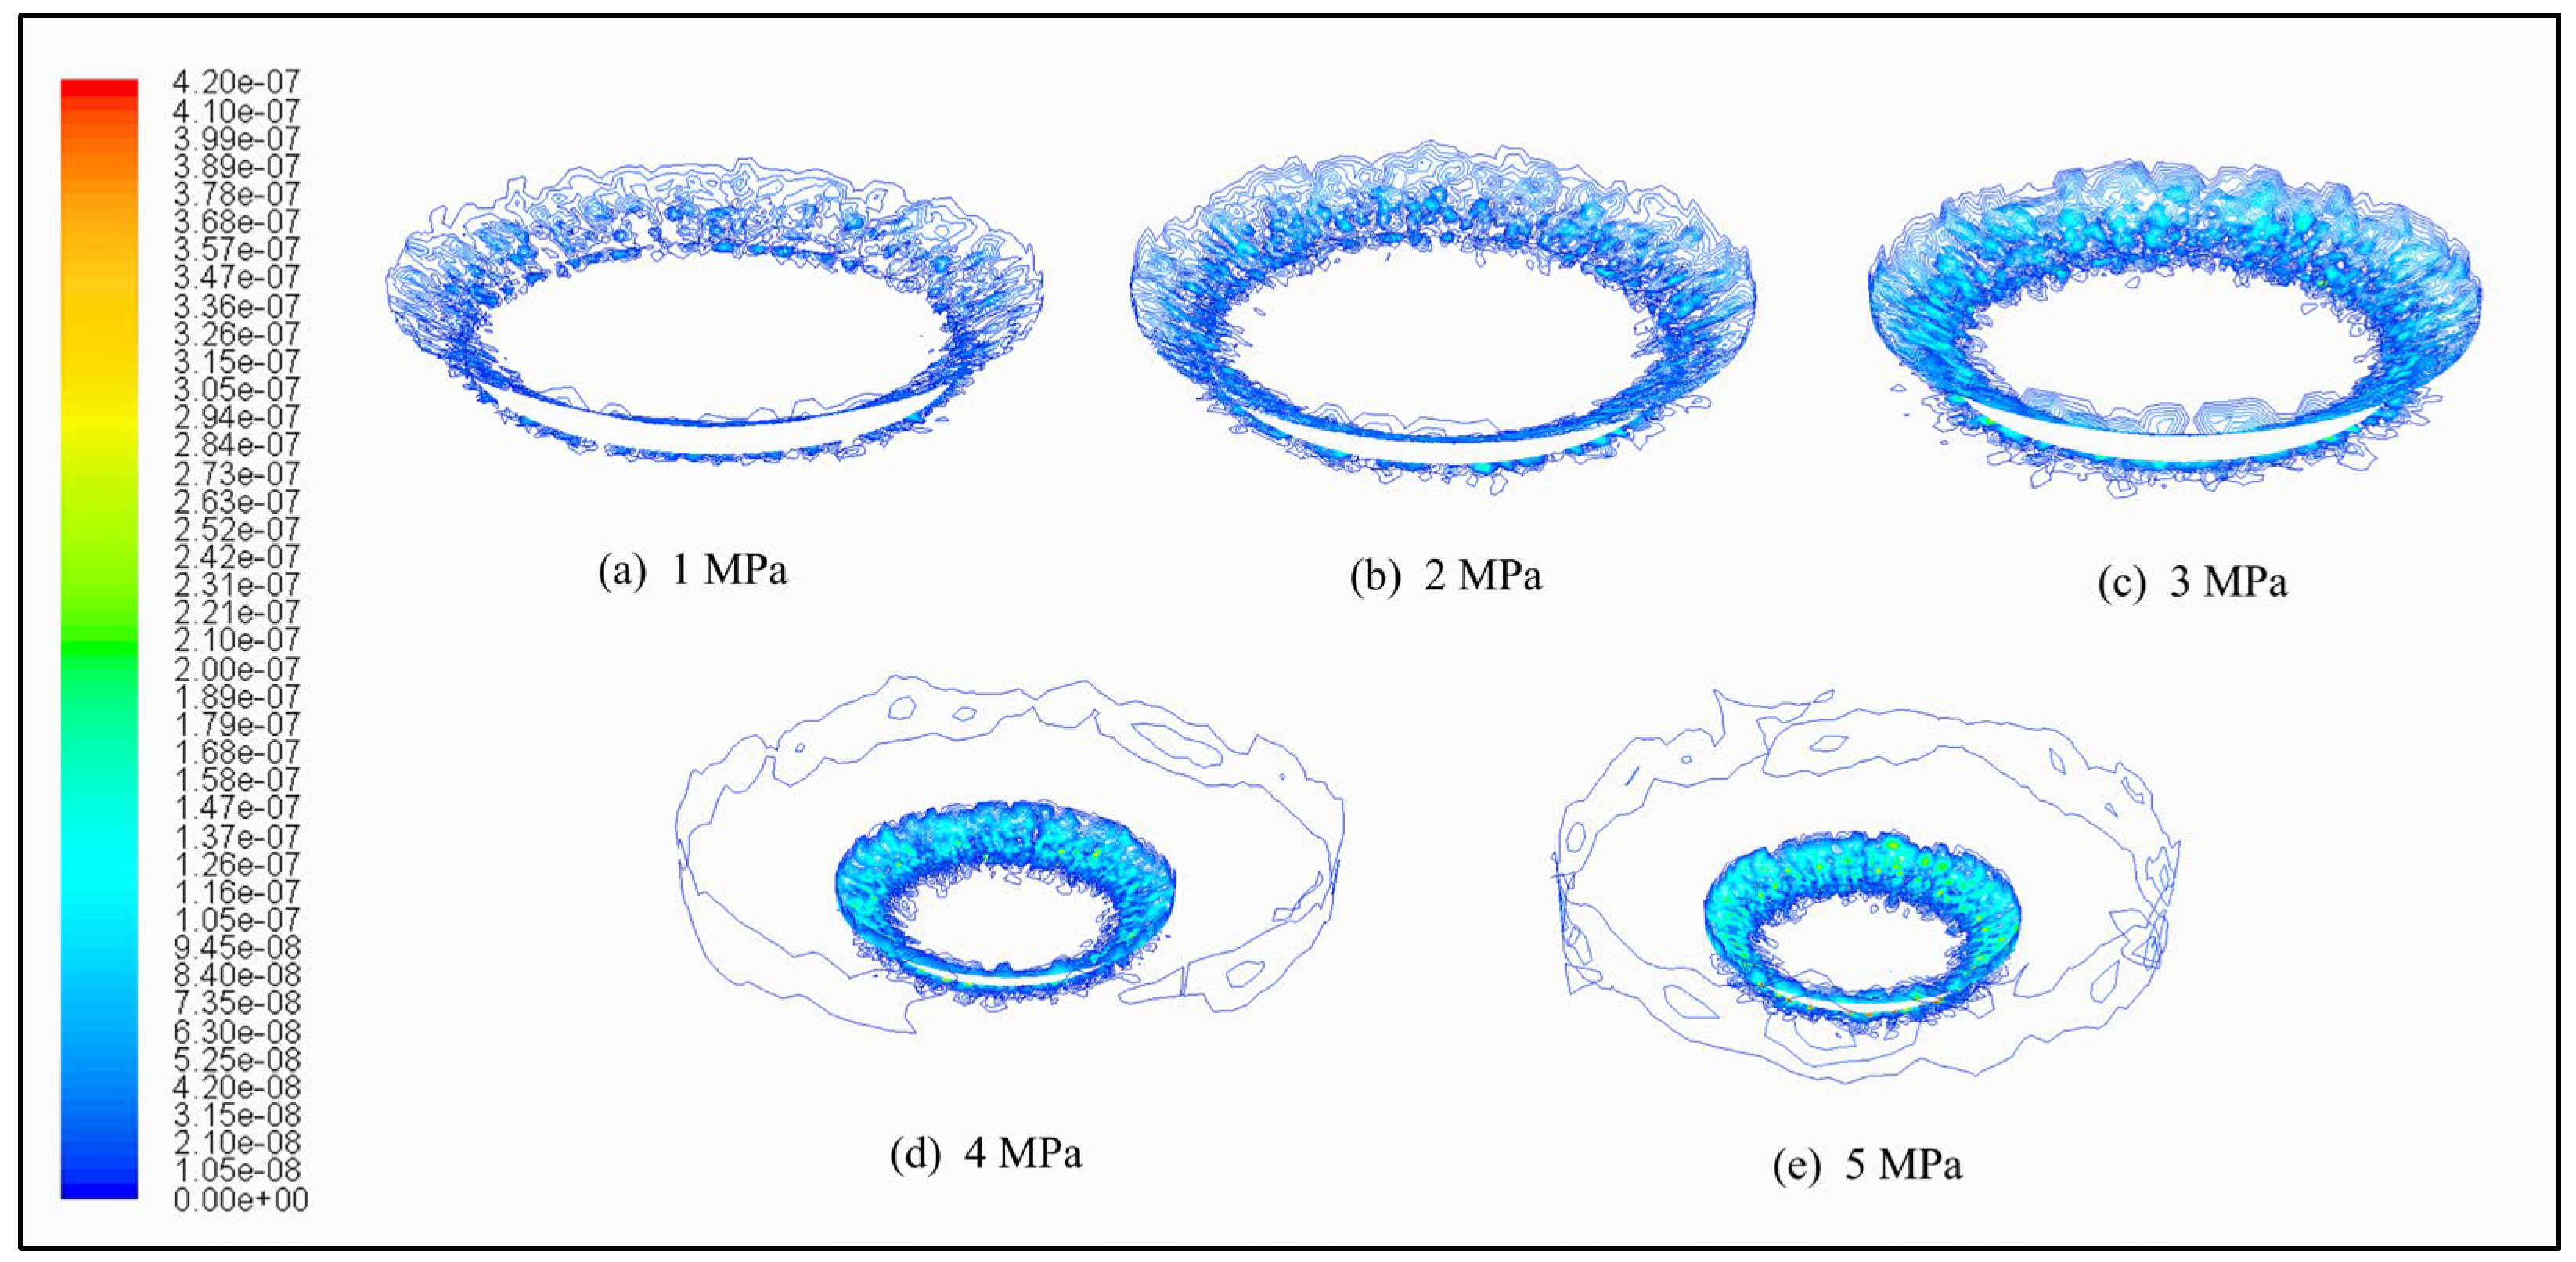
When the pressure difference at the valve port was less than 2 MPa, the spool erosion wear parts were mainly concentrated in the vicinity of the seal line. With the increase in the orifice pressure difference, the spool cone end and the valve body inner wall erosion wear increased (Figure 13). This is because with the increase in the pressure difference at the valve port, the speed of the fluid at the valve port and the speed of the contaminated particles in the fluid increased rapidly, and the particles, due to their inertia, continued to move forward in the original direction of motion after flowing out of the valve port, increasing the number of particles hitting the end of the spool cone and the wall of the valve body. The kinetic energy at the time of impact was also greater, resulting in more serious erosion wear at the end of the spool cone and the inner wall of the valve body.
4.3. Effect of Oil Contamination Level on Valve Port Erosion
The change in the oil contamination level is the increase or decrease in contaminated particles in the oil. For each level of increase in oil contamination, the mass flow of imported particles increased by one, the maximum erosion rate of the valve port became two times the original, and the service life of the high-speed on/off valve was reduced by half (Figure 14). This is consistent with the findings of Ge Pengfei et al. [26]. Therefore, improving the cleanliness of the hydraulic fluid can significantly improve the service life of the high-speed on/off valve.
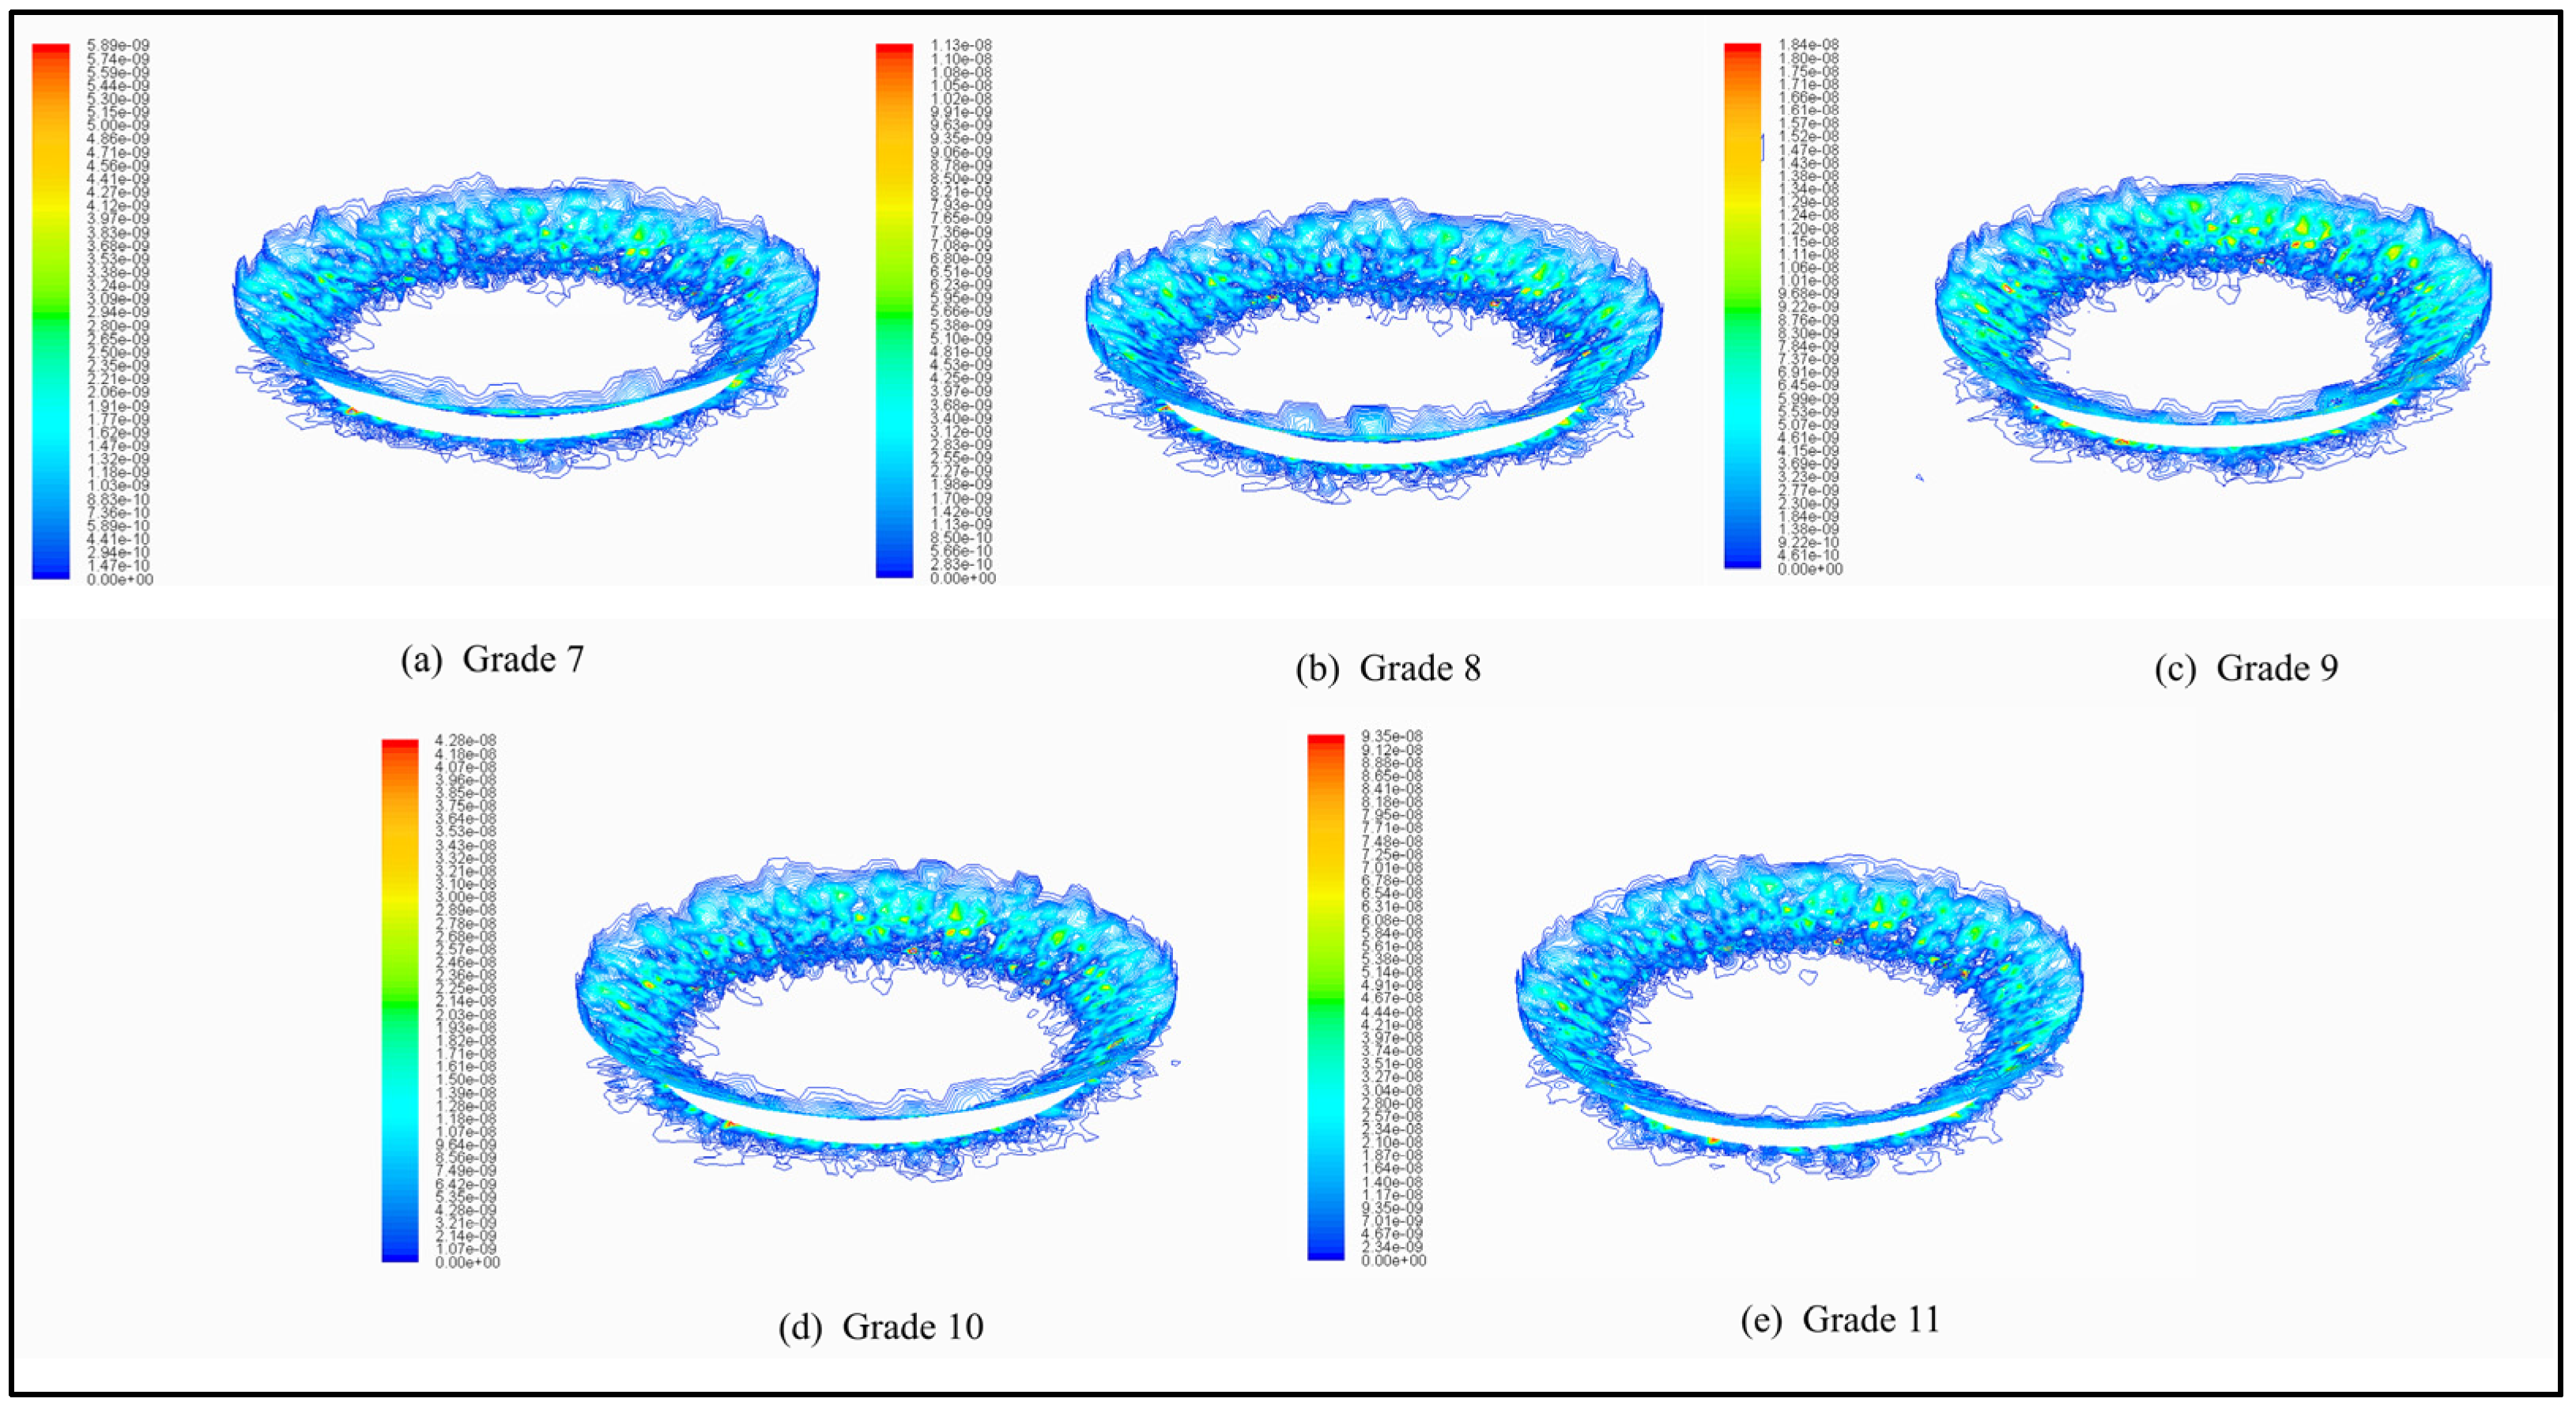
Since the valve port erosion rate varies greatly for different fluid contamination levels, the erosion rate distribution obtained from the simulation is represented using the respective axes. From Figure 15, we can see that the location of the valve port erosion wear was the same for different fluid contamination levels, but the higher the contamination level, the higher the number of contamination particles contained in the fluid. Therefore, the higher the level of fluid contamination, the more severe the erosion wear in the area of the outer end of the spool seal line.
4.4. Effect of Particle Size on Valve Port Erosion
The curve of the maximum erosion rate with the particle size is shown in Figure 16. Although the velocity of the large particles decreased compared to the small particles, with the maximum velocity of the particles decreasing from 122 m/s for 1 μm to 71 m/s for 9 μm, the kinetic energy of the large particles was larger than that of the small particles because the mass of the 9 μm particles was 729 times larger than that of the 1 μm particles. Therefore, the valve orifice erosion caused by large particles is also more serious, and the maximum valve orifice erosion rate under 9 μm particles is 63 times that of 1 μm particles.
Thus, if the proportion of large particles in the fluid is relatively large, the service life of the high-speed on/off valve will be significantly shortened.
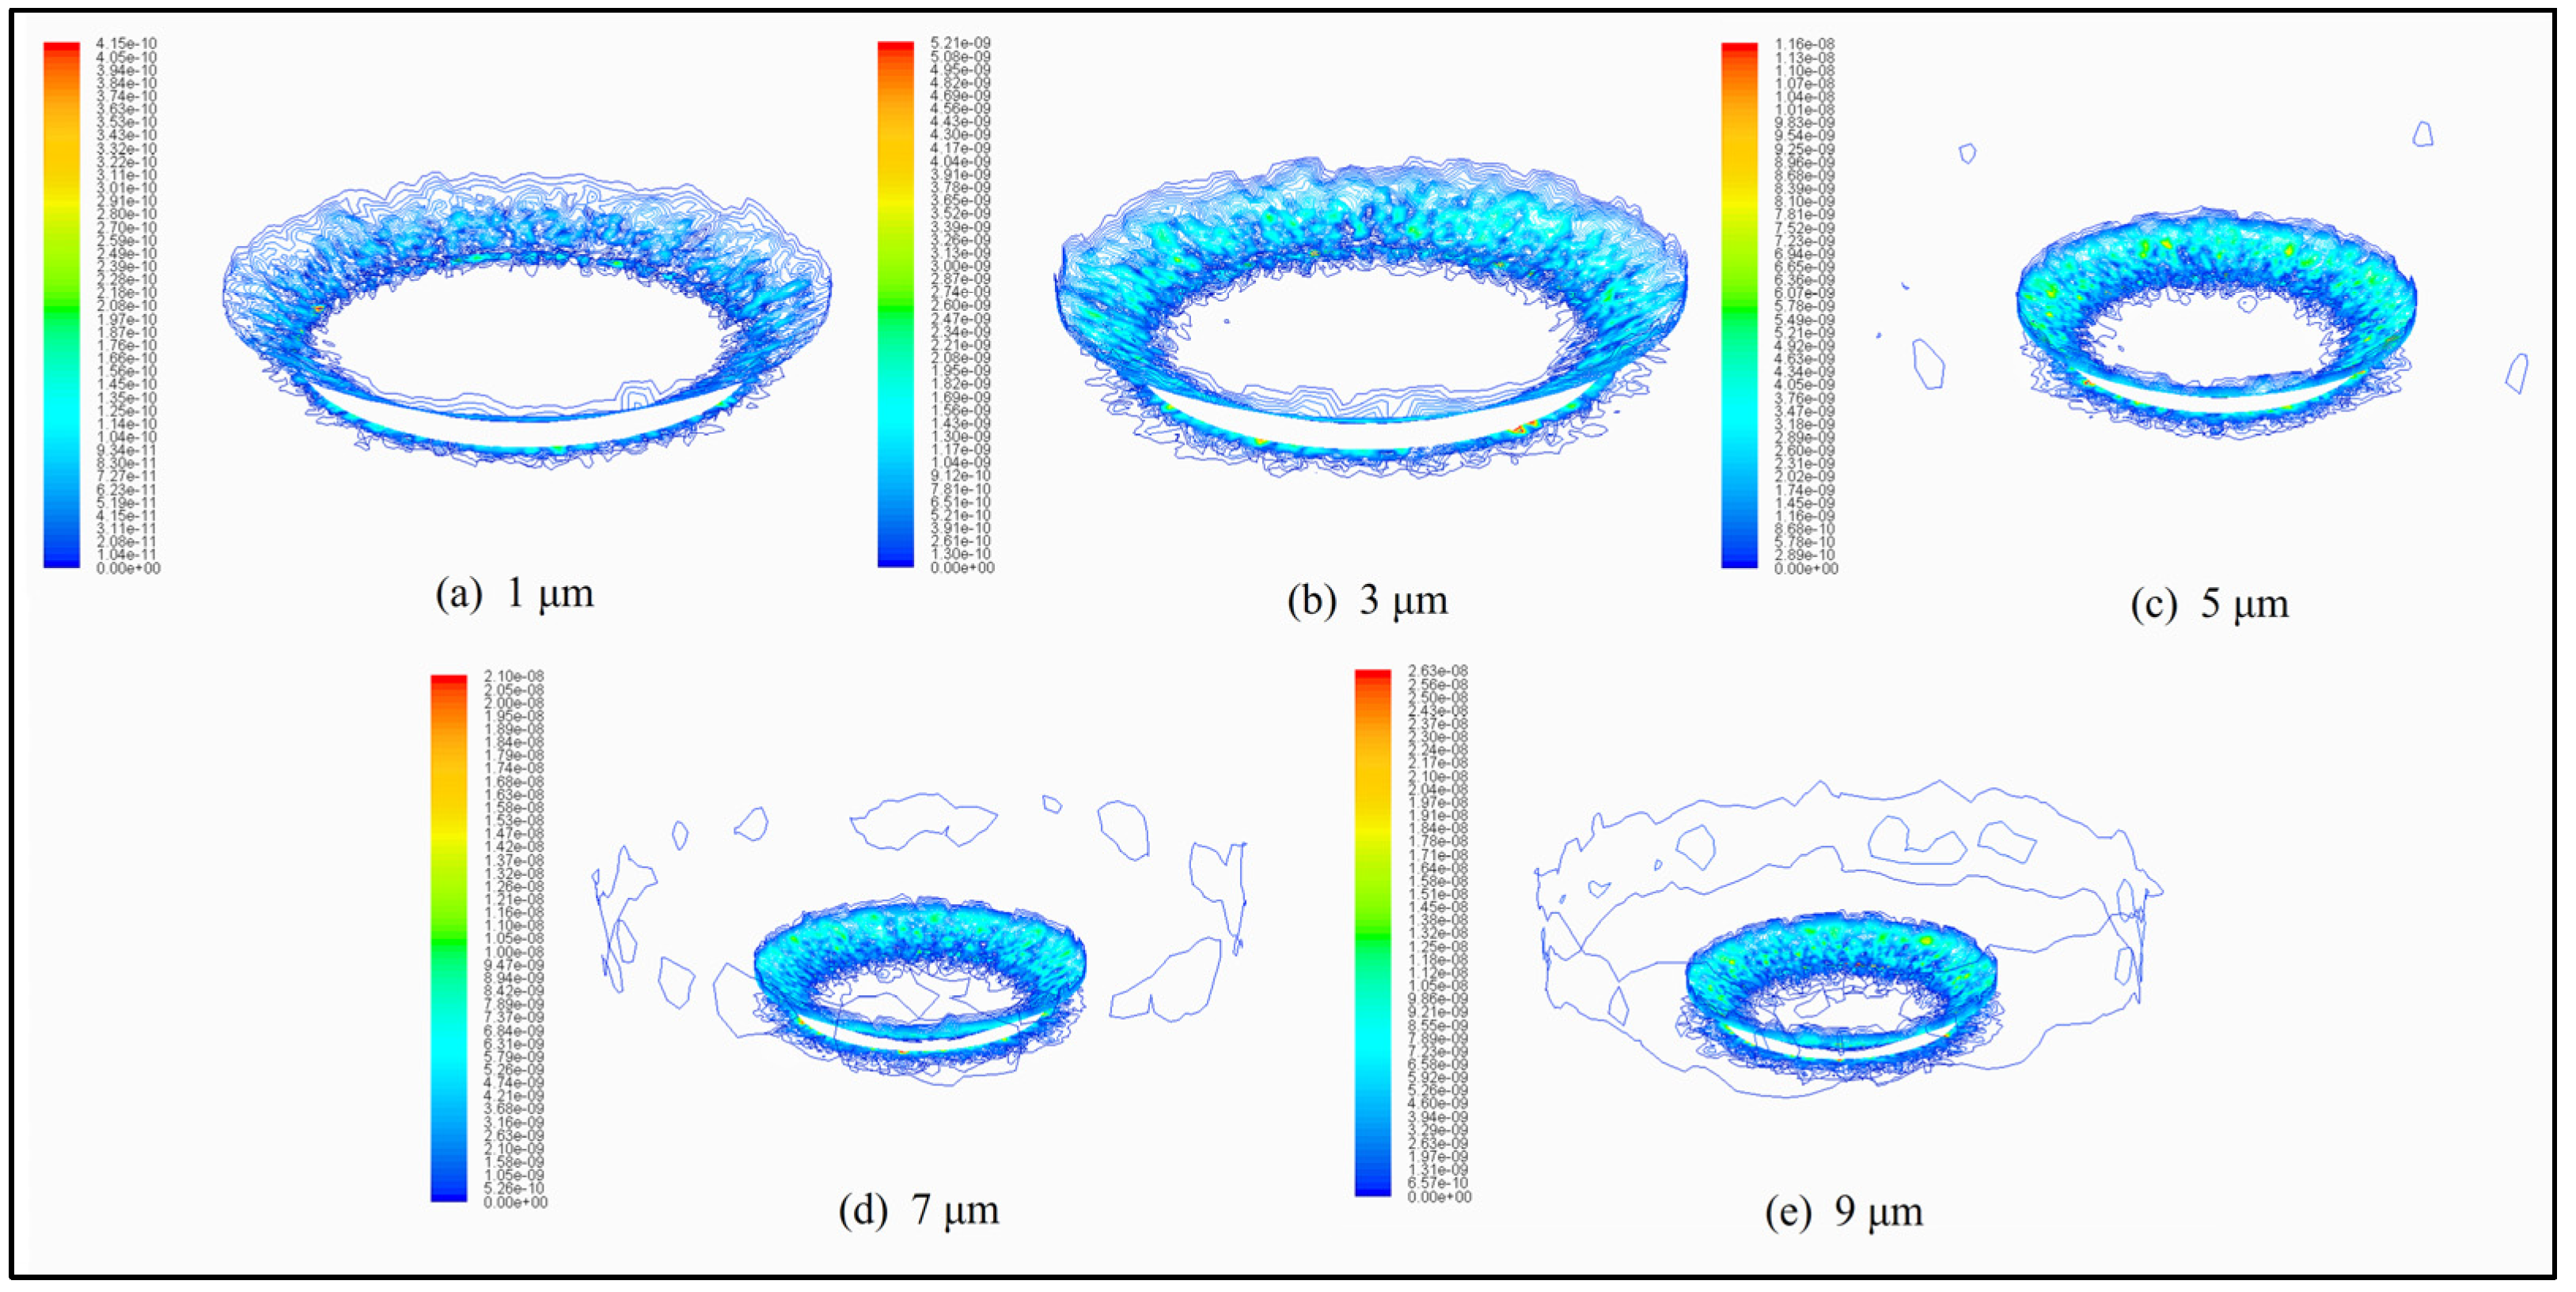
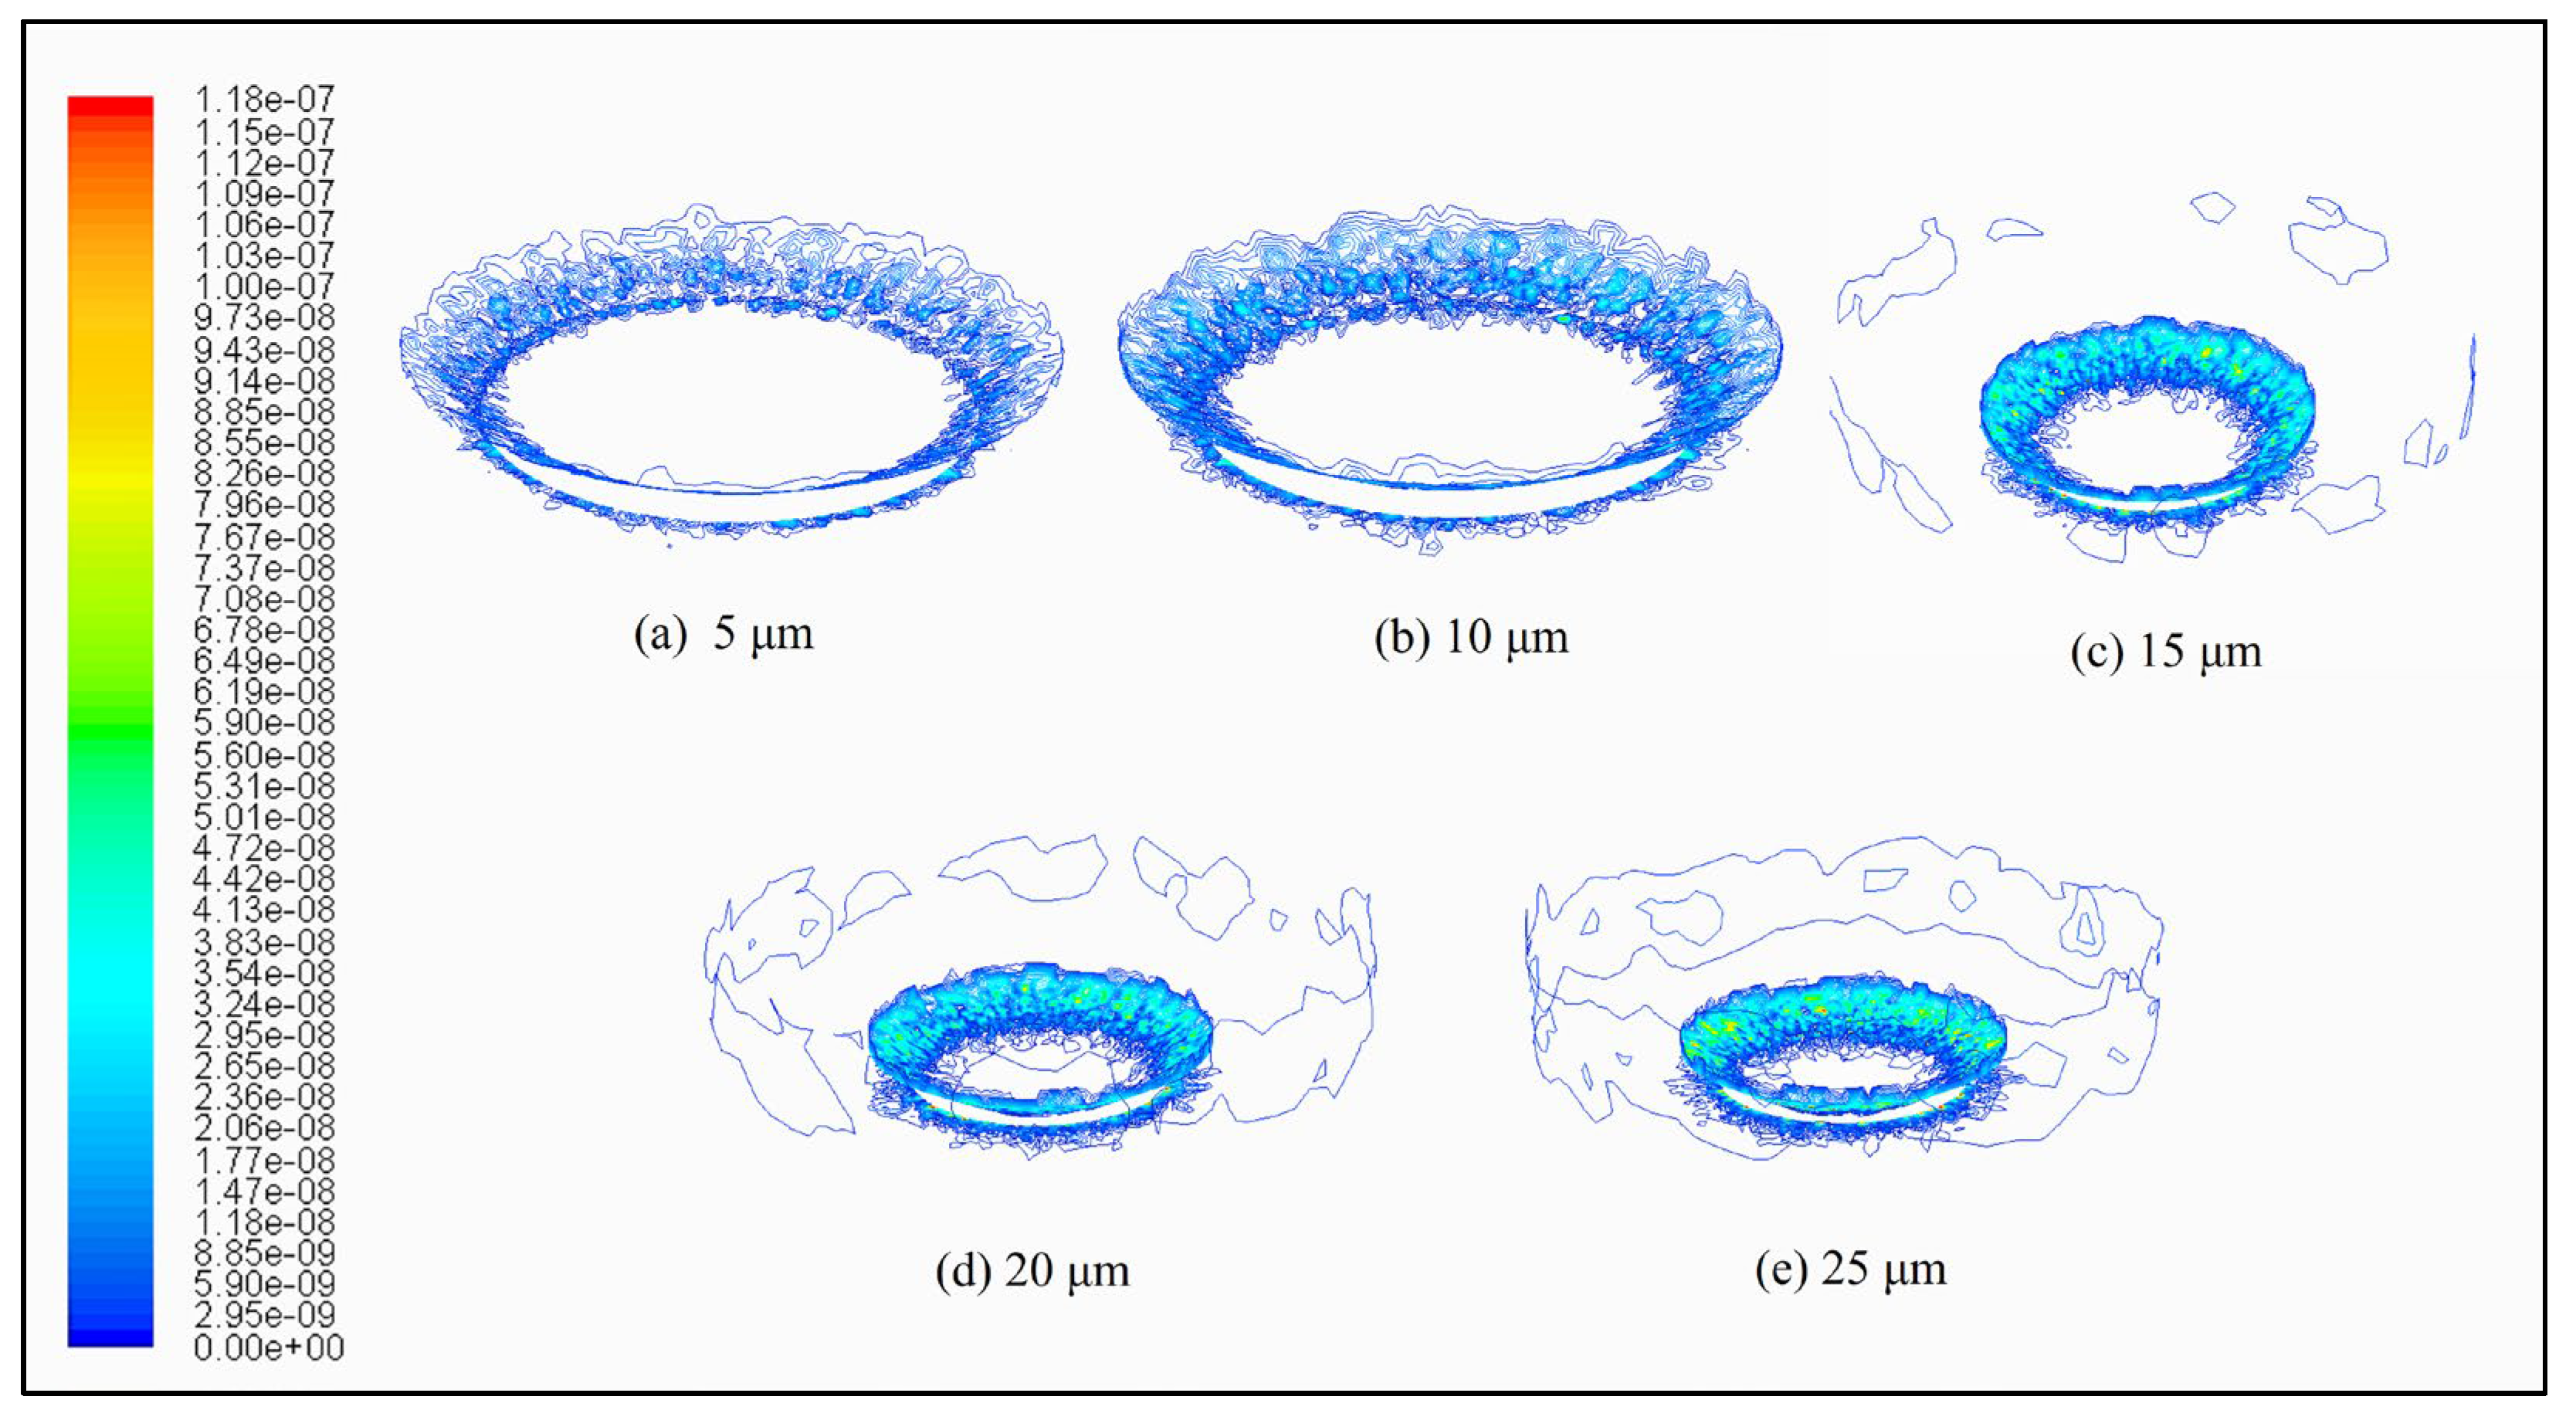
The distribution of the erosion rate for different particle sizes is shown in Figure 17. Due to the better flow-through of particles with a particle size of less than 3 μm, these particles flowing through the valve orifice were immediately carried by the oil flow to the direction of the outlet, so small particles of pollutants were mainly on the spool seal line near the area caused by erosion damage; particles of larger size, due to their inertia, continued to move forward in their original direction when flowing through the valve port, directly impacting the end of the cone and the inner wall of the valve body. Furthermore, because the kinetic energy of the large particles was relatively large compared to the small particles, the spool cone end and the inner wall of the valve body had more serious erosion wear.
4.5. Effect of Filter Pore Size on Valve Port Erosion
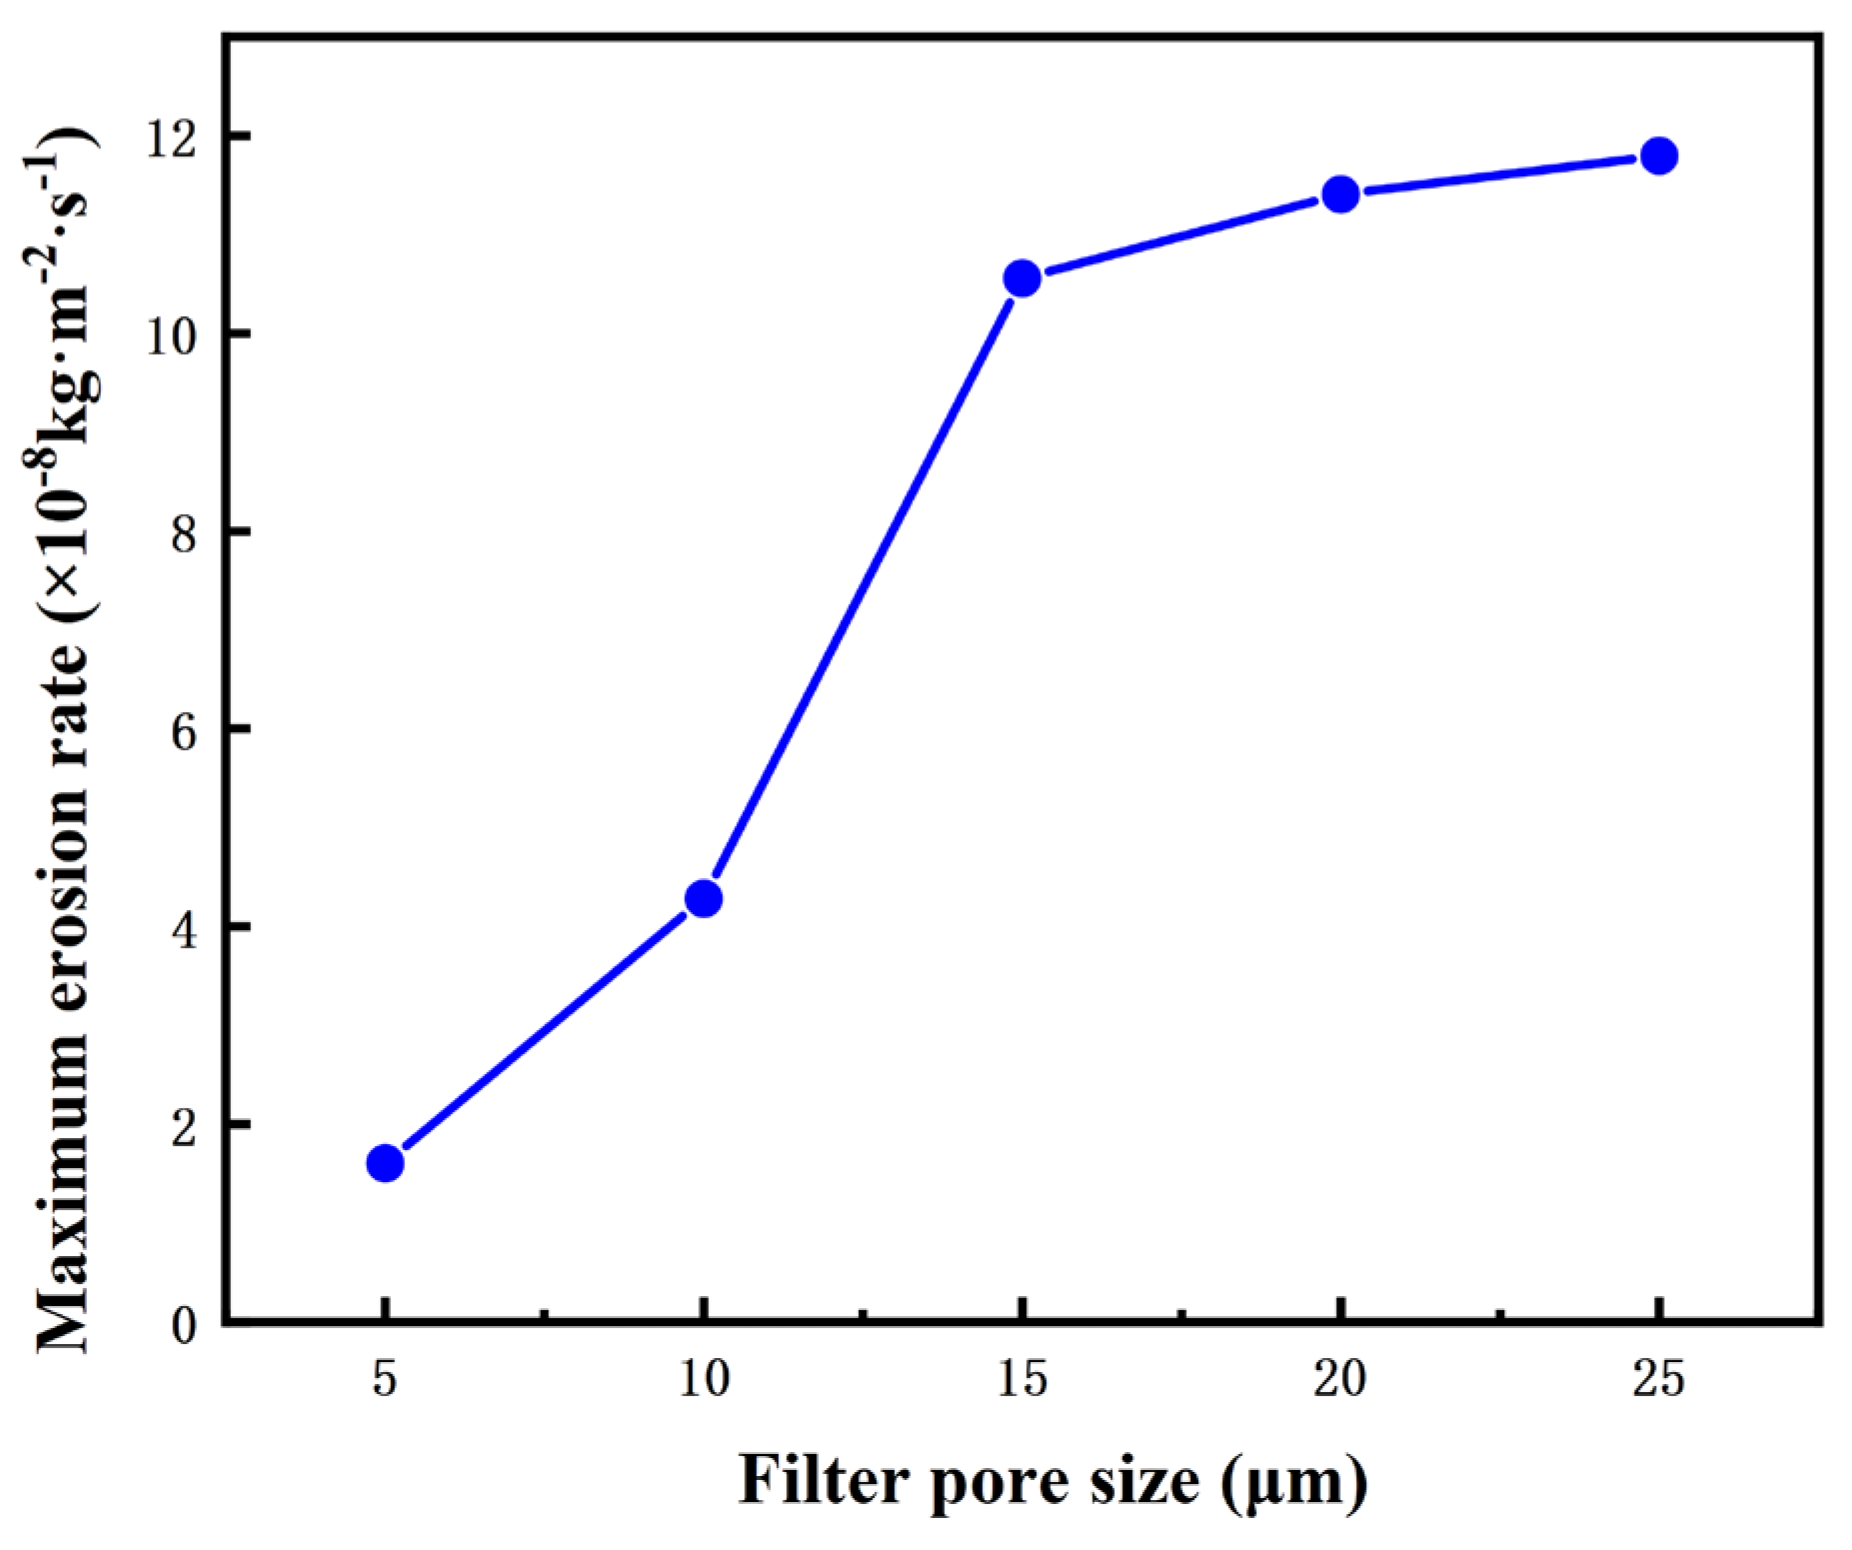
The curve of the maximum erosion rate with the filter pore size is shown in Figure 18. When the filter pore size changed from 15 μm to 10 μm and from 10 μm to 5 μm, the service life of the high-speed on/off valve both increased by 1.5 times. When the filter pore size changed from 25 μm to 15 μm, the service life of the high-speed on/off valve did not increase significantly. This is because, in a general hydraulic system, small particles account for a larger proportion of contaminants; particles with a particle size distribution below 15 μm account for about 93.13% (taking pollution level 10 as an example), while particles with a particle size greater than 15 μm account for only 6.87%. Therefore, the use of filters with a pore size of 15 μm or less can effectively filter the contaminated particles in the oil.
As shown in Figure 19, when the filter pore size was 5 μm, there were only particles less than 5 μm in the oil, the particles had good flowability, and the main impact site was located in the area near the spool cone seal line. However, as the filter pore size increased, the proportion of large particle contaminants in the oil increased, increasing the number of particles impacting the end of the cone and the inner wall of the valve body, which aggravated the erosion on the end of the spool cone and the inner wall surface of the valve body.
4.6. Correlation Analysis of Influencing Factors
The gray relational analysis was introduced into the analysis of the influencing factors of orifice erosion, and the correlation values of each influencing factor (spool taper angle, orifice pressure difference, oil contamination level, particle size, and filter pore size) and the maximum erosion rate were calculated. The most important factors affecting the maximum erosion rate of the orifice were determined according to the magnitude of the correlation [27]. The correlation values calculated according to the gray relational analysis are shown in Table 3.
The table shows that the influencing factor with the greatest correlation is the pressure difference at the valve port, indicating that the change in the pressure difference at the valve port is most likely to cause changes in the maximum erosion rate at the valve port. The two influencing factors with the second and third highest correlations are the particle size and filter aperture. From this, it is clear that reducing the proportion of large particle contaminants in the fluid, as well as the use of an appropriate aperture filter, can significantly improve the service life of high-speed on/off valves.
5. Conclusions
- (1)
- Considering the influence of the fluid vortex at the valve orifice, a three-dimensional prediction model of valve orifice erosion of high-speed on/off valves was established, revealing the causes of valve orifice erosion: valve orifice erosion of high-speed on/off valves is mainly caused by the mainstream beam and centrifugal particle erosion of the valve cavity vortex together.
- (2)
- Several factors influencing valve port erosion were simulated to investigate the change rule of valve port erosion under different factors:
- ①
- With the increase in the spool cone angle, the maximum erosion rate of the valve port increased linearly;
- ②
- With the increase in the pressure difference at the valve port, the oil flow rate and the particle mass flow rate at the inlet of the high-speed on/off valve increased rapidly, resulting in a rapid increase in the maximum erosion rate at the valve port;
- ③
- The kinetic energy of large particle contaminants was much larger compared to small particles, resulting in a significant shortening of the service life of the high-speed on/off valve;
- ④
- For each increase in the oil contamination level, the particle mass flow rate at the inlet increased by a factor of one, and the service life of the high-speed on/off valve was also shortened by half;
- ⑤
- The use of filters with a filtration pore size of 15 μm or less effectively filtered the contaminated particles in the oil, and the service life of the high-speed on/off valve was significantly improved.
- (3)
- Gray relational analysis was used to establish the pressure difference at the valve orifice, the particle size, and the filter aperture as the three most important factors affecting the erosion of the valve orifice of the high-speed on/off valve. In other words, reducing the pressure difference at the valve port, reducing the proportion of large particle pollutants in the oil, and selecting a filter with an appropriate pore size can significantly improve the service life of the high-speed on/off valve.
Author Contributions
Validation, Y.L. (Yuzheng Li), H.D. and H.H.; Writing—original draft, J.D.; Writing—review & editing, Y.L. (Yijun Lan). All authors have read and agreed to the published version of the manuscript.
Funding
This research was funded by the subproject of the National Key R&D Program, Key Technology of Design and Manufacture of a Micro High-Speed On/Off Valve, grant number 2019YFB2005103.
Institutional Review Board Statement
Not applicable.
Informed Consent Statement
Not applicable.
Data Availability Statement
Not applicable.
Conflicts of Interest
The authors declare no conflict of interest.
Nomenclature
| Density of the fluid | |
| Dynamic viscosity of the fluid | |
| Velocity of the fluid | |
| Time-averaged velocity of the fluid | |
| Fluctuating fluid velocity at the particle location | |
| Velocity component of the fluid | |
| Kinematic viscosity of the fluid | |
| k | Turbulent kinetic energy |
| Turbulent dissipation rate | |
| Time | |
| Timestep | |
| Density of the particles | |
| Diameter of the particles | |
| Mass of a single particle | |
| Mass flow rate of the particles | |
| Velocity of particles | |
| Instantaneous fluid velocity at the particle location | |
| Temporal mean velocity of the fluid at the particle location | |
| Vp | Velocity of the particle relative to the wall |
| Volume content of particles | |
| Random numbers that obey the normal distribution | |
| Pulse width modulation |
References
- Askari, A.; Jozaei, A.F. Numerical simulation of the effect of valve opening and particle concentration on the erosion damage in ball valves of pressure reducing station. J. Comput. Appl. Mech. 2018, 50, 127–134. [Google Scholar]
- Wallace, M.S.; Dempster, W.M.; Scanlon, T.J.; Peters, J.; Mcculloch, S. Prediction of impact erosion in valve geometries. Wear 2004, 256, 927–936. [Google Scholar] [CrossRef]
- Yin, Y.B.; Yuan, J.Y.; Guo, S.R. Numerical study of solid particle erosion in hydraulic spool valves. Wear 2017, 392, 174–189. [Google Scholar]
- Zhang, K.; Yao, J.; Jiang, T. Degradation assessment and life prediction of electro-hydraulic servo valve under erosion wear. Eng. Fail. Anal. 2014, 36, 284–300. [Google Scholar] [CrossRef]
- Chu, Y.B.; Yuan, Z.H.; Zhang, Y. Erosion wear characteristic of jet pipe servo valve. Acta Aeronaut. Astronaut. Sin. 2015, 36, 1548–1555. [Google Scholar]
- Yin, Y.B.; Fu, J.H.; Jin, Y.L. Numerical simulation of erosion wear of pre-stage of jet pipe servo valve. J. Zhejiang Univ. (Eng. Sci.) 2015, 9, 2250–2260. [Google Scholar]
- Liu, X.Q.; Ji, H.; Wu, J.H.; Cui, T.X.; Yang, X.B.; Yuan, W.B. Numerical prediction of impact-friction erosion wear of hydraulic poppet valve orifice and countermeasure for its reduction. J. Lanzhou Univ. Technol. 2019, 6, 40–44. [Google Scholar]
- ANSYS. ANSYS Fluent Theory Guide; ANSYS: Canonsburg, PA, USA, 2013. [Google Scholar]
- Clift, R.; Grace, J.R.; Weber, M.E. Bubbles, Drops, and Particles; The University of Texas at San Antonio: San Antonio, TX, USA, 2005. [Google Scholar]
- Mei, R. An approximate expression for the shear lift force on a spherical particle at finite Reynolds number. Int. J. Multiph. Flow 1992, 18, 145–147. [Google Scholar] [CrossRef]
- Shuen, J.S.; Chen, L.D.; Faeth, G.M. Evaluation of a stochastic model of particle dispersion in a turbulent round jet. Aiche J. 2010, 29, 167–170. [Google Scholar] [CrossRef]
- Meng, H.; Cwm, G. Particle Trajectory Computations in Steady Non-Uniform Liquid Flows; ASME: New York, NY, USA, 1991. [Google Scholar]
- Gosman, A.D.; Loannides, E. Aspects of computer simulation of liquid-fueled combuster. J. Energy 1983, 7, 482–490. [Google Scholar] [CrossRef]
- Lin, N.; Lan, H.Q.; Xu, Y.G.; Cui, Y.; Barber, G. Coupled effects between solid oarticles and gas velocities on erosion of elbows in natural gas pipelines. Procedia Eng. 2015, 102, 893–903. [Google Scholar] [CrossRef] [Green Version]
- Amsden, A.A. KIVA-II: A Computer Program for Chemically Reactive Flows with Sprays; Los Alamos National Laboratory Report; Los Alamos National Lab. (LANL): Los Alamos, NM, USA, 1989.
- Faeth, G. Spray atomization and combustion. In Proceedings of the 24th Aerospace Sciences Meeting, Reno, NV, USA, 6–9 January 1986. [Google Scholar]
- Grant, G.; Tabakoff, W. Erosion prediction in turbomachinery resulting from environmental solid particles. J. Aircr. 2012, 12, 471–478. [Google Scholar] [CrossRef]
- Edwards, J.K.; Mclaury, B.S.; Shirazi, S.A. Evaluation of alternative pipe bend fittings in erosive service. In Proceedings of the 2000 ASME Fluids Engineering Division Summer Meeting: Presented at the 2000 ASME FluidS Engineering Division Summer Meeting, Boston, MA, USA, 11–15 June 2000. [Google Scholar]
- Roache, P.J. Quantification of uncertainty in computational fluid dynamics. Ann. Rev. Fluid Mech. 1997, 29, 123–160. [Google Scholar] [CrossRef] [Green Version]
- An, E.K.; Zhang, R.; Han, Y.F.; Liu, D. Mesh-independent analysis for numerical simulation of multi-phase turbulent combustion. Boil. Technol. 2018, 49, 5. [Google Scholar]
- Celik, I.B.; Ghia, U.; Roache, P.J.; Freitas, C.J. Procedure for estimation and reporting of uncertainty due to discretization in CFD applications. J. Fluids Eng. Trans. ASME 2008, 130, 078001. [Google Scholar]
- Manna, P.; Dharavath, M.; Sinha, P.K.; Chakraborty, D. Optimization of a flight-worthy scramjet combustor through CFD. Aerosp. Sci. Technol. 2013, 27, 138–146. [Google Scholar] [CrossRef]
- Chen, X.; Mclaury, B.S.; Shirazi, S.A. Application and experimental validation of a computational fluid dynamics (CFD)-based erosion prediction model in elbows and plugged tees. Comput. Fluids 2004, 33, 1251–1272. [Google Scholar] [CrossRef]
- Zheng, S.J.; Quan, L. CFD visual analysis on cross section of truncated poppet valve. Trans. Chin. Soc. Agric. Mach. 2014, 45, 327–333. [Google Scholar]
- Huang, W.J.; Liu, C.L.; Li, Z.J.; Wang, J.J.; Liao, Z.K. Effect offlow velocity and particle size on the erosion of QAl9-4 aluminum bronze. J. Funct. Mater. 2016, 47, 5. [Google Scholar]
- Ge, P.F.; Zheng, C.S.; Ma, B. Hydraulic valve contamination wear loss efficiency research and analysis of factors affecting. Acta Armamentarii 2014, 35, 298–304. [Google Scholar]
- Zhou, Y.M.; Wu, G.Z.; Li, D.; Zhang, Y.P. Application of Grey Relational Analysis in the evaluation of energy consumption of crude oil gathering and transmission system. Oil-Gasfield Surf. Eng. 2009, 28, 2. [Google Scholar]
Figure 1.
Curve of rebound coefficient with collision angle.

Figure 2.
High-speed on/off valve structure and its fluid domain (spool taper angle—120°; valve opening—0.2 mm), 1—valve body, 2—upper-end cap, 3—adjusting screw, 4—anti-loosening adjusting nut, 5—spring pressure plate, 6—solenoid, 7—armature, 8—spring, 9—connecting rod, 10—valve body, 11—valve spool, 12—valve seat, 13—seals.

Figure 3.
Mesh of the flow field.

Figure 4.
The curve of the maximum erosion rate with the number of particle packets.

Figure 5.
(a) Velocity contours on the axisymmetric plane; (b) velocity pathlines on the axisymmetric plane.
Figure 5.
(a) Velocity contours on the axisymmetric plane; (b) velocity pathlines on the axisymmetric plane.

Figure 6.
Diagram of particle trajectory.

Figure 7.
(a) Distribution of erosion rate on valve port (unit: kg·m−2·s−1); (b) distribution of erosion rate on axisymmetric surface (unit: kg·m−2·s−1).
Figure 7.
(a) Distribution of erosion rate on valve port (unit: kg·m−2·s−1); (b) distribution of erosion rate on axisymmetric surface (unit: kg·m−2·s−1).

Figure 8.
The curve of the maximum erosion rate with the spool cone angle (inlet pressure—5 MPa, outlet pressure—4 MPa, valve opening—0.2 mm, oil contamination level—10, particle size range— 1–10 μm).
Figure 8.
The curve of the maximum erosion rate with the spool cone angle (inlet pressure—5 MPa, outlet pressure—4 MPa, valve opening—0.2 mm, oil contamination level—10, particle size range— 1–10 μm).

Figure 9.
Velocity traces at different spool taper angles (unit: m/s).

Figure 10.
Distribution of erosion rate at different spool taper angles (unit: kg·m−2·s−1).

Figure 11.
Distribution of erosion rate on axisymmetric surface (unit: kg·m−2·s−1).

Figure 12.
The curve of the maximum erosion rate with the pressure difference at the valve port (inlet pressure—5 MPa, outlet pressure—4 MPa, 3 MPa, 2 MPa, 1 MPa, and 0, valve opening—0.2 mm, spool taper angle—120°, oil contamination class—10, particle size range—1–10 μm).
Figure 12.
The curve of the maximum erosion rate with the pressure difference at the valve port (inlet pressure—5 MPa, outlet pressure—4 MPa, 3 MPa, 2 MPa, 1 MPa, and 0, valve opening—0.2 mm, spool taper angle—120°, oil contamination class—10, particle size range—1–10 μm).

Figure 13.
Distribution of erosion rate at different pressure differences of valve port (unit: kg·m−2·s−1).
Figure 13.
Distribution of erosion rate at different pressure differences of valve port (unit: kg·m−2·s−1).

Figure 14.
The curve of the maximum erosion rate with the oil contamination level (inlet pressure—5 MPa, outlet pressure—4 MPa, valve opening—0.2 mm, spool taper angle—120°, and particle size range—1–10 μm).
Figure 14.
The curve of the maximum erosion rate with the oil contamination level (inlet pressure—5 MPa, outlet pressure—4 MPa, valve opening—0.2 mm, spool taper angle—120°, and particle size range—1–10 μm).

Figure 15.
Distribution of erosion rate with different oil contamination levels (unit: kg·m−2·s−1).

Figure 16.
The curve of the maximum erosion rate with the particle size (inlet pressure—5 MPa, outlet pressure—4 MPa, spool taper angle—120°, valve opening—0.2 mm, set particle size for single-particle size, assuming 200,000 particles per 100 mL of fluid).
Figure 16.
The curve of the maximum erosion rate with the particle size (inlet pressure—5 MPa, outlet pressure—4 MPa, spool taper angle—120°, valve opening—0.2 mm, set particle size for single-particle size, assuming 200,000 particles per 100 mL of fluid).

Figure 17.
Distribution of erosion rate for different particle sizes (unit: kg·m−2·s−1).

Figure 18.
The curve of the maximum erosion rate with a filter pore size (inlet pressure—5 MPa, outlet pressure—4 MPa, valve opening—0.2 mm, spool taper angle—120°, oil pollution grade—10).
Figure 18.
The curve of the maximum erosion rate with a filter pore size (inlet pressure—5 MPa, outlet pressure—4 MPa, valve opening—0.2 mm, spool taper angle—120°, oil pollution grade—10).

Figure 19.
Distribution of erosion rate with different filter pore sizes (unit: kg·m−2·s−1).


Table 1.
Properties of the materials.
| Parameters | Value |
|---|---|
| Oil density | 960 kg/m3 |
| Dynamic viscosity | 0.048 Pa·s |
| Particulate material | Iron powder |
| Particle shape | Spherical |
| Particle density | 8030 kg/m3 |
| Particle hardness | 90 HB |
| Particle size range | 1–10 μm |
Table 2.
Calculation results of discretization error.
| Number of Grids | r21 | r32 | Outlet Flow Rate (kg/s) | p | GCI |
|---|---|---|---|---|---|
| 47,746, 110,684, 310,548 | 1.3235 | 1.4104 | 0.0721, 0.0636, 0.0634 | 1.97 | 1.94% |
Table 3.
Calculation results of correlation degrees.
| Influencing Factors | Correlation Values | Rank |
|---|---|---|
| Pressure difference | 1.000 | 1 |
| Particle size | 0.741 | 2 |
| Filter pore size | 0.694 | 3 |
| Oil contamination level | 0.620 | 4 |
| Spool taper angle | 0.576 | 5 |
Publisher’s Note: MDPI stays neutral with regard to jurisdictional claims in published maps and institutional affiliations. |
© 2022 by the authors. Licensee MDPI, Basel, Switzerland. This article is an open access article distributed under the terms and conditions of the Creative Commons Attribution (CC BY) license (https://creativecommons.org/licenses/by/4.0/).
Share and Cite
MDPI and ACS Style
Li, Y.; Du, J.; Lan, Y.; Du, H.; Huang, H. Numerical Analysis of the Factors Influencing the Erosion of the Valve Port of a High-Speed On/Off Valve. Appl. Sci. 2022, 12, 6212. https://0-doi-org.brum.beds.ac.uk/10.3390/app12126212
AMA Style
Li Y, Du J, Lan Y, Du H, Huang H. Numerical Analysis of the Factors Influencing the Erosion of the Valve Port of a High-Speed On/Off Valve. Applied Sciences. 2022; 12(12):6212. https://0-doi-org.brum.beds.ac.uk/10.3390/app12126212
Chicago/Turabian StyleLi, Yuzheng, Jintao Du, Yijun Lan, Heng Du, and Hui Huang. 2022. "Numerical Analysis of the Factors Influencing the Erosion of the Valve Port of a High-Speed On/Off Valve" Applied Sciences 12, no. 12: 6212. https://0-doi-org.brum.beds.ac.uk/10.3390/app12126212
Note that from the first issue of 2016, this journal uses article numbers instead of page numbers. See further details here.