
Enlargements of Viewing Zone and Screen Size of Holographic Displays Using MEMS SLM Combined with Scanning Systems †

Institute of Engineering, Tokyo University of Agriculture and Technology, 2-24-16 Nakacho, Koganei 184-8588, Tokyo, Japan
†
It is an invited paper for the special issue.
Appl. Sci. 2022, 12(13), 6495; https://0-doi-org.brum.beds.ac.uk/10.3390/app12136495
Submission received: 24 May 2022
/
Revised: 11 June 2022
/
Accepted: 21 June 2022
/
Published: 27 June 2022
(This article belongs to the Special Issue Holography, 3D Imaging and 3D Display Volume II)
Abstract
:Featured Application
Three-Dimensional Display.
Abstract
The problems of conventional holographic display techniques, which are the requirements of a sub-micron pixel pitch and ultra-high resolution for spatial light modulators (SLMs) to enlarge the viewing zone and screen size, can be addressed using microelectromechanical systems (MEMS) SLMs combined with spatial scanning systems. Various scanning systems have been efficiently combined with high-speed image generation of MEMS SLMs based on the time-multiplexing technique. The horizontal scanning system enlarged the viewing zone and screen size, the circular scanning system provided 360° three-dimensional (3D) images, and the RGB scanning system generated color 3D images. The screen size can be increased scalably using a multichannel system based on the space-multiplexing technique. The use of a short laser pulse illumination system eliminates the mechanical scanning system and greatly simplifies the display system. The measurements of the accommodation responses of human eyes showed that 3D images generated by the screen scanning holographic display have a possibility to solve the visual fatigue issue caused by the vergence–accommodation conflict, which prevents the long-time usage of conventional 3D displays.
1. Introduction
Due to the production of three-dimensional (3D) images that satisfy all physiological factors of human depth perception [1,2], holographic displays are ideal 3D displays devoid of visual fatigue caused by the vergence–accommodation conflict [3]. However, conventional techniques to construct holographic displays require that spatial light modulators (SLMs) exhibit a sub-micron pixel pitch and an ultra-high resolution to provide a wide viewing zone and a large screen size. This article reviews techniques to enlarge the viewing zone and screen size of holographic displays using microelectromechanical systems (MEMS) SLMs combined with spatial scanning systems.
For the conventional holographic display techniques, when hologram patterns are displayed using the SLM with a resolution of N × M and a pixel pitch of p, the screen size (i.e., the 3D image size) is given by Np × Mp, and the light diffraction determines the viewing zone angle given by 2 sin−1 (λ/2p), where λ is the wavelength of light. For instance, to obtain a viewing zone angle of 30° and a screen size of 40 inches, the resolution should be 886,600 × 498,000, and the pixel pitch should be 0.97 μm when λ = 0.5 μm. SLMs with such a high resolution and a small pixel pitch are difficult to develop. Although many efforts have been made to develop SLMs with ultra-high resolution and a sub-micron pixel pitch [4,5,6,7,8,9], substantial time is required to develop SLMs that can provide an effective practical viewing zone angle and screen size.
Several techniques that do not depend on pixel pitch reduction and an increase in SLM resolution have been developed for enlarging the viewing zone angle and screen size. One method is the spatial-multiplexing technique that employs multiple SLMs [10,11,12]. This technique requires optical systems that combine many SLMs. Another method is the time-multiplexing technique, which employs a high-speed SLM combined with one-dimensional (1D) [13], two-dimensional (16) [14,15], and circular scanning systems [16,17,18].
Among several types of high-speed SLMs, MEMS SLM has the highest frame rate with moderate resolution. This article reviews the holographic displays developed by our research group, which are based on the time-multiplexing technique using MEMS SLMs combined with various scanning schemes, such as the screen [13], viewing zone [19], circular [20], and RGB scanning [21]. The measurements of the accommodation responses of the eyes to the scanning holographic display system [22] are also explained.
2. Viewing Zone Scanning System
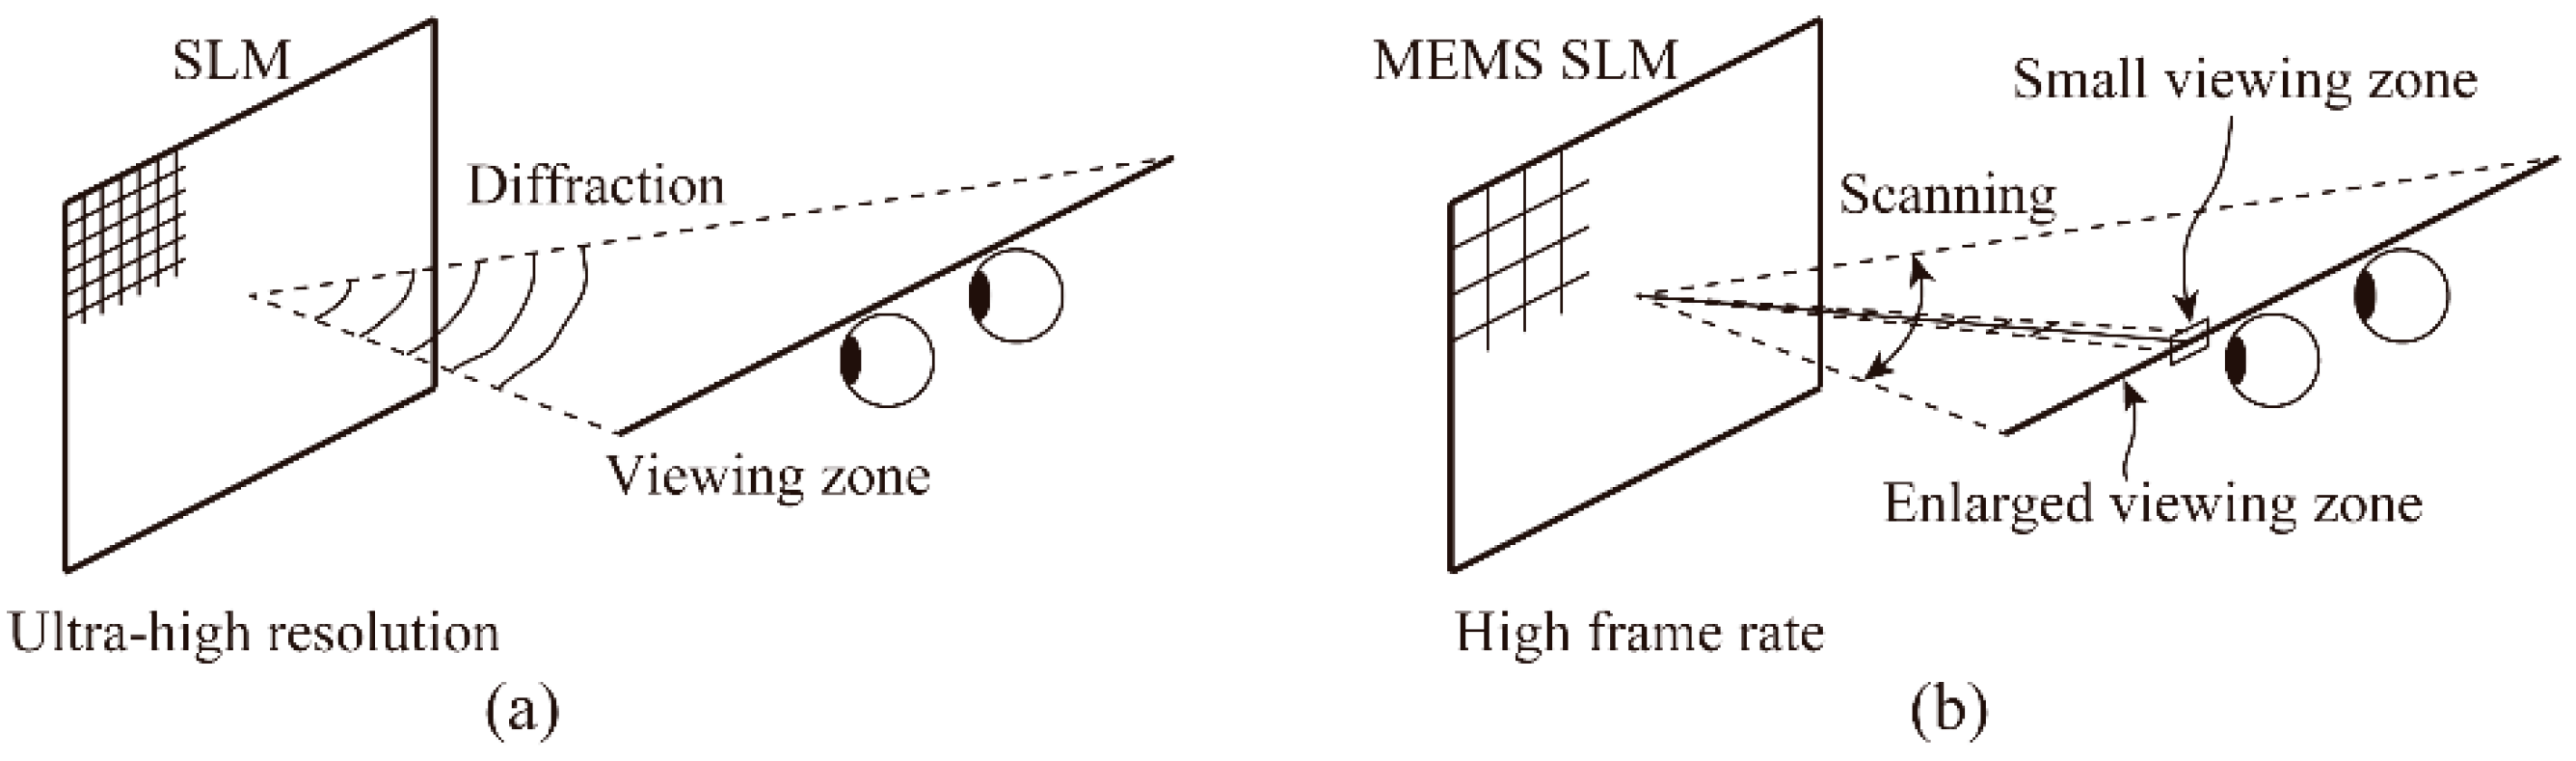
In conventional holographic display techniques, the SLM diffracts light to generate the viewing zone (Figure 1a). Therefore, the SLM pixel pitch should be reduced to enlarge the viewing zone. When the pixel pitch is reduced, the resolution should be increased to enlarge the screen size. Thus, a small pixel pitch is needed only for the viewing zone enlargement. Regarding viewing zone enlargement, the scanning system outperforms the light diffraction system (Figure 1b). A combination of a 1D light modulation using the acousto-optic modulator and a 2D light scanning using the polygon mirror and the galvano scanner was proposed [23]. In this article, the combination of 2D light modulation using MEMS SLM and 1D or circular light scanning proposed in our research group [13,19,20,21] is reviewed. The latter combination requires a slower scanning speed than the former.
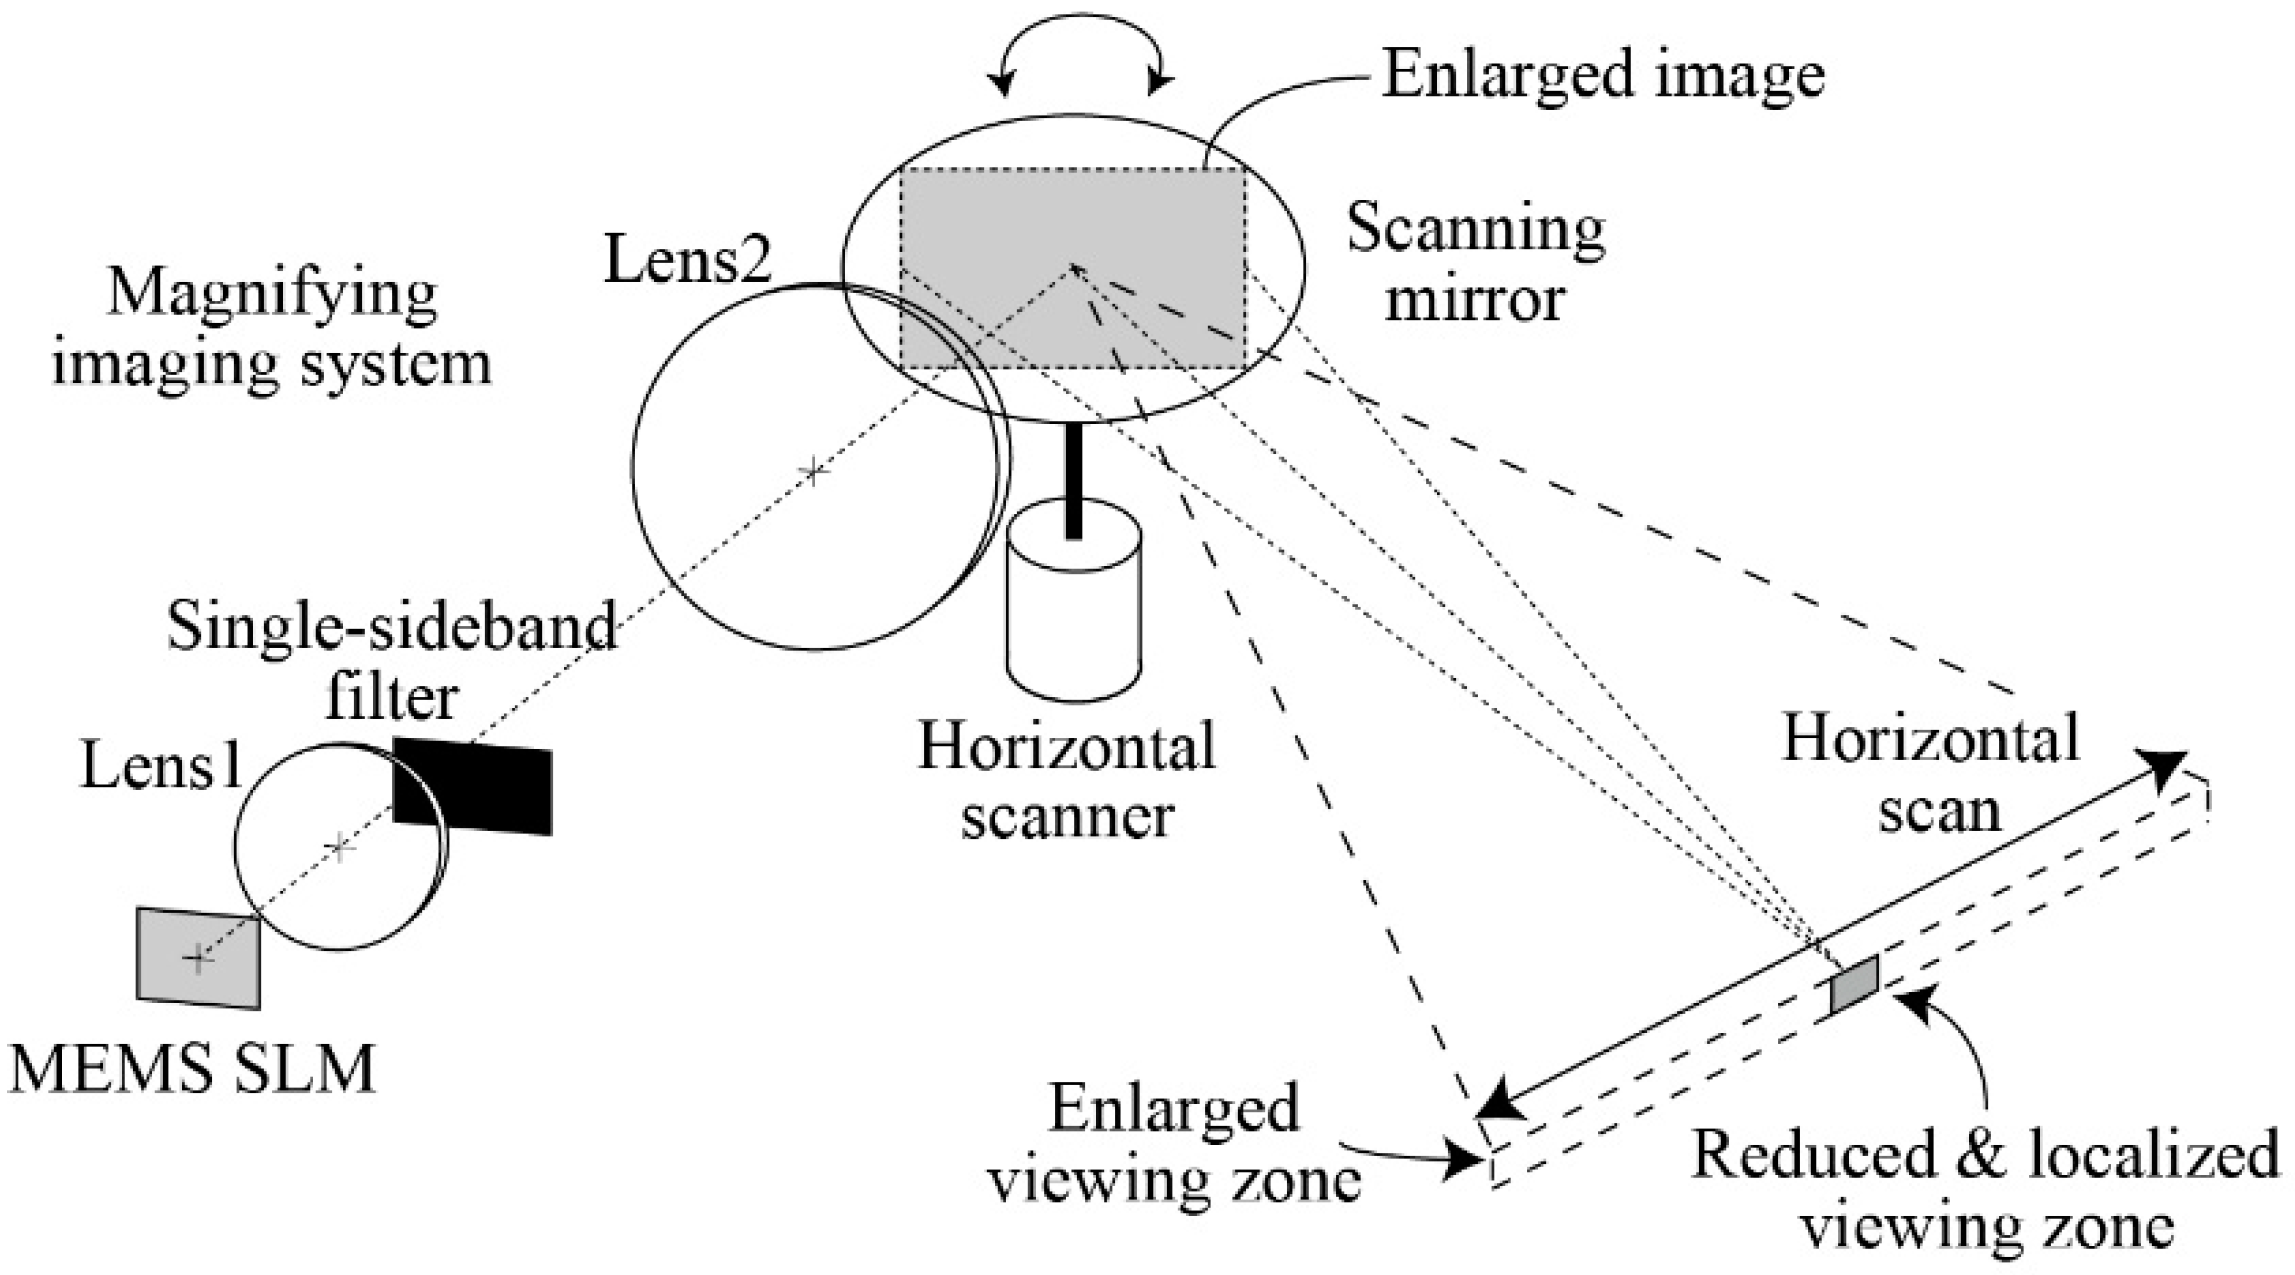
Figure 2 shows the holographic display system comprising the MEMS SLM and the 1D scanning system [19]. A magnifying imaging system enlarges the screen size of the MEMS SLM to increase the screen size of the display system. Thus, the pixel pitch increases, and the viewing zone is reduced. The reduced viewing zone is scanned by the 1D scanner to enlarge the viewing zone. Hence, both the viewing zone and screen size are enlarged. The single-sideband (SSB) filter is used to eliminate the conjugate image and the zero-order diffraction light, which are not required for hologram reconstruction [24]. The width of the reduced viewing zone should exceed the pupil diameter of the human eye to ensure wavefront reconstruction.
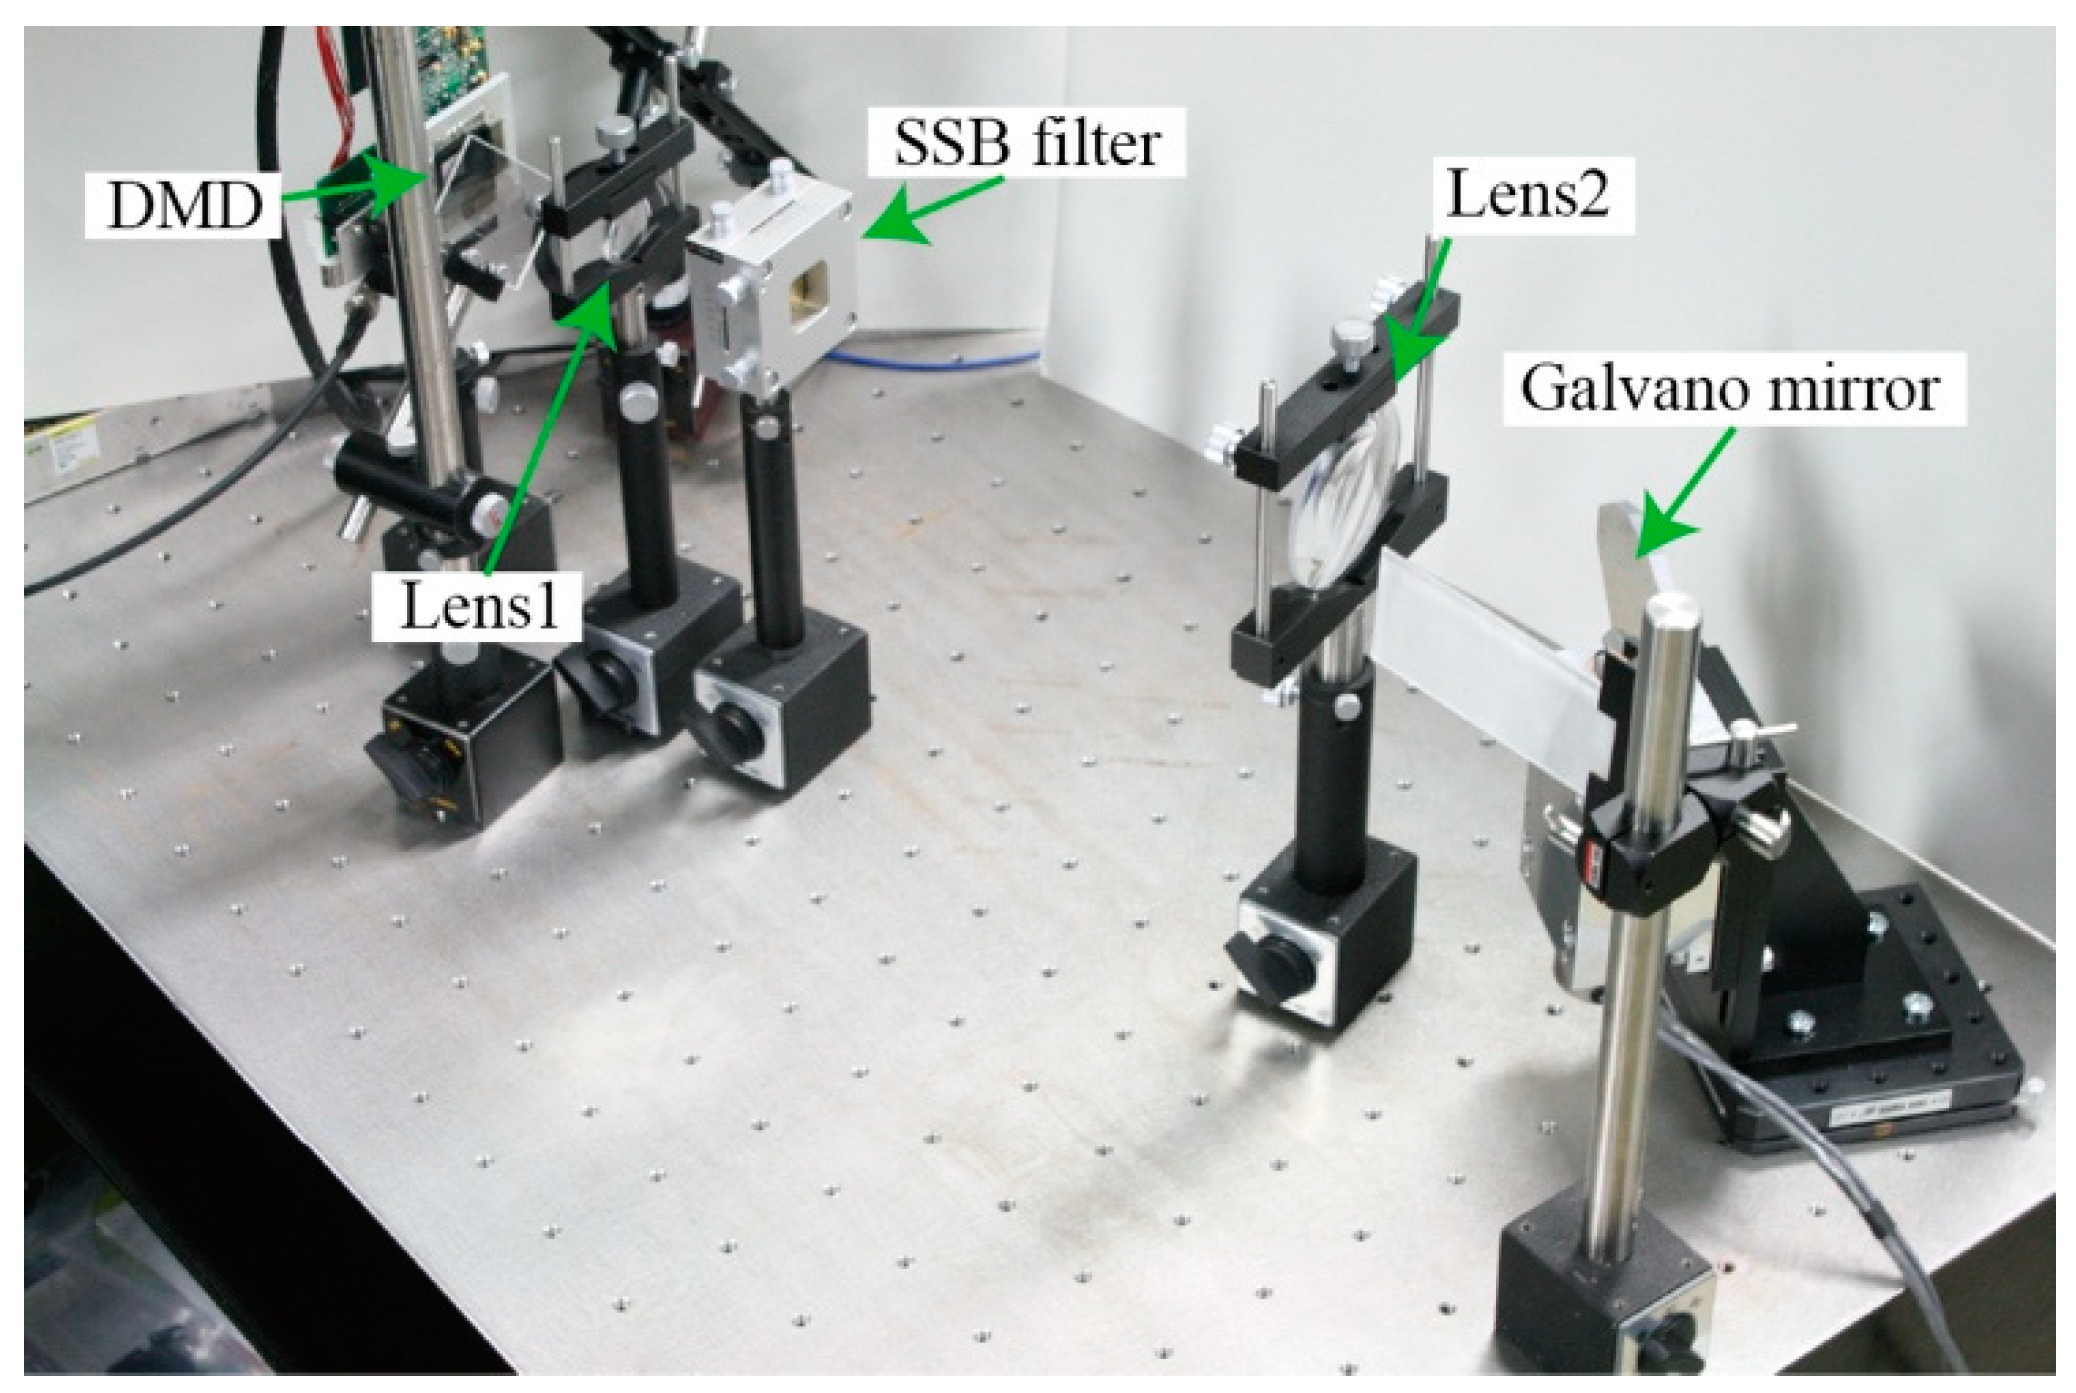
Figure 3 shows the experimental system based on the viewing zone scanning system. A digital micromirror device (DMD) was used for the MEMS SLM. The resolution was 1024 × 768, the pixel pitch was 13.68 μm, and the frame rate was 13.333 kHz. A galvano mirror with a diameter of 50 mm (2.0 inches) was used as the horizontal scanner. A laser diode with a wavelength of 635 nm was used as the light source. The magnification of the imaging system was determined to be 2.86 such that the image was the same size as the galvano mirror (2.0 inches), which is the same size as the screen of the holographic display. The imaging system had an enlarged pixel pitch of 39.1 μm. The distance between the galvano mirror and the viewing zone was determined such that the width of the viewing zone was larger than the average pupil diameter of the human eye (5 mm). This distance was set to 600 mm and the width of the viewing zone was then 9.74 mm. The scan angle of the galvano mirror was 40.0°. The viewing zone angle was enlarged to 40.0°, considering that the viewing zone and scan angles are equal. The scanning frequency was 60 Hz, and 222 reduced viewing zones were generated during a single scan. A substantial overlap existed between the reduced viewing zones. The delay and the hysteresis characteristics of the rotation of the galvano mirror were measured in advance, and the hologram calculation was performed considering the measured rotation angles of the galvano mirror.
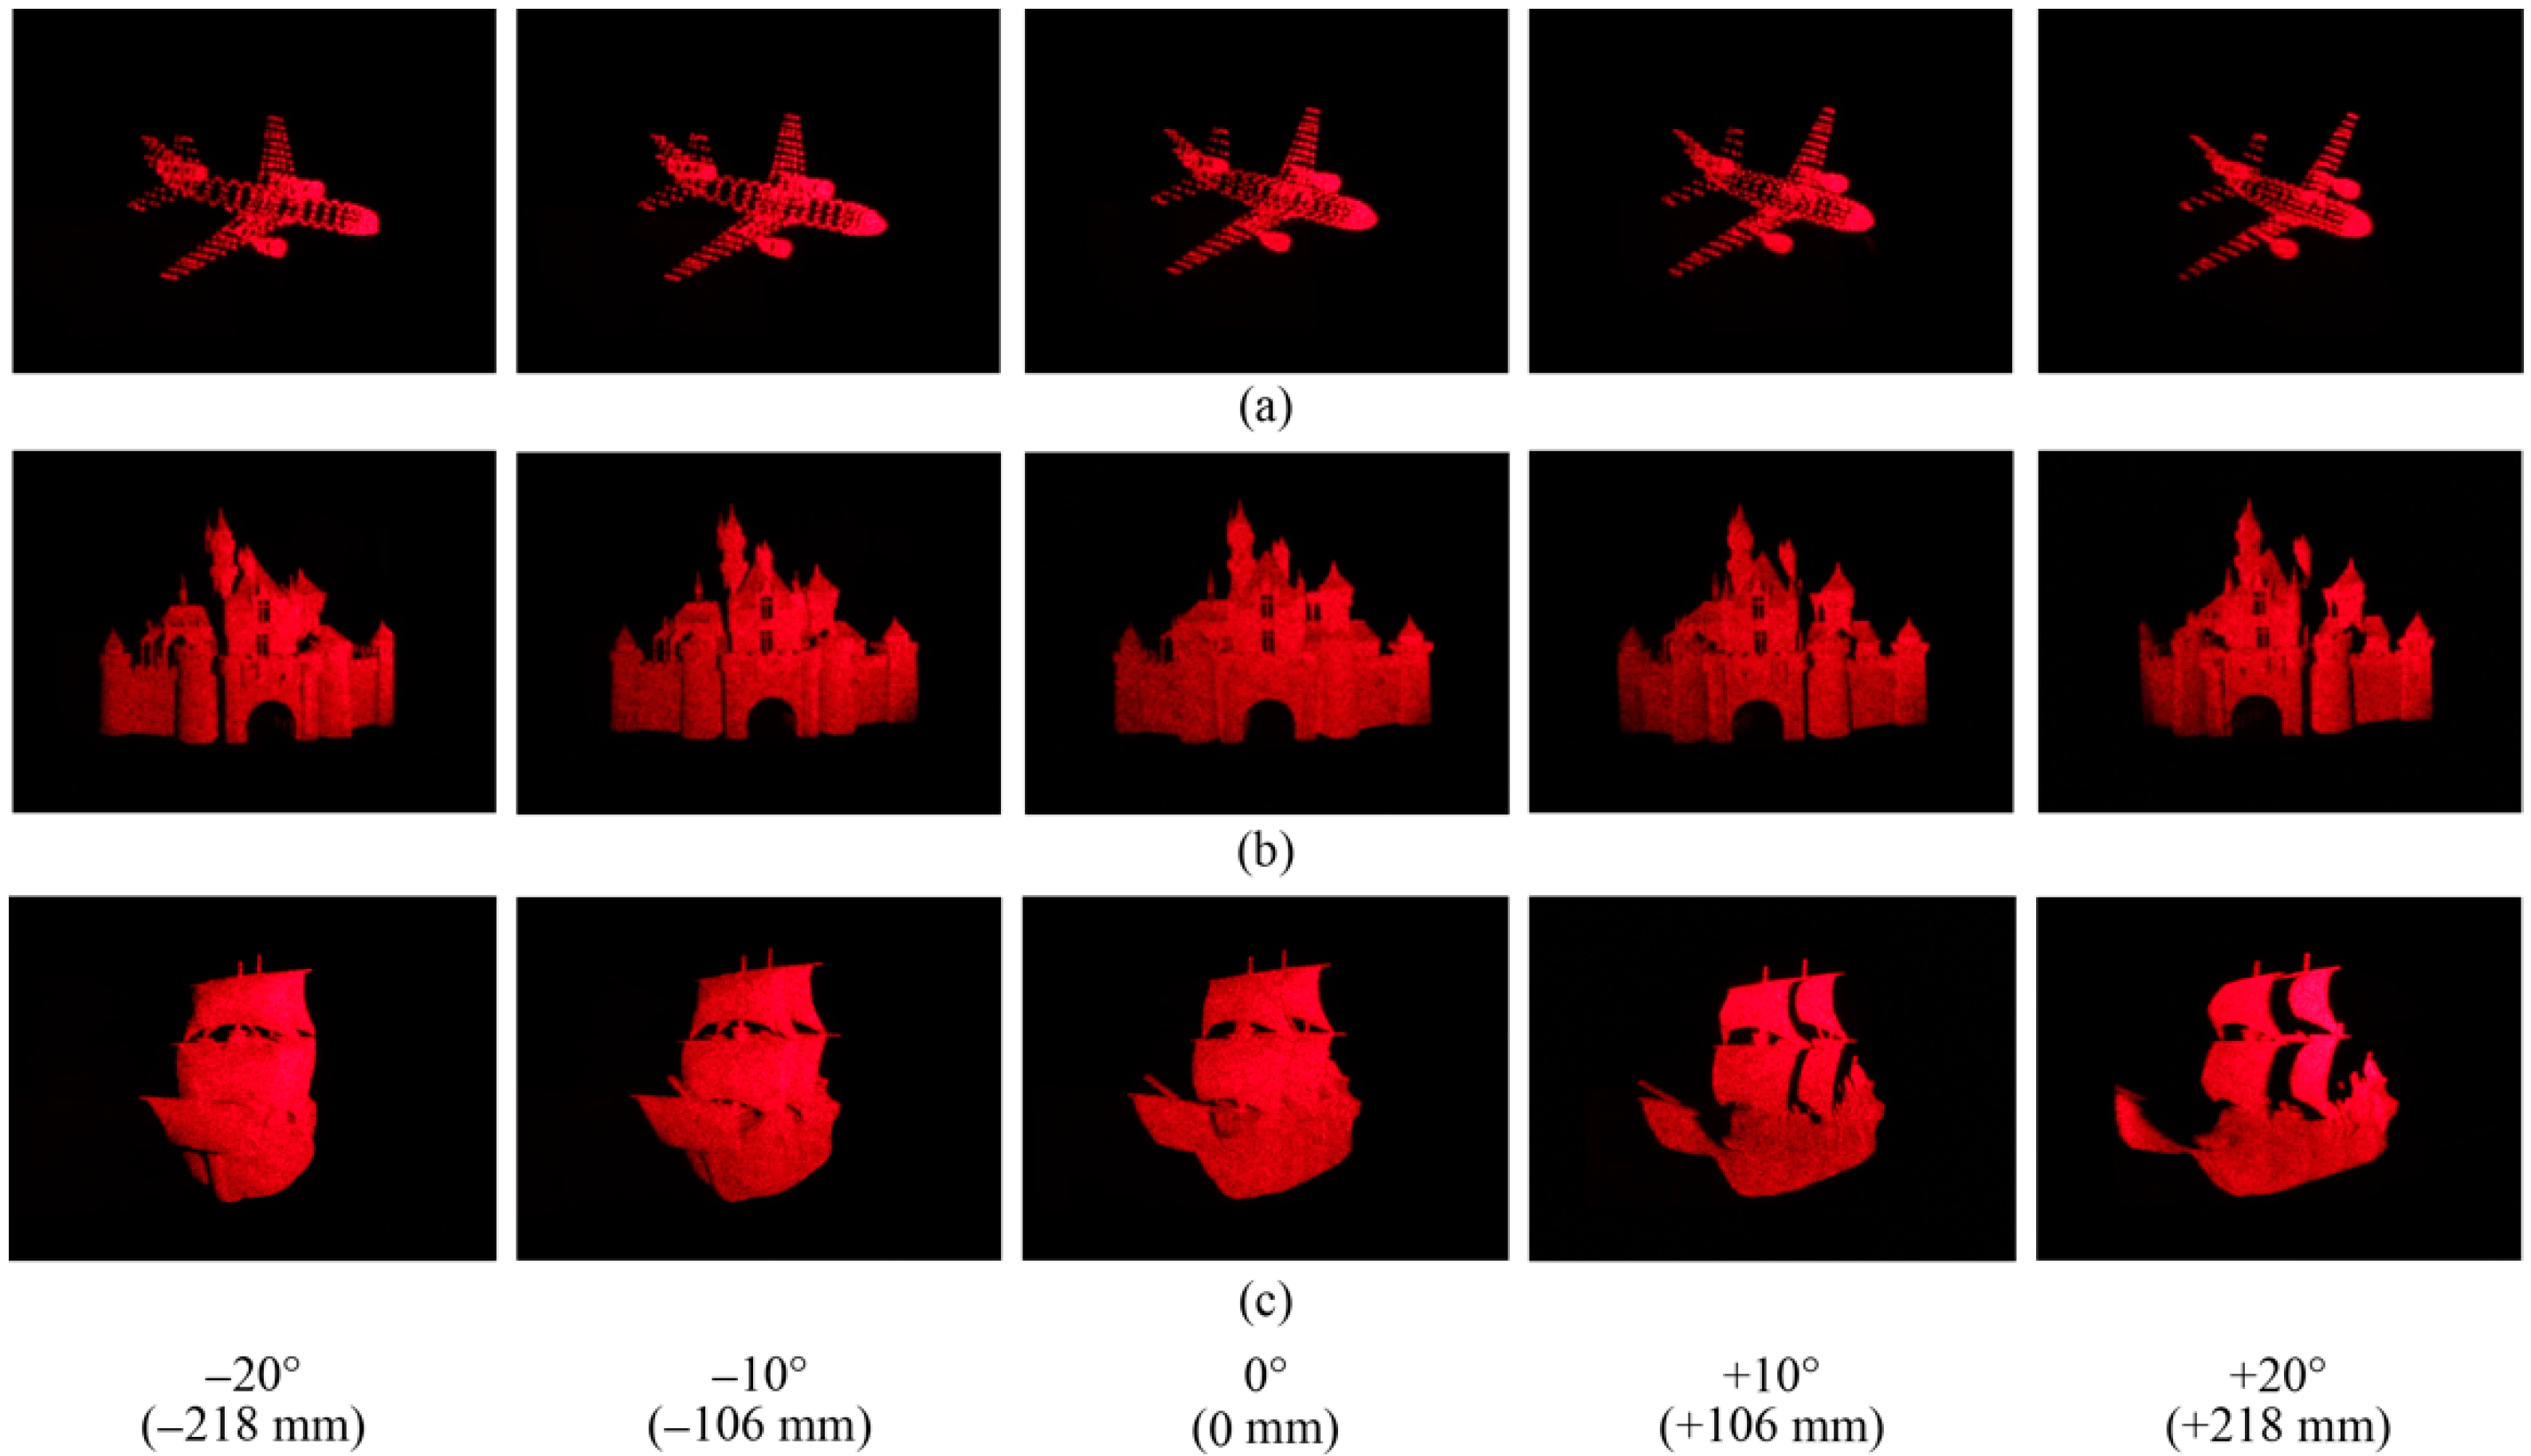
Figure 4 shows the experimentally obtained reconstructed images. The 3D images were captured from different horizontal directions. The viewing zone was enlarged effectively. Figure 5 shows the reconstructed images when the focus of the camera was adjusted at different depth positions. The focused pattern looked sharp. Thus, the generated 3D images could be focused on by the eyes.
The holographic display system using a 2D scanning system was proposed in Refs. [14,15] which used a resonance scanner for the high-speed horizontal scan and a galvano mirror for the low-speed vertical scan. This system demonstrated horizontal and vertical viewing zone angles of 48° and 3.2°, respectively, and had a screen size of 10 × 10 mm2, which was obtained by fully utilizing the high frame rate of the DMD. The horizontal scanning system shown in Figure 3 used a vertical diffuser to increase the vertical viewing zone [19]. In this manner, the vertical viewing zone angle was increased to >50°, although the vertical parallax was lost.
3. Circular Scanning System
When the scanning scheme is changed from a linear scan to a circular scan, a 360° viewing zone can be realized [20]. The 3D images are generated on the table screen, which can be observed from 360° directions. As the MEMS SLM can operate at a sufficiently high frame rate, reduced viewing zones are generated without gaps on a circle. Hence, multiple viewers can observe 3D images without using the viewer tracking technique.
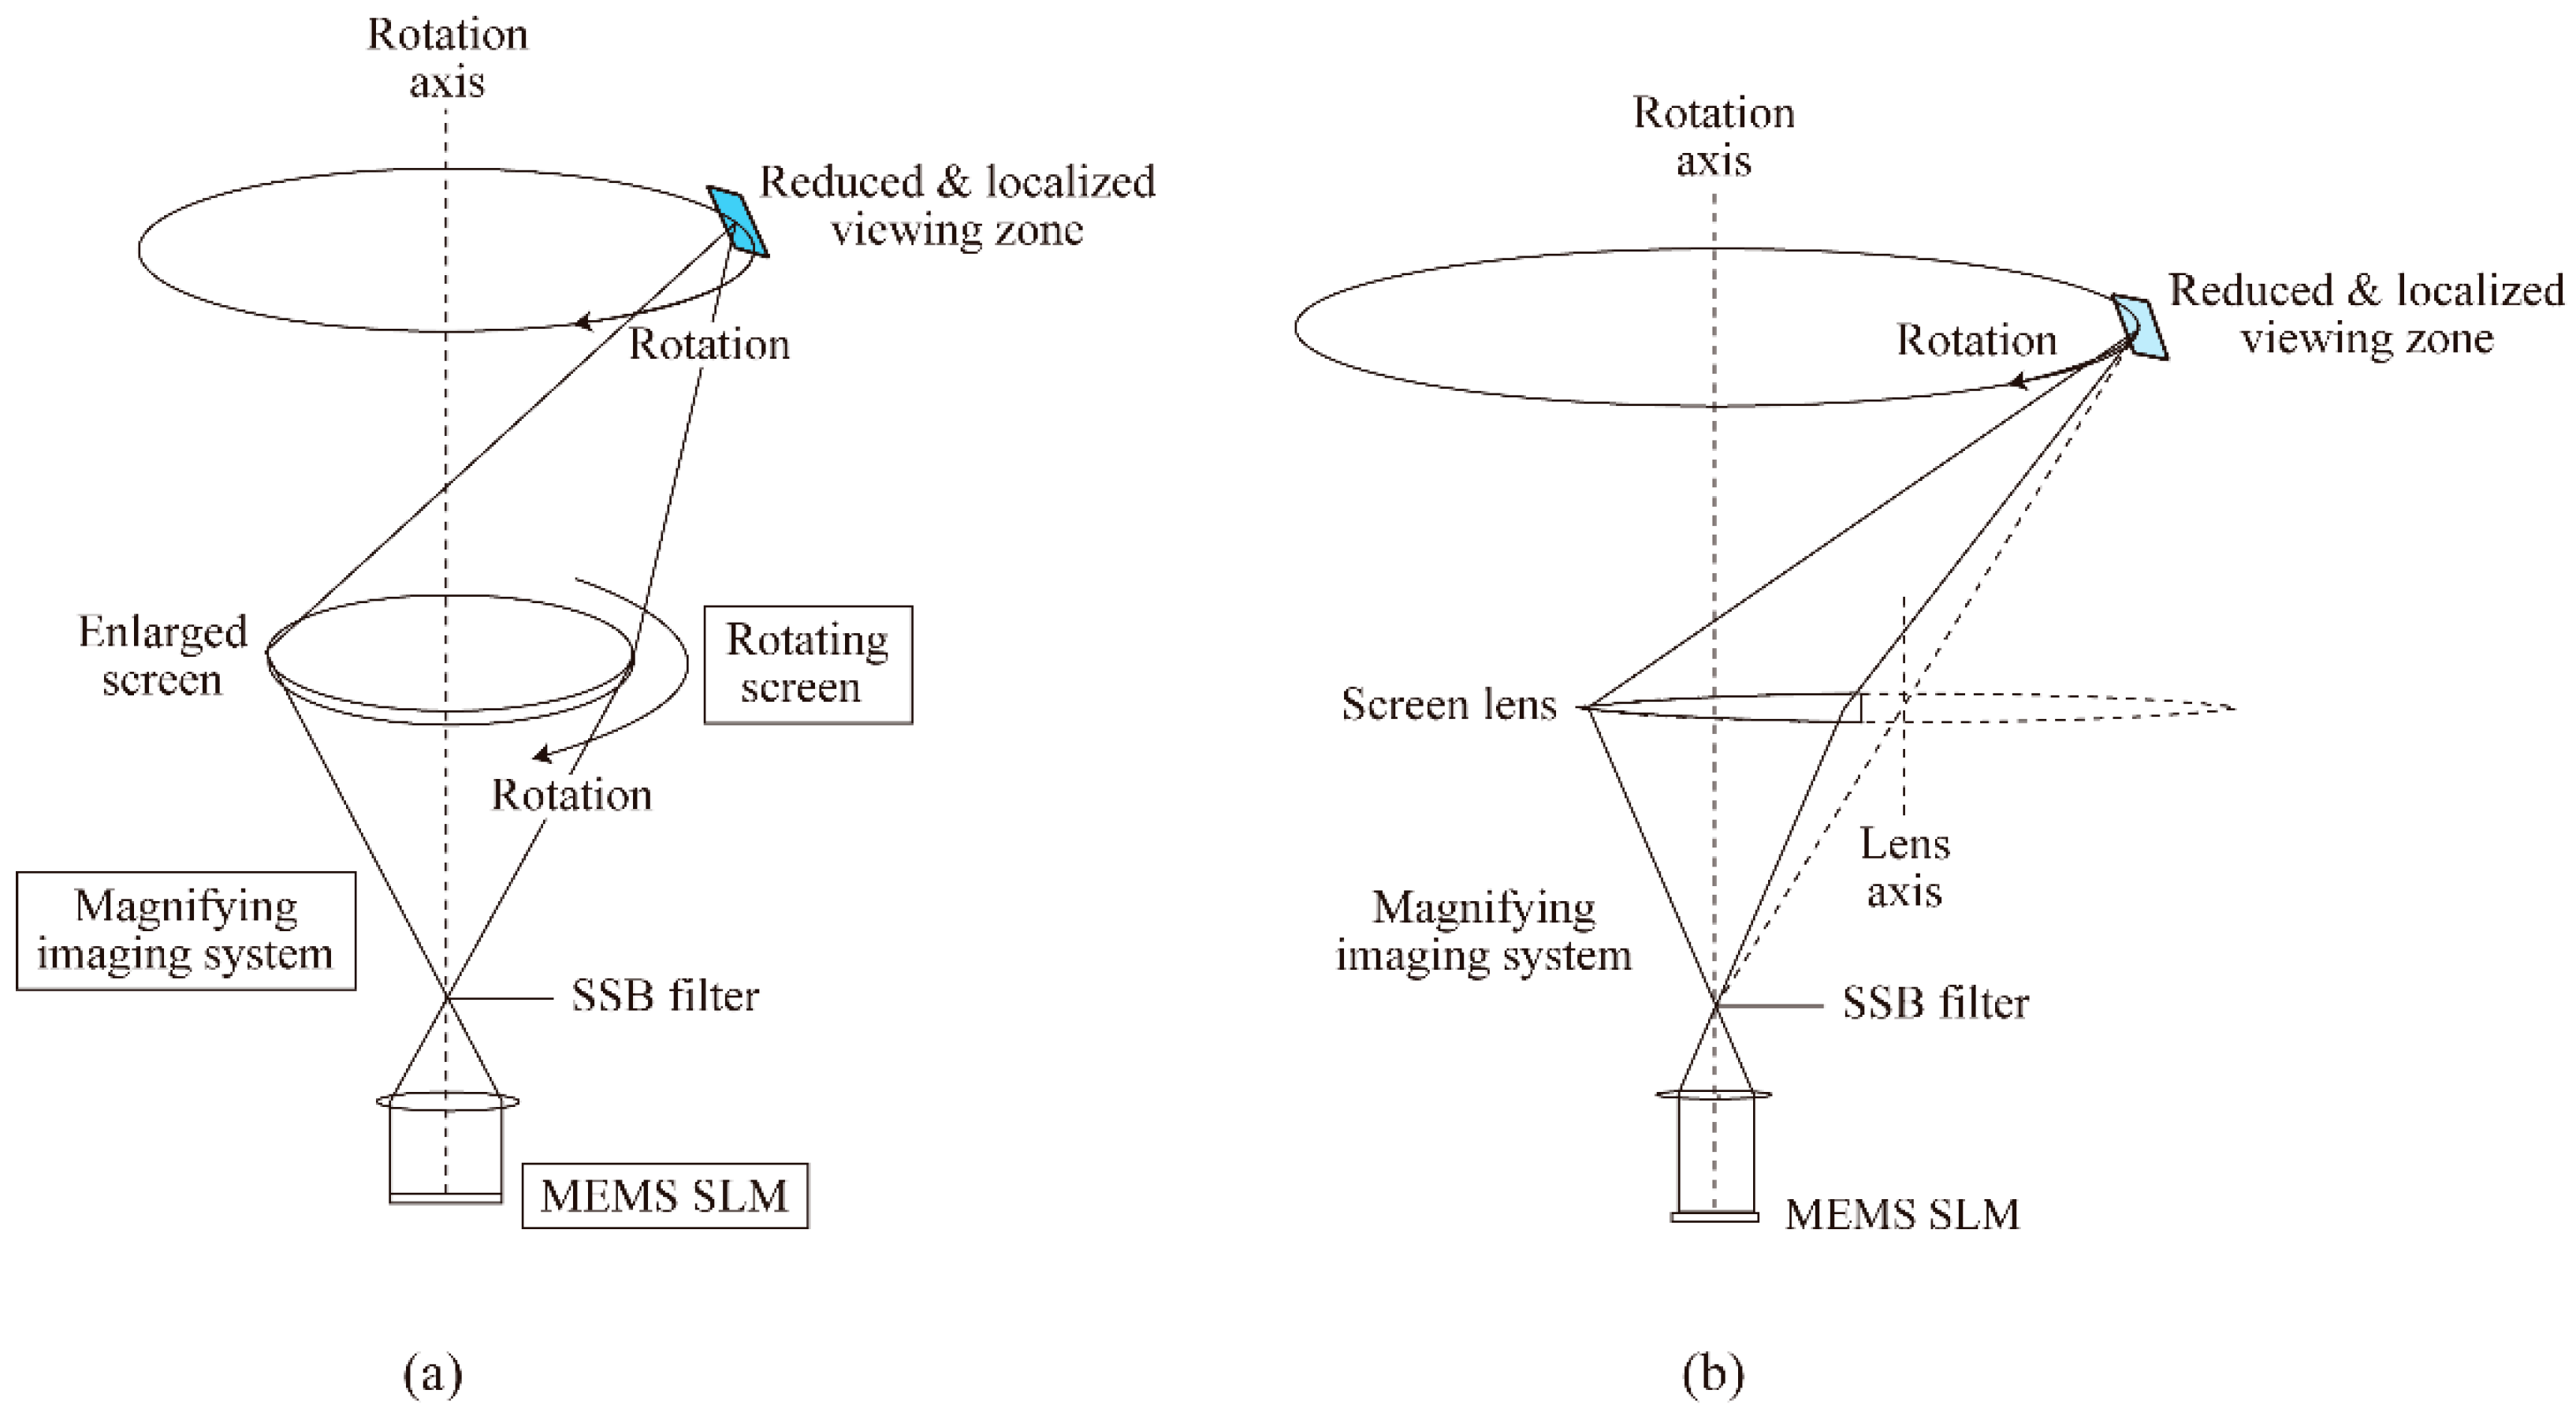
Figure 6a shows a schematic diagram of the table screen 360° holographic display. A magnifying imaging system and a rotating screen are combined. The hologram patterns displayed on the MEMS SLM are projected onto the rotating screen. As the rotating screen is an off-axis lens, the viewing zone is generated outside the rotation axis (Figure 6b). When the screen lens rotates, the viewing zone rotates circularly around the rotation axis. The rotating lens becomes a table screen.
In the experimental system of the circular scanning display, a DMD with a frame rate of 22.727 kHz was used. A laser diode with a wavelength of 635 nm was used as the light source. The reflective rotating screen was used to permit the DMD projection system to be positioned above the rotating screen. The rotating screen consisted of an off-axis Frensel lens and an aluminum-coated vertical diffuser. A Fresnel lens was used as the rotating screen because a lightweight lens with a large diameter was needed. The focal length of the Fresnel lens was 700 mm. The light passed through the Frensel lens twice, and thus, the effective focal length was 350 mm. The off-axis lens shift, which was equal to the distance between the lens center and the screen center, was 172 mm. The screen diameter was 100 mm (3.94 inches), and the image size was 80.0 × 60.0 mm2. A lenticular lens with a fine lens pitch was used as the vertical diffuser. As 800 reduced viewing zones were generated during a single circular scan, the frame rate of the 3D image generation was 28.4 Hz. The width of the reduced viewing zone was 5.81 mm.
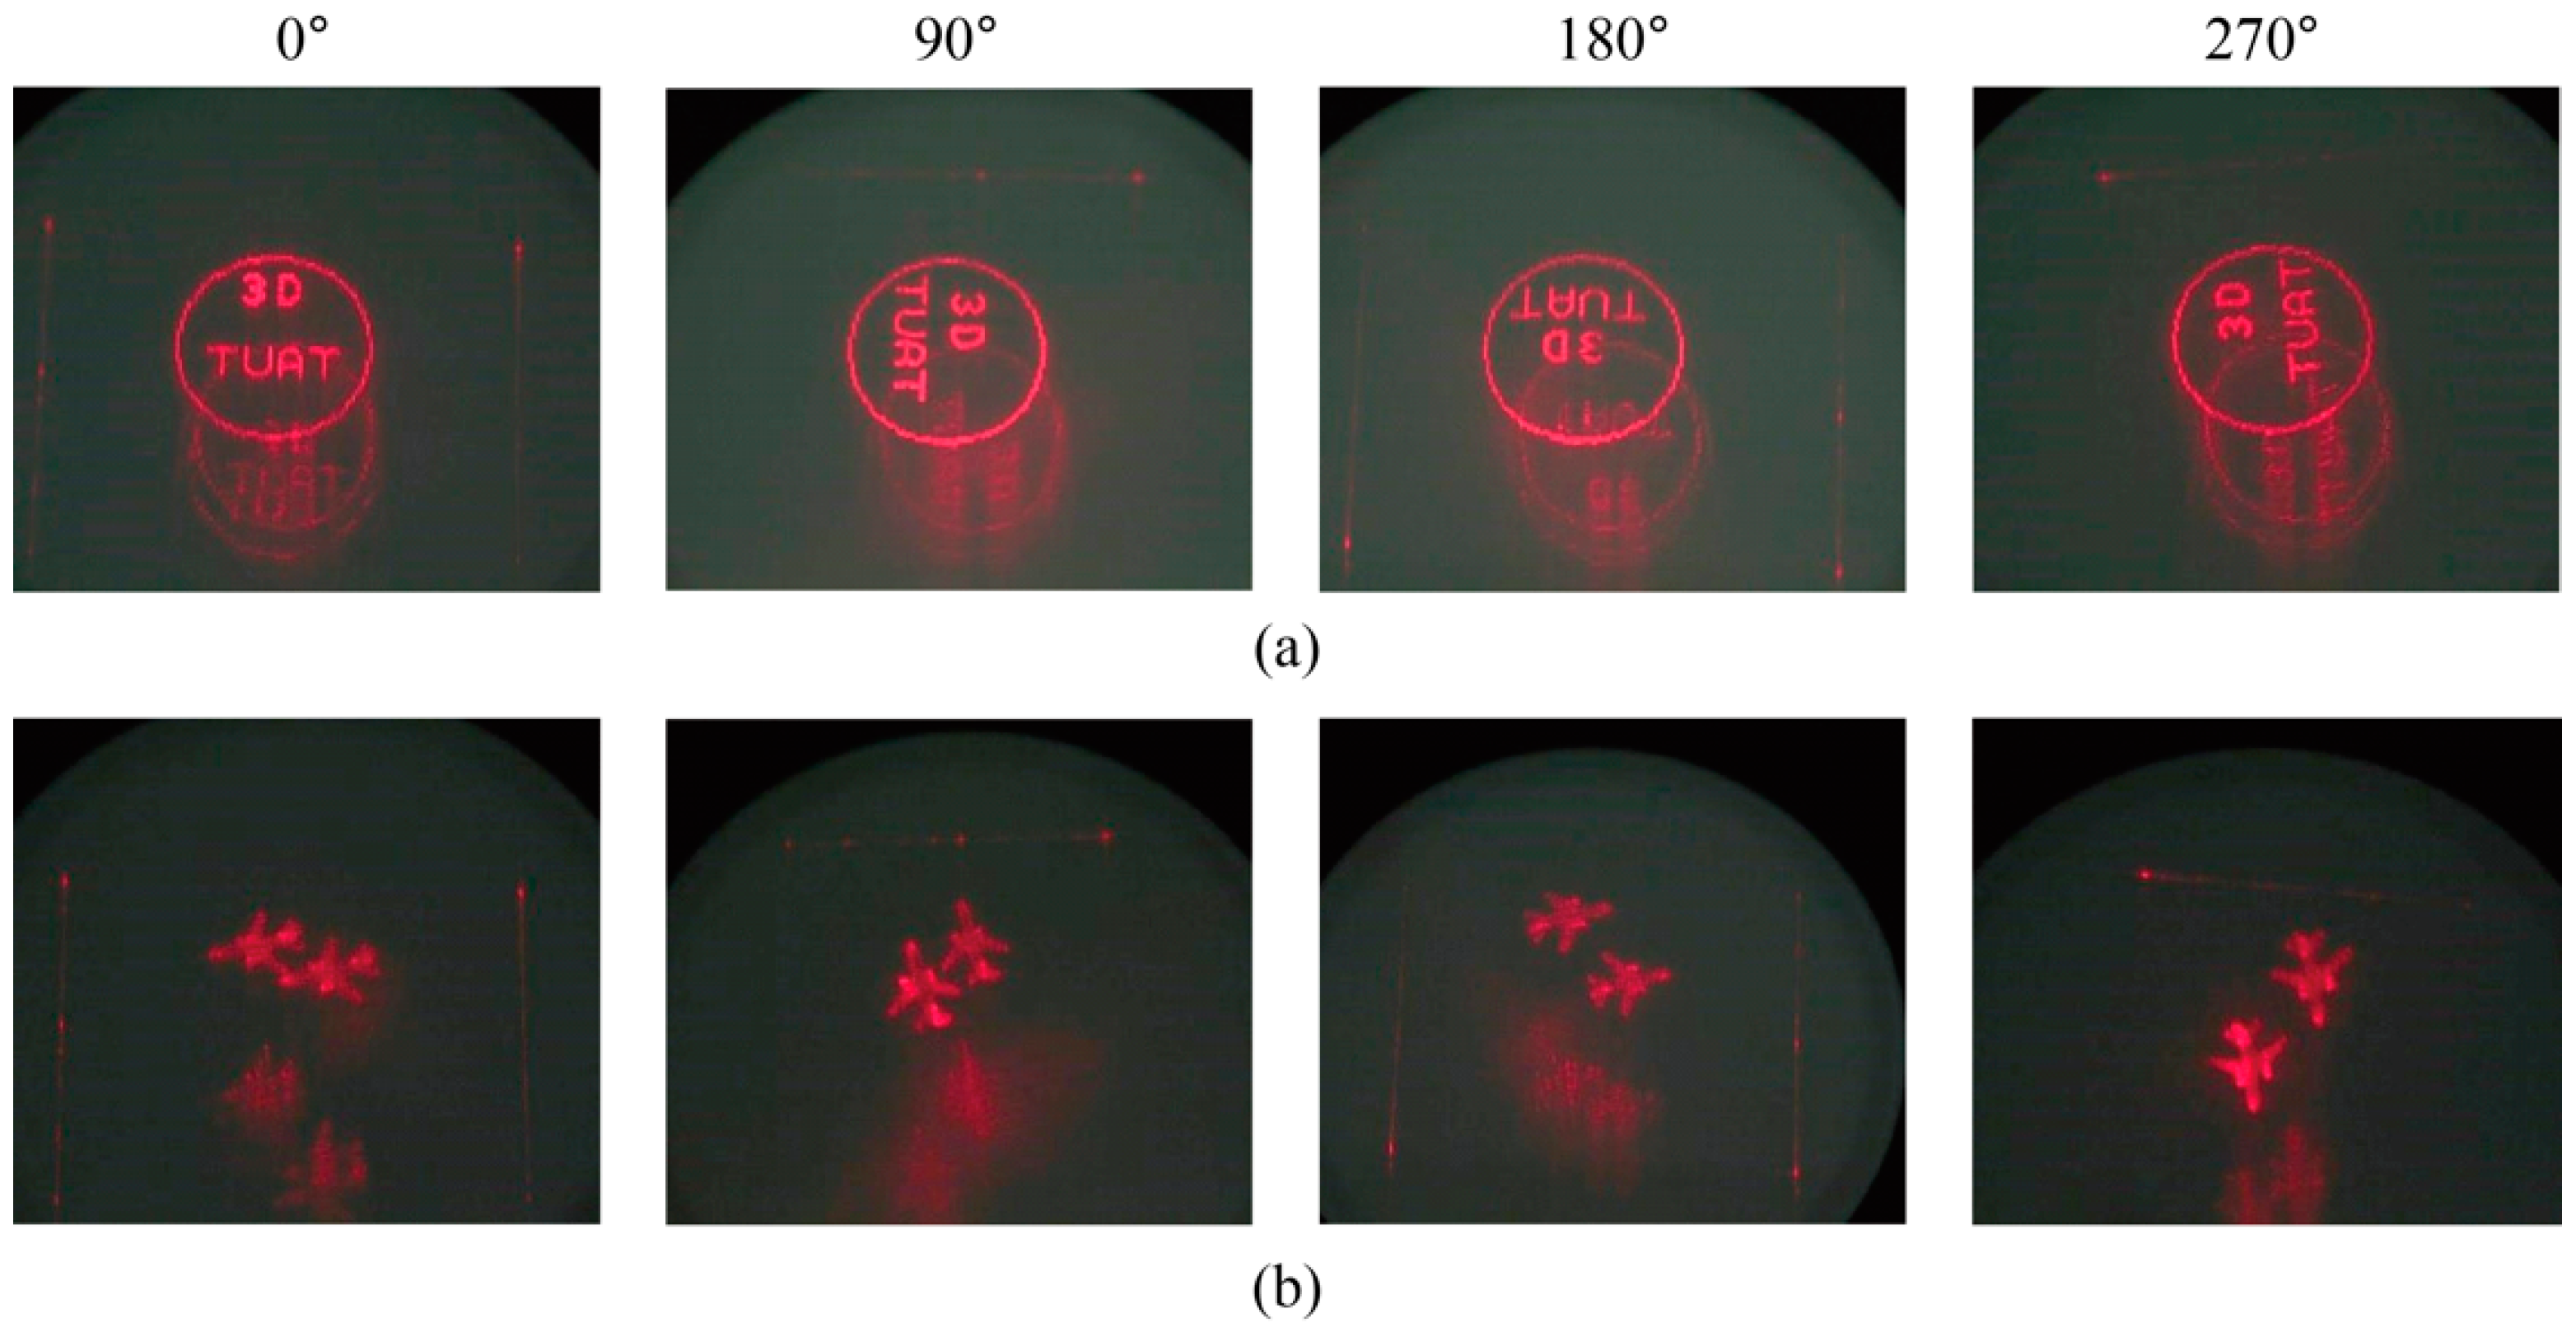
Figure 7 shows the generated 360° images captured from the four directions around the table screen. The ghost images were observed in addition to the 360° images; these ghost images were caused by light reflecting on the surface of the rotating screen, not the conjugate images. The generated 3D images had a smooth motion parallax, and multiple viewers could observe the 3D images simultaneously.
The 360° holographic display using a circular scanning system was also proposed in Ref. [16]; in this system, four DMDs, two parabolic mirrors, and a rotating mirror were used to provide a screen diameter of 3.2 in. This system has the capacity to generate floating 3D images, although the diameter of the parabolic mirrors should be several times larger than that of the 3D images. The circular scanning system illustrated in Figure 6 required a rotating Fresnel lens with a diameter roughly equal to that of 3D images.
4. RGB Scanning System
By virtue of the high-speed image generation of the MEMS SLM, the time-multiplexing technique can be used not only for viewing zone enlargement but also for color image generation. The RGB lasers are combined with a viewing zone scanning holographic display to generate color 3D images [21].
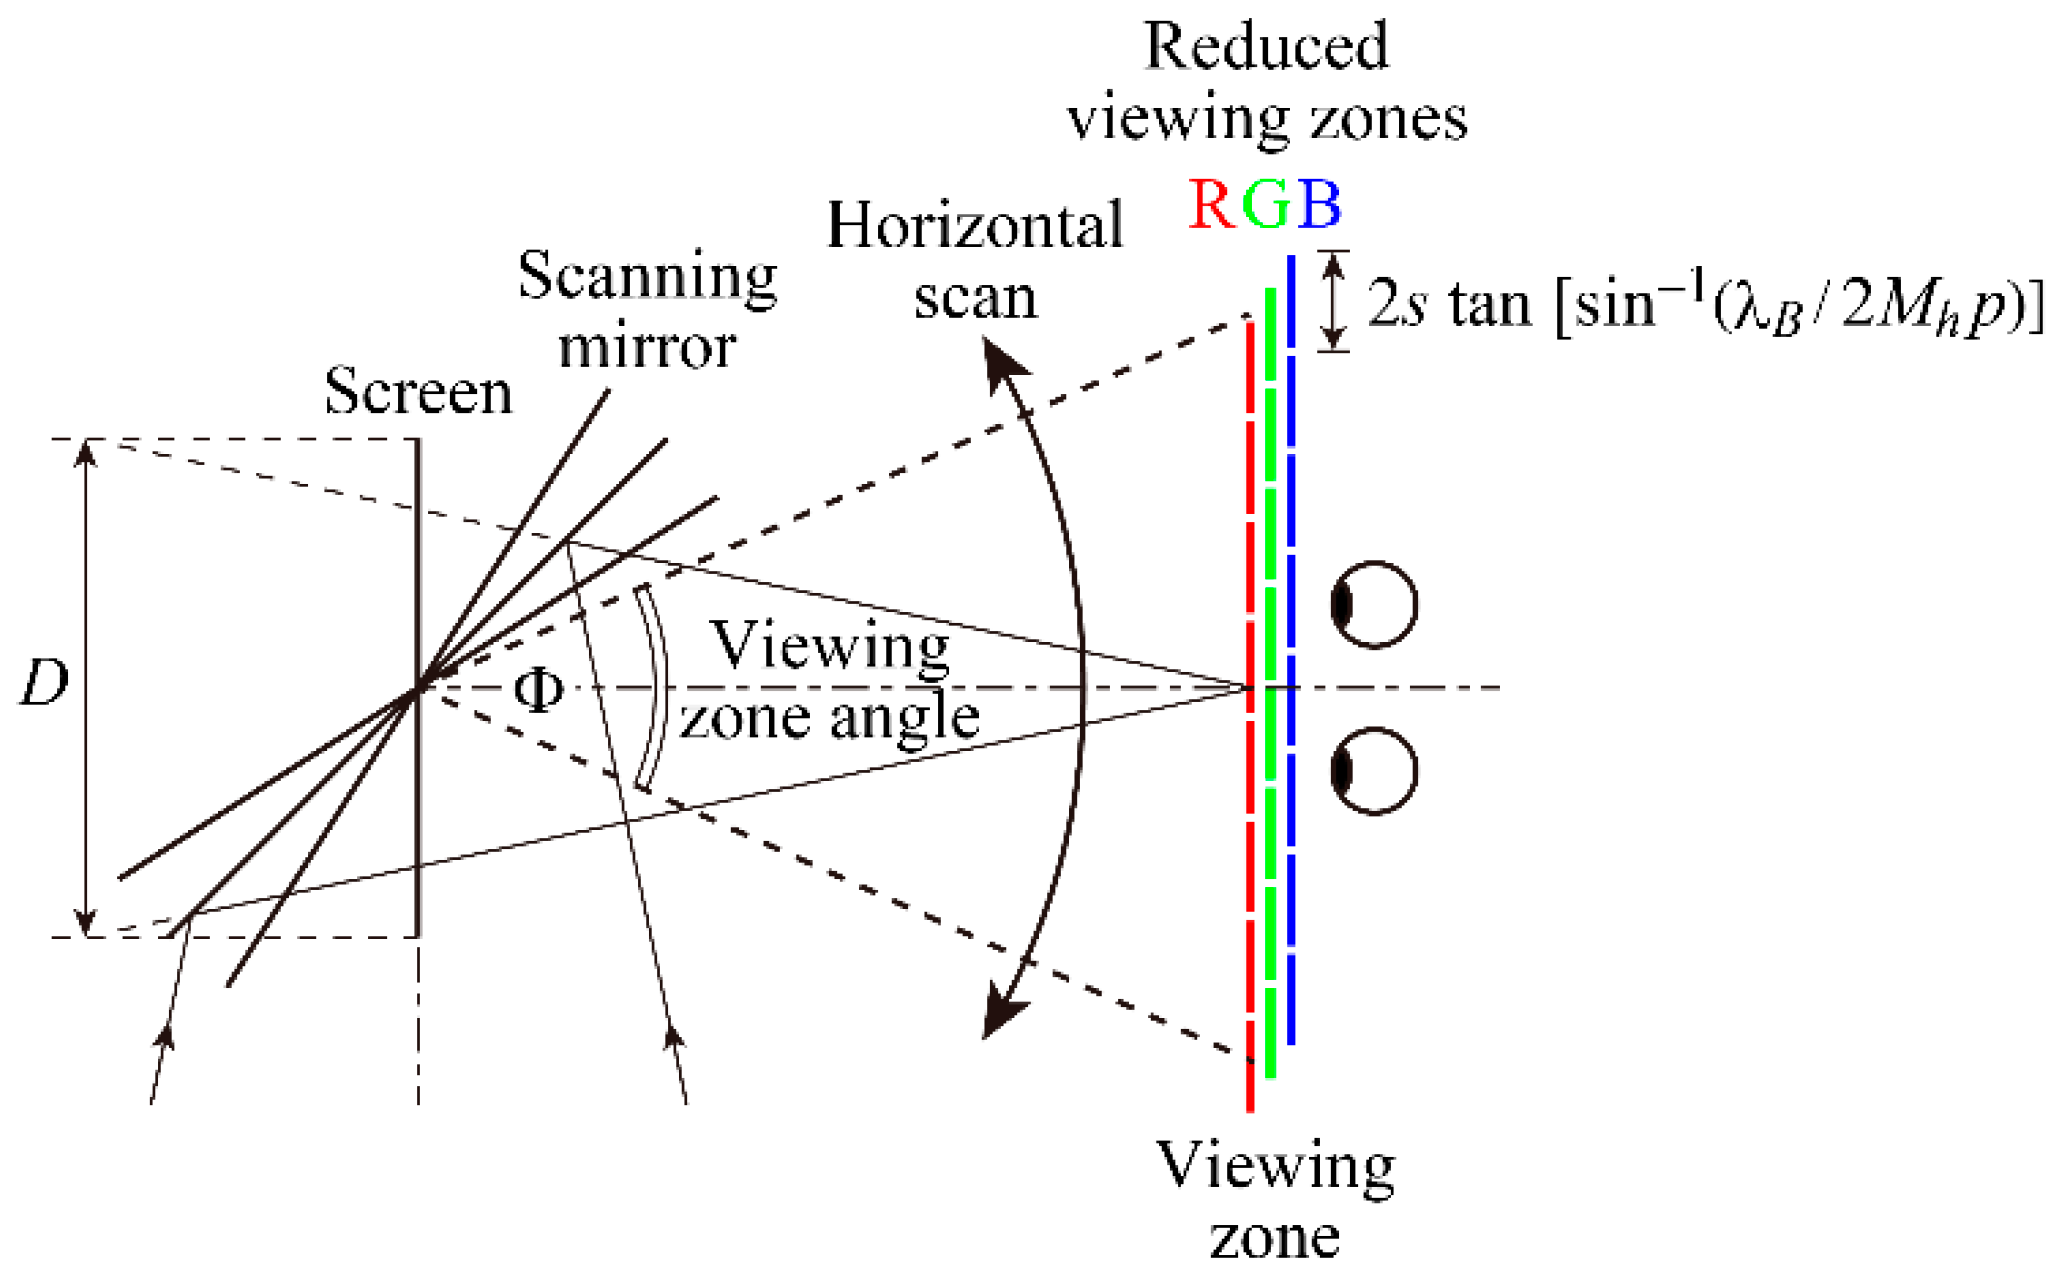
The viewing zone scanning system shown in Figure 2 is modified to be able to generate 3D color images. Holograms for R, G, and B colors are displayed sequentially by the MEMS SLM, and the MEMS SLM is illuminated by the R, G, and B lasers with the synchronization of the hologram pattern generation by the MEMS SLM. Then, as shown in Figure 8, the reduced viewing zones for the three colors are scanned simultaneously on the viewing zone. For the original viewing zone scanning system described in Section 2, the width of the reduced viewing zone depends on the wavelength of light. For the RGB scanning system, a rectangular aperture is used for the SSB filter, and its width is determined for blue light having the shortest wavelength among the three colors. Since the images of the SSB filter become the reduced viewing zones, the widths of the reduced viewing zones and the amount of overlap among the reduced viewing zones become identical for the three colors. The directions of the three laser lights illuminating the MEMS SLM should be appropriately adjusted considering the grating equation. In this case, due to the color of 3D images changing in the vertical direction, the vertical diffuser must be placed close to the galvano mirror, although the vertical diffuser was optional for the monochromatic display systems. The details of this system are described in Ref. [18].
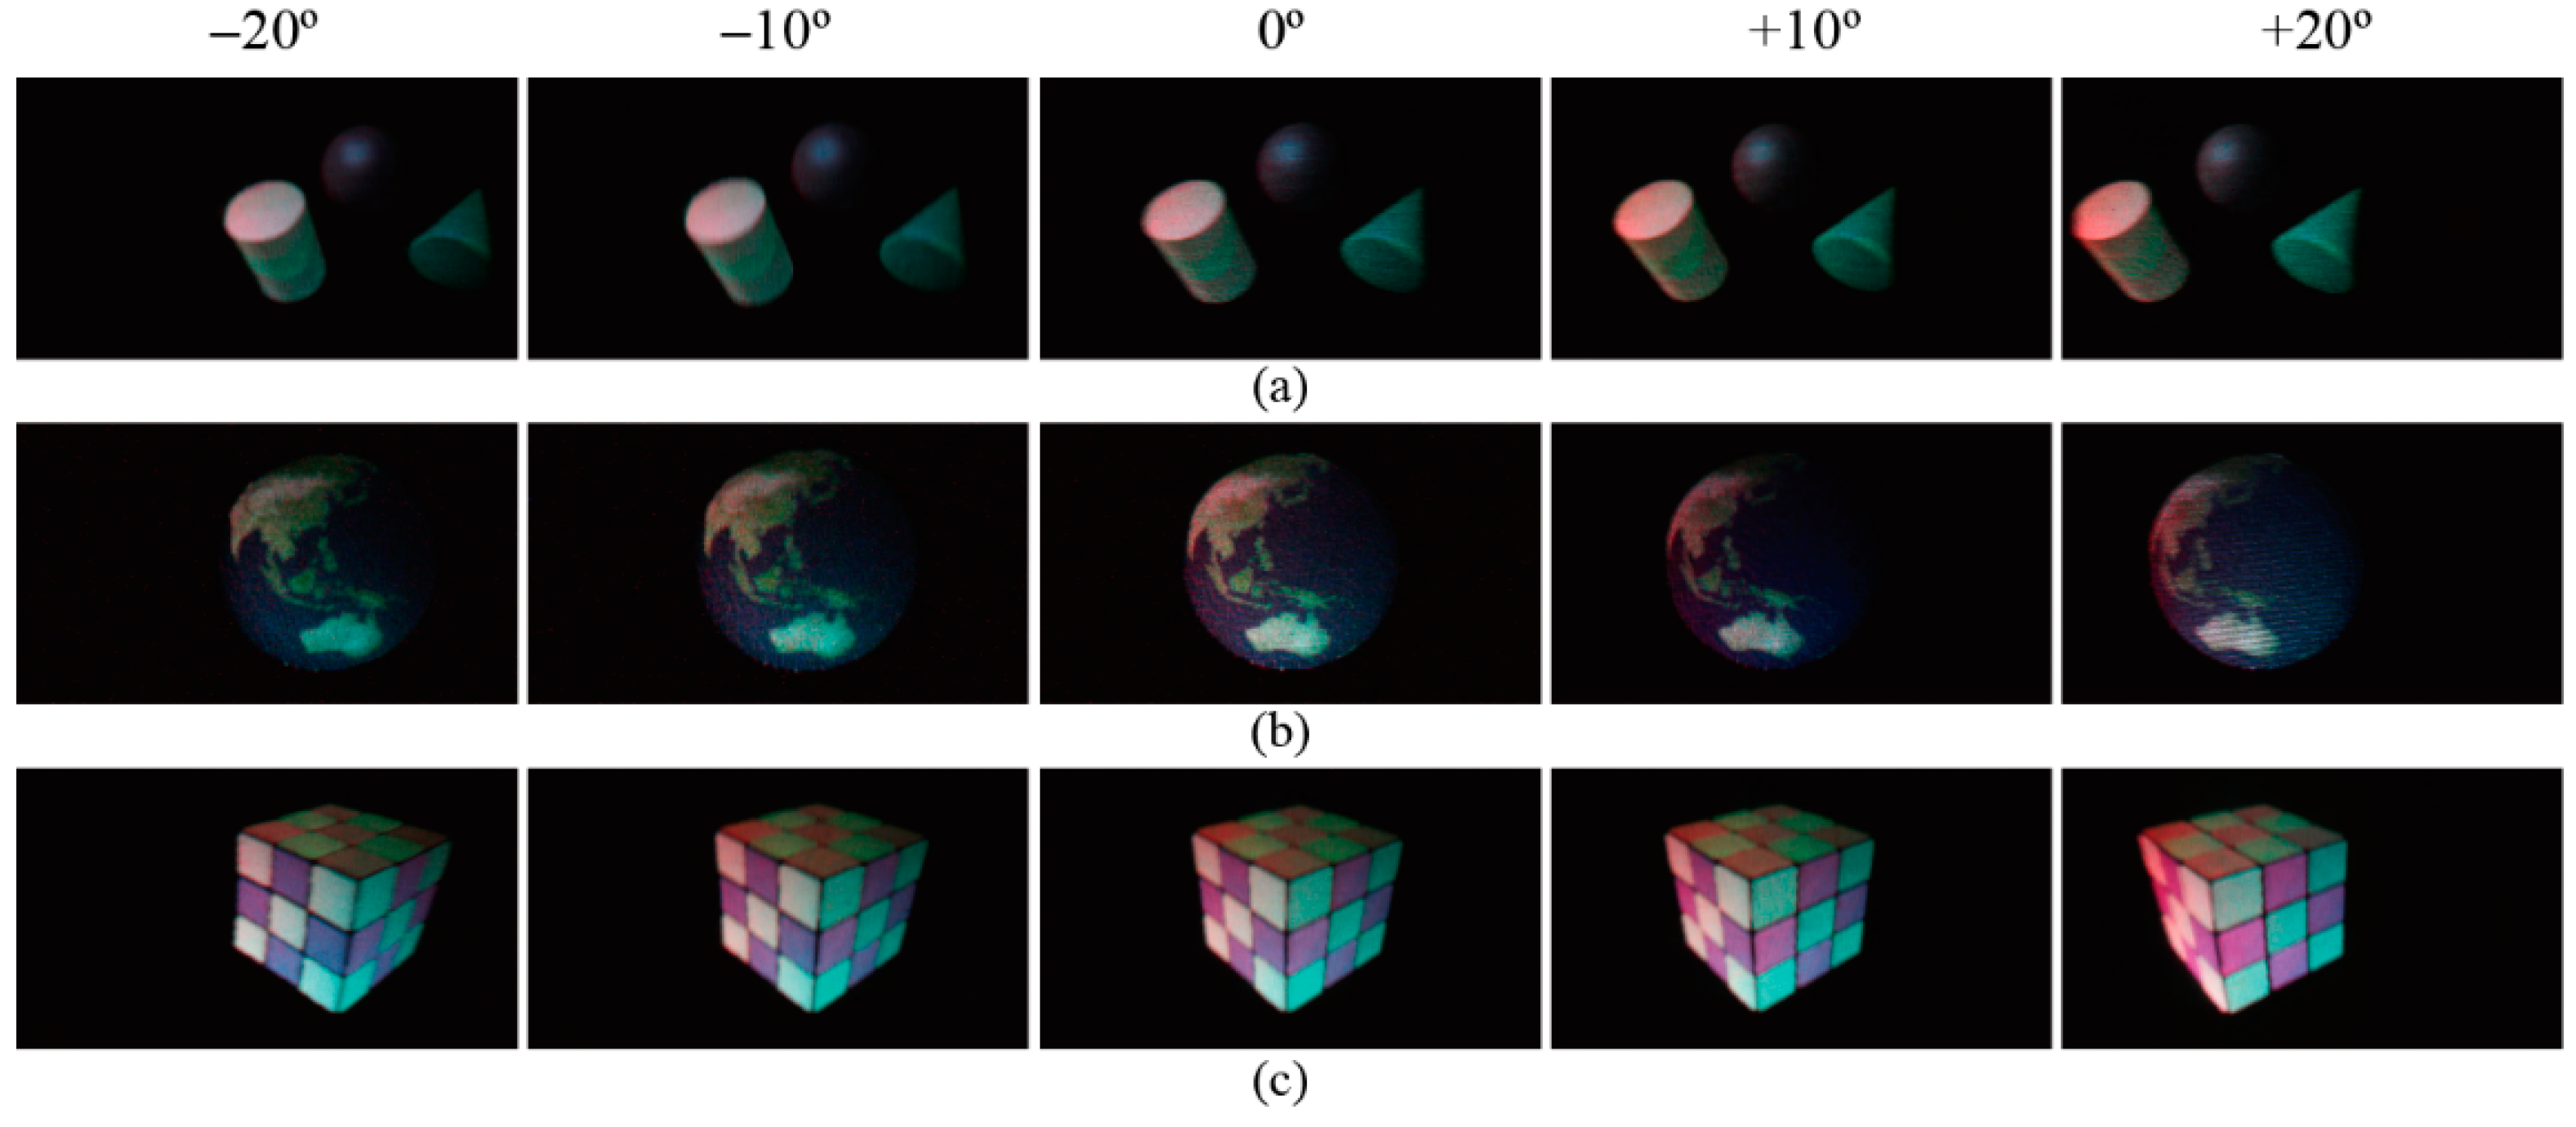
Figure 9 shows the produced color 3D images. The wavelength of the B, G, and R lasers were 488, 515, and 635 nm, respectively. The color profile conversion considering the three laser wavelengths was performed before the hologram calculation for the three colors in order to improve the color representation. The color 3D images were successfully produced. As the DMD can generate only binary images, the error diffusion technique modified for the hologram pattern generation was developed [25]. Although the color change in the vertical direction was mitigated by the vertical diffuser, the 3D images became redder when they were viewed from the left side and more cyan when they were viewed from the right side.
The generation of 3D color image using MEMS SLMs has been proposed by numerous research groups [15,21,26]. There are two techniques that can be used to generate 3D color images: the time-multiplexing technique using a single MEMS SLM and the space-multiplexing technique using three MEMS SLMs. The majority of works in the literature make use of the time-multiplexing technique because of the high frame rate of the DMDs.
5. Multi-Channel Scanning System
Thus far, the time-multiplexing technique has been used to increase the viewing zone and screen size of holographic displays. Although the viewing zone angle has been sufficiently increased to 40–360°, the screen size has been limited to 2–4 inches. For a further increase in screen size, the space-multiplexing technique has been introduced into the viewing zone scanning system [27].
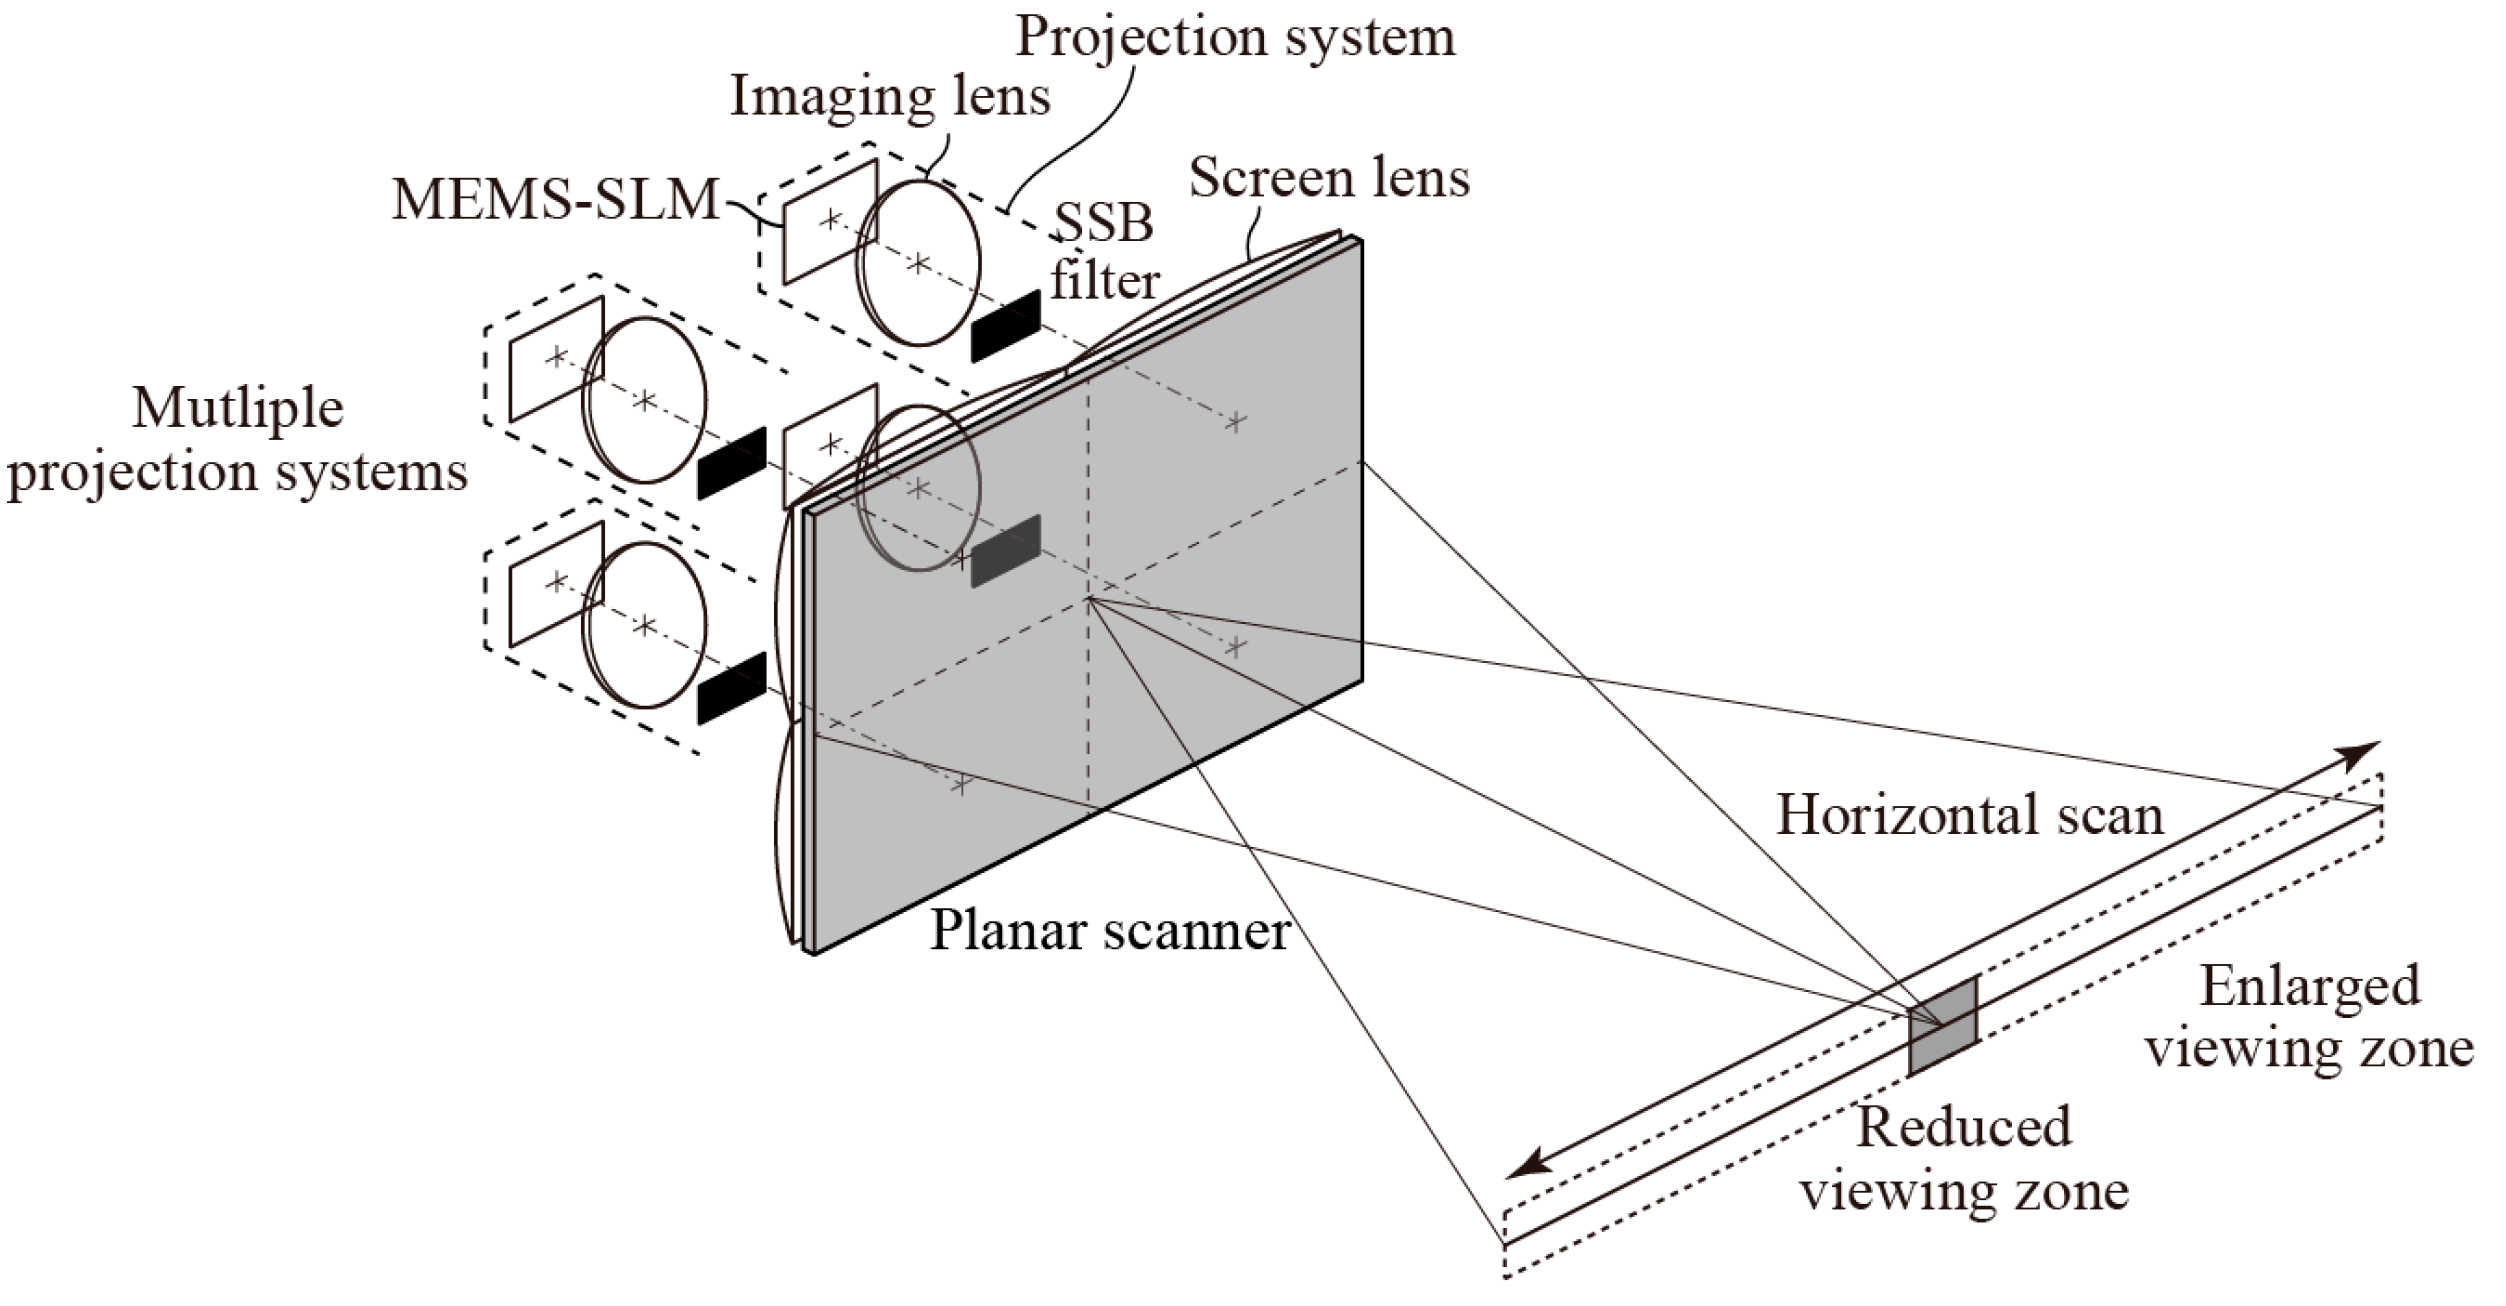
Figure 10 illustrates the multi-channel holographic display system that uses both time-multiplexing and space-multiplexing techniques. A multi-channel system consists of multiple projection systems using the MEMS SLMs and a planar scanner. The projection system shown in Figure 2 is modified to enable us to tile all screens of the multiple projection systems seamlessly. The planar scanner is a screen that supports large images and can redirect the images in a horizontal direction. The planar scanner consists of an off-axis Fresnel lens and a vertical diffuser. The rotation of the off-axis Fresnel lens rotates the viewing zone around the rotation axis. The vertical diffuser diffuses light vertically so that the rotation of the viewing zone is transformed into the horizontal movement of the viewing zone. Thus, the planar scanner can scan the viewing zone in the horizontal direction. The multi-channel system provides a scalable screen size by alternating the number of projectors.
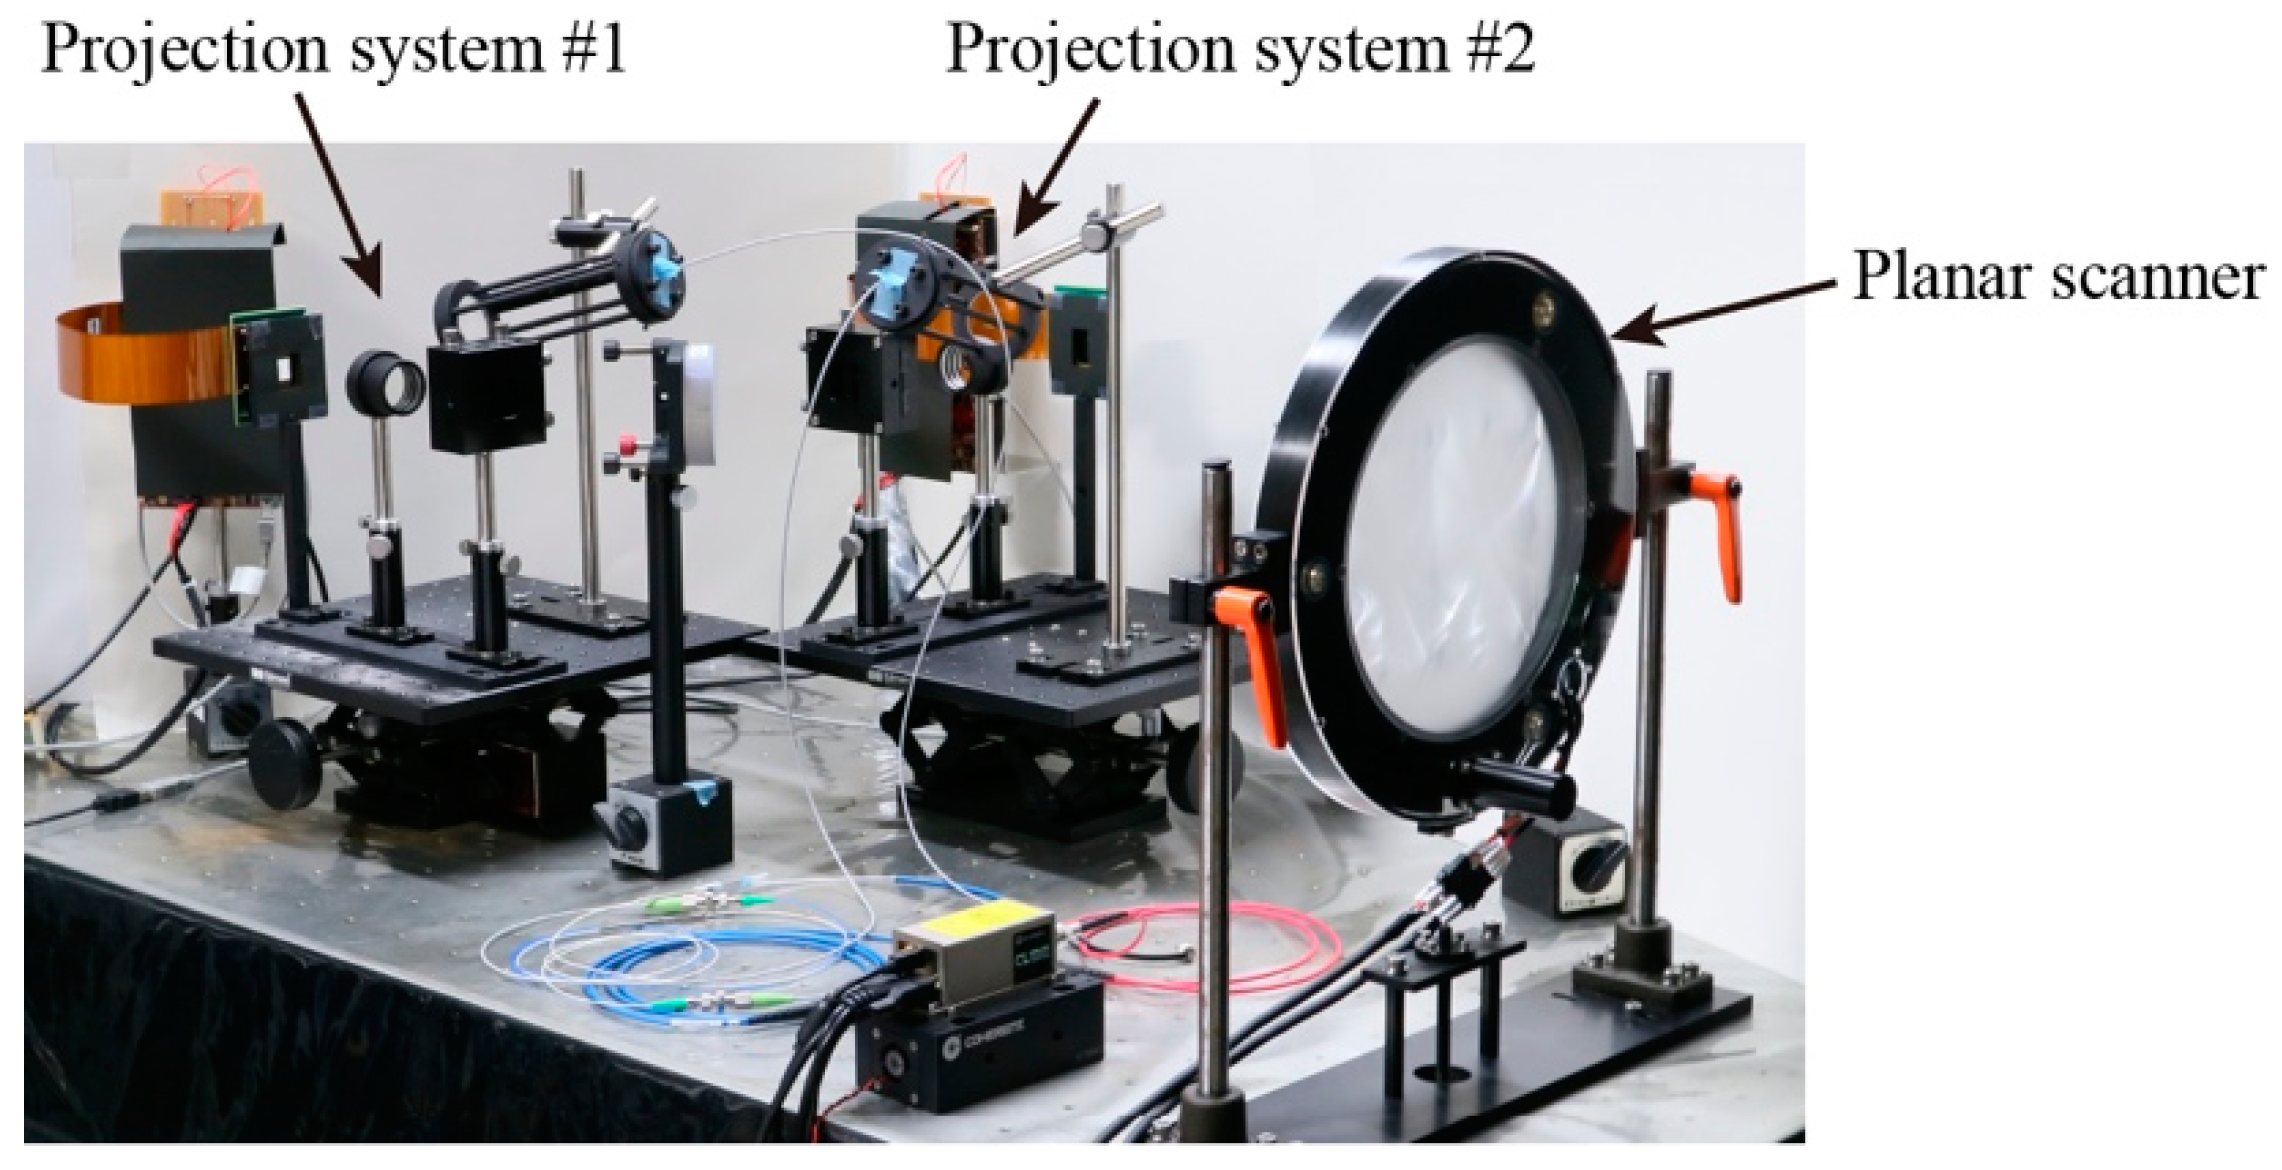
The proposed multi-channel technique was verified using a two-channel holographic display shown in Figure 11. The screens of the projection systems #1 and #2 were horizontally tiled on the planer scanner to increase the screen size to 7.4 inches (156 × 104 mm2). The focal length of the Fresnel lens was f = 800 mm. The scan angle of the planer scanner was 43.0° which was equal to the viewing zone angle of the two-channel system. The 3D images were produced with a frame rate of 60 Hz. As the viewing zone was scanned twice during one rotation of the planar scanner, the rotation speed of the planar scanner was set to 1800 rpm.
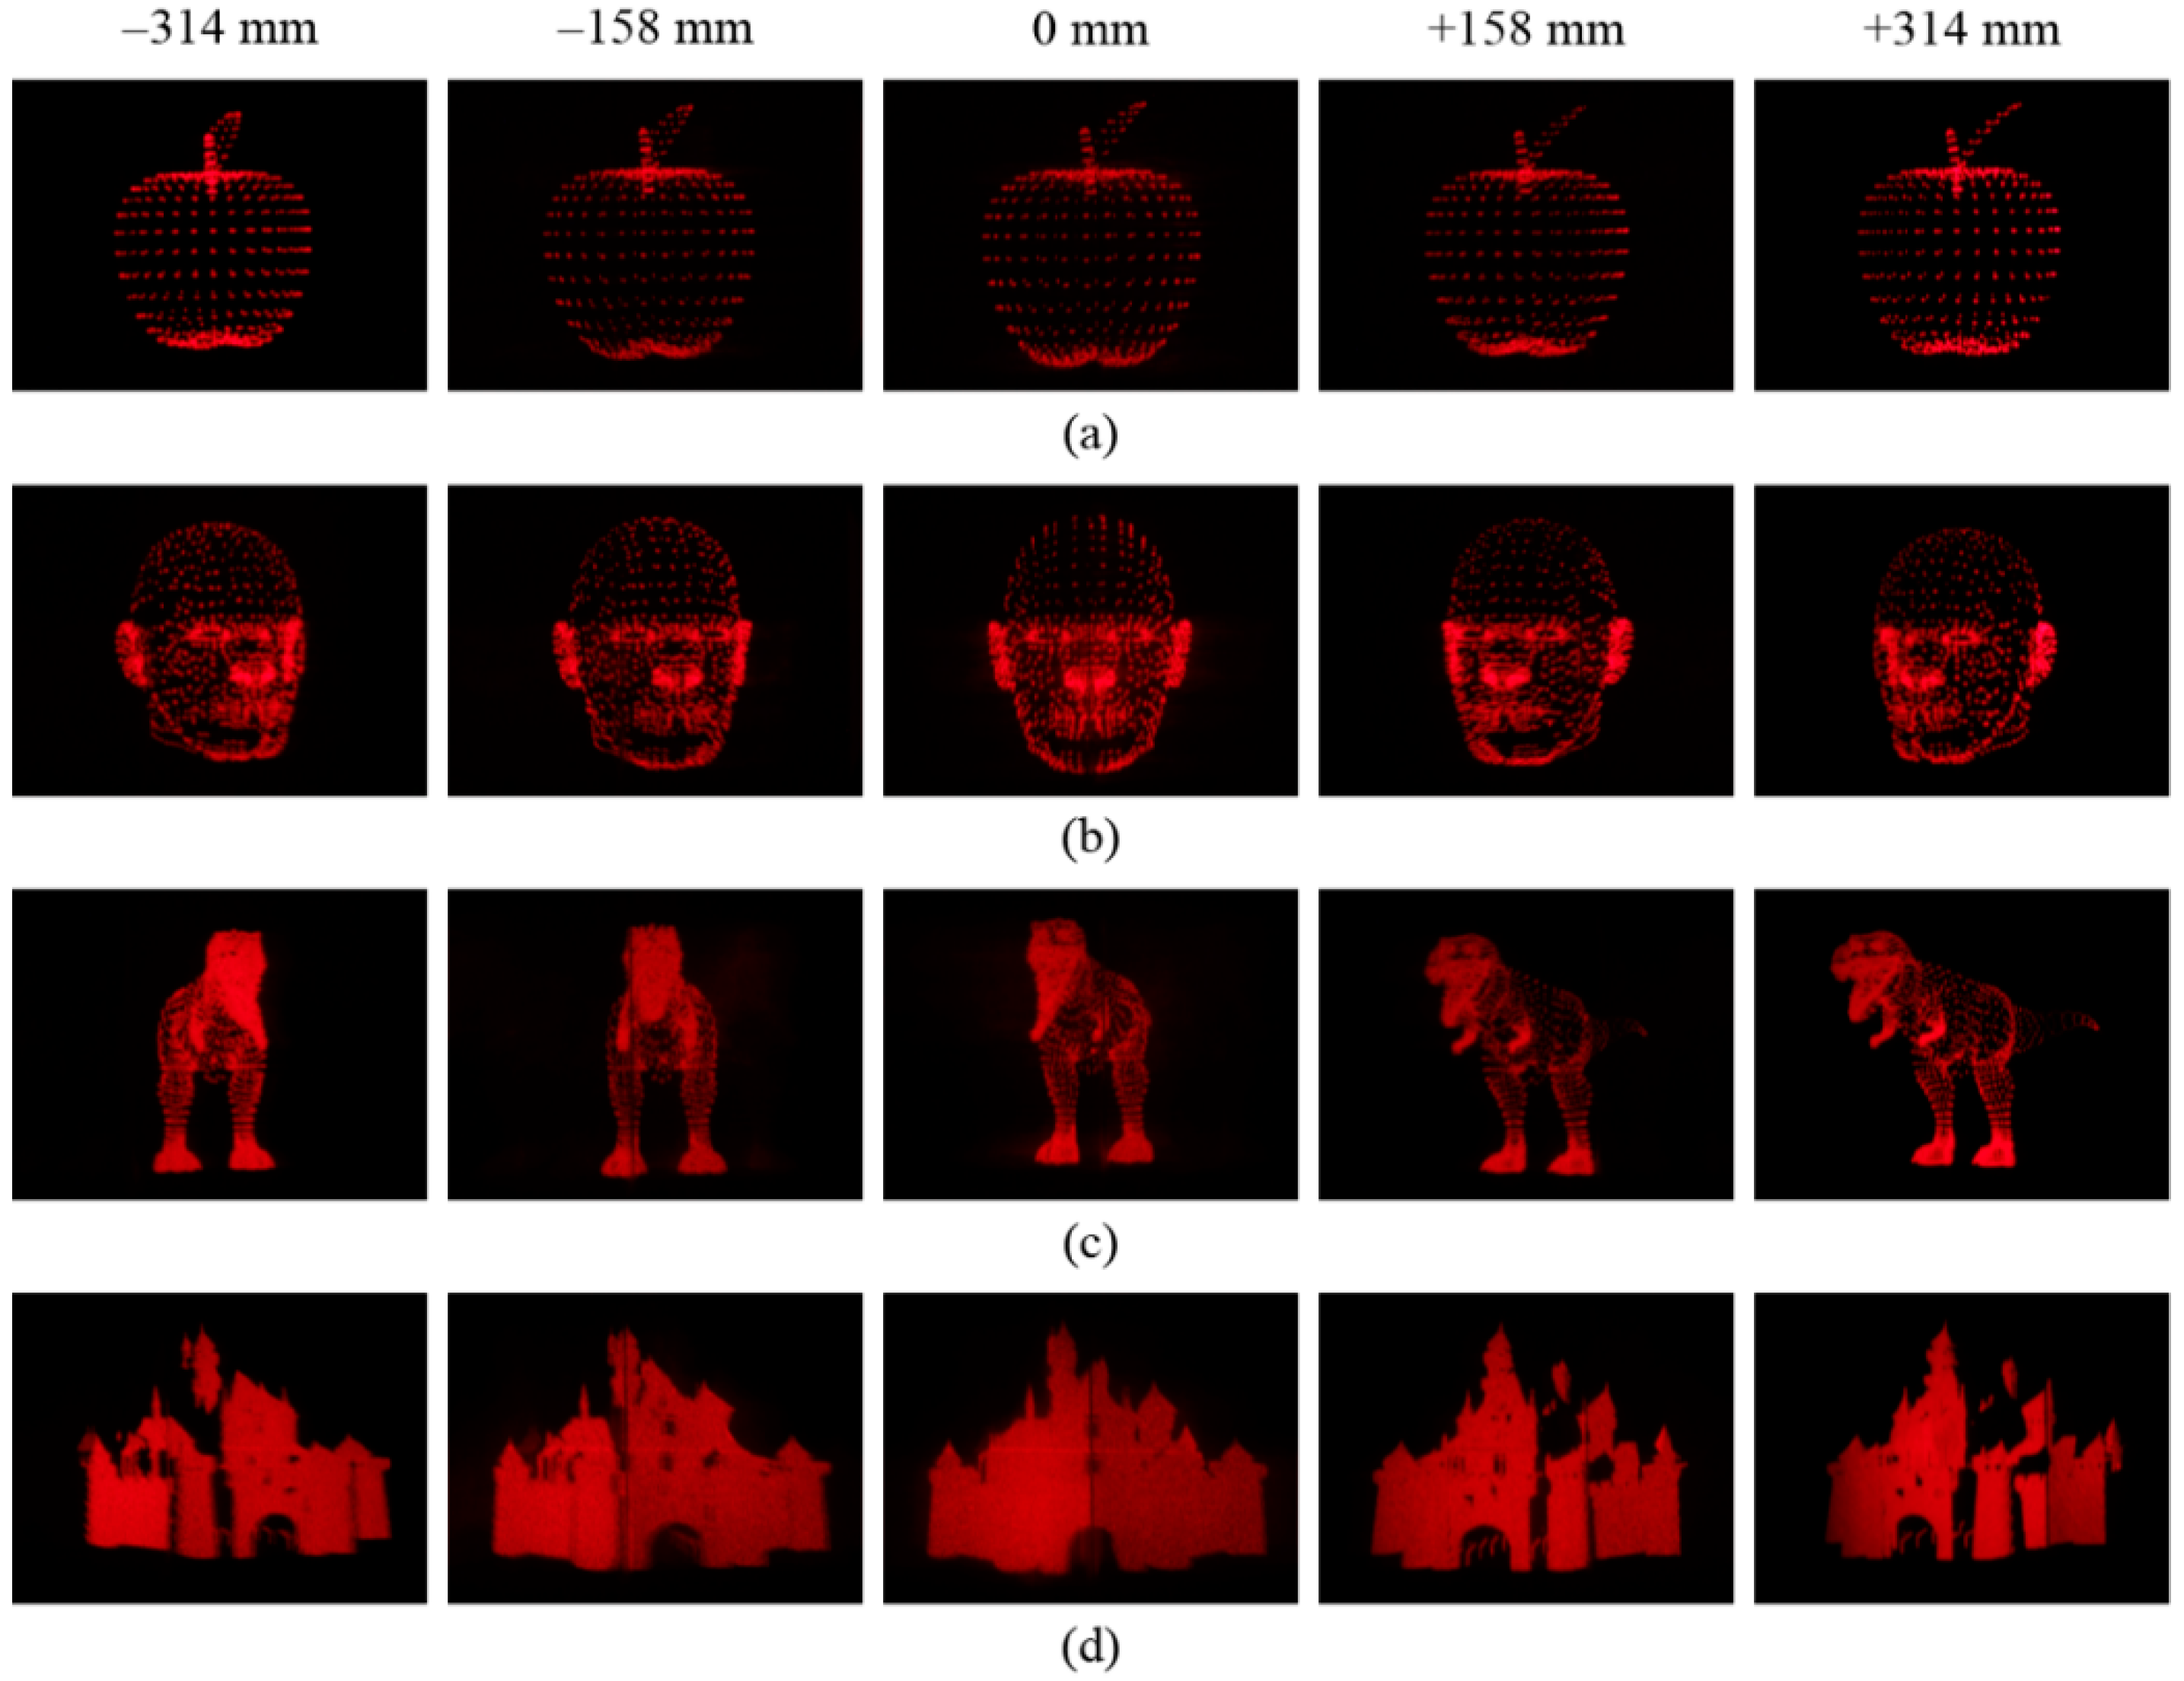
The photographs of the 3D images produced by the two-channel system are shown in Figure 12. From the experimental results, both the large screen size and the wide viewing zone angle were obtained.
The methodology for the enlargement of the screen size described in this section makes use of the space-multiplexing technique. The use of the time-multiplexing technique to increase the screen size is described in the following section. Many research works have made use of the space-multiplexing technique to increase the screen size of the holographic displays [10,11,12,28]. The combination of the 2D scanning system and two DMDs was used to increase the screen size to 10 × 20 mm2 [28]. The space-multiplexing technique has also been used for the holographic displays using liquid-crystal (LC) SLMs to increase the screen size because of the low frame rate of the LC SLMs. Holographic display systems using 9 and 16 LC SLMs were developed to provide a screen size of 2.5 and 3.3 inches, respectively [11,12].
6. Scanning System Using Pulse-Modulated MEMS SLM
For viewing zone scanning holographic displays, the viewing zone angle equals the scan angle of the scanning system, and the screen size equals the optical window size of the scanning system. Therefore, a large scan angle and a large optical window are required for the scanning system. Among various scanning systems, this requirement can be satisfied by mechanical scanners, such as the galvano scanner. However, the use of the mechanical system reduces system reliability and stability. The use of the pulse-modulation of laser light to expose the MEMS SLM has been proposed to eliminate the mechanical scanning systems from the holographic display systems employing the MEMS SLM [29].
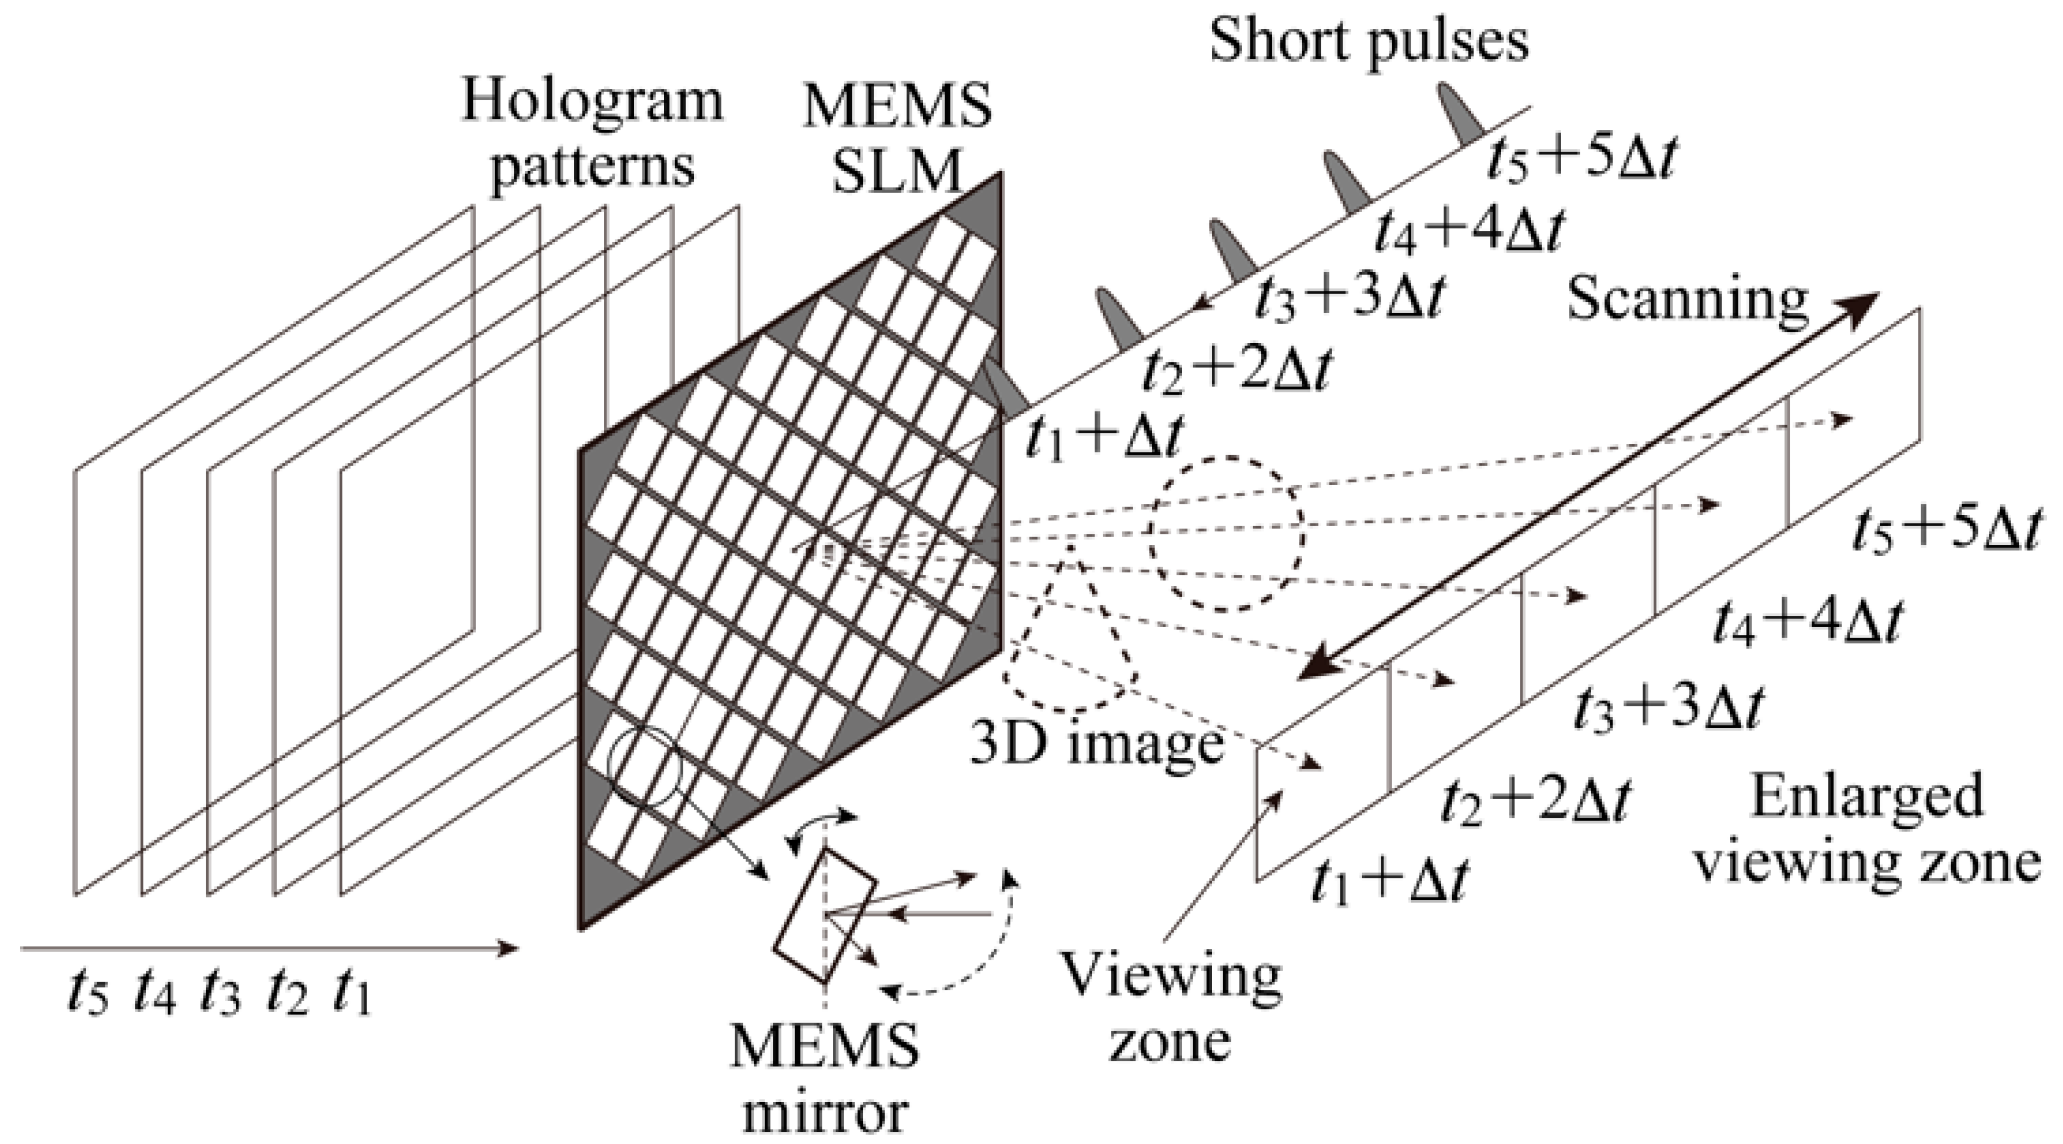
Figure 13 illustrates the holographic display using the pulse-modulated MEMS SLM. Short-pulse laser light exposes the MEMS SLM. The MEMS SLM consists of two-dimensionally aligned MEMS mirrors. The MEMS mirrors have binary states, i.e., an on state and an off state, and quickly rotate to alter their states from on to off, and vice versa. All MEMS mirrors alter their states simultaneously to display 2D images. The proposed technique uses a rotating state of the MEMS mirrors, which is not conventionally utilized to generate images. The pulse width of the laser is made shorter than the rotating time of the MEMS mirrors. Hologram patterns are sequentially displayed by the MEMS SLM. When the short-pulse laser light exposes the MEMS mirrors in the rotating state, the direction of light reflected by the MEMS mirrors is determined by the timing of the laser pulse exposure. Therefore, 2D images displayed by the MEMS SLM can be scanned by appropriately controlling the timing of the short-pulse generation. Thus, the pulse-modulation of the MEMS SLM enables the scanning of the viewing zone. When the rotation angles of the MEMS mirrors for the on and off states are respectively represented by +α and −α, the possible scan angle is from +2α to −2α. Therefore, the use of pulse-modulated MEMS SLM can enlarge the viewing zone angle to 4α.
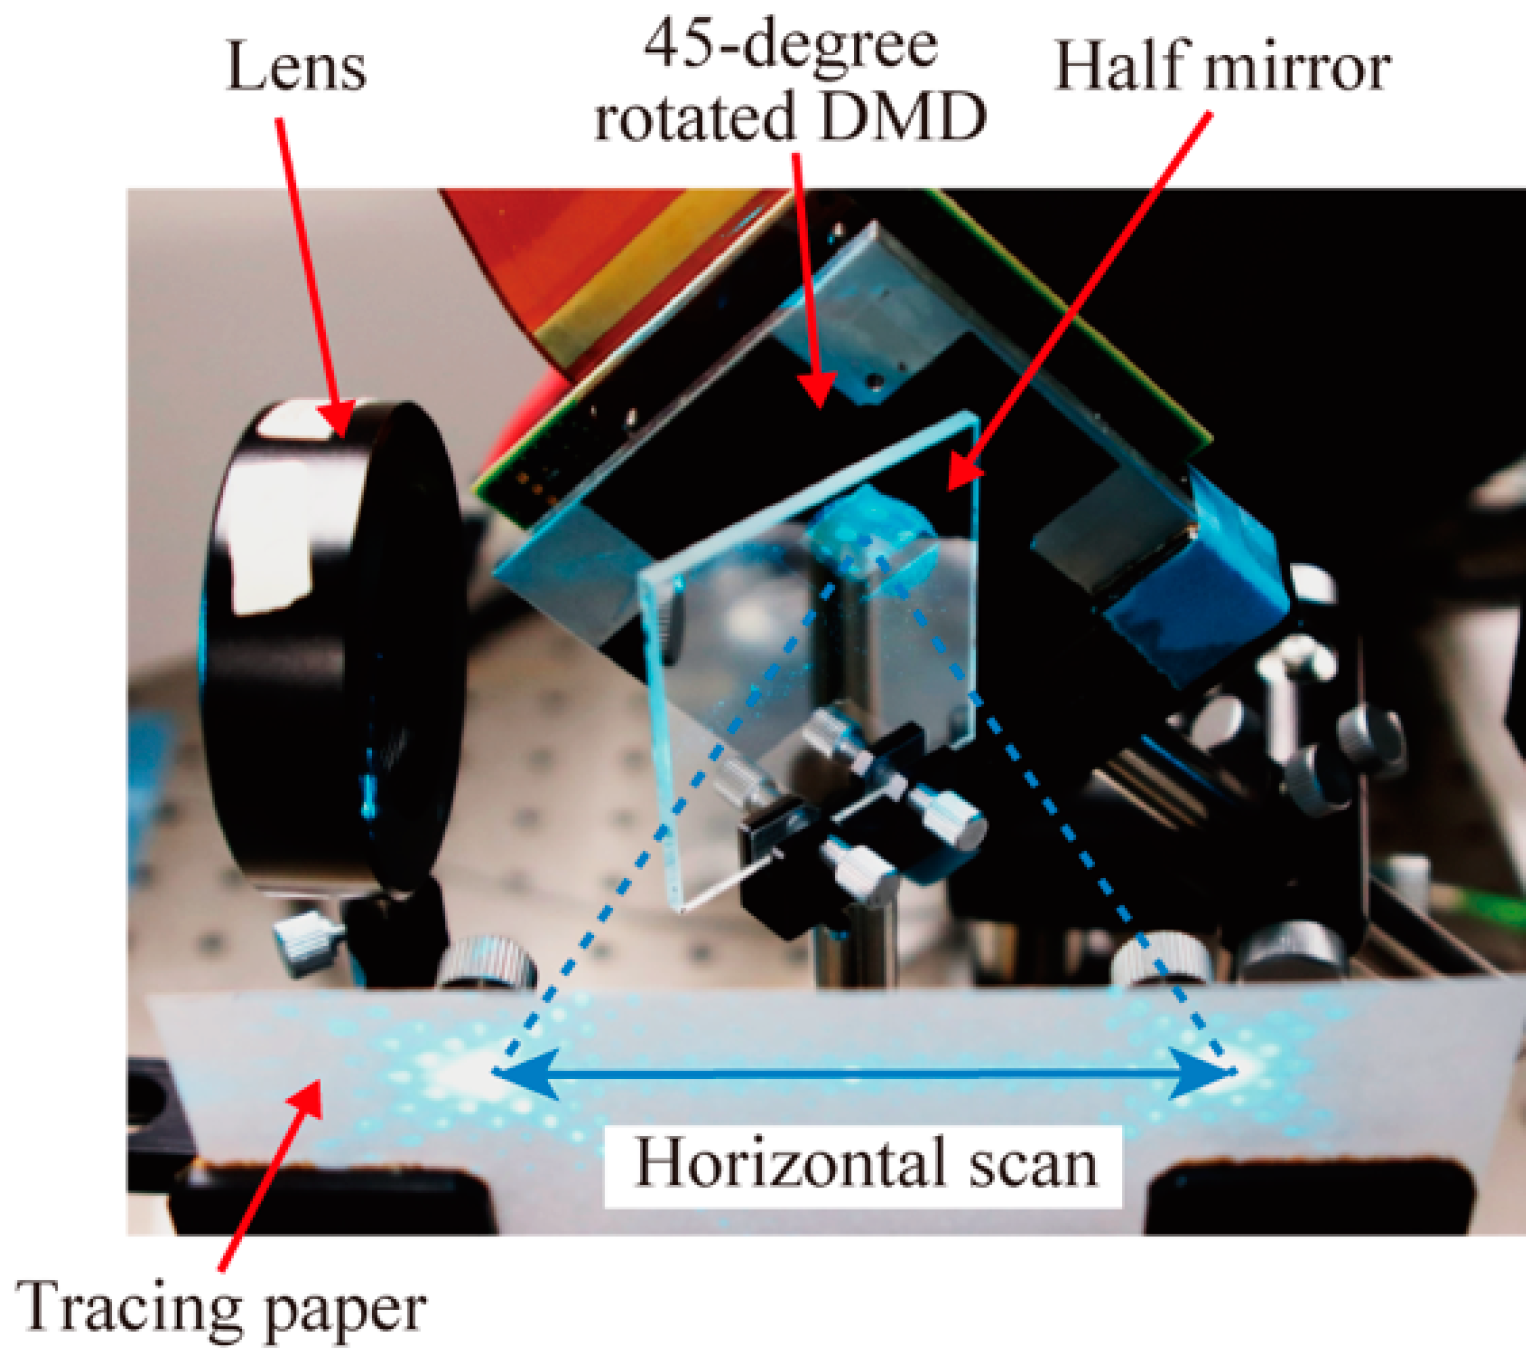
The DMD was also used to verify the technique employing the pulse-modulated MEMS SLM. The MEMS mirrors of the DMD had a rotating angle of α = 12°. Thus, the possible scan angle was from +24° to −24°. Thus, the viewing zone angle could be enlarged to 48°. The rotation time of the MEMS mirrors was 3.83 μs. The pulse width of the laser light was set to 20 ns. So, the number of scan points was 192. The frame rate of the DMD was 22,727 Hz. Thus, the frame rate of displaying 3D images was 59.2 Hz. An FPGA was used to control the pulse signal generation. Figure 14 shows the photograph of the experimental system. The elimination of the mechanical scanning system greatly simplified the display system.
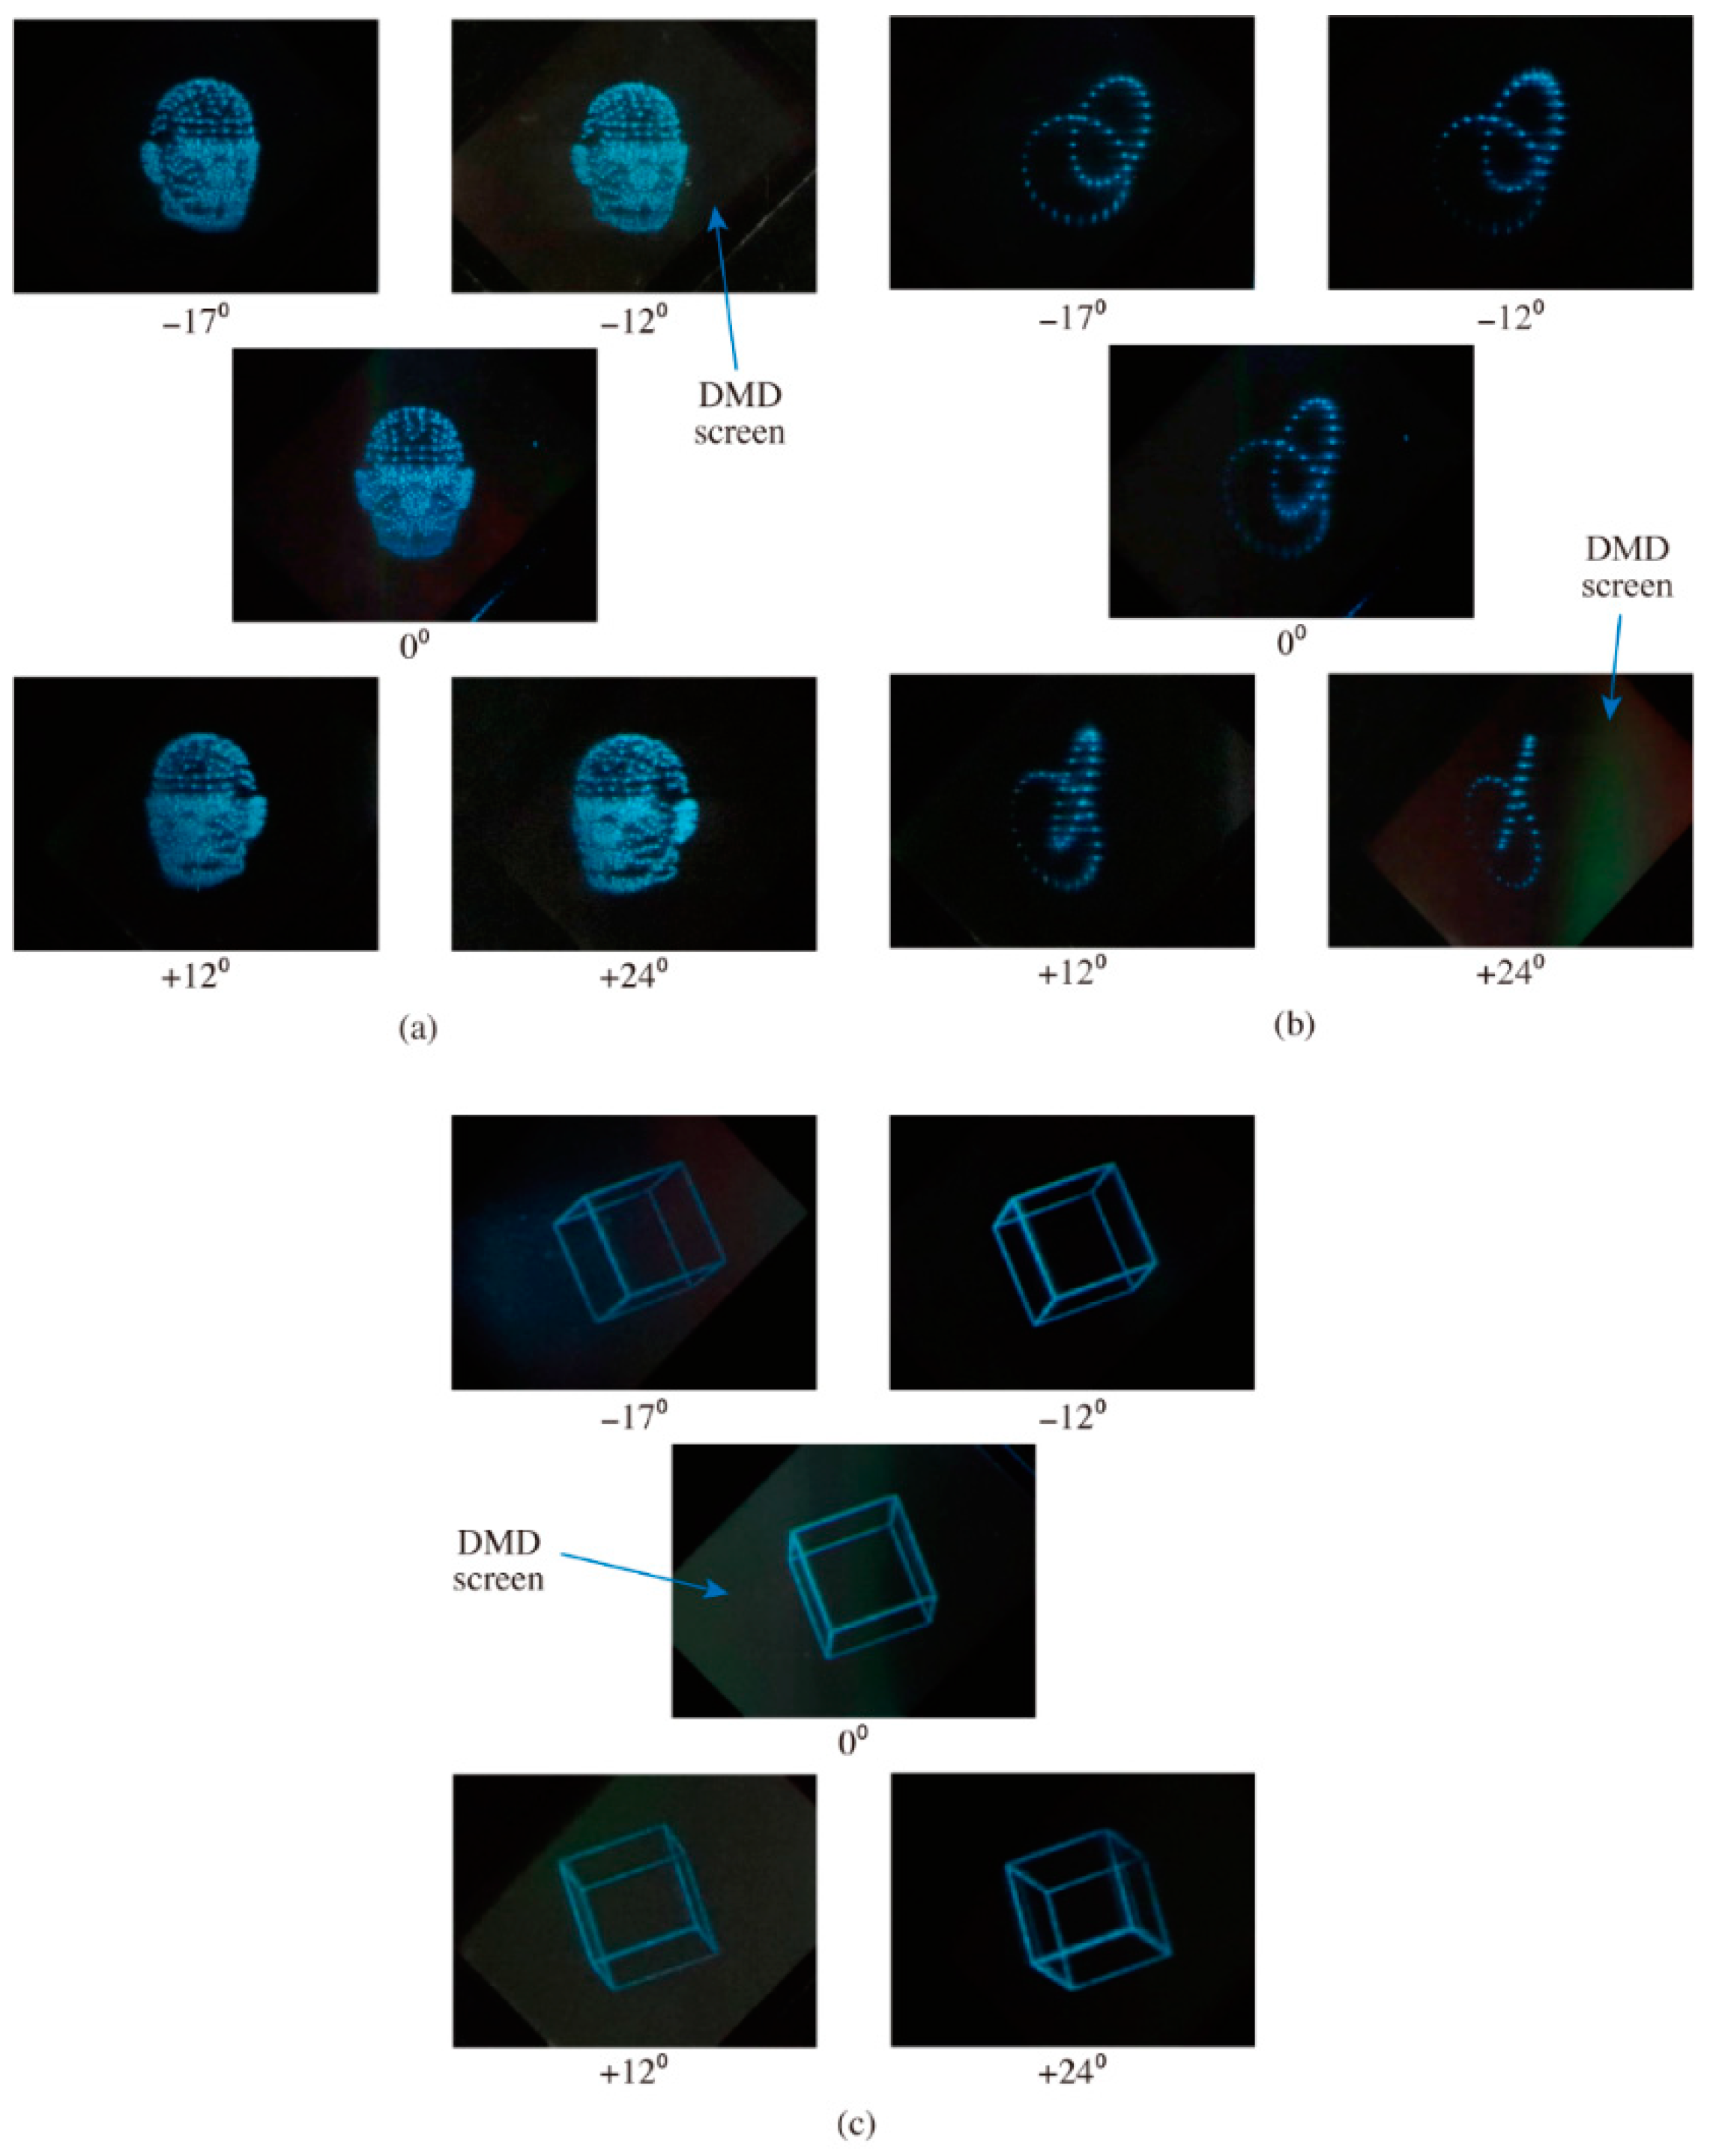
Figure 15 shows the reconstructed images. The effective scan angle was from −18° to +24°, because undesirable distributions appeared in the minus-end scan region. The viewing zone angle was enlarged to 42°. The undesirable light distributions were generated by the small vibration of the MEMS mirrors in the off state when the other MEMS mirrors changed from the off state to the on state.
The pulse modulation of the DMD was originally proposed for the Lidar system [30]. This technique was also used in the construction of the light field display [31]. Although light scanning using the pulse modulation of the MEMS SLM significantly simplified the display systems, the brightness of 3D images was low because the rotation time of the MEMS mirrors was short. The development of a specialized MEMS SLM for use in 3D displays consisting of MEMS mirrors that have a longer rotation time is important.
7. Screen Scanning System
Screen scanning holographic displays using the MEMS SLM [13,32] were also proposed before the proposal of viewing zone scanning holographic displays to enlarge the screen size and the viewing zone. The grayscale and color image generation techniques were also developed for screen scanning display systems [33,34]. The screen scanning systems scan the light beam on the display screen to enlarge the screen size, and the light beam should have a large diverging angle to obtain a large viewing zone. Therefore, screen scanning systems require a large lens to project the screen of the MEMS SLM onto the display screen with a large diverging angle. The requirement for a large-size imaging lens was the problem of the screen scanning systems. However, the viewing zone scanning systems do not require a large-size lens because they perform image magnification like commercial video projectors.
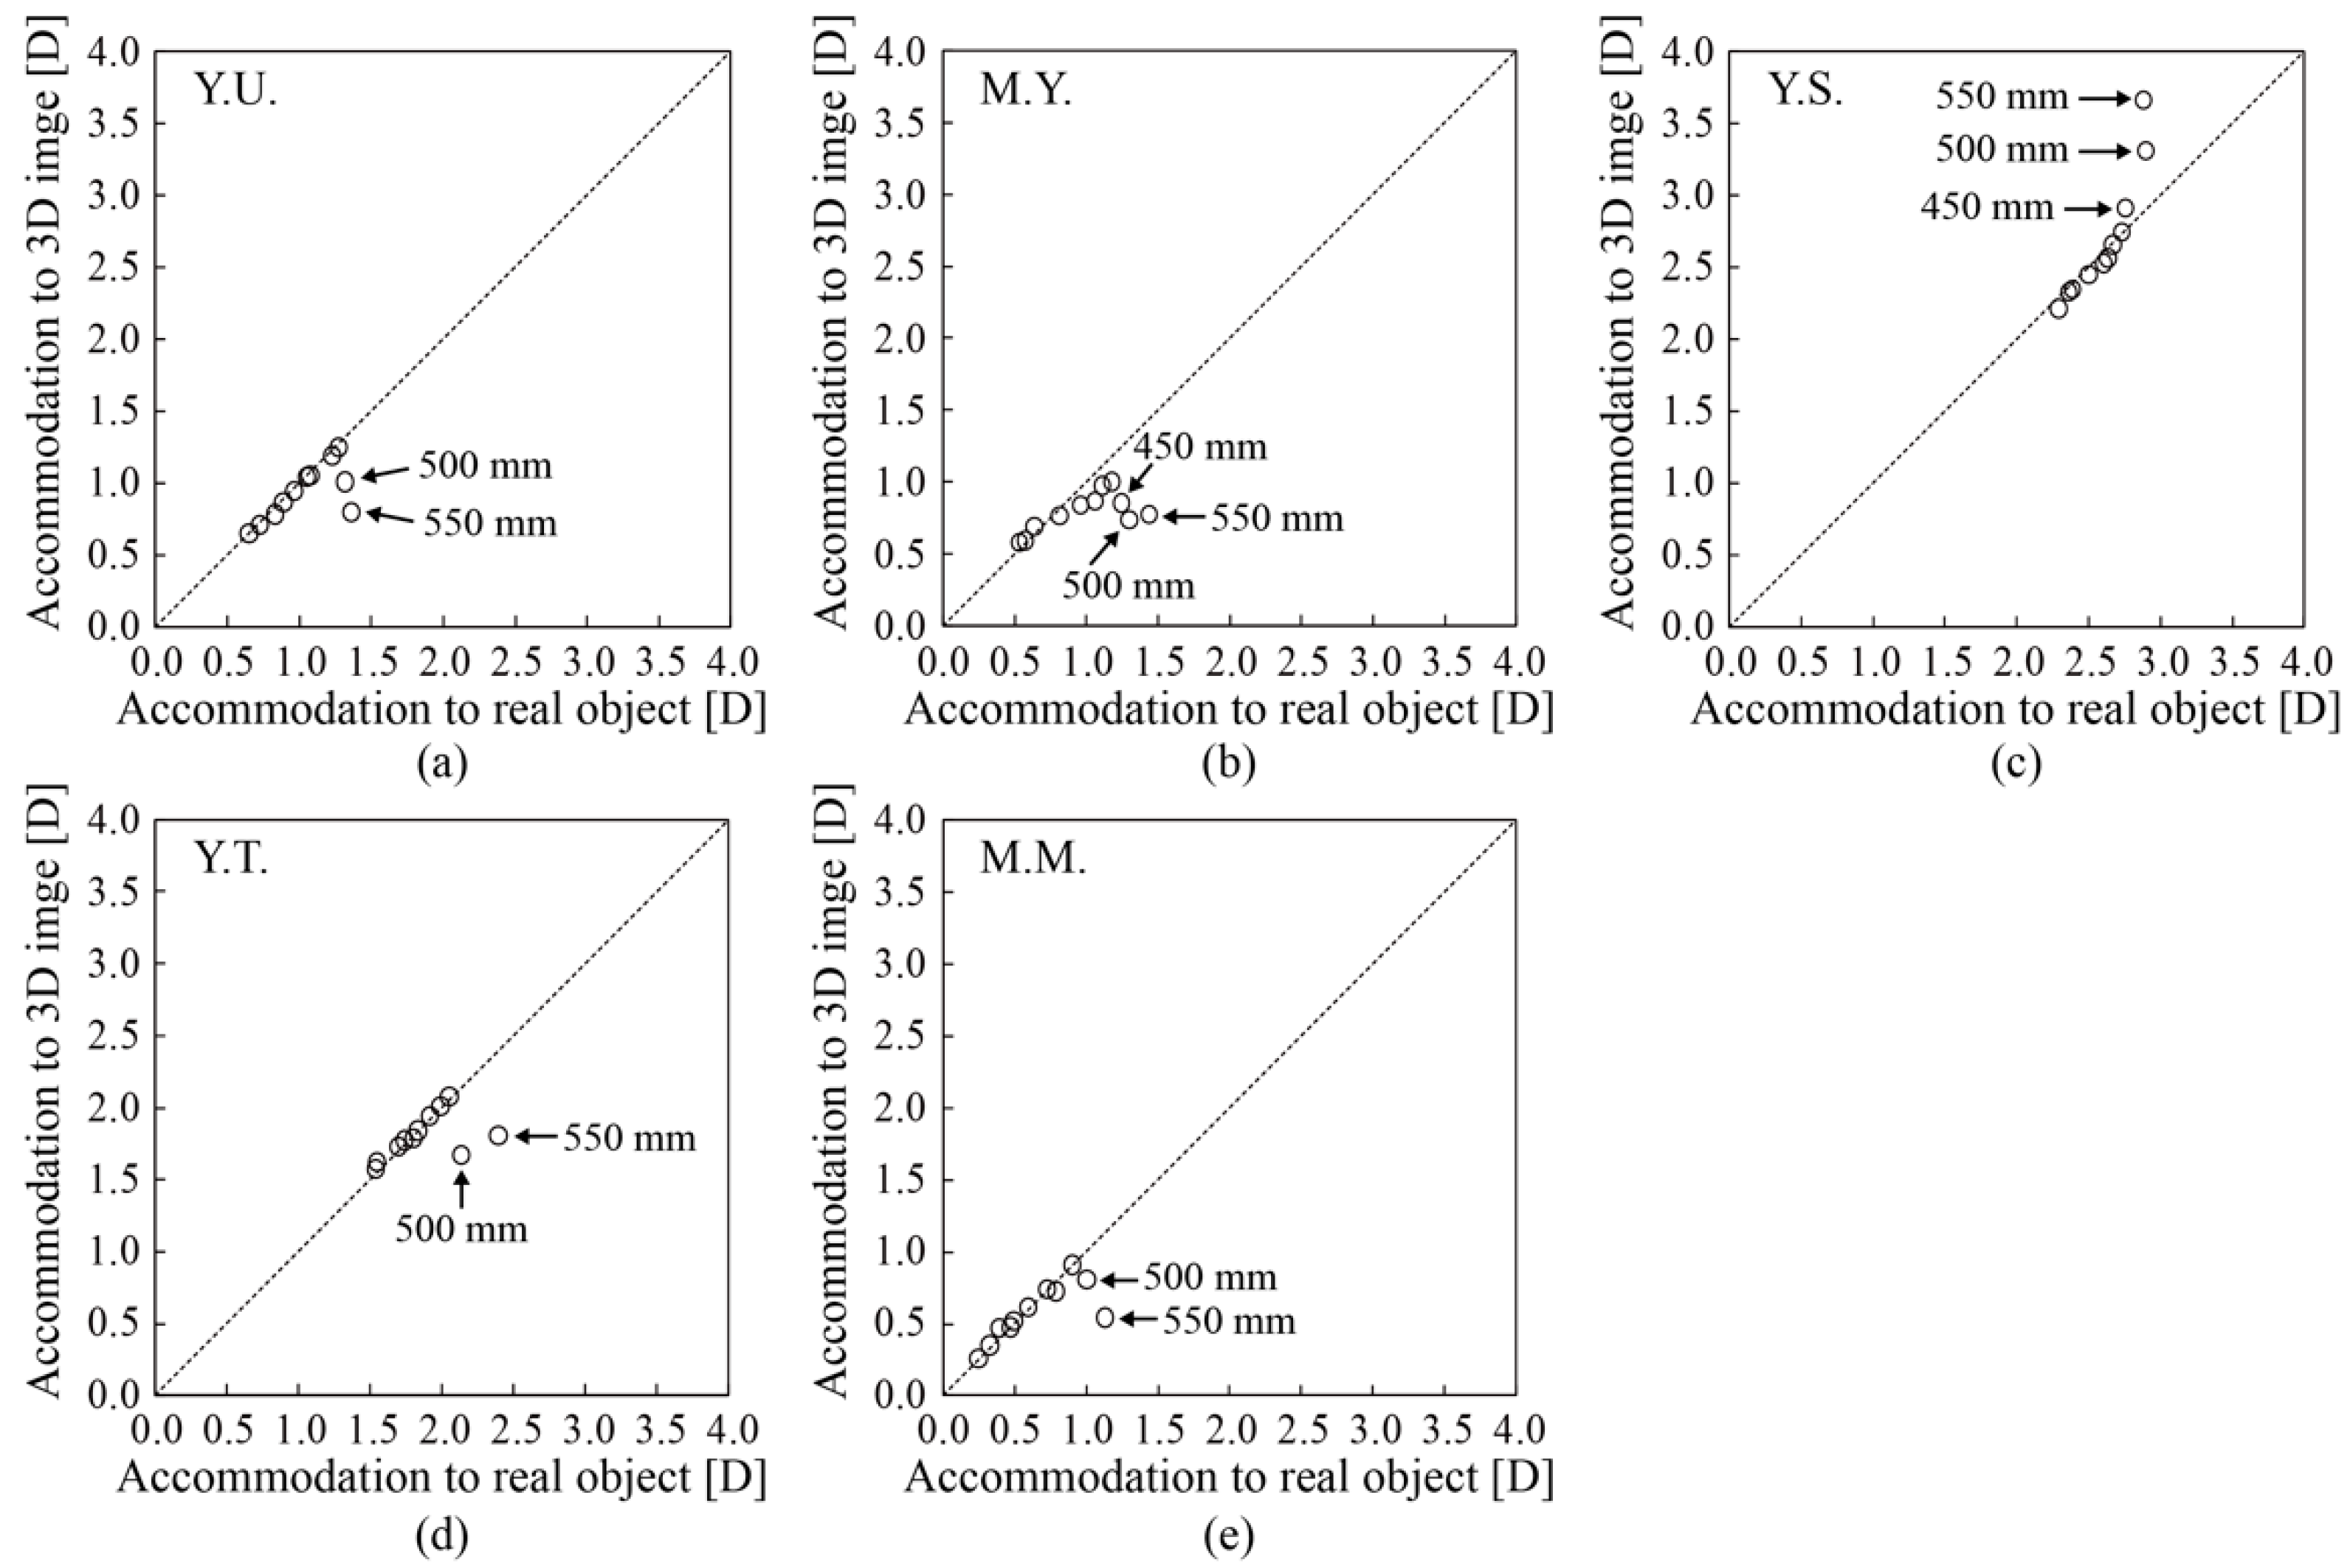
Conventional 3D displays have the issue of visual fatigues caused by the vergence–accommodation conflict [3]. The accommodation, which is the focusing function of the eyes, does not work correctly for 3D images generated by conventional 3D displays. To confirm that the accommodation works correctly for the 3D images generated by the holographic displays, the accommodation responses to the holographic images generated by the screen scanning system were measured [22]. Figure 16 shows the results of the accommodation measurements. Observably, the accommodation responses to the holographic images were similar to those to real objects.
8. Screen Comparisons of Scanning Schemes
The components used to build the experimental systems based on the various scanning schemes described in this article are shown in Table 1, and the parameters describing the performance of the experimental systems are shown in Table 2. The scanning systems increased the viewing zone angle to almost 40°, with the exception of the screen scanning system. The conventional holographic display techniques require a pixel pitch of 0.93 µm for the SLMs to obtain the viewing zone angle of 40° for λ = 635 nm.
The viewing zone scanning system had a larger viewing zone angle and a smaller screen size than the screen scanning system, although the optical system of the former system was much simpler than that of the latter. The frame rate of the 3D image display for the circular scanning system was reduced to about half that of the other scanning systems because more scan points were required to provide a 360-degree viewing zone. In spite of using a single DMD, the display performances for the RGB scanning system remained identical to those for the monochrome (viewing zone scanning) system because the framerate of the DMD was sufficiently high. The multi-channel scanning system increased the screen size by a factor of about 3–4 via the use of two DMDs. The use of the pulse modulation of the DMD eliminated the mechanical scanning system and provided an almost identical viewing zone angle to the viewing zone scanning system because the rotating angle of the MEMS mirrors of the DMD was almost identical to that of the galvano mirror. However, its screen size was the smallest among the systems considered here because the DMD screen was used as the screen for the holographic display.
9. Conclusions
The holographic display systems that combine the MEMS SLMs and the scanning systems were developed to enlarge the screen size and viewing zone angle. The use of the galvano mirror increased the screen size to 2.0 inches and the viewing zone angle to 40.0°. When the circular scanner was combined, the viewing zone was enlarged to 360° with a screen diameter of 100 mm. By use of the high-speed operation of the MEMS SLM and R, G, and B lasers, color images were generated using a single MEMS SLM based on the time-multiplexing technique. The two-channel scanning system increased the screen size to 7.4 inches using the space-multiplexing technique. The short pulse illumination on the MEMS SLM and the precise control of the pulse generation timing enabled the removal of the mechanical scanning system from the holographic display system, and the viewing zone angle was enlarged to 42°. The measurements of the accommodation responses of human eyes to the 3D images generated by the screen scanning system showed that the visual fatigue problem caused by the vergence–accommodation conflict could be solved.
The holographic display techniques described in this article used commercial MEMS SLMs, which were developed for the video projectors. The development of MEMS SLMs specialized for holographic displays would effectively increase viewing zone angles and screen sizes of holographic displays.
Funding
This research was funded by Japan Society for the Promotion of Science (JSPS) KAKENHI, grant number 15H03987 and 19H02189, and also funded by CASIO Science Promotion Foundation.
Conflicts of Interest
The author declares no conflict of interest.
References
- Yaraş, F.; Kang, H.; Onural, L. State of the art in holographic displays: A survey. J. Disp. Technol. 2010, 6, 443–454. [Google Scholar] [CrossRef]
- Okoshi, T. Three-Dimensional Imaging Techniques; Academic Press: New York, NY, USA, 1976; pp. 49–53. [Google Scholar]
- Hoffman, D.M.; Girshick, A.R.; Akeley, K.; Banks, M.S. Vergence-accommodation conflicts hinder visual performance and cause visual fatigue. J. Vis. 2008, 8, 33. [Google Scholar] [CrossRef] [PubMed]
- Hwang, C.-S.; Choi, J.H.; Pi, J.-E.; Yang, J.-H.; Kim, G.H.; Kim, Y.-H.; Kim, J.Y.; Lee, W.-J.; Kim, H.-O.; Lee, H.K.; et al. 21-2: 1 μm pixel pitch spatial light modulator panel for digital holography. In Session 21: Super Resolution and Gen 11; SID2020 Digest; Society for Information Display: Campbell, CA, USA, 2020; pp. 297–300. [Google Scholar]
- Stahl, R.; Rochus, V.; Rottenberg, X.; Cosemans, S.; Haspeslagh, L.; Severi, S.; Van Der Plas, G.; Lafruit, G.; Donnay, S. Modular sub-wavelength diffractive light modulator for high-definition holographic displays. J. Phys. Conf. Ser. 2013, 415, 012057. [Google Scholar] [CrossRef]
- Kim, Y.-H.; Cho, S.M.; Choi, K.; Hwang, C.Y.; Kim, G.H.; Cheon, S.; Hwang, C.-S. Crafting a 1.5 µm pixel pitch spatial light modulator using Ge2Sb2Te5 phase change material. J. Opt. Soc. Am. A 2019, 36, D23–D30. [Google Scholar] [CrossRef]
- Higashida, R.; Funabashi, N.; Aoshima, K.; Machida, K. Submicron-scale light modulation device driven by current-induced domain wall motion for electro-holography. Jpn. J. Appl. Phys. 2020, 59, 053001. [Google Scholar] [CrossRef]
- Isomae, Y.; Aso, S.; Shibasaki, J.; Aoshima, K.; Machida, K.; Kikuchi, H.; Ishinabe, T.; Shibata, Y.; Fujikake, H. Superior Spatial Resolution of Surface-stabilized Ferroelectric Liquid Crystals Compared to Nematic Liquid Crystals for Wide-field-of-view Holographic Displays. Jpn. J. Appl. Phys. 2020, 59, 040901. [Google Scholar] [CrossRef]
- Isomae, Y.; Ishinabe, T.; Shibata, Y.; Fujikake, H. Alignment control of liquid crystals in a 1.0-μm-pitch spatial light modulator by lattice-shaped dielectric wall structure. J. Soc. Inf. Display 2019, 27, 251–258. [Google Scholar] [CrossRef]
- Hahn, J.; Kim, H.; Lim, Y.; Park, G.; Lee, B. Wide viewing angle dynamic holographic stereogram with a curved array of spatial light modulators. Opt. Express 2008, 16, 12372–12386. [Google Scholar] [CrossRef]
- Yamamoto, K.; Ichihashi, Y.; Senoh, T.; Oi, R.; Kurita, T. 3D objects enlargement technique using an optical system and multiple SLMs for electronic holography. Opt. Express 2012, 20, 21137–21144. [Google Scholar] [CrossRef]
- Sasaki, H.; Yamamoto, K.; Ichihashi, Y.; Senoh, T. Image size scalable full-parallax coloured three-dimensional video by electronic holography. Sci. Rep. 2014, 4, 4000. [Google Scholar] [CrossRef] [Green Version]
- Takaki, Y.; Okada, N. Hologram generation by horizontal scanning of a high-speed SLM. Appl. Opt. 2009, 48, 3255–3260. [Google Scholar] [CrossRef] [PubMed]
- Li, J.; Smithwick, Q.; Chu, D. Full bandwidth dynamic coarse integral holographic displays with large field of view using a large resonant scanner and a galvanometer scanner. Opt. Express 2018, 26, 17459–17476. [Google Scholar] [CrossRef] [PubMed]
- Chen, J.S.; Smithwick, Q.Y.J.; Chu, D.P. Coarse integral holography approach for real 3D color video displays. Opt. Express 2016, 24, 6705–6718. [Google Scholar] [CrossRef] [Green Version]
- Lim, Y.; Hong, K.; Kim, H.; Kim, H.; Chang, E.; Lee, S.; Kim, T.; Nam, J.; Choo, H.; Kim, J.; et al. 360-degree tabletop electronic holographic display. Opt. Express 2016, 24, 24999–25009. [Google Scholar] [CrossRef] [PubMed] [Green Version]
- Sando, Y.; Satoh, K.; Barada, D.; Yatagai, T. Full-color holographic 3D display with horizontal full viewing zone by spatiotemporal-division multiplexing. Appl. Opt. 2018, 57, 7622–7626. [Google Scholar] [CrossRef] [PubMed]
- Sando, Y.; Satoh, K.; Barada, D.; Yatagai, T. Real-time interactive holographic 3D display with a 360° horizontal viewing zone. Appl. Opt. 2019, 58, G1–G5. [Google Scholar] [CrossRef]
- Takaki, Y.; Fujii, K. Viewing-zone scanning holographic display using a MEMS spatial light modulator. Opt. Express 2014, 22, 24713–24721. [Google Scholar] [CrossRef]
- Inoue, T.; Takaki, Y. Table screen 360-degree holographic display using circular viewing-zone scanning. Opt. Express 2015, 23, 6533–6542. [Google Scholar] [CrossRef]
- Matsumoto, Y.; Takaki, Y. Time-multiplexed color image generation by viewing-zone scanning holographic display employing MEMS-SLM. J. Soc. Inf. Disp. 2017, 25, 515–523. [Google Scholar] [CrossRef]
- Takaki, Y.; Yokouchi, M. Accommodation measurements of horizontally scanning holographic display. Opt. Express 2012, 20, 3918–3931. [Google Scholar] [CrossRef]
- Hilaire, P.S.; Benton, S.A.; Lucente, M.; Hubel, P.M. Color images with the MIT holographic video display. Proc. SPIE 1992, 1667, 73–84. [Google Scholar]
- Takaki, Y.; Tanemoto, Y. Band-limited zone plates for single-sideband holography. Appl. Opt. 2009, 48, H64–H70. [Google Scholar] [CrossRef] [PubMed]
- Matsumoto, Y.; Takaki, Y. Improvement of gray-scale representation of horizontally scanning holographic display using error diffusion. Opt. Lett. 2014, 39, 3433–3436. [Google Scholar] [CrossRef]
- Kim, J.; Lim, Y.; Hong, K.; Kim, H.; Kim, H.-E.; Nam, J.; Park, J.; Hahn, J.; Kim, Y.-J. Electronic Tabletop Holographic Display: Design, Implementation, and Evaluation. Appl. Sci. 2019, 9, 705. [Google Scholar] [CrossRef] [Green Version]
- Takaki, Y.; Nakaoka, M. Scalable screen-size enlargement by multi-channel viewing-zone scanning holography. Opt. Express 2016, 24, 18772–18781. [Google Scholar] [CrossRef]
- Li, J.; Smithwick, Q.; Chu, D. Scalable coarse integral holographic video display with integrated spatial image tiling. Opt. Express 2020, 28, 9899–9912. [Google Scholar] [CrossRef] [PubMed] [Green Version]
- Takekawa, Y.; Takashima, Y.; Takaki, Y. Holographic display having a wide viewing zone using a MEMS SLM without pixel pitch reduction. Opt. Express 2020, 28, 7392–7407. [Google Scholar] [CrossRef] [PubMed]
- Smith, B.; Gin, A.; Espinoza, A.; Takashima, Y.; Hellman, B. Single chip lidar with discrete beam steering by digital micromirror device. Opt. Express 2017, 25, 14732–14745. [Google Scholar] [CrossRef]
- Hellman, B.; Takashima, Y. Angular and spatial light modulation by single digital micromirror device for multi-image output and nearly-doubled étendue. Opt. Express 2019, 27, 21477–21496. [Google Scholar] [CrossRef] [Green Version]
- Takaki, Y.; Okada, N. Reduction of image blurring of horizontally scanning holographic display. Opt. Express 2010, 18, 11327–11334. [Google Scholar] [CrossRef]
- Takaki, Y.; Yokouchi, M.; Okada, N. Improvement of grayscale representation of the horizontally scanning holographic display. Opt. Express 2010, 18, 24926–24936. [Google Scholar] [CrossRef] [PubMed]
- Takaki, Y.; Matsumoto, Y.; Nakajima, T. Color image generation for screen-scanning holographic display. Opt. Express 2015, 23, 26986–26998. [Google Scholar] [CrossRef] [PubMed]
Figure 1.
Generation of viewing zone: (a) conventional technique using a sub-micron pixel pitch SLM and (b) combination of MEMS SLM and spatial scanning.
Figure 1.
Generation of viewing zone: (a) conventional technique using a sub-micron pixel pitch SLM and (b) combination of MEMS SLM and spatial scanning.

Figure 2.
Viewing zone scanning holographic display using MEMS SLM.

Figure 3.
Experimental system for the viewing zone scanning holographic display.

Figure 4.
Reconstructed images captured from different horizontal positions produced by the viewing zone scanning system: (a) plane, (b) castle, and (c) ship.
Figure 4.
Reconstructed images captured from different horizontal positions produced by the viewing zone scanning system: (a) plane, (b) castle, and (c) ship.

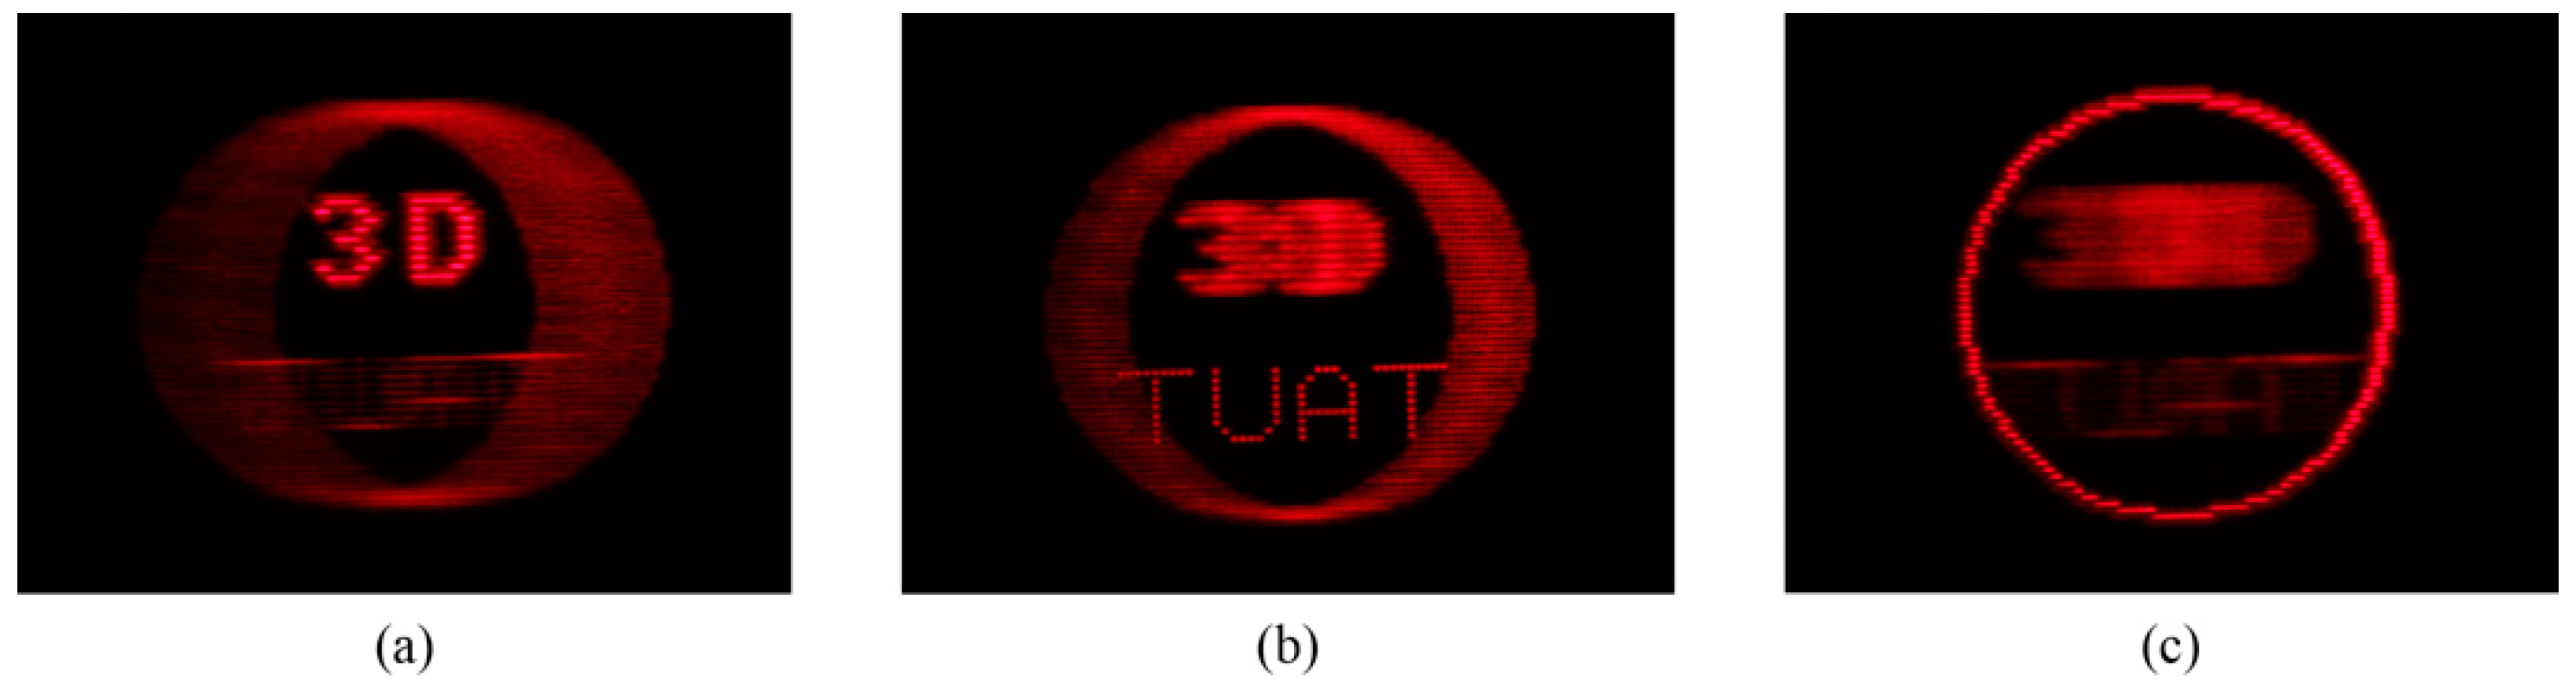
Figure 5.
Reconstructed images captured by focusing on various depth positions: (a) “3D” at +100 mm, (b) “TUAT” at +30 mm, and (c) a circle at −100 mm.
Figure 5.
Reconstructed images captured by focusing on various depth positions: (a) “3D” at +100 mm, (b) “TUAT” at +30 mm, and (c) a circle at −100 mm.

Figure 6.
Circular scanning holographic display using MEMS SLM: (a) system configuration and (b) circular scanning using an off-axis lens.
Figure 6.
Circular scanning holographic display using MEMS SLM: (a) system configuration and (b) circular scanning using an off-axis lens.

Figure 7.
360° holographic images generated by circular scanning holographic display; photographs were captured from four different directions: (a) symbols and (b) two planes.
Figure 7.
360° holographic images generated by circular scanning holographic display; photographs were captured from four different directions: (a) symbols and (b) two planes.

Figure 8.
RGB viewing-zone scanning scheme to produce color 3D images.

Figure 9.
Color 3D images produced by RGB scanning holographic display: (a) three objects, (b) earth, and (c) cube.
Figure 9.
Color 3D images produced by RGB scanning holographic display: (a) three objects, (b) earth, and (c) cube.

Figure 10.
Multi-channel holographic display using multiple MEMS SLMs.

Figure 11.
Two-channel holographic display system.

Figure 12.
3D images produced by the two-channel display: (a) apple, (b) head, (c) T-REX, and (d) castle.
Figure 12.
3D images produced by the two-channel display: (a) apple, (b) head, (c) T-REX, and (d) castle.

Figure 13.
Holographic display using pulse-modulated MEMS SLM.

Figure 14.
Experimental system of holographic display using pulse-modulated MEMS SLM.

Figure 15.
Reconstructed images generated by holographic display using pulse-modulated MEMS SLM: (a) head, (b) two rings, and (c) cube.
Figure 15.
Reconstructed images generated by holographic display using pulse-modulated MEMS SLM: (a) head, (b) two rings, and (c) cube.

Figure 16.
Results of accommodation measurements to compare responses to real objects and holographic images: (a) Y. U., (b) Y. S., (c) M. Y., (d) Y. T., and (e) M. M.
Figure 16.
Results of accommodation measurements to compare responses to real objects and holographic images: (a) Y. U., (b) Y. S., (c) M. Y., (d) Y. T., and (e) M. M.


Table 1.
Components used in the holographic displays using various scanning schemes.
| Scanning Scheme | Scanning System | Number of DMDs | Framerate of DMD |
|---|---|---|---|
| Screen scanning | Galvano mirror | 1 | 13.333 kHz |
| Viewing zone scanning | Galvano mirror | 1 | 13.333 kHz |
| Circular scanning | Rotating Fresnel lens | 1 | 22.727 kHz |
| RGB scanning | Galvano mirror | 1 | 22.727 kHz |
| Multi-channel scanning | Rotating Fresnel lens | 2 | 22.727 kHz |
| Pulse-modulated MEMS SLM | None | 1 | 22.727 kHz |
Table 2.
Performance measures of the holographic displays using various scanning schemes.
| Scanning Scheme | Viewing Zone Angle | Screen Size | Frame Rate |
|---|---|---|---|
| Screen scanning | 15.0° | 3.4 in. | 60 Hz |
| Viewing zone scanning | 40.0° | 2.0 in. | 60 Hz |
| Circular scanning | 360.0° | 3.9 in. | 28.4 Hz |
| RGB scanning | 40.0° | 2.0 in. | 60 Hz |
| Multi-channel scanning | 43.0° | 7.4 in. | 60 Hz |
| Pulse-modulated MEMS SLM | 42.0° | 0.69 in. | 59.2 Hz |
Publisher’s Note: MDPI stays neutral with regard to jurisdictional claims in published maps and institutional affiliations. |
© 2022 by the author. Licensee MDPI, Basel, Switzerland. This article is an open access article distributed under the terms and conditions of the Creative Commons Attribution (CC BY) license (https://creativecommons.org/licenses/by/4.0/).
Share and Cite
MDPI and ACS Style
Takaki, Y. Enlargements of Viewing Zone and Screen Size of Holographic Displays Using MEMS SLM Combined with Scanning Systems. Appl. Sci. 2022, 12, 6495. https://0-doi-org.brum.beds.ac.uk/10.3390/app12136495
AMA Style
Takaki Y. Enlargements of Viewing Zone and Screen Size of Holographic Displays Using MEMS SLM Combined with Scanning Systems. Applied Sciences. 2022; 12(13):6495. https://0-doi-org.brum.beds.ac.uk/10.3390/app12136495
Chicago/Turabian StyleTakaki, Yasuhiro. 2022. "Enlargements of Viewing Zone and Screen Size of Holographic Displays Using MEMS SLM Combined with Scanning Systems" Applied Sciences 12, no. 13: 6495. https://0-doi-org.brum.beds.ac.uk/10.3390/app12136495
Note that from the first issue of 2016, this journal uses article numbers instead of page numbers. See further details here.