
A Photoplethysmogram Dataset for Emotional Analysis
by
 , , ,
, , ,
Ye-Ji Jin
1 ,
,
Erkinov Habibilloh
1 ,
,
Ye-Seul Jang
1 ,
,
Taejun An
2,
Donghyun Jo
2,
Saron Park
1 and
Won-Du Chang
1,* 1
Department of Artificial Intelligence Convergence, Pukyong National University, Yongso-ro 45, Nam-gu, Busan 48513, Korea
2
Department of Computer Engineering, Pukyong National University, Yongso-ro 45, Nam-gu, Busan 48513, Korea
*
Author to whom correspondence should be addressed.
Appl. Sci. 2022, 12(13), 6544; https://0-doi-org.brum.beds.ac.uk/10.3390/app12136544
Submission received: 20 May 2022
/
Revised: 16 June 2022
/
Accepted: 24 June 2022
/
Published: 28 June 2022
(This article belongs to the Special Issue Biomedical Signal Processing, Data Mining and Artificial Intelligence)
Abstract
:In recent years, research on emotion classification based on physiological signals has actively attracted scholars’ attention worldwide. Several studies and experiments have been conducted to analyze human emotions based on physiological signals, including the use of electrocardiograms (ECGs), electroencephalograms (EEGs), and photoplethysmograms (PPGs). Although the achievements with ECGs and EEGs are progressive, reaching higher accuracies over 90%, the number of studies utilizing PPGs are limited and their accuracies are relatively lower than other signals. One of the difficulties in studying PPGs for emotional analysis is the lack of open datasets (there is a single dataset to the best of the authors). This study introduces a new PPG dataset for emotional analysis. A total of 72 PPGs were recorded from 18 participants while watching short video clips and analyzed in time and frequency domains. Moreover, emotional classification accuracies with the presented dataset were presented with various neural network structures. The results prove that this dataset can be used for further emotional analysis with PPGs.
1. Introduction
Emotion is a critical factor in human communication. In certain conditions, the same words or sentences can have different meanings according to the emotional state of a person, and individuals often try to please other people and assess their responses in various ways [1]. Likewise, emotions are also considered important factors for human-computer interactions (HCI) [2,3]. Some robots are designed to express emotions with eye movements [4,5], while certain machines are aimed at recognizing people’s emotions using facial images and bio-signals [6,7].
Automatic recognition of emotions using bio-signals can be utilized for health monitoring. It can be used to monitor patients in intensive care units [8,9] and to protect workers in extreme conditions (e.g., firefighters and soldiers) [10,11]. Emotional recognition using electrocardiograms (ECGs) has been studied by many research groups and verified by various databases [12,13,14,15,16,17,18,19,20,21], achieving accuracies higher than 95% when classifying emotions into four classes. Notably, the accuracy of ECGs is high enough for most applications, but it can be uncomfortable and bothersome to attach electric sensors to the chest to measure a clear ECG. Studies have been conducted to recognize emotional status using electroencephalograms (EEGs). Tong et al. presented a method to classify emotional states using linear regression and the AdaBoost algorithm [22]. They achieved a 66.03% accuracy for the binary classification of low and high valence and a 68.68% accuracy for arousal classification. Lin et al. presented a method to recognize emotional states from 30-channel EEG signals using a support vector machine [23]. They extracted spectral power from frequency bands, and classified four emotional states (joy, anger, sadness, and pleasure) with an accuracy of 82.29%. Recently, Gannouni et al. achieved an accuracy of 89.33% in classifying nine emotional states using 32-channel EEGs [7]. Recent advances in emotional recognition using EEGs have been described in a review paper by Suhaimi et al. [24]. The best accuracy in the literature was 98.37% for binary classification of emotions (positive and negative) [25].
Photoplethysmogram (PPG), on the other hand, is a bio-signal that contains information about a person’s emotional status. The biggest advantage of PPG in comparison to other bio-signals is its ease of data acquisition. PPG is performed with an inexpensive and small sensor that is composed of two light emitting diodes (LEDs) and one optical sensor. The price of the sensor is relatively low at less than $30 in online marketplaces, and the signals can be recorded with a common single-board microcontroller, such as Arduino [26]. PPG signals can also be recorded using a smartphone [27]. The relationships between emotional conditions and PPG signal changes have recently been studied by several research groups [8,14]. Choi and Kim reported that the proportion of high frequency (HF), low frequency (LF), and very low frequency (VLF) signals changes according to emotional conditions based on a PPG study of nine participants [28]. The direction of the PPG changes varied according to the participants, and they were not able to identify general principles that explained these findings. The practicability of utilizing PPG to recognize emotional conditions automatically is still vague because sufficient studies have not been conducted. There have been a few studies on emotional recognition using PPG signals. Lee et al. introduced a method of utilizing convolutional neural networks and achieved results of 82.1% and 80.9% for binary recognition of valence and arousal, respectively [29]. Despite its high accuracy, the method partly relies on the division of the training and test datasets.
The most popular dataset for PPG-based emotional recognition is the DEAP dataset [30]. This dataset consists of multiple physiological signals (including EEGs and PPG signals) from 32 participants. To collect the datasets, participants were required to watch 40 short, selected video clips that elicited an emotional response, each lasting for 1 min, during the experiments. The participants were then asked to survey their emotional states in response to each of the videos. The DEAP dataset has been utilized in many emotional analysis studies with various physiological signals. Regardless of its success, the length of the video stimuli can be considered a limitation of these DEAP datasets. In fact, watching a short 1-min video clip is not thought to be enough to evoke an emotional response. Moreover, it has been reported that 3 min is the minimum length of the signal measurement necessary to obtain reliable features in heart variability tests such as the total power, standard deviation of NN intervals, and the identification of low or high frequencies [31].
This study introduces a PPG dataset for emotional analysis and algorithm tests. The dataset was recorded from 18 participants, where the lengths of video clips were shorter than 5 min. The remainder of this paper is organized as follows. Section 2 provides detailed information on the dataset and methods for analysis. Section 3 describes the analyzed results on the datasets and the classification test using deep neural network and discusses related issues to the results. Section 4 presents the conclusion.
2. Materials and Methods
2.1. Dataset Acquisition
Initially, PPG signals were recorded by 18 participants (13 men and 5 women), with ages ranging from 23 to 31. None of them had a history of heart disease, and they did not consume alcoholic products within 12 h before the start of the data recording. During data acquisition, each participant watched short video clips that were expected to stimulate emotional responses. Table 1 provides detailed information on the participants.
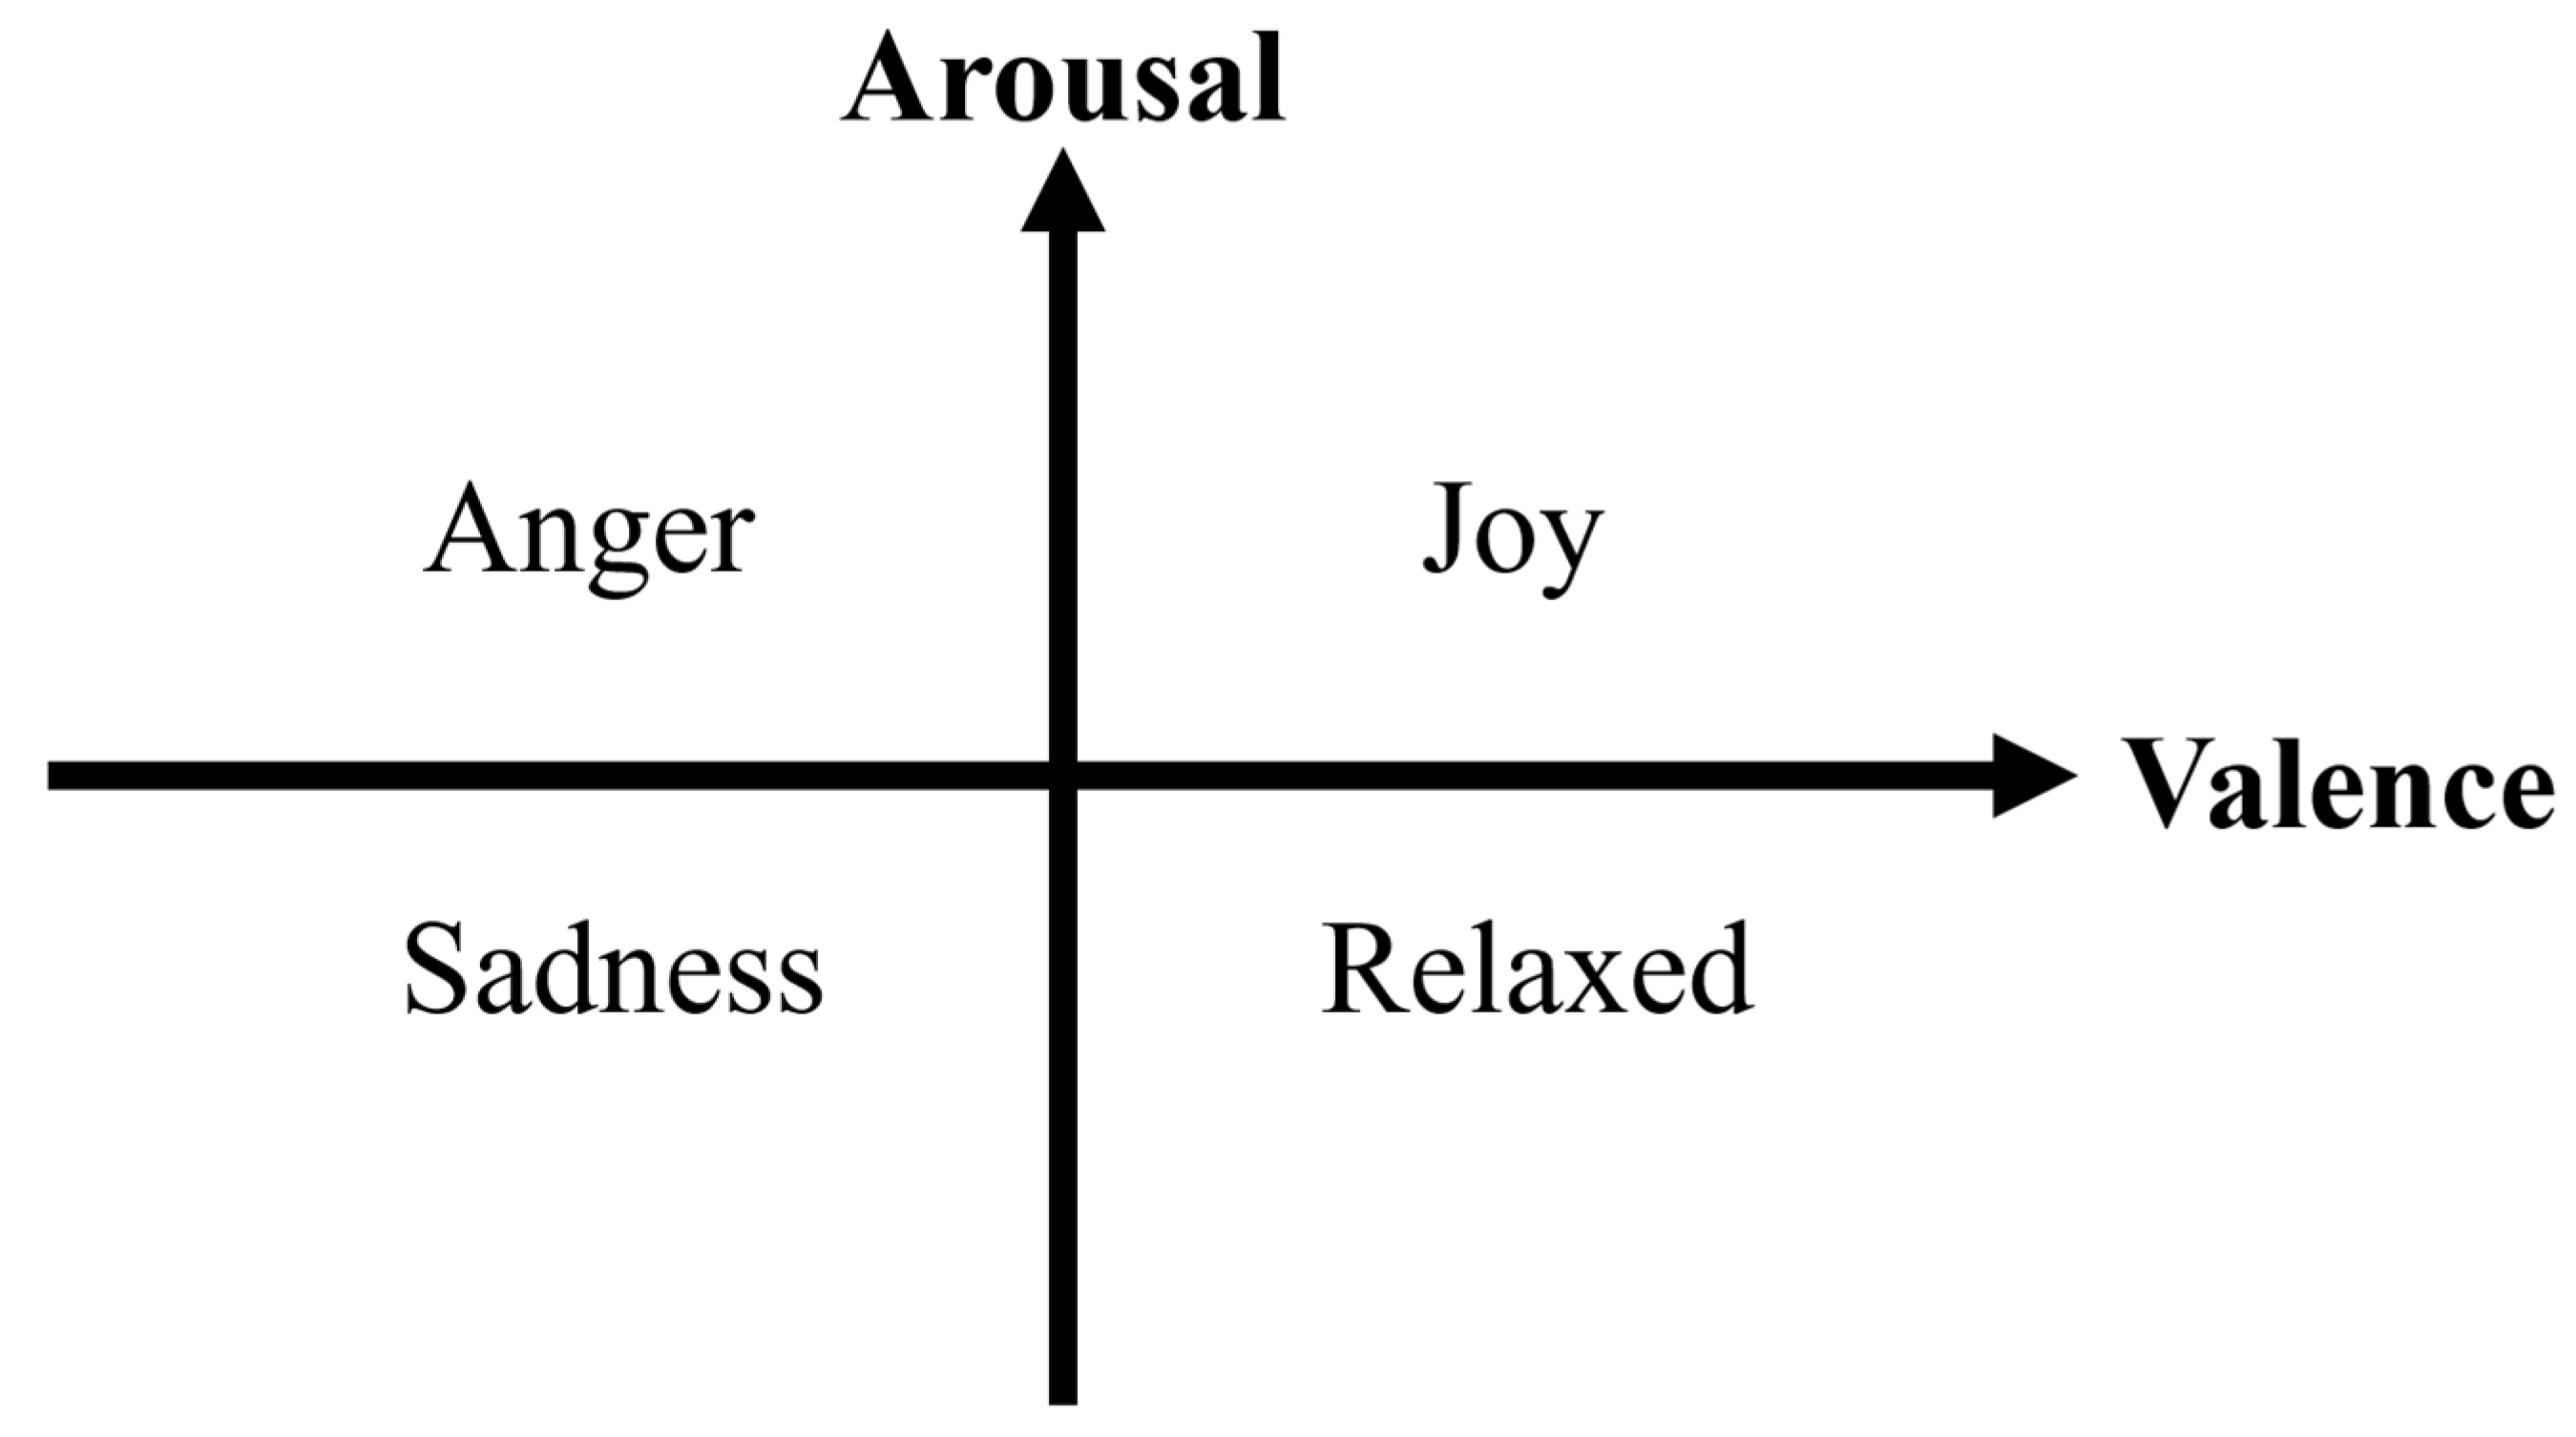
The target emotions of this study were joy, sadness, anger, and relaxed, such that the emotions represent each quadrant of the emotional space of arousal and valence (see Figure 1). This emotional space has been widely utilized in emotional recognition studies [22,28,29,30,32,33].
The data were recorded from a pulse sensor [26] connected to Arduino with the sampling rate set to 100 Hz, while participants watched a video clip. The video clips were played on a monitor while the participants were seated in front of the monitor. The sensor was attached at a fingertip with Velcro tape. Fingers to record signals were different for participants because PPG signals were not measured precisely at certain fingers. A simple python GUI (graphical user interface) software was developed to record signals from Arduino. The software was run on a personal computer which was connected to Arduino via a serial communication. The order of the emotional stimuli was relaxed, joy, sadness, and anger. Rests of 3 min were given to the participants after watching video clips of joy and sadness. The order of the stimuli was fixed in this experiment because it was reported that the order of the stimuli was not significantly related to the ratings of arousal and valence even when little breaks were given between the stimuli [30]. The participants rated subjective degrees of emotional stimuli after watching a video clip.
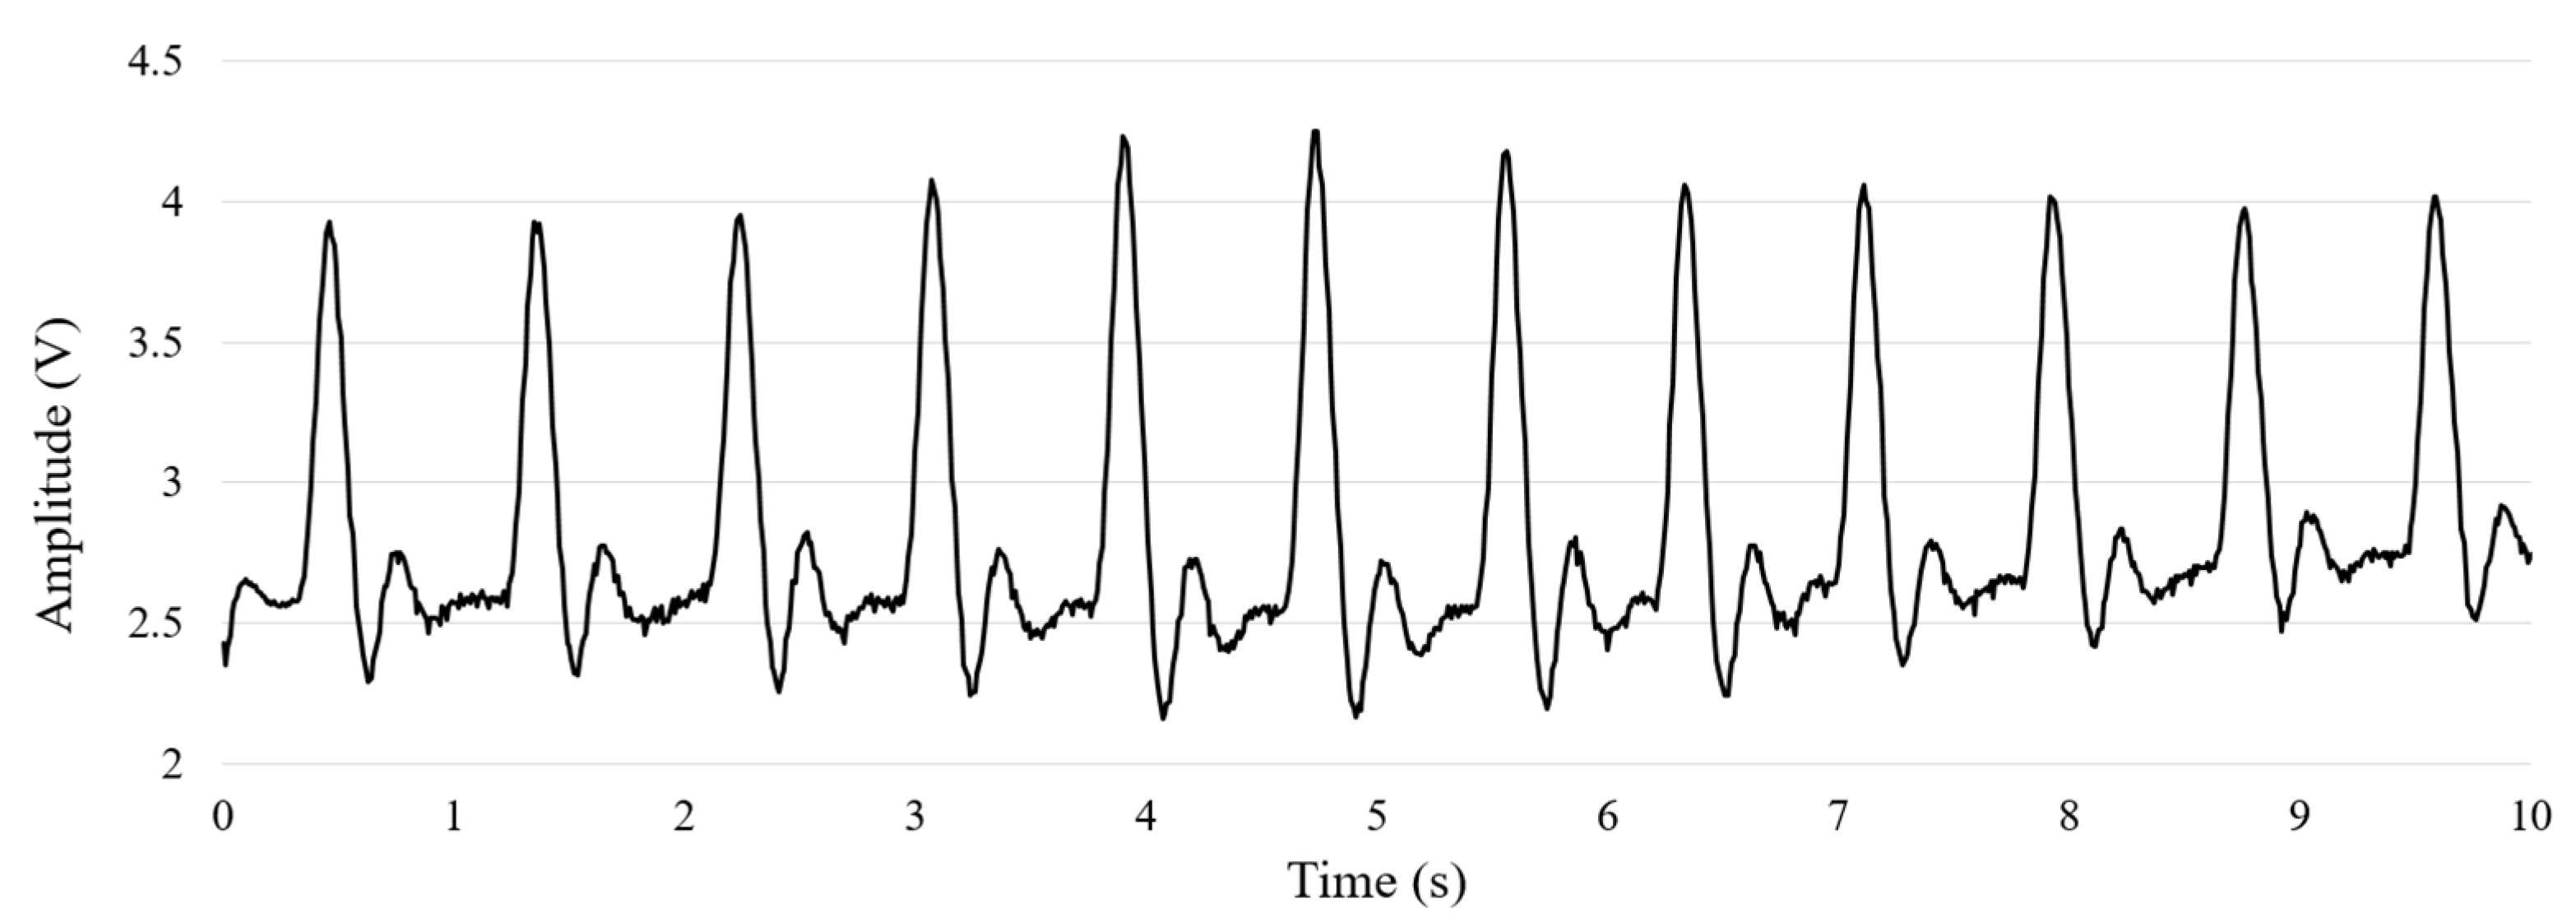
The sampling rate of 100 Hz is relatively lower than the other dataset, but it still covers the most frequency bands of interests. Features have been extracted in 0.67–50 Hz band for ECG in general [12], and recent studies utilized the frequency lower than 0.4 Hz for emotion recognition with PPG [29,33,34]. Figure 2 shows a sample PPG signal of the obtained data.
Two video clips were chosen for each emotional state, as listed in Table 2. Each participant first watched a video, and a second video was played if the participant felt that their emotion was not evoked. This decision was dependent on the participants’ subjective opinions, and the participants did not describe the degree of the emotional stimulus in this case. Rests were provided to the participants between each video clip, and the duration of the resting period was decided by the participants. Monetary rewards were provided to the participants. The verbal language in the video clips was Korean because all participants were native Koreans.
Video clips were selected in YouTube, whose playtime was shorter than 5 min but impressive enough to invoke the emotions of the participants. Most of the video clips were viewed more than one million times. The video clips for joy were selected among a comedy video contest in Korea; sadness video clips were highlights of documentary films on people, whose lives were devoted to their neighbors. The video clips for anger were the news on people who abuse or fraud other people using their power. Orchestra videos were selected for relaxed.
2.2. Frequency and Time Domain Analysis
For emotion recognition, feature extraction is considered a key process [22,28,29]. Because emotional states are not easily observable in a time domain, signals are commonly transformed into frequency domains and analyzed. Following traditional methods [22,29], we calculated the features in three different frequency bands: very-low-frequency (VLF, ≤0.04 Hz), low-frequency (LF, 0.04~0.15 Hz), and high-frequency (HF, 0.15~0.4 Hz). Frequency transforms were conducted using fast Fourier transform (FFT).
Thirteen features (VLFa, LFa, HFa, TOTALa, VLFh, LFh, HFh, VLFp, LFp, HFp, LFn, HFn, and LFHF), proposed in [29], were calculated and analyzed for each emotional state. Table 3 lists the features and their descriptions. The features were derived from the frequency statistics of each band, using the area, peak point, percentage value, and highest power values.
Six time-domain features were calculated based on studies in the literature [22,29,32]. The time-domain features were highly related to the NN intervals of heart rate variability. MeanNN, medianNN, and SDNN denote the mean, median, and standard deviation of the NN intervals of a signal, respectively. NN40 is the sum of NN intervals equal to or larger than 40 ms, and pNN40 denotes the value of NN40 divided by the number of total peaks (i.e., the number of heartbeats). RMSSD is the root mean square of the NN interval of a signal.
2.3. Automatic Classification of Emotions
We examined whether the dataset could be classified using pattern recognition methodologies. To do this, we developed a deep neural network model and classified the signals into two groups: high and low emotional states. The network had one output value, which denoted the level of arousal or valence (0 and 1 denoted low and high, respectively). The four emotions were categorized into two groups for arousal and two for valence (Table 4). Sadness and the relaxed emotion were categorized into the low arousal group, while joy and anger were categorized into the high arousal group. The signals of sadness and anger were categorized into the low valence group, and relaxed and joy into the high valence group. The placement of the emotions in the arousal-valence axis was followed by Russell’s model of affect [35] and conventional studies on emotion recognition [30].
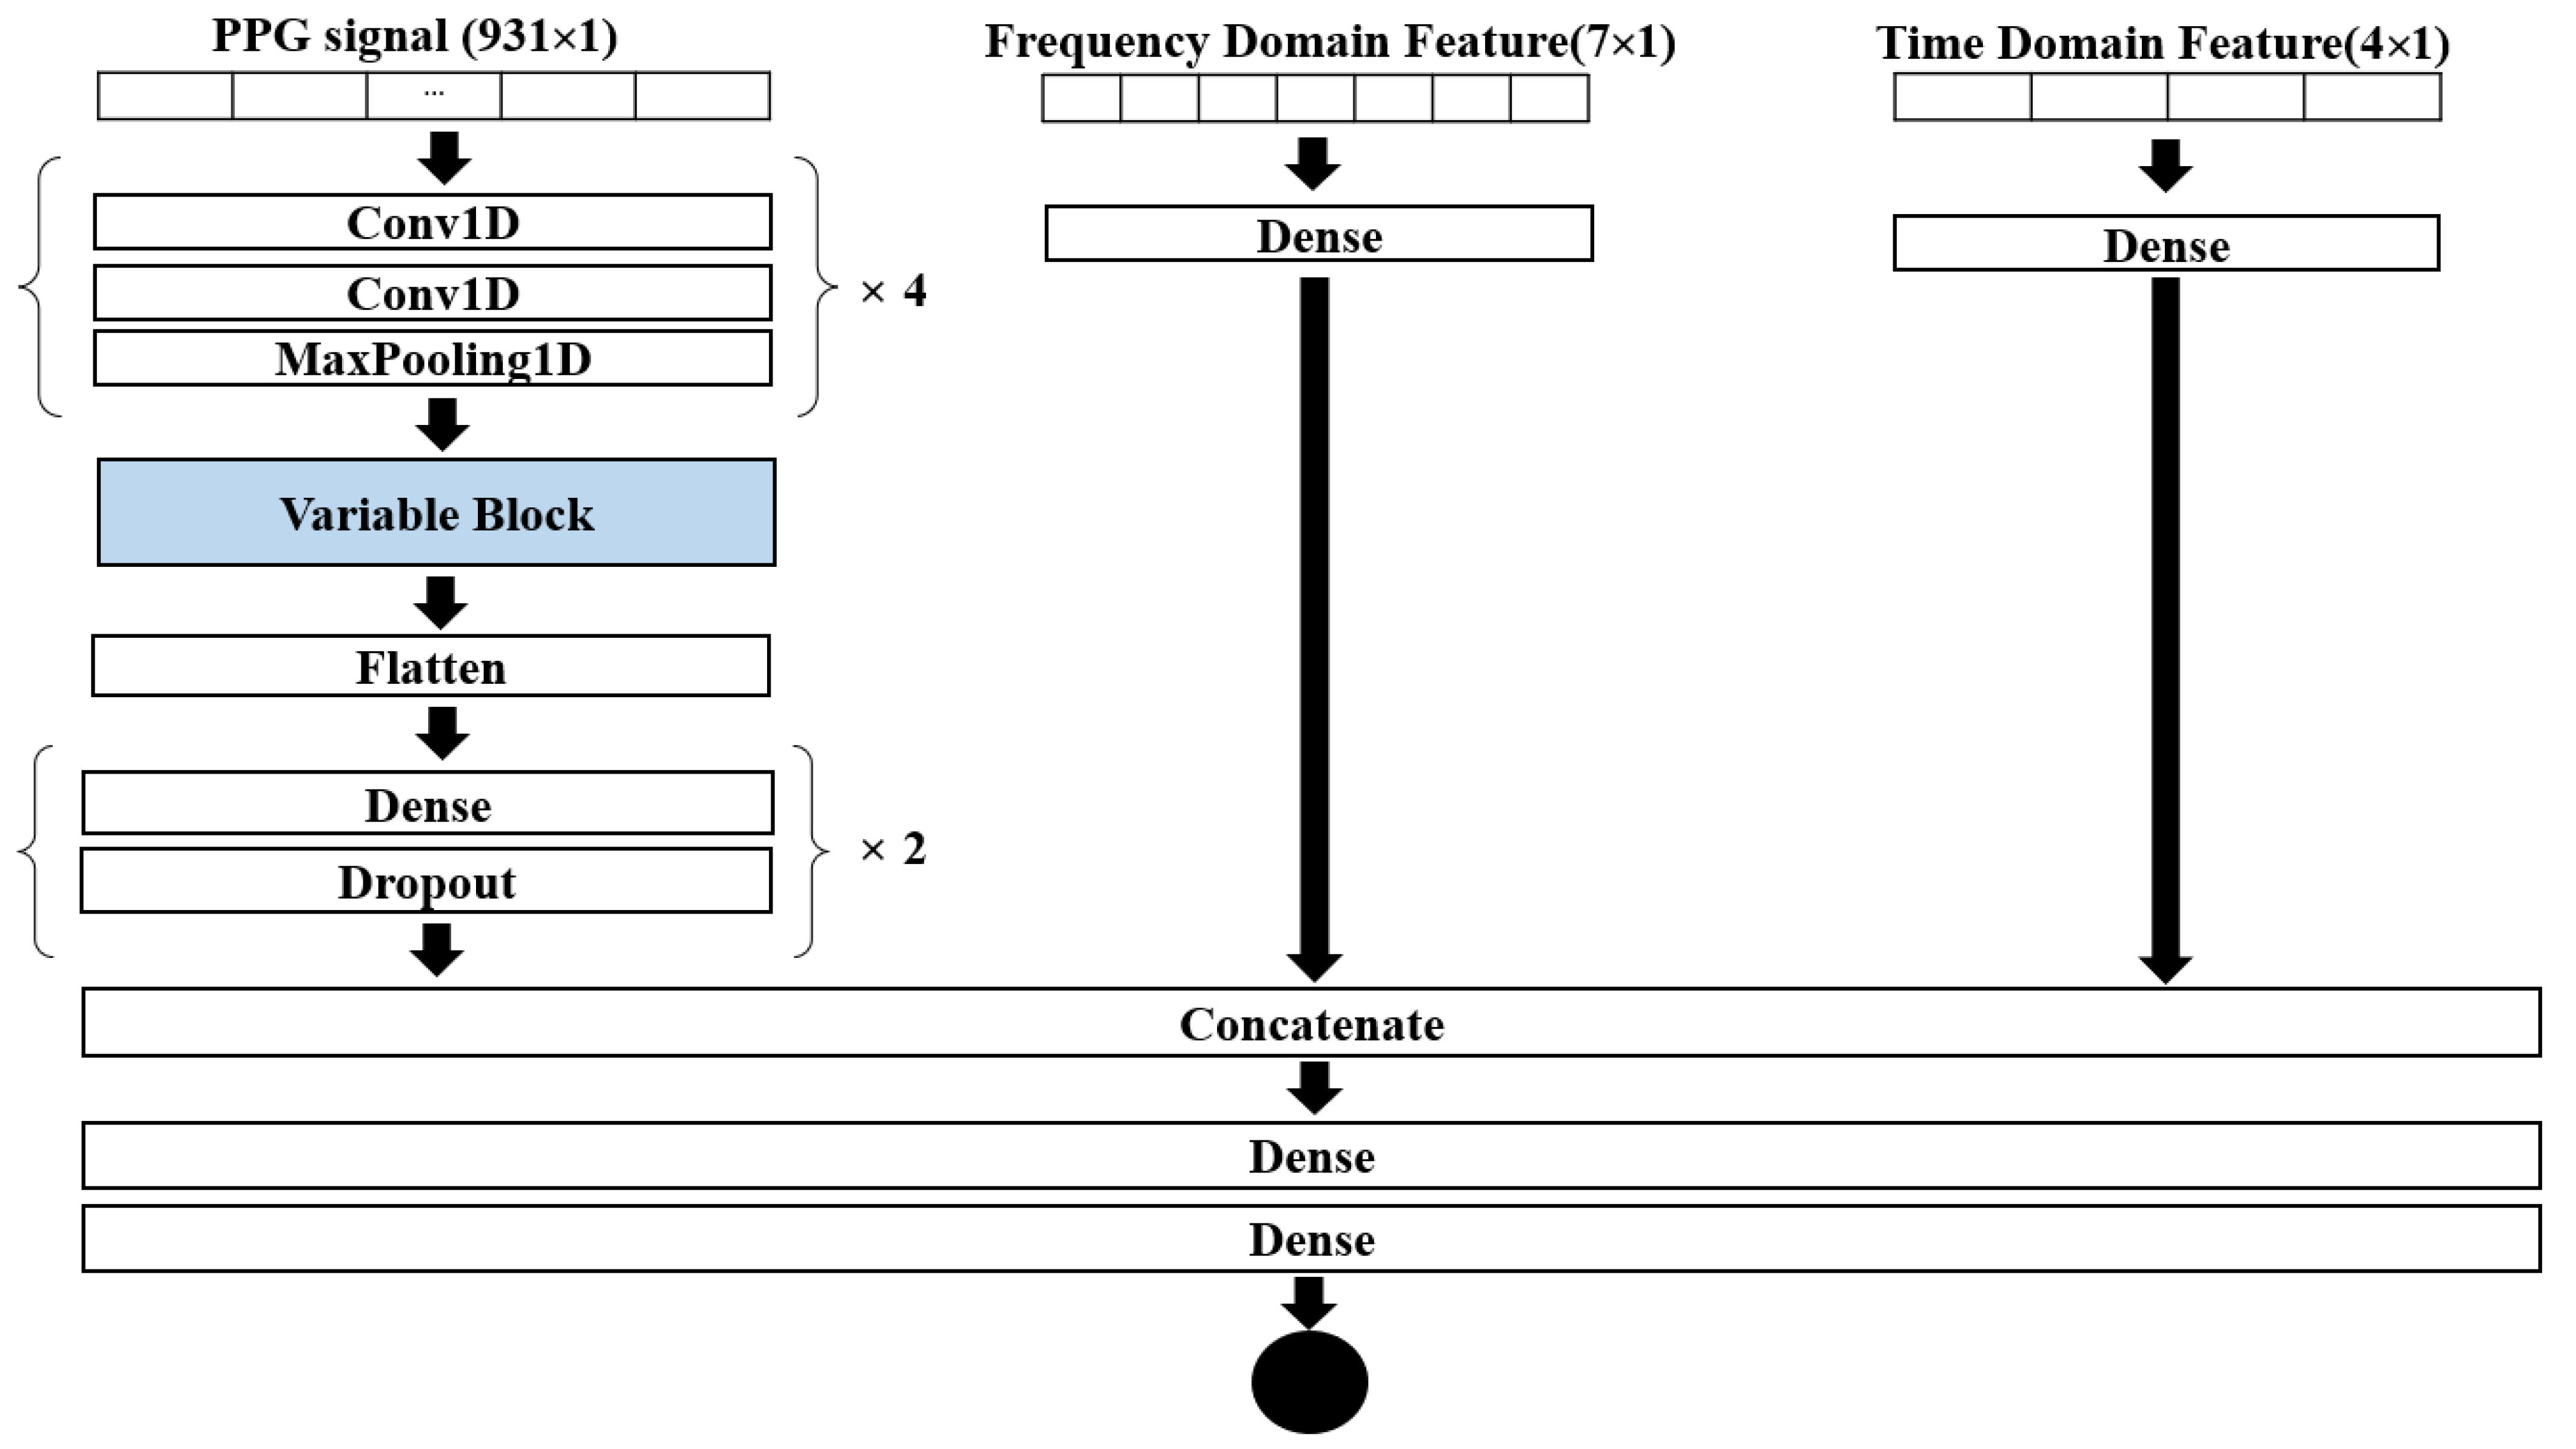
We divided the signal into eight sections and generated a total of 576 short signals. The network had three different inputs: time-series signals, selected frequency domain features, and selected time domain features. The network structure and the feature selection method are described in the next section. The selection method for the third type of inputs followed the study of Lee et al. [29].
2.4. Deep Network Architecture
Figure 3 represents the overall architecture of emotion recognition, where statistical and convolutional neural network (CNN) features were used to classify valence and arousal. The left module extracts features automatically from the time-domain signals. Two network modules (central and right) were placed to emphasize more important features. The central module was to utilize the statistical frequency domain features with a single dense layer of 7 units. Seven features were selected among the thirteen frequency domain features and were used as the input of the central module. The right module consists of a single dense layer with 4 units to utilize statistical time-domain features. Four out of the six time-domain features were selected and were used as the inputs for the right module.
The outputs of the three modules were concatenated and connected to a module of two dense layers. The number of units of the dense layer were set to 32 and 1, respectively. All the activation functions in the network were rectified linear units (ReLUs), except the last layer which should be the sigmoid function to predict the level of the emotional states.
The left module for time-series data starts from convolutional blocks. A convolutional block consists of two one-dimensional convolutional layers connected to a max pooling layer, which is repeated four times to precisely extract features. The filter numbers of the first and second convolutional blocks were set to 32, and the filter numbers of the third and fourth blocks were set to 64. The kernel sizes of the filter masks were all set to 3. The output of the last convolutional block was connected to a variable block which we changed to compare the different network structures. The output of the variable block was connected to two dense layers via a flattened layer. The number of units in the first dense layer was set to 16, and the second to 8. A dropout layer was attached to each dense layer of the time-series module with a dropout ratio of 0.2 to prevent overfitting.
In this study, seventeen different network structures were validated by substituting the variable block. The variable blocks consist of recurrent neural networks (RNNs) such as long short-term memory (LSTM) and gate recurrent unit (GRU). Table 5 lists the sorts of variable blocks. B1 represents a network structure without the variable block, the variable network blocks from B2 to B9 utilize a single memory layer with different number of nodes, and the blocks from B10 to B17 consist of two memory layers with a dropout layer in the middle.
3. Results and Discussion
3.1. Analysis with Heartbeats per Minute
The average and standard deviation of the number of beats per minute (BPM) for each emotion were evaluated. After the initial step of data acquisition, the length of the datasets collected by each participant was in the range of 7449 to 29,441 because the length of the watched videos varied. As the minimum length was 7449, other datasets were cut and equalized to a minimum value.
Table 6 lists that the average and standard deviation of BPM for all the emotions. There were no significant differences in the mean of BPMs, but the BPM of anger was significantly lower than joy (p < 0.05) or relaxed (p < 0.01) for each participant.
3.2. Statistics of Frequency and Time Domain Features
Table 7 lists the statistics of frequency-domain features. There were no significant differences in the mean value of frequency domain features in the analysis of variance (ANOVA) test, because of high variations. The only difference in frequency-domain features between different emotions was found between joy and relaxed. The VLFa of joy was higher than relaxed (p < 0.05) in Wilcoxon’s signed rank test. This means that the VLFa of joy of a person is expected to be higher than the VLFa of relaxed with a high possibility.
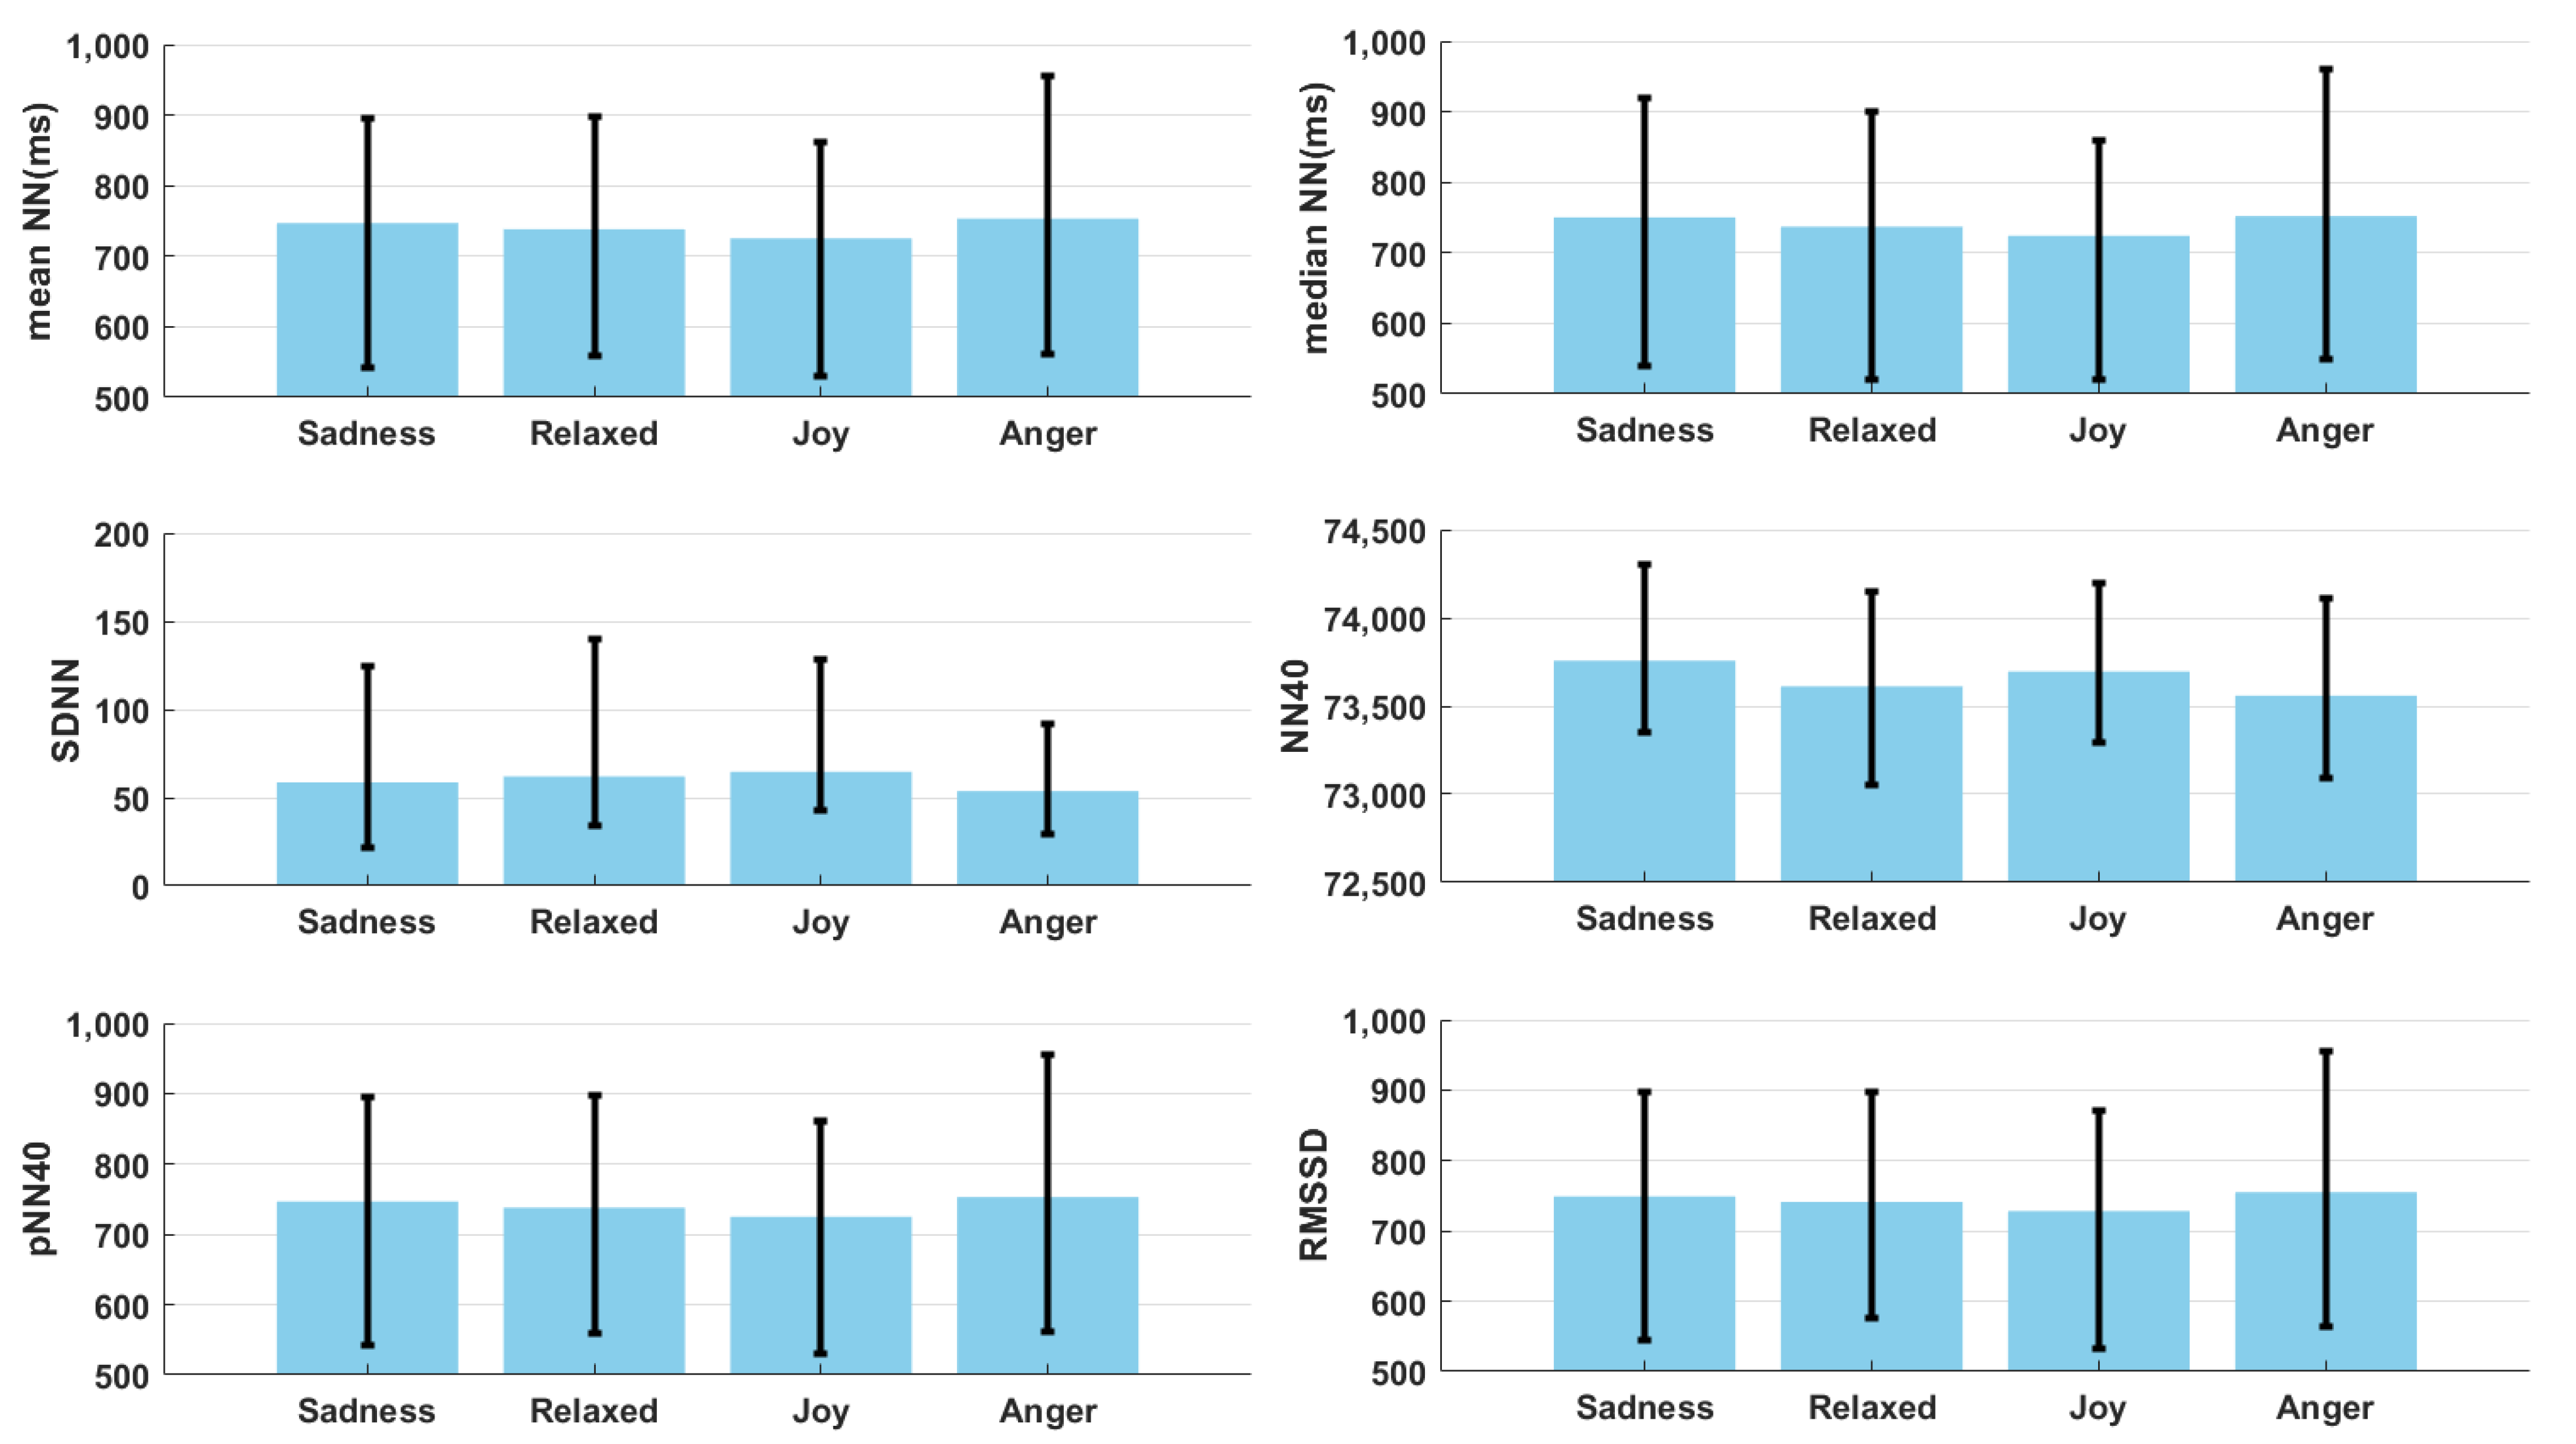
The means and standard deviations of time-domain features among the participants are shown in Figure 4. As shown in the figure, there were no significant differences in the mean value of statistical features in the ANOVA test. However, there were individual differences between anger and other emotions. According to Wilcoxon’s signed rank test, the meanNN and pNN40 of anger were bigger than joy (p < 0.05); the SDNN of anger was smaller than joy (p < 0.05); the RMSSD of anger was bigger than joy and relaxed (p < 0.05); the meanNN and pNN40 of anger was bigger than relaxed (p < 0.01); the medianNN of anger was bigger than relaxed (p < 0.05); and the NN40 of anger was smaller than sadness (p < 0.01).
3.3. Responses of Participants
The participants rated the degree to which the participants felt the target emotions, in the range between 1 and 10 (Table 8). For example, a participant rates 10 if he/she is relaxed fully when watching a video clip for the relaxed states. He/she may rate 10 if he/she is extremely angry when watching a video clip for anger. Table 8 indicates the video stimuli were effective for most of the participants. The average degree of emotion was 7.22 for sadness, 6.61 for relaxation, 7.00 for joy, and 7.61 for anger. The average degree of the overall feeling was 7.11.
The levels of arousal and valence were surveyed after experiments for 13 out of 18 participants to investigate the dimensional emotional states of participants. In general, dimensional responses followed the well-known emotional model (Figure 1). The arousal scores were lower than 6 for sadness and relaxed except two cases, and higher than 5 for joy and anger except five cases. The participants who rated the low-level arousal (5) for joy and anger rated the low degree of the target emotion (4–6). The valence scores were lower than 6 for sadness and anger for all the cases, and higher than 5 for relaxed and joy except five cases. The participants who rated the low-level valence (3–5) for joy and anger rated the low degree of the target emotion (2–5).
3.4. Emotional Classification Results
The data were divided into three groups: training, validation, and testing, at a respective ratio of 7:1:2. We used the Adam optimizer, and the learning rate was set to 0.001. Binary cross-entropy was chosen for the loss function because the output node of the presented network was binary. The network was trained for 200 epochs with a batch size of eight. K-fold validation was used to obtain reliable results, and the number of K-folds is five.
Table 9 and Table 10 list the accuracies of previous studies and the proposed dataset for arousal classification. The classification accuracies with the proposed dataset varied according to the network structure. The best accuracy among the different network structures was 75.16% with an LSTM layer, which was similar to the accuracy in [29]. We found that the accuracy varies according to the selection of the training dataset. The best accuracy among the five trials was 81.9%, while the lowest was 64.35%. The total average accuracy for all the network structures was 66.94%, and any RNN blocks increased the accuracy when they were combined with the base network structure (B1).
Likewise, Table 11 and Table 12 list the accuracies of previous studies and the proposed dataset for valence classification. The average accuracy for all the variable blocks was 72.60% which was higher than the arousal, and the best mean accuracy was 78.12% with GRU, which was 2.96% points higher than the arousal. This was higher than the accuracies in previous studies, which means the valence were invoked well with the video clips in our experiments. The accuracies with GRU layers were higher than with LSTM layers in general in our experiment.
The recognition accuracies of emotional states using PPG solely were relatively lower than the best accuracies of using other signals such as ECG and EEG. Sarkar and Etemad achieved 96.7% and 97.3% accuracies for binary classifications of arousal and valence, respectively [36]; Ferreira et al. reported 98.06% accuracy by utilizing ECG together with EEG [37]. However, there are possibilities for the accuracies with PPG to be increased in further studies. A report presented that the emotion recognition using PPG and ECG showed similar accuracy [14], and studies utilizing PPG solely have not been much studied yet. Although the accuracies were low (71.6% for arousal, 71.7% for valence), PPG together with GSR achieved slightly better accuracy than the combination of ECG and GSR.
The recognition accuracy depends on the network structure as it is known widely. Although this study conducted experiments with different network structures, different network structures may increase the accuracy in further studies. Testing accuracies by using different datasets is necessary to verify the presented network structure and may show inspirations for further studies, but it is not demonstrated because the goal of the current study was to present and evaluate a dataset.
Another issue for the recognition accuracy is that we trained two different models for arousal and valence, because the network learned better with selected features rather than all the features. This could be partly because the size of training data is small, which can be overcome by training together with additional datasets or by employing a few-shots learning mechanism [38].
3.5. Comparison to Conventional PPG Dataset
Table 13 lists datasets for emotional analysis which include PPG signals. The most popular way to invoke participants’ emotions has been utilizing video clips, because video clips easily make people immerse in the scenes. DEAP [30], WESAD [13], and CLAS [14] utilized music videos, while CASE [15] utilized movie clips. The main difference between music videos and movie clips as the source of invoking emotions is the importance of the story. Music videos often emphasize music and short but sensational scenes, while the images in the movies are arranged to tell stories in general. However, it is difficult to tell a story in a highlighted movie scene of a few minutes because the original movie lasts more than an hour.
The proposed dataset utilized narrative video clips to invoke participants’ emotions except relaxed, as it was described in Section 2.1. The stories in the video clips were shown as they were created by the original producers because they were shorter than 5 min, and the impact of the short clips was verified by the number of viewers. The influence of the stories in the video clips would be an interesting topic for further studies using the proposed dataset.
The biggest limitation of the proposed dataset would be the limited number of participants, which makes it difficult to train a big network model and to verify it. This limitation could be overcome when the proposed dataset is utilized together with other datasets. It would be interesting for further studies to apply transfer learning for the proposed dataset after training a network with a big dataset.
4. Conclusions
Emotions play a vital role in human communication, and the need for the function of automatically recognizing emotions using bio-signals is crucial in today’s society; such functions can be used in various situations and for different purposes. With the help of technological advancements in recent years, automatic algorithms are capable of recognizing emotions from various bio-signals, especially via EEGs and ECGs. Recently, there has been interest in utilizing PPG for emotional status recognition, but the number of studies and datasets using PPG is limited in comparison to those utilizing the other signals.
The main contribution of this study was the introduction of a new public dataset of PPG for emotional recognition. The dataset, collected from 18 participants, was proven to reflect the emotional states of the participants. This study aimed to introduce a dataset of PPG signals for emotional status analysis and recognition. The signals of the dataset were recorded from 18 participants, while each participant watched several preselected 3- to 4-min-long videos. The video clips were carefully selected to invoke emotions in the participants. Four types of videos were utilized in the experiment to respectively invoke sadness, relaxed, joy, and anger. The proposed data were analyzed in the time and frequency domains and the automatic classifications of the emotions were conducted with various artificial neural network structures.
In the results, we found significant differences between different emotions in BPMs, and frequency and time-domain features. The BPM of anger was lower than joy and relaxed. The differences in frequency and time-domain features were observed personally. The VLFa of joy of a person was higher than relaxed; differences were found between anger and other emotions in meanNN, pNN40, SDNN, RMSSD, and meanNN. Moreover, we presented classification results with different network structures, achieving the best mean accuracy of 75.16% for arousal and 78.12% for valence.
The main limitation of this study is the limited size of the dataset, as it contains 72 signals from 18 participants only. However, the proposed dataset will be useful for emotional analysis using PPG because it is one of a few PPG datasets and it is differentiated by the sorts of video stimuli. It could be utilized widely to evaluate algorithm performance, especially to test few-shots learnings.
Author Contributions
Conceptualization, W.-D.C. and S.P.; Methodology, Y.-J.J.; Validation, Y.-J.J.; Investigation, Y.-J.J.; Data curation, Y.-S.J., T.A. and D.J.; Writing—original draft preparation, E.H. and Y.-J.J.; Writing—review and editing, E.H. and W.-D.C.; Supervision, W.-D.C.; Project administration, W.-D.C. All authors have read and agreed to the published version of the manuscript.
Funding
This research received no external funding, and the APC was funded by brain Korea 21 program.
Institutional Review Board Statement
The study protocol was approved by the Institutional Review Board (IRB) of Pukyong National University.
Informed Consent Statement
Not applicable.
Data Availability Statement
Data is available at following address: https://github.com/PKNU-PR-ML-Lab/PPG-Dataset.
Conflicts of Interest
The authors declare no conflict of interest.
References
- Hwang, D.H.; Hwang, Y.H.; Yoon, H.H. The Effects of Verbal and Nonverbal Communication of Service Providers on the Customers’ Emotional Responses and Customer Satisfaction: Moderating Effects of Restaurant Type. Culin. Sci. Hosp. Res. 2018, 24, 73–84. [Google Scholar]
- Peter, C.; Urban, B. Emotion in Human-Computer Interaction. In Expanding the Frontiers of Visual Analytics and Visualization; Earnshaw, J.D.R., Kasik, D., Vince, J., Wong, P., Eds.; Springer: London, UK, 2012; pp. 239–262. [Google Scholar]
- Beale, R.; Peter, C. The Role of Affect and Emotion in HCI. In Affect and Emotion in Human-Computer Interaction; Beale, R., Peter, C., Eds.; Springer: Berlin/Heidelberg, Germany, 2008; Volume 4868, pp. 1–11. [Google Scholar]
- Park, D.S.; Pan, Y.H. A Study on Human-Robot’s Emotional Communication through the Movement of the Eye of a Social Robot. Korean Des. Forum 2019, 24, 129–138. [Google Scholar]
- Takanishi, A.; Sato, K.; Segawa, K.; Takanobu, H.; Miwa, H. An Anthropomorphic Head-Eye Robot Expressing Emotions. In Proceedings of the 2000 IEEE International Conference on Robotics and Automation, San Francisco, CA, USA, 24–28 April 2000; pp. 2243–2249. [Google Scholar]
- Kulkarni, S.S.; Reddy, N.P.; Hariharan, S. Facial Expression (Mood) Recognition from Facial Images Using Committee Neural Networks. Biomed. Eng. OnLine 2009, 8, 16. [Google Scholar] [CrossRef] [PubMed] [Green Version]
- Gannouni, S.; Aledaily, A.; Belwafi, K.; Aboalsamh, H. Emotion Detection Using Electroencephalography Signals and a Zero-time Windowing-based Epoch Estimation and Relevant Electrode Identification. Sci. Rep. 2021, 11, 7071. [Google Scholar] [CrossRef] [PubMed]
- Park, I.J.; Lee, H.W.; Cha, S.M.; Seo, R.J.; Kim, J.G. An Implementation of Data Monitoring and Wireless Emergency Alarm System Which Utilize the ECG Sensors. In Proceedings of the Symposium of the Korean Institute of communications and Information Sciences, Pyeong Chang, Korea, 1–3 July 2015; Volume 11. [Google Scholar]
- Davoudi, A.; Malhotra, K.R.; Shickel, B.; Siegel, S.; Williams, S.; Ruppert, M.; Bihorac, E.; Ozrazgat-Baslanti, T.; Tighe, P.J.; Bihorac, A.; et al. Intelligent ICU for Autonomous Patient Monitoring Using Pervasive Sensing and Deep Learning. Sci. Rep. 2019, 9, 8020. [Google Scholar] [CrossRef] [PubMed] [Green Version]
- Lin, S.-H.; Lai, C.-I.; Boorady, L. ECG Monitoring via Apparel for Female Firefighter’s Safety. In Proceedings of the International Textile and Apparel Association Annual Conference, London, UK, 30 July–1 August 2019; pp. 1–3. [Google Scholar]
- Shi, H.; Zhao, H.; Liu, Y.; Gao, W.; Dou, S.C. Systematic Analysis of a Military Wearable Device Based on a Multi-Level Fusion Framework: Research Directions. Sensors 2019, 19, 2651. [Google Scholar] [CrossRef] [Green Version]
- Hasnul, M.A.; Aziz, N.A.A.; Alelyani, S.; Mohana, M.; Aziz, A.A. Electrocardiogram-Based Emotion Recognition Systems and Their Applications in Healthcare—A Review. Sensors 2021, 21, 5015. [Google Scholar] [CrossRef]
- Schmidt, P.; Reiss, A.; Duerichen, R.; van Laerhoven, K. Introducing WeSAD, a Multimodal Dataset for Wearable Stress and Affect Detection. In Proceedings of the ICMI 2018—International Conference on Multimodal Interaction, Boulder, CO, USA, 16–20 October 2018; pp. 400–408. [Google Scholar] [CrossRef]
- Markova, V.; Ganchev, T.; Kalinkov, K. CLAS: A Database for Cognitive Load, Affect and Stress Recognition. In Proceedings of the International Conference on Biomedical Innovations and Applications, BIA 2019, Varna, Bulgaria, 8–9 November 2019; pp. 19–22. [Google Scholar] [CrossRef]
- Sharma, K.; Castellini, C.; van den Broek, E.L.; Albu-Schaeffer, A.; Schwenker, F. A Dataset of Continuous Affect Annotations and Physiological Signals for Emotion Analysis. Sci. Data 2019, 6, 196. [Google Scholar] [CrossRef] [Green Version]
- Park, C.Y.; Cha, N.; Kang, S.; Kim, A.; Khandoker, A.H.; Hadjileontiadis, L.; Oh, A.; Jeong, Y.; Lee, U. K-EmoCon, a Multimodal Sensor Dataset for Continuous Emotion Recognition in Naturalistic Conversations. Sci. Data 2020, 7, 293. [Google Scholar] [CrossRef]
- Miranda-Correa, J.A.; Abadi, M.K.; Sebe, N.; Patras, I. AMIGOS: A Dataset for Affect, Personality and Mood Research on Individuals and Groups. IEEE Trans. Affect. Comput. 2021, 12, 479–493. [Google Scholar] [CrossRef] [Green Version]
- Subramanian, R.; Wache, J.; Abadi, M.K.; Vieriu, R.L.; Winkler, S.; Sebe, N. Ascertain: Emotion and Personality Recognition Using Commercial Sensors. IEEE Trans. Affect. Comput. 2018, 9, 147–160. [Google Scholar] [CrossRef]
- Abadi, M.K.; Subramanian, R.; Kia, S.M.; Avesani, P.; Patras, I.; Sebe, N. DECAF: MEG-Based Multimodal Database for Decoding Affective Physiological Responses. IEEE Trans. Affect. Comput. 2015, 6, 209–222. [Google Scholar] [CrossRef]
- Katsigiannis, S.; Ramzan, N. DREAMER: A Database for Emotion Recognition Through EEG and ECG Signals from Wireless Low-Cost Off-the-Shelf Devices. IEEE J. Biomed. Health Inform. 2018, 22, 98–107. [Google Scholar] [CrossRef] [PubMed] [Green Version]
- Healey, J.A.; Picard, R.W. Detecting Stress during Real-World Driving Tasks Using Physiological Sensors. IEEE Trans. Intell. Transp. Syst. 2005, 6, 156–166. [Google Scholar] [CrossRef] [Green Version]
- Tong, Z.; Chen, X.; He, Z.; Tong, K.; Fang, Z.; Wang, X. Emotion Recognition Based on Photoplethysmogram and Electroencephalogram. In Proceedings of the 2018 IEEE 42nd Annual Computer Software and Applications Conference, Tokyo, Japan, 23–27 July 2018; pp. 402–407. [Google Scholar]
- Lin, Y.-P.; Wang, C.-H.; Jung, T.-P.; Wu, T.-L.; Jeng, S.-K.; Duann, J.-R.; Chen, J.-H. EEG-Based Emotion Recognition in Music Listening. IEEE Trans. Biomed. Eng. 2010, 57, 1798–1806. [Google Scholar]
- Suhaimi, N.S.; Mountstephens, J.; Teo, J. EEG-Based Emotion Recognition: A State-of-the-Art Review of Current Trends and Opportunities. Comput. Intell. Neurosci. 2020, 2020, 8875426. [Google Scholar] [CrossRef]
- Kimmatkar, N.V.; Babu, V.B. Human Emotion Classification from Brain EEG Signal Using Multimodal Approach of Classifier. In Proceedings of the 2018 International Conference on Intelligent Information Technology, Hanoi, Vietnam, 26–28 February 2018; pp. 9–13. [Google Scholar] [CrossRef]
- Available online: Https://Pulsesensor.Com/Products/Pulse-Sensor-Amped (accessed on 30 March 2021).
- Park, J.; Li, C.; Kwon, H. Heart Rate Detection of Photoplethysmography Using a Smartphone Camera. In Proceedings of the Symposium of the Korean Institute of communications and Information Sciences, Seoul, Korea, 12–15 December 2013; pp. 617–618. [Google Scholar]
- Choi, J.-Y.; Kim, H.-S. Study on Heart Rate Variability and PSD Analysis of PPG Data for Emotion Recognition. J. Digit. Contents Soc. 2018, 19, 103–112. [Google Scholar]
- Lee, M.S.; Lee, Y.K.; Lim, M.T.; Kang, T.K. Emotion Recognition Using Convolutional Neural Network with Selected Statistical Photoplethysmogram Features. Appl. Sci. 2020, 10, 3501. [Google Scholar] [CrossRef]
- Koelstra, S.; Muehl, C.; Soleymani, M.; Lee, J.-S.; Yazdani, A.; Ebrahimi, T.; Pun, T.; Nijholt, A.; Patras, I. DEAP: A Database for Emotion Analysis Using Physiological Signals. IEEE Trans. Affect. Comput. 2012, 3, 18–31. [Google Scholar] [CrossRef] [Green Version]
- Choi, W.-J.; Lee, B.-C.; Jeong, K.-S.; Lee, Y.-J. Minimum Measurement Time Affecting the Reliability of the Heart Rate Variability Analysis. Korean J. Health Promot. 2017, 17, 269. [Google Scholar] [CrossRef] [Green Version]
- Park, S.; Chang, W.-D. Recognition of Emotional States Using Single Channel PPG Signals. In Proceedings of the 36th International Technical Conference on Circuits/Systems, Computers and Communications, Jeju, Korea, 28–30 June 2021; pp. 1–3. [Google Scholar]
- Lee, M.S.; Cho, Y.R.; Lee, Y.K.; Pae, D.S.; Lim, M.T.; Kang, T.K. PPG and EMG Based Emotion Recognition Using Convolutional Neural Network. In Proceedings of the 16th International Conference on Informatics in Control, Automation and Robotics, Prague, Czech Republic, 29–31 July 2019; pp. 595–600. [Google Scholar]
- Lee, M.S.; Lee, Y.K.; Pae, D.S.; Lim, M.T.; Kim, D.W.; Kang, T.K. Fast Emotion Recognition Based on Single Pulse PPG Signal with Convolutional Neural Network. Appl. Sci. 2019, 9, 3355. [Google Scholar] [CrossRef] [Green Version]
- Russell, J.A. A Circumplex Model of Affect. J. Personal. Soc. Psychol. 1980, 39, 1161–1178. [Google Scholar] [CrossRef]
- Sarkar, P.; Etemad, A. Self-Supervised ECG Representation Learning for Emotion Recognition. IEEE Trans. Affect. Comput. 2020, 1–13. [Google Scholar] [CrossRef]
- Shin, D.; Shin, D.; Shin, D. Development of Emotion Recognition Interface Using Complex EEG/ECG Bio-Signal for Interactive Contents. Multimed. Tools Appl. 2017, 76, 11449–11470. [Google Scholar] [CrossRef]
- Kim, J.; Kim, T.; Kim, S.; Yoo, C.D. Edge-Labeling Graph Neural Network for Few-Shot Learning. In Proceedings of the 2019 IEEE/CVF Conference on Computer Vision and Pattern Recognition, Long Beach, CA, USA, 16–20 June 2019. [Google Scholar]
Figure 1.
Arousal and valence model.

Figure 2.
Sample of original PPG signal obtained from a pulse sensor.

Figure 3.
The overall architecture of the proposed deep learning model.

Figure 4.
Statistics of time domain features.


Table 1.
Participant information.
| Participant # | Sex | Age (Years) |
|---|---|---|
| 1 | Male | 26 |
| 2 | Female | 30 |
| 3 | Male | 26 |
| 4 | Male | 26 |
| 5 | Male | 25 |
| 6 | Male | 25 |
| 7 | Male | 23 |
| 8 | Female | 23 |
| 9 | Male | 23 |
| 10 | Male | 28 |
| 11 | Female | 20 |
| 12 | Male | 26 |
| 13 | Female | 24 |
| 14 | Female | 27 |
| 15 | Male | 25 |
| 16 | Male | 31 |
| 17 | Male | 23 |
| 18 | Male | 23 |
Table 2.
Video stimuli information (video links were accessed 7 April 2022 last).
| Emotion | Title and Web-Address | Genre | View |
|---|---|---|---|
| Joy | Driving lessons from a gangster https://youtu.be/wK4K9icjEO4 | Comedy | 14 M |
| The tenth of every month https://youtu.be/6gSSI1Ldfqk | Comedy | 4 M | |
| Sadness | Families sharing the saddest last moments together https://youtu.be/5zD-slYVWgI | Documentary | 1.2 M |
| Dad couldn’t keep his promise to meet his son the next day https://youtu.be/DWXO8kPKp2g | Documentary | 157 K | |
| Anger | Nursery school teacher assaults 4-year-old child https://youtu.be/xw6mOLW8Gnc | News | 1.6 M |
| The landlord who took a mortgage on the day of the tenant moving in. https://youtu.be/_oCC5omof04 | News | 6.6 M | |
| Relaxed | Chopin Nocturne Op. 9 No. 2 https://youtu.be/9E6b3swbnWg | Orchestra | 607 K |
| Bach—Air on The G String https://youtu.be/noYRi8bi0aY | Orchestra | 7.1 M | |
| Short Meditation Music —3 Minute Relaxation, Calming https://www.youtube.com/watch?v=cI4ryatVkKw | Meditation Music with Images | 2.4 M |
Table 3.
Frequency domain features.
| Name | Feature |
|---|---|
| total_power | Total power |
| [Freq.Name] a * | Integrated area of power in frequency band |
| [Freq.Name] h * | Highest power in frequency band |
| [Freq.Name] p * | [Freq.Name] h/total_power |
| LFn * | LFa/(LFa + HFa) |
| HFn * | HFa/(LFa + HFa) |
| LFHF | LFa/HFa |
* suffixes denote sorts of features. a, h, p, and n denote the integrated area of power, the highest power, ratio of the highest power to the total power, and the normalized area by the area of specific bands, respectively.
Table 4.
Arousal and valence by emotion.
| Arousal | Valence | |
|---|---|---|
| Sadness | 0 | 0 |
| Relaxed | 0 | 1 |
| Joy | 1 | 1 |
| Anger | 1 | 0 |
Table 5.
Tested method and Description.
| Variable Block | Description * |
|---|---|
| B1 | None |
| B2 | LSTM (32) |
| B3 | LSTM (64) |
| B4 | Bi-LSTM (32) |
| B5 | Bi-LSTM (64) |
| B6 | GRU (32) |
| B7 | GRU (64) |
| B8 | Bi-GRU (32) |
| B9 | Bi-GRU (64) |
| B10 | LSTM (32), Dropout (0.2), LSTM (16) |
| B11 | LSTM (64), Dropout (0.2), LSTM (32) |
| B12 | Bi-LSTM (32), Dropout (0.2), Bi-LSTM (16) |
| B13 | Bi-LSTM (64), Dropout (0.2), Bi-LSTM (32) |
| B14 | GRU (32), Dropout (0.2), GRU (16) |
| B15 | GRU (64), Dropout (0.2), GRU (32) |
| B16 | Bi-GRU (32), Dropout (0.2), Bi-GRU (16) |
| B17 | Bi-GRU (64), Dropout (0.2), Bi-GRU (32) |
* The numbers in parentheses indicate numbers of nodes (for LSTM or GRU) or dropout ratio (for Dropout).
Table 6.
Average and standard deviation of BPM.
| Sadness | Relaxed | Joy | Anger |
|---|---|---|---|
| 80.65 ± 10.39 | 81.41 ± 10.17 | 82.89 ± 10.20 | 79.75 ± 10.04 |
Table 7.
Statistics of frequency domain feature values.
| Features | Mean ± Standard Deviation | |||
|---|---|---|---|---|
| Sadness | Relaxed | Joy | Anger | |
| VLFa | 1385.86 ± 780.99 | 1186.71 ± 513.08 | 1395.76 ± 679.54 | 1323.02 ± 715.64 |
| LFa | 2385.51 ± 969.51 | 2371.84 ± 991.23 | 2432.99 ± 957.81 | 2377.73 ± 838.47 |
| HFa | 729.1 ± 569.73 | 646.23 ± 446.17 | 661.47 ± 492.83 | 620.16 ± 407.63 |
| TOTALa | 4811.42 ± 2381.5 | 4472.3 ± 1986.65 | 4770.6 ± 2154.6 | 4567.09 ± 1968.38 |
| VLFh | 113.49 ± 69.15 | 100.73 ± 51.9 | 101.93 ± 64.02 | 99.44 ± 50.07 |
| LFh | 52.15 ± 19.65 | 56.9 ± 22.75 | 51.76 ± 22.67 | 52.09 ± 18.19 |
| HFh | 5.51 ± 4.24 | 5.35 ± 4.24 | 5.08 ± 4.31 | 4.91 ± 3.28 |
| VLFp | 0.29 ± 0.06 | 0.27 ± 0.04 | 0.3 ± 0.05 | 0.28 ± 0.05 |
| LFp | 0.52 ± 0.07 | 0.54 ± 0.07 | 0.52 ± 0.06 | 0.54 ± 0.07 |
| HFp | 0.13 ± 0.06 | 0.13 ± 0.05 | 0.12 ± 0.05 | 0.12 ± 0.04 |
| LFn | 0.8 ± 0.08 | 0.81 ± 0.08 | 0.81 ± 0.08 | 0.81 ± 0.07 |
| HFn | 0.2 ± 0.08 | 0.19 ± 0.08 | 0.19 ± 0.08 | 0.19 ± 0.07 |
| LFHF | 5.23 ± 3.15 | 5.44 ± 3.88 | 5.27 ± 2.75 | 5.23 ± 2.68 |
Table 8.
Participants’ responses on the degree of emotional stimuli.
| Participant IDs | Sadness | Relaxed | Joy | Anger | ||||||||
|---|---|---|---|---|---|---|---|---|---|---|---|---|
| D * | A ** | V ** | D * | A ** | V ** | D * | A ** | V ** | D * | A ** | V ** | |
| 1 | 6 | - | - | 8 | - | - | 9 | - | - | 8 | - | - |
| 2 | 5 | - | - | 7 | - | - | 9 | - | - | 7 | - | - |
| 3 | 7 | - | - | 10 | - | - | 9 | - | - | 7 | - | - |
| 4 | 8 | - | - | 8 | - | - | 9 | - | - | 10 | - | - |
| 5 | 9 | - | - | 6 | - | - | 8 | - | - | 10 | - | - |
| 6 | 9 | - | - | 8 | - | - | 6 | - | - | 7 | - | - |
| 7 | 5 | 2 | 4 | 6 | 3 | 7 | 4 | 5 | 5 | 5 | 4 | 4 |
| 8 | 10 | 4 | 1 | 8 | 1 | 8 | 5 | 5 | 8 | 8 | 9 | 3 |
| 9 | 3 | 3 | 5 | 7 | 2 | 6 | 9 | 7 | 8 | 6 | 4 | 3 |
| 10 | 6 | 4 | 4 | 5 | 5 | 5 | 6 | 7 | 7 | 6 | 7 | 4 |
| 11 | 9 | 4 | 5 | 6 | 3 | 7 | 8 | 9 | 6 | 8 | 7 | 3 |
| 12 | 10 | 2 | 2 | 7 | 2 | 9 | 9 | 10 | 9 | 8 | 8 | 2 |
| 13 | 10 | 2 | 1 | 4 | 3 | 5 | 6 | 5 | 5 | 10 | 9 | 2 |
| 14 | 4 | 3 | 1 | 4 | 2 | 7 | 5 | 7 | 8 | 4 | 7 | 3 |
| 15 | 8 | 8 | 2 | 10 | 2 | 7 | 5 | 5 | 8 | 9 | 10 | 2 |
| 16 | 8 | 7 | 3 | 4 | 3 | 3 | 7 | 7 | 8 | 6 | 7 | 4 |
| 17 | 6 | 3 | 3 | 4 | 2 | 5 | 6 | 5 | 7 | 10 | 9 | 3 |
| 18 | 7 | 4 | 5 | 7 | 3 | 7 | 6 | 8 | 7 | 8 | 8 | 3 |
| Avg. | 7.22 | 3.83 | 3.00 | 6.61 | 2.58 | 6.33 | 7.00 | 6.67 | 7.17 | 7.61 | 7.42 | 3.00 |
| Std. | 2.13 | 1.90 | 1.60 | 1.91 | 1.00 | 1.61 | 1.75 | 1.72 | 1.27 | 1.79 | 1.88 | 0.74 |
* D denotes the degree of each emotional status (sadness, relaxed, joy, and anger). ** A and V denote arousal and valence, respectively.
Table 9.
Arousal classification accuracies in previous studies.
| Ref. | Year | Database | Signal Source | Method | Accuracy (%) |
|---|---|---|---|---|---|
| [32] | 2021 | DEAP | PPG | CNNs with statistical features | 71.50 |
| [29] | 2020 | DEAP | PPG | CNNs with statistical features | 76.2 |
| [22] | 2021 | DEAP | PPG | Logistic regression | 64.84 |
| [14] | 2019 | CLAS | PPG + GSR * | SVM * | 71.6 |
* GSR denotes galvanic skin response, SVM denotes support vector machine.
Table 10.
Accuracies of different network structure of the proposed dataset for arousal classification. The training and test were repeated five times.
Table 10.
Accuracies of different network structure of the proposed dataset for arousal classification. The training and test were repeated five times.
| Variable Block | Accuracies (%) for Each Iteration | Mean ± Std. | ||||
|---|---|---|---|---|---|---|
| 1 | 2 | 3 | 4 | 5 | ||
| B1 | 66.38 | 58.26 | 75.65 | 63.48 | 61.74 | 65.1 ± 5.89 |
| B2 | 81.9 | 81.74 | 64.35 | 70.43 | 77.39 | 75.16 ± 6.83 |
| B3 | 51.72 | 55.65 | 65.22 | 70.43 | 59.13 | 60.43 ± 6.68 |
| B4 | 62.93 | 60.87 | 65.22 | 70.43 | 47.83 | 61.46 ± 7.52 |
| B5 | 60.34 | 62.61 | 87.83 | 72.17 | 77.39 | 72.07 ± 10.04 |
| B6 | 69.83 | 61.74 | 73.04 | 72.17 | 73.91 | 70.14 ± 4.41 |
| B7 | 75 | 62.61 | 61.74 | 60 | 88.7 | 69.61 ± 10.92 |
| B8 | 62.07 | 74.78 | 75.65 | 53.04 | 52.17 | 63.54 ± 10.15 |
| B9 | 63.79 | 64.35 | 82.61 | 54.78 | 68.7 | 66.85 ± 9.09 |
| B10 | 62.93 | 71.3 | 48.7 | 68.7 | 66.96 | 63.72 ± 7.99 |
| B11 | 64.66 | 73.04 | 59.13 | 65.22 | 64.35 | 65.28 ± 4.46 |
| B12 | 62.07 | 81.74 | 71.3 | 73.04 | 49.57 | 67.54 ± 10.94 |
| B13 | 68.97 | 84.35 | 63.48 | 60.87 | 73.04 | 70.14 ± 8.27 |
| B14 | 71.55 | 60 | 69.57 | 73.04 | 70.43 | 68.92 ± 4.61 |
| B15 | 65.52 | 64.35 | 75.65 | 74.78 | 62.61 | 68.58 ± 5.5 |
| B16 | 52.59 | 69.57 | 51.3 | 73.04 | 66.96 | 62.69 ± 8.99 |
| B17 | 64.66 | 42.61 | 66.09 | 73.91 | 86.09 | 66.67 ± 14.23 |
Table 11.
Valence classification accuracies in previous studies.
| Ref. | Year | Database | Signal Source | Method | Accuracy (%) |
|---|---|---|---|---|---|
| [32] | 2021 | DEAP | PPG | CNNs with statistical features | 72.40 |
| [29] | 2020 | DEAP | PPG | CNNs with statistical features | 75.3 |
| [22] | 2021 | DEAP | PPG | Adaboost | 64.84 |
| [14] | 2019 | CLAS | PPG + GSR | SVM | 71.7 |
Table 12.
Accuracies of different network structure of the proposed dataset for valence classification. The training and test were repeated five times.
Table 12.
Accuracies of different network structure of the proposed dataset for valence classification. The training and test were repeated five times.
| Variable Block | Accuracies (%) for Each Iteration | Mean ± Std. | ||||
|---|---|---|---|---|---|---|
| 1 | 2 | 3 | 4 | 5 | ||
| B1 | 66.38 | 54.78 | 59.13 | 85.22 | 68.7 | 66.84 ± 10.45 |
| B2 | 83.62 | 91.3 | 65.22 | 64.35 | 85.22 | 77.94 ± 11.05 |
| B3 | 72.41 | 73.91 | 74.78 | 88.7 | 70.43 | 76.05 ± 6.5 |
| B4 | 58.62 | 73.91 | 64.35 | 89.57 | 71.3 | 71.55 ± 10.48 |
| B5 | 87.93 | 82.61 | 76.52 | 77.39 | 59.13 | 76.72 ± 9.7 |
| B6 | 84.48 | 69.57 | 80 | 50.43 | 64.35 | 69.77 ± 12.04 |
| B7 | 67.24 | 85.22 | 59.13 | 53.91 | 62.61 | 65.62 ± 10.72 |
| B8 | 85.34 | 57.39 | 68.7 | 60.87 | 85.22 | 71.5 ± 11.83 |
| B9 | 71.55 | 64.35 | 66.09 | 73.91 | 71.3 | 69.44 ± 3.61 |
| B10 | 58.62 | 73.04 | 67.83 | 80.87 | 78.26 | 71.72 ± 7.94 |
| B11 | 56.9 | 84.35 | 78.26 | 71.3 | 80 | 74.16 ± 9.6 |
| B12 | 87.93 | 75.65 | 80.87 | 57.39 | 82.61 | 76.89 ± 10.51 |
| B13 | 69.83 | 79.13 | 79.13 | 71.3 | 53.91 | 70.66 ± 9.22 |
| B14 | 80.17 | 79.13 | 77.39 | 64.35 | 85.22 | 77.25 ± 6.96 |
| B15 | 81.9 | 80 | 73.91 | 87.83 | 66.96 | 78.12 ± 7.13 |
| B16 | 79.31 | 57.39 | 69.57 | 52.17 | 78.26 | 67.34 ± 10.92 |
| B17 | 63.79 | 84.35 | 56.52 | 73.91 | 84.35 | 72.58 ± 11.08 |
Table 13.
Physiological signal dataset with PPG for emotional analysis.
| Ref. | Year | Name | Signal Source | Number of Subjects | Type of Stimuli | Emotions |
|---|---|---|---|---|---|---|
| [30] | 2012 | DEAP | EEG, EMG, EOG, GSR, PPG | 40 | Music video | Arousal, valence, liking, dominance |
| [13] | 2018 | WESAD | ECG, EMG, GSR, PPG, RSP | 15 | Music video, assessment | Neutral, stress, amusement |
| [14] | 2019 | CLAS | ECG, EDA **, PPG, GSR | 62 | Music video, picture | Arousal, valence, liking, dominance, control |
| [15] | 2019 | CASE | ECG, EMG, GSR, PPG, RSP | 30 | Movie clip | Four categories (amusing, boring, relaxing, and scary) |
| [16] | 2020 | K-EmoCon | ACC *, ECG, EDA **, EEG (1 channel), PPG | 32 | Debate | Arousal, valence, and 18 other categories |
| Proposed | 2022 | PPGE * | PPG | 18 | Narrative video | Four categories (joy, sadness, anger, and relaxed) |
* ACC denotes 3-axis acceleration signal; PPGE is a shorten name of the proposed dataset. ** EDA denotes electrodermal activity.
Publisher’s Note: MDPI stays neutral with regard to jurisdictional claims in published maps and institutional affiliations. |
© 2022 by the authors. Licensee MDPI, Basel, Switzerland. This article is an open access article distributed under the terms and conditions of the Creative Commons Attribution (CC BY) license (https://creativecommons.org/licenses/by/4.0/).
Share and Cite
MDPI and ACS Style
Jin, Y.-J.; Habibilloh, E.; Jang, Y.-S.; An, T.; Jo, D.; Park, S.; Chang, W.-D. A Photoplethysmogram Dataset for Emotional Analysis. Appl. Sci. 2022, 12, 6544. https://0-doi-org.brum.beds.ac.uk/10.3390/app12136544
AMA Style
Jin Y-J, Habibilloh E, Jang Y-S, An T, Jo D, Park S, Chang W-D. A Photoplethysmogram Dataset for Emotional Analysis. Applied Sciences. 2022; 12(13):6544. https://0-doi-org.brum.beds.ac.uk/10.3390/app12136544
Chicago/Turabian StyleJin, Ye-Ji, Erkinov Habibilloh, Ye-Seul Jang, Taejun An, Donghyun Jo, Saron Park, and Won-Du Chang. 2022. "A Photoplethysmogram Dataset for Emotional Analysis" Applied Sciences 12, no. 13: 6544. https://0-doi-org.brum.beds.ac.uk/10.3390/app12136544
Note that from the first issue of 2016, this journal uses article numbers instead of page numbers. See further details here.