Article

Improved Electrical Stimulation-Based Exercise Model to Induce Mice Tibialis Anterior Muscle Hypertrophy and Function

by
Paula Ketilly Nascimento Alves
,
João G. Silvestre
,
Wenddy Wyllie Damascena Sougey
,
André Cruz
and
Anselmo Sigari Moriscot
*
Laboratory of Cell and Molecular Biology of the Striated Muscle, Department of Anatomy, Institute of Biomedical Sciences, University of São Paulo, São Paulo 05508-000, Brazil
*
Author to whom correspondence should be addressed.
Submission received: 8 June 2022 / Revised: 20 July 2022 / Accepted: 27 July 2022 / Published: 29 July 2022
(This article belongs to the Special Issue Exercise Science Animal Model)

Abstract

:
Efficient and suitable animal models directed to skeletal muscle hypertrophy are highly needed; nevertheless, the currently available models have limitations, such as restricted hypertrophy outcome and prolonged protocols; thus, additional research is required. In this study, we developed an improved muscle training protocol for mice by directly stimulating the tibialis anterior (TA) muscle motor point using electrical stimulation. C57BL/6 adult male mice were separated into four groups: CTR (control groups for one and two weeks), ES1 (electrical stimulation for one week), and ES2 (electrical stimulation for two weeks). Following muscle training, TA was taken for further examination. The results demonstrated a steady increase in the fiber cross-sectional area as a result of muscle training (ES1, 14.6% and ES2, 28.9%, p < 0.0001). Two weeks of muscle training enhanced muscle mass and maximal tetanic force by 18 (p = 0.0205) and 30%, respectively (p = 0.0260). To assess the tissue remodeling response in this model, we evaluated satellite cell activity and observed an increase in the number of Pax-7-positive nuclei after one and two weeks of muscle training (both >2-fold, p < 0.0001). In addition, we observed an increase in the number of positive nuclei for MyoD after two weeks (2.6-fold, p = 0.0057) without fiber damage. Accordingly, phosphorylation of mTOR and p70 increased following two weeks of muscle training (17%, p = 0.0215 and 66%, p = 0.0364, respectively). The results indicate that this muscle training strategy is appropriate for promoting quick and intense hypertrophy.

1. Introduction

The capacity of skeletal muscle to adapt to metabolic and environmental demands is remarkable. Notably, this tissue is able to increase or decrease its mass, and consequently the size of the contractile apparatus, in response to various stimuli, such as exercise [1], electrical stimulation [2], denervation [3], mechanical load [4], nutritional demands [5], or external factors such as hypoxia [6,7]. Hypertrophy is the increase in skeletal muscle mass and force, which is characterized by increased protein synthesis and storage, resulting in larger muscle fibers [8,9]. Among possible stimuli, resistance exercise is regarded as the most effective means of promoting hypertrophy. Under this sort of stimulation, the hypertrophic response is caused by the accumulation of anabolic bursts from numerous exercise sessions and recuperation rounds [10,11,12].
Resistance exercise training in humans typically consists of recurrent sessions (3–4 times per week) with high repetitions (3 to 10 sets of 1 to 12 repetitions per set) and moderate loading (65–85 percent of one maximum repetition—1RM) with short rest periods (<90 s) [13,14]. Notably, a recovery period (two to three days) is required to restore basal tissue homeostasis [12,13,15]. Throughout the years, various animal models have been created to examine this adaptive muscle response [15].
Compensatory hypertrophy was one of the earliest attempts to simulate resistance exercise (also described as functional overload and synergist ablation) [16,17,18,19], and although this model produces a rapid (about one week) and substantial (30%) increase in the muscle mass, it has significant drawbacks, including an intense inflammatory response and persistent injury due to the extreme stretching imposed on the plantar muscle.
A second animal model is squat training, which debuted in the late nineties and has been widely employed over the past two decades [20]; nonetheless, research employing this model focuses mostly on cardiac muscle hypertrophy [21,22,23]. This approach typically results in a 15–30% rise in mass after 8–12 weeks, with a greater hypertrophic response in the plantar muscle, which is not the focus of human squat exercises [20,24]. In addition, the plantar muscle is rather tiny and profoundly confined in the posterior legs, limiting its utility for tissue, molecular, and functional-based investigation. The squat model has only been documented in rats, restricting its applicability to genetically modified models, which are often based on mice.
Subsequently, a stretch-shortening contraction training strategy was modified to address athletic actions more specifically. In this model, electrical stimulation is utilized to induce concentric activation of the dorsiflexors, followed by the application of an opposing force (eccentric component), resulting in plantar flexion. After four-and-a-half weeks of training utilizing this strategy, around 20% hypertrophy is attained in TA [25,26,27].
Additionally, the usage of ladder-climbing as an alternative resistance exercise model has occurred. In this procedure, rats or mice are placed at the base of a vertical ladder with various loads attached to their tails [28,29,30,31,32,33]. The majority of training protocols are lengthy, lasting 6 to 8 weeks, and muscle mass increase may vary greatly between research (11–23%), which may be related to the fact that animal motivation influences performance.
Finally, a resistance-like exercise protocol based on electrical stimulation was first developed in rats by Wong and Booth (1988) [34,35]; since then, their protocol has undergone several improvements [36], resulting in two major types of electrical stimulation in animal models: one in which the sciatic nerve is electrically stimulated via invasive procedures [2,37] and another in which the muscle is directly stimulated [11,38]. In the first model, electrical stimulation causes eccentric contractions of the tibialis anterior (causing a 7–14% hypertrophic response in 6 weeks); nevertheless, the majority of the lower leg muscles are stimulated simultaneously. In the second model, concentric contraction is performed, and the growth in gastrocnemius muscle mass after four weeks is around 11%. Even though the first model induces a significant hypertrophic response in a major muscle, only the eccentric phase of contraction is induced, which is not a conventional way to design a resistance exercise protocol; furthermore, it has been demonstrated that eccentric contractions can significantly increase tissue injury. This protocol was subsequently adapted and explored [12,39]; nevertheless, important measurements such as skeletal muscle mass, fiber cross-sectional area, or strength were not shown.
Overall, the research presented indicates that there are still limits in resistance-like exercise models, primarily related to either the time interval or the level of hypertrophy obtained. Therefore, we sought to implement enhancements that coupled maximal concentric contractions with a high training volume and brief rest periods. Using this method, we were able to induce around 30 percent hypertrophy of the tibialis anterior muscle in two weeks of muscle training, which is faster and more intensive than what has been described previously.

2. Materials and Methods

2.1. Experimental Groups

Fifty-six male C57BL/6 mice (8–12 weeks, 24.1 ± 2.1 g) were randomly divided into seven groups: ES1 (n = 5 for histology/Western blot and n = 6 for force measurements), ES2 (n = 5 for histology/Western blot and n = 6 for force measurements), and ES4 (n = 4 for histology), with respective controls. Controls were subjected to a non-motor electrical current while ES groups were submitted to electrical stimulation for 1, 2, and 4 weeks. Mice also had TA injected with cardiotoxin (CTX) which were collected at day 4 post-injury (CTX 4D, n = 4). The animals were housed in standard cages (dimensions: 30 × 20 × 13 cm) with controlled temperature and lighting (23 °C, 12:12 h light/dark cycle) and free access to food and water. The following experimental protocols were approved by the ethics committee of the Institute of Biomedical Sciences at the University of São Paulo (n° 1282210519), and the animals were housed at the Institute of Biomedical Sciences Bioterium (University of São Paulo).
The mice were fasted for three hours before to euthanasia to ensure that all animals were in the same nutritional status. The mice were killed by cervical dislocation, and the tibialis anterior muscle (TA) was quickly removed, weighed, and transversally divided into two parts: one half was stored in a −80 °C freezer for additional molecular analysis, and the other half was frozen in hyper-cooled isopentane and then stored at −80 °C for additional histological analysis.

2.2. Design of Electrical Stimulation Protocol

The mice were subsequently prepped for electrical stimulation after receiving an intraperitoneal injection of a ketamine (100 mg/kg) and xylazine (10 mg/kg) cocktail. Each mouse’s left hindlimb was shaved to remove the hair. The body of the mouse was placed in the stimulation apparatus (12.5 cm long and 2 cm high) in a supine posture, and its left ankle was coupled to a locking mechanism such that the hip angle was kept at 180°, the knee angle at 150°, and the ankle angle at 10°. The range of motion was between 10° and 140°, with a movement velocity of 130°/s. External stimulating needle electrodes (Tecnident, COD:13 × 03X0 20C/10—HTM, Amparo, SP, Brazil) were sterilized and percutaneously inserted in the anterolateral part of the tibia so as to stimulate the contraction of the left tibialis anterior muscle at its motor point. To stimulate electric current, we applied a suitable electrical stimulator (Stimulus Esthetic, HTM; #80212480017, Amparo, SP, Brazil). Before undergoing the muscle training treatment, the animals underwent an acclimation phase. Up to half the working voltage (4 V) was provided in escalating electrical current dosages, and five contraction series were utilized. This was repeated twice every week for one week.
To design a protocol as closely as feasible to a real intense resistance exercise procedure, the following configuration was developed: 10 sets of concentric contractions separated by one minute of rest. Each set included 12 contractions (time ON 3 s, time OFF 2 s), and in each contraction the dorsiflexor muscles were gradually engaged for 1000 milliseconds until they reached 8 volts. Subsequently, the muscle remained completely engaged for 2000 milliseconds, followed by a 2000 milliseconds period of rest. The duration of the pulse was 2 milliseconds. The stimulation frequency of 100 Hz was chosen since it has been shown to engage both rapid and slow motor units effectively [35,40]. At the conclusion of the experiment, muscle samples were taken 48 h following the final training session.

2.3. The Cross-Sectional Area of a Fiber (CSA)

Using a cryostat (Leica CM1850 UV, Wetzlar, Germany), samples were transversely sectioned (10-µm-thick), and immunofluorescence detected Dystrophin (Santa Cruz, rabbit anti-Dystrophin #sc-15376, Dallas, TX, USA) and nuclei (through DAPI, 4′,6-diamidino-2-phenylindole). Photomicrographs were obtained by fluorescence microscope Axio Scope.A1 (Carl Zeiss Microscopy GmbH, Göttingen, Germany), and the muscle fibers’ CSA was determined with the ImageJ software (v. 1.45 s, National Institutes of Health, Bethesda, MD, USA) (~700 fibers per animal were analyzed).

2.4. Myonuclei Counting

The number of myonuclei per fiber was obtained by manually counting myonuclei in 20×-magnified AxioVision images. A nucleus was classed as a myonucleus if one of the following conditions was met: (1) it was clearly within the dystrophin border; (2) it was on the dystrophin boundary facing within the fiber; or (3) 50% of the area was within the dystrophin boundary. Fiber number was manually measured after counting myonuclei inside an image to express the number of myonuclei per fiber [41].

2.5. In Vivo Muscle Function Analysis

Skeletal muscle function analysis was conducted as before [42,43]. Tribromoethanol (20 mg/100 g body weight, ip) was used to anesthetize the animals, after which a lateral incision was made to expose the sciatic nerve and an electrode was attached. The TA tendon was attached to a force transducer, which was utilized to assess data on muscle contraction and strength. The muscles were fixed at the ideal length (Lo) before the tests began (defined as the length providing the maximum twitch force). Maximum tetanic force, specific force, and absolute force were recorded using a data acquisition and analysis system (AVS system, Aqda/Ancad software, Sao Carlos, Brazil). To create force frequency curves, the TA was stimulated at Lo every two minutes at increasing frequencies (10 to 150 Hz). In order to determine the maximum tetanic force, a 100 Hz stimulation procedure was utilized to achieve a maximal plateau with minimal frequency. Following testing, the TA’s entire CSA was measured in order to normalize the highest tetanic force for the TA muscle size and calculate the specific tetanic force.

2.6. Immunofluorescence Analysis

Cross-sections of muscle were fixed with formaldehyde (4%) and then washed three times for five minutes with TBS-T (trisbuffered saline, 0.5 M NaCl, 50 mM trisHCl pH 7.4 with 0.3% TRITON X-100). The tissue was then immersed in blocking solution (1% donkey serum in TBS-T) for 1 h at room temperature, followed by overnight incubation at 4 °C with the following primary antibodies (independent slides): rat anti-Laminin (1:200; Thermo Scientific, #MA1-06100, Rockford, IL, USA), rabbit anti-Dystrophin (Santa Cruz, rabbit anti-Dystrophin #sc-15376, Dallas, TX, USA), rabbit anti-Pax-7 (1:50; Abcam, #187339, Cambridge, UK), and rabbit anti-MyoD (1:200; PROTEIN TECH, #18943-1-AP, Rosemont, IL, USA). Next, the sections were washed three times for five minutes in TBS-T before being incubated with the secondary antibody (1:250 Alexa-Fluor 488; Cy3 Donkey Anti-Rabbit and Cy5 Donkey Anti-Rat, Jackson Immuno Research, West Grove, PA, USA) with DAPI (3:1000; BioLegend, #422801, San Diego, CA, USA) in blocking solution for 1 h at room temperature and then washed three times for five minutes in TBS-T. Finally, the slides were mounted using mounting material (20 mM Tris, pH 8.0; 0.5% N-propyl gallate, and 50% glycerol) and coverslips. The fluorescent microscope Axio Scope.A1 (Carl Zeiss Microscopy GmbH, Gottingen, Germany) was used to acquire micrographs, and ImageJ was used to analyze the number of Pax-7 and MyoD nuclear colocalization with DAPI.
To identify myofibers that had sustained sarcolemma damage, we labeled the TA cross-sections with donkey anti-mouse antibody to IgG (heavy and light chains) conjugated to Cy3 (#715-165-150, Jackson Immuno Research, West Grove, PA, USA). IgG and other large serum molecules are excluded from myofibers with intact sarcolemma membranes but enter the myoplasm of myofibers with sarcolemma injury [44].

2.7. Western-Blot

The powdered muscle tissue was homogenized in RIPA buffer (5 M NaCl; 0.50 M EDTA ph 8.0; 1 M Tris ph 8.0; 1% NP-40, 10% SDS, and 1× Halt protease and phosphatase inhibitor cocktail—Thermo Scientific cat#78445, Rockford, IL, USA). After 30 min of incubation on ice, the homogenates were centrifuged (10,000 rpm at 4 °C for 10 min) and the supernatant was collected. Using the Bradford method and bovine serum albumin (BSA) as the standard, the protein concentration was measured.
Total protein (30–40 µg) was loaded onto 12% sodium dodecyl sulfate-polyacrylamide gel electrophoresis (SDS-PAGE) and separated electrophoretically. To ensure uniform loading and the quality of protein extracts, proteins were transferred to a polyvinylidene difluoride (PVDF) membrane and stained with Ponceau. All membranes were then blocked for one hour with 5% BSA in Trisbuffered saline with Tween (0.5 M NaCl, 50 mM TrisHCl pH 7.4, 0.1% Tween 20). The membranes were then treated overnight at 4 °C with 5% BSA in Trisbuffered saline with Tween and a primary antibody. We utilized the following primary antibodies: rabbit anti-AKT total (1:1000, cat#9272, Cell Signaling, Danvers, MA, USA); rabbit anti-pserAKT (1:1000, cat#9271, Cell Signaling); rabbit anti-mTOR total (1:1000, cat#2972S, Cell Signaling); rabbit anti-psermTOR (1:1000, cat#2971S, Cell Signaling); rabbit anti-P70 total (1:1000, cat#9202S, Cell Signaling); rabbit anti-pthrP70 (1:1000, cat#9205S, Cell Signaling); rabbit anti-eIF4E total (1:1000, cat#TA323841, ORIGEN, Rockville, MD, USA); rabbit anti-pserIF4E (1:1000, cat#TA325446, ORIGEN); and rabbit anti-GAPDH (1:3000 cat#2118, Cell Signaling). The membranes were then washed three times for five minutes with Trisbuffered saline and Tween and incubated for one hour at room temperature with a secondary antibody (1:10,000 for phosphorylated proteins and 1:30,000 for total proteins, goat anti-rabbit peroxidase cat#111035003, Jackson Immunodetect) with 5% BSA in Trisbuffered saline and Tween. The membranes were then washed three times for five minutes with Trisbuffered saline and Tween. LuminataTM Forte (cat#WBLUF0500, Millipore, Burlington, MA, USA) was utilized to visualize the specific bands in the Fusion FX5 XT (Vilber Lourmat). GAPDH endogenous control was utilized to detect load fluctuations.

2.8. Statistical Analysis

Data analysis was performed using Prism Software (GraphPad Prism 7.0, San Diego, CA, USA), and comparisons were established using either two-way ANOVA followed by Tukey’s post-test or two-way ANOVA for matching data followed by Bonferroni’s post-test. The unpaired t-test was employed to compare the differences between two groups when the data were parametric, or the Mann-Whitney test when the data were non-parametric. Data were presented as mean ± SD or SEM, and statistical significance p < 0.05 was considered.

3. Results

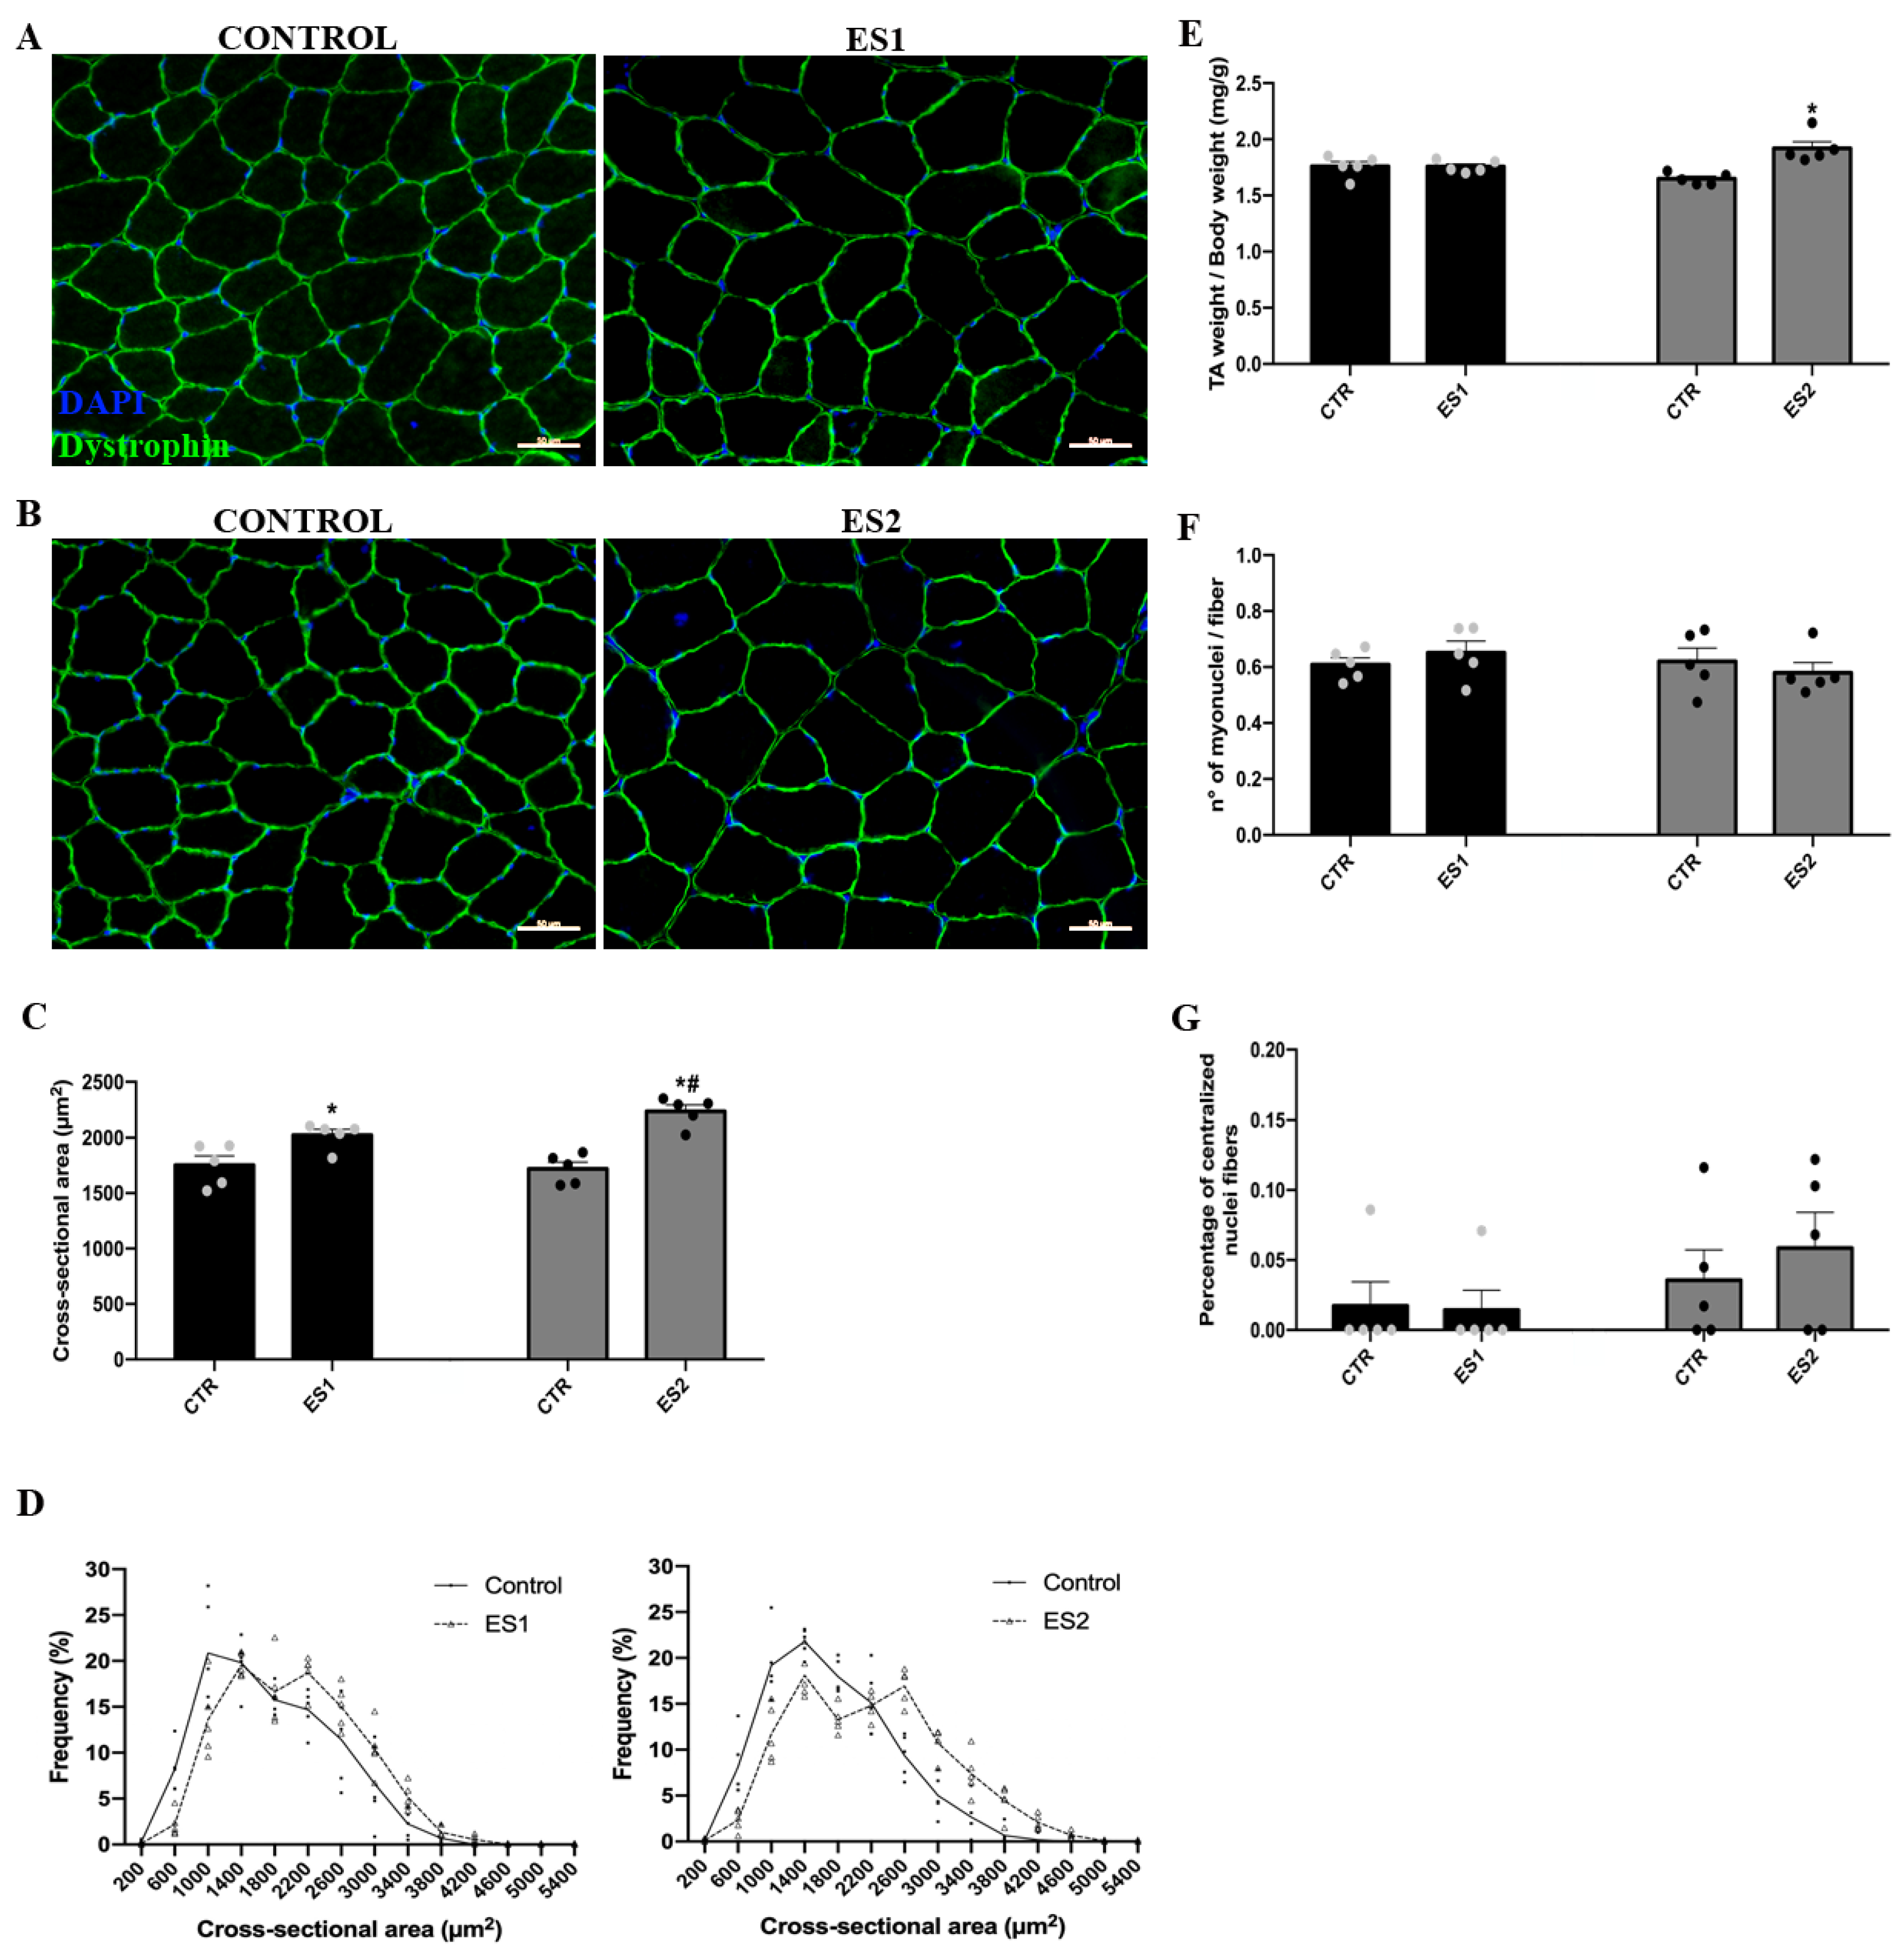
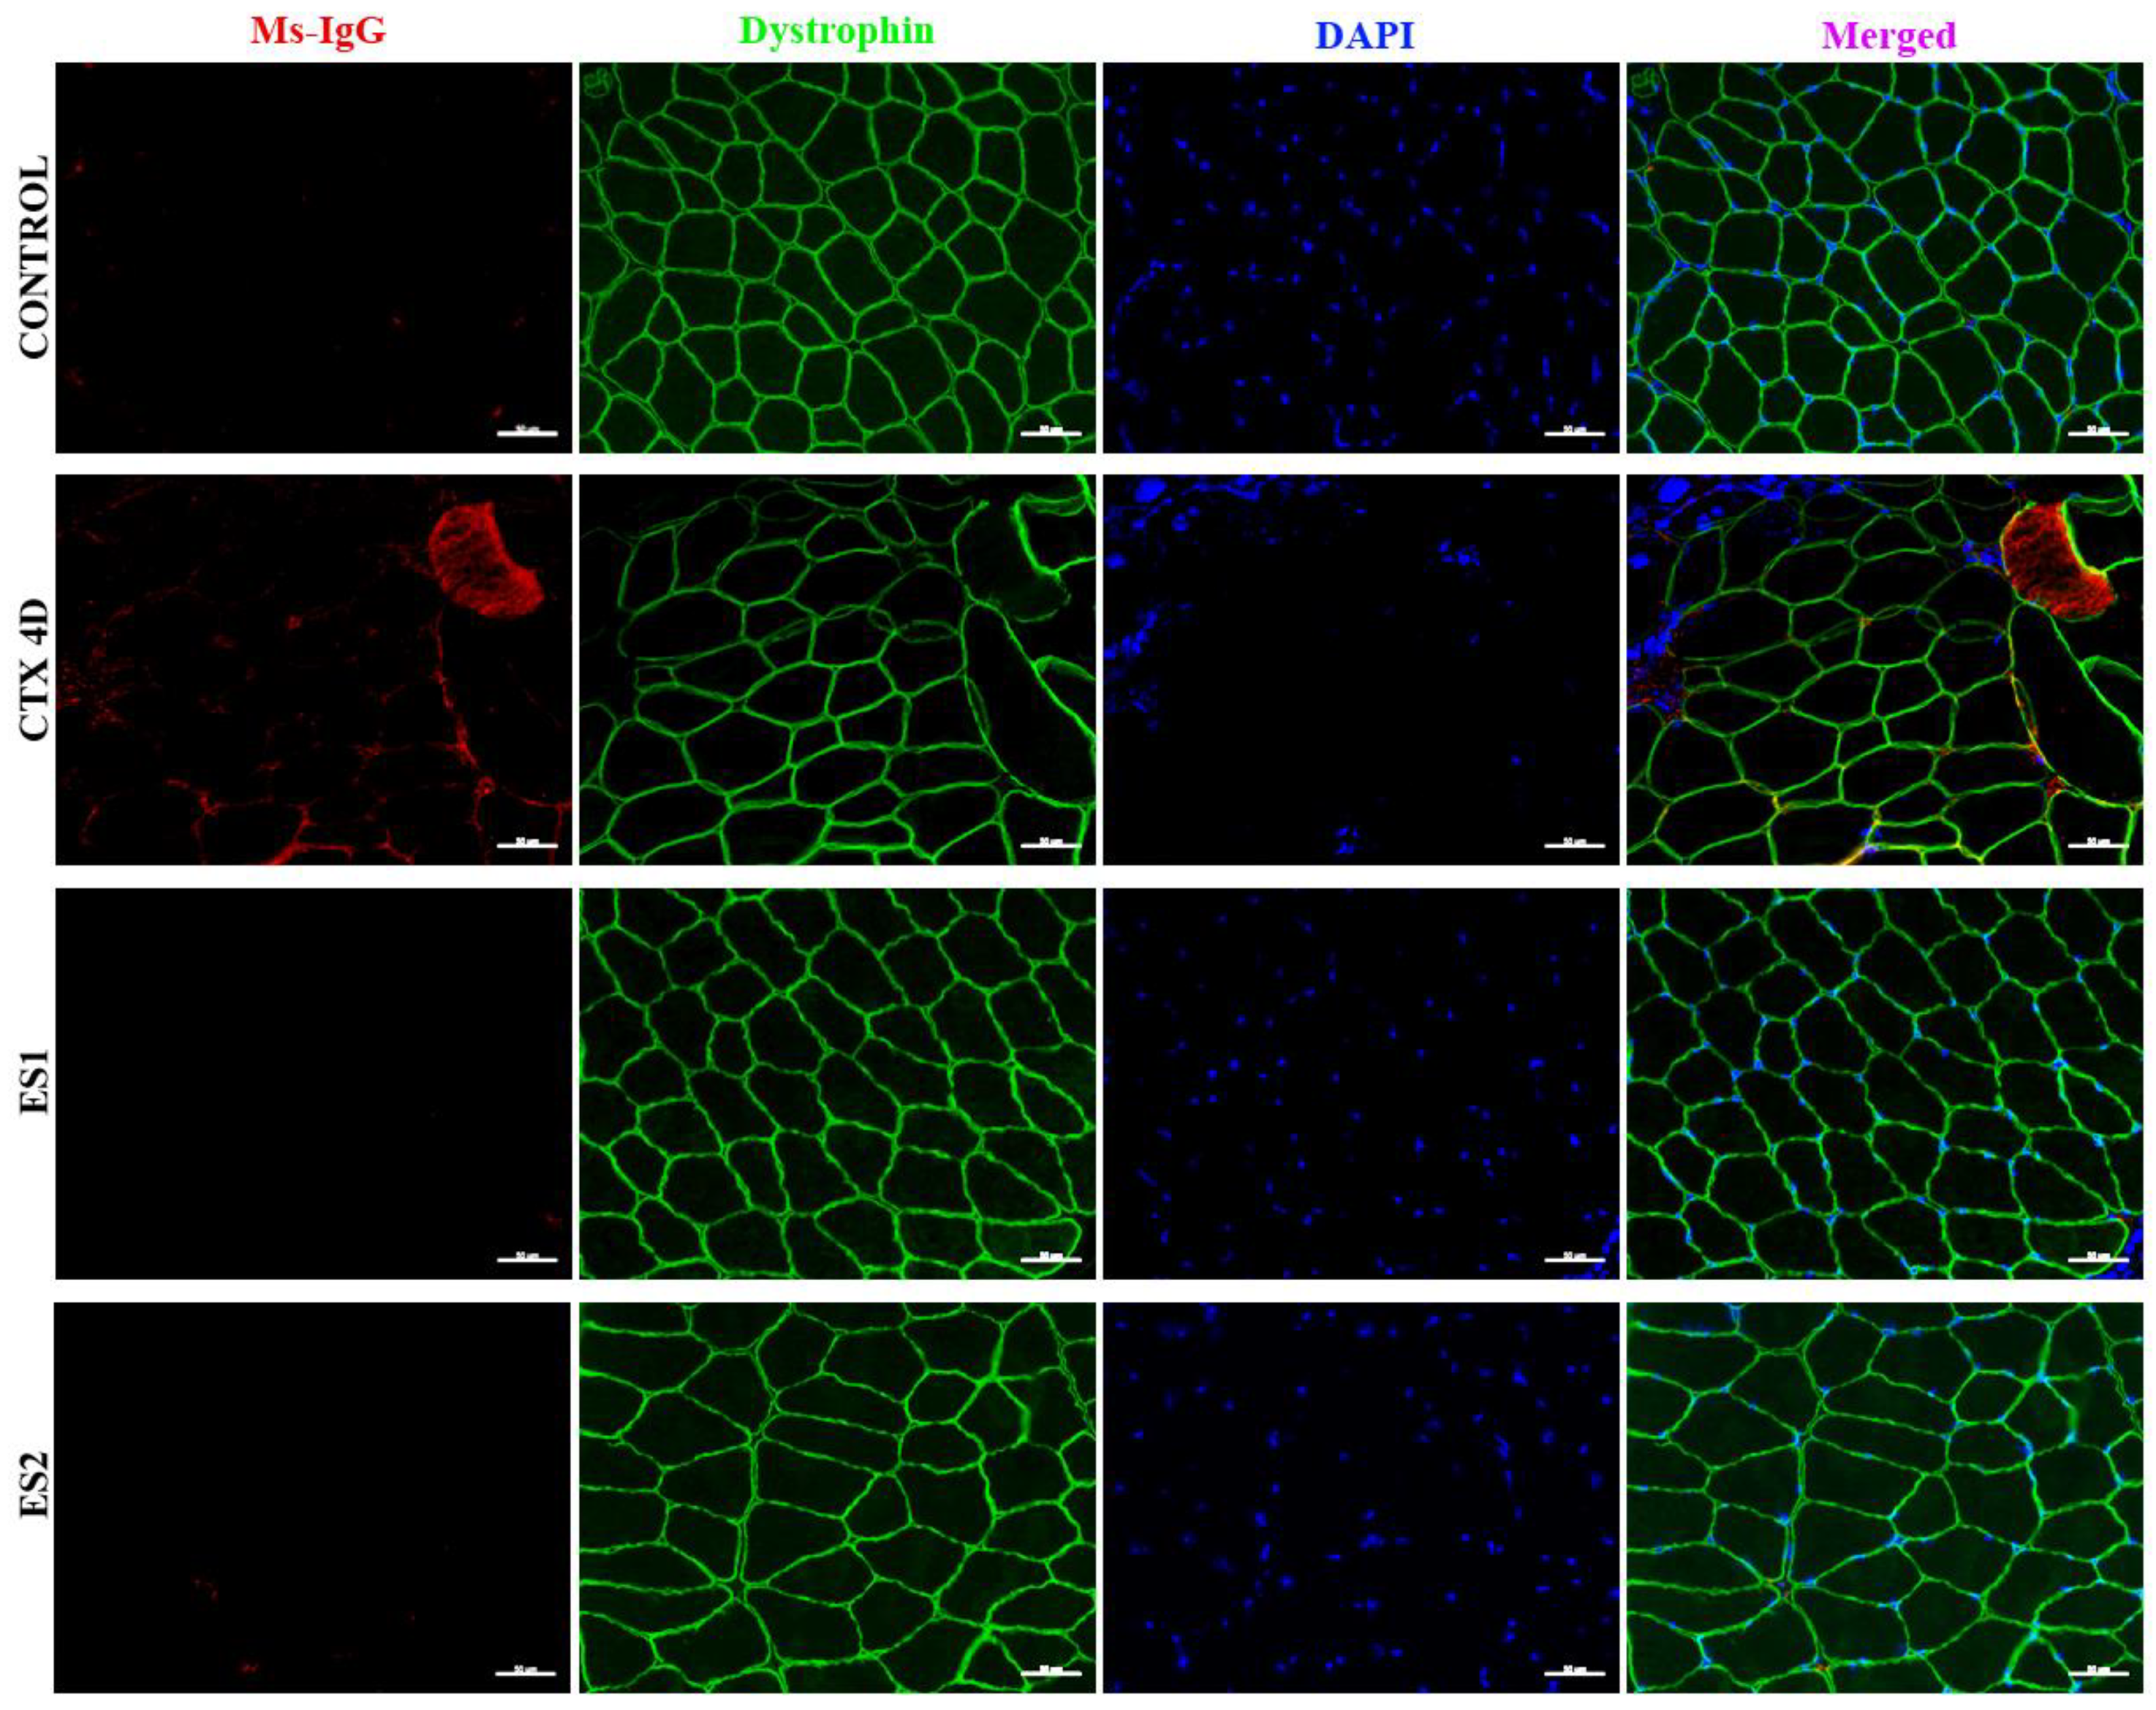
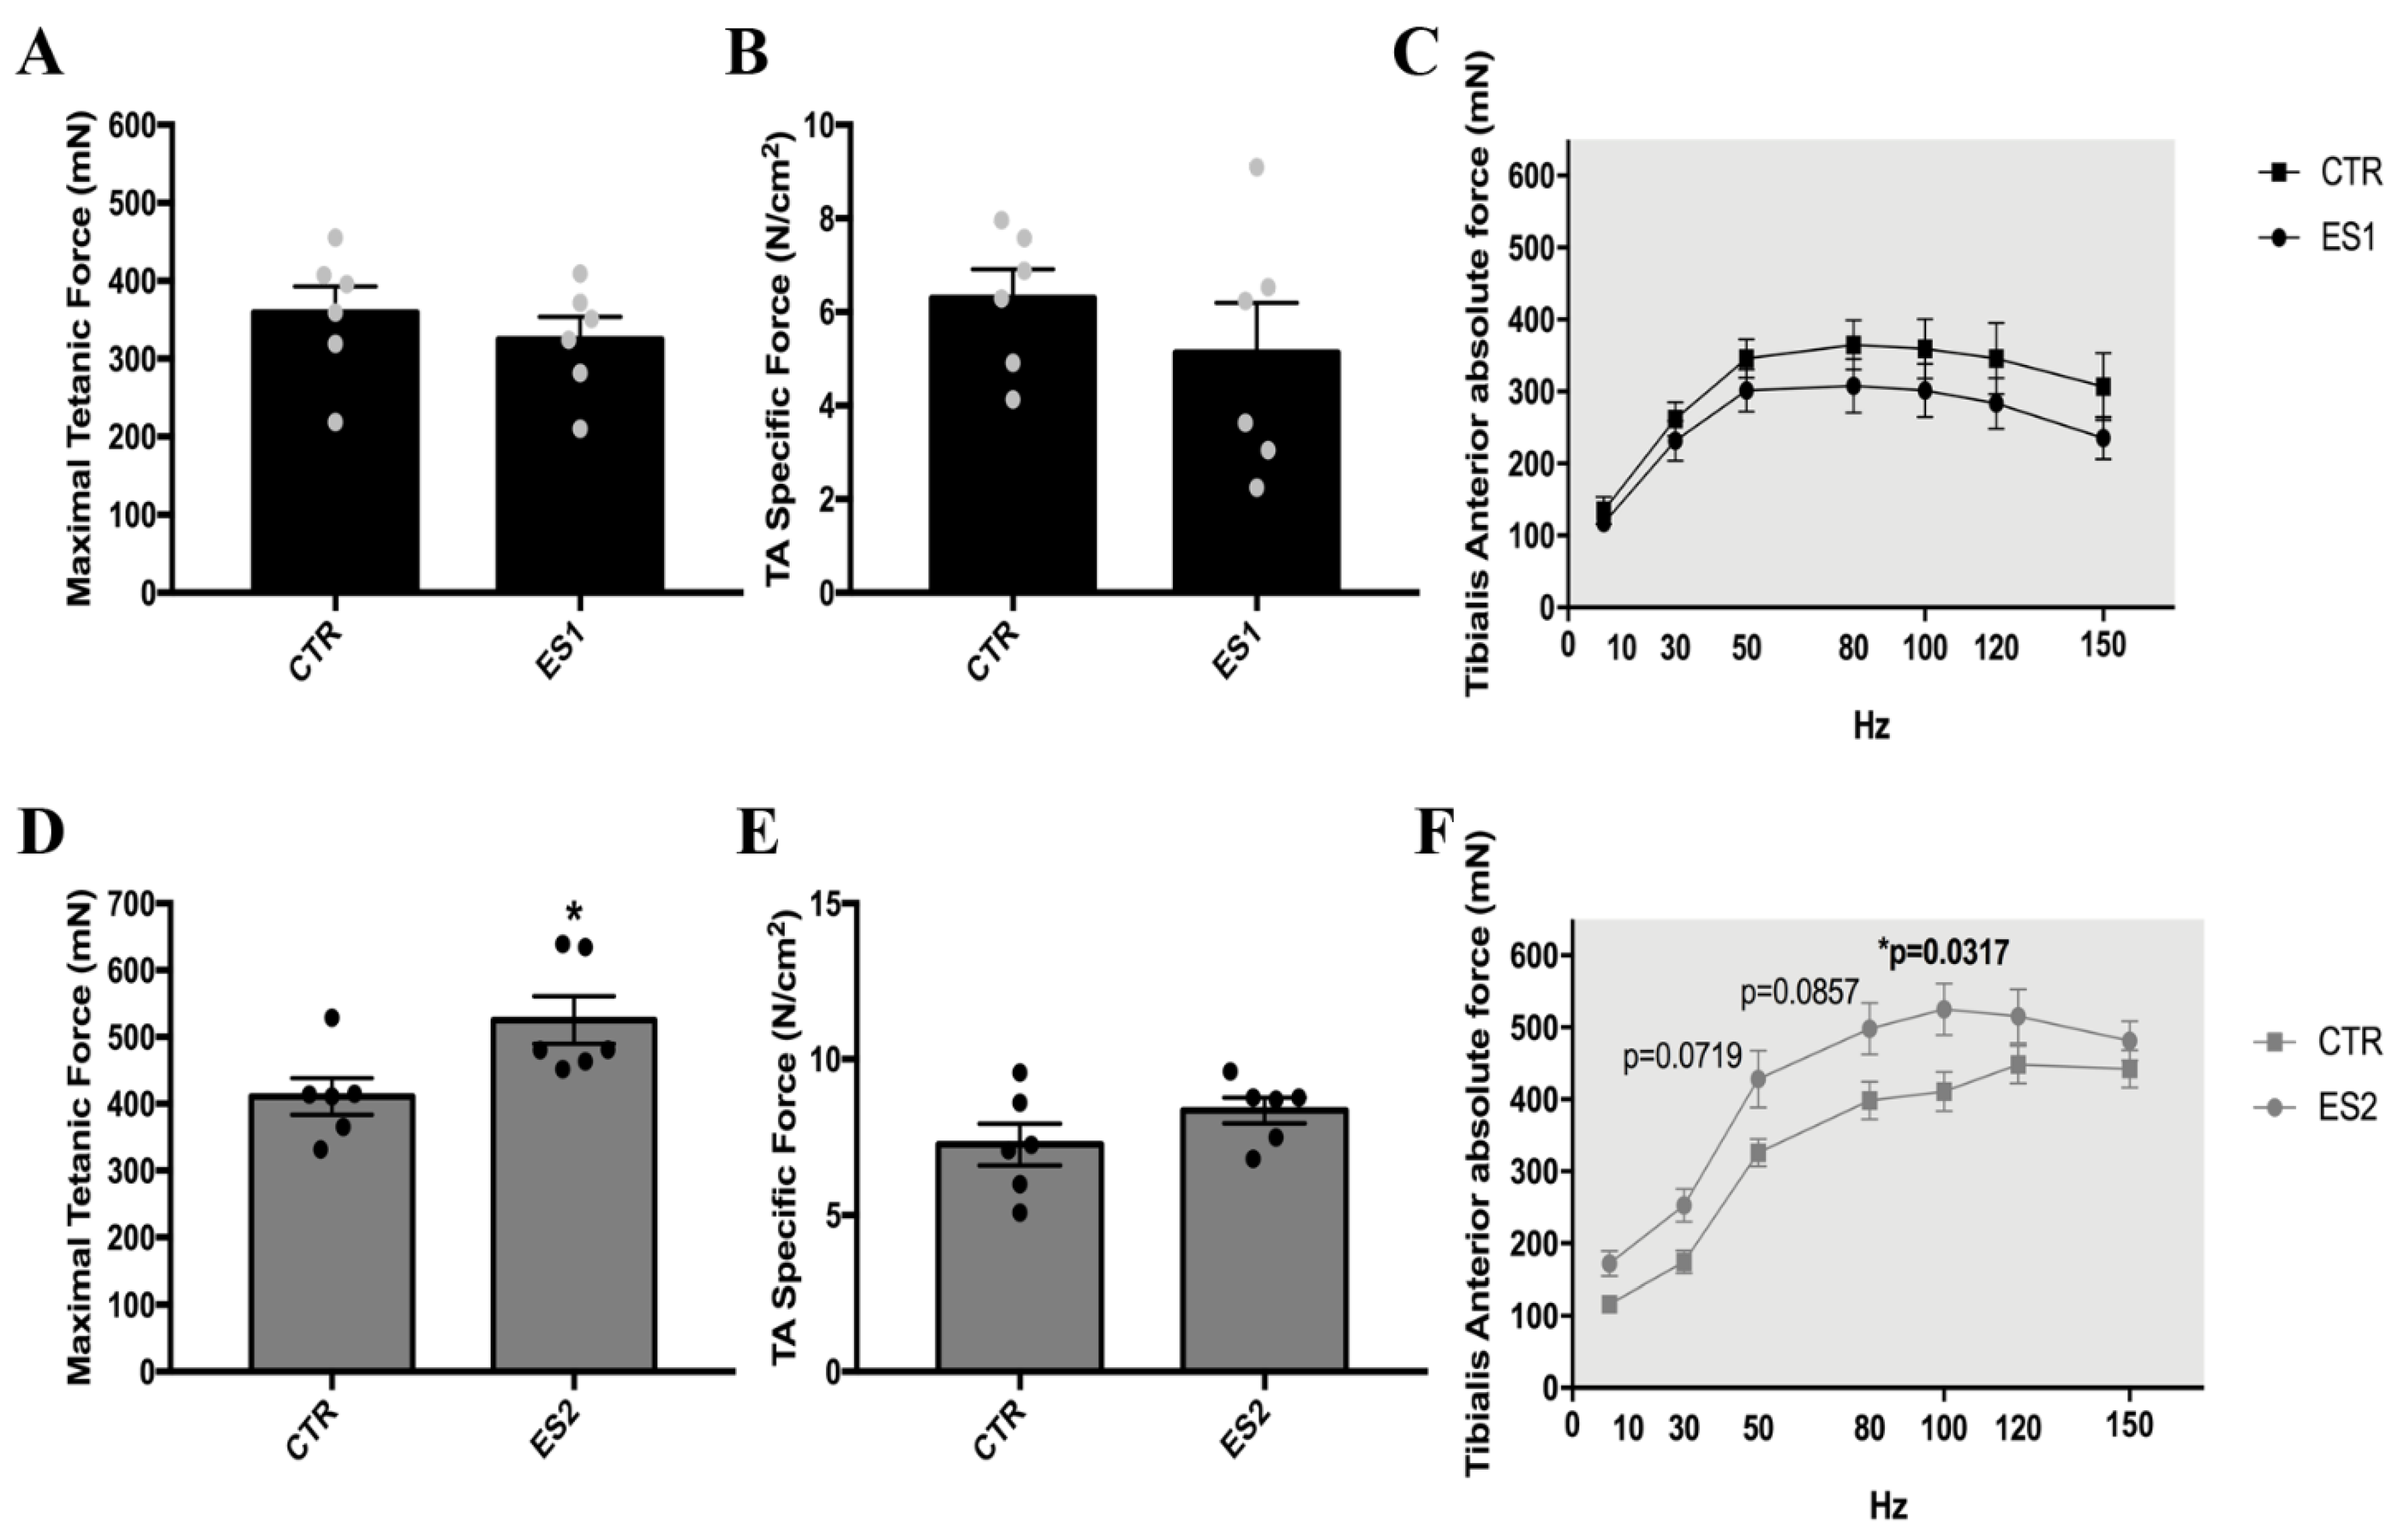
3.1. Electrical Stimulation Induced Skeletal Muscle Hypertrophy and Enhanced Tibialis Anterior Maximal Strength in Mice

Initially, we evaluated the effectiveness of ES exercise in generating hypertrophy in TA. By evaluating the fiber’s CSA, we were able to detect an increase of about 15% (CTR: 1792 ± 21.07 µm2 vs. ES1: 2054 ± 19.71 µm2, p < 0.0001) in this parameter after only one week of training (Figure 1A,C). After two weeks of ES training, the CSA increased to nearly 30% (CTR: 1758 ± 21.69 µm2 vs. ES2: 2266 ± 25.23 µm2, p < 0.0001) (Figure 1B,C). Likewise, frequency distribution analysis indicated an increase in CSA across both time periods, particularly in fibers ranging from 600 to 1000 µm2 and 2200 to 2600 µm2 in the ES1 group, and from 600 to 1800 µm2 and 2600 to 3800 µm2 in the ES2 group (Figure 1D). Histologically, we found that hypertrophied fibers retained their polygonal structure and abundance of extracellular matrix (Figure 1A,B). To determine the effect of additional training time, we exercised animals for four weeks and found a similar degree of hypertrophy, around 30% (CTR: 1573 ± 20.76 µm2 vs. ES4: 2061 ± 23.82 µm2, p < 0.0001) (Supplementary Figure S1). At two weeks of ES training, there was a substantial increase in muscle mass (CTR: 1.6 ± 0.055 mg/g vs. ES2: 1.9 ± 0.097 mg/g, p = 0.0205), although there was no difference at one week (Figure 1E). Analysis of the number of centralized nuclei and myonuclei per fiber revealed no significant differences among groups (Figure 1F,G).
Because we observed a somewhat rapid hypertrophy using the procedure described here, we chose to determine whether tissue damage following the fiber size takes place (Figure 2). In the control and ES groups, dystrophin staining was typical of a regular tissue, reflecting the polygonal form of the fibers. In the positive control group (muscle obtained four days after injection of cardiotoxin), we noticed altered dystrophin staining (reduced fiber polygonal form) and discontinuity in specific fibers. Similarly, we did not observe IgG staining in the control or ES groups, but we did observe IgG-positive fibers in the cardiotoxin injected group, as expected (Figure 2).
Next, we measured the tibialis muscle’s maximal strength using in vivo function analysis. At one week after muscle training, there was no change in TA force. Alternatively, two weeks of muscle training resulted in almost 30% (CTR: 411 ± 27.29 mN vs. ES2: 525 ± 35.61 mN, p = 0.0260) increase in TA force (Figure 3). Specific force was not altered among groups.

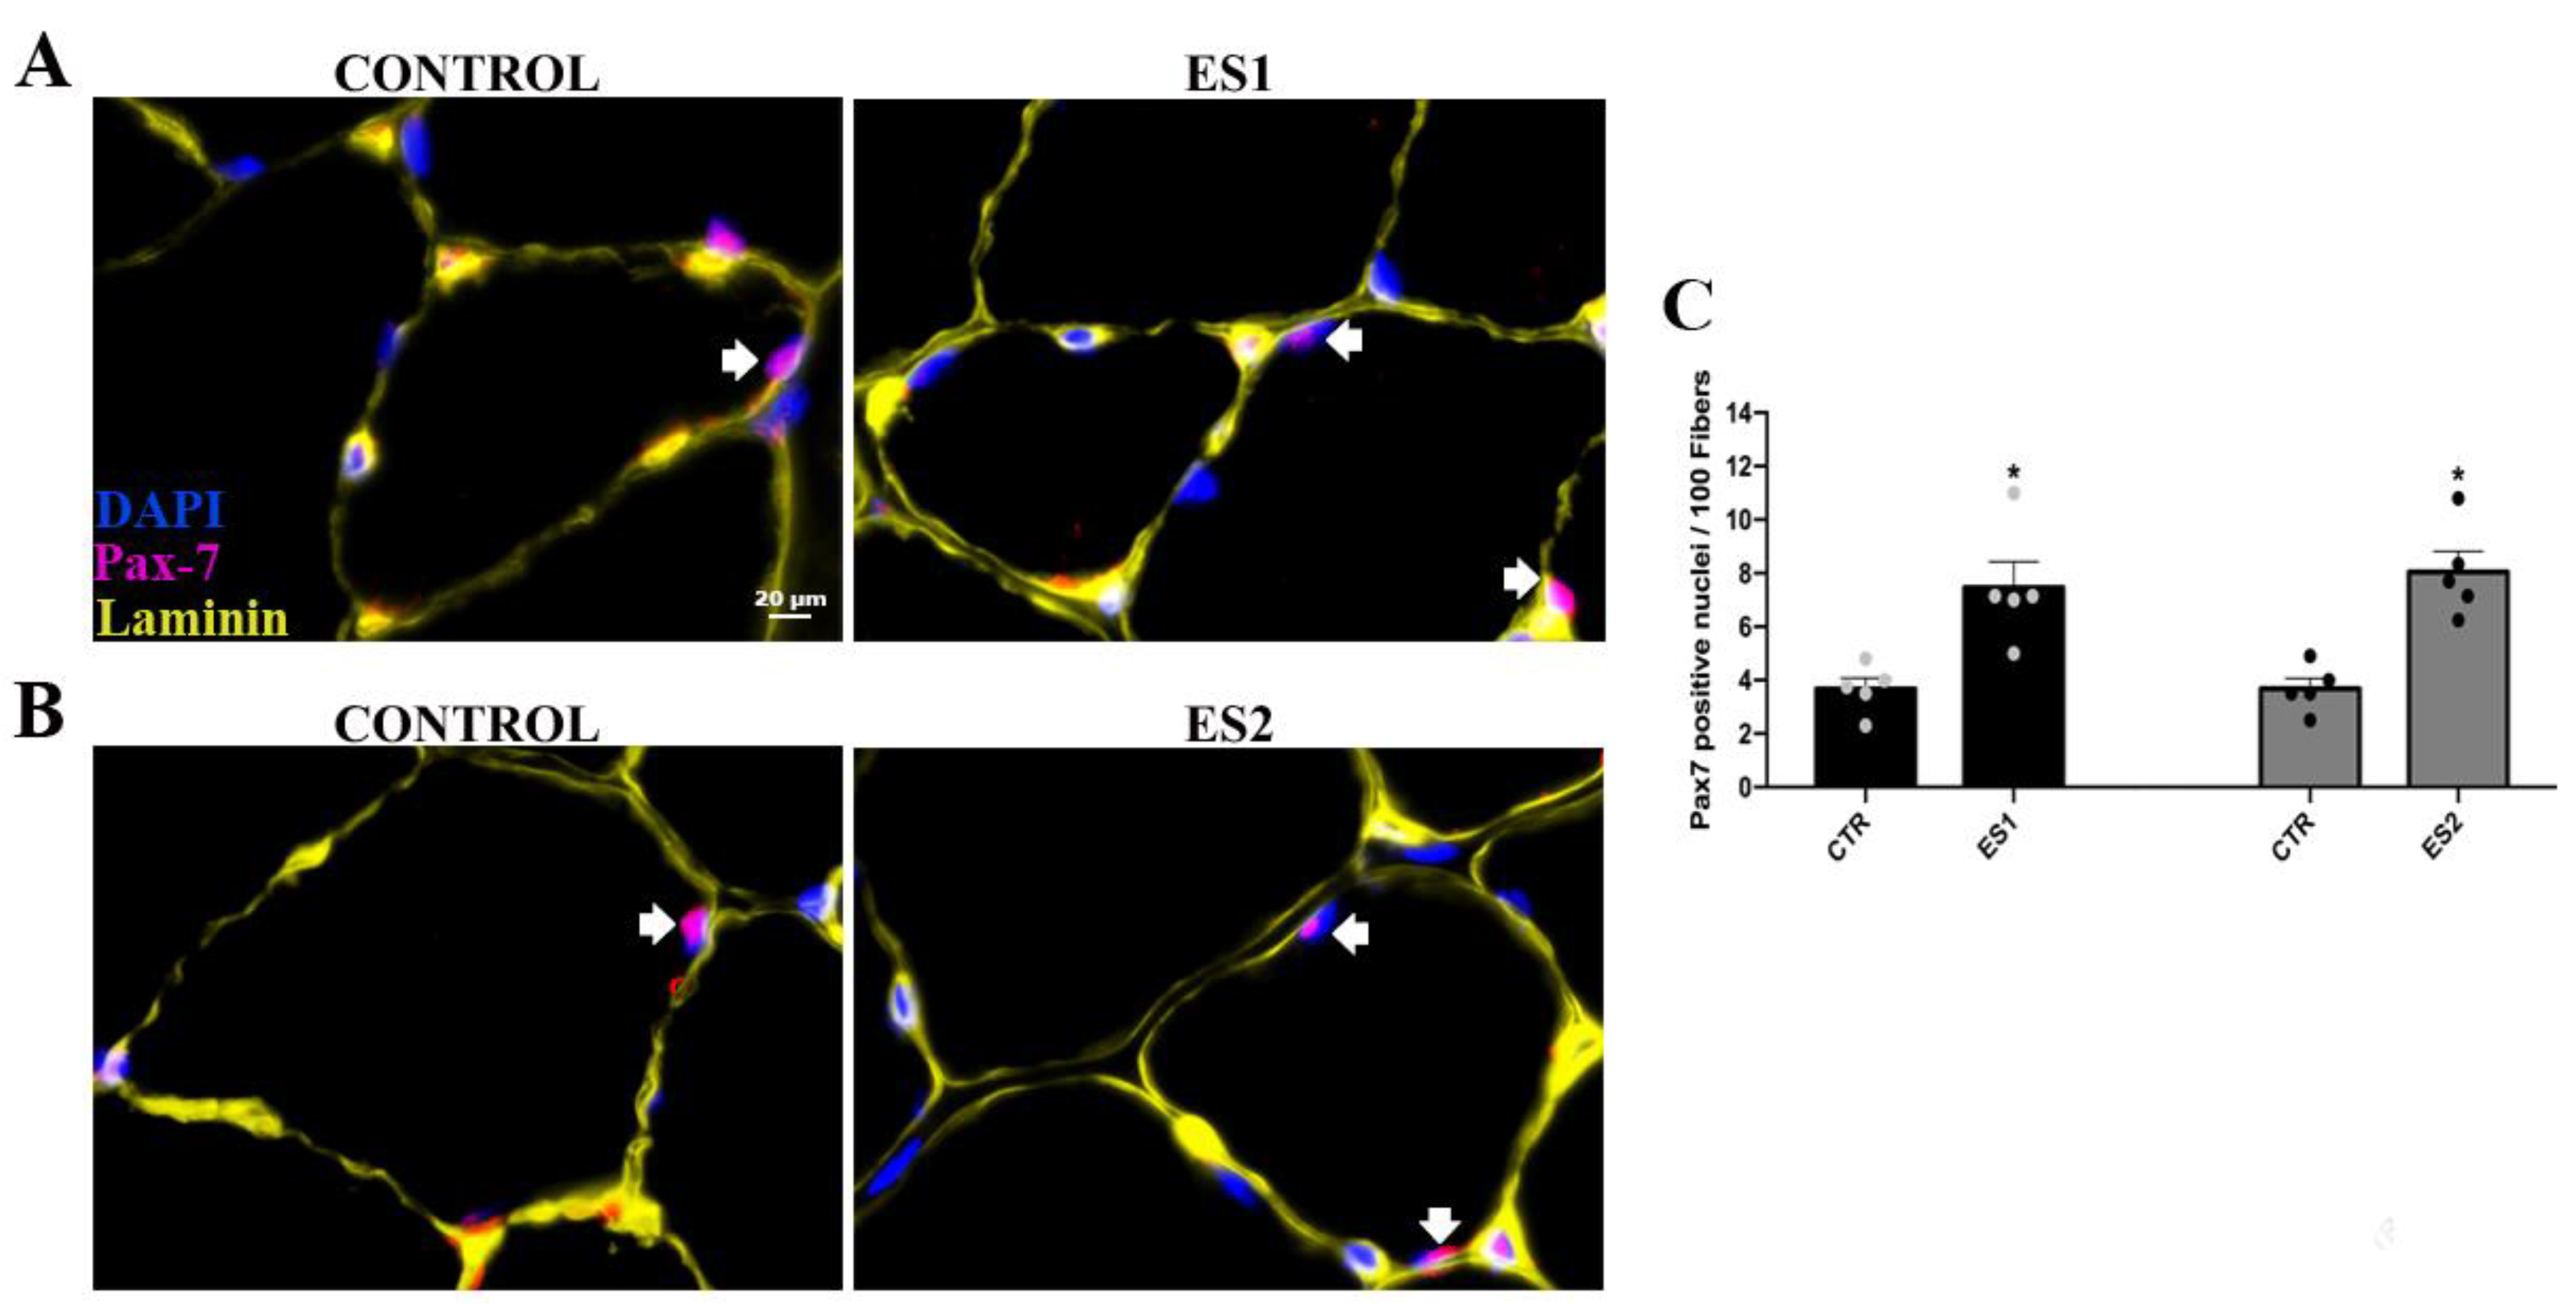
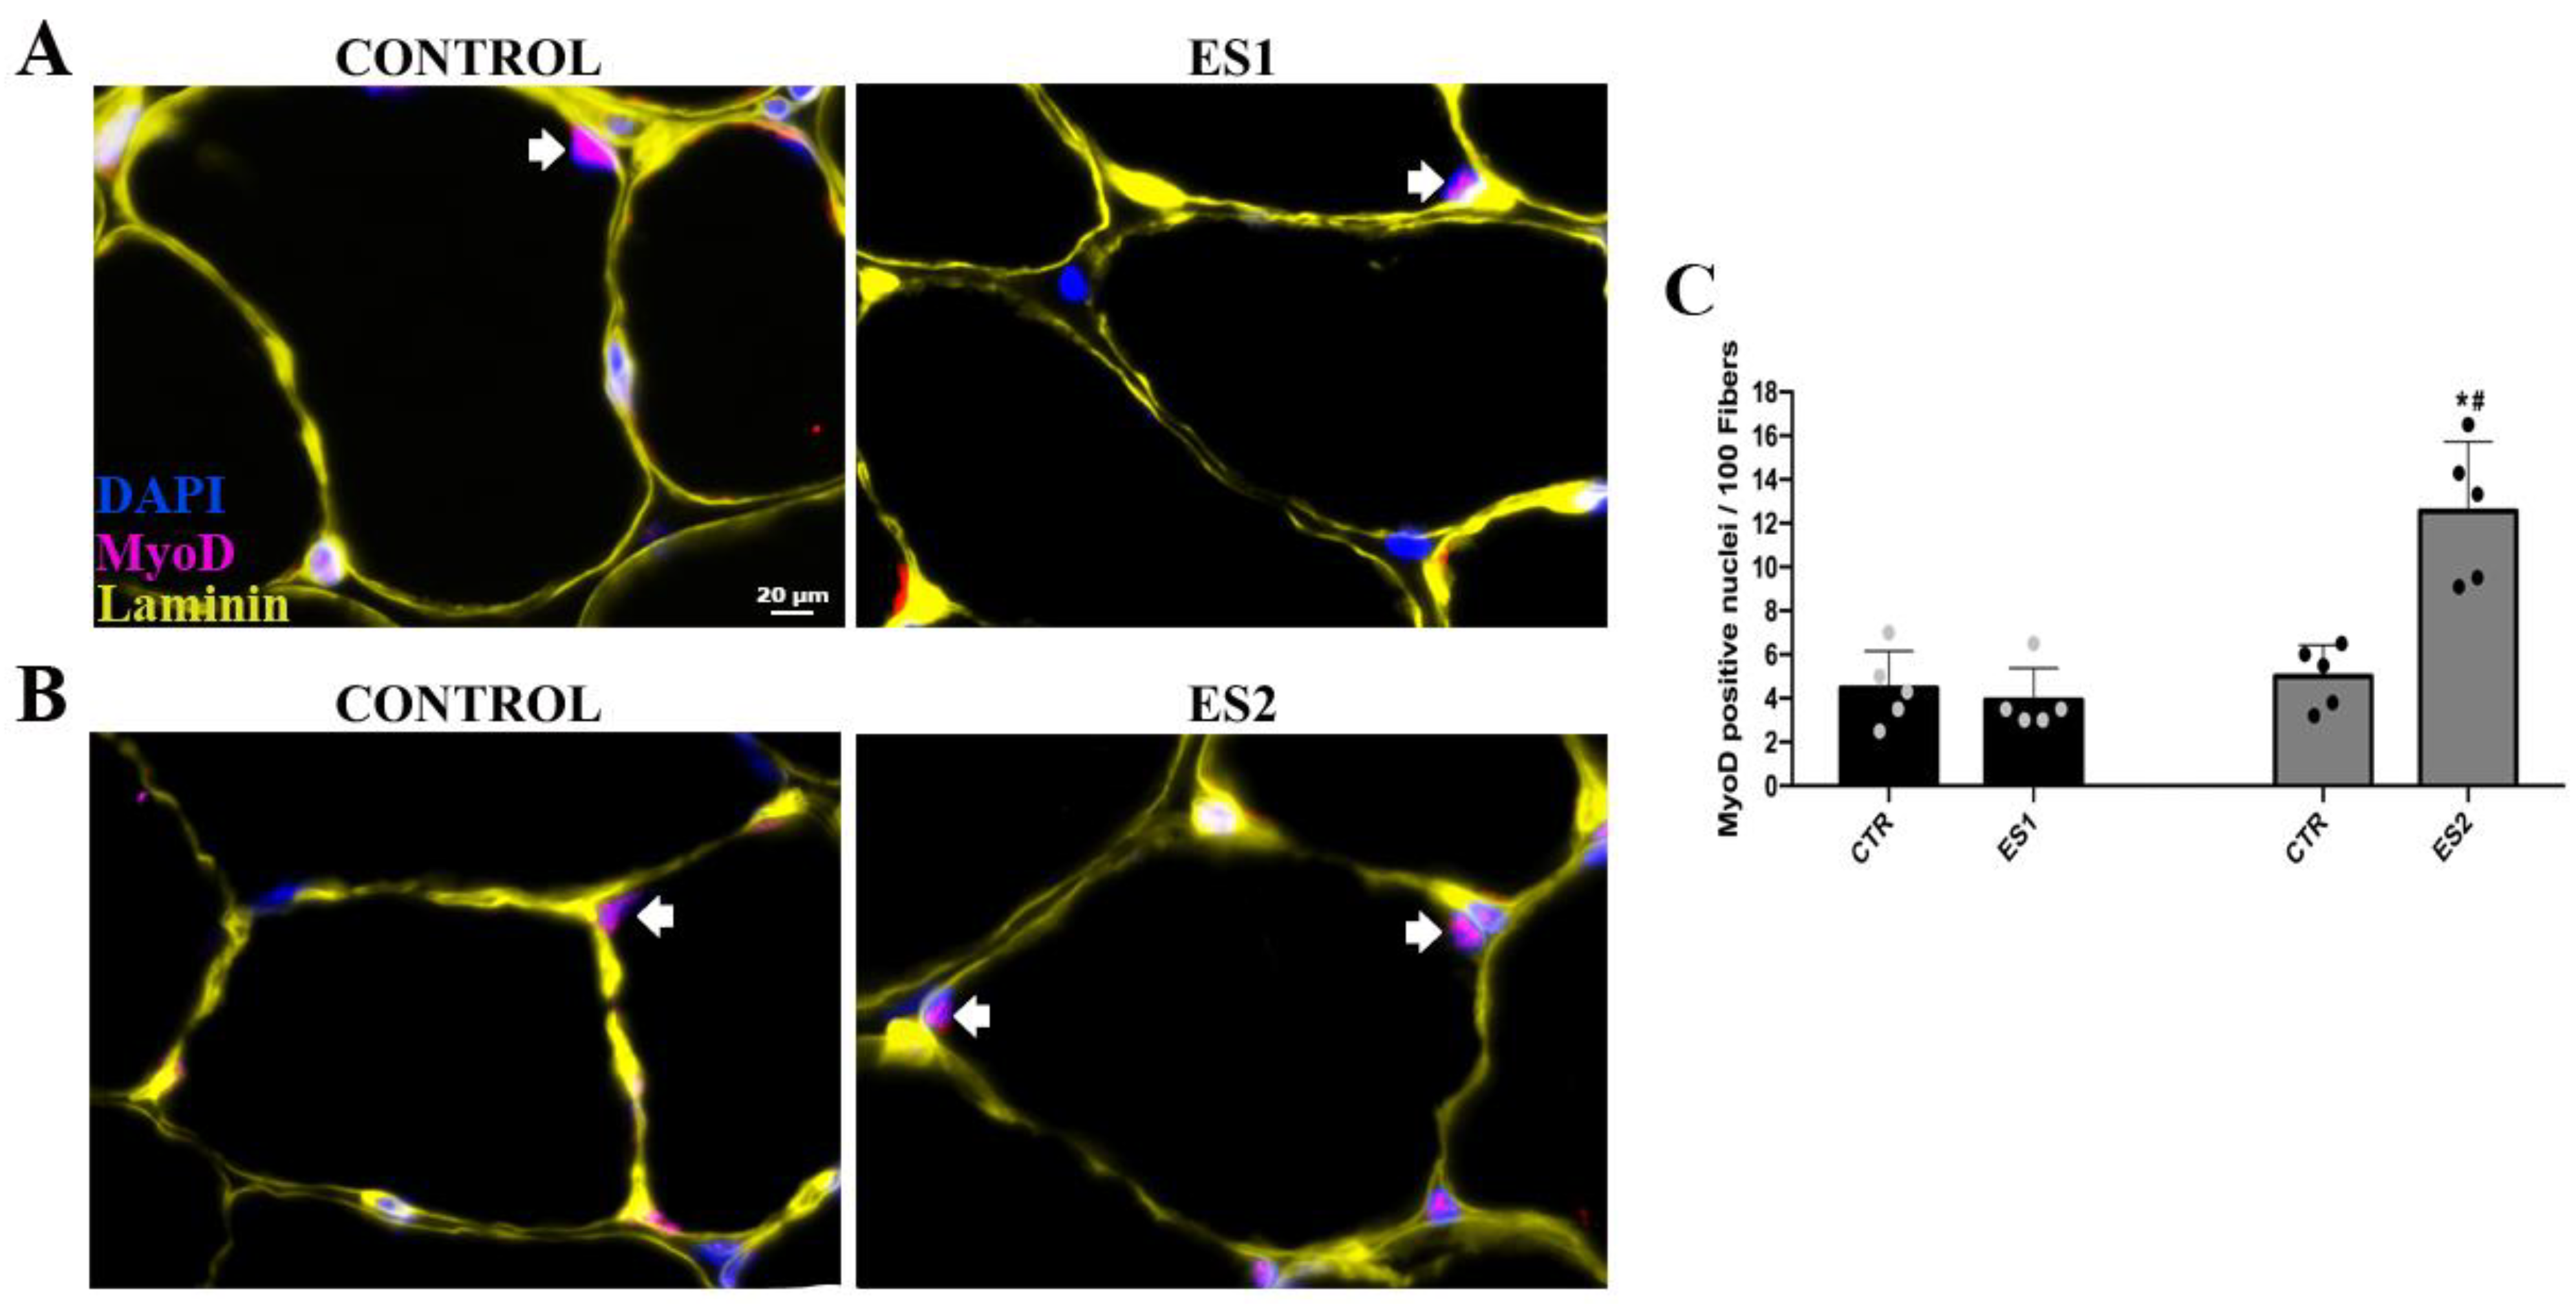
3.2. Electrical Stimulation Enhanced Pax-7 and MyoD Counts in Tibialis Anterior of Mice

Next, we studied the effect of muscle training on tissue remodeling. For this purpose, proliferating satellite cells were detected by immunolabeling with a specific Pax-7 antibody (Figure 4). We observed a rapid increase in the number of Pax-7-positive cells one week after training (CTR: 3.44 ± 1.31 vs. ES1: 7.56 ± 0,87, p < 0.0001) Accordingly, comparable outcomes were obtained two weeks following muscle training (CTR: 3.71 ± 1.41 vs. ES2: 8.15 ± 0.67, p < 0.0001).
When assessing the effect of muscle training on satellite cell differentiation as measured by MyoD immunolabeling, we found no response after one week of training (Figure 5). At two weeks, however, a significant increase in MyoD-positive cells was found (CTR: 4.71 ± 1.35 vs. ES2: 12.38 ± 1.83, p = 0.0057). Notably, the rise observed at two weeks is statistically distinct from that shown at one week (ES1: 3.71 ± 1.45 vs. ES2: 12.38 ± 1.83, p = 0.0017) (Figure 5).

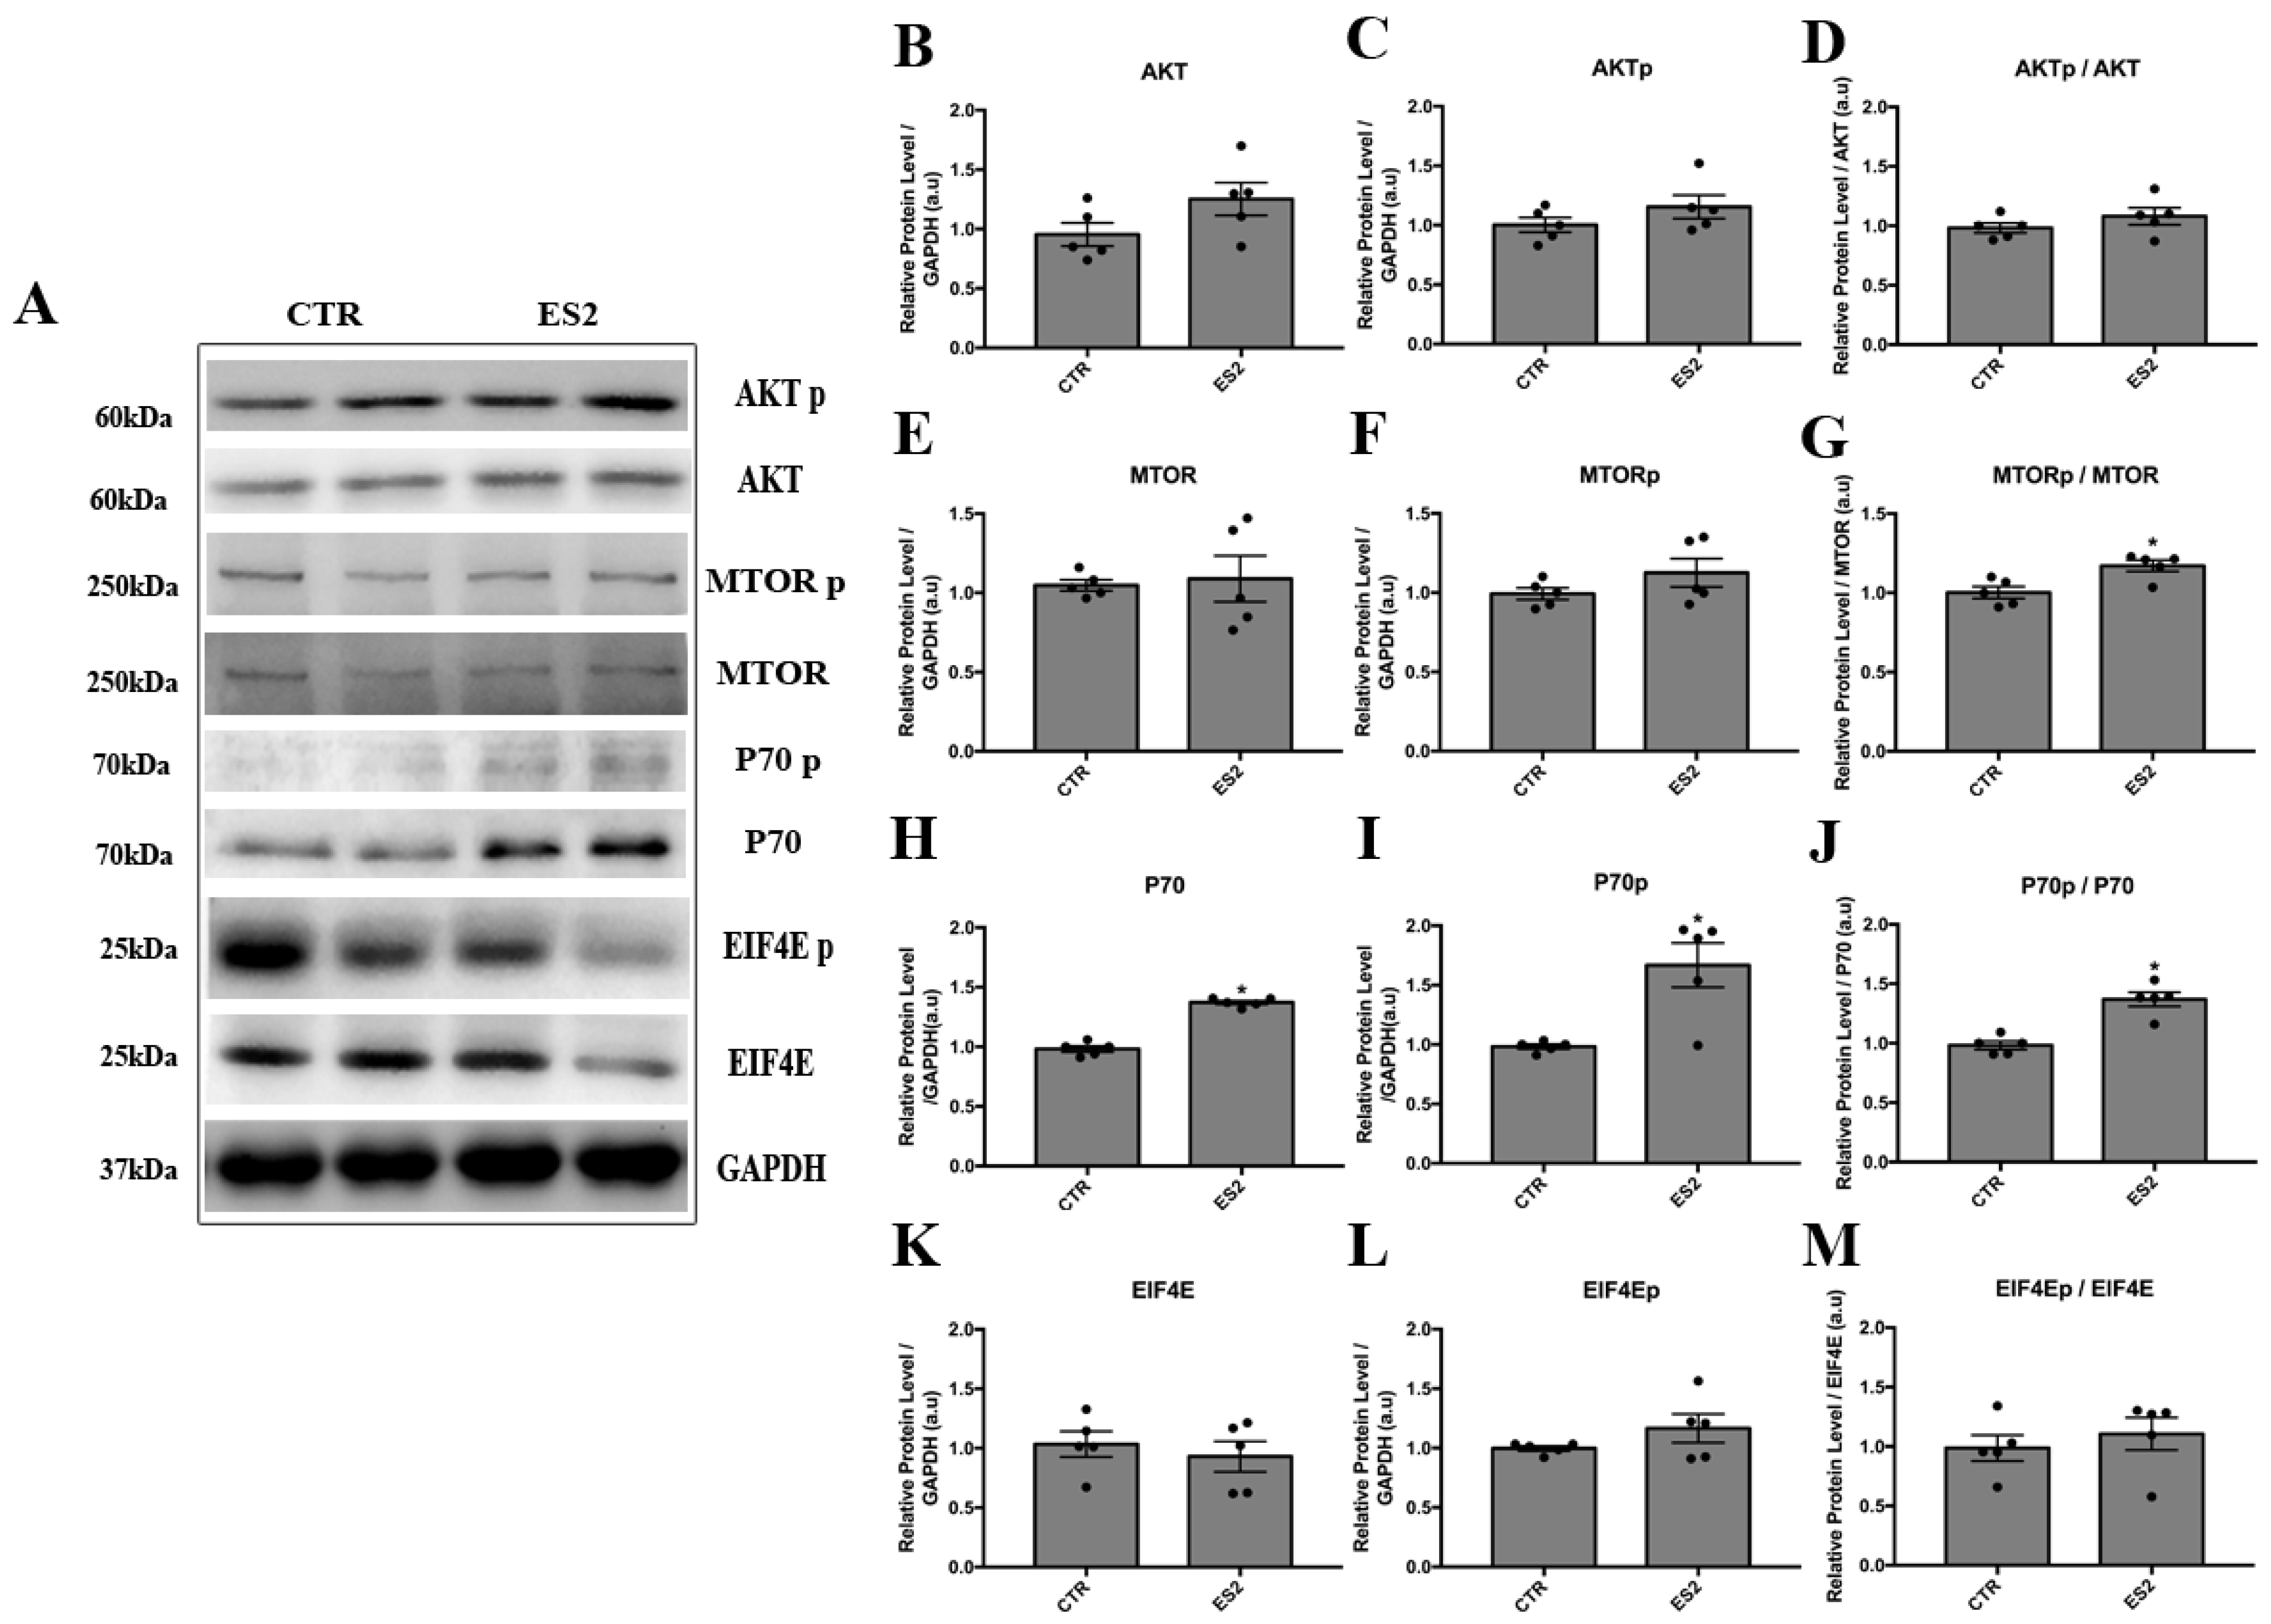
3.3. Electrical Stimulation Induced AKT/mTOR Signaling

Because an optimized response was found at two weeks of muscle training, we decided to focus on this time point to address markers of mammalian target of rapamycin signaling (Figure 6). Total and phospho AKT levels did not differ between the muscle training group and the control group. Although total and phospho mTOR levels were similar to those of the controls, the phospho/total ratio was marginally (17%, although statistically significant, CTR: 1.00 ± 0.0396 vs. ES2: 1.171 ± 0.0354, p = 0.0215) higher in the muscle training group. In addition, total (37%, CTR: 1.00 ± 0.0337 vs. ES2: 1.372 ± 0.0208, p = 0.0002) and phosphorylated P70 levels were higher (66%, CTR: 1.00 ± 0.0197 vs. ES2: 1.668 ± 0.186, p = 0.0364) in the muscle training group, culminating in high levels of the phospho/total ratio (37%, CTR: 1.00 ± 0.0533 vs. ES2: 1.37 ± 0.0598, p = 0.0059). Finally, neither total or phospho EIF4 levels were altered in the muscle training group compared to the control group (Figure 6).

4. Discussion

In light of the requirement for experimental models that elicit considerable hypertrophy in a timely manner, we sought to build an improved muscle training protocol employing electrical stimulation that mimics a conventional resistance exercise in humans. In terms of fiber type composition, we have also emphasized a rather homogenous (TA) muscle (predominantly type II fibers). Additionally, the TA muscle may be easily removed for further examination and is rather large compared to muscles employed in specific studies, such as the plantar [24], flexor hallucis longus [30], extensor digitorum longus, and soleus [28], allowing for sufficient tissue for further analysis at multiple levels. In addition, TA is the most common muscle used in investigations employing electroporation models, where it is relatively simple to transfer plasmids containing foreign genes into tissue cells. Notably, the use of a fast-twitch muscle may have created a limiting bias, as the results obtained may not be applicable to a predominately slow-twitch muscle.
The major difference in this study is the high intensity of training, in which the volume (10 sets with 12 repetitions), contraction/rest rate between contractions (3 s on and 2 s off), and resting time between sets (1 min) are, to our knowledge, the most intense in the literature [11,12,13,14,38,39]. This protocol design caused a rapid and strong hypertrophy (~30% hypertrophy) after only two weeks of training. After 3–6 weeks of exercise, related published programs typically achieve 8–15 percent hypertrophy [2], [11,37,39]. Notably, increased time to acquire quantifiable hypertrophy is associated with an increased likelihood of anesthetic events that could greatly increase animal stress levels, hence influencing molecular parameters and exercise response. Our maximal-force measurements reveal identical increases when compared to the changes in skeletal muscle fiber CSA, indicating that the hypertrophy seen corresponds to an increase in muscle size without a change in specific force.
In this study, we examined satellite cell activity as a tissue remodeling marker and observed a one-week increase in Pax-7-positive nuclei that persisted for two weeks following electrical stimulation. As a marker of satellite cell proliferation, these results are expected for Pax-7, and its increases at the beginning of training are required for muscle tissue remodeling and adaptation. We also examined MyoD-positive nuclei, and after two weeks of electrical stimulation, we detected an increase. This supports a subsequent burst of satellite cell differentiation, which is consistent with the anticipated tissue remodeling that occurs after the union of these cells with mechanically stressed fibers. This remodeling was reflected, as expected, in the centralized nuclei that were observed primarily after two weeks of training (Figure 1G), whereas sarcolemma was preserved, as observed by IgG and dystrophin measurements (Figure 2).
Measuring the expression of key molecules involved in protein synthesis is an additional way to monitor the efficacy of the muscle training described here. Muscle training activates mTOR signaling, which is a critical regulator of protein synthesis in skeletal muscle. Two weeks of electrical stimulation elicit an increase in mTOR phosphorylation and downstream components of this pathway, such as p70, according to our findings. It has been extensively demonstrated that mTOR signaling is required for a hypertrophic response, and numerous studies have reported that rapamycin-sensitive mTOR is robustly activated in acute mechanical stress (one bout) [12]; however, the effect of the entire resistance exercise training program is less well-documented. Although phosphorylated mTOR and p70 were observed to be raised in our tests, the intensity is definitely diminished when compared to the effects of a single bout. In fact, Ogasawara et al. obtained comparable results; they discovered a slight stimulation of the mTOR pathway after electrical stimulation of the gastrocnemius for four weeks [11]. In such resistance exercise procedures, it is conceivable that the initial bouts strongly activate pathways such as AKT-mTOR. As the skeletal muscle fiber gradually regains homeostasis, the impact of bouts on the activation of protein synthesis pathways diminishes. Another important point concerns the timing of response of the components of the AKT-mTOR pathway: our findings herein do not show increased expression/phosphorylation of AKT at two weeks of training. We envision that AKT activation occurred earlier in time, and what we observed after two weeks of training is the result of AKT’s early activation.
In order to generate a model that could be compared to other experimental models in terms of hypertrophy speed and intensity, we selected young male mice, as was the case in the vast majority of previous investigations. Although this approach is useful for comparison, it is crucial to note that it has limitations, namely that the observations reported here are limited to certain settings and a clear picture of hypertrophic response disparities across genders and the influence of aging is not yet attainable. Consequently, it would be intriguing to employ the technique presented here in the future to compare genders and age, similar to the rat research involving stretch-shortening contraction [25,26,27].
The availability of potent and accessible experimental models is essential for the identification and further characterization of molecules or biochemical pathways, which ultimately leads to translation to human clinical trials and the creation of new therapeutical techniques. Using a sufficiently robust and rapid muscle training model, one may, for example, uncover a critical responsive protein that could eventually lead to a molecule that could be combined with resistance exercise in older humans to stimulate more hypertrophy with less intensity or volume of training.
In conclusion, this study can contribute to future muscle training model investigations by presenting improvements that result in faster skeletal muscle hypertrophy.

Supplementary Materials

The following supporting information can be downloaded at: https://0-www-mdpi-com.brum.beds.ac.uk/article/10.3390/app12157673/s1, Figure S1: Morphometric analyses after four weeks of electrical stimulation.

Author Contributions

A.S.M. and P.K.N.A. designed the manuscript, wrote and analyzed the data; P.K.N.A. and A.C. designed the figures for the manuscript; P.K.N.A., J.G.S., W.W.D.S. and A.C. performed the experiments, data collection and/or statistical analysis; J.G.S., W.W.D.S. and A.C. revised the manuscript; A.S.M. data curation and resources. All authors have read and agreed to the published version of the manuscript.

Funding

This research received financial support by São Paulo Research Foundation (FAPESP), grant number #2015/04090-0 and 2021/03066-9, fellowships 2017/09398-8, 2017/26819-7, 2018/24419-4, 2018/24418-8, 2016/12941-2, 2021/05827-7 and National Council for Scientific and Technological Development (CNPq).

Institutional Review Board Statement

The animal study protocol was approved by the Institute of Biomedical Sciences ethics committee (Protocol code #1282210519, 12 August 2019).

Informed Consent Statement

Not applicable.

Data Availability Statement

The data that support the findings of this study are available from the corresponding author, [ASM], upon reasonable request.

Conflicts of Interest

The authors declare that the research was conducted in the absence of any commercial or financial relationships that could be construed as a potential conflict of interest.

References

  1. Harber, M.P.; Konopka, A.R.; Undem, M.K.; Hinkley, J.M.; Minchev, K.; Kaminsky, L.A.; Trappe, T.A.; Trappe, S. Aerobic Exercise Training Induces Skeletal Muscle Hypertrophy and Age-Dependent Adaptations in Myofiber Function in Young and Older Men. J. Appl. Physiol. 2012, 113, 1495–1504. [Google Scholar] [CrossRef] [Green Version]
  2. Hardee, J.P.; Mangum, J.E.; Gao, S.; Sato, S.; Hetzler, K.L.; Puppa, M.J.; Fix, D.K.; Carson, J.A. Eccentric Contraction-Induced Myofiber Growth in Tumor-Bearing Mice. J. Appl. Physiol. 2016, 120, 29–37. [Google Scholar] [CrossRef]
  3. Huang, Z.; Fang, Q.; Ma, W.; Zhang, Q.; Qiu, J.; Gu, X.; Yang, H.; Sun, H. Skeletal Muscle Atrophy Was Alleviated by Salidroside through Suppressing Oxidative Stress and Inflammation during Denervation. Front. Pharmacol. 2019, 10, 997. [Google Scholar] [CrossRef]
  4. Schoenfeld, B.J.; Contreras, B.; Krieger, J.; Grgic, J.; Delcastillo, K.; Belliard, R.; Alto, A. Resistance Training Volume Enhances Muscle Hypertrophy but Not Strength in Trained Men. Med. Sci. Sports Exerc. 2019, 51, 94–103. [Google Scholar] [CrossRef]
  5. Alves, P.K.N.; Cruz, A.; Silva, W.J.; Labeit, S.; Moriscot, A.S. Leucine Supplementation Decreases HDAC4 Expression and Nuclear Localization in Skeletal Muscle Fiber of Rats Submitted to Hindlimb Immobilization. Cells 2020, 9, 2582. [Google Scholar] [CrossRef]
  6. Adams, V.; Bowen, T.S.; Werner, S.; Barthel, P.; Amberger, C.; Konzer, A.; Graumann, J.; Sehr, P.; Lewis, J.; Provaznik, J.; et al. Small-Molecule-Mediated Chemical Knock-down of MuRF1/MuRF2 and Attenuation of Diaphragm Dysfunction in Chronic Heart Failure. J. Cachexia Sarcopenia Muscle 2019, 10, 1102–1115. [Google Scholar] [CrossRef]
  7. Debevec, T.; Ganse, B.; Mittag, U.; Eiken, O.; Mekjavic, I.B.; Rittweger, J. Hypoxia Aggravates Inactivity-Related Muscle Wasting. Front. Physiol. 2018, 9, 494. [Google Scholar] [CrossRef] [Green Version]
  8. Glass, D.J. Signalling Pathways That Mediate Skeletal Muscle Hypertrophy and Atrophy. Nat. Cell Biol. 2003, 5, 87–90. [Google Scholar] [CrossRef]
  9. Margolis, L.M.; Rivas, D.A. Implications of Exercise Training and Distribution of Protein Intake on Molecular Processes Regulating Skeletal Muscle Plasticity. Behav. Genet. 2015, 45, 211–221. [Google Scholar] [CrossRef]
  10. Tipton, K.D.; Wolfe, R.R. Exercise, Protein Metabolism, and Muscle Growth. Int. J. Sport Nutr. Exerc. Metab. 2001, 11, 109–132. [Google Scholar] [CrossRef] [Green Version]
  11. Ogasawara, R.; Fujita, S.; Hornberger, T.A.; Kitaoka, Y.; Makanae, Y.; Nakazato, K.; Naokata, I. The Role of MTOR Signalling in the Regulation of Skeletal Muscle Mass in a Rodent Model of Resistance Exercise. Sci. Rep. 2016, 6, 31142. [Google Scholar] [CrossRef]
  12. Takegaki, J.; Ogasawara, R.; Tamura, Y.; Takagi, R.; Arihara, Y.; Tsutaki, A.; Nakazato, K.; Ishii, N. Repeated Bouts of Resistance Exercise with Short Recovery Periods Activates MTOR Signaling, but Not Protein Synthesis, in Mouse Skeletal Muscle. Physiol. Rep. 2017, 5, e13515. [Google Scholar] [CrossRef] [PubMed]
  13. Bodine, S.C.; Baar, K. Analysis of Skeletal Muscle Hypertrophy in Models of Increased Loading. Methods Mol. Biol. 2012, 798, 213–229. [Google Scholar] [CrossRef] [PubMed]
  14. Communications, S. Progression Models in Resistance Training for Healthy Adults. Med. Sci. Sports Exerc. 2009, 41, 687–708. [Google Scholar] [CrossRef]
  15. Murach, K.A.; McCarthy, J.J.; Peterson, C.A.; Dungan, C.M. Making Mice Mighty: Recent Advances in Translational Models of Load-Induced Muscle Hypertrophy. J. Appl. Physiol. 2020, 129, 516–521. [Google Scholar] [CrossRef]
  16. Terena, S.M.L.; Fernandes, K.P.S.; Bussadori, S.K.; Deana, A.M.; Mesquita-Ferrari, R.A. Systematic Review of the Synergist Muscle Ablation Model for Compensatory Hypertrophy. Rev. Assoc. Med. Bras. 2017, 63, 164–172. [Google Scholar] [CrossRef] [Green Version]
  17. Armstrong, R.B.; Marum, P.; Tullson, P.; Saubert IV, C.W. Acute Hypertrophic Response of Skeletal Muscle to Removal of Synergists. J. Appl. Physiol. 1979, 46, 835–842. [Google Scholar] [CrossRef] [PubMed]
  18. Baldwin, K.M.; Cheadle, W.G.; Martinez, O.M.; Cooke, D.A. Effect of Functional Overload on Enzyme Levels in Different Types of Skeletal Muscle. J. Appl. Phys. Resp. Environ. Exerc. Physiol. 1977, 42, 312–317. [Google Scholar] [CrossRef] [PubMed]
  19. Roy, R.R.; Meadows, I.D.; Baldwin, K.M.; Edgerton, V.R. Functional Significance of Compensatory Overloaded Rat Fast Muscle. J. Appl. Physiol. 1982, 52, 473–478. [Google Scholar] [CrossRef]
  20. Tamaki, T.; Uchiyama, S.; Nakano, S. A Weight-Lifting Exercise Model for Inducing Hypertrophy in the Hindlimb Muscles of Rats. Med. Sci. Sports Exerc. 1992, 24, 881–886. [Google Scholar] [CrossRef]
  21. Barretti, D.L.M.; Melo, S.F.S.; Oliveira, E.M.; Barauna, V.G. Resistance Training Attenuates Salt Overload-Induced Cardiac Remodeling and Diastolic Dysfunction in Normotensive Rats. Braz. J. Med. Biol. Res. 2017, 50, e6146. [Google Scholar] [CrossRef] [Green Version]
  22. Mota, M.M.; da Silva, T.L.T.B.; Fontes, M.T.; Barreto, A.S.; dos Santos Araújo, J.E.; de Oliveira, A.C.C.; Wichi, R.B.; Santos, M.R.V. Resistance Exercise Restores Endothelial Function and Reduces Blood Pressure in Type 1 Diabetic Rats. Arq. Bras. Cardiol. 2014, 103, 25–32. [Google Scholar] [CrossRef]
  23. Alves, J.P.; Nunes, R.B.; da Cunha Ferreira, D.; Stefani, G.P.; Jaenisch, R.B.; Dal Lago, P. High-Intensity Resistance Training Alone or Combined with Aerobic Training Improves Strength, Heart Function and Collagen in Rats with Heart Failure. Am. J. Transl. Res. 2017, 9, 5432–5441. [Google Scholar] [PubMed]
  24. Aguiar, A.F.; Vechetti-Júnior, I.J.; Alves De Souza, R.W.; Castan, E.P.; Milanezi-Aguiar, R.C.; Padovani, C.R.; Carvalho, R.F.; Silva, M.D.P. Myogenin, MyoD and IGF-I Regulate Muscle Mass but Not Fiber-Type Conversion during Resistance Training in Rats. Int. J. Sports Med. 2013, 34, 293–301. [Google Scholar] [CrossRef] [PubMed]
  25. Cutlip, R.G.; Baker, B.A.; Geronilla, K.B.; Mercer, R.R.; Kashon, M.L.; Miller, G.R.; Murlasits, Z.; Alway, S.E. Chronic Exposure to Stretch–Shortening Contractions Results in Skeletal Muscle Adaptation in Young Rats and Maladaptation in Old Rats. Appl. Physiol. Nutr. Metab. 2006, 31, 573–587. [Google Scholar] [CrossRef]
  26. Rader, E.P.; Layner, K.; Triscuit, A.M.; Chetlin, R.D.; Ensey, J.; Baker, B.A. Age-Dependent Muscle Adaptation after Chronic Stretch-Shortening Contractions in Rats. Aging Dis. 2016, 7, 1–13. [Google Scholar] [CrossRef] [PubMed] [Green Version]
  27. Rader, E.P.; Naimo, M.A.; Ensey, J.; Baker, B.A. High-Intensity Stretch-Shortening Contraction Training Modifies Responsivity of Skeletal Muscle in Old Male Rats. Exp. Gerontol. 2018, 104, 118–126. [Google Scholar] [CrossRef]
  28. Duncan, N.D.; Williams, D.A.; Lynch, G.S. Adaptations in Rat Skeletal Muscle Following Long-Term Resistance Exercise Training. Eur. J. Appl. Physiol. 1998, 77, 372–378. [Google Scholar] [CrossRef]
  29. Yarasheski, K.E.; Lemon, P.W.R.; Gilloteaux, J. Effect of Heavy-Resistance Exercise Training on Muscle Fiber Composition in Young Rats. J. Appl. Physiol. 1990, 69, 434–437. [Google Scholar] [CrossRef]
  30. Hornberger, T.A.; Farrar, R.P. Physiological Hypertrophy of the FHL Muscle Following 8 Weeks of Progressive Resistance Exercise in the Rat. Can. J. Appl. Physiol. 2004, 29, 16–31. [Google Scholar] [CrossRef]
  31. Jung, S.; Ahn, N.; Kim, S.; Byun, J.; Joo, Y.; Kim, S.; Jung, Y.; Park, S.; Hwang, I.; Kim, K. The Effect of Ladder-Climbing Exercise on Atrophy/Hypertrophy-Related Myokine Expression in Middle-Aged Male Wistar Rats. J. Physiol. Sci. 2015, 65, 515–521. [Google Scholar] [CrossRef]
  32. Speretta, G.F.F.; Rosante, M.C.; Duarte, F.O.; Leite, R.D.; de Souza Lino, A.D.; Andre, R.A.; de Oliviera Silvestre, J.G.; de Araujo, H.S.S.; de Oliveira Duarte, A.C.G. The Effects of Exercise Modalities on Adiposity in Obese Rats. Clinics 2012, 67, 1469–1477. [Google Scholar] [CrossRef]
  33. Silvestre, J.G.; Speretta, G.F.F.; Fabrizzi, F.; Moraes, G.; De Oliveira Duarte, A.C.G. Acute Effects of Resistance Exercise Performed on Ladder on Energy Metabolism, Stress, and Muscle Damage in Rats. Mot. Rev. Educ. Fis. 2017, 23. [Google Scholar] [CrossRef]
  34. Wong, T.S.; Booth, F.W. Protein Metabolism in Rat Tibialis Anterior Muscle after Stimulated Chronic Eccentric Exercise. J. Appl. Physiol. 1990, 69, 1718–1724. [Google Scholar] [CrossRef]
  35. Wong, T.S.; Booth, F.W. Skeletal Muscle Enlargement with Weight-Lifting Exercise by Rats. J. Appl. Physiol. 1988, 65, 950–954. [Google Scholar] [CrossRef]
  36. Baar, K.; Esser, K. Phosphorylation of P70(S6k) Correlates with Increased Skeletal Muscle Mass Following Resistance Exercise. Am. J. Physiol. Cell Physiol. 1999, 276, 120–127. [Google Scholar] [CrossRef]
  37. Hardee, J.P.; Counts, B.R.; Gao, S.; VanderVeen, B.N.; Fix, D.K.; Koh, H.J.; Carson, J.A. Inflammatory Signalling Regulates Eccentric Contraction-Induced Protein Synthesis in Cachectic Skeletal Muscle. J. Cachexia Sarcopenia Muscle 2018, 9, 369–383. [Google Scholar] [CrossRef]
  38. Ogasawara, R.; Kobayashi, K.; Tsutaki, A.; Lee, K.; Abe, T.; Fujita, S.; Nakazato, K.; Ishii, N. MTOR Signaling Response to Resistance Exercise Is Altered by Chronic Resistance Training and Detraining in Skeletal Muscle. J. Appl. Physiol. 2013, 114, 934–940. [Google Scholar] [CrossRef] [Green Version]
  39. Ambrosio, F.; Kelley Fitzgerald, G.; Ferrari, R.; Distefano, G.; Carvell, G. A Murine Model of Muscle Training by Neuromuscular Electrical Stimulation. J. Vis. Exp. 2012, 63, e3914. [Google Scholar] [CrossRef] [Green Version]
  40. Brown, M.D.; Cotter, M.A.; Hudlická, O.; Vrbová, G. The Effects of Different Patterns of Muscle Activity on Capillary Density, Mechanical Properties and Structure of Slow and Fast Rabbit Muscles. Pflüg. Arch. Eur. J. Physiol. 1976, 361, 241–250. [Google Scholar] [CrossRef]
  41. Liu, F.; Fry, C.S.; Mula, J.; Jackson, J.R.; Lee, J.D.; Peterson, C.A.; Yang, L. Automated Fiber-Type-Specific Cross-Sectional Area Assessment and Myonuclei Counting in Skeletal Muscle. J. Appl. Physiol. 2013, 115, 1714–1724. [Google Scholar] [CrossRef] [PubMed] [Green Version]
  42. Silva, W.J.; Graça, F.A.; Cruz, A.; Silvestre, J.G.; Labeit, S.; Miyabara, E.H.; Yan, C.Y.I.; Wang, D.Z.; Moriscot, A.S. MiR-29c Improves Skeletal Muscle Mass and Function throughout Myocyte Proliferation and Differentiation and by Repressing Atrophy-Related Genes. Acta Physiol. 2019, 226, e13278. [Google Scholar] [CrossRef] [PubMed]
  43. Distefano, G.; Ferrari, R.J.; Weiss, C.; Deasy, B.M.; Boninger, M.L.; Fitzgerald, G.K.; Huard, J.; Ambrosio, F. Neuromuscular Electrical Stimulation as a Method to Maximize the Beneficial Effects of Muscle Stem Cells Transplanted into Dystrophic Skeletal Muscle. PLoS ONE 2013, 8, e54922. [Google Scholar] [CrossRef] [PubMed] [Green Version]
  44. Roche, J.A.; Tulapurkar, M.E.; Mueller, A.L.; van Rooijen, N.; Hasday, J.D.; Lovering, R.M.; Bloch, R.J. Myofiber Damage Precedes Macrophage Infiltration after in Vivo Injury in Dysferlin-Deficient A/J Mouse Skeletal Muscle. Am. J. Pathol. 2015, 185, 1686–1698. [Google Scholar] [CrossRef] [PubMed]
Figure 1. Morphometric and myonuclei counting analyses after one and two weeks of electrical stimulation are depicted. (A,B) are representative photomicrographs of dystrophin (green) immunofluorescence (DAPI in blue, used to identify nuclei) in TA muscle after one and two weeks of electrical stimulation, respectively (50 μm scale bar). (C) Mean fiber cross-sectional area of the TA muscle following one and two weeks of electrical stimulation (n = 5). (D) Distribution of fiber cross-sectional area after one and two weeks of electrical stimulation (n = 5). (E) TA muscle mass analysis after one and two weeks of electrical stimulation (n = 5). (F) Quantity of myonuclei per fiber following electrical stimulation for one and two weeks. (G) Percentage of fibers containing centralized nuclei following electrical stimulation for one and two weeks. The data were displayed as mean ± SEM. Two-way ANOVA was followed by Tukey’s post-test in the statistical analysis. Three independent experiments were conducted. * p < 0.05 versus control and # p < 0.05 versus ES1.
Applsci 12 07673 g001
Figure 2. Representative immunofluorescence micrographs of IgG-positive (red), dystrophin (green), and DAPI (blue) after one (ES1, n = 5) and two (ES2, n = 5) weeks of electrical stimulation and 4 days after cardiotoxin injection (CTX 4D, n = 4) compared to control (CTR, n = 5). Scale bar: 50 µm.
Applsci 12 07673 g002
Figure 3. Analysis of muscle function in vivo following one and two weeks of electrical stimulation. (AC) After one week of electrical stimulation, the maximal tetanic force, specific force, and absolute force were analyzed, respectively. (DF) After two weeks of electrical stimulation, the maximal tetanic force (100 Hz), specific force, and absolute force were measured, respectively. The data were presented as mean ± SEM. In the statistical analysis, an unpaired t-test and a Mann-Whitney test were employed (n = 6). * p < 0.05 vs. respective control.
Applsci 12 07673 g003
Figure 4. Analysis of Pax-7 positive cell counts after one and two weeks of electrical stimulation. (A,B) Representative immunofluorescence micrographs of DAPI (blue, used to identify nuclei), Pax-7 (violet), and Laminin (yellow) after one and two weeks, respectively, of electrical stimulation (20 µm scale bar). (C) The number of positive Pax-7 nuclei per 100 fibers after one and two weeks, respectively, of electrical stimulation (n = 5 per group). The arrows indicate Pax-7 positive cell. The data are presented as mean ± SD. Two-way ANOVA was followed by Tukey’s post-test in the statistical analysis. * p < 0.0001 in comparison to the relevant control group throughout time.
Applsci 12 07673 g004
Figure 5. Analysis of MyoD positive cell counts after one and two weeks of electrical stimulation. (A,B) Representative immunofluorescence micrographs of DAPI (blue, used to identify nuclei), MyoD (violet), and Laminin (yellow) after one and two weeks, respectively, of electrical stimulation (20 µm scale bar). (C) The number of positive MyoD nuclei per 100 fibers after one and two weeks, respectively, of electrical stimulation (n = 5 per group). The arrows indicate MyoD positive cell. The data are presented as mean ± SD. Two-way ANOVA was followed by Tukey’s post-test in the statistical analysis. * p < 0.05 in comparison to the relevant control group throughout time and # p < 0.05 vs. one week of training.
Applsci 12 07673 g005
Figure 6. Phosphorylation and total protein implicated in AKT/mTOR signaling following two weeks of electrical stimulation. (A) representative band patterns of AKT-mTOR elements after electrical stimulation for two weeks. AKT (BD), mTOR (EG), P70 (HJ), and EIF4E (KM) bands were analyzed by densitometry (n = 5 per group). The data are presented mean ± SD. In the statistical analysis, an unpaired t-test and a Mann-Whitney test were employed. * p < 0.05 vs. control group.
Applsci 12 07673 g006
Publisher’s Note: MDPI stays neutral with regard to jurisdictional claims in published maps and institutional affiliations.

