
Ecosystem Services: A Systematic Literature Review and Future Dimension in Freshwater Ecosystems


Manipal School of Architecture and Planning, Manipal Academy of Higher Education, Manipal 576104, Karnataka, India
*
Author to whom correspondence should be addressed.
Appl. Sci. 2022, 12(17), 8518; https://0-doi-org.brum.beds.ac.uk/10.3390/app12178518
Submission received: 11 June 2022
/
Revised: 29 July 2022
/
Accepted: 11 August 2022
/
Published: 25 August 2022
(This article belongs to the Special Issue Water Quality Modelling, Monitoring and Mitigation)
Abstract
:Ecosystem services are part and parcel of human lives. It is of paramount importance to understand the interaction between these ecosystem services, as they are directly related to human life. In the modern era, quantification of ecosystem services (ES) is playing an important role in the proper understanding and efficient management of social–ecological systems. Even though a significant amount of literature is available to present on the topic, there is a need to build an adequate amount of knowledge repository. Hence, a systematic literature review method is used, in which research question and searching stages are defined. This review study is conducted on ecosystem services and remote-sensing-related keywords in the Scopus database. After a systematic analysis of the papers retrieved from the Elsevier, Scopus database, MDPI, and open source, a total of 140 primary articles were categorized according to their relationship with other ecosystem services, land use, land cover, and planning management. Major issue findings and important aspects have been analyzed and reported in each category. With this analysis and developments in the existing literature, we have potential areas for future research. Findings pointed out that regional or local-level ecosystem services-related work is immensely important, and a hotspot of current research aiming to understand the variability and spatiotemporal dynamics in terrestrial and aquatic ecosystems.
1. Introduction
The biophysical state of the ecosystem is affected by multiple elements and, simultaneously, by humans’ ability to enjoy its services [1]. Furthermore, Anthropogenic and non-anthropogenic interventions can change the biochemical cycles and earth’s energy equilibrium, in turn causing global warming, and future climate changes [2]. On the other hand, rapid urbanization degrades ecosystem services [1,3]. Gretchen, in his work, points out that the lifestyle of the people may be hampering the prosperity of ecological biodiversity at the expense of their descendants [4,5]. Talking about ecological biodiversity, the term ecosystem services is described by many authors as the process that helps to sustain human life, with the help of interaction between the natural ecosystem and the species [4,6]. Globally, human systems are supported by nature’s contribution, i.e., ecosystem services, and [7,8] state that land use and land cover changes (LULC) induced by humans have increased over the last three decades, leading to changes from a natural setting to human-conquered land. Furthermore, according to Gómez-Baggethun & Barton [9] more than 50% of the world’s inhabitants reside in urban areas and potentially receive benefits from the ecosystem services; the future projection of people living in urban areas is calculated to reach 66% by 2050. The main motive for this research is to find a way to conserve the existing ecosystem, with a background of arising global environmental issues.
Ecosystem Services
Ecosystem services (ES) are defined as the benefits people obtain from nature [1,4,6]. ES connects human well-being and natural systems to ecological and economic development to lay a platform between nature and society [10]. Land use and land cover changes increase the population rate and have a huge impact on ES, which is leading to its degradation [11,12,13,14,15,16]. Therefore, evaluation of ES has been the core subject of research in the academic section for years [17,18], and the recent past interventions also show the readiness of the study to inform policymakers in undertaking essential decisions in the policy making process along, with the integration of ecology, geography, and economy [19]. In the study [20], the authors put forward that the authenticity of the ecosystem cannot be based on human intervention alone; the same is considered authentic when the researcher considers both pristine and altered forms of the ecosystem, therefore understanding the change in fundamental characteristics of the ecosystem.
ES plays a vital part in constituting the well-being of an individual’s life through security provision, meeting the basic needs for day-to-day life along with health and good social relationships with each other. Urban ecosystems are still a critical area of ES research, as half of the world’s population dwells in urban areas. According to MEA, around 60% of global ES has been threatened or used inappropriately, and the same process is expected to continue essentially in the first half of the present century [1]. For this reason, recently, ES is significantly considered one of the vital aspects of land use planning and ecological environmental planning and management [19,20,21,22,23,24,25,26,27,28,29,30,31,32].
The interaction between the ESs can take place in two ways. The first is trade-offs, where an increase in the effect of one of the ES results in a decreased effect in other ES. The second is synergies, where the increase in the effect of one ES also leads to the increased effect of other ES [23,24]. When these relationships occur again across space and time, they are called ES bundles [25]. Understanding this relationship is rather critical, as it focuses on the relationship between ES by concentrating on inherent bundles rather than on discrete ES [26,27,28]. Studies by Bennett et al. say that the trade-offs and the synergies are caused by the interaction among various ecosystems, so the ecosystem services cannot be considered independent [29]. Braat & de Groot infer that the study of various ES is complex [30].
Ecosystems can be monitored at different levels; they can be studied at a global scale or regional scale, or local scale. Global-level studies are carried out worldwide, but researchers suggest studying the services at the local level, which gives us a better understanding of the situation, helping us to take up appropriate mitigation strategies at a regional level. This helps us achieve sustainable goals at the global level [28]. Although research studies by a wide range of scholars have shed light on the interaction of various ecosystem services in recent years, the amalgamation of our existing knowledge repository and gaps is still inadequate [31].
Various other frameworks emerged in the recent past for ES studies [33]. To account for the natural capital, Common International Classification of Ecosystem Services (CICES) integrates different criteria of various ESs. Closely capturing concepts that relate to nature’s contribution to humans is the framework developed by Inter-governmental Science-Policy Platform on Biodiversity and Ecosystem Services (IPBES). To understand ES, Ref. [1] came up with a base framework for global ES study; therefore, ES can be classified into four categories: (i) provisioning ecosystem services, (ii) regulating ecosystem services, (iii) cultural ecosystem services, and (iv) supporting ecosystem services.
Provisioning ecosystem services (PES) are defined as the goods that can be directly extracted from nature and consumed, which have a certain market value. Examples of provisioning ecosystem services are water, food, wood, biofuels, etc. Stating the same, for the freshwater supply ecosystem service, it is necessary to have an ecosystem that is functioning in a good way [34]. Climatic factors such as precipitation, evaporation, and climate variability are the important components that control the water yield of the region [34]. Water yield has positive linkage between evapotranspiration and soil conservation [35], along with other components such as food production, timber, etc.
Regulating ecosystem services (RES) can be defined as the benefits that are drawn from the process of the ecosystem that modifies the condition that we are presently experiencing. Examples of the same will be climate changes, carbon storage, soil fertility, floods, etc. [29]. The study emphasizes the relationship in terms of trade-offs and/or synergies of regulating ecosystem with other ESs, due to which regulating ESs can be considered as one of the critical parameters for the assessment of ecological resilience [35]. Managing one ES parameter will improve synergies among other ES parameters, especially among carbon storage, low flow, biodiversity, etc. [36]. Carbon (C) storage is a key attribute in regulating the global service of climate regulation [9]. Practical implementation of C sequestration knowledge will take a back step in public policymaking due to the lack of effectiveness in translating scientific criteria [37]. Carbon sequestration acts as an important parameter in global climatic regulation [33]. Carbon is stored in four different layers in nature, i.e., aboveground biomass, belowground biomass, soil organic carbon, and dead matter storage. As carbon is stored (~70%) in the terrestrial ecosystem [38,39,40], its carbon dynamics potential could be affected in the future under rising carbon dioxide. Therefore, the carbon present in the soil considerably has a huge impact on the spatial and non-spatial data. Hence, long-and-medium term modeling taking into consideration of different LULC scenarios is the hotspot of current research, which helps policymakers with the mitigation strategies framework and decision-making process. This process can be re-scaled globally, regionally, and locally by co-relating different rationales to economic opportunities and regulatory policymaking.
Gómez-Baggethun et al. [41] introduced cultural ecosystem services (CES), but MEA studied and defined them as “the non-material or intangible benefits people obtain from the ecosystem either spiritually, through cognitive development, recreation, self-reflection or through experiencing aesthetically” [1]. In this ES, some of the services, such as recreations, have market value, whereas other services do not have the same. Functions fulfilling life information functionality are the different ways in which cultural ecosystems are included in the study [4,6,42]. Additionally, Sen & Guchhait simplify the definition by correlating humans’ sociocultural practices with psychological development [43]. CES is also associated with the intangible benefits that people attain from nature due to the interaction [44,45]. Most of the studies on cultural ecosystem services deal with recreation services that are nature based and aesthetic [46], whereas not a great amount of study hqw been carried out on the spiritual value of landscape due to the limitation of modeling [47]. Supporting ecosystem services (SES) are the fundamental process of the ecosystem that supports life, such as photosynthesis, nutrient cycle, and evolution; this is a vital service that the ecosystem provides, which allows the rest of the ecosystem services to be delivered.
To achieve sustainable development of the city and conserve the ecosystem, it is necessary to understand each of the abovementioned ecosystem services and their interactions with the changing LULC [48]. This study can help provide future research perspectives and proper decision-making strategies. To offer the same, a literature review for each of the ecosystem services was carried out, providing a global perspective first and then elaborating on the studies conducted at the national level. It will provide an overview of the models and methods that are used for the quantitative study of ecosystem services in the limelight. The publications used various methods of quantitative assessments, such as spatial mapping, economic valuation, etc. Therefore, the main objective of our paper is to understand; (i) the global scenario of ES, (ii) where does ES study in India fall? (iii) what are the research gaps that could be studied, and a way forward in the same area.
2. Materials and Methods
2.1. Data Collection
The literature survey was carried out in November 2021, and data were collected from Science Direct, Scopus, MDPI, official reports, and Wiley. The main strategies of the basic literature review contained four different phases. First, to understand the total number of publications present, we used the keyword “Ecosystem services” to understand the pattern of the study on a yearly basis. Second, to understand works on different types of Ecosystem services, we used the keywords “Ecosystem services and Provisioning Ecosystem services”. In the next search, using keywords “Ecosystem services and Regulating Ecosystem services”, similarly, the search was carried out for cultural ES and supporting ES and their trend of publication for two decades. This was followed by the search to understand the types of models used to study ES, and also to figure out the types of models catering to ES. Additionally, a search was carried out to understand the trends of individual models serving various parameters of ES. Finally, the investigation was carried out to understand the ES publication in the Indian context using the search keyword “Ecosystem services and India”.
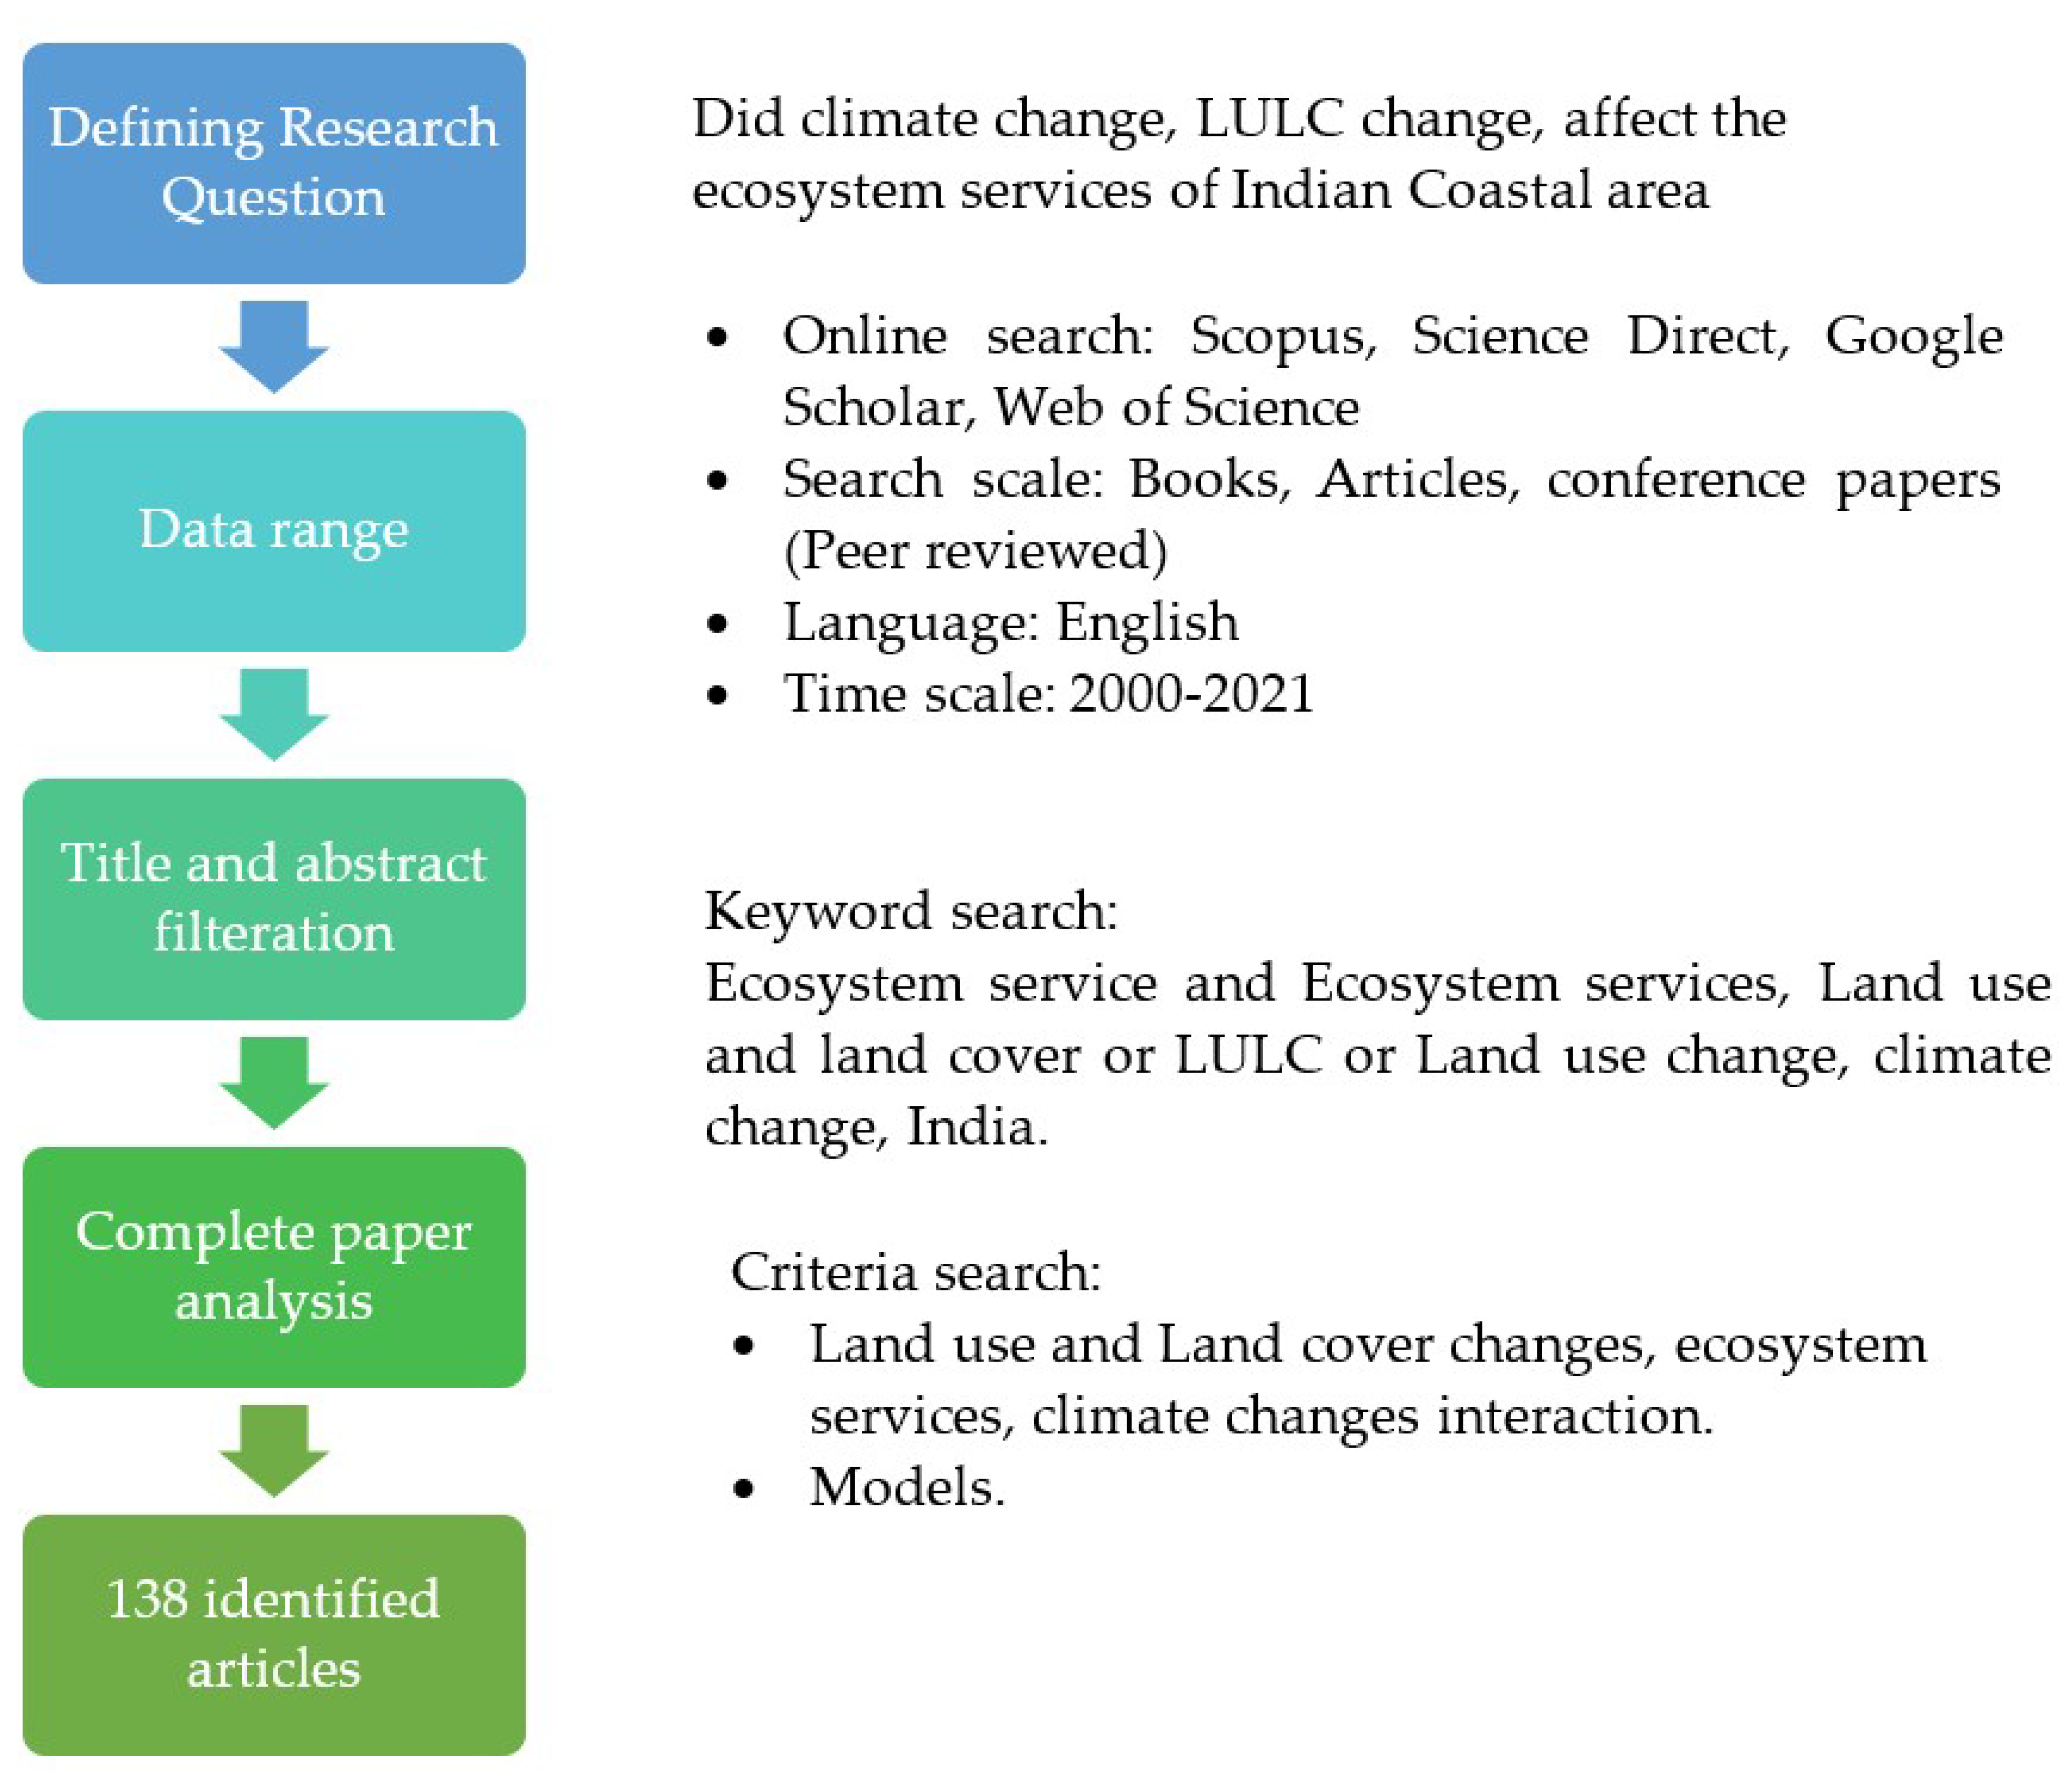
After collection of the records, the initial step of analysis took place at various levels. The first step of the selection criteria was to select the papers which spoke about ES throughout the world. This was followed by the data range strategy of selection, wherein the collected data were segregated based on types of publication. In this step, most of the journal articles were selected over the books or conference papers, as the articles are periodical, and there was a high chance of understanding the current trend of publication. Books and conference proceedings were negated. The step was followed by the title and abstract search, wherein the non-related articles were negated after going through the article abstracts and title. This was followed by the criteria search, which considered the related variables of the study. As a result of this, 138 articles were extracted for this review. The assessment parameters for this review are based on the ecosystem services approach and include the date of publication, the context of the publications, the kind of data used/analyzed (qualitative or quantitative), as well as the spatial size of the study. Table 1 gives an insight into the criteria considered for the study.
2.2. Data Analysis
The data analysis consisted the database of search records that was built from the data collection process. The study can be considered susceptible given the huge amount of data resent in the database. To avoid arbitrary comments, a systematic review was carried out on 140 selected papers that dug deeper to understand the knowledge base of the subject, which excluded book chapters, student theses, and reports. Regardless, the search output is considered authenticated and peer reviewed, as it was taken from the distinguished journal article database. The data were taken as a basis for future study (Figure 1).
3. Results
3.1. Mapping of Publication
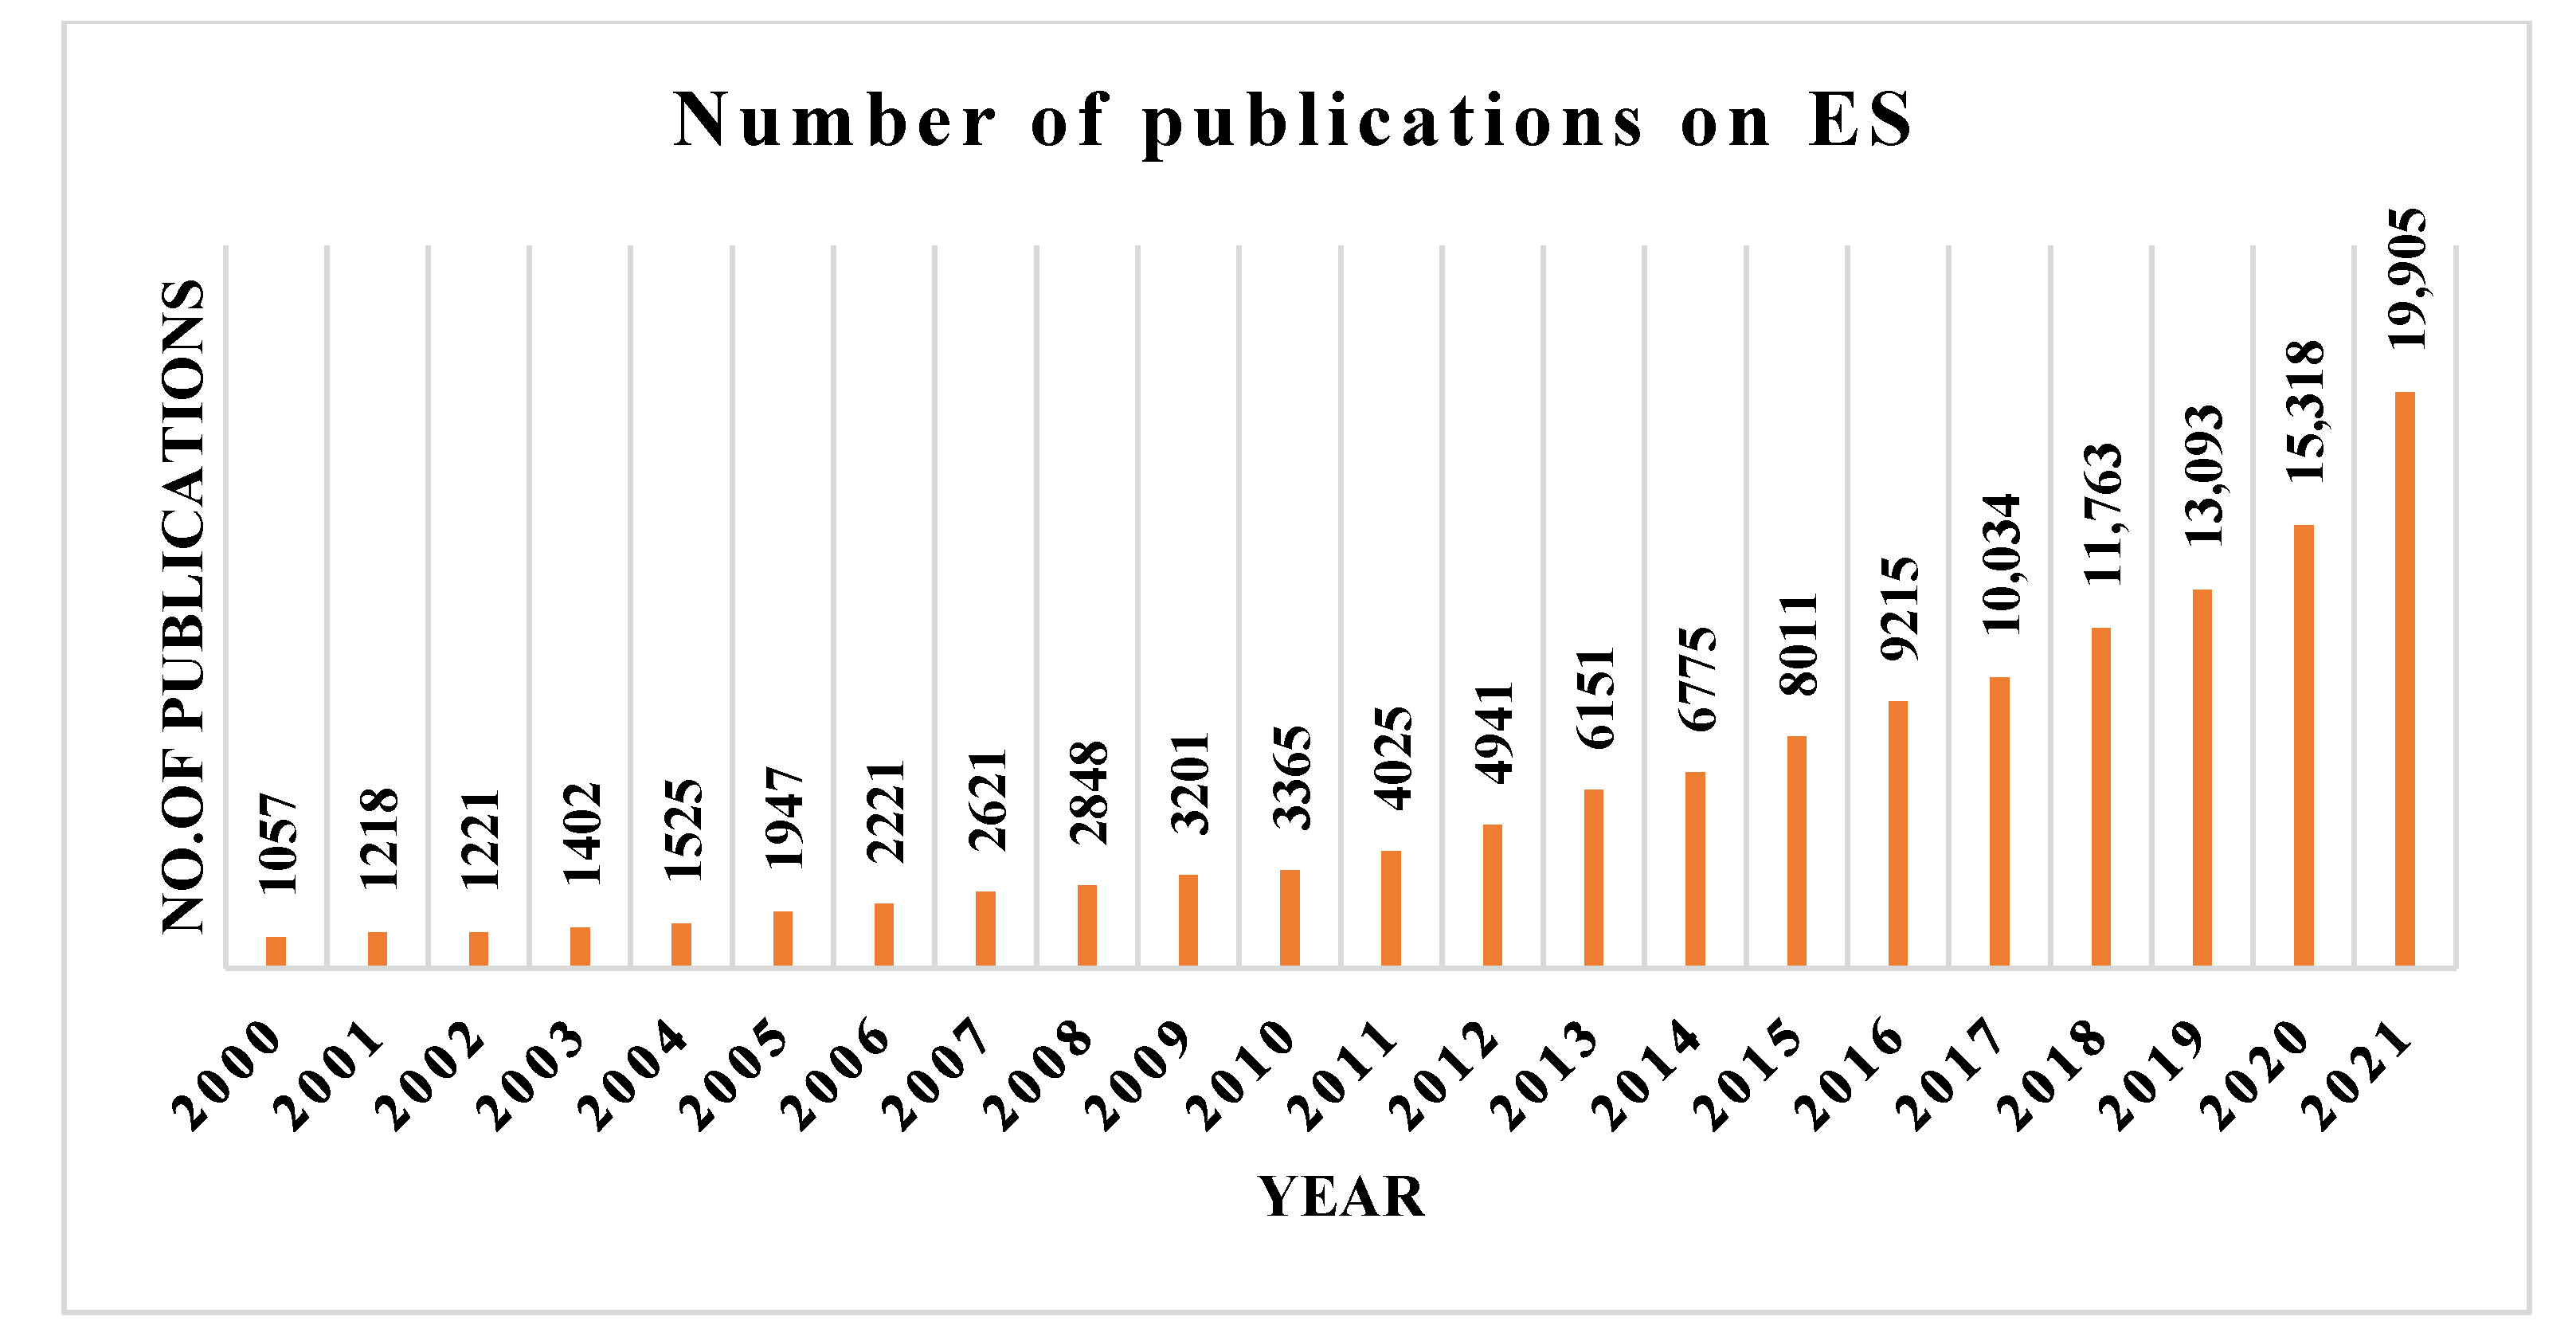
Research publications until early 2000 were fewer in number (Figure 2). The reason was unfamiliarity with the subject; later, the work changed the whole lens on how the ecosystem was viewed [4,6]. From 2000 to 2005, we can find approximately two thousand papers on ecosystem services (Figure 2). Later, once the MEA [1] was published, we found a sudden rise in the graph, which denotes that universal attention was attained by ecosystem service research. Later on, it became one of the core research areas among academicians and scholars. From the years 2005 to 2010, we found publications that provided an insight into the trade-off and synergies among the ecosystem services. Following MEA, in 2010, TEEB [46] came up with a newer lens of added economic value to the ES. In 2011, CICES [49] gave common ground for all international works related to ecosystem services. Post-2015 marks a prolific change in the number of publications on ecosystem services, with the publication of the Sustainable Development Goals (SDG) 2030. These are aimed at making cities locally and globally sustainable due to the change in global climatic aspects.
3.2. Chronological Publication on ES Papers
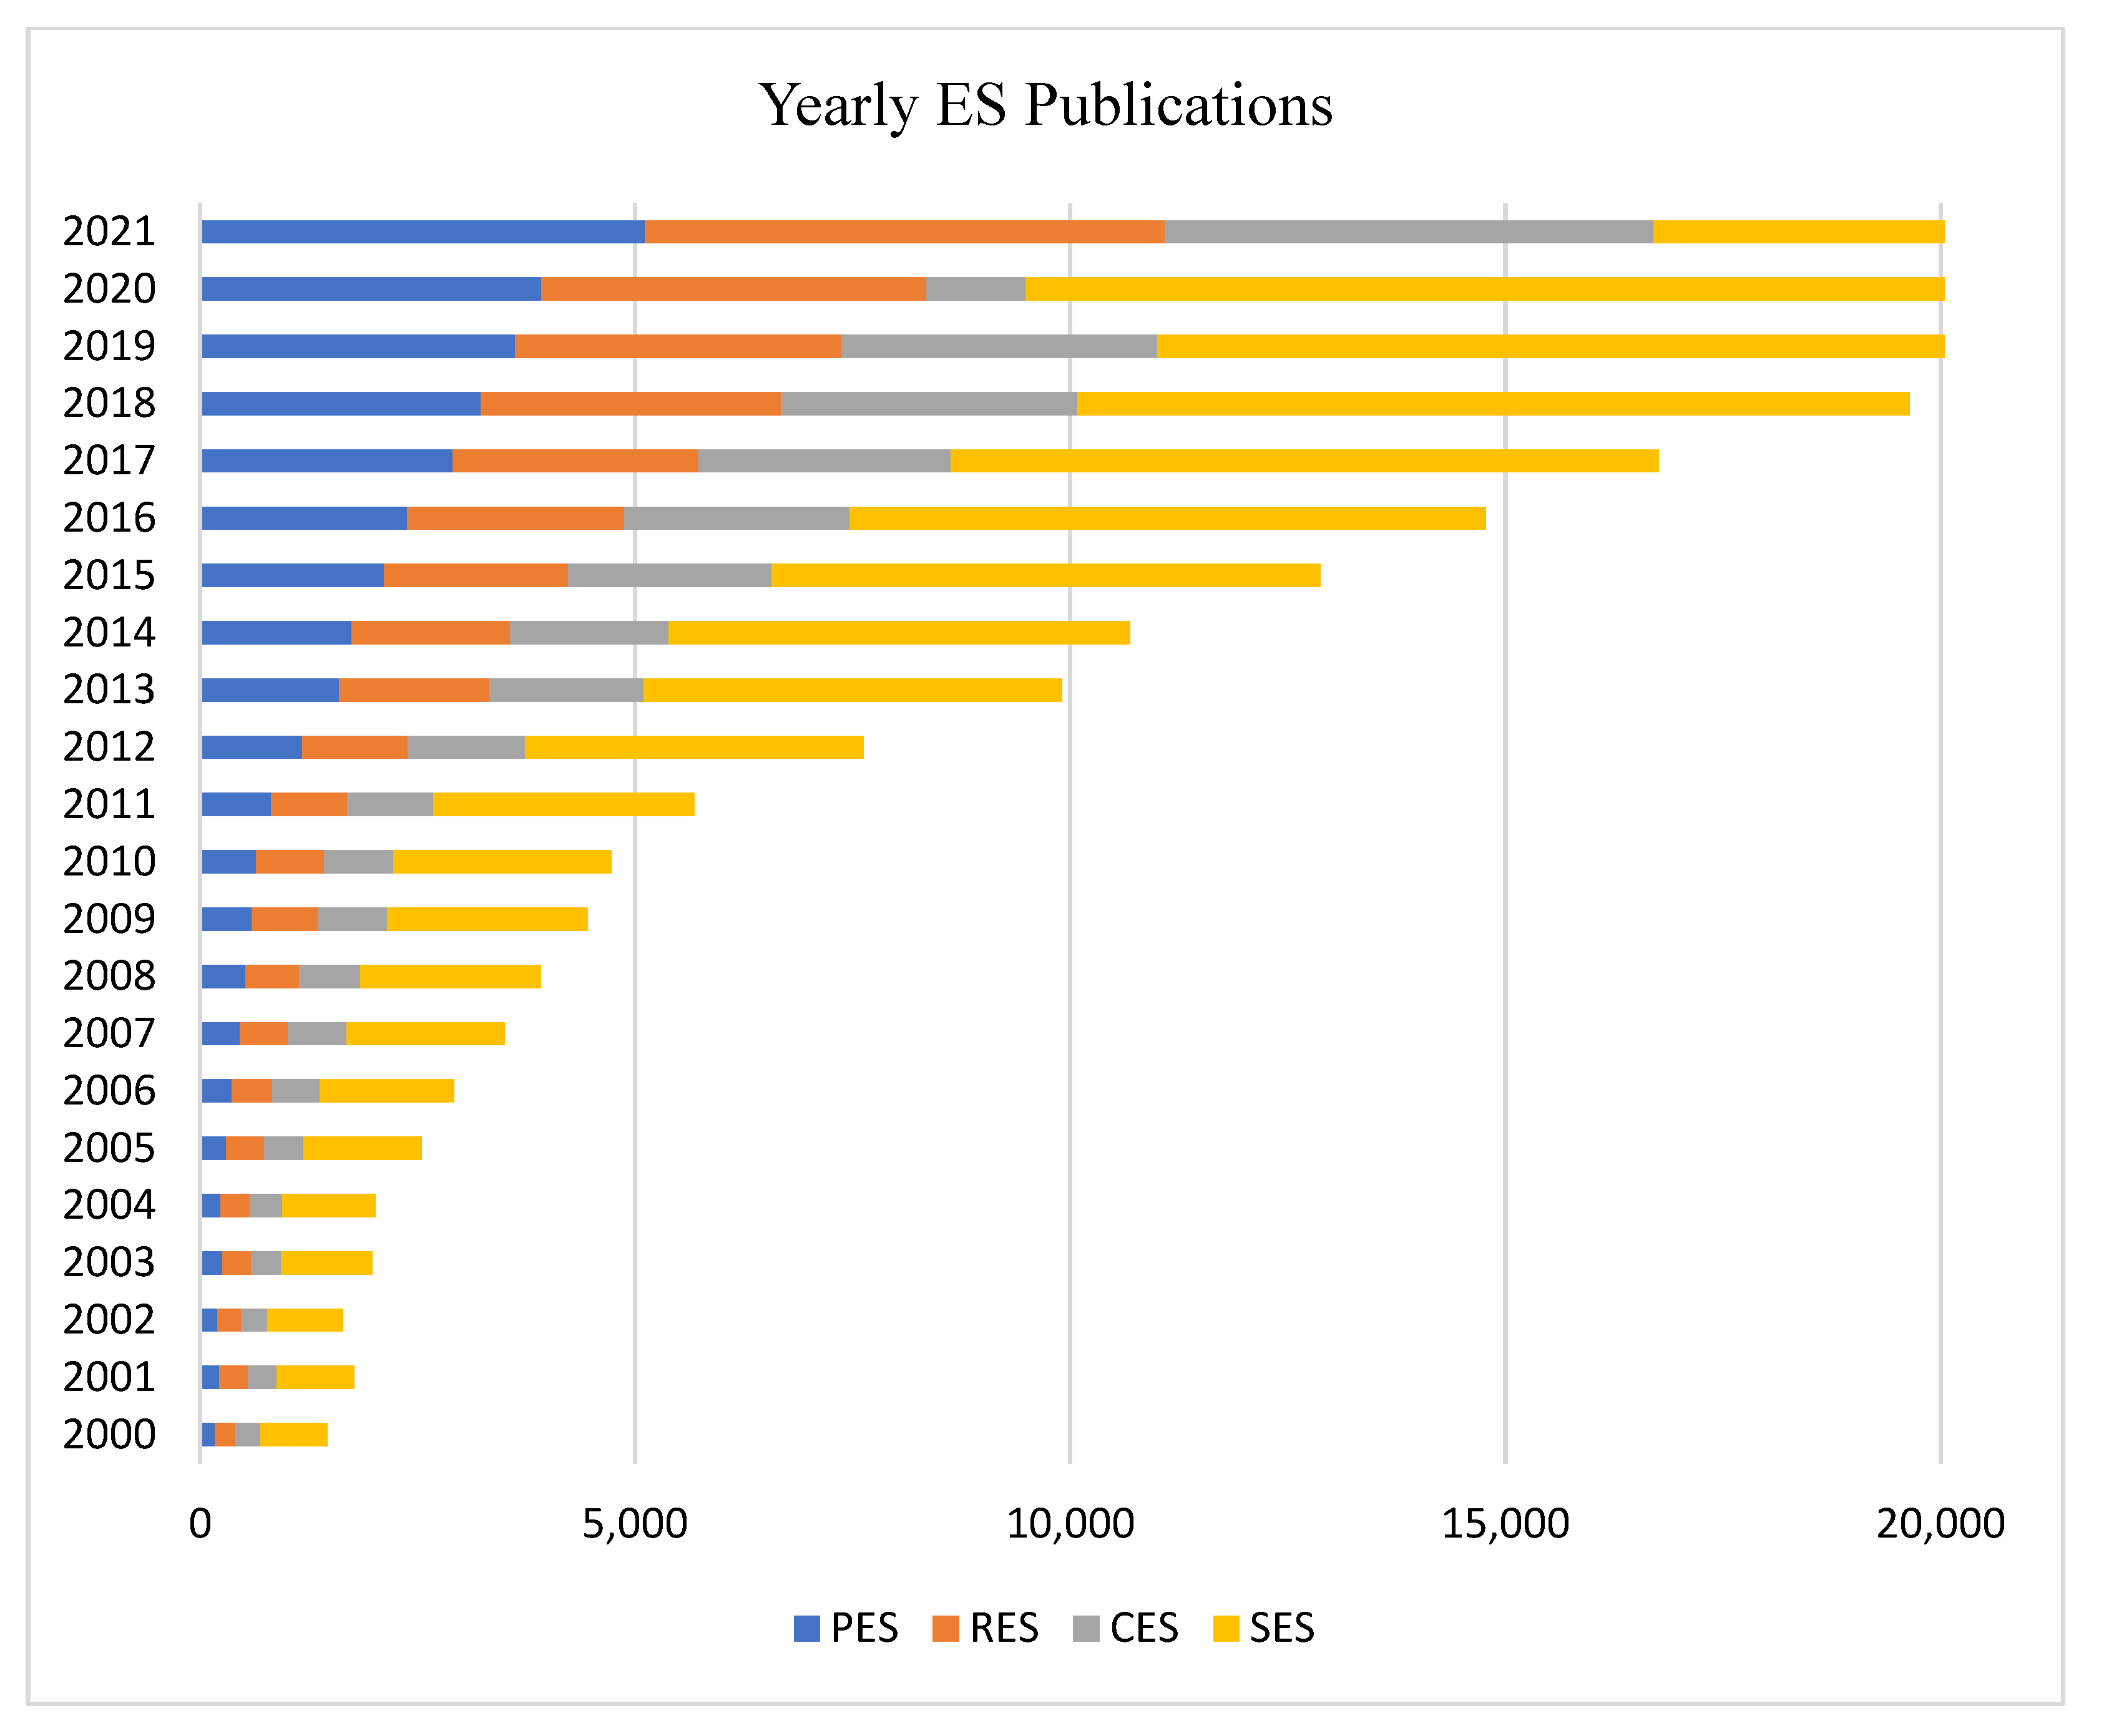
Ecosystem services papers published between the years 2000 and 2005 show that awareness of the subject was limited, wherein a critical understanding of the same was not present (Figure 3). Post MEA, the publications on the ecosystem services increased; today, we find 20,000 publications based on ESs (Figure 3). Sustainable development goals gave the necessary push required for the study and to make the cities more sustainable. MEA formed the ecosystem framework, along with four major categories.
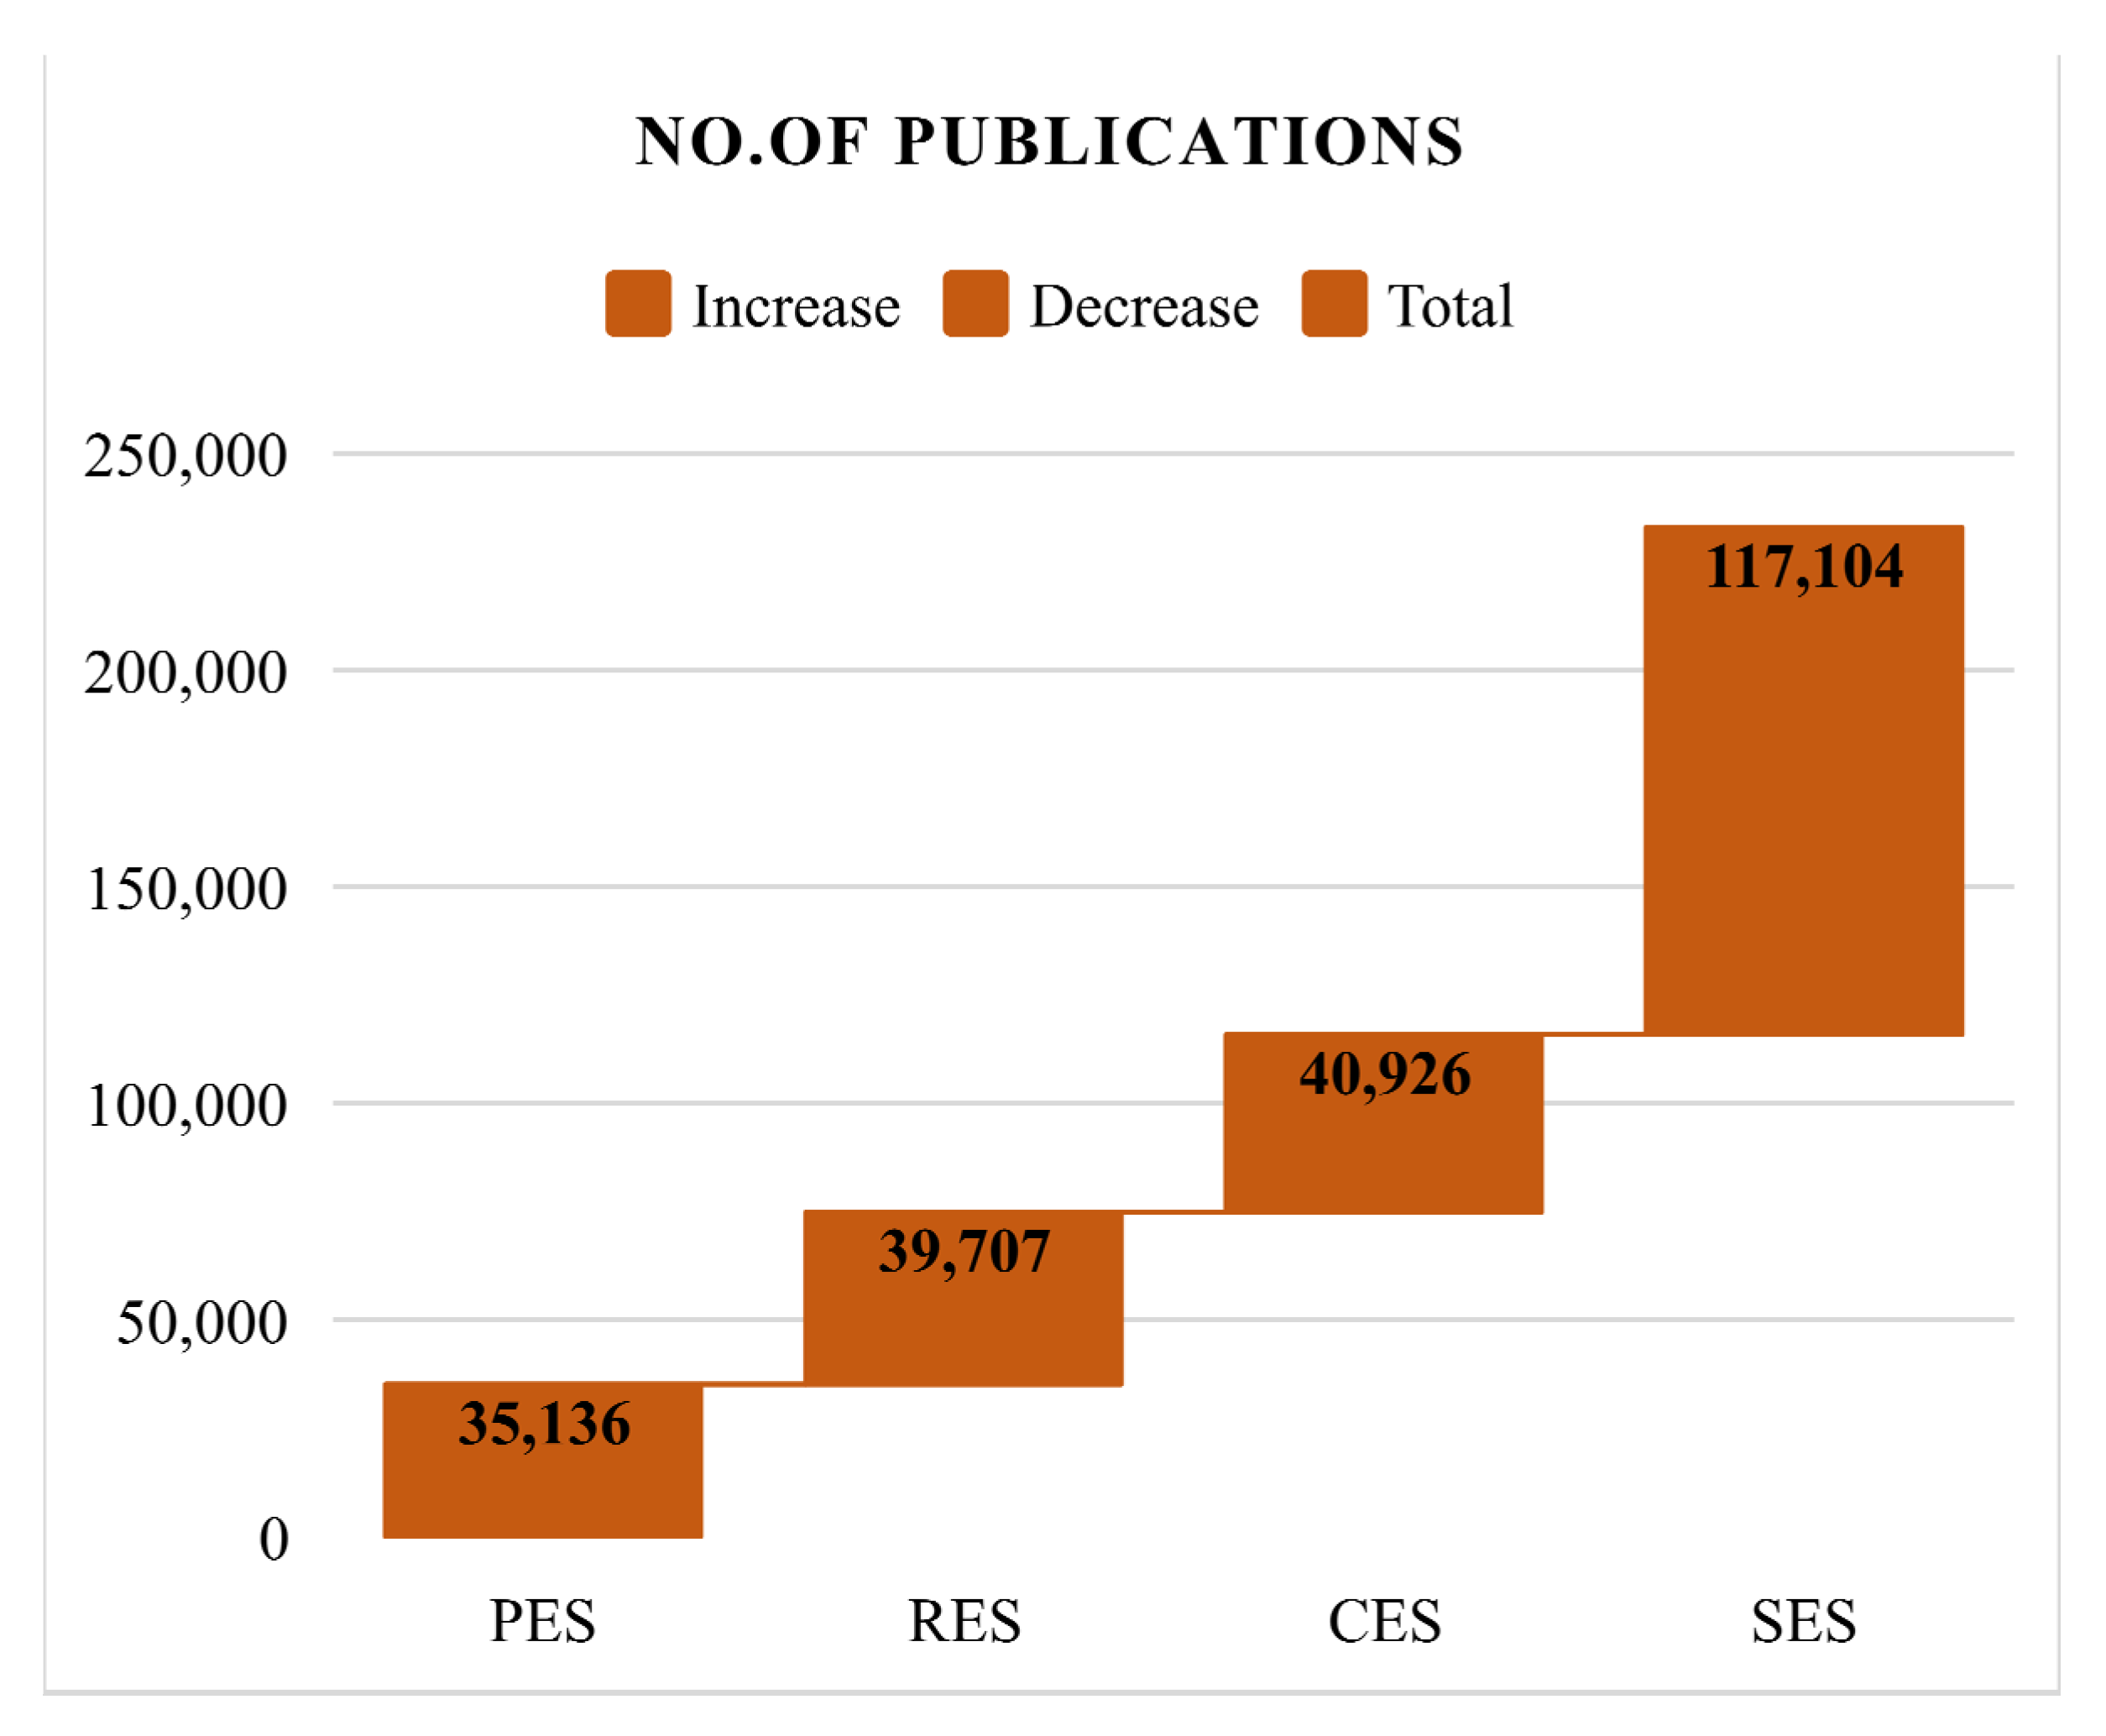
The number of papers was classified into four ES categories (Figure 4). Sixteen percent of the papers discuss provisioning ecosystem services, basically focusing on agricultural products, freshwater bodies, food, etc. (Figure 3). The publication trend of PES is gradually increasing day by day and is more focused on the water and agriculture-related aspect, as it has a significant role to play in every human life today. Regulating ES has 17% of paper publications, mainly focusing on the vital aspects of the present-day scenario, i.e., climatic changes, carbon sequestration, floods, soil erosion, etc. The publication trend of RES falls in line with the provisioning ecosystem, as we find trade-offs and synergies among the ESs [29], so it is important to study critical aspects on the same basis (Figure 4).
3.3. Models Used to Access Ecosystem Services
Modeling of the ES helps the researcher to quantify, spatially locate, and potentially evaluate the economic trends. Daily et al. [19] point out that this information plays a vital role in the decision making of urban planners, urban designers, and policymakers attempting to understand the effect of urban expansion on ES. In the present scenario, there is a proliferation of models and tools that helps us to map and access ES and vice versa [42,50,51].
Over time, numerous studies tried to simultaneously understand land use changes and their impact on ES, which helped designers and policymakers take appropriate steps to overcome the issue. To monitor LULC changes and ES changes, satellite images have been globally used as the most accurate tool [52,53]. Models are used to investigate the interactions (such as a trade-off, synergies, bundles/clusters, and flows) of ES, and deliberately put forward benefits that are enjoyed by humans for their well-being [54,55,56]. There is much importance given to enhancing ecosystem service management by objectively quantifying interactions among various ES [57].
Integrated Valuation of Environmental Services and Trade-offs (InVEST) is a globally accepted tool that was developed inside the Natural Capital Project [50,54,55,56,57,58,59]. The InVEST model can illustrate a spatially visualized map of the ESs. Comparing the InVEST model with other models, InVEST does not require any expertise; this model provides a nearly accurate assessment with limited demand of data input criteria, and is relevant in understanding the areas dealing with ecological processes [50,51,60]. InVEST model is a useful tool for assessing small-scale and local studies which give relevant and credible results for LULC and ES [58]. The InVEST toolbox is used to determine nearly 14 ES for supply changes using user-defined base setups like land use land cover and climatic changes [61,62].
The Soil and Water Assessment Tool (SWAT) is considered universally to simulate hydrological processes [63]. Further, the model has the flexibility in a spatial discretization that evaluates the space, locally, regionally, and globally. Like this, a decent number of models are used to assess ES changes; some of them are ARIES, LUCI, CA- Markov, SLEUTH, CLUES, etc.
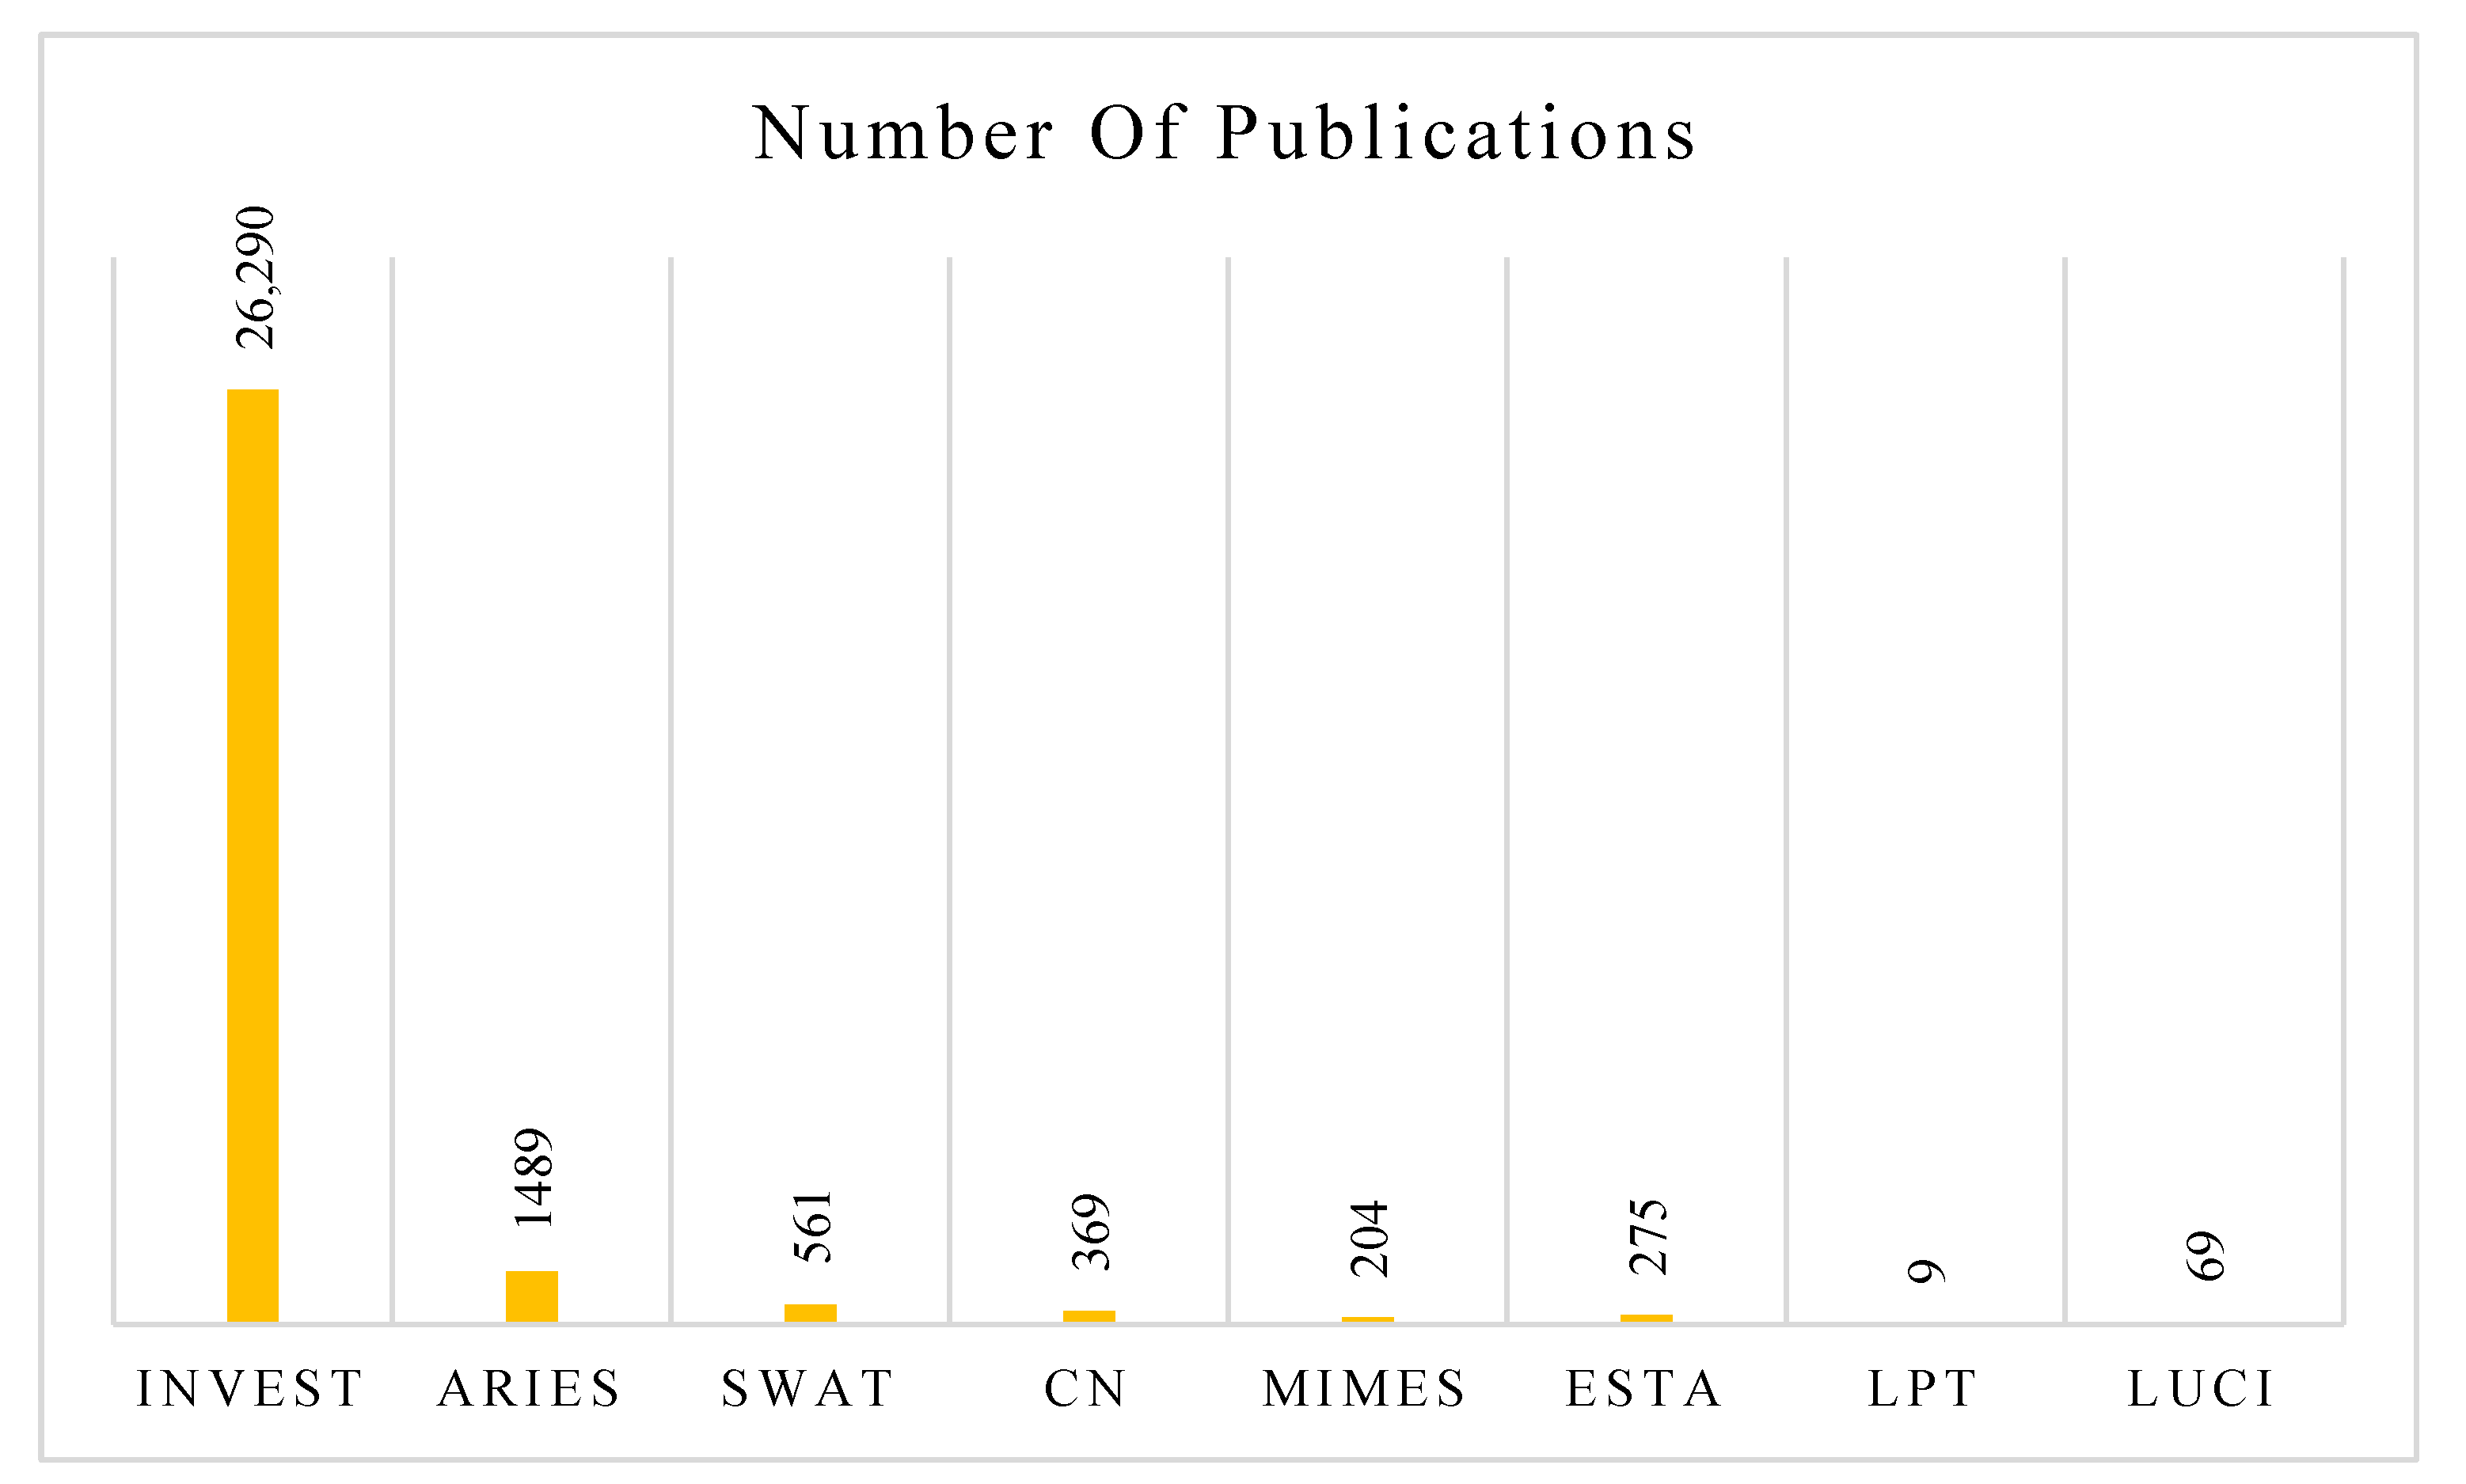
The study of ecosystem services is performed quantitatively using mapping and modeling techniques. Researchers also have used a combination of models to assess ES, such as a combination of model mapping ES (such as InVEST, SWAT, ARIES) and model mapping urban expansion. With the help of the statistical model, the mapping was carried out. Urban expansion models such as LUSD–urban (Land Use Scenario Dynamics–urban) [64] help in a multi-scale simulation of urban expansion, LUSD–urban along with Cellular Automata (CA) and system dynamics models signifies micro-scale evolutionary factors and macro-scale resource constraints. This model has undergone certain iterations in recent years, with improved accuracy and an average kappa index [65]. The other models are SLEUTH (slope, land use, exclusion, urban extent, transportation, and hill shade) [66], CLUE-S (the Conversion of Land Use and its Effects at Small regional extent) [67]. Statistical models such as correlation analysis [13,68], regression analysis [28], and root mean square deviation were used [69]. This combination of models is efficient at forming the correlation among a few variables but is not considered to be functionally viable. The most celebrated models are InVEST, ARIES, and SWAT. ]. Figure 5 gives a brief idea of various models used by researchers.
The most commonly used base data are LULC, soil data, terrain data, and hydrological data. This gives a whole picture of different criteria such as habitats, soil types, vegetation class, and biomes. According to Metzger et al., the above data are used as ecosystem services indicators [70]. Adding on the same data can be used for valuation and spatial estimation of ecosystem services [71]; the other types of data used for ES assessment are census data; climatic data such as precipitation data, which is used for water yield assessment; and a digital elevation model (DEM); this is used for hydrology assessment [72].
The models used to access ESs spatiotemporally are InVEST [60], SWAT [61], ARIES (Artificial Intelligence for Ecosystem Services) [73], LUCI, etc. According to the publication trend from 2000 till 2021, we find the InVEST model is being used extensively due to its input data criteria; it uses open source data that are freely available, with a mapping/modeling scale of 30 m × 30 m. This model helps us to access multiple ecosystem services, (water quality, soil erosion, carbon sequestration, biodiversity conservation, nutrients, agricultural produce, etc.) [72].
3.4. World ES Publication Status
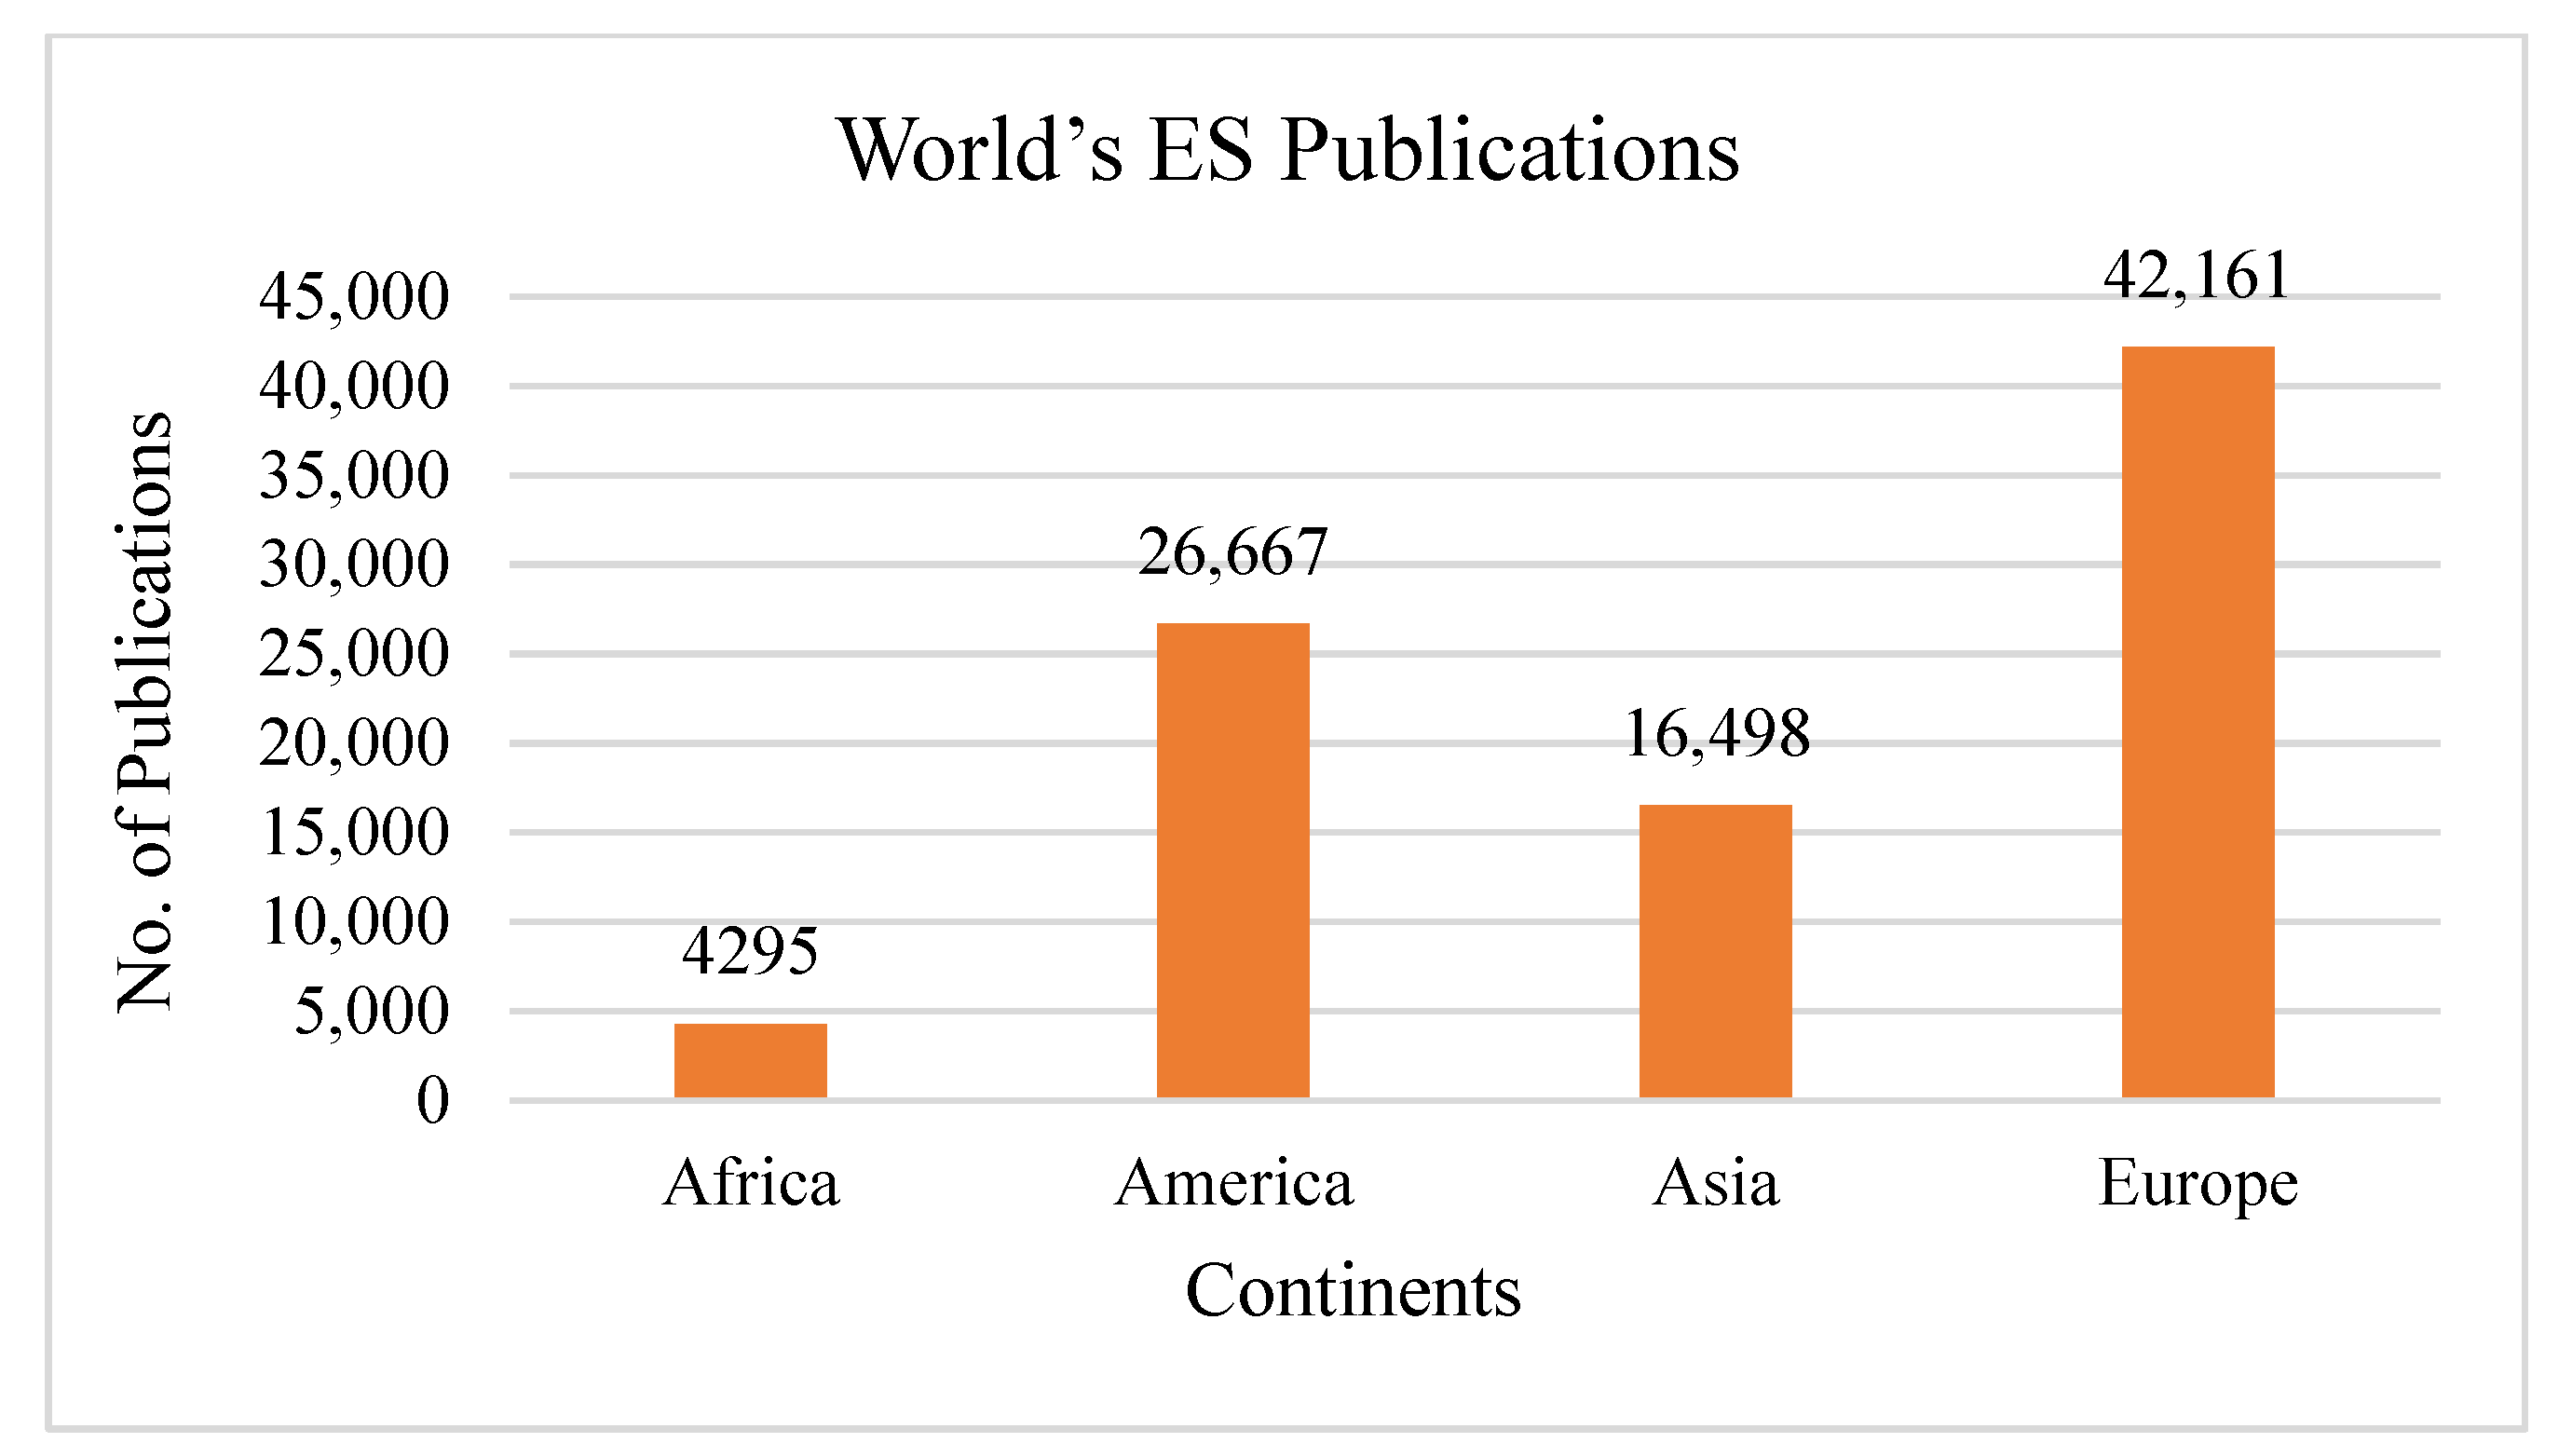
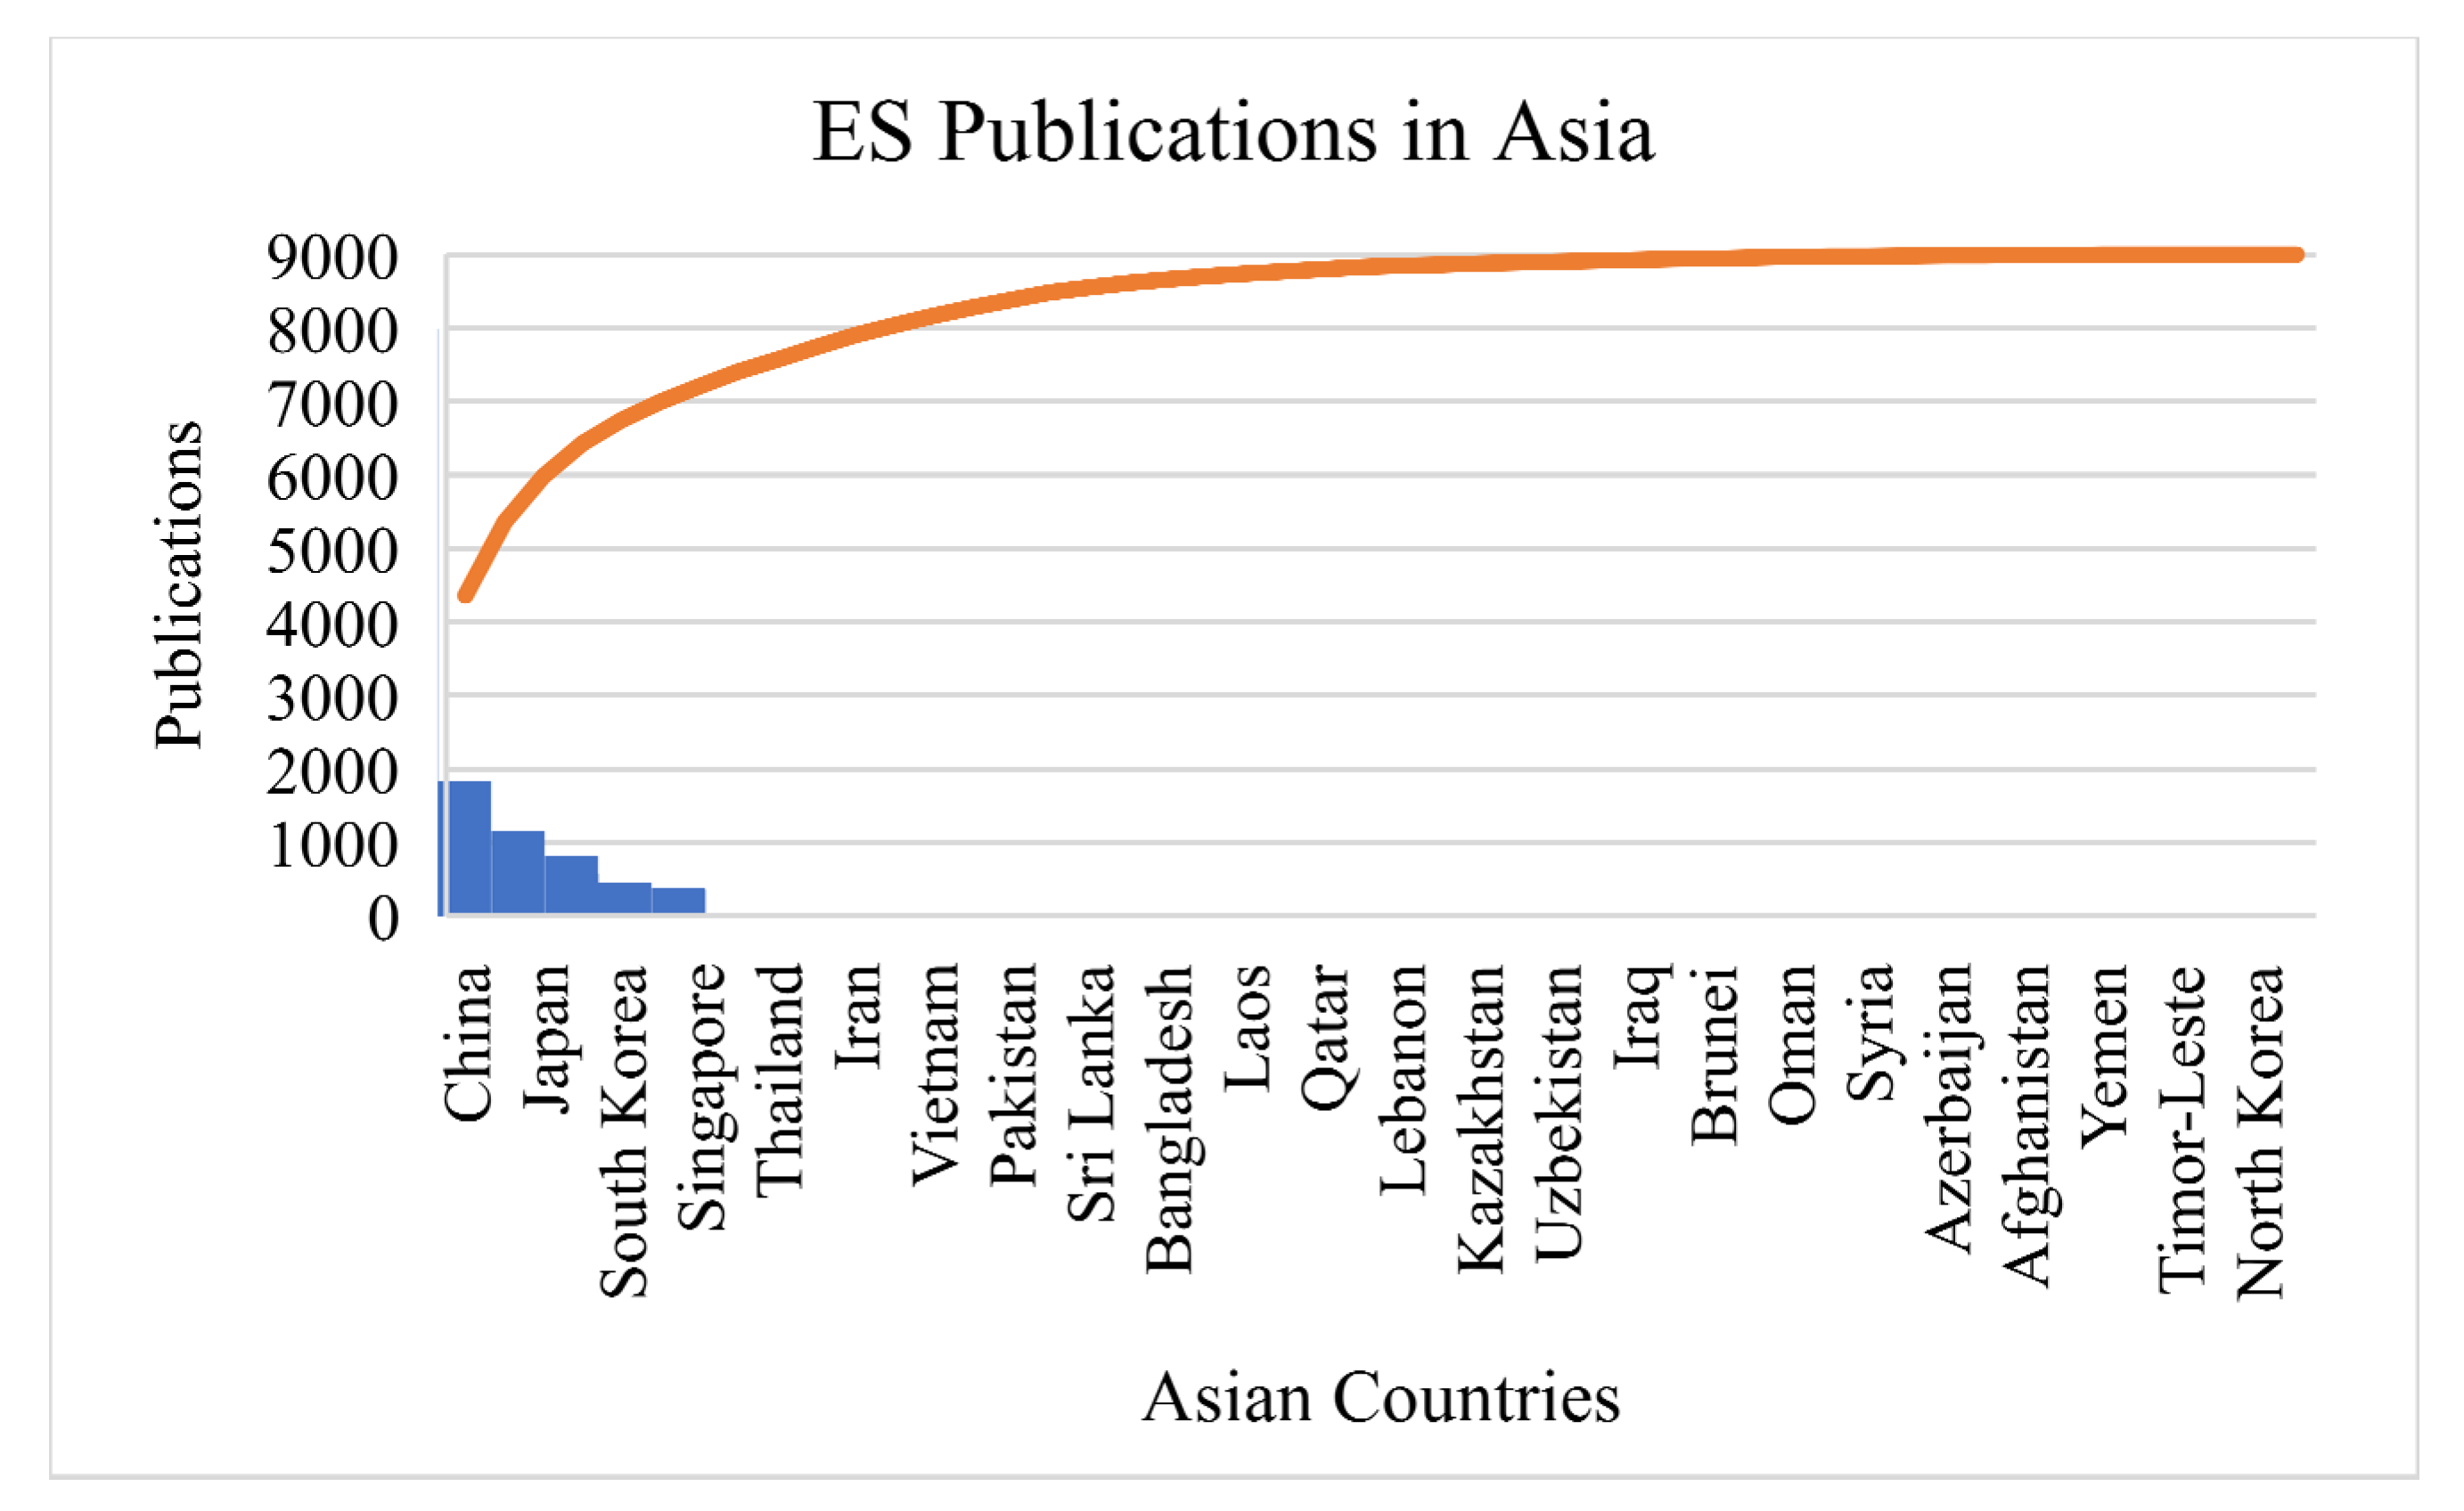
Ecosystem service study post [1] has been proliferated due to rapid urbanization, causing temporal changes such as climatic variation, global warming, etc. We find work on ecosystem services is mainly carried out in the developed countries. It is of prime importance to study the changing trajectory of spatial settings in developing countries, as the population increase demands changes in the land use and land cover dynamics. The interrelation between the ESs and human activities play a critical role in global climatic conditions. Publication trends in the world ES scenario is showcased in Figure 6 and Figure 7.
In the present scenario, we find ES studied globally in three ways: (1) estimating the physical quantity of services provided [74]; this is primary work that is carried out, to understand the influence of LULC change on ES, as well as its impact on the climatic aspect; (2) the economic value [75], which is needed to understand the income that is generated due to the interaction of ES, and also helps in estimating the economy lost due to the deterioration of ES, and (3) the basic benefit transfer method [6].
3.5. ES Publication Status of India
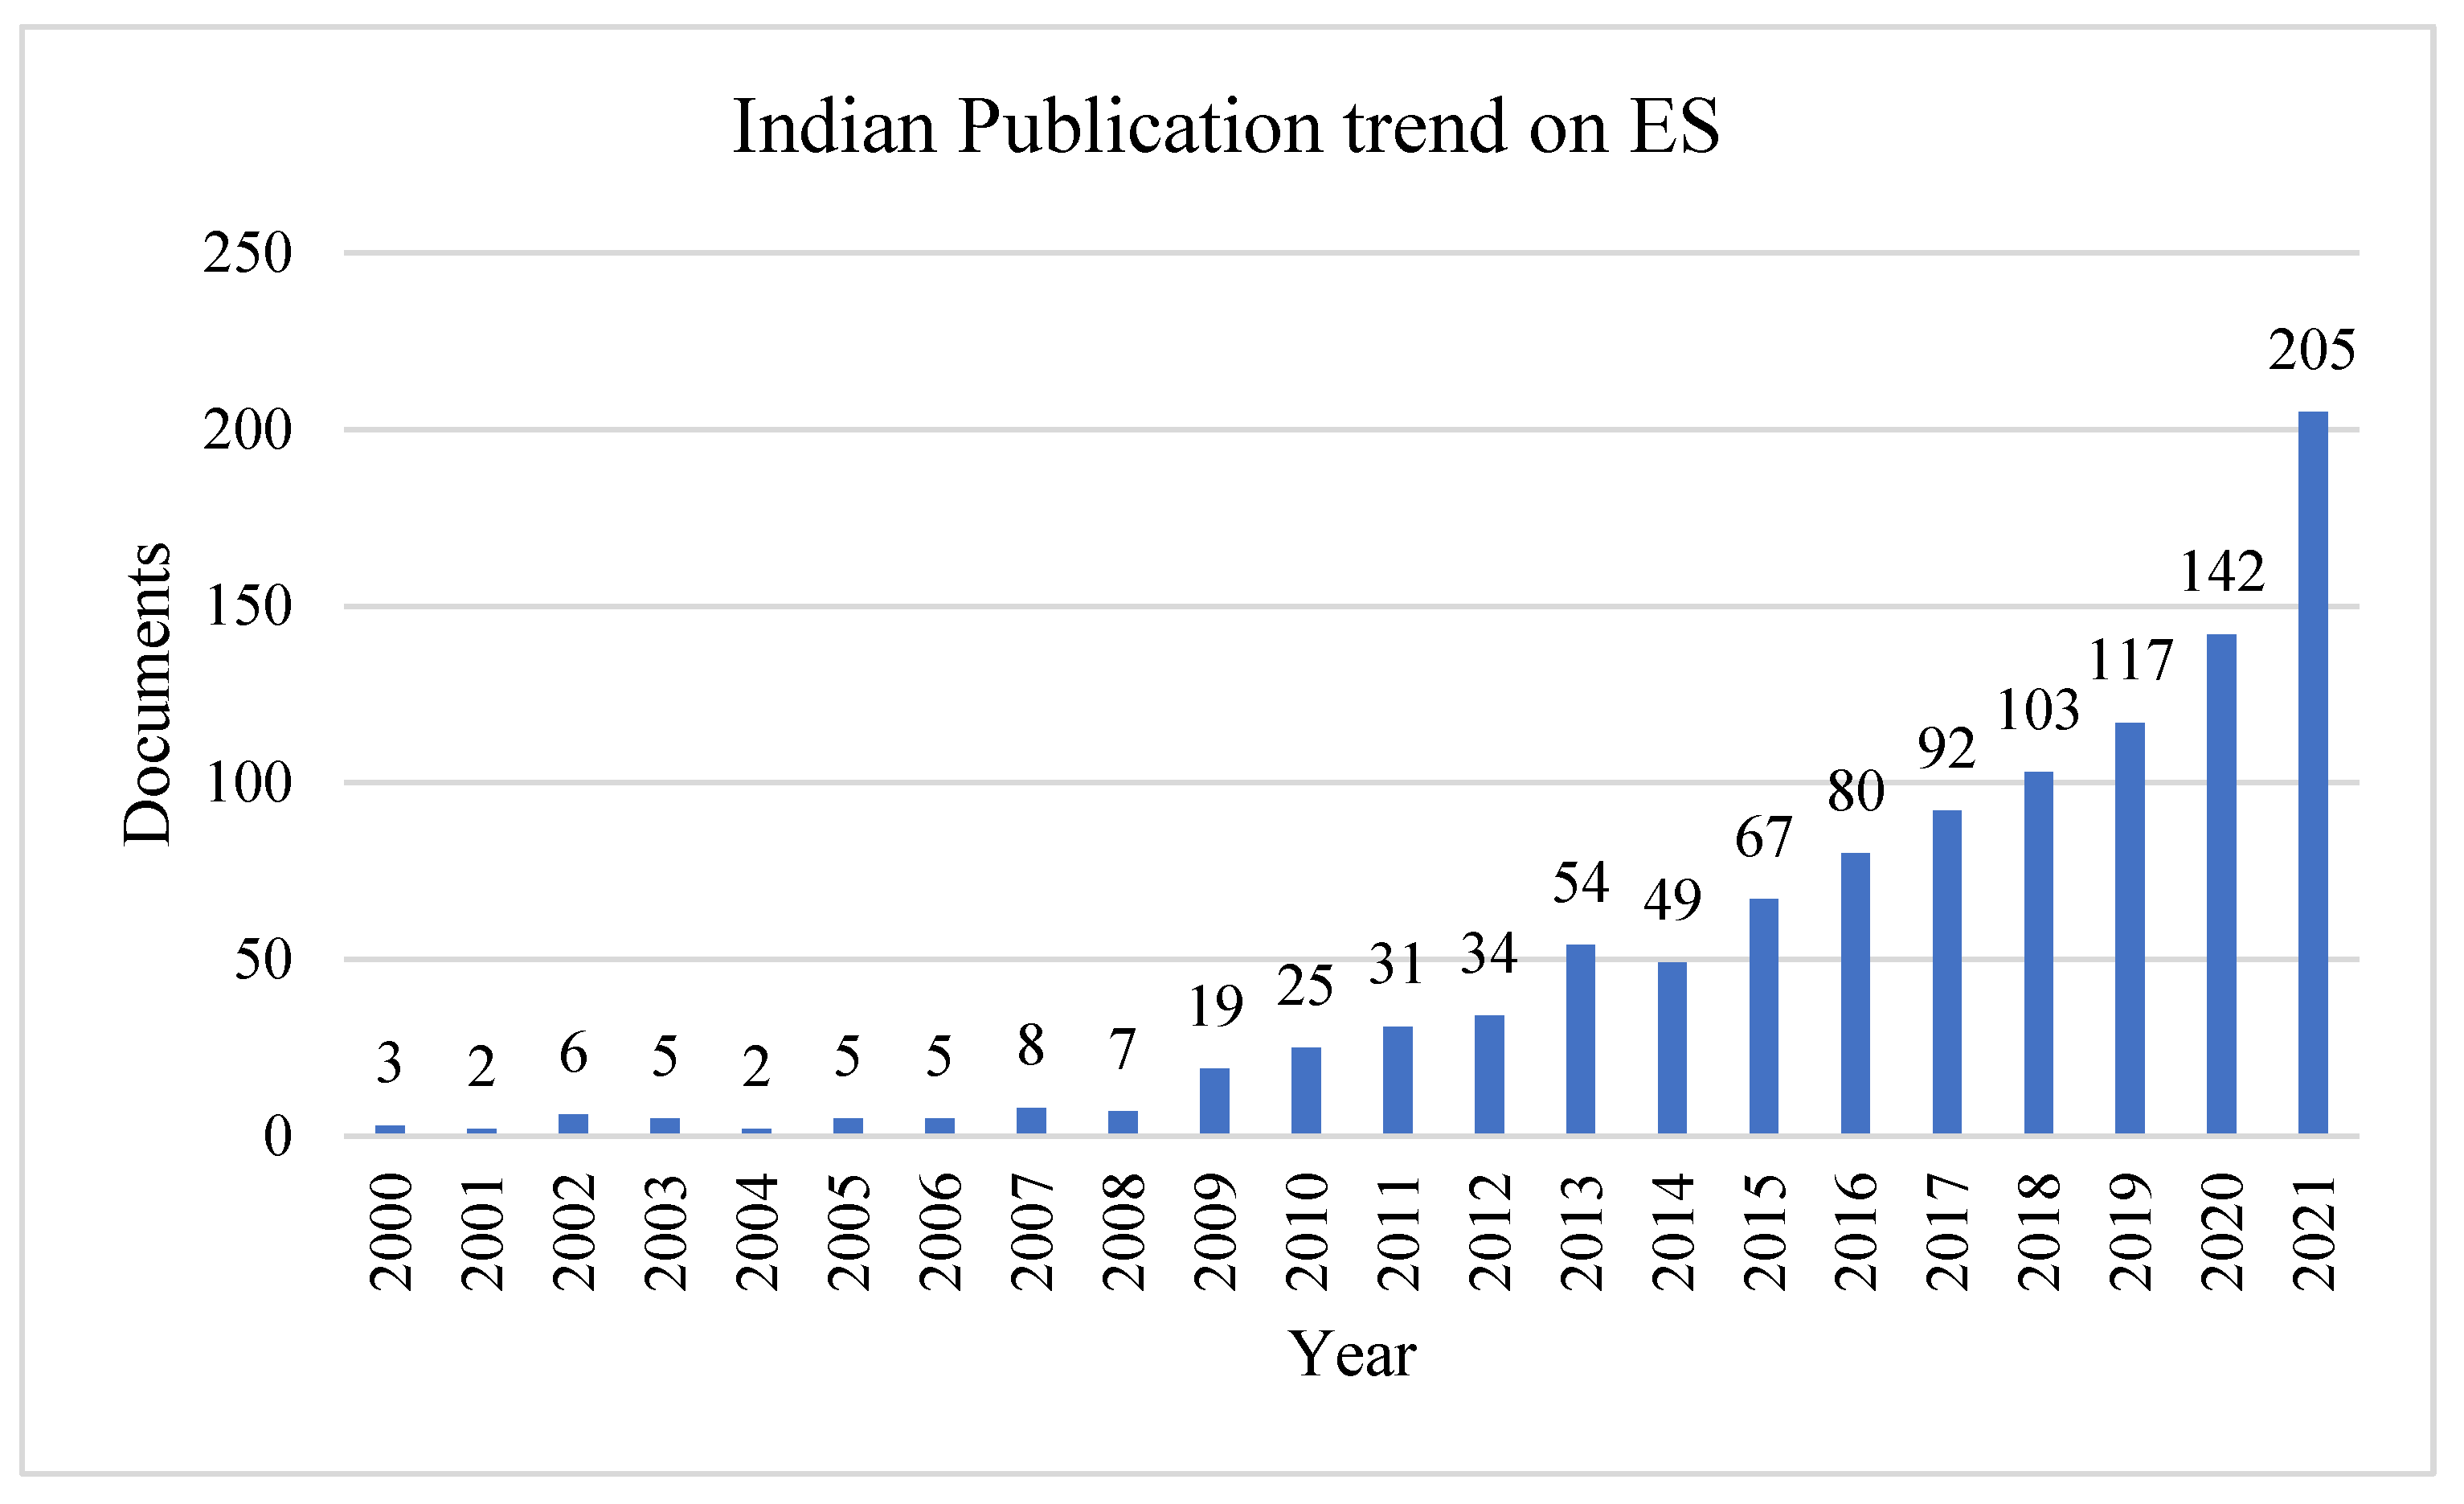
The publication trend of ecosystem services in the Indian context gives us a brief idea of the present knowledge gap. After the search carried out in the Scopus database, we found hardly 200 papers published on ESs (Figure 8). India is a very diverse country regarding its spatial, temporal, and cultural aspects. It will be of prime importance for the study of ES to bring about awareness of ESs’ influence on recent global temporal changes. India is a developing country; hence, it has experienced a lot of spatiotemporal changes in recent decades.
India is peninsular; it is surrounded by the sea on three sides. With this being said, mangrove plays an important role in protecting the coastal region. Table 2 gives a brief idea on the studies conducted on ES in India. Giri et al. studied the status of mangrove forests in Southeast Asia [76]. Prasad et al. [77] studied the rate of degradation of seagrass impacting regulating ES due to human activities, whereas Edward et al. gave insight into methods of restoring seagrass [78]. The study conducted by [79] to understand the spatiotemporal dynamics in the mid-sized town of Telangana using statistical methods showed unsustainable growth trends among LULC variables, making study of the patterns vital. Studies were conducted to understand the degradation and rate of sedimentation of wetlands in the Western Himalayan region of Himachal Pradesh, showing a large-scale unregulated development causing the damage to ES [80]. Furthermore, Sannigrahi et al. [81] measured 17 ESs; Sannigrahi et al. [82] showed that climatic factors, biophysical factors, and environmental stress significantly affect the ESs in the Sundarbans region. The seasonal variation was captured using GHG (Green House Gas) on carbon pools in the degraded Sundarbans region [83]. Talukdar et al. [84] demonstrated the relationship between LULC and changes in ES; later on, Das et al. [85] shed light on decreasing ecosystem health in the lower Gangetic Plain region. Stakeholder participation plays a vital role in conserving ES. Sinclair et al. showed the willingness of the stakeholders to maintain the same [86]. ESs by the world hotspot region of Western Ghats played a vital role, elaborating on the impact of LULC on the ecological hotspot region and ES of Western Ghats [87,88]. Water richness and wetland habitable suitability criteria are important for understanding the habitat suitability of a populated region [89]. Further, there are stresses related to the dynamics of soil carbon in alternative cropping techniques [90,91]. Shah et al. [92] came up with the framework to understand the ecosystem services with a comprehensive view of common resources used by policymakers to attain sustainability.
4. Discussion
4.1. Contribution of ES and Global Issues
According to the study, Millenium Ecosystem Assessment [1] inferred that 15 of 24 ecosystem services had degraded globally. Anthropogenic activities are the main reason for 60% of the deterioration of provisioning ecosystem services [1,94,95,96]. On a global scale, we projected the impact of LULC on ecosystem services and concluded that changes in LULC can deteriorate the ES [97].
Bennett et al. [29] infer that trade-off and/or synergies do take place between regulation ecosystem services and other ESs, considering this the main determinant to access the ecological changes [35]. In the global scenario of the past five decades, due to an increase in the population, demand, and usage of water, intensive agricultural produce, industrialization, and economic growth, Ref. [98] pinpoints that the use of water has tripled. Studies conducted by [14,99,100,101] prove that there is a significant role played by LULC on the water yield. A trade-off relationship between ES was found by Zhang et al. [102] between provision ES and soil conservation. The study conducted by Yi et al. [103] found that there is a significant connection between carbon storage and soil sediment retention in an urban watershed and river basins. However, it was also proved that the synergies and trade-offs occur in different scenarios [104]. Hence, a study analyzing various ESs is vital to urban management, planning, and policy decision making [28,105].
Literature proves that there is a direct relationship between the carbon and soil-based ESs [106,107,108]; Rodríguez et al. [109] proved the existence of a positive correlation between aboveground carbon storage with water regulation and supply. However, knowledge related to the potential of the coastal belt to regulate climate change and emission levels due to different anthropogenic activities is not available. Nevertheless, it is critical to access the influence of carbon sequestration on climate changes by different LULC on susceptible areas that are sensitive to changing processes. Many research scholars have studied the influence of LULC on carbon stock and climatic changes [110]. Following this study, we find [111] established the relationship between precipitation variation and LULC and its influence on ES
The study of soil erosion has caught the attention of researchers recently, and studies have been conducted globally on various scales [112]. The study conducted by Vaezi et al. [113] showed the result of ecosystem services hampered due to soil erosion, desertification, etc. Additionally, due to the presence of spatial heterogeneity, Ref. [114] explains the importance of soil-related study at various scale dynamics. This helps us to understand the effect of soil and its trade-off and/or synergies at various scales, as demonstrated by [115].
The major issue found globally today, as summarized by [116,117,118,119], shows that ES have been critically impacted due to the intense interaction between the ecosystem and humans at a regional scale, and this has to be looked after with immediate effect. This is also important according to the study [120], which found that the relationship between ES is spatially heterogeneous. Some researchers have studied the LULC change on a smaller scale can transform into synergy in spatiotemporal distribution at a larger scale [121,122,123]. Sun et al. [104] stated that studies at the future level at a regional scale should be designed to improve various scenarios in a detailed way to cater to the local situation and policy planning. Researchers such [82,124,125] found that there was a significant influence of climatic factors on the ESs variations. Therefore, Refs. [126,127] suggest that the effective planning management strategy is to incorporate ES bundles and hotspots in the decision-making process.
4.2. Way forward to ES Research in India
Based on the literature review conducted, there is a need to account for ecosystem services on different LULC in Indian scenarios, varying in urban settings and geolocation of the urban areas. On a national scale, we have the work of LULC changes giving an insight into the change dynamics in land use. There is empirical evidence that shows there are evident changes in the structure of ES due to urban expansion, which will lead to the degradation of the same [65]. However, little is known about the intensity of ES losses at a regional scale in the Indian context, due to the influence of LULC. It is also important to understand the influence of climatic factors on ES at a regional scale, providing better service to society.
The reason to select the ESs is that first, ESs such as carbon sequestration, water yield, and soil retention are the common focus areas for research study, as they represent the ESs subset [128,129,130]. Second, the quantitative methods of spatially analyzing the driving forces of these ESs can be reinforced by the efficient availability of large-scale data [130,131]. Vallet et al. [132] state that the study of ES interaction is important when it comes to questioning the usefulness of various criteria to come up with appropriate decision-making needs and expectations. From the literature survey, it is seen that provision, regulation, and support of ESs are threatened [27].
Even though there is a prolific amount of research on ES, there must be in-depth knowledge about the relationship and tradeoff among various ES [27], which should also be explored in terms of emerging climatic changes [27]. Additionally, Refs. [36,84] suggests that research should be conducted on every site-specific scenario leading to informed design management strategies, which in turn elevates ES benefits. The authors of [132] investigated the relationship between ES and urbanization, and concluded that for LULC, topography has a greater influence on ESs than urbanization.
5. Conclusions
Understanding the changes in ESs and their relationship with the help of spatially explicit methods could be helpful for the study to be conducted. In the present review, research dynamics of ES in the global scenario are given, and are then narrowed down to the national scale of the Indian scenario between 2000 and 2021. This analysis is based on 138 articles gathered from the databases of Science Direct, etc., with the help of bibliometric statistics such as keywords, countries, and outcomes. Additionally, ecosystem types, geographical location of the studies conducted, and assessment and valuation methods are in the limelight. The number of publications in the Indian context is gradually increasing. We find a steady increase in the publication trend post-2015. We find publications focusing on the study of two or more ES categories. Crop production and water yield have focused on provisioning ecosystem services; carbon sequestration, soil conservation for regulating ecosystem services; biodiversity conservation, along with the nutrient cycle, for supporting ecosystem services; psychological behavior, and quality of life in cultural ecosystems. We find these studies have been completed, since these are considered major determinants ruling these ESs along with the help of readily available research methodological framework. On the other hand, due to lack of methods and data, it is difficult to map the remaining ESs. In the Indian context, water, carbon, and soil play a major role in improving the socioeconomical aspect of ES.
India is a peninsular country with a wide variety of physical landscapes, including croplands, woods, grasslands, deserts, rivers, lakes, deltas, shelves, oceans, mountains, plateaus, basins, and islands. With its existing rapid economic growth and massive urbanization, India has become increasingly vulnerable to both natural disasters, such as droughts and floods, and human-caused ecological disasters, such as deforestation, salinization, erosion, and water, air, and soil pollution. The ES transdisciplinary paradigm serves as a useful framework for analyzing diversified natural assets and addressing environmental issues through integrated ecosystem management. However, the dataset built in this review work is not comprehensive; it can serve as a foundation for future studies, with the hope of creating a complete ES research database at the national level.
Author Contributions
Conceptualization, D. and A.K.S.; methodology, D. and A.K.S.; validation, D. and A.K.S.; formal analysis, D. and A.K.S.; writing—original draft preparation, D. and A.K.S.; writing—review and editing, A.K.S.; supervision, A.K.S. All authors have read and agreed to the published version of the manuscript.
Funding
This research received no external funding.
Institutional Review Board Statement
Not applicable.
Informed Consent Statement
Not applicable.
Data Availability Statement
The data that support the findings of this study are available from the corresponding author, upon reasonable request.
Acknowledgments
The authors are thankful to the Scopus database, Science Direct, Web of Science, and Google Scholar for providing the ecosystem services-related publications. The authors are also thankful to the anonymous reviewers for their constructive suggestions as to how to improve the quality of the present work.
Conflicts of Interest
This manuscript has not been published or presented elsewhere in part or entirety and is not under consideration by another journal. There are no conflicts of interest to declare.
References
- Millennium Ecosystem Assessment (MEA). Ecosystems and Human Well-Being: Synthesis; Island Press: Washington, DC, USA, 2005; ISBN 1597260401. [Google Scholar]
- Song, X.-P.; Hansen, M.C.; Stehman, S.V.; Potapov, P.V.; Tyukavina, A.; Vermote, E.F.; Townshend, J.R. Global Land Change from 1982 to 2016. Nature 2018, 560, 639–643. [Google Scholar] [CrossRef] [PubMed]
- Barbier, E.B.; Hacker, S.D.; Kennedy, C.; Koch, E.W.; Stier, A.C.; Silliman, B.R. The Value of Estuarine and Coastal Ecosystem Services. Ecol. Monogr. 2011, 81, 169–193. [Google Scholar] [CrossRef]
- Daily, G.C. Daily_1997_Natures-Services-Chapter-1. In Societal Dependence on Natural Ecosystems; Daily, G.C., Ed.; Island Press: Washington, DC, USA, 1997. [Google Scholar]
- Guo, Z.; Zhang, L.; Li, Y. Increased Dependence of Humans on Ecosystem Services and Biodiversity. PLoS ONE 2010, 5, 13113. [Google Scholar] [CrossRef]
- Costanza, R.; d’Arge, R.; de Groot, R.; Farber, S.; Grasso, M.; Hannon, B.; Limburg, K.; Naeem, S.; O’Neill, R.V.; Paruelo, J.; et al. The Value of the World’s Ecosystem Services and Natural Capital. Nature 1997, 387, 253–260. [Google Scholar] [CrossRef]
- Pascual, U.; Balvanera, P.; Díaz, S.; Pataki, G.; Roth, E.; Stenseke, M.; Watson, R.T.; Başak Dessane, E.; Islar, M.; Kelemen, E.; et al. Valuing Nature’s Contributions to People: The IPBES Approach. Curr. Opin. Environ. Sustain. 2017, 26, 7–16. [Google Scholar] [CrossRef]
- Joshi, N.; Baumann, M.; Ehammer, A.; Fensholt, R.; Grogan, K.; Hostert, P.; Jepsen, M.R.; Kuemmerle, T.; Meyfroidt, P.; Mitchard, E.T.A.; et al. A Review of the Application of Optical and Radar Remote Sensing Data Fusion to Land Use Mapping and Monitoring. Remote Sens. 2016, 8, 70. [Google Scholar] [CrossRef]
- Gómez-Baggethun, E.; Barton, D.N. Classifying and Valuing Ecosystem Services for Urban Planning. Ecol. Econ. 2013, 86, 235–245. [Google Scholar] [CrossRef]
- Xue, L.; Zhu, B.; Wu, Y.; Wei, G.; Liao, S.; Yang, C.; Wang, J.; Zhang, H.; Ren, L.; Han, Q. Dynamic Projection of Ecological Risk in the Manas River Basin Based on Terrain Gradients. Sci. Total Environ. 2019, 653, 283–293. [Google Scholar] [CrossRef]
- Wang, L.J.; Ma, S.; Zhao, Y.G.; Zhang, J.C. Ecological Restoration Projects Did Not Increase the Value of All Ecosystem Services in Northeast China. For. Ecol. Manag. 2021, 495, 119340. [Google Scholar] [CrossRef]
- Kumar, P.; Thakur, P.K.; Bansod, B.K.S.; Debnath, S.K. Groundwater: A Regional Resource and a Regional Governance. Environ. Dev. Sustain. 2018, 20, 1133–1151. [Google Scholar] [CrossRef]
- Shukla, A.K.; Ojha, C.S.P.; Garg, R.D.; Shukla, S.; Pal, L. Influence of Spatial Urbanization on Hydrological Components of the Upper Ganga River Basin, India. J. Hazard. Toxic Radioact. Waste 2020, 24, 04020028. [Google Scholar] [CrossRef]
- Shukla, A.K.; Ojha, C.S.P.; Mijic, A.; Buytaert, W.; Pathak, S.; Garg, R.D.; Shukla, S. Population Growth, Land Use and Land Cover Transformations, and Water Quality Nexus in the Upper Ganga River Basin. Hydrol. Earth Syst. Sci. 2018, 22, 4745–4770. [Google Scholar] [CrossRef]
- Peters, M.K.; Hemp, A.; Appelhans, T.; Becker, J.N.; Behler, C.; Classen, A.; Detsch, F.; Ensslin, A.; Ferger, S.W.; Frederiksen, S.B.; et al. Climate–Land-Use Interactions Shape Tropical Mountain Biodiversity and Ecosystem Functions. Nature 2019, 568, 88–92. [Google Scholar] [CrossRef] [PubMed]
- Wu, C.; Chen, B.; Huang, X.; Dennis Wei, Y.H. Effect of Land-Use Change and Optimization on the Ecosystem Service Values of Jiangsu Province, China. Ecol. Indic. 2020, 117, 106507. [Google Scholar] [CrossRef]
- Fisher, B.; Turner, R.K.; Morling, P. Defining and Classifying Ecosystem Services for Decision Making. Ecol. Econ. 2009, 68, 643–653. [Google Scholar] [CrossRef]
- Kragt, M.E.; Robertson, M.J. Quantifying Ecosystem Services Trade-Offs from Agricultural Practices. Ecol. Econ. 2014, 102, 147–157. [Google Scholar] [CrossRef]
- Daily, G.C.; Polasky, S.; Goldstein, J.; Kareiva, P.M.; Mooney, H.A.; Pejchar, L.; Ricketts, T.H.; Salzman, J.; Shallenberger, R. Ecosystem Services in Decision Making: Time to Deliver—Enhanced Reader. Front. Ecol. Environ. 2009, 7, 21–28. [Google Scholar] [CrossRef]
- Xia, M.; Jia, K.; Wang, X.; Bai, X.; Li, C.; Zhao, W.; Hu, X.; Cherubini, F. A Framework for Regional Ecosystem Authenticity Evaluation—A Case Study on the Qinghai-Tibet Plateau of China. Glob. Ecol. Conserv. 2021, 31, e01849. [Google Scholar] [CrossRef]
- Costanza, R.; de Groot, R.; Braat, L.; Kubiszewski, I.; Fioramonti, L.; Sutton, P.; Farber, S.; Grasso, M. Twenty Years of Ecosystem Services: How Far Have We Come and How Far Do We Still Need to Go? Ecosyst. Serv. 2017, 28, 1–16. [Google Scholar] [CrossRef]
- Sattler, C.; Loft, L.; Mann, C.; Meyer, C. Methods in Ecosystem Services Governance Analysis: An Introduction. Ecosyst. Serv. 2018, 34, 155–168. [Google Scholar] [CrossRef]
- Han, H.-Q.; Liu, Y.; Gao, H.-J.; Zhang, Y.-J.; Wang, Z.; Chen, X.-Q. Tradeoffs and Synergies between Ecosystem Services: A Comparison of the Karst and Non-Karst Area. J. Mt. Sci. 2020, 17, 1221–1234. [Google Scholar] [CrossRef]
- Dade, M.C.; Mitchell, M.G.E.; McAlpine, C.A.; Rhodes, J.R. Assessing Ecosystem Service Trade-Offs and Synergies: The Need for a More Mechanistic Approach. Ambio 2019, 48, 1116–1128. [Google Scholar] [CrossRef] [PubMed]
- Cord, A.F.; Bartkowski, B.; Beckmann, M.; Dittrich, A.; Hermans-Neumann, K.; Kaim, A.; Lienhoop, N.; Locher-Krause, K.; Priess, J.; Schröter-Schlaack, C.; et al. Towards Systematic Analyses of Ecosystem Service Trade-Offs and Synergies: Main Concepts, Methods and the Road Ahead. Ecosyst. Serv. 2017, 28, 264–272. [Google Scholar] [CrossRef]
- Turner, K.G.; Odgaard, M.V.; Bøcher, P.K.; Dalgaard, T.; Svenning, J.C. Bundling Ecosystem Services in Denmark: Trade-Offs and Synergies in a Cultural Landscape. Landsc. Urban Plan. 2014, 125, 89–104. [Google Scholar] [CrossRef]
- Jiang, C.; Zhang, H.; Tang, Z.; Labzovskii, L. Evaluating the Coupling Effects of Climate Variability and Vegetation Restoration on Ecosystems of the Loess Plateau, China. Land Use Policy 2017, 69, 134–148. [Google Scholar] [CrossRef]
- Jia, X.; Fu, B.; Feng, X.; Hou, G.; Liu, Y.; Wang, X. The Tradeoff and Synergy between Ecosystem Services in the Grain-for-Green Areas in Northern Shaanxi, China. Ecol. Indic. 2014, 43, 103–113. [Google Scholar] [CrossRef]
- Bennett, E.M.; Peterson, G.D.; Gordon, L.J. Understanding Relationships among Multiple Ecosystem Services. Ecol. Lett. 2009, 12, 1394–1404. [Google Scholar] [CrossRef]
- Braat, L.C.; de Groot, R. The Ecosystem Services Agenda:Bridging the Worlds of Natural Science and Economics, Conservation and Development, and Public and Private Policy. Ecosyst. Serv. 2012, 1, 4–15. [Google Scholar] [CrossRef]
- Lee, H.; Lautenbach, S. A Quantitative Review of Relationships between Ecosystem Services. Ecol. Indic. 2016, 66, 340–351. [Google Scholar] [CrossRef]
- Li, J.; Zhang, C.; Zhu, S. Relative Contributions of Climate and Land-Use Change to Ecosystem Services in Arid Inland Basins. J. Clean. Prod. 2021, 298, 126844. [Google Scholar] [CrossRef]
- Zhang, L.; Cheng, L.; Chiew, F.; Fu, B. Understanding the Impacts of Climate and Landuse Change on Water Yield. Curr. Opin. Environ. Sustain. 2018, 33, 167–174. [Google Scholar] [CrossRef]
- Abera, W.; Tamene, L.; Kassawmar, T.; Mulatu, K.; Kassa, H.; Verchot, L.; Quintero, M. Impacts of Land Use and Land Cover Dynamics on Ecosystem Services in the Yayo Coffee Forest Biosphere Reserve, Southwestern Ethiopia. Ecosyst. Serv. 2021, 50, 101338. [Google Scholar] [CrossRef]
- Bennett, E.M.; Cumming, G.S.; Peterson, G.D. A Systems Model Approach to Determining Resilience Surrogates for Case Studies. Ecosystems 2005, 8, 945–957. [Google Scholar] [CrossRef]
- Carter Berry, Z.; Jones, K.W.; Gomez Aguilar, L.R.; Congalton, R.G.; Holwerda, F.; Kolka, R.; Looker, N.; Lopez Ramirez, S.M.; Manson, R.; Mayer, A.; et al. Evaluating Ecosystem Service Trade-Offs along a Land-Use Intensification Gradient in Central Veracruz, Mexico. Ecosyst. Serv. 2020, 45, 101181. [Google Scholar] [CrossRef]
- Garrastazú, M.C.; Mendonça, S.D.; Horokoski, T.T.; Cardoso, D.J.; Rosot, M.A.D.; Nimmo, E.R.; Lacerda, A.E.B. Carbon Sequestration and Riparian Zones: Assessing the Impacts of Changing Regulatory Practices in Southern Brazil. Land Use Policy 2015, 42, 329–339. [Google Scholar] [CrossRef]
- Delibas, M.; Tezer, A.; Kuzniecow Bacchin, T. Towards Embedding Soil Ecosystem Services in Spatial Planning. Cities 2021, 113, 103150. [Google Scholar] [CrossRef]
- Kumar, A.; Kumar, M.; Pandey, R.; Yu, Z.G.; Yu, Z.G.; Cabral-Pintod, M. Forest soil nutrient stocks along with an altitudinal range of Uttarakhand Himalayas: An aid to Nature Based Climate Solutions. CATENA 2021, 207, 105667. [Google Scholar] [CrossRef]
- Rai, P.; Vineeta; Shukla, G.; Manohar, A.K.; Bhat, J.A.; Kumar, A.; Kumar, M. Carbon Storage of Single Tree and Mixed Tree Dominant Species Stands in a Reserve Forest—Case Study of the Eastern Sub-Himalayan Region of India. Land 2021, 10, 435. [Google Scholar] [CrossRef]
- Kumar, A.; Kumar, M. Estimation of Biomass and Soil Carbon Stock in the Hydroelectric Catchment of India and its Implementation to Climate Change. J. Sustain. For. 2020, 36. [Google Scholar] [CrossRef]
- de Groot, R.; Brander, L.; van der Ploeg, S.; Costanza, R.; Bernard, F.; Braat, L.; Christie, M.; Crossman, N.; Ghermandi, A.; Hein, L.; et al. Global Estimates of the Value of Ecosystems and Their Services in Monetary Units. Ecosyst. Serv. 2012, 1, 50–61. [Google Scholar] [CrossRef]
- Sen, S.; Guchhait, S.K. Urban Green Space in India: Perception of Cultural Ecosystem Services and Psychology of Situatedness and Connectedness. Ecol. Indic. 2021, 123, 107338. [Google Scholar] [CrossRef]
- Ko, H.; Son, Y. Perceptions of Cultural Ecosystem Services in Urban Green Spaces: A Case Study in Gwacheon, Republic of Korea. Ecol. Indic. 2018, 91, 299–306. [Google Scholar] [CrossRef]
- Chan, K.M.A.; Satterfield, T.; Goldstein, J. Rethinking Ecosystem Services to Better Address and Navigate Cultural Values. Ecol. Econ. 2012, 74, 8–18. [Google Scholar] [CrossRef]
- TEEB. The Economics of Ecosystems and Biodiversity. In The Economics of Ecosystems and Biodiversity Ecological and Economic Foundations; Kumar, P., Ed.; Earthscan: London, UK; Washington, DC, USA, 2010. [Google Scholar]
- Nelson, E.; Bhagabati, N.; Ennaanay, D.; Lonsdorf, E.; Pennington, D.; Sharma, M. Modeling Terrestrial Ecosystem Services. In Encyclopedia of Biodiversity, 2nd ed.; Elsevier Inc.: Amsterdam, The Netherlands, 2013; pp. 347–361. ISBN 9780123847195. [Google Scholar]
- Hasan, S.S.; Zhen, L.; Miah, M.G.; Ahamed, T.; Samie, A. Impact of Land Use Change on Ecosystem Services: A Review. Environ. Dev. 2020, 34, 100527. [Google Scholar] [CrossRef]
- Haines-Young, R.; Potschin, M. Common International Classification of Ecosystem Services (CICES); European Environment Agency: Copenhagen, Denmark, 2011. [Google Scholar]
- Signorello, G.; Marzo, A.; Prato, C.; Sturiale, G.; de Salvo, M. Assessing the Hidden Impacts of Hypothetical Eruption Events at Mount Etna. Environ. Sustain. Indic. 2020, 8, 100056. [Google Scholar] [CrossRef]
- Bagstad, K.J.; Semmens, D.J.; Winthrop, R. Comparing Approaches to Spatially Explicit Ecosystem Service Modeling: A Case Study from the San Pedro River, Arizona. Ecosyst. Serv. 2013, 5, 40–50. [Google Scholar] [CrossRef]
- Verma, P.; Raghubanshi, A.S. Rural Development and Land Use Land Cover Change in a Rapidly Developing Agrarian South Asian Landscape. Remote Sens. Appl. Soc. Environ. 2019, 14, 138–147. [Google Scholar] [CrossRef]
- Kam, J.; Jayanthi, S.C.; Raghavswamy, V. Spatio-temporal analysis of land use in urban mumbai-using multi-sensor satellite data and gis techniques. J. Indian Soc. Remote Sens. 2006, 34, 385–396. [Google Scholar]
- Posner, S.; Verutes, G.; Koh, I.; Denu, D.; Ricketts, T. Global Use of Ecosystem Service Models. Ecosyst. Serv. 2016, 17, 131–141. [Google Scholar] [CrossRef]
- Malinga, R.; Gordon, L.J.; Jewitt, G.; Lindborg, R. Mapping Ecosystem Services across Scales and Continents—A Review. Ecosyst. Serv. 2015, 13, 57–63. [Google Scholar] [CrossRef]
- Dang, A.N.; Jackson, B.M.; Benavidez, R.; Tomscha, S.A. Review of Ecosystem Service Assessments: Pathways for Policy Integration in Southeast Asia. Ecosyst. Serv. 2021, 49, 101266. [Google Scholar] [CrossRef]
- Mouchet, M.A.; Lamarque, P.; Martín-López, B.; Crouzat, E.; Gos, P.; Byczek, C.; Lavorel, S. An Interdisciplinary Methodological Guide for Quantifying Associations between Ecosystem Services. Glob. Environ. Change 2014, 28, 298–308. [Google Scholar] [CrossRef]
- Bogdan, S.-M.; Pătru-Stupariu, I.; Zaharia, L. The Assessment of Regulatory Ecosystem Services: The Case of the Sediment Retention Service in a Mountain Landscape in the Southern Romanian Carpathians. Procedia Environ. Sci. 2016, 32, 12–27. [Google Scholar] [CrossRef]
- Tallis, H.; Polasky, S. Mapping and Valuing Ecosystem Services as an Approach for Conservation and Natural-Resource Management. Ann. NY Acad. Sci. 2009, 1162, 265–283. [Google Scholar] [CrossRef] [PubMed]
- Bangash, R.F.; Passuello, A.; Sanchez-Canales, M.; Terrado, M.; López, A.; Elorza, F.J.; Ziv, G.; Acuña, V.; Schuhmacher, M. Ecosystem Services in Mediterranean River Basin: Climate Change Impact on Water Provisioning and Erosion Control. Sci. Total Environ. 2013, 458–460, 246–255. [Google Scholar] [CrossRef] [PubMed]
- Fang, Z.; Bai, Y.; Jiang, B.; Alatalo, J.M.; Liu, G.; Wang, H. Quantifying Variations in Ecosystem Services in Altitude-Associated Vegetation Types in a Tropical Region of China. Sci. Total Environ. 2020, 726, 138565. [Google Scholar] [CrossRef]
- Sharp, R.; Tallis, H.T.; Ricketts, T.; Guerry, A.D.; Wood, S.A.; Chaplin-Kramer, R.; Nelson, E.; Ennaanay, D.; Wolny, S.; Olwero, N.; et al. InVEST User’s Guide InVEST User’s Guide Integrated Valuation of Ecosystem Services and Tradeoffs; The Natural Capital Project: Stanford, CA, USA, 2014; Available online: https://0-scholar-google-com.brum.beds.ac.uk/citations?view_op=view_citation&hl=en&user=yPREfmsAAAAJ&citation_for_view=yPREfmsAAAAJ:3fE2CSJIrl8C (accessed on 10 June 2022).
- Notter, B.; Hurni, H.; Wiesmann, U.; Abbaspour, K.C. Modelling Water Provision as an Ecosystem Service in a Large East African River Basin. Hydrol. Earth Syst. Sci. 2012, 16, 69–86. [Google Scholar] [CrossRef]
- He, C.; Okada, N.; Zhang, Q.; Shi, P.; Zhang, J. Modeling Urban Expansion Scenarios by Coupling Cellular Automata Model and System Dynamic Model in Beijing, China. Appl. Geogr. 2006, 26, 323–345. [Google Scholar] [CrossRef]
- Xie, W.; Huang, Q.; He, C.; Zhao, X. Projecting the Impacts of Urban Expansion on Simultaneous Losses of Ecosystem Services: A Case Study in Beijing, China. Ecol. Indic. 2018, 84, 183–193. [Google Scholar] [CrossRef]
- Clarke, K.C.; Hoppen, S.; Gaydos, L. A Self-Modifying Cellular Automaton Model of Historical Urbanization in the San Francisco Bay Area. Environ. Plan. B Plan. Des. 1997, 24, 247–261. [Google Scholar] [CrossRef]
- Verburg, P.H.; Soepboer, W.; Veldkamp, A.; Limpiada, R.; Espaldon, V.; Mastura, S.S.A. Modeling the Spatial Dynamics of Regional Land Use: The CLUE-S Model. Environ. Manag. 2002, 30, 391–405. [Google Scholar] [CrossRef] [PubMed]
- Raudsepp-Hearne, C.; Peterson, G.D.; Bennett, E.M. Ecosystem Service Bundles for Analyzing Tradeoffs in Diverse Landscapes. Proc. Natl. Acad. Sci. USA 2010, 107, 5242–5247. [Google Scholar] [CrossRef] [PubMed]
- Lu, N.; Fu, B.; Jin, T.; Chang, R. Trade-off Analyses of Multiple Ecosystem Services by Plantations along a Precipitation Gradient across Loess Plateau Landscapes. Landsc. Ecol. 2014, 29, 1697–1708. [Google Scholar] [CrossRef]
- Metzger, M.J.; Rounsevell, M.; Acosta-Michlik, L.; Leemans, R.; Schröter, D. The vulnerability of ecosystem services to land use change. Agric. Ecosyst. Environ. 2006, 114, 69–85. [Google Scholar] [CrossRef]
- Sutton, P.C.; Costanza, R. Global estimates of market and non-market values derived from nighttime satellite imagery, land cover, and ecosystem service valuation. Ecol. Econ. 2002, 41, 509–527. [Google Scholar] [CrossRef]
- Nelson, E.; Mendoza, G.; Regetz, J.; Polasky, S.; Tallis, H.; Cameron, D.; Chan, K.M.; Daily, G.C.; Goldstein, J.; Kareiva, P.M.; et al. Modeling Multiple Ecosystem Services, Biodiversity Conservation, Commodity Production, and Tradeoffs at Landscape Scales. Front. Ecol. Environ. 2009, 7, 4–11. [Google Scholar] [CrossRef]
- Villa, F.; Bagstad, K.J.; Voigt, B.; Johnson, G.W.; Portela, R.; Honzák, M.; Batker, D. A Methodology for Adaptable and Robust EcosystemServices Assessment. PLoS ONE 2014, 9, e91001. [Google Scholar] [CrossRef] [PubMed]
- Jiang, C.; Wang, F.; Zhang, H.; Dong, X. Quantifying Changes in Multiple Ecosystem Services during 2000–2012 on the Loess Plateau, China, as a Result of Climate Variability and Ecological Restoration. Ecol. Eng. 2016, 97, 258–271. [Google Scholar] [CrossRef]
- Han, X.; Yu, J.; Shi, L.; Zhao, X.; Wang, J. Spatiotemporal Evolution of Ecosystem Service Values in an Area Dominated by Vegetation Restoration: Quantification and Mechanisms. Ecol. Indic. 2021, 131, 108191. [Google Scholar] [CrossRef]
- Giri, C.; Long, J.; Abbas, S.; Murali, R.M.; Qamer, F.M.; Pengra, B.; Thau, D. Distribution and Dynamics of Mangrove Forests of South Asia. J. Environ. Manag. 2015, 148, 101–111. [Google Scholar] [CrossRef] [PubMed]
- Prasad, M.H.K.; Ganguly, D.; Paneerselvam, A.; Ramesh, R.; Purvaja, R. Seagrass Litter Decomposition: An Additional Nutrient Source to Shallow Coastal Waters. Environ. Monit. Assess. 2019, 191, 5. [Google Scholar] [CrossRef] [PubMed]
- Edward, J.K.P.; Raj, K.D.; Mathews, G.; Kumar, P.D.; Arasamuthu, A.; D’ Souza, N.; Bilgi, D.S. Seagrass Restoration in Gulf of Mannar, Tamil Nadu, Southeast India: A Viable Management Tool. Environ. Monit. Assess. 2019, 191, 430. [Google Scholar] [CrossRef] [PubMed]
- Sahani, S.; Raghavaswamy, V. Analyzing Urban Landscape with City Biodiversity Index for Sustainable Urban Growth. Environ. Monit. Assess. 2018, 190, 471. [Google Scholar] [CrossRef]
- Malik, M.; Rai, S.C. Drivers of Land Use/Cover Change and Its Impact on Pong Dam Wetland. Environ. Monit. Assess. 2019, 191, 203. [Google Scholar] [CrossRef] [PubMed]
- Sannigrahi, S.; Chakraborti, S.; Joshi, P.K.; Keesstra, S.; Sen, S.; Paul, S.K.; Kreuter, U.; Sutton, P.C.; Jha, S.; Dang, K.B. Ecosystem Service Value Assessment of a Natural Reserve Region for Strengthening Protection and Conservation. J. Environ. Manag. 2019, 244, 208–227. [Google Scholar] [CrossRef]
- Sannigrahi, S.; Zhang, Q.; Pilla, F.; Joshi, P.K.; Basu, B.; Keesstra, S.; Roy, P.S.; Wang, Y.; Sutton, P.C.; Chakraborti, S.; et al. Responses of Ecosystem Services to Natural and Anthropogenic Forcings: A Spatial Regression Based Assessment in the World’s Largest Mangrove Ecosystem. Sci. Total Environ. 2020, 715, 137004. [Google Scholar] [CrossRef] [PubMed]
- Padhy, S.R.; Bhattacharyya, P.; Dash, P.K.; Reddy, C.S.; Chakraborty, A.; Pathak, H. Seasonal Fluctuation in Three Mode of Greenhouse Gases Emission in Relation to Soil Labile Carbon Pools in Degraded Mangrove, Sundarban, India. Sci. Total Environ. 2020, 705, 135909. [Google Scholar] [CrossRef] [PubMed]
- Talukdar, S.; Singha, P.; Shahfahad; Mahato, S.; Praveen, B.; Rahman, A. Dynamics of Ecosystem Services (ESs) in Response to Land Use Land Cover (LU/LC) Changes in the Lower Gangetic Plain of India. Ecol. Indic. 2020, 112, 106121. [Google Scholar] [CrossRef]
- Das, M.; Das, A.; Pereira, P.; Mandal, A. Exploring the Spatio-Temporal Dynamics of Ecosystem Health: A Study on a Rapidly Urbanizing Metropolitan Area of Lower Gangetic Plain, India. Ecol. Indic. 2021, 125, 107584. [Google Scholar] [CrossRef]
- Sinclair, M.; Vishnu Sagar, M.K.; Knudsen, C.; Sabu, J.; Ghermandi, A. Economic Appraisal of Ecosystem Services and Restoration Scenarios in a Tropical Coastal Ramsar Wetland in India. Ecosyst. Serv. 2021, 47, 101236. [Google Scholar] [CrossRef]
- Ramachandra, T.V.; Bharath, S. Carbon Sequestration Potential of the Forest Ecosystems in the Western Ghats, a Global Biodiversity Hotspot. Nat. Resour. Res. 2020, 29, 2753–2771. [Google Scholar] [CrossRef]
- Ramachandra, T.V.; Bharath, S.; Gupta, N. Modelling Landscape Dynamics with LST in Protected Areas of Western Ghats, Karnataka. J. Environ. Manag. 2018, 206, 1253–1262. [Google Scholar] [CrossRef]
- Debanshi, S.; Pal, S. Modelling Water Richness and Habitat Suitability of the Wetlands and Measuring Their Spatial Linkages in Mature Ganges Delta of India. J. Environ. Manag. 2020, 271, 110956. [Google Scholar] [CrossRef]
- Babu, S.; Singh, R.; Avasthe, R.K.; Yadav, G.S.; Mohapatra, K.P.; Selvan, T.; Das, A.; Singh, V.K.; Valente, D.; Petrosillo, I. Soil Carbon Dynamics in Indian Himalayan Intensified Organic Rice-Based Cropping Sequences. Ecol. Indic. 2020, 114, 106292. [Google Scholar] [CrossRef]
- Srinivasarao, C.; Lal, R.; Kundu, S.; Babu, M.B.B.P.; Venkateswarlu, B.; Singh, A.K. Soil Carbon Sequestration in Rainfed Production Systems in the Semiarid Tropics of India. Sci. Total Environ. 2014, 487, 587–603. [Google Scholar] [CrossRef]
- Shah, A.; Garg, A. Urban Commons Service Generation, Delivery, and Management: A Conceptual Framework. Ecol. Econ. 2017, 135, 280–287. [Google Scholar] [CrossRef]
- Pathak, S.; Ojha, C.S.P.; Garg, R.D. Applicability of the InVEST Model for Estimating Water Yield in Upper Ganga Basin. Society of Earth Scientists Series. In The Ganga River Basin: A Hydrometeorological Approach; Chauhan, M.S., Ojha, C.S.P., Eds.; Springer: Cham, Switzerland, 2021; pp. 219–231. [Google Scholar]
- Yang, Y.; Zheng, H.; Kong, L.; Huang, B.; Xu, W.; Ouyang, Z. Mapping Ecosystem Services Bundles to Detect High- and Low-Value Ecosystem Services Areas for Land Use Management. J. Clean. Prod. 2019, 225, 11–17. [Google Scholar] [CrossRef]
- Jew, E.; Burdekin, O.; Dougill, A.J.; Sallu, S.M. Rapid Land Use Change Threatens Provisioning Ecosystem Services in Miombo Woodlands. Nat. Resour. Forum 2019, 43, 56–70. [Google Scholar] [CrossRef]
- Jopke, C.; Kreyling, J.; Maes, J.; Koellner, T. Interactions among Ecosystem Services across Europe: Bagplots and Cumulative Correlation Coefficients Reveal Synergies, Trade-Offs, and Regional Patterns. Ecol. Indic. 2015, 49, 46–52. [Google Scholar] [CrossRef]
- Nelson, E.; Sander, H.; Hawthorne, P.; Conte, M.; Ennaanay, D.; Wolny, S.; Manson, S.; Polasky, S. Projecting Global Land-Use Change and Its Effect on Ecosystem Service Provision and Biodiversity with Simple Models. PLoS ONE 2010, 5, e14327. [Google Scholar] [CrossRef] [PubMed]
- Bennear, L.S.; Olmstead, S.M. The Impacts of the “Right to Know”: Information Disclosure and the Violation of Drinking Water Standards. J. Environ. Econ. Manag. 2008, 56, 117–130. [Google Scholar] [CrossRef]
- Paudyal, K.; Baral, H.; Bhandari, S.P.; Bhandari, A.; Keenan, R.J. Spatial Assessment of the Impact of Land Use and Land Cover Change on Supply of Ecosystem Services in Phewa Watershed, Nepal. Ecosyst. Serv. 2019, 36, 100895. [Google Scholar] [CrossRef]
- Farley, K.A.; Jobbágy, E.G.; Jackson, R.B. Effects of Afforestation on Water Yield: A Global Synthesis with Implications for Policy. Glob. Change Biol. 2005, 11, 1565–1576. [Google Scholar] [CrossRef]
- Rimal, B.; Sharma, R.; Kunwar, R.; Keshtkar, H.; Stork, N.E.; Rijal, S.; Rahman, S.A.; Baral, H. Effects of Land Use and Land Cover Change on Ecosystem Services in the Koshi River Basin, Eastern Nepal. Ecosyst. Serv. 2019, 38, 100963. [Google Scholar] [CrossRef]
- Zhang, Y.; Lu, X.; Liu, B.; Wu, D.; Fu, G.; Zhao, Y.; Sun, P. Spatial Relationships between Ecosystem Services and Socioecological Drivers across a Large-Scale Region: A Case Study in the Yellow River Basin. Sci. Total Environ. 2021, 766, 142480. [Google Scholar] [CrossRef]
- Yi, H.; Güneralp, B.; Kreuter, U.P.; Güneralp, İ.; Filippi, A.M. Spatial and Temporal Changes in Biodiversity and Ecosystem Services in the San Antonio River Basin, Texas, from 1984 to 2010. Sci. Total Environ. 2018, 619–620, 1259–1271. [Google Scholar] [CrossRef]
- Sun, X.; Li, F.; Sun, X.; Li, F. Spatiotemporal Assessment and Trade-Offs of Multiple Ecosystem Services Based on Land Use Changes in Zengcheng, China. Sci. Total Environ. 2017, 609, 1569–1581. [Google Scholar] [CrossRef]
- Feng, Q.; Zhao, W.; Fu, B.; Ding, J.; Wang, S. Ecosystem Service Trade-Offs and Their Influencing Factors: A Case Study in the Loess Plateau of China. Sci. Total Environ. 2017, 607–608, 1250–1263. [Google Scholar] [CrossRef]
- Izquierdo, A.E.; Clark, M.L. Spatial Analysis of Conservation Priorities Based on Ecosystem Services in the Atlantic Forest Region of Misiones, Argentina. Forests 2012, 3, 764–786. [Google Scholar] [CrossRef]
- Sahoo, U.K.; Tripathi, O.P.; Nath, A.J.; Deb, S.; Das, D.J.; Gupta, A.; Devi, N.B.; Charturvedi, S.S.; Singh, S.L.; Kumar, A.; et al. Quantifying tree diversity, carbon stocks and sequestration potential for diverse land-uses in northeast India. Front. Environ. Sci. 2021. [Google Scholar] [CrossRef]
- Kumar, M.; Kumar, A.; Thakur, T.K.; Pandey, R.; Shaboo, U.K. Soil Organic Carbon Estimation along an Altitudinal Gradient of Chir-Pine forests of Garhwal Himalaya, India: A field inventory to remote sensing approach. Land Degrad. Dev. 2022. [Google Scholar] [CrossRef]
- Rodríguez, N.; Armenteras, D.; Retana, J. National Ecosystems Services Priorities for Planning Carbon and Water Resource Management in Colombia. Land Use Policy 2015, 42, 609–618. [Google Scholar] [CrossRef]
- Tan, Z.; Liu, S.; Tieszen, L.L.; Tachie-Obeng, E. Simulated Dynamics of Carbon Stocks Driven by Changes in Land Use, Management and Climate in a Tropical Moist Ecosystem of Ghana. Agric. Ecosyst. Environ. 2009, 130, 171–176. [Google Scholar] [CrossRef]
- Chiang, L.C.; Lin, Y.P.; Huang, T.; Schmeller, D.S.; Verburg, P.H.; Liu, Y.L.; Ding, T.S. Simulation of Ecosystem Service Responses to Multiple Disturbances from an Earthquake and Several Typhoons. Landsc. Urban Plan. 2014, 122, 41–55. [Google Scholar] [CrossRef]
- Anache, J.A.A.; Flanagan, D.C.; Srivastava, A.; Wendland, E.C. Land Use and Climate Change Impacts on Runoff and Soil Erosion at the Hillslope Scale in the Brazilian Cerrado. Sci. Total Environ. 2018, 622–623, 140–151. [Google Scholar] [CrossRef] [PubMed]
- Vaezi, A.R.; Ahmadi, M.; Cerdà, A. Contribution of Raindrop Impact to the Change of Soil Physical Properties and Water Erosion under Semi-Arid Rainfalls. Sci. Total Environ. 2017, 583, 382–392. [Google Scholar] [CrossRef]
- Wei, W.; Chen, L.; Yang, L.; Fu, B.; Sun, R. Spatial Scale Effects of Water Erosion Dynamics: Complexities, Variabilities, and Uncertainties. Chin. Geogr. Sci. 2012, 22, 127–143. [Google Scholar] [CrossRef]
- Wen, X.; Zhen, L. Soil Erosion Control Practices in the Chinese Loess Plateau: A Systematic Review. Environ. Dev. 2020, 34, 100493. [Google Scholar] [CrossRef]
- Li, J.; Zhou, Z.X. Natural and Human Impacts on Ecosystem Services in Guanzhong—Tianshui Economic Region of China. Environ. Sci. Pollut. Res. 2016, 23, 6803–6815. [Google Scholar] [CrossRef]
- Liao, C.; Yue, Y.; Wang, K.; Fensholt, R.; Tong, X.; Brandt, M. Ecological Restoration Enhances Ecosystem Health in the Karst Regions of Southwest China. Ecol. Indic. 2018, 90, 416–425. [Google Scholar] [CrossRef]
- Peng, J.; Tian, L.; Liu, Y.; Zhao, M.; Hu, Y.; Wu, J. Ecosystem Services Response to Urbanization in Metropolitan Areas: Thresholds Identification. Sci. Total Environ. 2017, 607–608, 706–714. [Google Scholar] [CrossRef] [PubMed]
- Han, R.; Feng, C.C.; Xu, N.; Guo, L. Spatial Heterogeneous Relationship between Ecosystem Services and Human Disturbances: A Case Study in Chuandong, China. Sci. Total Environ. 2020, 721, 137818. [Google Scholar] [CrossRef]
- Zhang, Z.; Liu, Y.; Wang, Y.; Liu, Y.; Zhang, Y.; Zhang, Y. What Factors Affect the Synergy and Tradeoff between Ecosystem Services, and How, from a Geospatial Perspective? J. Clean. Prod. 2020, 257, 120454. [Google Scholar] [CrossRef]
- Raudsepp-Hearne, C.; Peterson, G.D. Scale and Ecosystem Services: How Do Observation, Management, and Analysis Shift with Scale—Lessons from Québec. Ecol. Soc. 2016, 21, 16. [Google Scholar] [CrossRef]
- de Groot, R.S.; Alkemade, R.; Braat, L.; Hein, L.; Willemen, L. Challenges in Integrating the Concept of Ecosystem Services and Values in Landscape Planning, Management and Decision Making. Ecol. Complex. 2010, 7, 260–272. [Google Scholar] [CrossRef]
- Bai, Y.; Chen, Y.; Alatalo, J.M.; Yang, Z.; Jiang, B. Scale Effects on the Relationships between Land Characteristics and Ecosystem Services- a Case Study in Taihu Lake Basin, China. Sci. Total Environ. 2020, 716, 137083. [Google Scholar] [CrossRef] [PubMed]
- Clerici, N.; Cote-Navarro, F.; Escobedo, F.J.; Rubiano, K.; Villegas, J.C. Spatio-Temporal and Cumulative Effects of Land Use-Land Cover and Climate Change on Two Ecosystem Services in the Colombian Andes. Sci. Total Environ. 2019, 685, 1181–1192. [Google Scholar] [CrossRef] [PubMed]
- Ma, S.; Wang, L.J.; Jiang, J.; Chu, L.; Zhang, J.C. Threshold Effect of Ecosystem Services in Response to Climate Change and Vegetation Coverage Change in the Qinghai-Tibet Plateau Ecological Shelter. J. Clean. Prod. 2021, 318, 128592. [Google Scholar] [CrossRef]
- Yohannes, H.; Soromessa, T.; Argaw, M.; Warkineh, B. Spatio-Temporal Changes in Ecosystem Service Bundles and Hotspots in Beressa Watershed of the Ethiopian Highlands: Implications for Landscape Management. Environ. Chall. 2021, 5, 100324. [Google Scholar] [CrossRef]
- Li, Y.; Zhang, L.; Qiu, J.; Yan, J.; Wan, L.; Wang, P.; Hu, N.; Cheng, W.; Fu, B. Spatially Explicit Quantification of the Interactions among Ecosystem Services. Landsc. Ecol. 2017, 32, 1181–1199. [Google Scholar] [CrossRef]
- Jiang, C.; Li, D.; Wang, D.; Zhang, L. Quantification and Assessment of Changes in Ecosystem Service in the Three-River Headwaters Region, China as a Result of Climate Variability and Land Cover Change. Ecol. Indic. 2016, 66, 199–211. [Google Scholar] [CrossRef]
- Khan, M.; Sharma, A.; Goyal, M.K. Assessment of Future Water Provisioning and Sediment Load under Climate and LULC Change Scenarios in a Peninsular River Basin, India. Hydrol. Sci. J. 2019, 64, 405–419. [Google Scholar] [CrossRef]
- Jianying, X.; Jixing, C.; Yanxu, L. Partitioned Responses of Ecosystem Services and Their Tradeoffs to Human Activities in the Belt and Road Region. J. Clean. Prod. 2020, 276, 123205. [Google Scholar] [CrossRef]
- Naidoo, R.; Balmford, A.; Costanza, R.; Fisher, B.; Green, R.E.; Lehner, B.; Malcolm, T.R.; Ricketts, T.H. Global Mapping of Ecosystem Services and Conservation Priorities. Proc. Natl. Acad. Sci. USA 2008, 105, 9495–9500. [Google Scholar] [CrossRef]
- Zhang, Y.; Liu, Y.; Zhang, Y.; Liu, Y.; Zhang, G.; Chen, Y. On the Spatial Relationship between Ecosystem Services and Urbanization: A Case Study in Wuhan, China. Sci. Total Environ. 2018, 637–638, 780–790. [Google Scholar] [CrossRef]
Figure 1.
Showing the flow chart of the data analysis for ecosystem services.

Figure 2.
Number of publications on ecosystem services for two decades.

Figure 3.
Number of publications on ecosystem services classification—chronology. Where PES indicates provisioning ecosystem services, RES is regulating ecosystem services, CES is cultural ecosystem services and SES is supporting ecosystem services.
Figure 3.
Number of publications on ecosystem services classification—chronology. Where PES indicates provisioning ecosystem services, RES is regulating ecosystem services, CES is cultural ecosystem services and SES is supporting ecosystem services.

Figure 4.
Number of publications on ecosystem services classification. Where PES denotes provisioning ecosystem services, RES is regulating ecosystem services, CES is cultural ecosystem services, and SES is supporting ecosystem services.
Figure 4.
Number of publications on ecosystem services classification. Where PES denotes provisioning ecosystem services, RES is regulating ecosystem services, CES is cultural ecosystem services, and SES is supporting ecosystem services.

Figure 5.
Number of publications on assessment models of ecosystem services.

Figure 6.
Trend of world’s ecosystem service publications.

Figure 7.
Trend of Asia’s ecosystem service publications.

Figure 8.
Indian Ecosystem service Publication trends.


Table 1.
Criteria of Review with Feasible entries.
| Criterion | Feasible Entry |
|---|---|
| Source | Science Direct database |
| Paper type | Research Paper |
| Data type | Quantitative data, Qualitative data |
| Spatial measurement scale | Local, regional, national, global scale |
| ES indicators | 4 types of ES indicators |
Table 2.
Studies conducted on ESs in India.
| Author (s) and Study Year | Region | ES Categories Studied (P, R, S, C) | Number of ES Assessed | Grain | Methodology Used to Access ES |
|---|---|---|---|---|---|
| Giri et al. [76] | South Asia, Pakistan, Bangladesh, and India (Goa and Sundarbans) | S | 1 | Goa–23.5 m Sundarbans–30 m | GIS and ERDAS (unsupervised, ISODATA) |
| Srinivasarao et al. [91] | Semi-arid tropics of India | P, R | 2 | Survey | |
| Shah & Garg [92] | Cascading Framework | ||||
| Sahani & Rahavaswamy [79] | Khammam, Telangana | P, R, C | 3 | Municipality | GIS with LULC base and Shannon’s entropy |
| Ramachandra et al. [88] | Western Ghats, Karnataka | S | 1 | 160,000 km2 Mountain | GIS with Markov Analysis |
| Shukla et al. [14] | Upper Ganga basin | P | 1 | 22,292 km2 Wetland | GIS with Pearson’s correlation and multiple linear regression |
| Prasad et al. [77] | Palk Bay | S | 1 | 330 km2 Wetland | Sampling design |
| Malik & Rai [80] | Himachal Pradesh | P, R | 2 | 12,562 km2 Wetland | GIS and ERDAS Imagine, Socioecological interviews |
| Sannigrahi et al. [81] | Sundarbans | P, R, S, C | 17 | 4264 km2 | GIS using LULC analysis and ESV |
| Sannigrahi et al. [82] | Sundarbans | P, R, S | 5 | 4264 km2 | NPP with InVEST and CA-Markov |
| Shukla et al. [13] | Upper Ganga basin | P | 1 | 22,292 km2 Wetland | Soil and Water Assessment Tool (SWAT) with MANOVA |
| Padhy et al. [83] | Sundarbans | R | 2 | 4264 km2 | Sampling design |
| Talukdar et al. [84] | Lower Gangetic plain | P, R, S, C | 17 | GIS using LULC analysis and ESV | |
| Ramachandra & Bharath [87] | Western Ghats, Karnataka | P, R, S | 3 | 160,000 km2 Mountain | GIS with Markov Analysis |
| Debanshi & Pal [89] | Ganges- Brahmaputra delta | P, S | 3 | 6358.21 km2 Wetland | Artificial Neural Network (ANN) and Support Vector Machine (SVM) |
| Babu et al. [90] | Mizoram | R | 2 | 22.0 Mha | Sampling design |
| Das et al. [85] | Kolkata | P, R, S, C | 17 | Metropolitan area | GIS using LULC analysis and EH |
| Sinclair et al. [86] | Ashtamudi lake Ramsar, Kerala | P, S | 3 | 56 km2 Wetland | Questionnaire and sampling, econometric model |
| Sen & Guchhait [43] | Bardhaman | C | 5 | Municipality | field survey with semi-structured questionnaire |
| Pathak et al. [93] | Upper Ganga basin | P | 1 | 22,292 km2 Wetland | mean Lumped Zhang model with InVEST |
Where P denotes provisioning ES, R is regulating ES, S is supporting ES, and C is cultural ES.
Publisher’s Note: MDPI stays neutral with regard to jurisdictional claims in published maps and institutional affiliations. |
© 2022 by the authors. Licensee MDPI, Basel, Switzerland. This article is an open access article distributed under the terms and conditions of the Creative Commons Attribution (CC BY) license (https://creativecommons.org/licenses/by/4.0/).
Share and Cite
MDPI and ACS Style
Deeksha; Shukla, A.K. Ecosystem Services: A Systematic Literature Review and Future Dimension in Freshwater Ecosystems. Appl. Sci. 2022, 12, 8518. https://0-doi-org.brum.beds.ac.uk/10.3390/app12178518
AMA Style
Deeksha, Shukla AK. Ecosystem Services: A Systematic Literature Review and Future Dimension in Freshwater Ecosystems. Applied Sciences. 2022; 12(17):8518. https://0-doi-org.brum.beds.ac.uk/10.3390/app12178518
Chicago/Turabian StyleDeeksha, and Anoop Kumar Shukla. 2022. "Ecosystem Services: A Systematic Literature Review and Future Dimension in Freshwater Ecosystems" Applied Sciences 12, no. 17: 8518. https://0-doi-org.brum.beds.ac.uk/10.3390/app12178518
Note that from the first issue of 2016, this journal uses article numbers instead of page numbers. See further details here.