Article

Effects of the Operational Parameters in a Coupled Process of Electrocoagulation and Advanced Oxidation in the Removal of Turbidity in Wastewater from a Curtember

by
Paul Alcocer-Meneses
1,
Angel Britaldo Cabrera-Salazar
1,
Juan Taumaturgo Medina-Collana
1,
Jimmy Aurelio Rosales-Huamani
2,*,
Elmar Javier Franco-Gonzales
2 and
Gladis Enith Reyna-Mendoza
1
1
Water Treatment Process Engineering Research Center, Faculty of Chemical Engineering, National University of Callao, Juan Pablo II 306 Avenue, Bellavista, Callao 07011, Peru
2
Multidisciplinary Sensing, Universal Accessibility and Machine Learning Group, Faculty of Geological, Mining and Metallurgical Engineering, National University of Engineering, Lima 15333, Peru
*
Author to whom correspondence should be addressed.
Submission received: 28 May 2022 / Revised: 3 July 2022 / Accepted: 14 July 2022 / Published: 15 August 2022
(This article belongs to the Special Issue Water Quality Modelling, Monitoring and Mitigation)

Abstract

:
The tannery industry during its process generates various polluting substances such as organic matter from the skin and chemical inputs, producing wastewater with a high concentration of turbidity. The objective of this research is to evaluate the most appropriate operational parameters of the coupled process of electrocoagulation and advanced oxidation to achieve the removal of turbidity in wastewater from a tannery in the riparian zone (tannery). This process uses a direct current source between perforated aluminum electrodes of circular geometry submerged in the effluent, which causes the dissolution of the aluminum plates. For our study, an electrocoagulation unit coupled to an ozone generator has been built at the laboratory level, where the influence of five factors (voltage, inlet flow to the reactor, initial turbidity, pH, and ozone flow) has been studied with three levels with regarding turbidity, using the Taguchi experimental methodology. The optimal conditions for the removal of turbidity were obtained at 10 volts, 7.5 pH, 360 L/h of wastewater recirculation flow rate; 2400 mg/h of ozone flow rate; and 1130 NTU of initial turbidity of the sample in 60 min of treatment reaching a removal of 99.75% of the turbidity. Under optimal conditions, the removal of chemical oxygen demand (COD) and biochemical oxygen demand (BOD) was determined, reaching a removal percentage of 33.2% of COD and 39.36% of BOD was achieved. Likewise, the degree of biodegradability of the organic load obtained increased from 0.467 to 0.553.

1. Introduction

The leather trade can be an economic problem for developing countries that produce a good type of product from animal leather, such as footwear, luggage, and clothing. However, its production has a terribly high environmental footprint [1]. In addition, considering the enormous quantity and low biodegradability of the chemical products present in the productive cycle of tannery work, the wastewater from said process represents a great environmental and technological inconvenience [2]. In [3], the authors mentioned that the Electrocoagulation (EC) is often considered as an alternate treatment methodology with several advantages such as easy instrumentality, simple operation and automation, a brief retention time, low sludge production, and no chemical necessities.
Other studies have stated that Electrocoagulation mixtures and alternative technologies have been designed to treat high concentration organic waste material such as the textile trade and mixed industries [4,5]. In [6], mentioned that the use of EC as the only treatment process could face serious practical limitations, especially if the wastewater is highly contaminated. Therefore, there is a need for an efficient and relatively inexpensive treatment process. Due to this, the use of a post- or pre-treatment process with the EC will improve its performance, as mentioned by several studies that have described more profitable combined treatment systems [6,7].
The authors of [8] published a review that includes EC combined with other treatment processes such as: electrocoagulation–ozone, electrocoagulation–adsorption, electrocoagulation–ultrasound, and electrocoagulation–pulses. In his work, the authors also mention about the performance of these combined systems.
According to [9] Electrocoagulation (EC) is used in chemical science water treatment techniques where anode electrodes (aluminum, Al, or iron, Fe) area unit are dissolved in place, which promote coagulation and succeeding removals of pollutants and also the concurrent reduction of turbidity from water and wastewater. EC relies on the physical–chemical method of destabilization of mixture systems below the action of a right away current [10].
The electrodes dissolve according to Equations (1) and (2) to provide coagulant metal ions (Al 3 + or Fe 2 + /Fe 2 ) into the water, and these instantaneously carries rapid hydrolysis.
Anode reactions:
Al ( s ) Al ( aq ) 3 + + 3 e E 0 = 1.66 V
Fe ( s ) Fe ( aq ) 3 + + 3 e E 0 = 0.04 V
When the anode potential is sufficiently high, secondary reactions may occur, especially oxygen evolution, according to Equation (3)
2 H 2 O ( l ) O 2 ( g ) + 4 H ( aq ) + + 4 e E 0 = 1.66 V
Simultaneously with the anode reaction, water molecules H 2 O break down at the cathode, producing hydrogen gas H2 and OH ions, according to Equation (4).
Cathode reaction:
H 2 O ( l ) + 2 e H 2 ( g ) + OH ( aq ) E 0 = 1.66 V
The electrical energy applied to the anode dissolves the aluminum into the solution which then reacts with the hydroxyl ion from the cathode to form aluminum hydroxy. The most significant advantage of electrocoagulation is avoiding any addition of chemical substances thus reducing the likelihood of secondary pollution; the dosing of coagulator depends on the cell potential (or current density) applied [11]. Other advantages are the simple equipment, so requiring less maintenance and straightforward automation of the method [12].
Standard treatments for cloudiness removal have many disadvantages, such as the use of enormous amounts of chemicals and generating large amounts of sludge that causes disposal issues and therefore the loss of water. Then in [13] mentioned that the combination of ultrasound technique with different processes such as electrocoagulation, electro-Fenton, and electrooxidation could be important to achieve effective decomposition of organic contaminants in wastewater. Independently in [14] mentioned the integrated sonoelectro-Fenton (SEF) method could be a novel methodology for the removal of paracetamol (PCT) waste material from liquid solutions through synthesized iron ore (Fe 2 O 3 ) nanoparticles.
The novelty of our study was the design of the electrocoagulation cell with perforated plates installed vertically, improving the mixture of ozone with the residual water and the ions generated by the electrodes. In this way, reducing areas of stagnation in the electrocoagulation cell that produce passivation of the electrodes, causing a decrease in the efficiency of the process.
The objective of this study was to examine the treatment of wastewater from the tanning industry, through the electrocoagulation process, the impact of the factors electrical potential, feed flow, initial concentration of turbidity, pH, and ozone flow on the percentage reduction of turbidity and energy consumption, based on the Taguchi methodology.

2. Materials and Methods

2.1. Effluent Sample Collection

The samples were collected from the operations corresponding to the riparian zone (pre-soaking, main soaking, peeling, descaling, and purging or delivery), from the tannery located in the district of Ate Vitarte, Lima (Peru). Each sample was collected and then homogenized and allowed to stand for 3 h. These samples came from a process of transformation of sheep skins preserved with salt, with hair destruction technology.
A part of the sample was sent to a specialized laboratory, applying the corresponding monitoring protocols to know the physicochemical characteristics, as illustrated in Table 1.

2.2. Analytical Methods

The turbidity was measured by Ezodo model TUB-430, turbidimeter, to determine the pH, conductivity and total dissolved solids, the Multiparameter equipment (pH, EC, TDS, T C), HANNA brand was used. To determine the voltage and current intensity, the Digital Hook Multimeter (amps, voltage, temperature, etc.) was used.

2.3. Design of Experiment

The optimization of wastewater turbidity removal using Aluminum electrodes was performed using the Taguchi Design. Five important factors such as voltage, feed flow, effluent concentration, pH, and ozone flow were used as independent variables where their combined effects were examined, while the percentage of turbidity removal was the dependent variable.
This was performed to determine the best conditions for the optimum removal of turbidity from the wastewater. The experimental design involves varying the independent variable at three different levels (−1, 0, +1). The experimental range and levels of the independent variables are presented in Table 2. In this work, a set of 27 experiments with two replicates, the mean shown in Table 3. Where the levels of the applied electrical potential were acquired from the work developed by [15] and to select the pH range the research work provided by [16] was taken.
The interactive effects of the independent (process) variables on the dependent variable (response) were examined using the analysis of variance (ANOVA) as shown in Table 4.

2.4. Electrocoagulation Reactor

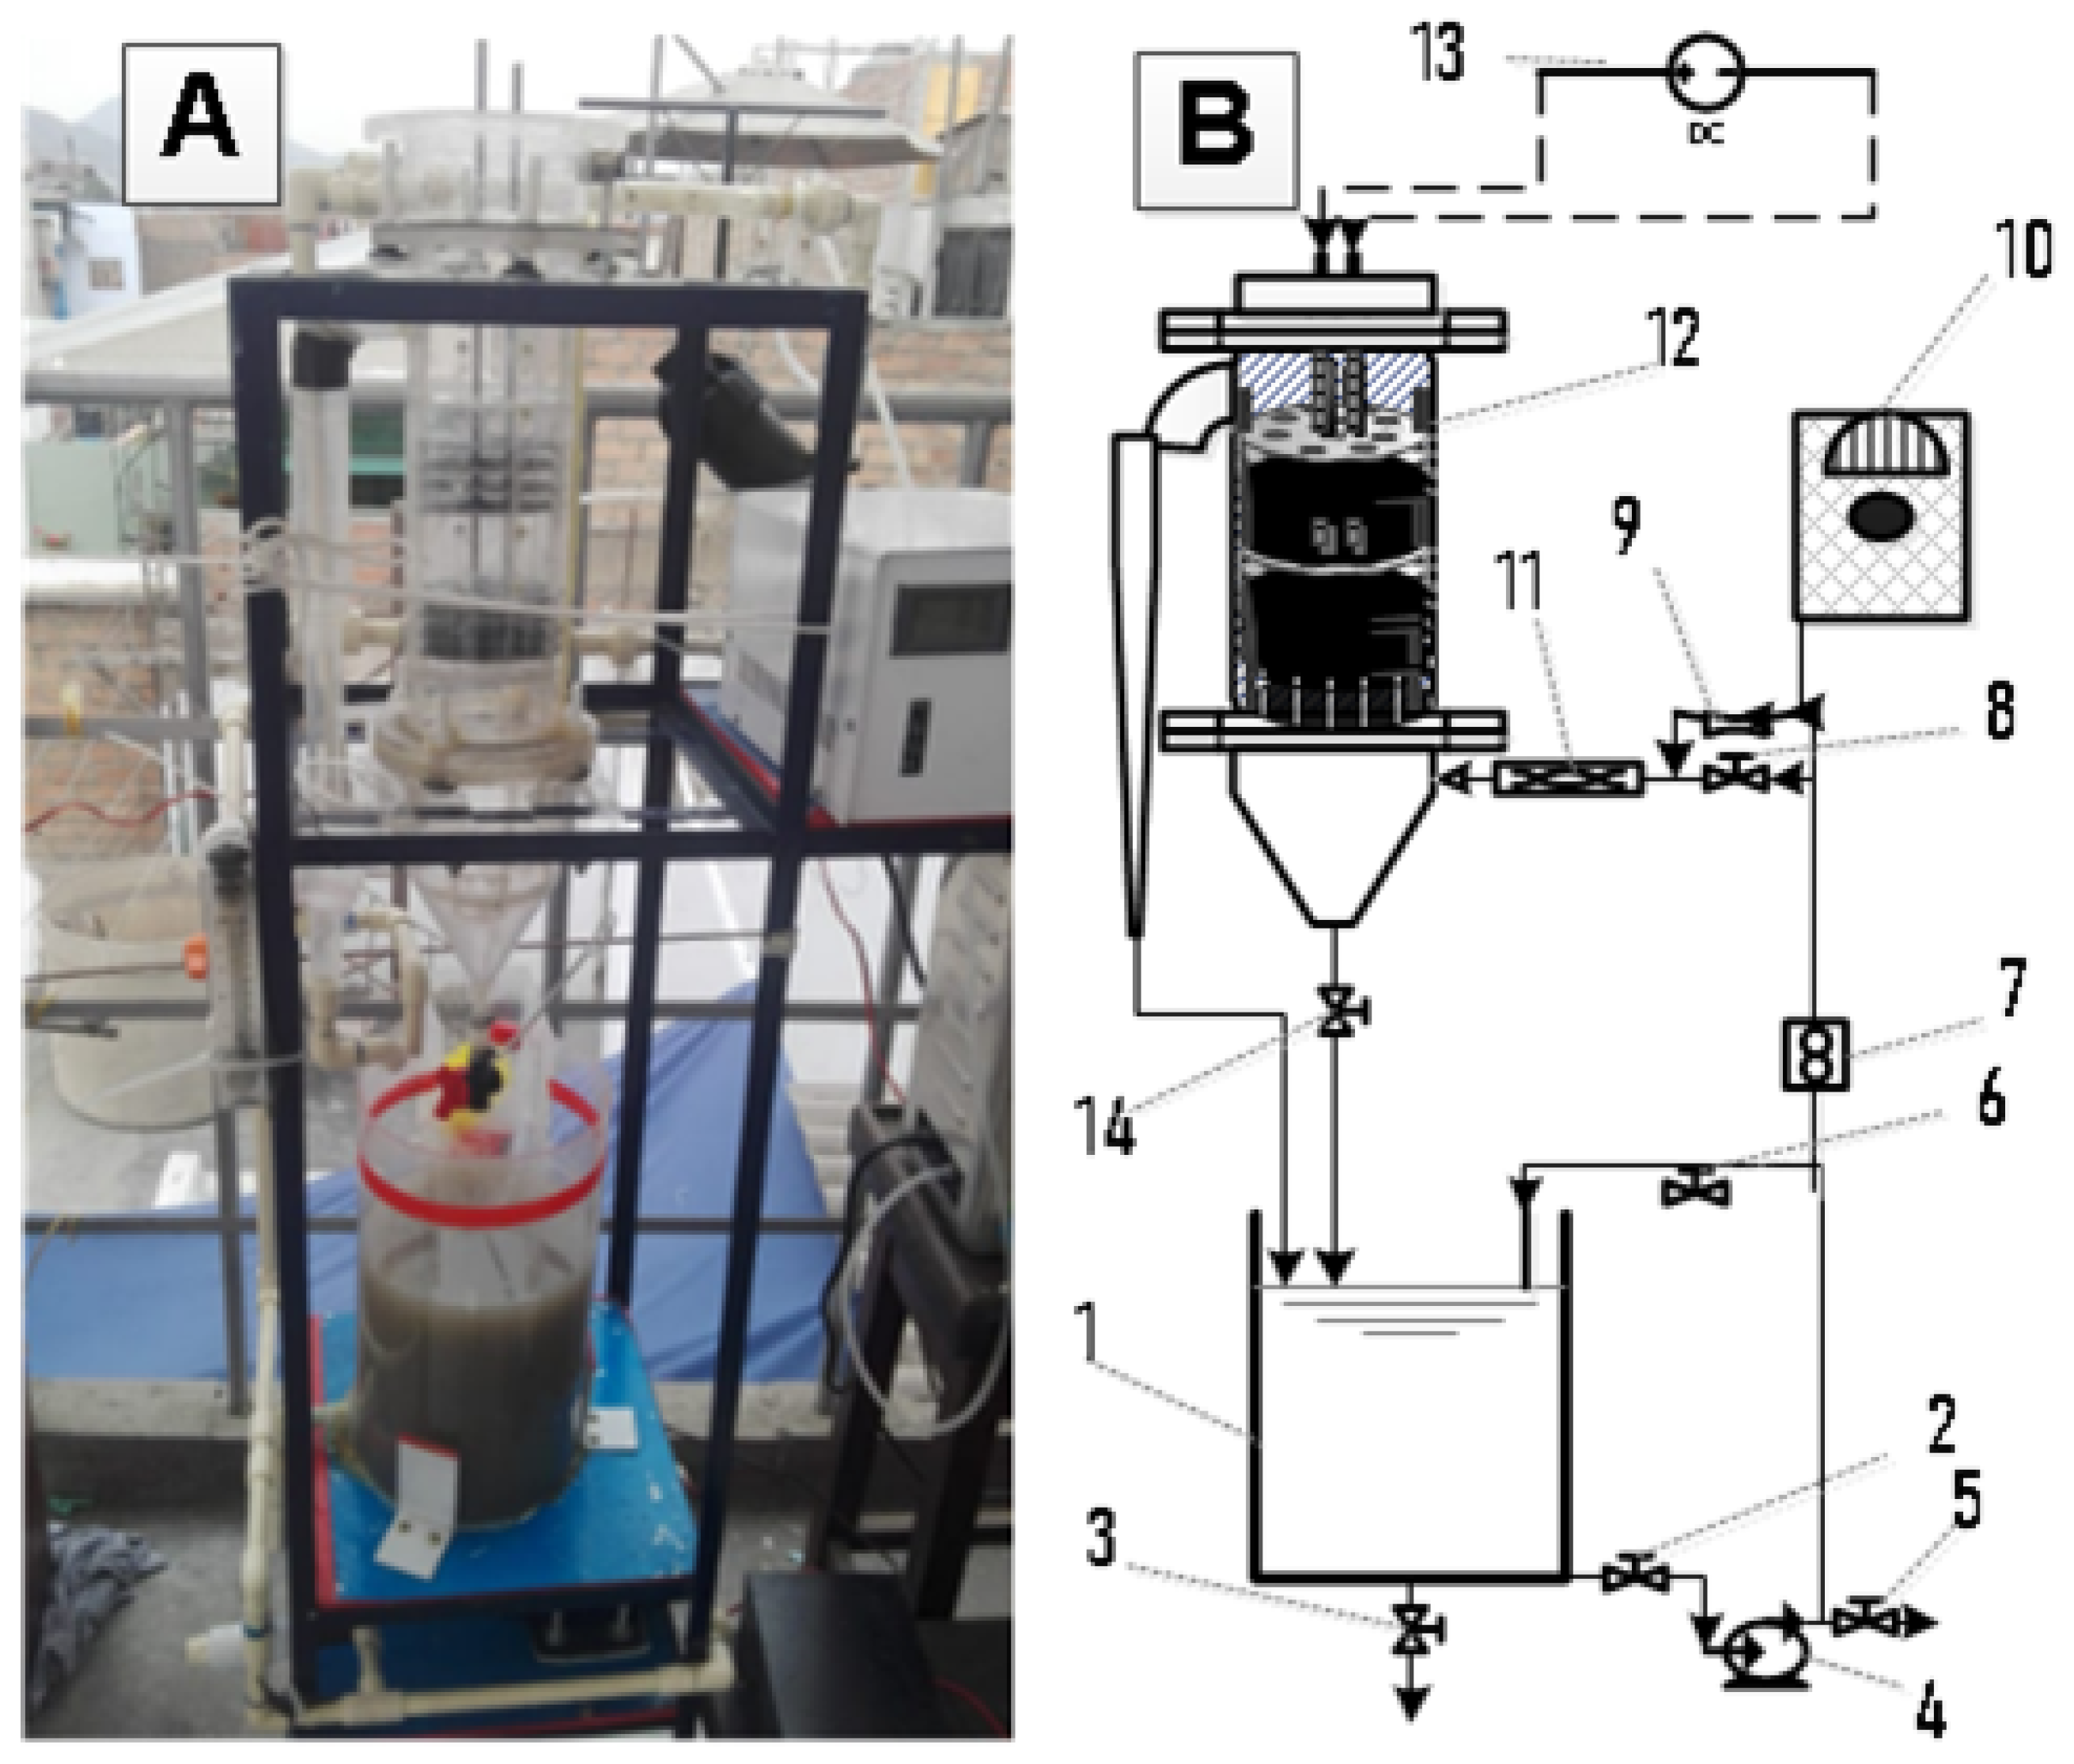
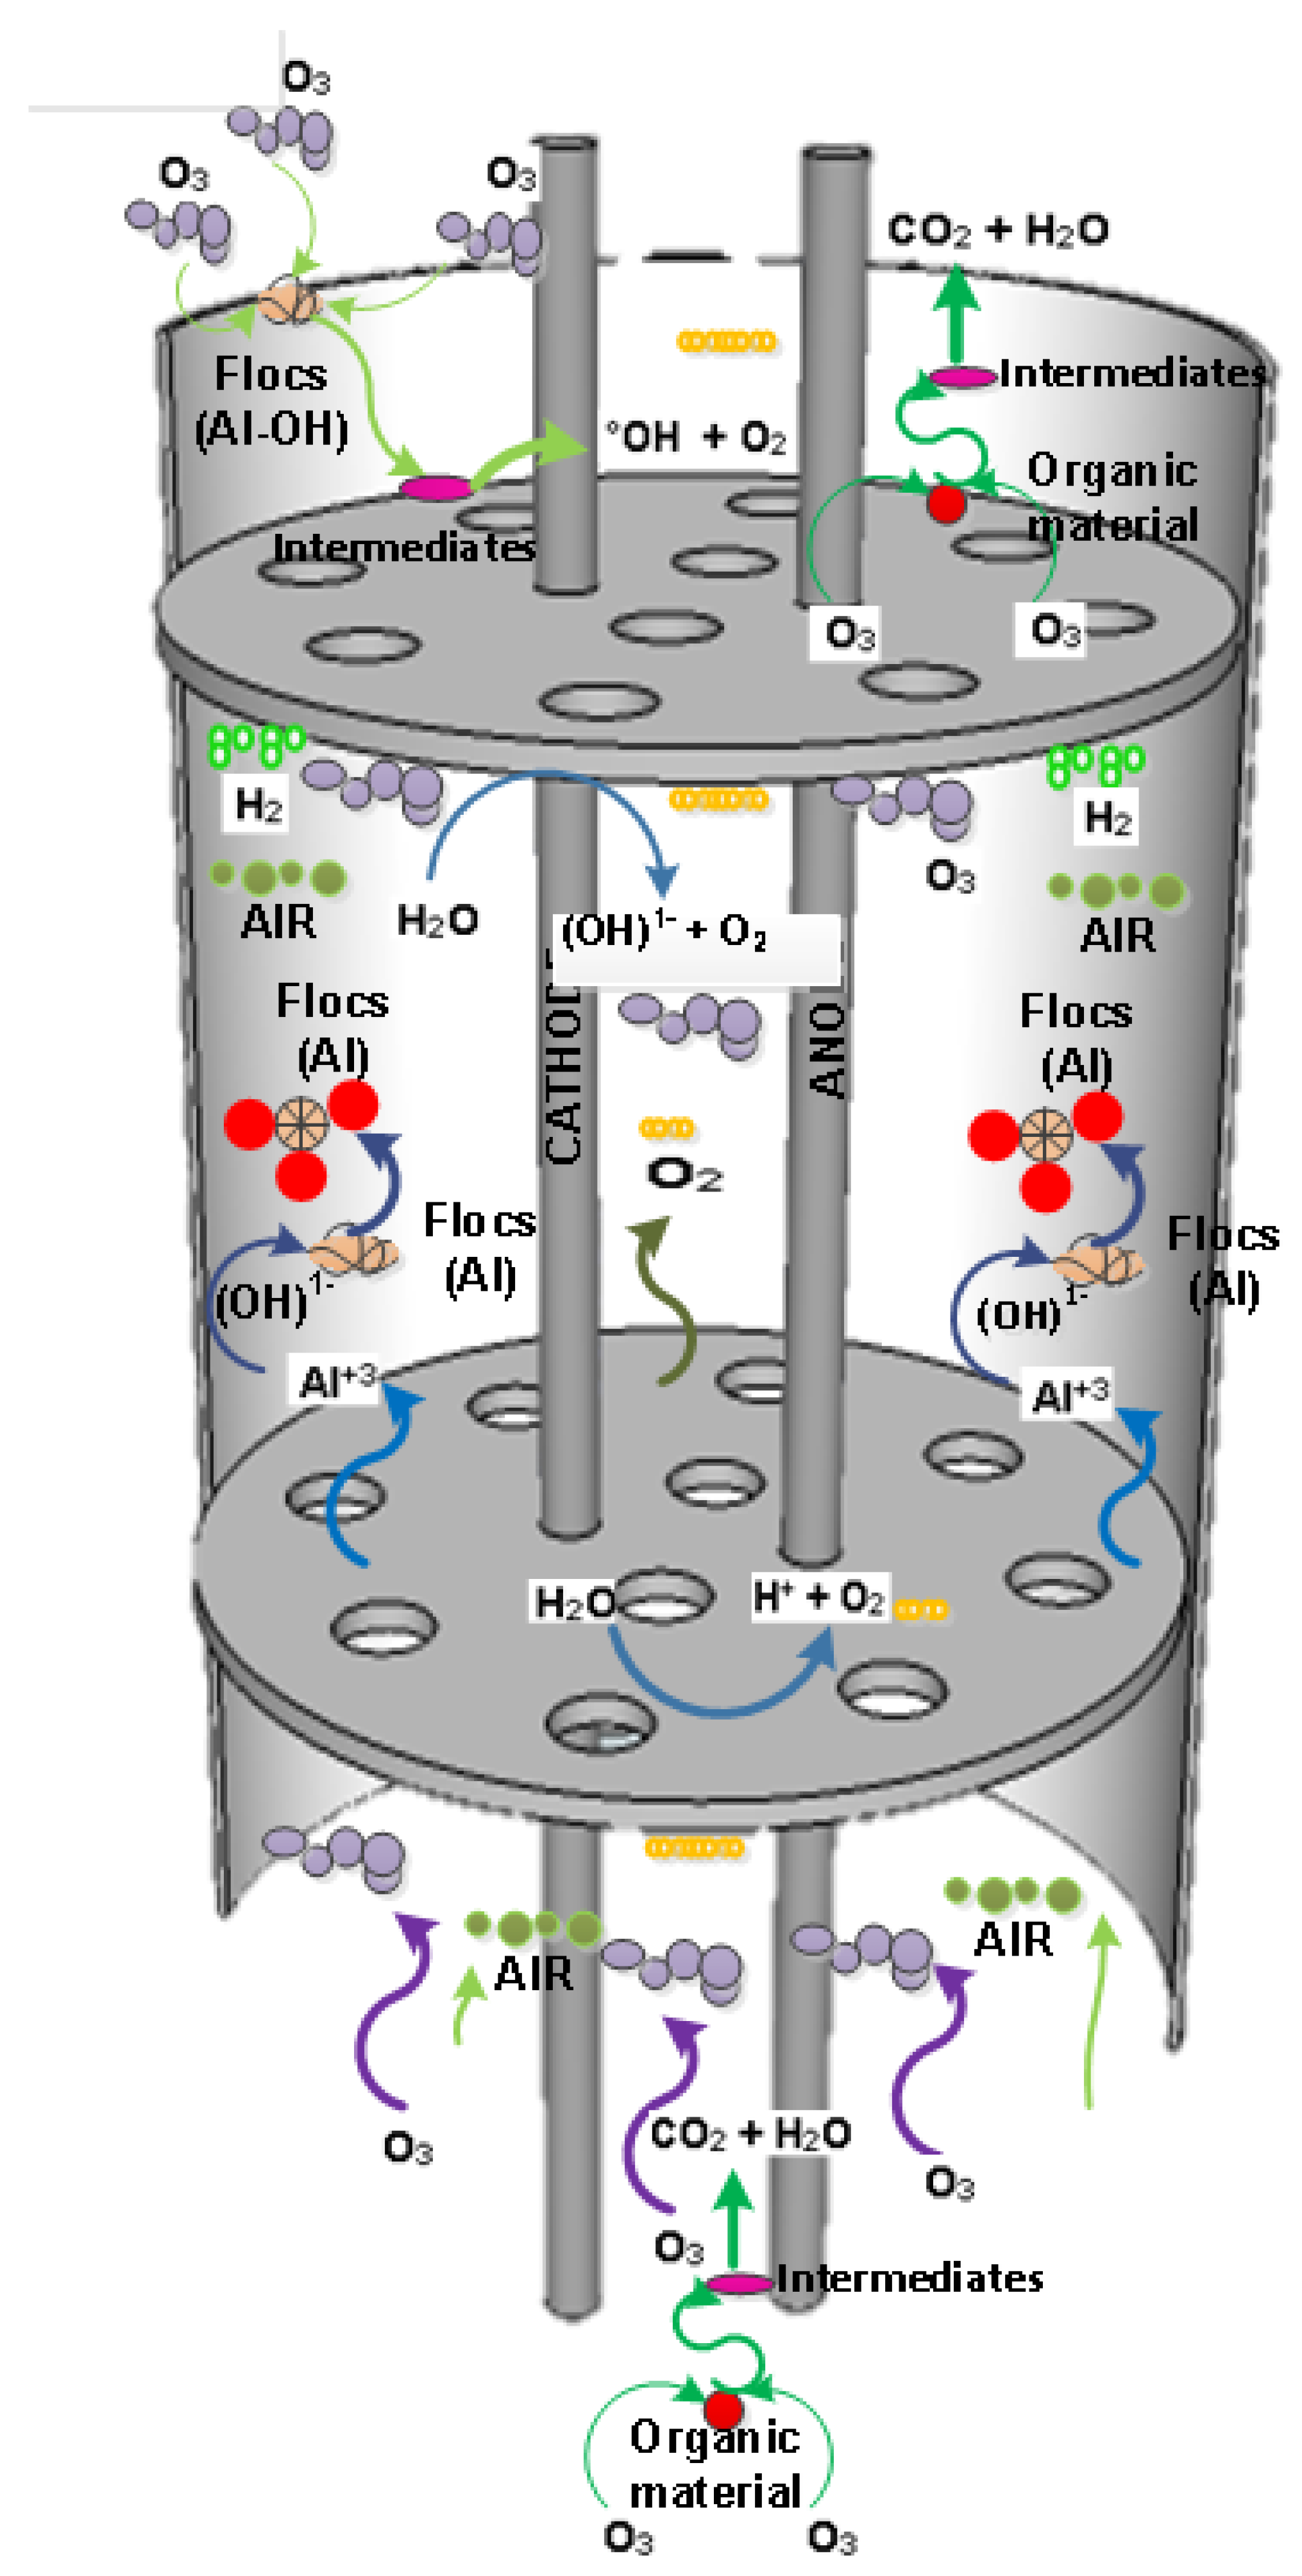
The EC experiments were performed by a batch process using a 7 L capacity of a cylindrical reactor, the configuration (Figure 1) of the electrochemical reactor has a cylindrical shape, aluminum electrodes were used both for the anode and for the circular cathode (Perforated plates), we work with a configuration of parallel monopolar electrodes, with a separation of 1 cm as mentioned in [17,18,19], and the specific area of each electrode was 0.014 cm 2 . Each electrode was 10 cm (diameter) with 10 holes of 10 mm diameter each, by 0.3 cm (thickness), the number of electrodes used were four. The EC cell was configured for the vertical water flow of the feed water that was delivered by a peristaltic pump. Accessory (ACC) power supply was connected (0–15 volts). Before installation in the EC unit, each plate was weighed to allow the calculation of the mass consumed after the tests. Each experiment was continued for 60 min, which was considered enough to achieve a stable operation. Ozone was coupled to the system by means of venturi, the ozone generating equipment has a capacity of (0 to 3 g O 3 /h).
All experiments were performed at room temperature (nominally 20 C). After the seating time elapsed, the samples were removed from a depth of 2 cm using a syringe and measured using the turbidity meter. The electrodes were cleaned in a solution of low concentration hydrochloric acid (0.04 M) and another caustic soda solution (0.08 M) to remove the remains stuck on the surface of the electrodes; they were finally washed with distilled water for reuse. The arrangement of the electrodes consisted of two cathodes that were interspersed with two anodes connected by stainless steel rods to other arranged and then the samples were periodically taken every 10 min for the measurement of turbidity. The power was supplied to the electrodes with a Direct Current (DC) power supply.
An improvement over other reported works [15,20,21] is the configuration of the experimental equipment used. In this investigation, an electrocoagulation cell with perforated circular electrodes has been built. This design allows for improved mixing, longer residence time for the effluent and ozone. therefore the mechanisms used in this hybrid process are improved such as sedimentation [15,22]. A disadvantage compared to other configurations of electrocoagulation cells is the maintenance of the electrodes, which is relatively easy.

2.5. The Main Calculations of Electrocoagulation Process

The reduction rate of turbidity, expressed in percentage “T” (%), was calculated using Equation (5).
T ( % ) = T i T f T i × 100 %
where T i and T f represent initial and final turbidity, respectively. Electrical energy consumption is a very important economical parameter in the electrocoagulation process. The electrical energy consumption was calculated using the following Equation (6) [23].
C . E . = U V m 0 3600 I ( t ) d t
  • C . E . is the energy consumption (kWh/m 3 )
  • U is the applied voltage (V)
  • V m is the treated volume of the sample (L).
The integral represents the intensity value multiplied with time in seconds.
The amount of dissolved electrode was calculated theoretically using Faraday’s law [24], through the following Equation (7).
m = M n F t . inicial t . final I ( t ) d t
  • m is the aluminum mass (g) in the electrolytic cell
  • I is the intensity of the current (A)
  • t is the electrocoagulation time (s), M is the molecular weight of the anode (g/mol)
  • z is The chemical equivalence, F is the faraday constant (96,500 c/mol)
  • ( M A l = 26,982 g/mol)
  • n is the valence of the ions of the electrode material ( n A l = 3.0 ).

3. Results

The results of our experiment are shown below. Complementing the results of Table 3, the standard deviation has been evaluated with respect to the mean of the percentage of turbidity removal and Energy consumption whose results are shown in Table 5. Then we show the physicochemical parameters obtained in Table 6.

3.1. Main Effect of Variables

The main effect plots for the six operating variables are given in Figure 2. The main effects of the tested variables were calculated by averaging the experiment results achieved at each level for each variable. This plot was obtained from Table 3 and is used to visualize the relation between variables and the output response.

3.1.1. Comparison of Ozonation, Electrocoagulation, and Ozone-Assisted Electrocoagulation

From Figure 3 we observe that for the initial turbidity of 655 NTU of the sample, when the process is hybrid (electrocoagulation and ozone), a turbidity of 4.19 NTU is reached (99.36% turbidity removal). In the electrocoagulation process, a turbidity of 18.34 NTU (97.2%) is obtained and through ozone up to 196.6 NTU (69.98%) is reached, therefore it is concluded that the hybrid and electrocoagulation process reach yields above 97% for removal of turbidity. We also observed that the removal of turbidity in the three processes is achieved in the first 20 initial minutes of treatment. In the work of [25] indicated that the combined electrocoagulation/ozonation process improved both the degradation rate and the maximum removal of COD compared to the electrocoagulation and ozonation processes alone.

3.1.2. Initial pH Effect

From Table 3, trials 1, 4, 10, 20, 24, and 27 have been plotted as they are the most representative. Then it is observed from Figure 4 that for experiments 1 and 10 the pH of the sample increases with the treatment time. For experience 27, a pH of 8.21 is reached and is attributed mainly to the increase in electrical potential (10 volts). When the initial pH is 7.5 for experiences 4 and 20, the increase is not very significant, reaching a final value of 8.54. Finally, when the sample has an initial pH of 10.8 in tests 10 and 24, a decrease is observed, reaching a value of 9.21.
The tannery industry generates effluents with a wide pH range, from pH = 3.5 to pH = 11; on the other hand, studies show that pH has a significant impact on electrocoagulation performance. The increase in pH is a consequence of the formation of Al 3 + which precipitates due to the presence of other anions, as well as the precipitation of aluminum hydroxide; however when the pH starts at alkaline, the decrease in pH is the result of the formation of Al(OH) 4 1 [26].

3.1.3. Effect of Initial Turbidity

According to Figure 5B, a greater reduction in turbidity is observed as the initial turbidity is less than 1130 NTU, this behavior could be explained because the amount of flocs formed is sufficient for their adsorption and thus quickly decrease turbidity. This trend is also deduced from Faraday’s law, which states that Al 3 + released to the solution for the same applied solution is constant [27].
The proposed mechanism for the reduction of turbidity by means of the hybrid system of electrocoagulation and ozone is shown in Figure 6. This consists of destabilizing the colloidal particles and forming larger flocs, in which the contaminants are trapped and these flocs can be separated from the solution by flotation or sedimentation [28]. The dissolved air flotation mechanism is effective in reducing the organic load [29] and dissolved ozone flotation gives efficient results in the removal of suspended solids [30,31]. For soluble contaminants, aluminum-based coagulants can act as catalysts for ozone and generate hydroxyl formation [22] and also oxidize surface functional groups of colloidal contaminants that promote colloid aggregation.

3.1.4. Feed Flow Effect

According to Figure 5C, as the feed flow increases (240 to 360 L/h) there is an increase in the reduction of turbidity, this could be attributed as the feed flow increases towards the reactor, there is a greater formation of bubbles, this is influenced by the principle of hydrodynamic cavitation that forms in the Venturi tube [32]. As a consequence, the flotation mechanism predominates to reduce turbidity, this formation of bubbles increases when working under acidic conditions, forming two phases (80% foam and 20% liquid) [33]. However, this generation of bubbles generates a problem in the electrodes (activation polarization), generating an increase in voltage and a decrease in electrical current, thus an increase in energy consumption [34].

3.1.5. Ozone Flow Effect

Ozone flow is one of the factors that has the least influence on reducing turbidity, as can be seen in Figure 5D. Furthermore, in Figure 2, we observe that the mass flow of ozone does not have much influence on the removal of turbidity. In [35], mentioned that for the activation of ozone and its transformation into hydroxide ion (OH ), it is achieved through electroreduction, which in this case would help in the oxidation either directly or indirectly to the components present in the effluent (organic matter, nitrates, sulfides, etc.). To oxidize the sulfur, ozone is an alternative to the traditional ions (Fe 2 + , O 2 , etc.), as verified in the research work [36].

4. Discussion

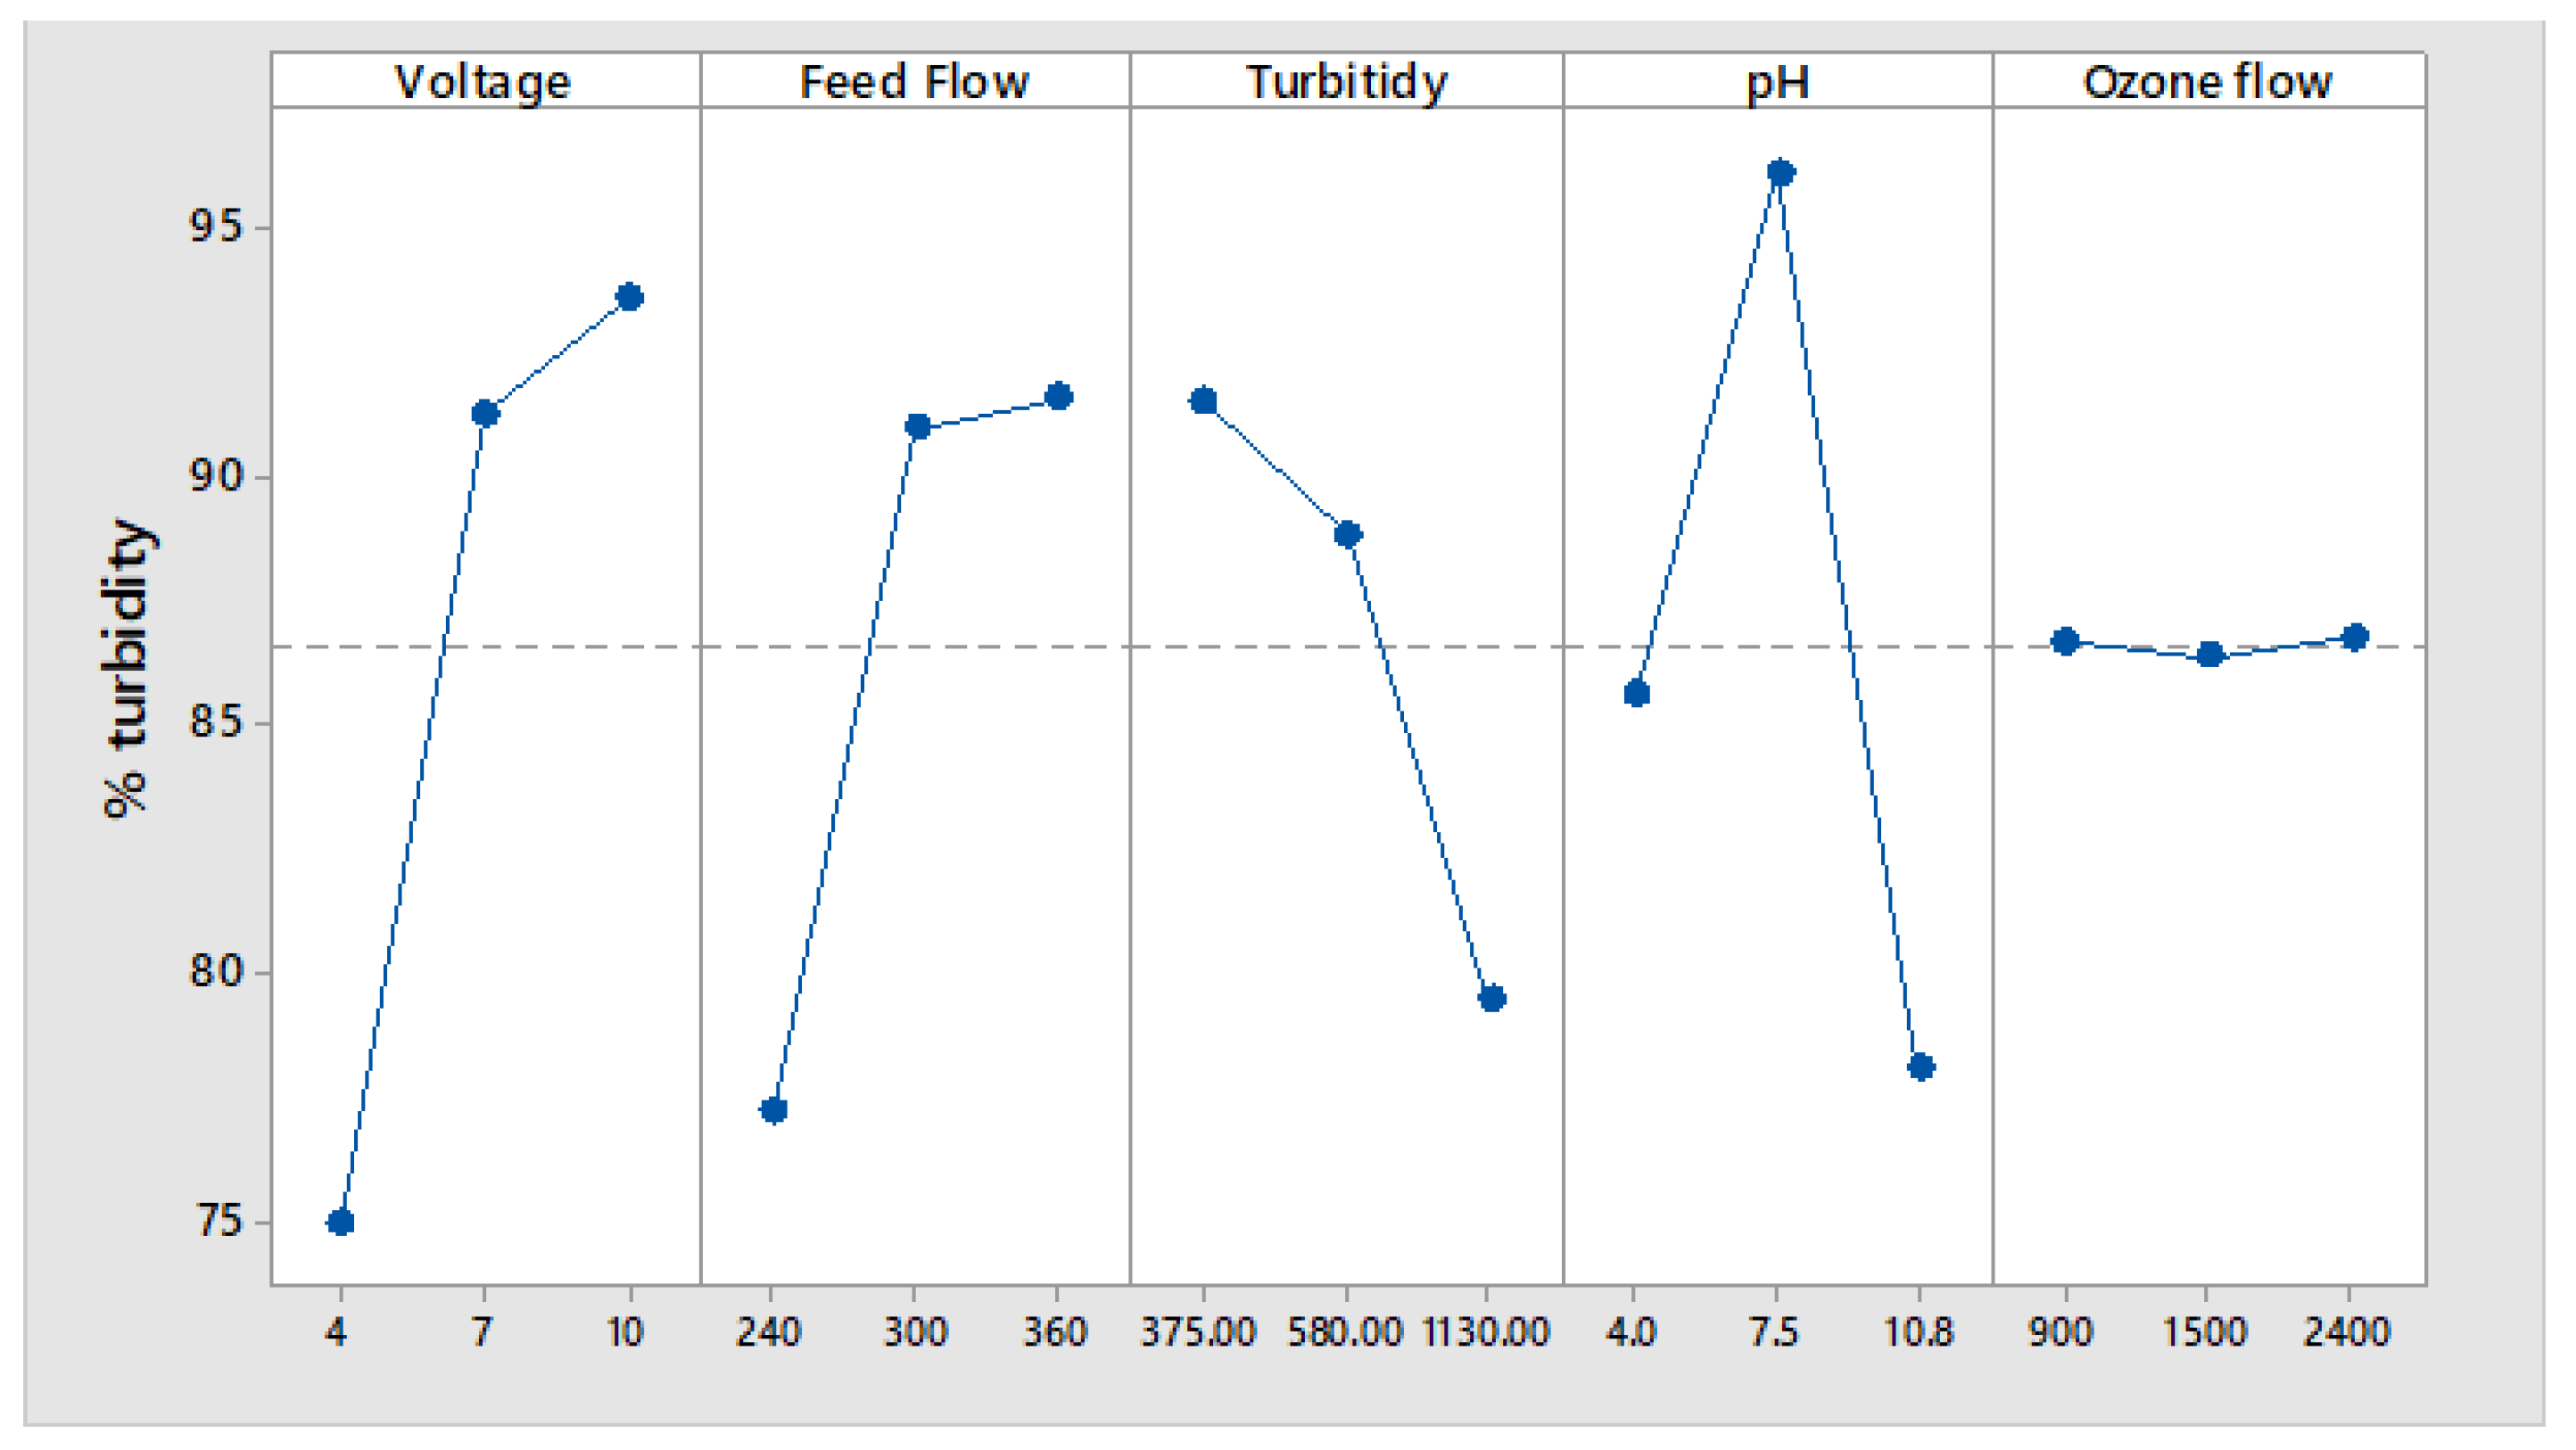
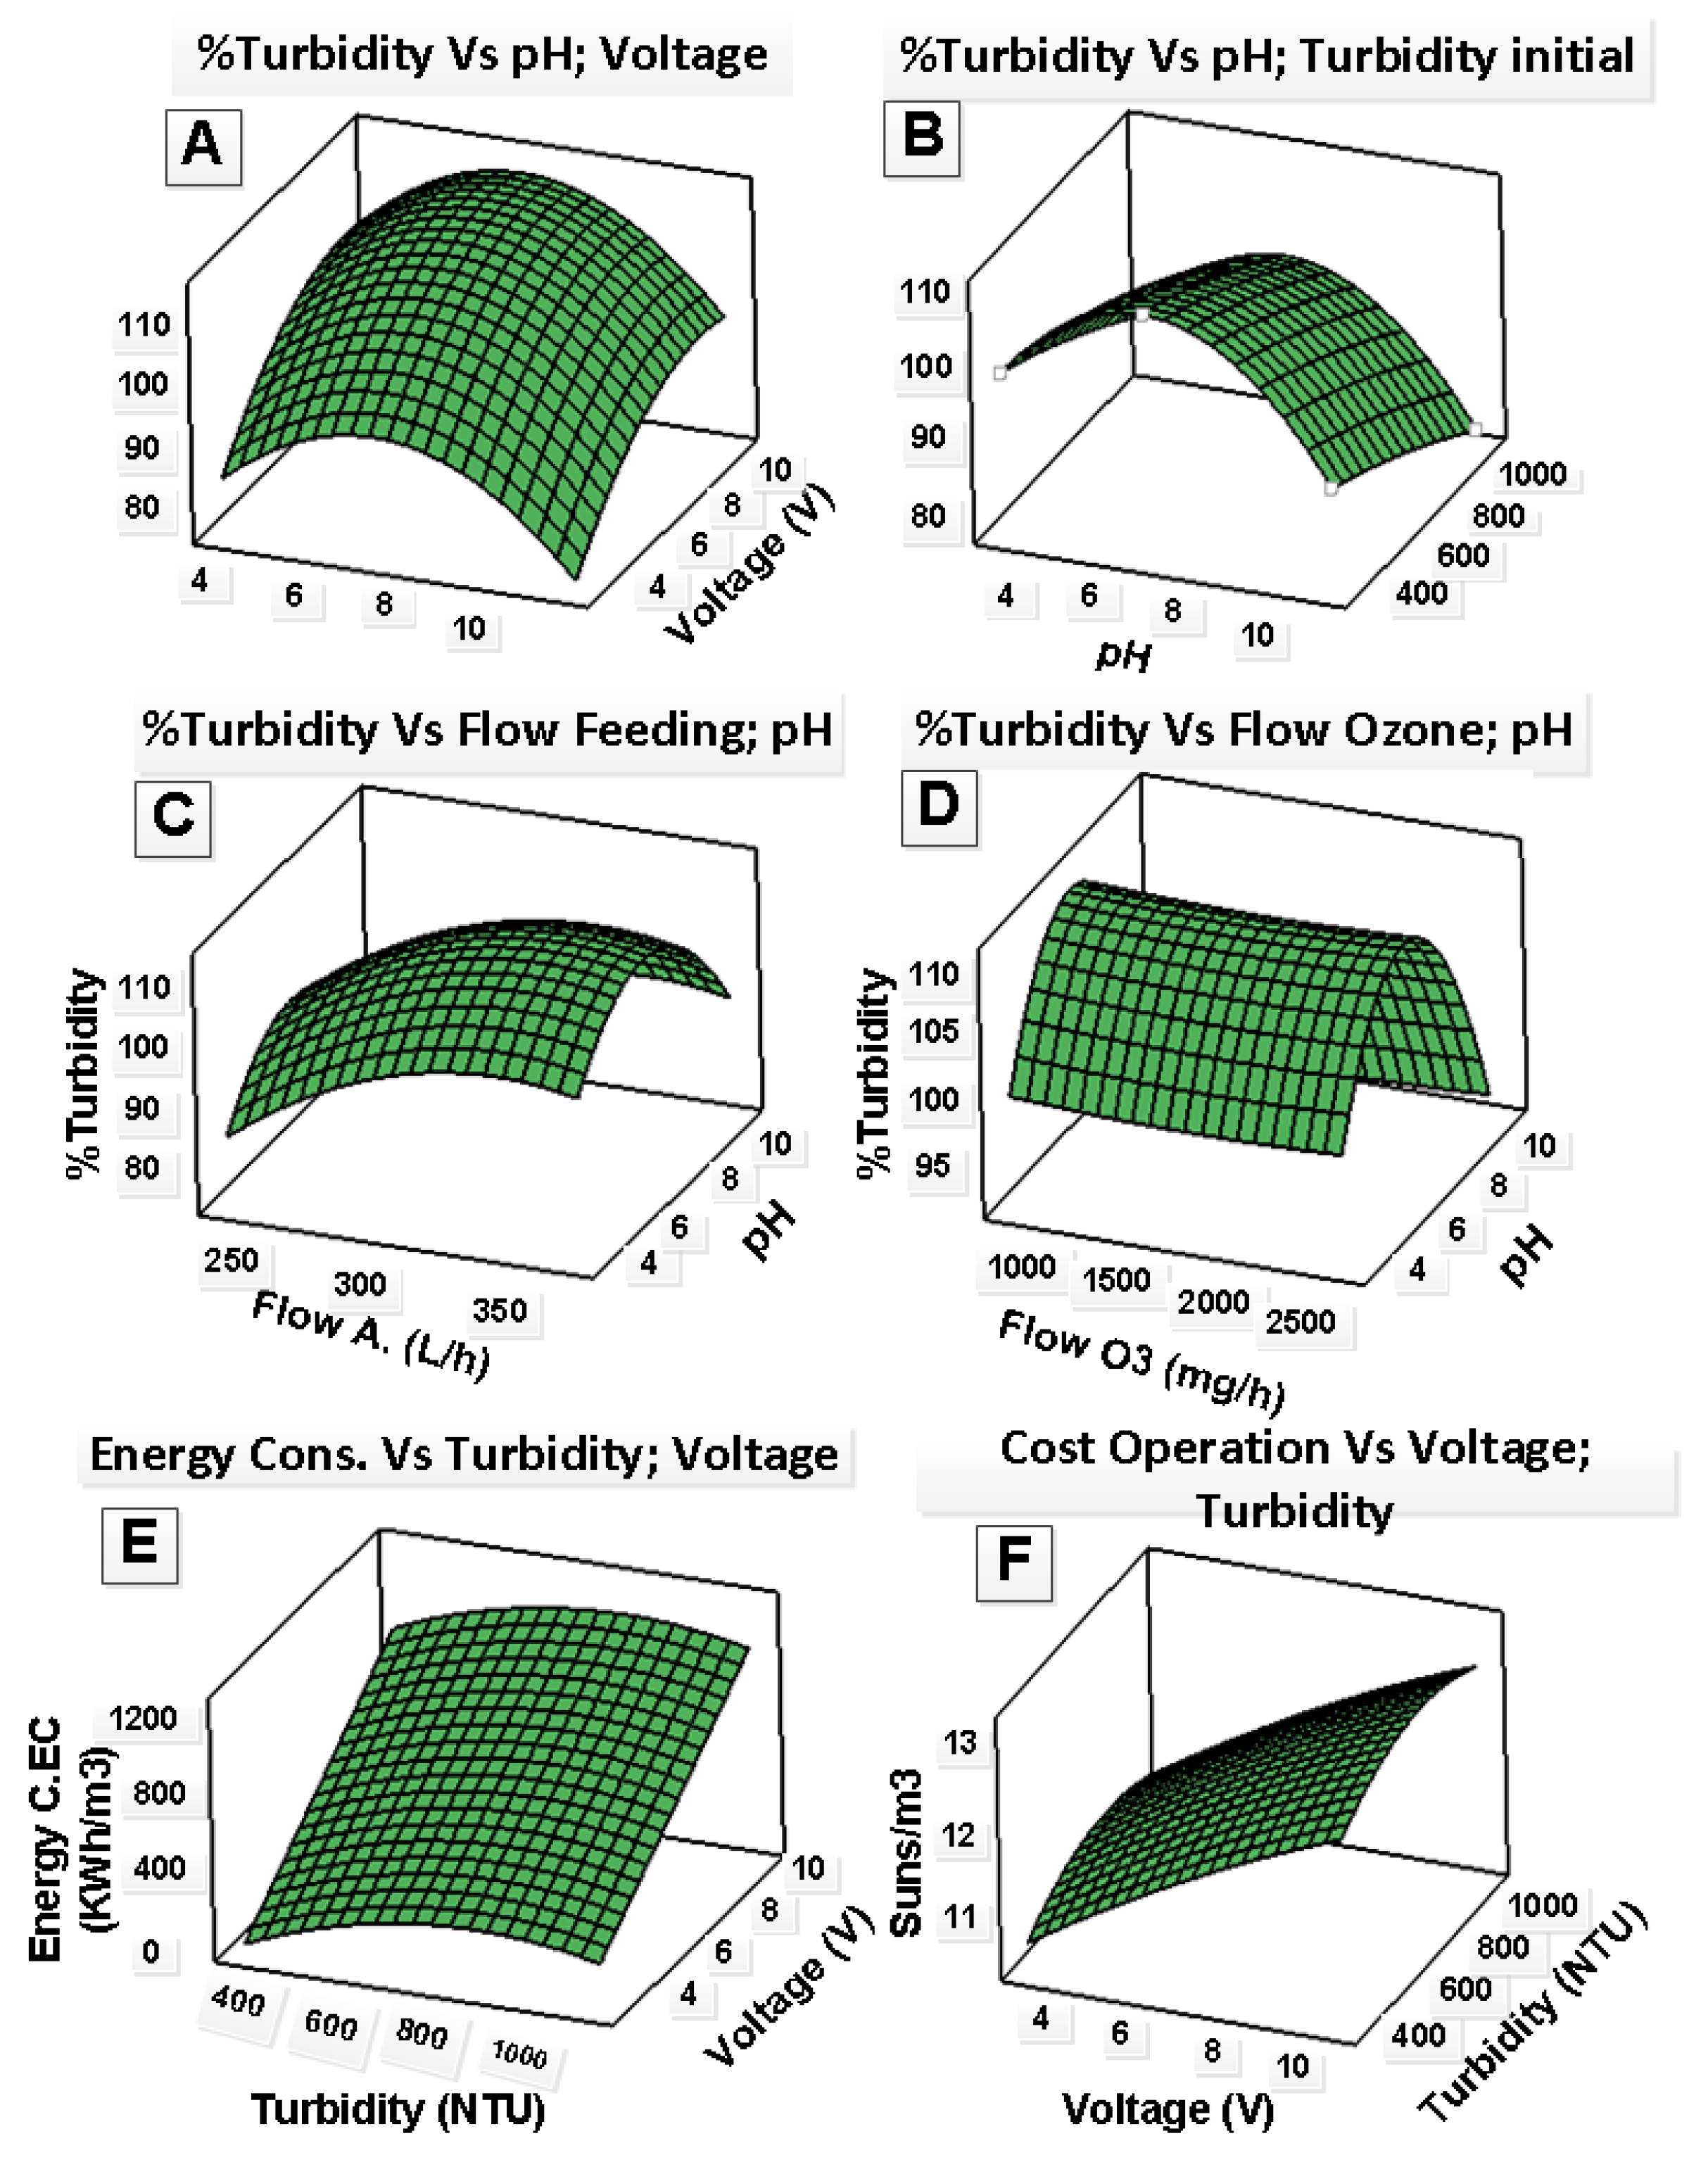
When evaluating the five operational parameters against the reduction of turbidity according to Figure 2, it is shown that the factor with the greatest influence is the voltage, corroborating it in Table 4 of ANOVA due to its greater contribution with respect to the other parameters. By increasing the potential values from 4 to 10 volts as seen in Figure 5A, it was possible to increase the percentage of turbidity reduction reaching 56.83% and 100%, a growing effect in the elimination of turbidity. This originated effect is analogous to those reported in [37], where they worked at 6, 8.5 and 10 volts, for one hour of treatment on grey water, reaching a reduction of 68%, 73%, and 86% respectively.
On the other hand, the effect on removal is due to the increase in particle size as a function of time, studied by [38], where he reported that in a synthetic sample of kaolinite, the size formed is affected as the voltage and time are increased, allowing the generation of a higher sedimentation rate of the particles.
This ascending effect of the voltage on the turbidity can also be seen in the report presented by [39], they worked in the range of 2.9 to 11.7 mA/cm 2 , for a time of 14 min on water. residues from car washes, achieving close to a 96% reduction in turbidity. On the other hand, the work presented by [15], also reported the influence of the applied potential on turbidity, where they evaluated 4 voltage levels for a period of 15 min such as: 2, 5, 10, and 15 V, achieving a reduction 83% for voltage 2 and 92% for 15 volts; therefore, as stated [40], the applied voltage is an influential and important parameter. As a main step, it ensures the production of Al 3 + ion coagulants as a result of electrolytic oxidation of the electrode. Table 7 shows the results.
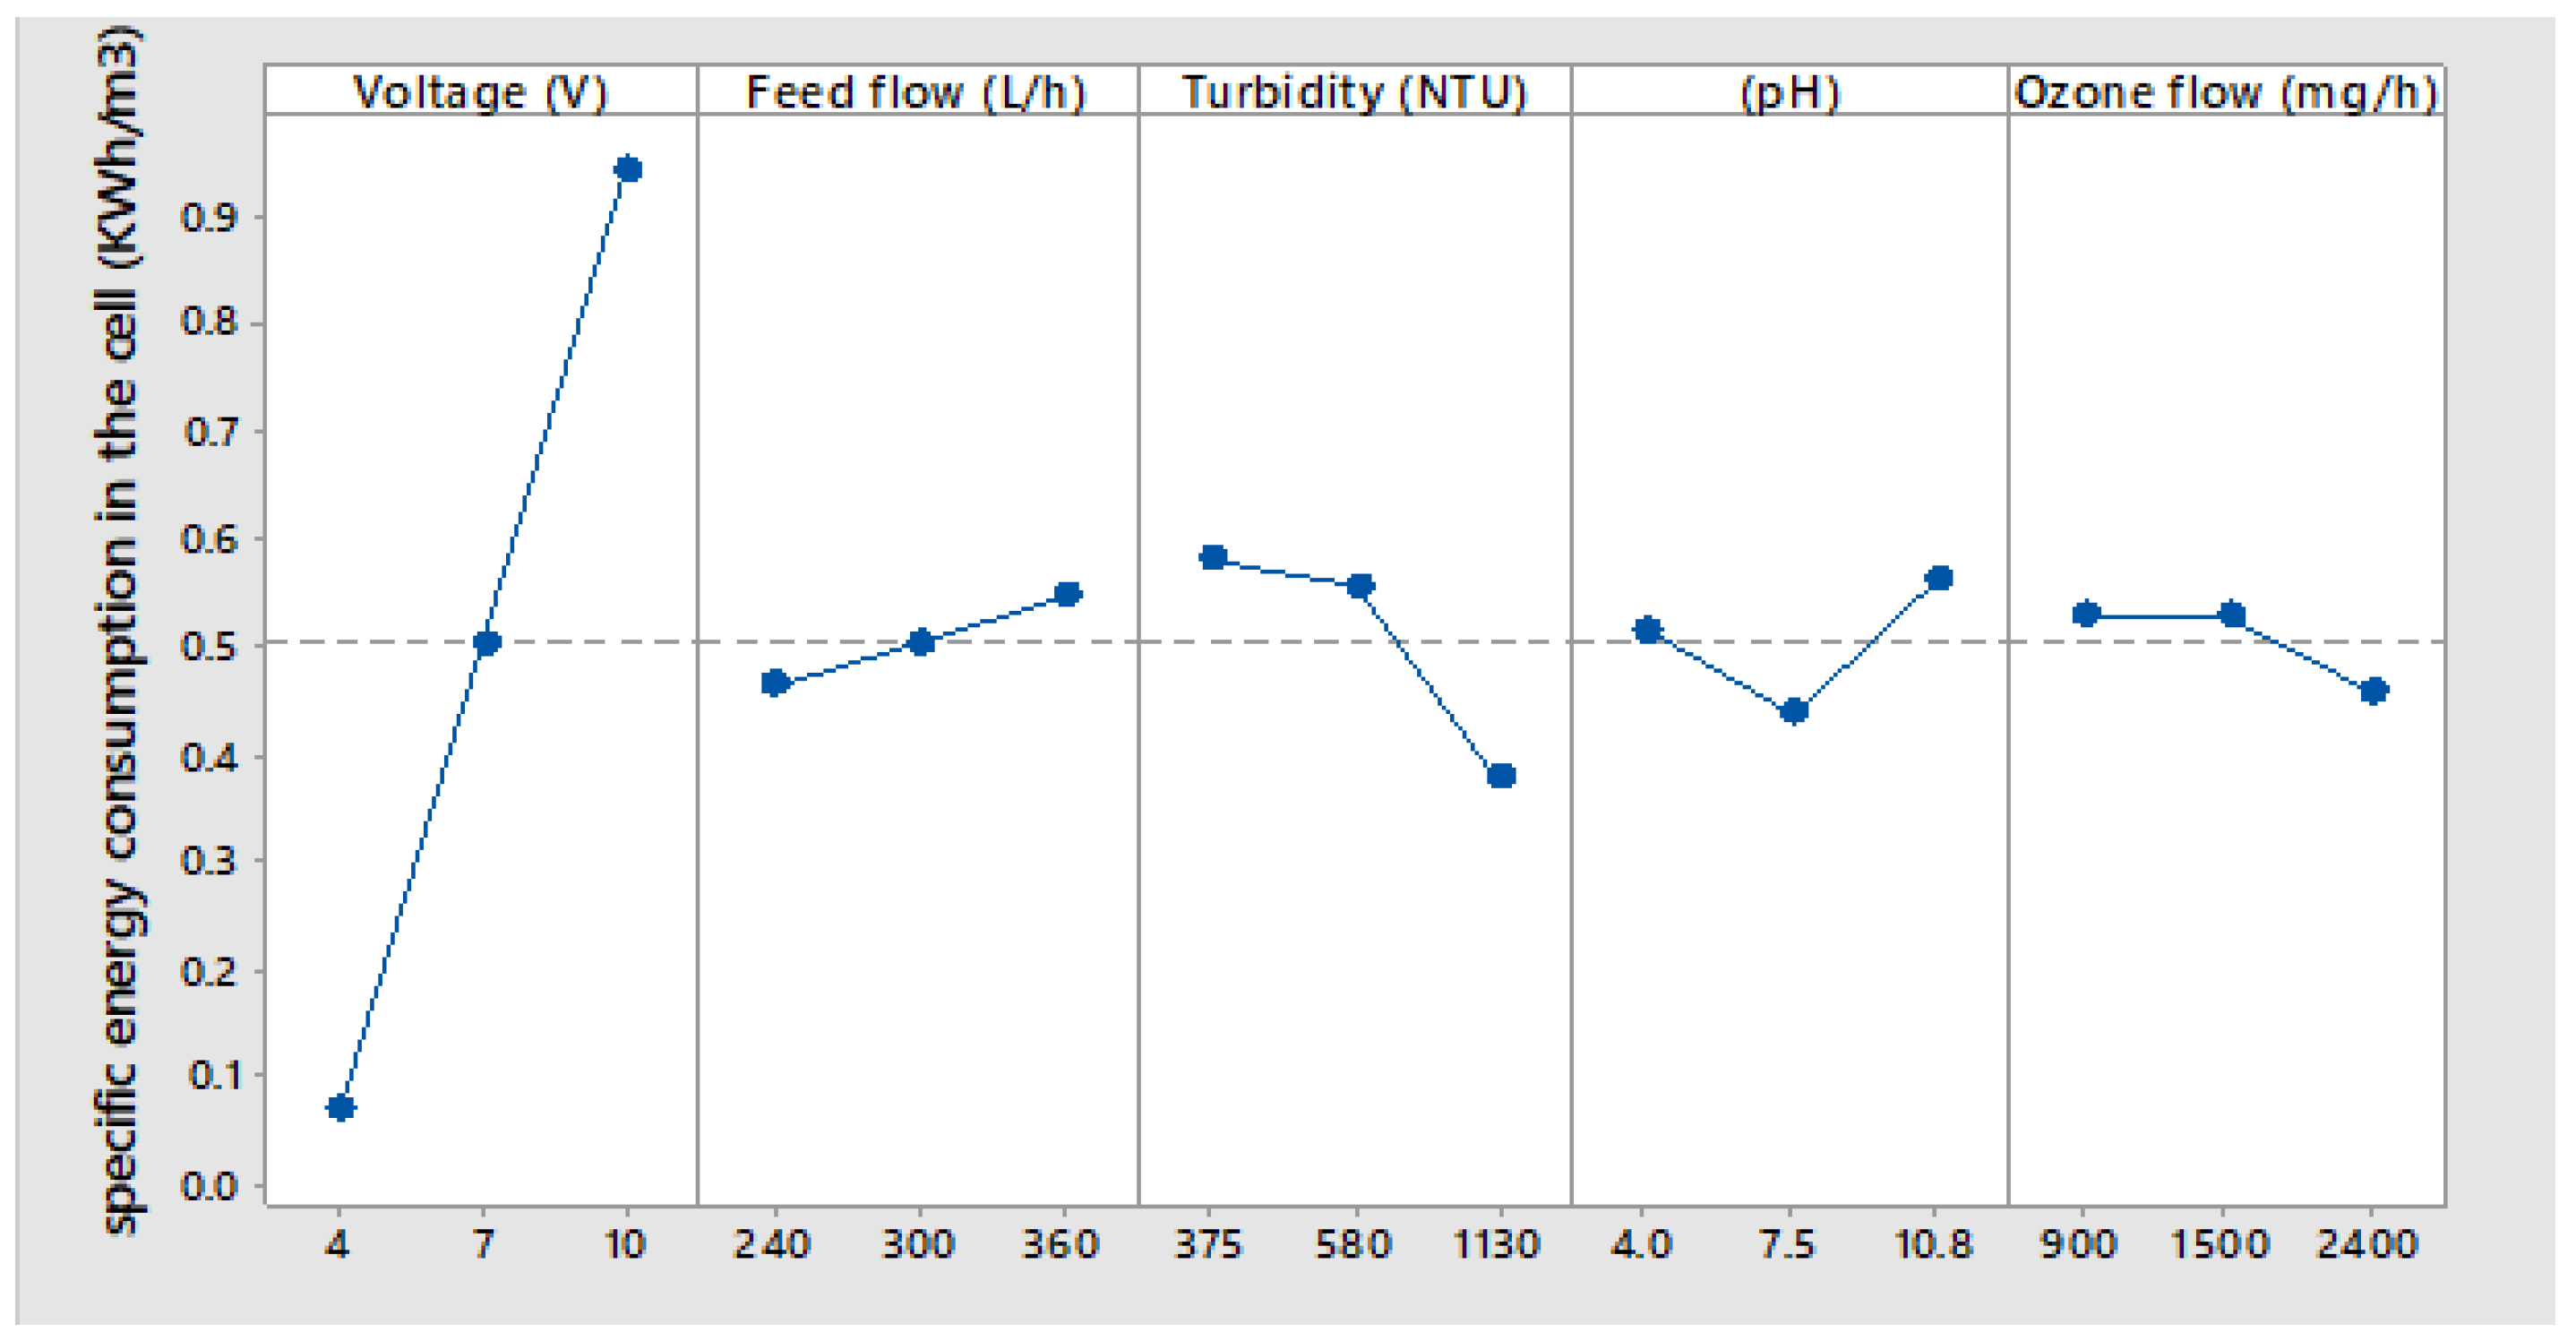
From Table 3 we generate Figure 7 which shows the effect of the process parameters with respect to energy consumption in kWh/m 3 . From said figure we observe that the average energy consumption in the 27 experiments was 0.5 kWh/m 3 .
In addition, the factor with the greatest influence was the electrical potential applied to the electrocoagulation cell, as indicated by the diagram, the lowest energy consumption (0.069) was obtained with the electrical potential at 4 volts and the highest energy consumption (0.94) was obtained at an electrical potential of 10 volts. Likewise, it is observed that turbidity has a significant influence on energy consumption at the high level, 0.376 kWh/m 3 is consumed, whose value is below the average.
In the study carried out by [15], about the reduction of turbidity and chromium content in tannery wastewater by electrocoagulation process using aluminum electrodes at an electrical potential of 10 volts, pH of 6.1, and a time of 90 min. The authors obtained an energy consumption of 1.5 kWh/m 3 , which is quite close to that obtained in our present study.

5. Conclusions

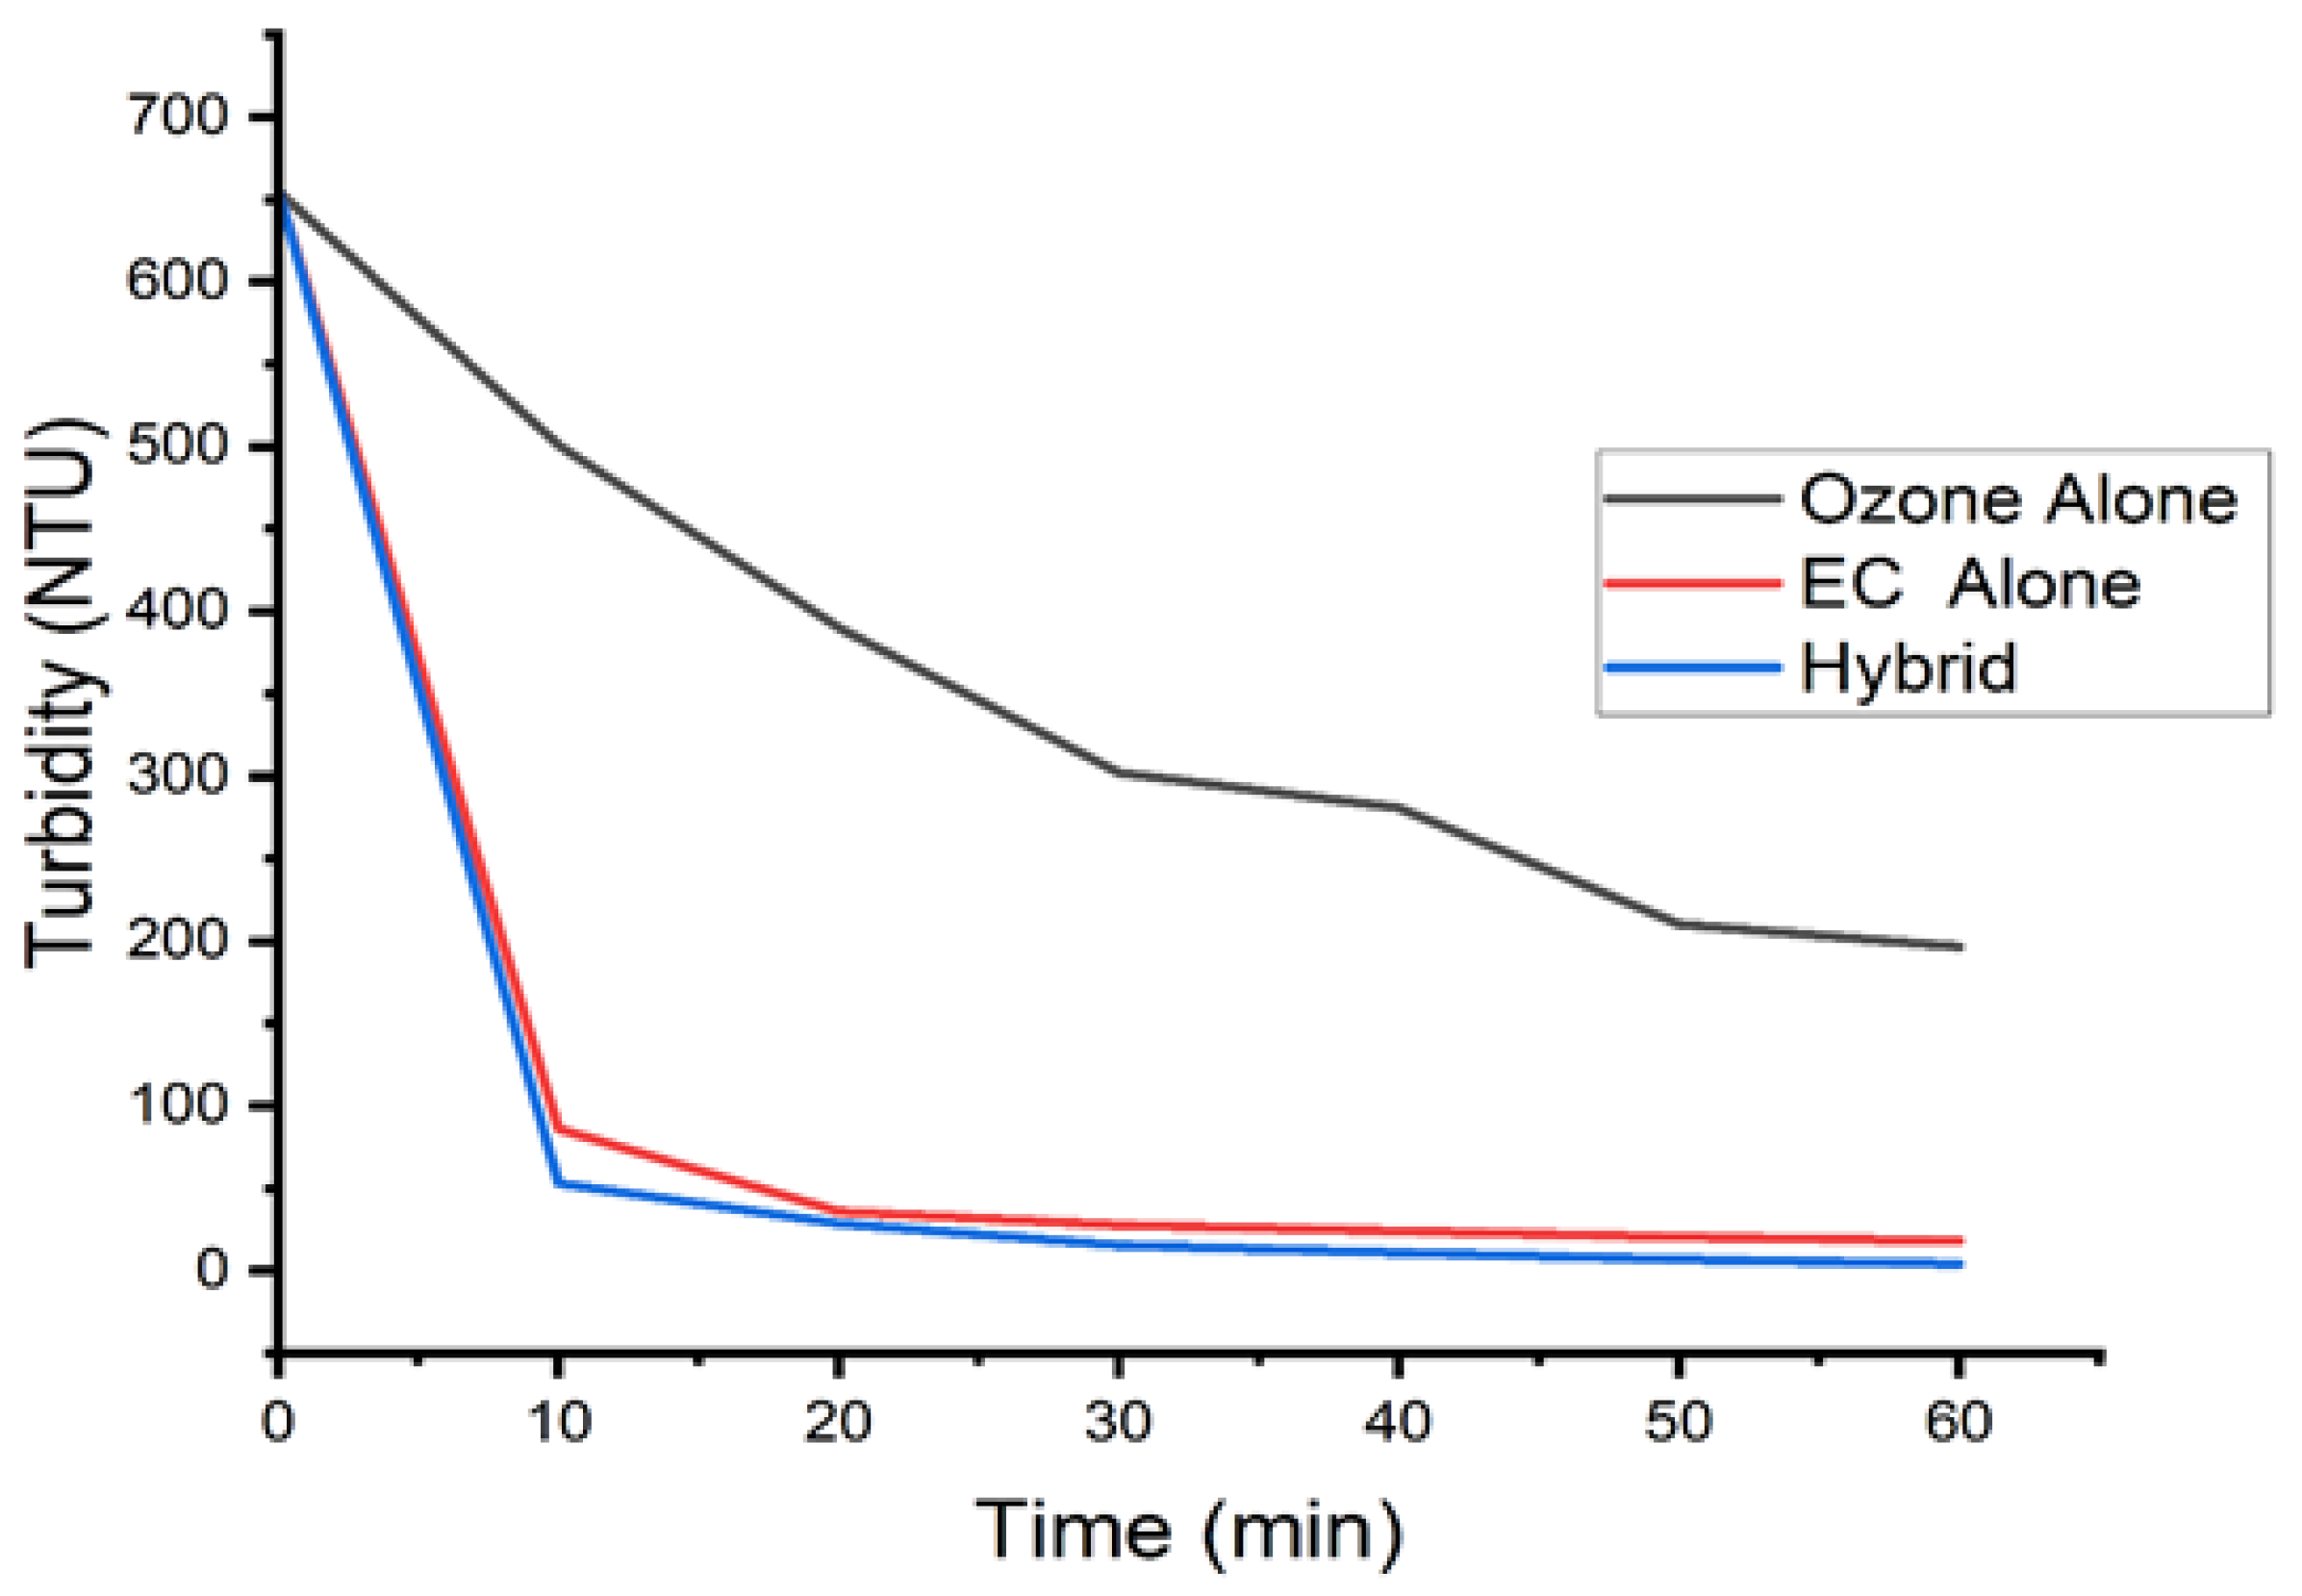
The coupled process of electrocoagulation with ozone was successfully tested in the treatment of wastewater from a tannery from the riparian zone. Parameters such as applied voltage potential, feed flow, initial turbidity concentration, pH, and ozone flux were studied on the percentage of turbidity reduction and energy consumption in the electrocoagulation cell. It was found that parameters have the greatest influence on turbidity reduction and the effects separately of each process such as ozone, electrocoagulation and ozone-assisted electrocoagulation on turbidity.
The result showed that the factor that has the greatest influence on reducing turbidity is voltage. The present study showed that the coupled electrocoagulation and ozone system reduced more turbidity than the processes alone. The optimal conditions for the removal of turbidity, Chemical Oxygen Demand (COD) and Biochemical Oxygen Demand (BOD) were obtained at 10 volts, 7.5 pH, 360 L/h of wastewater recirculation flow, 2400 mg/h of ozone flow, and 1130 NTU of initial turbidity of the sample in 60 min of treatment. Finally, under these conditions, a removal of 99.75% of turbidity, 33.2% of COD, and 39.36% of BOD was achieved. Likewise, the degree of biodegradability of the organic load obtained increased from 0.467 to 0.553.

Author Contributions

Conceptualization, P.A.-M.; Data curation, A.B.C.-S.; Investigation, J.A.R.-H.; Project administration, A.B.C.-S.; Software, J.T.M.-C.; Validation, P.A.-M.; Writing—original draft, E.J.F.-G.; Writing—review & editing, G.E.R.-M. All authors have read and agreed to the published version of the manuscript.

Funding

This research received no external funding.

Conflicts of Interest

The authors declare no conflict of interest.

References

  1. Villaseñor-Basulto, D.L.; Picos-Benítez, A.; Pacheco-Alvarez, M.; Pérez, T.; Bandala, E.R.; Peralta-Hernández, J.M. Tannery wastewater treatment using combined electrocoagulation and electro-Fenton processes. J. Environ. Chem. Eng. 2022, 10, 107290. [Google Scholar] [CrossRef]
  2. Di Iaconi, C.; Lopez, A.; Ramadori, R.; Di Pinto, A.; Passino, R. Combined chemical and biological degradation of tannery wastewater by a periodic submerged filter (SBBR). Water Res. 2002, 36, 2205–2214. [Google Scholar] [CrossRef]
  3. Varank, G.; Erkan, H.; Yazycy, S.; Demir, A.; Engin, G. Electrocoagulation of tannery wastewater using monopolar electrodes: Process optimization by response surface methodology. Winter 2014, 8, 165–1890. [Google Scholar]
  4. Chanikya, P.; Nidheesh, P.; Babu, D.S.; Gopinath, A.; Kumar, M.S. Treatment of dyeing wastewater by combined sulfate radical based electrochemical advanced oxidation and electrocoagulation processes. Sep. Purif. Technol. 2021, 254, 117570. [Google Scholar] [CrossRef]
  5. Nidheesh, P.; Kumar, A.; Babu, D.S.; Scaria, J.; Kumar, M.S. Treatment of mixed industrial wastewater by electrocoagulation and indirect electrochemical oxidation. Chemosphere 2020, 251, 126437. [Google Scholar] [CrossRef] [PubMed]
  6. Al-Qodah, Z.; Tawalbeh, M.; Al-Shannag, M.; Al-Anber, Z.; Bani-Melhem, K. Combined electrocoagulation processes as a novel approach for enhanced pollutants removal: A state-of-the-art review. Sci. Total. Environ. 2020, 744, 140806. [Google Scholar] [CrossRef] [PubMed]
  7. GilPavas, E.; Dobrosz-Gómez, I.; Gómez-García, M.Á. Optimization and toxicity assessment of a combined electrocoagulation, H2O2/Fe2+/UV and activated carbon adsorption for textile wastewater treatment. Sci. Total. Environ. 2019, 651, 551–560. [Google Scholar] [CrossRef] [PubMed]
  8. Barrera-Díaz, C.E.; Roa-Morales, G.; Hernández, P.B.; Fernandez-Marchante, C.M.; Rodrigo, M.A. Enhanced electrocoagulation: New approaches to improve the electrochemical process. J. Electrochem. Sci. Eng. 2014, 4, 285–296. [Google Scholar] [CrossRef]
  9. Kuokkanen, V.; Kuokkanen, M.; Hynynen, I.; Kuokkanen, T. Electrocoagulation treatment of metallurgical industry wastewater–A laboratory scale batch and pilot scale continuous study. Hydrometallurgy 2021, 202, 105596. [Google Scholar] [CrossRef]
  10. Sillanpää, M.; Shestakova, M. Electrochemical Water Treatment Methods: Fundamentals, Methods and Full Scale Applications; Butterworth-Heinemann: Oxford, UK, 2017. [Google Scholar]
  11. Mollah, M.Y.; Morkovsky, P.; Gomes, J.A.; Kesmez, M.; Parga, J.; Cocke, D.L. Fundamentals, present and future perspectives of electrocoagulation. J. Hazard. Mater. 2004, 114, 199–210. [Google Scholar] [CrossRef] [PubMed]
  12. Mollah, M.Y.A.; Schennach, R.; Parga, J.R.; Cocke, D.L. Electrocoagulation (EC)—Science and applications. J. Hazard. Mater. 2001, 84, 29–41. [Google Scholar] [CrossRef]
  13. Hassani, A.; Malhotra, M.; Karim, A.V.; Krishnan, S.; Nidheesh, P. Recent progress on ultrasound-assisted electrochemical processes: A review on mechanism, reactor strategies, and applications for wastewater treatment. Environ. Res. 2022, 205, 112463. [Google Scholar] [CrossRef] [PubMed]
  14. Ghanbari, F.; Hassani, A.; Wacławek, S.; Wang, Z.; Matyszczak, G.; Lin, K.Y.A.; Dolatabadi, M. Insights into paracetamol degradation in aqueous solutions by ultrasound-assisted heterogeneous electro-Fenton process: Key operating parameters, mineralization and toxicity assessment. Sep. Purif. Technol. 2021, 266, 118533. [Google Scholar] [CrossRef]
  15. Ziati, M.; Khemmari, F.; Aitbara, A.; Hazourli, S. Reduction of Turbidity and Chromium Content of Tannery Wastewater by Electrocoagulation Process: Ziati et al. Water Environ. Res. 2018, 90, 598–603. [Google Scholar] [CrossRef] [PubMed]
  16. Mahmad, M.K.N.; Rozainy, M.M.R.; Abustan, I.; Baharun, N. Electrocoagulation process by using aluminium and stainless steel electrodes to treat total chromium, colour and turbidity. Procedia Chem. 2016, 19, 681–686. [Google Scholar] [CrossRef]
  17. Loukanov, A.; El Allaoui, N.; Omor, A.; Elmadani, F.Z.; Bouayad, K.; Nakabayashi, S. Large-scale removal of colloidal contaminants from artisanal wastewater by bipolar electrocoagulation with aluminum sacrificial electrodes. Results Chem. 2020, 2, 100038. [Google Scholar] [CrossRef]
  18. Marmanis, D.; Emmanouil, C.; Fantidis, J.; Thysiadou, A.; Marmani, K. Description of a Fe/Al Electrocoagulation Method Powered by a Photovoltaic System, for the (Pre-) Treatment of Municipal Wastewater of a Small Community in Northern Greece. Sustainability 2022, 14, 4323. [Google Scholar] [CrossRef]
  19. Chen, G. Electrochemical technologies in wastewater treatment. Sep. Purif. Technol. 2004, 38, 11–41. [Google Scholar] [CrossRef]
  20. Ikhlaq, A.; Javed, F.; Akram, A.; Rehman, A.; Qi, F.; Javed, M.; Mehdi, M.J.; Waheed, F.; Naveed, S.; Aziz, H.A. Synergic catalytic ozonation and electroflocculation process for the treatment of veterinary pharmaceutical wastewater in a hybrid reactor. J. Water Process. Eng. 2020, 38, 101597. [Google Scholar] [CrossRef]
  21. Asaithambi, P.; Aziz, A.R.A.; Daud, W.M.A.B.W. Integrated ozone—Electrocoagulation process for the removal of pollutant from industrial effluent: Optimization through response surface methodology. Chem. Eng. Process. Process. Intensif. 2016, 105, 92–102. [Google Scholar] [CrossRef]
  22. Jin, X.; Xie, X.; Liu, Y.; Wang, Y.; Wang, R.; Jin, P.; Yang, C.; Shi, X.; Wang, X.C.; Xu, H. The role of synergistic effects between ozone and coagulants (SOC) in the electro-hybrid ozonation-coagulation process. Water Res. 2020, 177, 115800. [Google Scholar] [CrossRef] [PubMed]
  23. Li, G.; Yang, C.; Yao, Y.; Zeng, M. Electrocoagulation of chromium in tannery wastewater by a composite anode modified with titanium: Parametric and kinetic study. Desalin Water Treat 2019, 171, 294–301. [Google Scholar] [CrossRef]
  24. Elabbas, S.; Ouazzani, N.; Mandi, L.; Berrekhis, F.; Perdicakis, M.; Pontvianne, S.; Pons, M.N.; Lapicque, F.; Leclerc, J.P. Treatment of highly concentrated tannery wastewater using electrocoagulation: Influence of the quality of aluminium used for the electrode. J. Hazard. Mater. 2016, 319, 69–77. [Google Scholar] [CrossRef]
  25. Barrera-Diaz, C.; Bernal-Martinez, L.A.; Natividad, R.; Peralta-Hernández, J.M. Synergy of electrochemical/O3 process with aluminum electrodes in industrial wastewater treatment. Ind. Eng. Chem. Res. 2012, 51, 9335–9342. [Google Scholar] [CrossRef]
  26. Alam, R.; Sheob, M.; Saeed, B.; Khan, S.U.; Shirinkar, M.; Frontistis, Z.; Basheer, F.; Farooqi, I.H. Use of electrocoagulation for treatment of pharmaceutical compounds in water/wastewater: A review exploring opportunities and challenges. Water 2021, 13, 2105. [Google Scholar] [CrossRef]
  27. Aber, S.; Amani-Ghadim, A.; Mirzajani, V. Removal of Cr (VI) from polluted solutions by electrocoagulation: Modeling of experimental results using artificial neural network. J. Hazard. Mater. 2009, 171, 484–490. [Google Scholar] [CrossRef]
  28. Hakizimana, J.N.; Gourich, B.; Chafi, M.; Stiriba, Y.; Vial, C.; Drogui, P.; Naja, J. Electrocoagulation process in water treatment: A review of electrocoagulation modeling approaches. Desalination 2017, 404, 1–21. [Google Scholar] [CrossRef]
  29. Gonzalez-Galvis, J.P.; Narbaitz, R.M. Large batch bench-scale dissolved air flotation system for simulating full-scale turbidity removal. Environ. Technol. 2020, 43, 1791–1804. [Google Scholar] [CrossRef]
  30. Jin, X.; Zhang, L.; Liu, M.; Hu, S.; Yao, Z.; Liang, J.; Wang, R.; Xu, L.; Shi, X.; Bai, X.; et al. Characteristics of dissolved ozone flotation for the enhanced treatment of bio-treated drilling wastewater from a gas field. Chemosphere 2022, 298, 134290. [Google Scholar] [CrossRef]
  31. Yao, Z.; Jin, X.; Liang, J.; Wang, R.; Jin, P.; Li, G.; Yao, L.; Wang, Z. Application of an integrated dissolved ozone flotation process in centralised fracturing wastewater treatment plant. Water Reuse 2021, 11, 236–247. [Google Scholar] [CrossRef]
  32. Wang, J.; Wang, L.; Xu, S.; Ji, B.; Long, X. Experimental investigation on the cavitation performance in a venturi reactor with special emphasis on the choking flow. Exp. Therm. Fluid Sci. 2019, 106, 215–225. [Google Scholar] [CrossRef]
  33. Fukui, Y.; Yuu, S. Removal of colloidal particles in electroflotation. AIChE J. 1985, 31, 201–208. [Google Scholar] [CrossRef]
  34. Skoog, D.A.; West, D.M.; Holler, F.J.; Crouch, S.R. Fundamentals of Analytical Chemistry; Cengage Learning: Boston, MA, USA, 2013. [Google Scholar]
  35. Sivagami, K.; Sakthivel, K.; Nambi, I.M. Advanced oxidation processes for the treatment of tannery wastewater. J. Environ. Chem. Eng. 2018, 6, 3656–3663. [Google Scholar] [CrossRef]
  36. Umbarila-Ortega, M.F.; Prado-Rodríguez, J.S.; Agudelo-Valencia, R.N. Remoción de sulfuro empleando ozono como agente oxidante en aguas residuales de curtiembres. Rev. Fac. de Ing. 2019, 28, 25–38. [Google Scholar] [CrossRef]
  37. Vakil, K.A.; Sharma, M.K.; Bhatia, A.; Kazmi, A.A.; Sarkar, S. Characterization of greywater in an Indian middle-class household and investigation of physicochemical treatment using electrocoagulation. Sep. Purif. Technol. 2014, 130, 160–166. [Google Scholar] [CrossRef]
  38. Lin, C.J.; Lo, S.L.; Kuo, C.Y.; Wu, C.H. Pilot-scale electrocoagulation with bipolar aluminum electrodes for on-site domestic greywater reuse. J. Environ. Eng. 2005, 131, 491–495. [Google Scholar] [CrossRef]
  39. El-Ashtoukhy, E.; Amin, N.; Fouad, Y. Treatment of real wastewater produced from Mobil car wash station using electrocoagulation technique. Environ. Monit. Assess. 2015, 187, 628. [Google Scholar] [CrossRef]
  40. Emamjomeh, M.M.; Sivakumar, M. An empirical model for defluoridation by batch monopolar electrocoagulation/flotation (ECF) process. J. Hazard. Mater. 2006, 131, 118–125. [Google Scholar] [CrossRef]
Figure 1. Electrocoagulation and ozone experimental module. (A) Photograph of the experimental module doing preliminary tests. The sample is fed to tank 1, followed by the sample being pumped through the flow meter, followed by the Venturi system, dynamic mixer until reaching the electrolytic reactor, once the system is filled again the sample returns to the tank. (B) Module diagram, where 1 is the deposit; 2, 3, 5, 6, 8, and 14 stopcocks; 4 recirculation pump; 7 flow meter; 9 Venturi; 10 ozone generator; 11 dynamic mixer; 12 electrocoagulation reactor and 13 current rectifier.
Applsci 12 08158 g001
Figure 2. The effects of the operating variables on the mean turbidity removal percentage.
Applsci 12 08158 g002
Figure 3. Turbidity reduction for separate processes such as pure ozone, electrocoagulation and coupled process of EC/O 3 , operated at conditions of 10.0 volts, feed flow 360 L/h, O 3 flow 2400 mg/h, pH 6.89, and initial turbidity of 655 NTU.
Applsci 12 08158 g003
Figure 4. Variation of the pH in the time of treatment by electrocoagulation/O 3 .
Applsci 12 08158 g004
Figure 5. Representation of the effect of operational variables on % reduction in turbidity, energy consumed in the electrolytic cell, and operational cost of the module. (A) Variation of the pH and voltage variables against % turbidity for fixed values of 300 L/h, 752.5 NTU, and 1650 mg/h. (B) Variability of pH and initial turbidity versus % turbidity for fixed values of 6.5 volts, 300 L/h and 1650 mg/h of O 3 flow. (C) pH and feed flow variability versus % turbidity for fixed values of 6.5 volts, 752.5 NTU, and 1650 mg/h O 3 flow. (D) Ozone and pH flow variability versus % turbidity for fixed values of 6.5 volts, 300 L/h, and 752.5 NTU. (E) Variability of initial turbidity and voltage versus energy consumption in the electrocoagulation cell for fixed values of 300 L/h, 7.4 pH, and 1650 mg/h of O 3 flow. (F) Variability of voltage and initial turbidity against the cost of the built module for fixed values of 300 L/h, 7.4 pH, and 1650 mg/h of O 3 flow.
Applsci 12 08158 g005
Figure 6. Mechanism of hydroxyl formation.
Applsci 12 08158 g006
Figure 7. Effect of process parameters on specific energy consumption.
Applsci 12 08158 g007
Table 1. Some of the physicochemical characteristics of the wastewater of the riparian zone.
ParametersUnitValue
pH 9.43
TurbidityNTU1130
Chemical oxygen demandmg/L2638
Biological oxygen demandmg/L1232
Oils and fatsmg/L15.1
Ammonia nitrogenNH 3 + -N mg/L88.85
SulfidesS = mg/L21.4
Fecal coliformsNMP/100 mL<1.8
Aluminummg/L0.29
Table 2. Experimental range and levels of independent variables used in this study.
FactorsUnitNotationLevels
LowMediumHigh
VoltageV X 1 4710
Feed flowL/h X 2 240300360
TurbidityNTU X 3 3755801130
pH X 4 4.07.510.8
Ozone flowmg/h X 5 90015002400
Table 3. Presents the results of the 27 experiments carried out using the Taguchi methodology of five factors at three levels under study.
N° TestsFactorsResponse
X 1 (V) Voltage X 2 (L/h) Feed Flow X 3 (NTU) Turbidity X 4 (pH) X 5 (mg/h) OzoneFlowTurbidity (NTU)% TurbidityReductionFaraday AluminumDough (g)Energy Consumedin the Cell (KWh/m3)
142403754900471.458.280.1176175.17823
2424037541500487.856.830.053585.34855
3424037542400483.657.20.047176.356466
443005807.590048.791.650.027945.541531
543005807.5150055.590.480.031450.222793
643005807.5240052.391.030.039763.811338
74360113010.890088.376.450.024637.127518
84360113010.8150091.275.680.027543.868429
94360113010.8240087.176.770.029446.751746
10724058010.8900135.276.490.2093657.31997
11724058010.81500145.174.770.1539499.21802
12724058010.82400139.775.70.1726551.08302
137300113049003.299.140.1111365.33785
1473001130415001.399.650.1135362.05164
15730011304240001000.136421.1065
1673603757.590017.598.450.1822570.44258
1773603757.5150013.898.780.1936604.95181
1873603757.5240015.298.660.1485479.17558
191024011307.59007.298.110.1402652.35772
201024011307.515005.298.640.1546748.96169
211024011307.524002.899.270.1492712.034
221030037510.890020781.630.27041178.6499
231030037510.81500195.282.680.29931310.3554
241030037510.8240019882.430.153726.03864
2510360580490001000.2381060.6992
2610360580415001.299.790.23121029.1543
2710360580424001.5799.730.23711042.1303
Table 4. Analysis of variance (ANOVA).
SourceGLSC Sec.ContributionSC Ajust.MC Ajust.Value FValue p
Model145252.0199.94%5252.01375.141337.590.000
Linear53347.263.69%3392.4678.482419.140.000
X 1 11669.4831.77%1560.971560.975565.70.000
X 2 1924.7917.60%919.82919.823279.660.000
X 3 1514.589.79%656.93656.932342.30.000
X 4 1238.294.53%254.67254.67908.050.000
X 5 10.060.00%0.060.060.230.643
Square51903.2836.22%1903.28380.661357.240.000
( X 1 ) 2 1193.783.69%193.78193.78690.950.000
( X 2 ) 2 1256.894.89%256.89256.89915.950.000
( X 3 ) 2 1210.764.01%210.76210.76751.480.000
( X 4 ) 2 11241.1223.62%1241.121241.124425.260.000
( X 5 ) 2 10.720.01%0.720.722.560.135
Error123.370.06%3.370.28
Total265255.38100.00%
Table 5. Standard deviation of percent turbidity removal and energy consumption and Energy consumption.
ResponseNStatisticalStatisticalMeanStandardStandard
MinimumMaximumErrorDeviation
Turbidity removal percentage2756.8310086.60332.73614.217
Energy consumption (KW/m 3 )270.0371.3100.5030.0750.390
Table 6. Results of the physicochemical characterization of the treated sample.
ParametersUnitValue
pH 8.6
TurbidityNTU2.8
Chemical oxygen demandmg/L876
Biological oxygen demandmg/L485
Oils and fatsmg/L<1.2
Ammonia nitrogenNH 3 + -N mg/L32.75
SulfidesS = mg/L<0.002
Fecal coliformsNMP/100 mL<1.8
Aluminummg/L44.06
Table 7. Effect of the applied potential difference on the removal of the turbidity.
Electric Potential (V)Turbidity (%)
283
590
1091
1592
Publisher’s Note: MDPI stays neutral with regard to jurisdictional claims in published maps and institutional affiliations.

