
Application of Laser-Ultrasonics for Evaluating Textures and Anisotropy

Swerim AB, 164 40 Stockholm, Sweden
*
Author to whom correspondence should be addressed.
Appl. Sci. 2022, 12(20), 10547; https://0-doi-org.brum.beds.ac.uk/10.3390/app122010547
Submission received: 19 September 2022
/
Revised: 13 October 2022
/
Accepted: 16 October 2022
/
Published: 19 October 2022
(This article belongs to the Section Materials Science and Engineering)
Abstract
:Various approaches are reviewed for determining elastic anisotropy and its coupling to crystallographic texture, with special reference to ultrasonic measurements. Two new methods are described for measuring the anisotropy of P-wave velocity using laser-ultrasonics. Making measurements across the diameter of a cylindrical specimen as it is rotated makes it possible to maintain a very constant known path length. This permits extremely accurate measurements with a precision of better than 0.01%. Results on 316 stainless steel in different conditions are compared with calculated values obtained from EBSD textures together with measured densities and crystalline coefficients from the literature. Excellent agreement is obtained when applying the Hill geometrical average procedure. A similar approach is adopted to measure the variation of wave velocity in a martensitic steel, after tempering at a range of temperatures. Changes in the anisotropy associated with thermal softening are discussed. The second method uses Galvano mirrors to steer the generating laser to different positions over a sheet surface, allowing wave velocities to be determined along different directions in the anisotropic material.
1. Introduction
This manuscript describes two new procedures for determining texture-related anisotropy from ultrasonic measurements using lasers. Textures in materials are usually measured by diffraction methods using X-rays, neutrons and more recently with electron back-scattering (EBSD). Less complete but still useful information about textures can be obtained from ultrasonics (US). US methods have the advantage of rapidity and do not necessitate special sample preparation to offer the potential for making measurements directly during materials processing. Electromagnetic acoustic transducers (EMATs) have been applied in many cases, although their applications are restricted to near room temperature conditions and by the need for small stand-off distances. Most other acoustic methods require physical contact. These limitations can be overcome when lasers are used instead for both generating and detecting US signals, which greatly enhances the freedom of operation [1]. For example, stand-off distance can be increased to a metre or even more and difficult environmental conditions such as atmospheres and high temperatures are not restricting. Even rapidly moving surfaces are not a problem for such measurements. This laser-ultrasonics (LUS) approach is, in fact, the only means by which textures can be assessed on-line in steel and metal production, including during hot-rolling operations. Knowledge of texture is often valuable in itself since it relates to plastic anisotropy and to the formability of rolled products so is a measure of sheet quality. In addition, however, textures vary depending on whether the microstructure is in a deformed or recrystallised state during hot working, which is important, for example in cold-rolled steels. It can also be added that other microstructural information, such as grain size, may be determined simultaneously; hence, LUS is a very powerful approach for the non-destructive characterisation of materials.
The principal aim of our work has been to introduce LUS into industrial applications. The attenuation of sound waves depends on grain size and is now being used to measure grain sizes continuously in connection with the hot-rolling of steels. Here, we demonstrate how additional data can be gathered simultaneously to obtain information about their textures, thus giving a very comprehensive characterisation of the austenite microstructure from on-line measurements. However, the LUS method has also been further developed to provide very precise and accurate measurements of texture in the laboratory environment. We demonstrate this with examinations of martensite in as-quenched and tempered conditions. From these measurements, it has been possible to draw conclusions about the elastic anisotropy of the constituent martensite crystals.
Numerous investigations have been reported on how texture information can be obtained from ultrasonic measurements and in many cases, these have been integrated with predictions based on conventional texture determinations. Examples of these applications are described in [2,3,4,5,6,7,8,9,10,11,12,13,14,15,16]. Calculation of relationships between elasticity and texture in cubic systems requires knowledge of the material’s crystal elastic coefficients (c11, c12, c44) which are, in most cases, available in the literature. Several models have been proposed to take into account the interactions between grains in a polycrystal [8] for this situation. The models of Voigt [17] and Reuss [18] were shown to give limiting upper and lower bounds for these interactions by Hill [19] who also proposed that arithmetic or geometric means of the limits should be a good approximation to the actual behaviour. Hill’s arithmetic mean construction has been widely used by later workers and generally found, e.g., [8], to work well, e.g., [20]. There are indications that dislocations, existing after cold working, may somewhat reduce the elastic stiffness [5] and the elongated grains may produce an anisotropy additional to that from texture, but these contributions seem to be fairly small [8,20].
In most earlier work, the full quantification of texture was carried out using polycrystalline diffraction, i.e., pole figure methods, but these are not sufficient for evaluating the elastic tensors or matrices of the materials. It is necessary, first, to calculate orientation distribution functions (ODFs), which is often achieved using spherical harmonic functions, e.g., [21] although other mathematical procedures are also possible and have been applied in some cases, e.g., [1]. An advantage of the spherical harmonic approach is that the linear elastic behaviour can be completely described using only three coefficients. These are the C411, C412, and C413 in the Bunge notation [21] or the equivalent W400, W420, W440 coefficients in the Roe notation [22]. More recently, electron back-scattering diffraction (EBSD) has become widely adopted for texture measurements, which permits the complete orientations of individual crystals to be measured and not only polycrystalline pole figures. Data from EBSD can be fitted to the same ODF functions, but this is not essential for calculating physical properties, which can be achieved directly from the individual crystal data. Both methods lead to the same results.
When considering the inverse procedure of determining texture from ultrasonic velocities and elasticity matrices, it is evident that the measurements must elucidate the anisotropic character of the material, so a single measurement cannot suffice. The necessary conditions can, however, be achieved in different ways in practice.
- Perhaps the most obvious approach is to measure the same property in different directions by rotating the material, with respect to the direction of measurement in the instrument, as described in several publications, e.g., [1,4,5,6,8,10,11,13,16,23]. We also demonstrate a method further below by which this can be achieved with high precision.
- Another approach is to determine the velocities for different wave types propagating along the same direction. This has been demonstrated by using combinations of S0 and SH0 waves [5] or S0, SH0 and P-waves [7,9] and has been applied in steelworks for measuring plastic anisotropy ratios (r-values), using EMATs, under production conditions for (cold) annealed sheets.
- A variant based on the previous concept using resonances of P- and S- waves through the thickness of plates has also been tested under steelwork conditions [12].
- Another approach used P-waves arrivals measured after different numbers of reflections through the thickness of the plate [15]. Thus, although the same fixed positions were used for generation and detection, the waves passed along different directions in the material.
- A LUS variant [14] based on the first method, here, was to convert the generating laser spot into a circle and mask off different sectors so that measurements of P- and SAW-waves could be made in different directions, which was reported to give robust measurements.
- Additionally, the group at Nottingham recently developed the Spatially Resolved Acoustic Spectroscopy (SRAS) technique [24] with which the surface texture can be measured by sampling the orientation of individual grains. From the measured surface, the texture can be calculated in a similar manner to how the textures from EBSD measurements are calculated. The team has recently been able to perform the inverse calculation of the single crystal values from the SRAS measurements [25].
In the present paper, we demonstrate a refinement of the first method and also an approach that resembles the fifth method, but where the generating laser beam is deflected using Galvano mirrors. The full effect of the laser can then be used continuously and its positioning is very fast (up to kHz for small angles) and precise (15 µrad repeatability).
2. Materials and Methods
2.1. Cold-Rolled 316
To investigate different textures of rolled austenitic steel, 4 samples were produced from a piece of 316 stainless steel plate. The samples were then rolled with either 50% or 70% reduction at the in-house lab rolling mill at Swerim in Luleå. Two of the samples were annealed, prior to the rolling, to attain two samples with larger starting grain size. These parameters are listed in Table 1 together with the measured densities.
The ultrasonic waves were generated in the ablation mode using a 20 Hz Q-switched Nd:YAG laser with 6 ns long pulses and up to 200 mJ of energy per pulse at a wavelength of 532 nm. The response was detected with an amplified single longitudinal mode laser at 1064 nm wavelength with a peak power of ~500 W and a pulse length of 100 µs. The reflected detection laser light from the samples was collected and interfered in a GaAs crystal to convert the Doppler shifted, i.e., frequency modulated, light into amplitude modulated light and measured by photodiode. The crystal was pumped by ~1/6 of the light from the same amplified single longitudinal laser.
The cold-rolled samples were prepared to achieve well-developed textures which were measured using EBSD patterns from many thousands of grains.
Orientation distribution functions were derived according to Bunge’s convention and method [21]. Textures were generally similar for all conditions, although sharper after the heavier rolling reductions. Examples of pole figures are shown in Figure 1 below. Figure 1a shows the 50% deformed sample and Figure 1b shows the 70% deformed sample. The principal components are major {110}<112> with minor {111}<112> and {110}<001> orientations, which are well known for rolled 316 steel from literature reports. These are all more fully developed after the 70% reduction, although the differences are not great. The resulting anisotropies should, therefore, be of a similar type, as was indeed found in subsequent LUS measurements.
The angular P-wave velocities were calculated using these orientation distribution functions with crystal stiffness coefficients obtained from the literature for 316 grade steel (c11 = 205, c12 = 138 and c44 = 126 GPa) [26], together with its density, c.f., Table 1. The Voigt and Reuss limits applying to the stiffness tensors were first calculated and average values were then obtained using the approximations suggested by Hill [19] as arithmetic averages or, alternatively, geometric averages of the limit values.
Two different approaches were adopted for determining the wave velocities using LUS. In the first, cylinders were accurately turned co-axially with the rolling direction (RD) or the transverse direction (TD). An illustration of the cut-out, and a photograph of a sample after turning, are shown in Figure 2 below. The lasers were directed to opposite sides of the cylinder, and the longitudinal wave times of flight (ToFs) were measured while the specimen was rotated.
The black line on the cylindrical sample in the photograph shows where the LUS measurements were performed. A typical B-scan is shown below for the polar scans with rotations around the TD and RD axes. The first horizontal line around 2.4 µs is the first echo that has travelled through the cylindrical sample. This first echo exhibits double or quadruple symmetry as the polar angle is swept 360°, Figure 3a,b, respectively. The second echo, at around 5.75 µs, is sharp and continuous for the scan around the TD axis in Figure 3a, whereas in the scan around the RD axis, Figure 3b, this second echo is somewhat hidden behind other background signals.
The four crosses in Figure 3b, as well as the smileys on the second echo at the ND and TD polar angles, are attributed to the head wave which is also visible in the TD-scan of the flat samples which is discussed later.
The second approach to measuring wave velocities in the 316 stainless steel plates involved directing the generating laser beam to different positions over the plate surface using Galvano mirrors. A schematic of the setup is shown in Figure 4, where the detection laser (red arrow) is directed by the use of 2 Galvano mirrors at the back of the sample and the generation laser (green arrow) is directed to different locations on the sample front side. The lateral distance between the generation and detection lasers is referred to as GD.
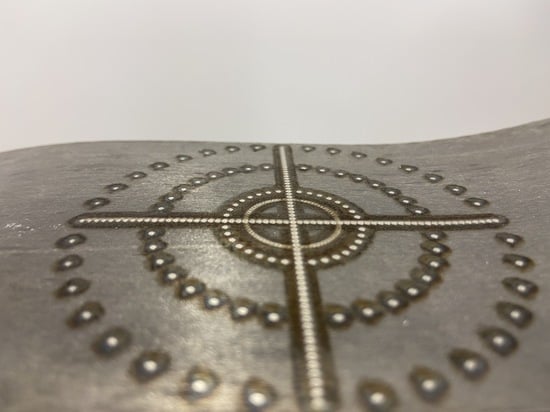
The generation laser point was scanned in the pattern shown in Figure 5 below, to probe the ultrasonic response in several different azimuthal and polar angles inside the material. This approach can be adapted so that the measurements are made from one side only of the material so that it would be more suitable for application in industrial environments.
A typical B-scan for such a measurement is shown in Figure 6 below. There are three regions indicated in the B-scan which correspond to the scan in: the RD direction, the TD direction, and one circle. The different echoes, i.e., the pressure-(P) and the shear-wave (S), are visible in the scans.
The parabolas are longitudinal (P), shear (S), or mode-converted (PS) waves. The RD scan and the TD scan are similar but differ in the region close to the GD = 0, i.e., the top of the parabolas. Here, the TD scan direction shows the head wave more clearly as almost straight lines originating from the peak of the uppermost parabola. The head wave is also visible in the circle scan showing up only close to the TD directions at ~5 µs.
2.2. Quenched Carbon Steel
A hot-rolled and quenched martensitic carbon steel was also investigated, both in the as-quenched condition and after tempering for 1 h at various temperatures. The purpose of this was to determine how the anisotropy of the steel varied as its strength level was changed. These samples were cut out from a 12 mm thick sheet and were then turned into cylinders coaxial with the normal direction so that measurements of P-wave velocity were made in the plane containing rolling and transverse directions. The post-annealing and oxidised samples are shown in Figure 7 below. The samples were measured in a laser-ultrasonics setup, both generating the ultrasound and detecting it at the same position.
Textures were determined for the steel using the same EBSD procedure, as described above, on both the as-quenched specimen and after tempering. However, as expected, these were virtually identical, so any variations in ultrasonic parameters arose from the condition of the martensite and not from differences in texture. All these measurements were restricted to the central third of the plate thickness, where the texture is uniform, corresponding also to the positions where the LUS measurements were made.
3. Results and Discussion
3.1. Stainless Steel–Cylindrical Specimens
Plots of the longitudinal wave velocity are shown in Figure 8 for all four material conditions in both rotation series, i.e., with the rotations around RD and around TD, corresponding to azimuthal angles of 0° and 90°. In fact, the type and degree of anisotropy is rather similar in each material. There is a two-fold symmetry for rotations around the TD axis and four-fold symmetry for RD axis rotations.
Also shown in Figure 8 are model calculations based on the textures measured by EBSD when enforcing symmetry on the calculated stiffness matrix. These are, in general, very close to the LUS measurements. Two sets of model results are included in each case. These refer to the Hill approximation used. It is universally assumed in the published literature that the Hill average is a simple arithmetic average of the Voigt and Reuss limit values. However, in his paper [19], Hill points out that a geometric average should be equally applicable, so this is also included in Figure 8. In fact, the differences are very small, although the geometric average appears to agree slightly better with the measurements than does the arithmetic one. This outcome is, however, sensitive to the crystal constants that are assumed (from literature sources), so a general conclusion on the relative merits is probably preliminary at the present time.
In all cases, the calculated velocities lie above the experimental values, which may also relate to uncertainty in the crystal coefficients applied in the models or may reflect a fundamental inadequacy of the Hill models. It may be added, however, that determinations of Young’s modulus on 316 stainless steel [23] showed a very similar deviation of the Hill calculations to higher values than the experimental ones. Hill’s model is not based on any strict physical principle, so it may not be correct in the limit. More fundamental approaches are possible, see, e.g., [27], but have not been attempted here.
3.2. Stainless Steel–Flat Plate Specimens
The wave paths through the plates are defined by the azimuthal angle θ and the polar angle ρ as shown in Figure 9. Note, in particular, that the polar angles vary not only with the GD distance (from generating laser position to detection) but also with the number of reflections.
As the number of reflections increases, the angle ρ diminishes progressively towards ND and the measured variation in velocity decreases. This is demonstrated for the as-received plate in Figure 10.
Figure 11 also contains the calculated velocities based on EBSD textures and the Hill arithmetic average procedure. As with the cylindrical specimens, the model values lie somewhat above the measurements, but the angular variations are very similar. The two experimental approaches appear to be in good agreement with one another. Some corrections could be made, perhaps since the experimental and modelled values refer to group and phase velocities, respectively, but this discrepancy is believed to be small for the present degree of texture and birefringence. Geometrical conditions preclude measurements along wave paths that lie close to the plane of the sheet, i.e., polar angles more than about 70° in each case, since the vertical movements of the plate surface become smaller and disappear completely at polar angles of 90°. Although the Galvano mirror method on the plate surfaces is not quite as precise as for the cylindrical samples, the numerical results are actually in excellent agreement and the greater simplicity and versatility of the former method weigh strongly in its favour for most industrial applications.
3.3. Quenched Steel
The cylindrical specimens of quenched martensitic steel were tempered for 1 h at temperatures up to 650 °C before measuring the wave velocities at room temperature. Figure 12 shows the resulting values through two complete revolutions of the samples. In general, the accuracy of ultrasonic wave velocities is mostly limited by the length of the wave path since time measurements are very exact. Due to the extremely constant path lengths in these lathe turned specimens, the precision of the values is very high and, from repeated measurements, can be judged to be significantly better than one part in ten thousand. The degree of anisotropy in individual specimens is only about 0.08%, and the repeatability is around 0.005%, as seen in Figure 12. In addition to these rotational measurements, P-velocities were also measured with high precision along the cylinder axis, i.e., along the plate’s normal direction.
A greater source of variation is actually the metallurgical condition since the wave velocity increases with tempering temperature and hence with strength level. From the as-quenched state to 650 °C, it increases by about 0.6%. This variation is in accord with other observations on the velocity of high strength steels [28] and also on variations of Young’s modulus [29]. The average wave velocity plotted against Vickers hardness, in Figure 13, agrees with measurements on other steels made in the authors’ laboratory [28]. There still appears to be no adequate explanation of this relationship between elastic strength and plastic strength. Calculations have been published of the elasticity of martensite based on atomic interactions [30,31], but these suffer from the assumption that the martensite has a tetragonal crystal structure, which is not the case for low carbon contents such as this (0.3% C), which are mainly cubic. Possibly, the high internal stresses in martensite are responsible in some way. Some new information is provided by the anisotropy data shown by the orange line in Figure 13. Due to the impossibility of making single crystals of martensite, the crystal elasticity coefficients have never been measured. Although the present results contain significant scatter, there appears to be a general decrease in the anisotropy as hardness reduces. The softest condition is expected to correspond most closely to pure iron when the steel’s carbon is fully precipitated as iron carbide. It appears, therefore, that the crystal anisotropy of martensite is slightly greater than that of pure bcc iron. It should be emphasised again that no change in the crystallographic texture occurs with tempering so the changes observed here must originate from variation in the steel’s fundamental elastic behaviour.
4. Conclusions
Two new methods have been developed and demonstrated for making measurements of anisotropy originating from texture. One gives the possibility of very high accuracy but requires special conditions, so it is restricted to laboratory conditions. The other, which employs Galvano mirrors to direct the generating laser beam, offers possibilities for application under industrial conditions.
Good agreement exists between P-wave anisotropy obtained with LUS and modelled behaviour, based on texture measurements, for plates of 316 stainless steel.
The elastic (wave) anisotropy of high strength martensitic steel is very small due to its weak texture. Nevertheless, this can be accurately measured due to the extreme precision of the newly developed method. Tempering at successively higher temperatures leads to softening, which is associated with small increases in both wave velocity and its anisotropy.
Author Contributions
Conceptualization, M.M. and B.H.; Data curation, M.M. and A.J.; Formal analysis, M.M.; Funding acquisition, M.M.; Investigation, M.M. and A.J.; Methodology, M.M., A.J. and B.H.; Project administration, M.M.; Software, M.M.; Validation, M.M. and A.J.; Visualization, M.M.; Writing—original draft, B.H. and M.M.; Writing—review & editing, B.H., M.M. and A.J. All authors have read and agreed to the published version of the manuscript.
Funding
This work was partially financed by the strategic innovation program Metallic Materials, by Vinnova, the Swedish Energy Agency, and Formas grant no. 2018-03916, as well as the European Union’s Research Fund for Coal and Steel (RFCS) research program under grant agreement no. RFCS-2018-847296.
Informed Consent Statement
Not applicable.
Conflicts of Interest
The authors declare no conflict of interest.
References
- Scruby, C.B.; Drain, L.E. Laser Ultrasonics Techniques and Applications; IOP Publishing Ltd. Techno House: Bristol, UK, 1990; ISBN 978-0-7503-0050-6. [Google Scholar]
- Kitagawa, H. Analysis of Elastic Anisotropy in Cold Rolled Steel Sheet. In Proceedings of the Sixth International Conference on Textures of Materials, Tokyo, Japan, 28 September–3 October 1981; Volume 1166, pp. 75–79. [Google Scholar]
- Konishi, T.; Honji, M. Texture Effect of Zircaloy on Ultrasonic Velocity. In Proceedings of the Sixth International Conference on Textures of Materials, Tokyo, Japan, 28 September–3 October 1981; Volume 1166, pp. 983–992. [Google Scholar]
- Thompson, R.B.; Lee, S.S.; Smith, J.F. Angular Dependence of Ultrasonic Wave Propagation in a Stressed, Orthorhombic Continuum: Theory and Application to the Measurement of Stress and Texture. J. Acoust. Soc. Am. 1986, 80, 921–931. [Google Scholar] [CrossRef] [Green Version]
- Ledbetter, H.M. RC Reno Texture and Dislocation Effects on Elastic Constants of Deformed Copper Plate. In Proceedings of the ICOTOM: Eighth International Conference on Textures of Materials, Santa-Fe, NM, USA, 20–25 September 1987. [Google Scholar]
- Spies, M.; Schneider, E. Nondestructive Analysis of Textures in Rolled Sheets by Ultrasonic Techniques. Texture Stress Microstruct. 1990, 13, 219–231. [Google Scholar] [CrossRef] [Green Version]
- Kawashima, K. Nondestructive Characterization of Texture and Plastic Strain Ratio of Metal Sheets with Electromagnetic Acoustic Transducers. J. Acoust. Soc. Am. 1990, 87, 681–690. [Google Scholar] [CrossRef]
- Spalthoff, P.; Wunnike, W.; Nauer-Gerhard, C.; Bunge, H.J.; Schneider, E. Determination of the Elastic Tensor of a Textured Low-Carbon Steel. Textures Microstruct. 1993, 21, 3–16. [Google Scholar] [CrossRef] [Green Version]
- Kawashima, K.; Hyoguchi, T.; Akagi, T. On-Line Measurement of Plastic Strain Ratio of Steel Sheet Using Resonance Mode EMAT. J. Nondestruct. Eval. 1993, 12, 71–77. [Google Scholar] [CrossRef]
- Hiwatashi, S.; Hatakeyama, T.; Ushioda, K.; Usuda, M. Numerical Analysis of Stiffness in Sheet Products Based on Crystal Anisotropy. Mater. Sci. Forum 1994, 157–162, 1585–1592. [Google Scholar] [CrossRef]
- Anderson, A.J.; Thompson, R.B.; Bolingbroke, R.; Root, J.H. Ultrasonic Characterization of Rolling and Recrystallization Textures in Aluminum. Textures Microstruct. 1996, 26, 39–58. [Google Scholar] [CrossRef]
- Moreau, A.; Lévesque, D.; Lord, M.; Dubois, M.; Monchalin, J.-P.; Padioleau, C.; Bussière, J.F. On-Line Measurement of Texture, Thickness and Plastic Strain Ratio Using Laser-Ultrasound Resonance Spectroscopy. Ultrasonics 2002, 40, 1047–1056. [Google Scholar] [CrossRef]
- Artymowicz, D.; Hutchinson, B.; Nogues, M. Effects of Crystallographic Texture on Ultrasonic Wave Velocities in Steels. Mater. Sci. Technol. 2002, 18, 1142–1146. [Google Scholar] [CrossRef]
- Lévesque, D.; Lim, C.S.; Padioleau, C.; Blouin, A. Measurement of Texture in Steel by Laser-Ultrasonic Surface Waves. J. Phys. Conf. Ser. 2011, 278, 012007. [Google Scholar] [CrossRef]
- Bate, P.; Lundin, P.; Lindh-Ulmgren, E.; Hutchinson, B. Application of Laser-Ultrasonics to Texture Measurements in Metal Processing. Acta Mater. 2017, 123, 329–336. [Google Scholar] [CrossRef]
- Duijster, A.; Volker, A.; Stolzenberg, M. Angle Beam Method for Detection of Textural Features in Steel Sheet. In Proceedings of the 12th European Conference of Non-Destructive Testing, Gothenburg, Sweden, 11–15 June 2018; p. 8. [Google Scholar]
- Voigt, W. Theoretische Studien Über Die Elasticitätsverhältnisse Der Krystalle. Der Dieterichschen Buchhandlung: Göttingen, Germany, 1887. [Google Scholar]
- Reuss, A. Computation of the Yield Point of Mixed Crystals Due to Hiring for Single Crystals. JZAMM 1929, 9, 49–58. [Google Scholar]
- Hill, R. The Elastic Behaviour of a Crystalline Aggregate. Proc. Phys. Soc. A 1952, 65, 349–354. [Google Scholar] [CrossRef]
- Park, N.J.; Bunge, H.J.; Kiewel, H.; Fritsche, L. Calculation of Effective Elastic Moduli of Textured Materials. Textures Microstruct. 1970, 23. [Google Scholar] [CrossRef] [Green Version]
- Bunge, H.-J. Texture Analysis in Materials Science: Mathematical Methods; Elsevier: Amsterdam, The Netherlands, 2013; ISBN 1-4832-7839-5. [Google Scholar]
- Roe, R. Description of Crystallite Orientation in Polycrystalline Materials. III. General Solution to Pole Figure Inversion. J. Appl. Phys. 1965, 36, 2024–2031. [Google Scholar] [CrossRef]
- Tägtström, P.; Hutchinson, B. The Influence of Crystallographic Texture and Nitrogen Content on Young’s Modulus of 304 and 316 Stainless Steel Sheet. Appl. Stainl. Steel 1992, 1, 84–93. [Google Scholar]
- Sharples, S.D. All-Optical Scanning Acoustic Microscope. Ph.D. Thesis, University of Nottingham, Nottingham, UK, 2003. [Google Scholar]
- Dryburgh, P.; Pieris, D.; Martina, F.; Patel, R.; Sharples, S.; Li, W.; Clare, A.T.; Williams, S.; Smith, R.J. Spatially Resolved Acoustic Spectroscopy for Integrity Assessment in Wire–Arc Additive Manufacturing. Addit. Manuf. 2019, 28, 236–251. [Google Scholar] [CrossRef]
- Ledbetter, H.M. Monocrystal-Polycrystal Elastic Constants of a Stainless Steel. physica status solidi 1984, 85, 89–96. [Google Scholar] [CrossRef]
- Ledbetter, H.M. Sound Velocities and Elastic-Constant Averaging for Polycrystalline Copper. J. Phys. D Appl. Phys. 1980, 13, 1879. [Google Scholar] [CrossRef]
- Falkenström, M.; Engman, M.; Lindh-Ulmgren, E.; Hutchinson, B. Laser Ultrasonics for Process Control in the Metal Industry. Nondestruct. Test. Eval. 2011, 26, 237–252. [Google Scholar] [CrossRef]
- Speich, G.R.; Leslie, W.C. Elastic Constants of Martensite. Met. Mater Trans B 1973, 4, 1873–1875. [Google Scholar] [CrossRef]
- Gunkelmann, N.; Ledbetter, H.; Urbassek, H.M. Experimental and Atomistic Study of the Elastic Properties of A′ Fe–C Martensite. Acta Mater. 2012, 60, 4901–4907. [Google Scholar] [CrossRef]
- Souissi, M.; Numakura, H. Elastic Properties of Fe–C and Fe–N Martensites. ISIJ Int. 2015, 55, 1512–1521. [Google Scholar] [CrossRef]
Figure 1.
Pole figures of the iron face centred cubic orientations with stereographic projection of the upper hemisphere with m3m symmetry for (a) the 50% deformed sample (792,127 data points) and (b) the 70% deformed sample (70,977 data points).
Figure 1.
Pole figures of the iron face centred cubic orientations with stereographic projection of the upper hemisphere with m3m symmetry for (a) the 50% deformed sample (792,127 data points) and (b) the 70% deformed sample (70,977 data points).

Figure 2.
(a) Illustration of how the cuboid samples were cut from the cold-rolled samples. (b) Photograph of the sample after turning, where some part of the original cuboid was left untouched to keep track of the material axes.
Figure 2.
(a) Illustration of how the cuboid samples were cut from the cold-rolled samples. (b) Photograph of the sample after turning, where some part of the original cuboid was left untouched to keep track of the material axes.

Figure 3.
B-scans of the 70% deformed heat-treated 316 sample with rotation around the (a) TD and (b) RD axis.
Figure 3.
B-scans of the 70% deformed heat-treated 316 sample with rotation around the (a) TD and (b) RD axis.

Figure 4.
Schematic of the laser ultrasonic transmission measurement set-up, generating on one side and detecting on the opposite side. The Galvano mirrors can direct the generation point and the position is measured synchronously with the ultrasonic response. The detection and generating lasers are focused on opposite sides of the specimen.

Figure 5.
Image of the sample after the transmission measurement showing the ablation marks on the generation side.
Figure 5.
Image of the sample after the transmission measurement showing the ablation marks on the generation side.

Figure 6.
Typical B-scans for measurements with a cross extending ±3 times the plate thickness together with one circle at a radius of 0.7× thickness.
Figure 6.
Typical B-scans for measurements with a cross extending ±3 times the plate thickness together with one circle at a radius of 0.7× thickness.

Figure 7.
Photograph of the martensitic steel samples after the annealing (at the indicated temperatures).
Figure 7.
Photograph of the martensitic steel samples after the annealing (at the indicated temperatures).

Figure 8.
LUS measured velocity versus the polar angle for all the cylindrical samples where (a,b) represents the as-received 50% reduced, (c,d) the heat treated 50% reduced, (e,f) the as-received 70% reduced, and (g,h) the heat treated 70% reduced sample. The graphs also display the EBSD calculated velocity using Hill arithmetic and the geometric approximation.


Figure 9.
Illustration of how the polar angles ρ towards ND and the azimuthal θ towards RD are defined together with the measurement principle, with the green arrow representing the generation laser position and the red arrow representing the detection laser. GD is the separation between the generation and the detection lasers. For the same GD distance, different echoes will have different polar angles but the same azimuthal angle.

Figure 10.
Velocity vs. azimuthal angle θ = ±180° for the circular scan with GD = ~2 times the plate thickness. Echoes 1–4 correspond to polar angles of ρ = 45, 18, 11 and 8°, respectively. The plot contains measurements (circles) from three full revolutions of the generation laser and the corresponding EBSD calculated velocities (solid lines) using Hill arithmetic approximation.

Figure 11.
Longitudinal wave velocity as a function of polar angle for azimuthal values of 0° (above) and 90° (below).
Figure 11.
Longitudinal wave velocity as a function of polar angle for azimuthal values of 0° (above) and 90° (below).

Figure 12.
The measured longitudinal wave velocity as a function of azimuthal angle for the as received and tempered martensite materials.
Figure 12.
The measured longitudinal wave velocity as a function of azimuthal angle for the as received and tempered martensite materials.

Figure 13.
The blue square markers represent the longitudinal wave velocity in the normal direction for the tempered martensitic samples (left y-axis). The leftmost point is the 650 °C tempered martensitic sample, and the last point on the line represents the as-received sample, i.e., un-tempered. Orange squares and line show the anisotropic variation that originates from the (weak) texture.


Table 1.
Description of sample properties.
| Heat Treatment | Rolling Reduction | Start Grain Size | Thickness | Density |
|---|---|---|---|---|
| No treatment | 70% | 20 µm | 12 mm | 7938 kg/m3 |
| 1 h @ 1200 °C | 70% | 60 µm | 12 mm | 7933 kg/m3 |
| No treatment | 50% | 20 µm | 12 mm | 7937 kg/m3 |
| 1 h @ 1200 °C | 50% | 60 µm | 12 mm | 7932 kg/m3 |
Publisher’s Note: MDPI stays neutral with regard to jurisdictional claims in published maps and institutional affiliations. |
© 2022 by the authors. Licensee MDPI, Basel, Switzerland. This article is an open access article distributed under the terms and conditions of the Creative Commons Attribution (CC BY) license (https://creativecommons.org/licenses/by/4.0/).
Share and Cite
MDPI and ACS Style
Malmström, M.; Jansson, A.; Hutchinson, B. Application of Laser-Ultrasonics for Evaluating Textures and Anisotropy. Appl. Sci. 2022, 12, 10547. https://0-doi-org.brum.beds.ac.uk/10.3390/app122010547
AMA Style
Malmström M, Jansson A, Hutchinson B. Application of Laser-Ultrasonics for Evaluating Textures and Anisotropy. Applied Sciences. 2022; 12(20):10547. https://0-doi-org.brum.beds.ac.uk/10.3390/app122010547
Chicago/Turabian StyleMalmström, Mikael, Anton Jansson, and Bevis Hutchinson. 2022. "Application of Laser-Ultrasonics for Evaluating Textures and Anisotropy" Applied Sciences 12, no. 20: 10547. https://0-doi-org.brum.beds.ac.uk/10.3390/app122010547
Note that from the first issue of 2016, this journal uses article numbers instead of page numbers. See further details here.