

Seismic Coherent Noise Removal of Source Array in the NSST Domain

College of Geo-Exploration Science and Technology, Jilin University, Changchun 130026, China
*
Author to whom correspondence should be addressed.
Appl. Sci. 2022, 12(21), 10846; https://0-doi-org.brum.beds.ac.uk/10.3390/app122110846
Submission received: 7 September 2022
/
Revised: 23 October 2022
/
Accepted: 25 October 2022
/
Published: 26 October 2022
(This article belongs to the Special Issue Technological Advances in Seismic Data Processing and Imaging)
Abstract
:The technique of the source array based on the vibroseis can provide the strong energy of a seismic wave field, which better meets the need for seismic exploration. The seismic coherent noise reduces the signal-to-noise ratio (SNR) of the source array seismic data and affects the seismic data processing. The traditional coherent noise removal methods often cause some damage to the effective signal while suppressing coherent noise or cannot suppress the interference wave effectively at all. Based on the multi-scale and multi-direction properties of the non-subsampled Shearlet transform (NSST) and its simple mathematical structure, the seismic coherent noise removal method of source array in NSST domain is proposed. The method is applied to both the synthetic seismic data and the filed seismic data. After processing with this method, the coherent noise of the seismic data is greatly removed and the effective signal information is greatly protected. The analysis of the results demonstrates the effectiveness and practicability of the proposed method on coherent noise attenuation.
1. Introduction
The seismic exploration method is widely used in resource exploration and other fields, and the seismic source, as an important part of the seismic data acquisition, directly affects the exploration effect of the seismic exploration. With the rapid development of vibroseis technology, vibroseis is gradually replacing the traditional dynamite source for seismic data acquisition due to its advantages of safety, environmental protection, high quality, economy, and efficiency. However, limited by its own structure and exploration environment, the single vibroseis has the problems of small output force and limited exploration depth. In order to meet the demand of seismic exploration, the source array based on vibroseis technology is paid more and more attention. In the seismic data acquisition of source array, there are generally more serious coherent noises, such as multiple refraction waves and surface waves of strong energy, strong acoustic interference, and surface direct waves with wide frequency bands, which greatly affect the quality of the seismic data. The removal of coherent noise is essential for the exploration technique of the source array.
How to better remove the seismic noise and improve the SNR of the seismic data has been a hot research topic in the seismic exploration field [1,2,3]. For coherent noise, scholars of seismic exploration have presented many seismic denoising approaches to suppress it. The traditional noise removal methods mainly suppress coherent noise according to the difference between effective signal and coherent noise in apparent velocity and frequency, such as f-k filter [4,5], K-L transform [6,7], Radon transform [8,9], radial channel transform [10,11], empirical mode decomposition (EMD) [12,13], and so on. Wavelet transform [14,15] is an effective tool for seismic data processing, which has great advantages in one-dimensional data processing, though this advantage cannot be simply extended to two-dimensional or three-dimensional data. Therefore, multi-scale geometric analysis methods such as Ridgelet transform [16,17], Curvelet transform [18,19], Contourlet transform [20,21] and Shearlet transform [22] have been proposed successively. At present, multi-scale geometric analysis has been widely used in seismic data processing and achieved certain effect.
G. Easley, K. Guo, and D. Labate [23] proposed the Shearlet transform based on the basic theory of wavelet transform and the multi-scale analysis theory. Shearlet transform not only has good localization characteristics, scaling characteristics, direction sensitivity, and near-optimal sparse representation performance, but also has a simple mathematical structure and the transformed coefficients have a one-to-one correspondence with the image points. Therefore, compared with other multi-scale geometric analysis methods, Shearlet transform has a more delicate representation of the scale direction and the physical significance of the transformed coefficients is clearer, which is more conducive to the processing of the coefficients. In the process of the conventional Shearlet transform, the subsampling operation is carried out, which leads to spectrum aliasing in the low frequency and high frequency sub-bands decomposed by Shearlet transform. The spectrum aliasing will cause the information of the same direction to appear in several different sub-bands at the same time, which will weaken the direction selectivity. In addition, the subsampling operation makes the Shearlet coefficient low redundancy, resulting in the lack of the translation invariance. If it is used for image denoising, there will be an obvious ringing effect. In order to overcome the shortcomings mentioned above and enhance the directional selectivity and the translation invariance of Shearlet transform, the NSST came into being. NSST is a non-orthogonal transform. The NSST abandons the subsampling operation and combines the non-subsampled Laplacian pyramid transform (NSLP) with the non-subsampled directional filter. After the NSST, the size of each direction sub-band at each scale is the same as the original image, which greatly improves the image redundancy. The enhancement of the image coefficient redundancy allows the NSST to have the translation invariance. The NSST has been successfully applied in many fields.
In the field of image processing, the NSST has been widely used. Guo, et al. (2013) proposed a new multi-focus image fusion algorithm based on the NSST [24]. Karami et al. (2016) adopted the NSST and the fully constrained least squares unmixing (FCLSU) to the denoising of hyperspectral images [25]. Priya et al. (2017) used the NSST based on the multislice fusion to the edge enhancement of liver CT images [26]. Qu et al. (2018) presented an image enhancement method based on the NSST and the directional information measurement [27]. Li et al. (2019) performed the enhancement of hyperspectral remote sensing images based on improved fuzzy contrast in the NSST domain [28]. Ramakrishnan et al. (2020) applied the NSST to the fusion of multiple exposure images [29]. Shen et al. (2021) made a change detection in SAR images based on the improved NSST and the multi-scale feature fusion CNN [30]. The NSST also has been increasingly applied in the seismic exploration field in recent years. Liang et al. (2018) presented a denoising method of microseismic data noise by the NSST based on singular value decomposition [31]. Sang et al. (2018) applied the NSST to petroleum seismic exploration denoising [32]. Sang et al. (2020) proposed a seismic random noise attenuation based on PCC classification in the NSST Domain [33].
The existing traditional denoising methods have achieved certain effects in the process of attenuating coherent noise but they also have some problems. For example, some methods will produce some new interference and some will lead to uneven energy after attenuating, even damaging the effective signal. Based on the coherent noise characteristics of the vibrator seismic data and the multi-scale and multi-directional properties of Shearlet transform, coherent noise removal of the source array in NSST domain is proposed in this article. The method is applied in both the synthetic seismic data and the filed seismic data. After processing with this method, the coherent noise in the seismic data is greatly removed and the effective signal information is greatly protected. The analysis of the results demonstrates the effectiveness and practicability of the proposed method on seismic coherent noise removal.
2. Theory and Method
2.1. Shearlet Transform
Shearlet transform is an asymptotically optimal sparse representation of multidimensional functions constructed by a special form of affine systems with synthetic expansion, which is composed of the Laplace pyramid transform and a set of directional filters.
When the dimension is two-dimensional, the scale matrix and the shear matrix are:
In Equation (1), A is the scale matrix, which can be divided into scales; j > 0, j is the scale parameter; B is the shear matrix, which can be dissected into directions; and l is the shear parameter.
The affine system with synthetic expansion is defined as:
In Equation (2), , φ is the shear wave function, L represents the productable space, x is the data to be processed, det (·) is the determinant, and k is the translation parameter.
If satisfies the Parseval framework (the tight framework), that is, for any function, it satisfies the following equation:
In Equation (3), Cj,l,k is the Shearlet domain coefficient, S is the Shearlet forward transform, and is the inner product. is called the composite wavelet. Parameters can control the division of the direction and the scale. By taking the inner product of the function and the basis function f and the basis function of different scales, directions, and positions, the Shearlet domain coefficients in the corresponding scale, direction, and position can be obtained. This process essentially uses the basis function after translation, expansion, and rotation to approximate the signal.
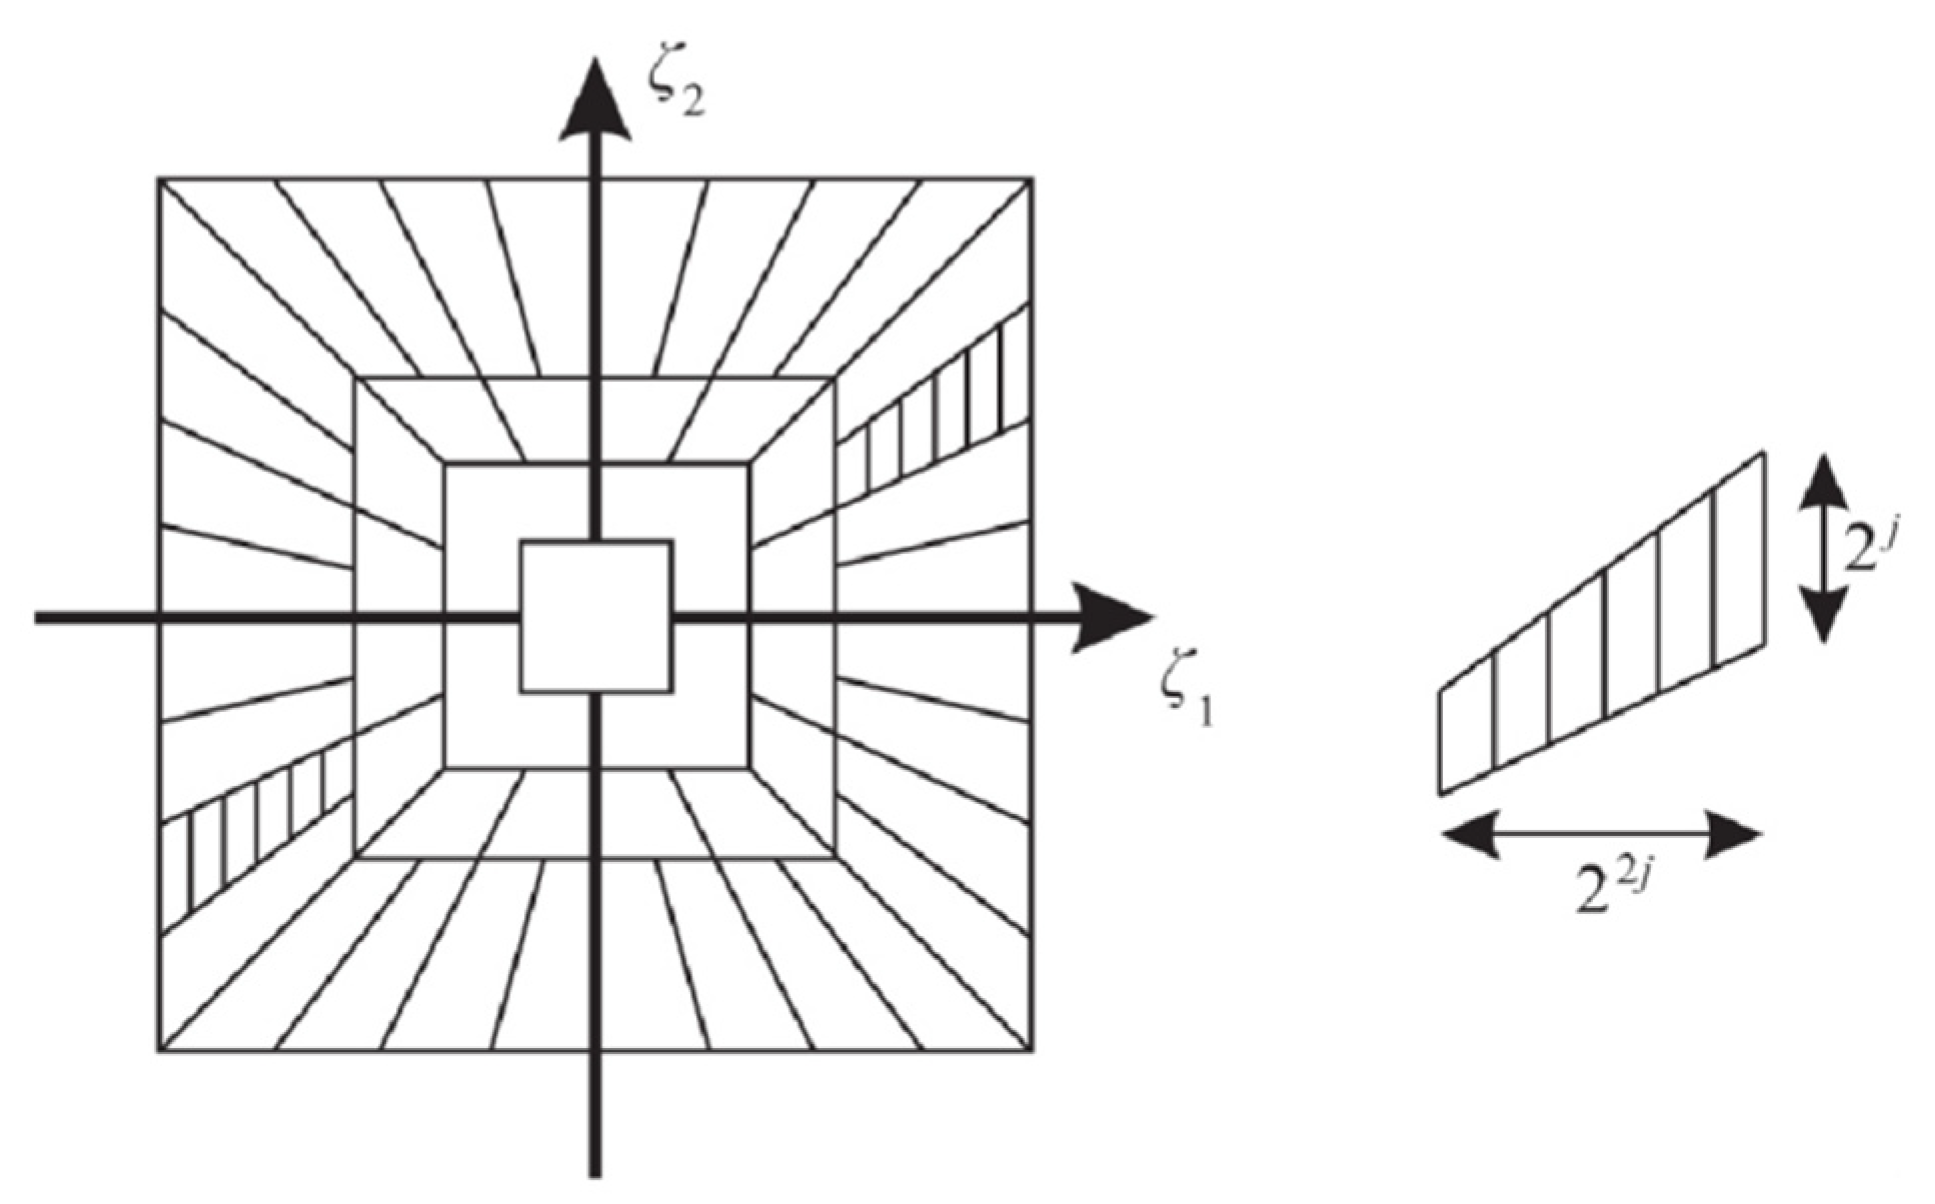
The frequency domain subdivision of the shear wave and its support interval are shown in Figure 1. As can be seen from Figure 1, the support interval of any shear wave element in the frequency domain is a trapezoidal region symmetric about the origin; the direction is distributed along a straight line with the slope of . The size of the trapezoidal region is about .
2.2. Non-Subsampled Shearlet Transform
Because Shearlet transform does not have the translational invariance, it is easy to generate the pseudo-Gibbs phenomenon near singular points when it is applied to image fusing and denoising. The NSST with the translational invariance can solve this problem. The discretization process of the NSST is composed of the multi-scale subdivision and the direction localization:
- (1)
- The multi-scale subdivision of the NSST is achieved by the non-subsampled pyramid transform (NSP). The image is decomposed by the j-level of the non-subsampling filters to obtain j + 1 sub-bands of the same size as the original image, including a low-frequency image and j high-frequency images;
- (2)
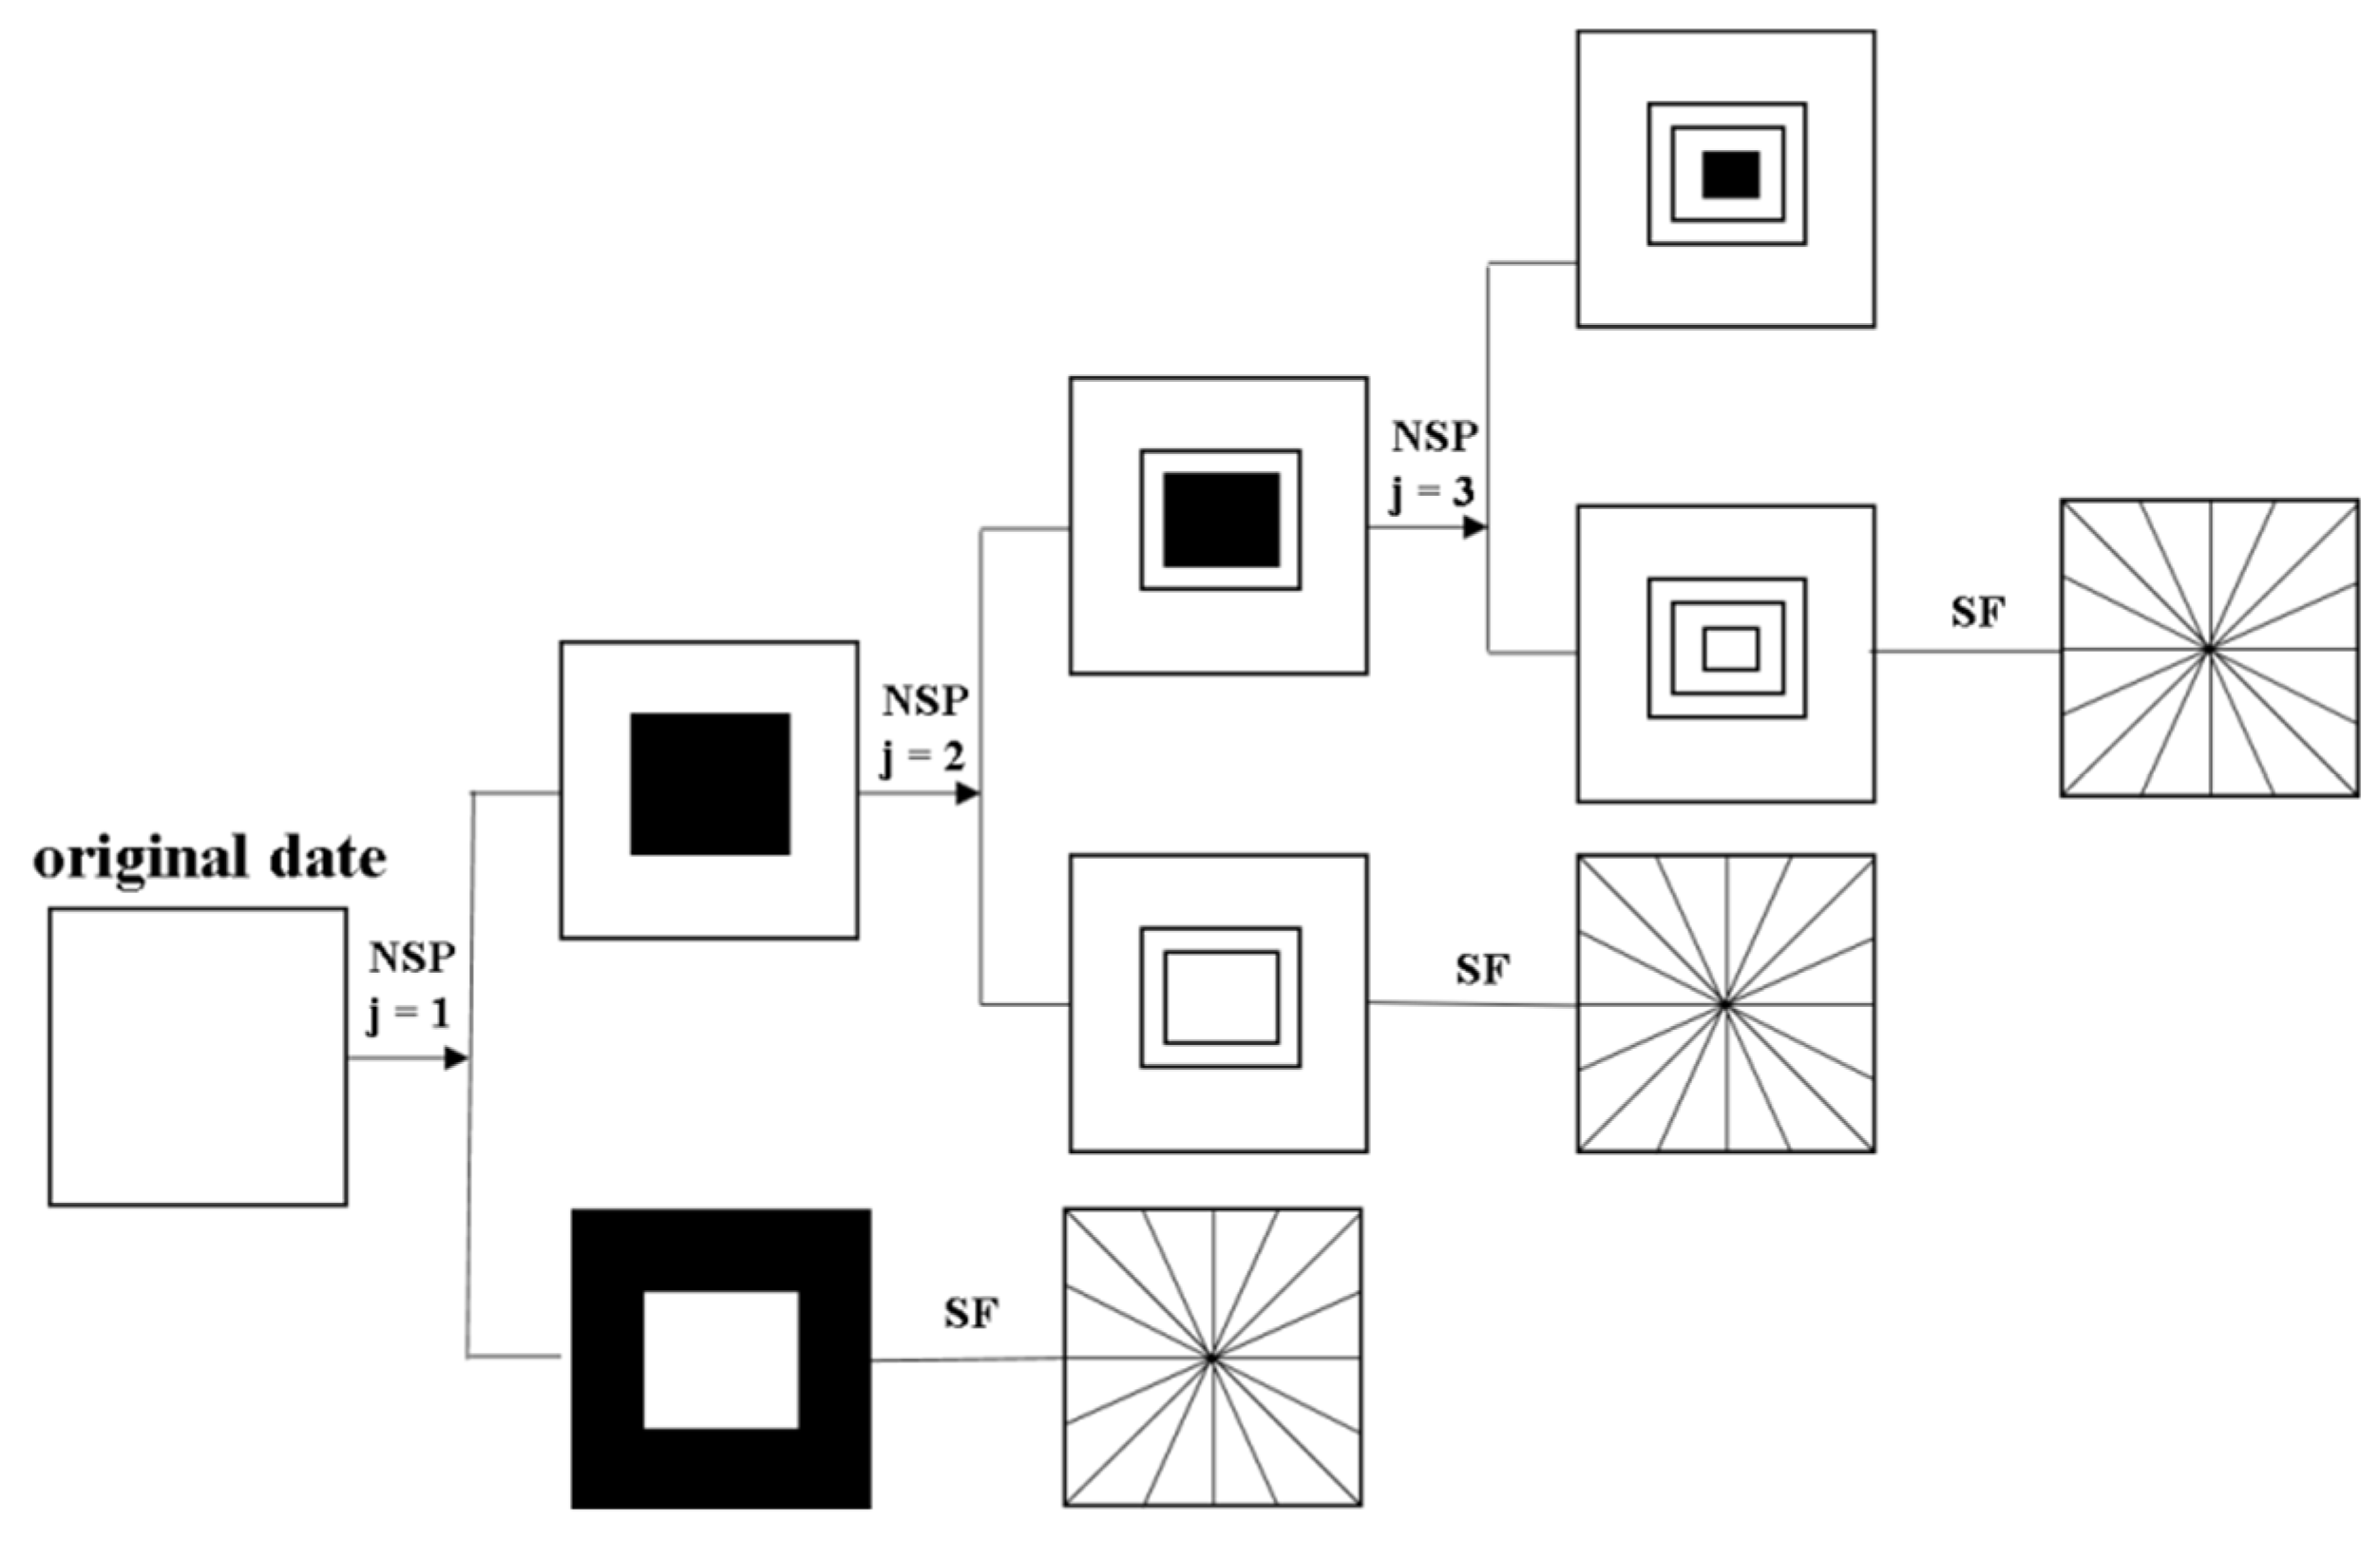
- The direction localization of the NSST is achieved by the improved shearing filter (SF). The standard shearing filter is realized by the translation operation of the window function in the pseudo-polarization grid; the subsampling operation is required during the execution, so it does not have the translation invariance. However, the NSST maps the standard shearing filter from the pseudo-polarization grid system to the Cartesian coordinate system and then directly completes its operation through the inverse Fourier transform and the two-dimensional convolution. Therefore, NSST can avoid the subsampling operation and meet the translation invariance. Figure 2 shows the multi-scale and multi-direction decomposition process of the NSST.
2.3. The Denoising Method in NSST Domain
The NSST abandons the subsampling operation and combines the non-subsampled Laplacian pyramid transform (NSLP) with the non-subsampled directional filter. After the NSST, the size of each direction sub-band at each scale is the same as the original image, which greatly improves the image redundancy. The enhancement of the image coefficient redundancy makes the NSST have the translation invariance and avoid the spectrum aliasing and the pseudo-Gibbs phenomenon. Therefore, the NSST has a stronger data processing performance. The NSST has a more delicate representation of the scale direction and the physical significance of the transformed coefficients is clearer, which is more conducive to the processing of the coefficients. The NSST can transform the time-space domain signal f(x) into the NSST domain (j, l, k), so the different signals can be easily separated in the NSST domain. Each NSST coefficient has its own specific frequency, direction, and position. The scale parameter j reflects the frequency difference; the direction parameter l reflects the direction difference, that is, mainly reflects the apparent velocity difference; and the position parameter k reflects the spatial location difference and the amplitude difference.
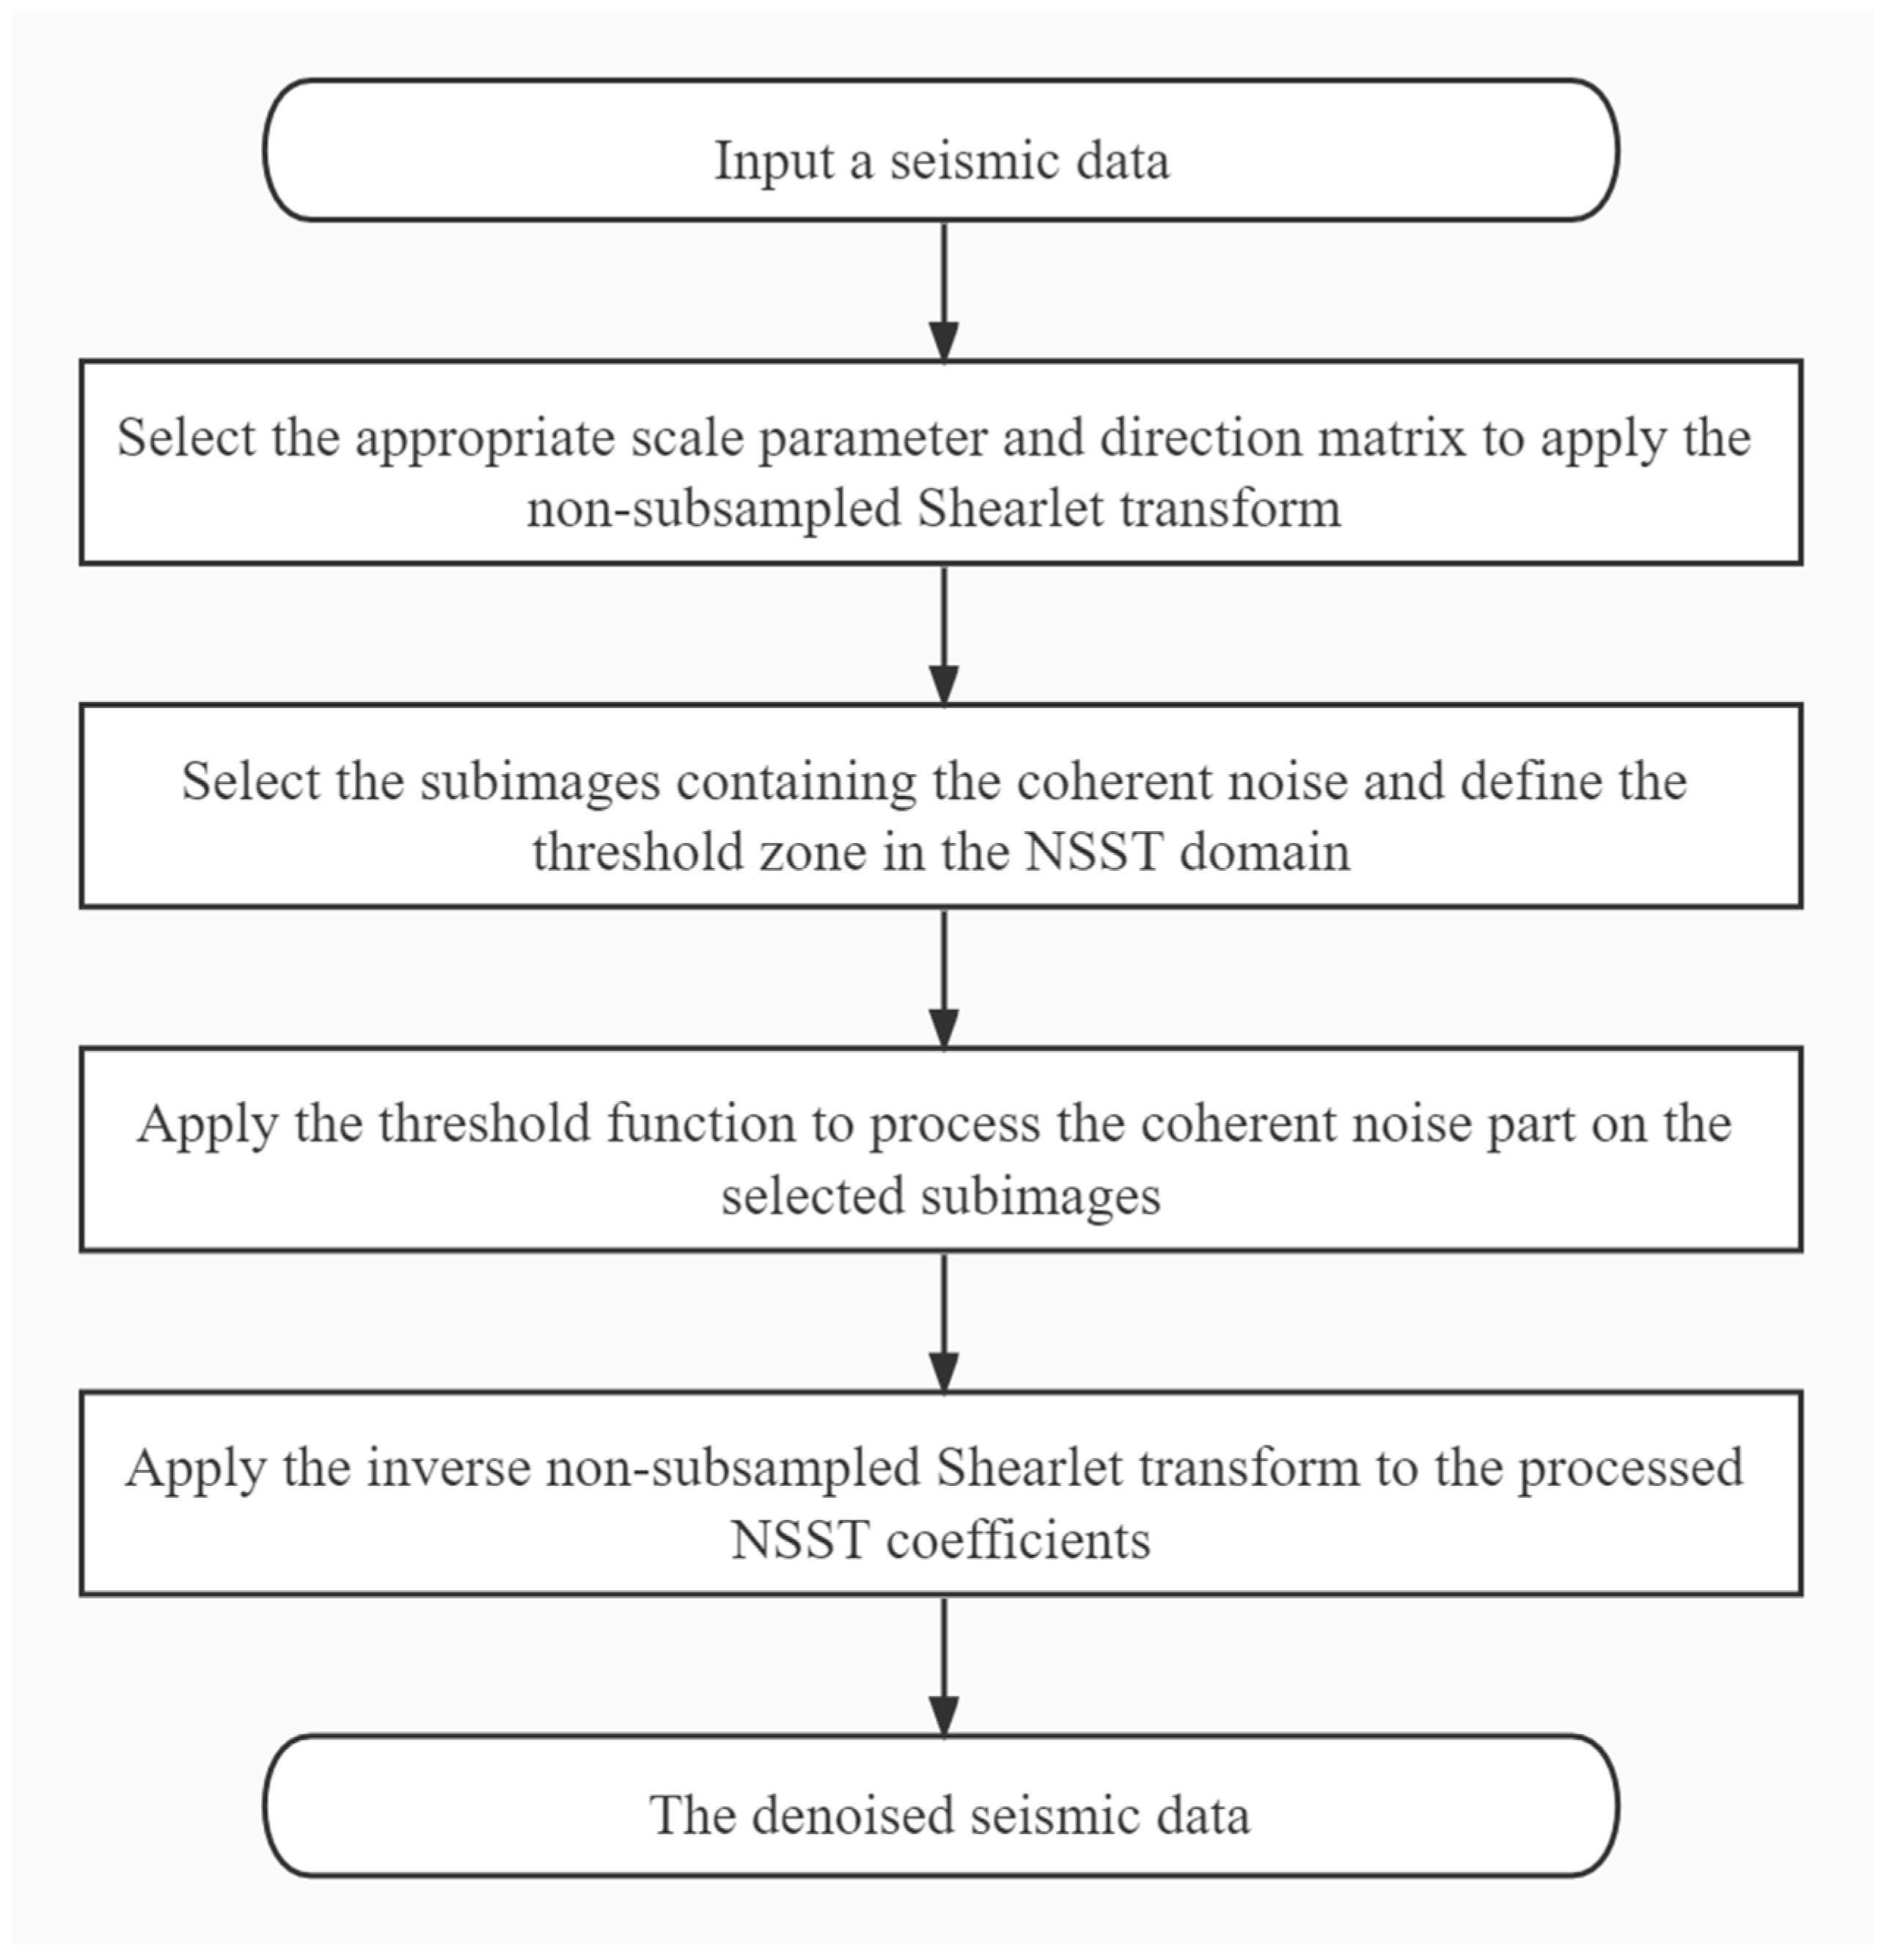
As shown in Figure 3, The specific steps of the coherent noise removal method of the vibrator source array seismic data in the NSST domain in this article are as follows:
In this article, we choose the norm to construct the threshold function.
The norm of the NSST domain coefficient is:
In Equation (4), is the norm of the NSST coefficient in the j scale l direction.
The threshold function is the adaptive threshold changing with scale and direction, which is expressed as follows:
In Equation (5), is the threshold function; is the total number of sampling points for the seismic data; is the norm of the NSST coefficient in the j scale l direction, J is the total scale of the decomposition; , σ is the noise standard deviation, median( ) is a median value for all the elements in the data matrix; is minimum value function; and is the test constant.
3. Results
3.1. Synthetic Example
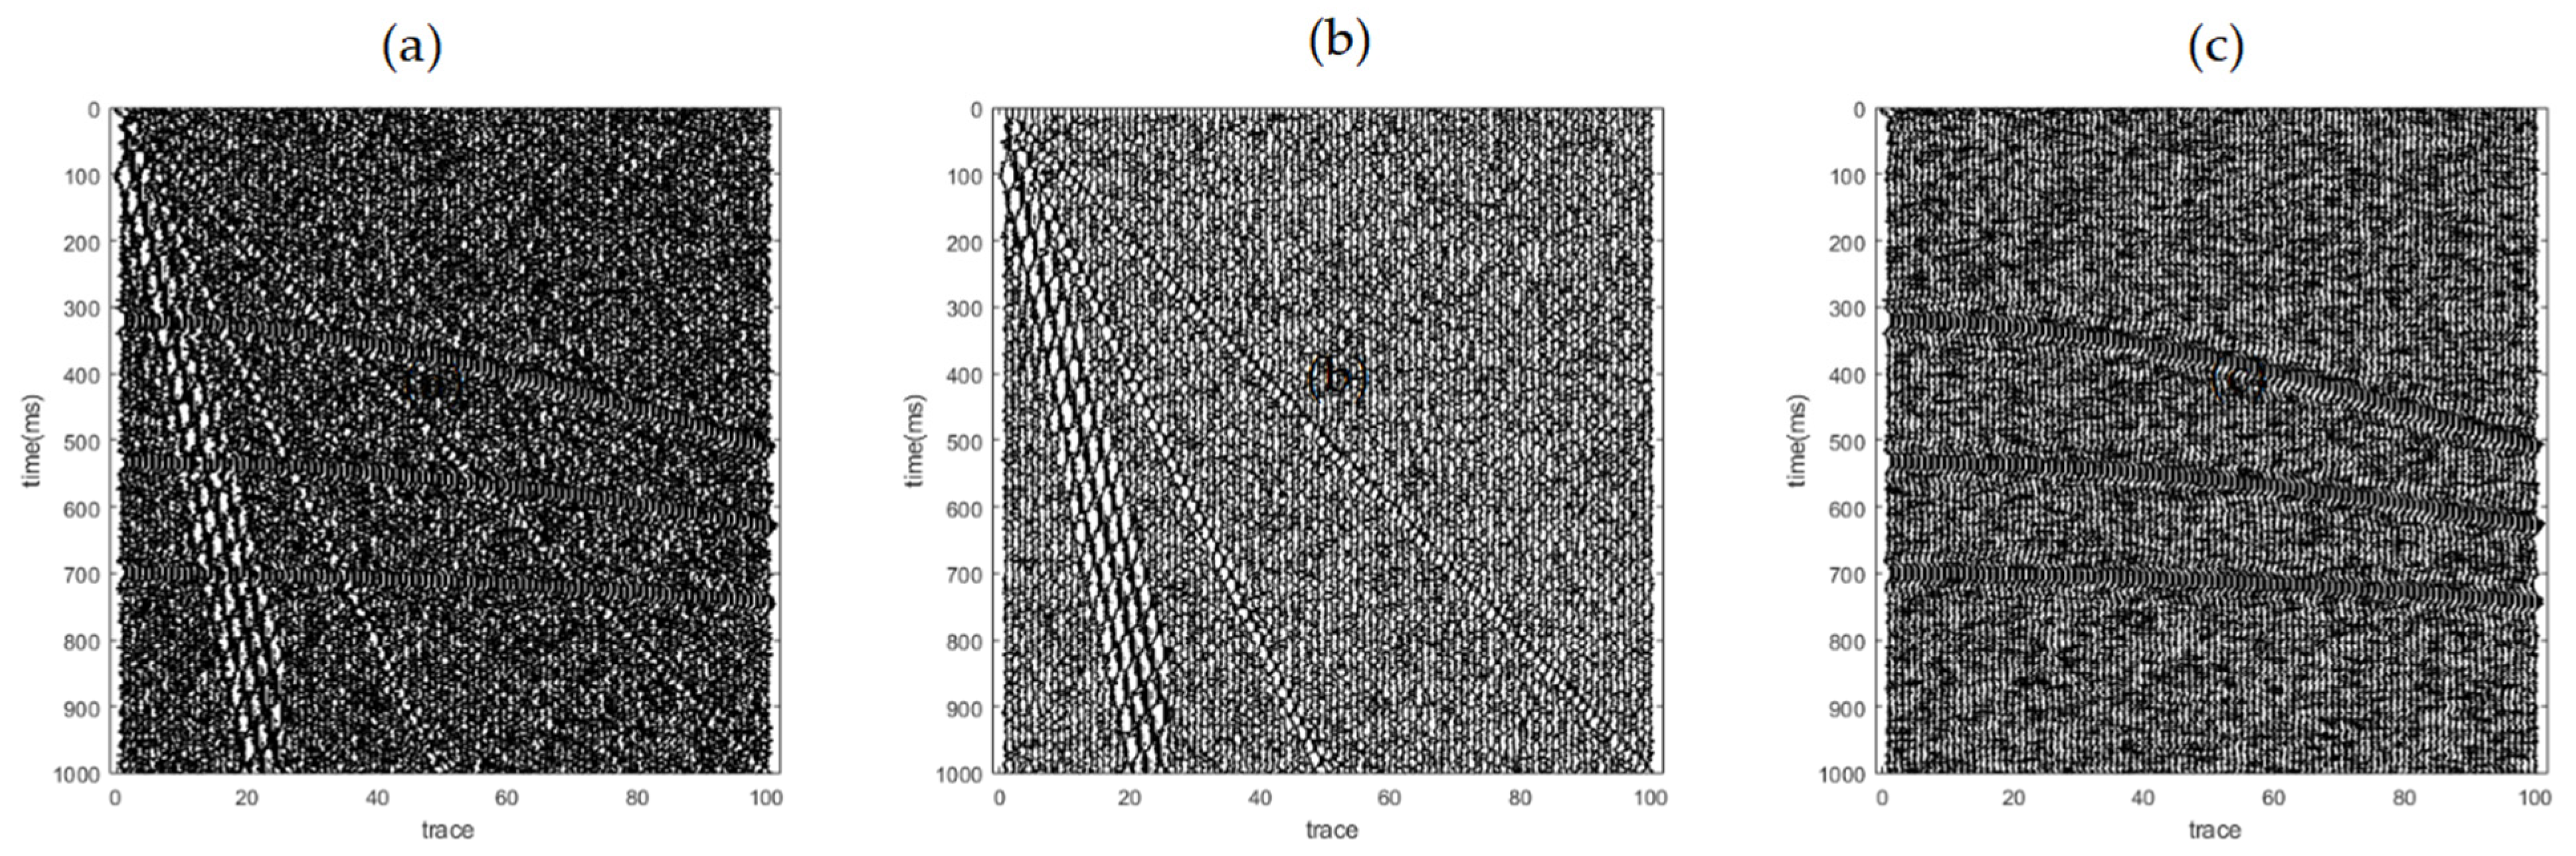
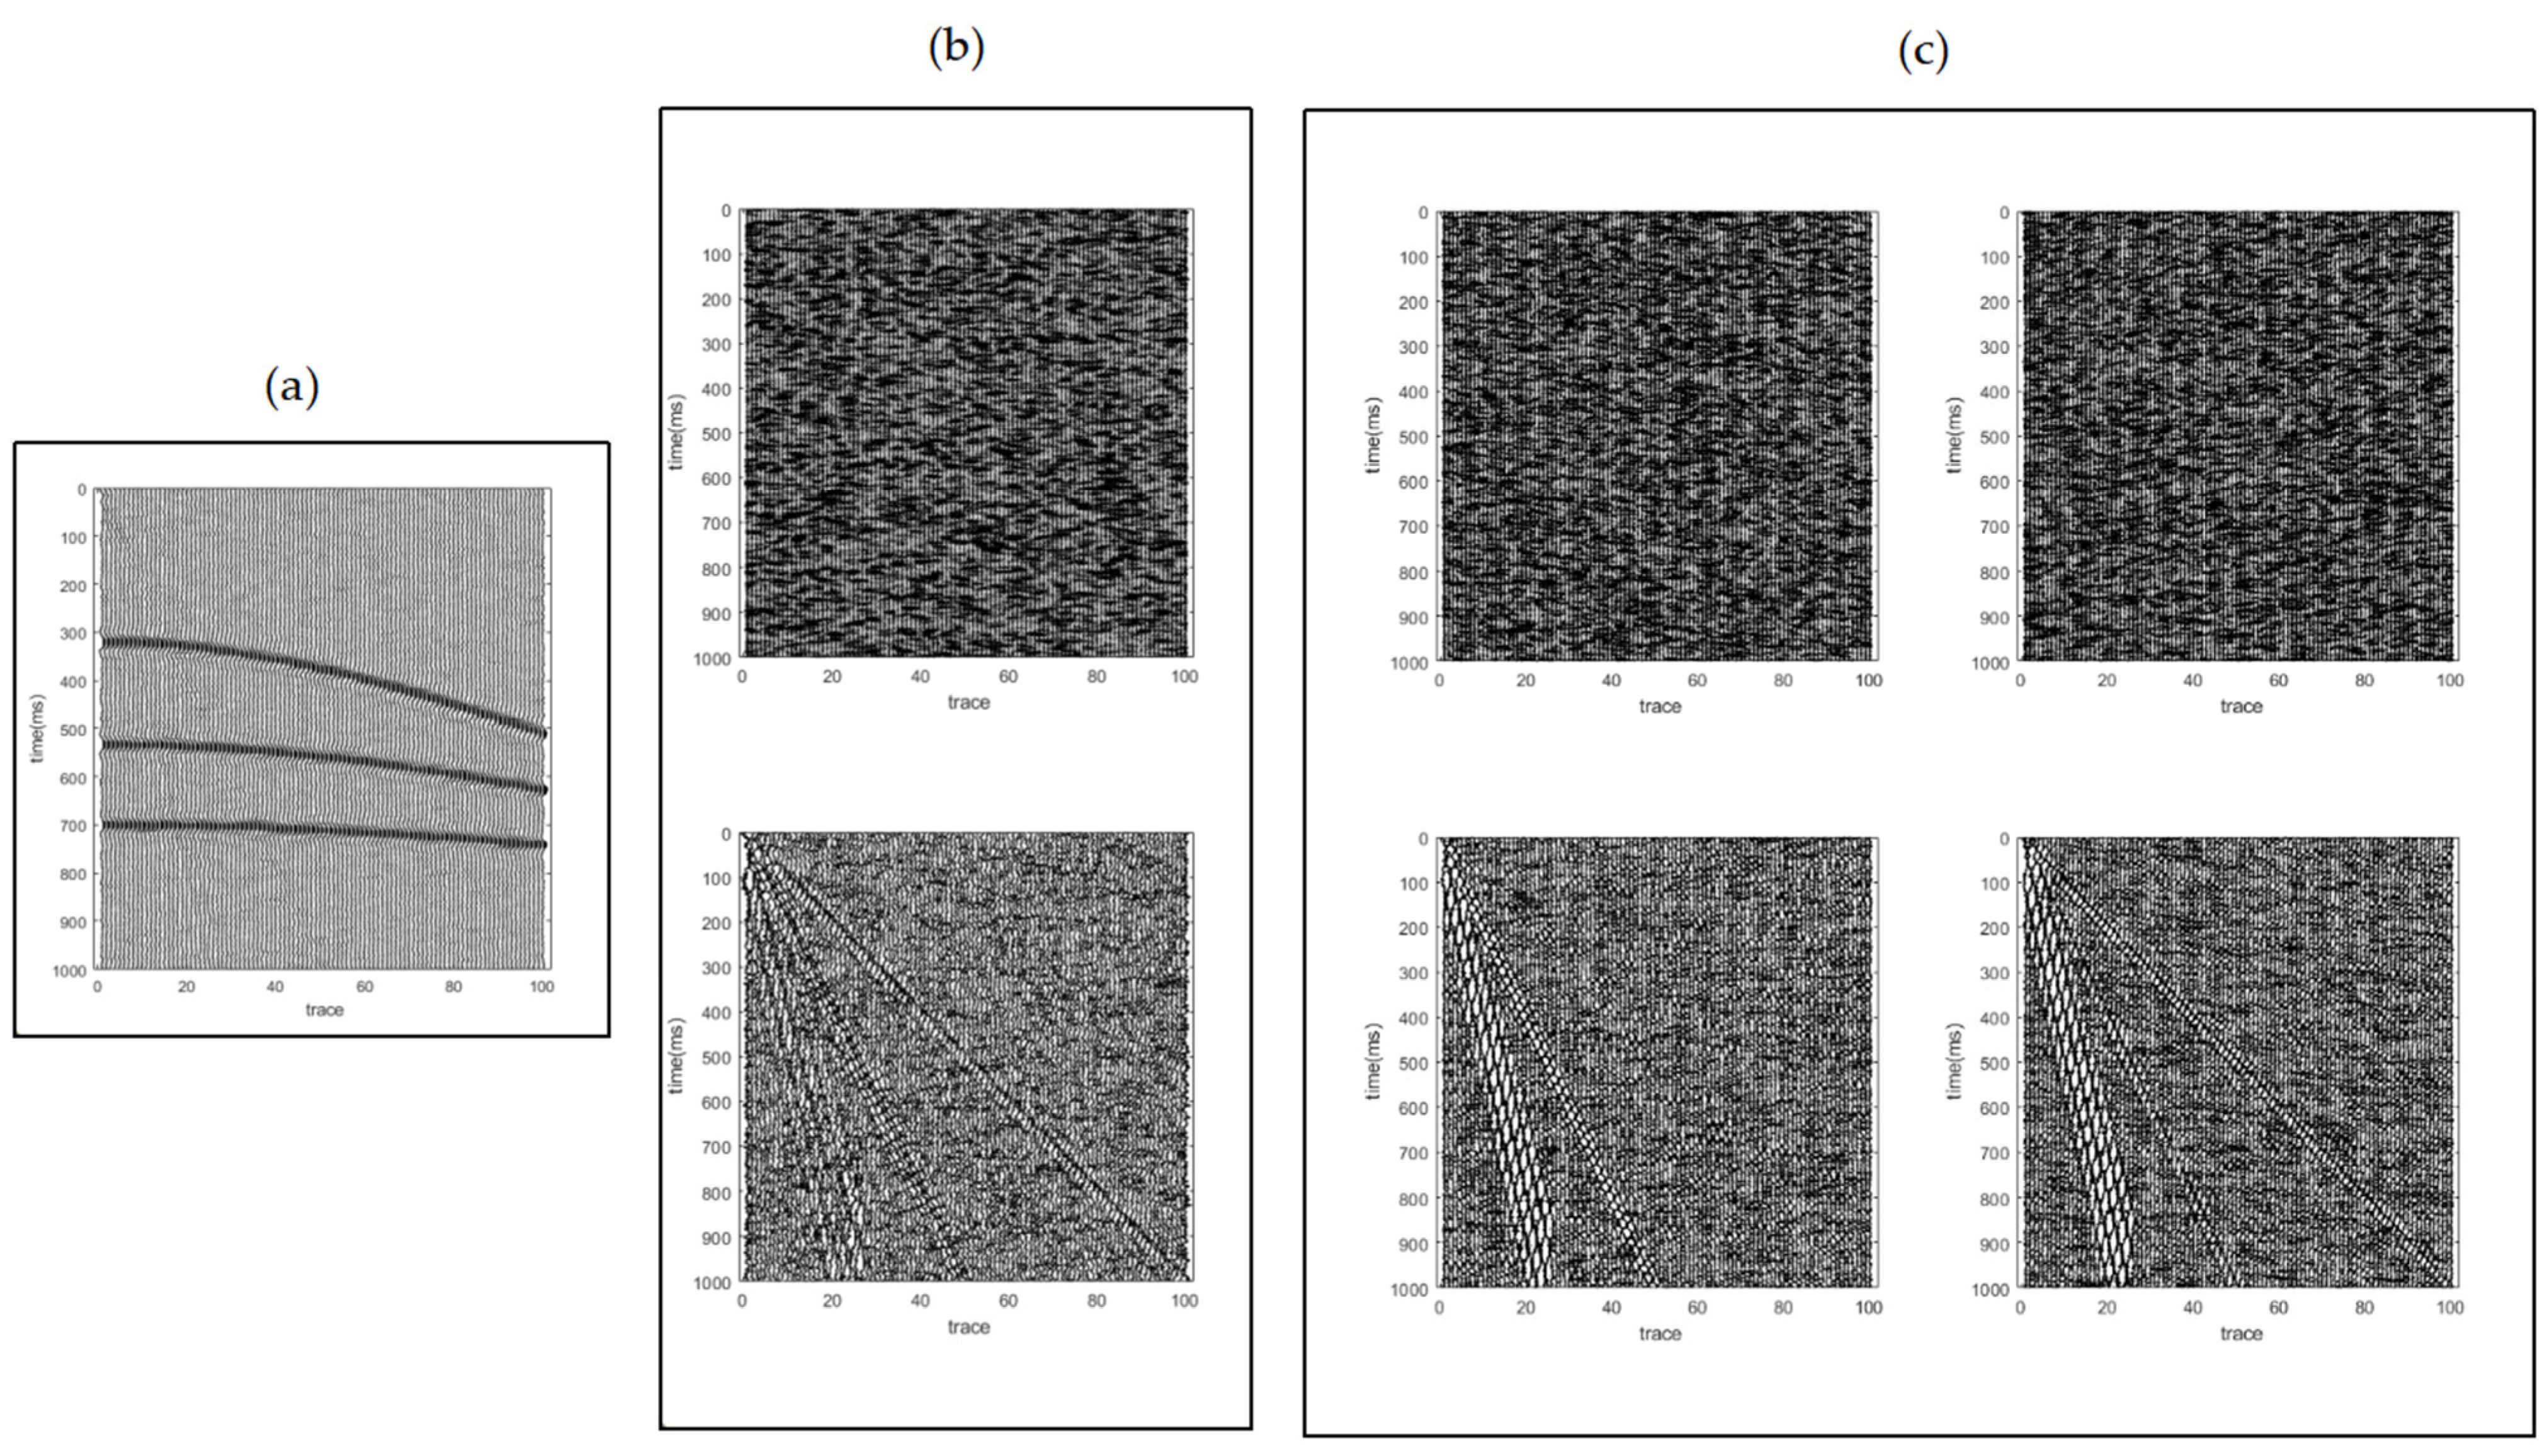
In order to verify the validity of the coherent noise removal method based on the NSST, the synthetic data example is tested in this article. The synthetic seismic data is shown in Figure 4a. The seismic data to be tested includes 100 channels, each channel contains 1000 sampling points, and the sampling interval is 1 ms.
As can be seen from Figure 4a, the effective signal with weak energy in the in-phase axis of the seismic record is covered by the coherent noise, which brings the interference to the subsequent processing of the seismic data. We apply the denoising method to the synthetic seismic data. Among the process, the decomposition scale of the NSST is 2, and the direction matrix is [12]. Figure 5 shows the coefficients after the decomposition of the NSST. There is an overlap of the frequency band between the effective signal and the noise. NSST can map the data into several sub-domains, which can represent the data sparsely, so that the noise and the signal can be separated better and the processing effect is better. Figure 4b shows the removed noise. Figure 4c is the result of the denoising method in this article. This method removes most of the coherent noise. This method can not only suppress the coherent noise but can also protect the effective signal to a great extent, restore the in-phase axis of the seismic record, enhance the continuity of the seismic record, and improve the SNR of the seismic record. The denoising results proves the feasibility of the denoising method in this article.
3.2. Field Data Example
The above section has verified the feasibility and validity of the proposed method using the synthetic data example. Now, we further verify the effectiveness and practicality of the proposed method from the field data example.
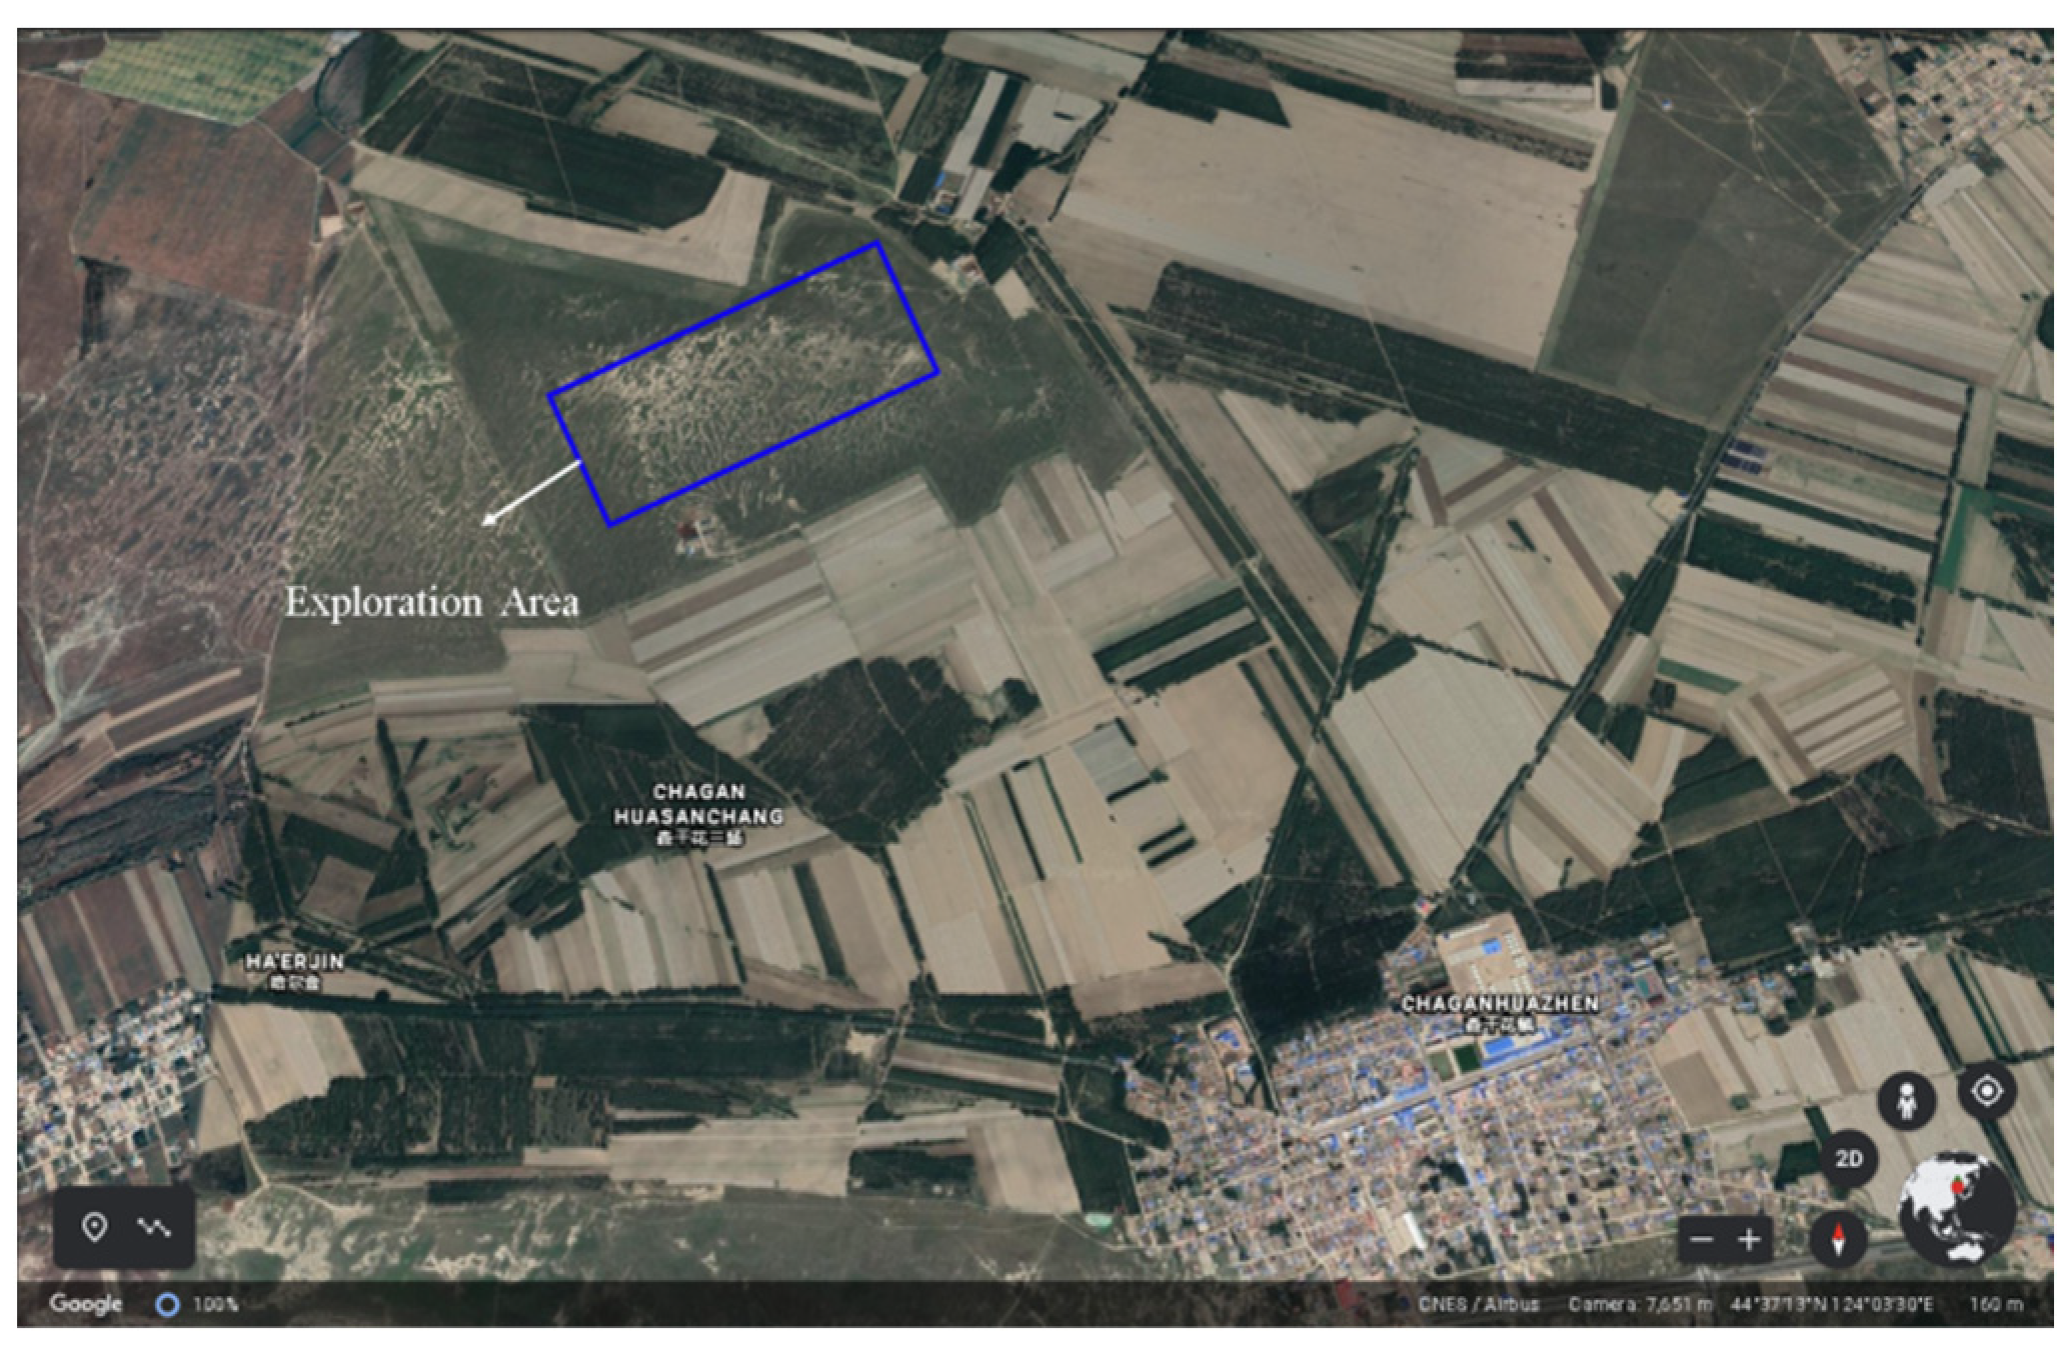
In this article, the field seismic data of source array in Chaganhua area is selected. The overview of the field exploration area is shown in Figure 6. The field exploration area is located in a grassland near Chaganhua Town, Qianguerroth Mongolian Autonomous County, Songyuan City, Jilin Province, China. The terrain of the exploration area is flat and the diving surface of the exploration area is relatively shallow. Table 1 shows the field seismic data parameters.
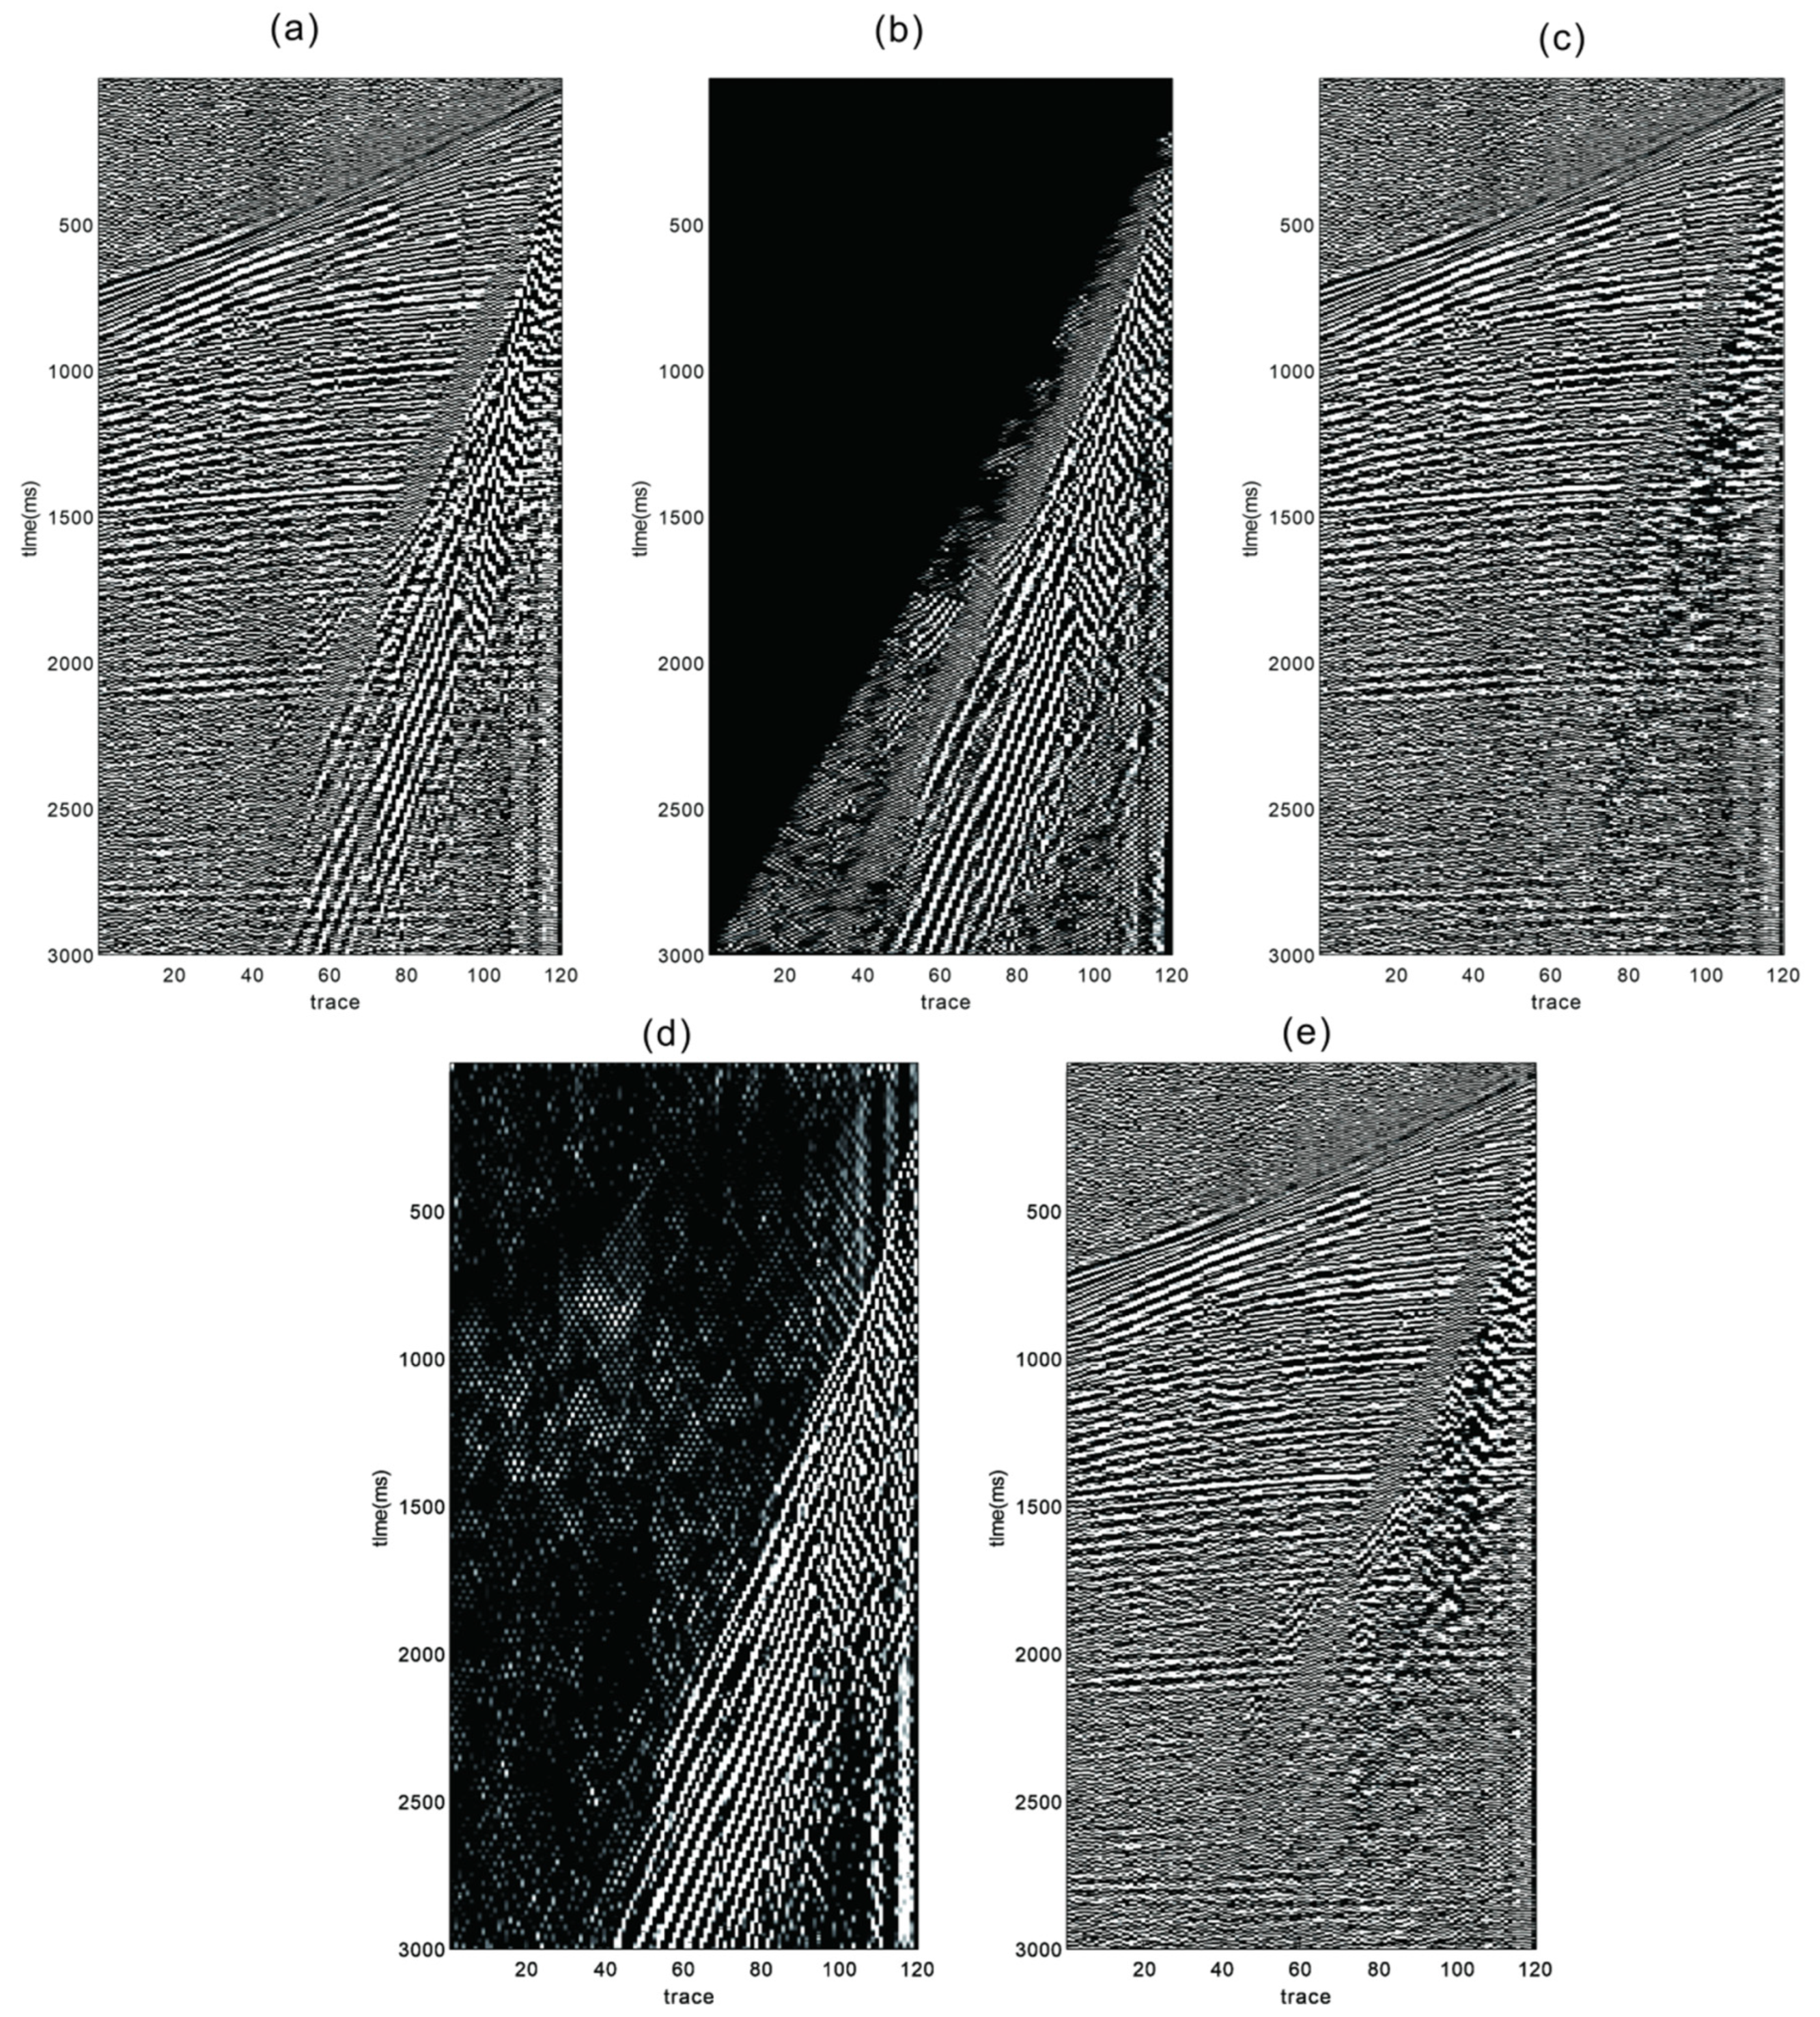
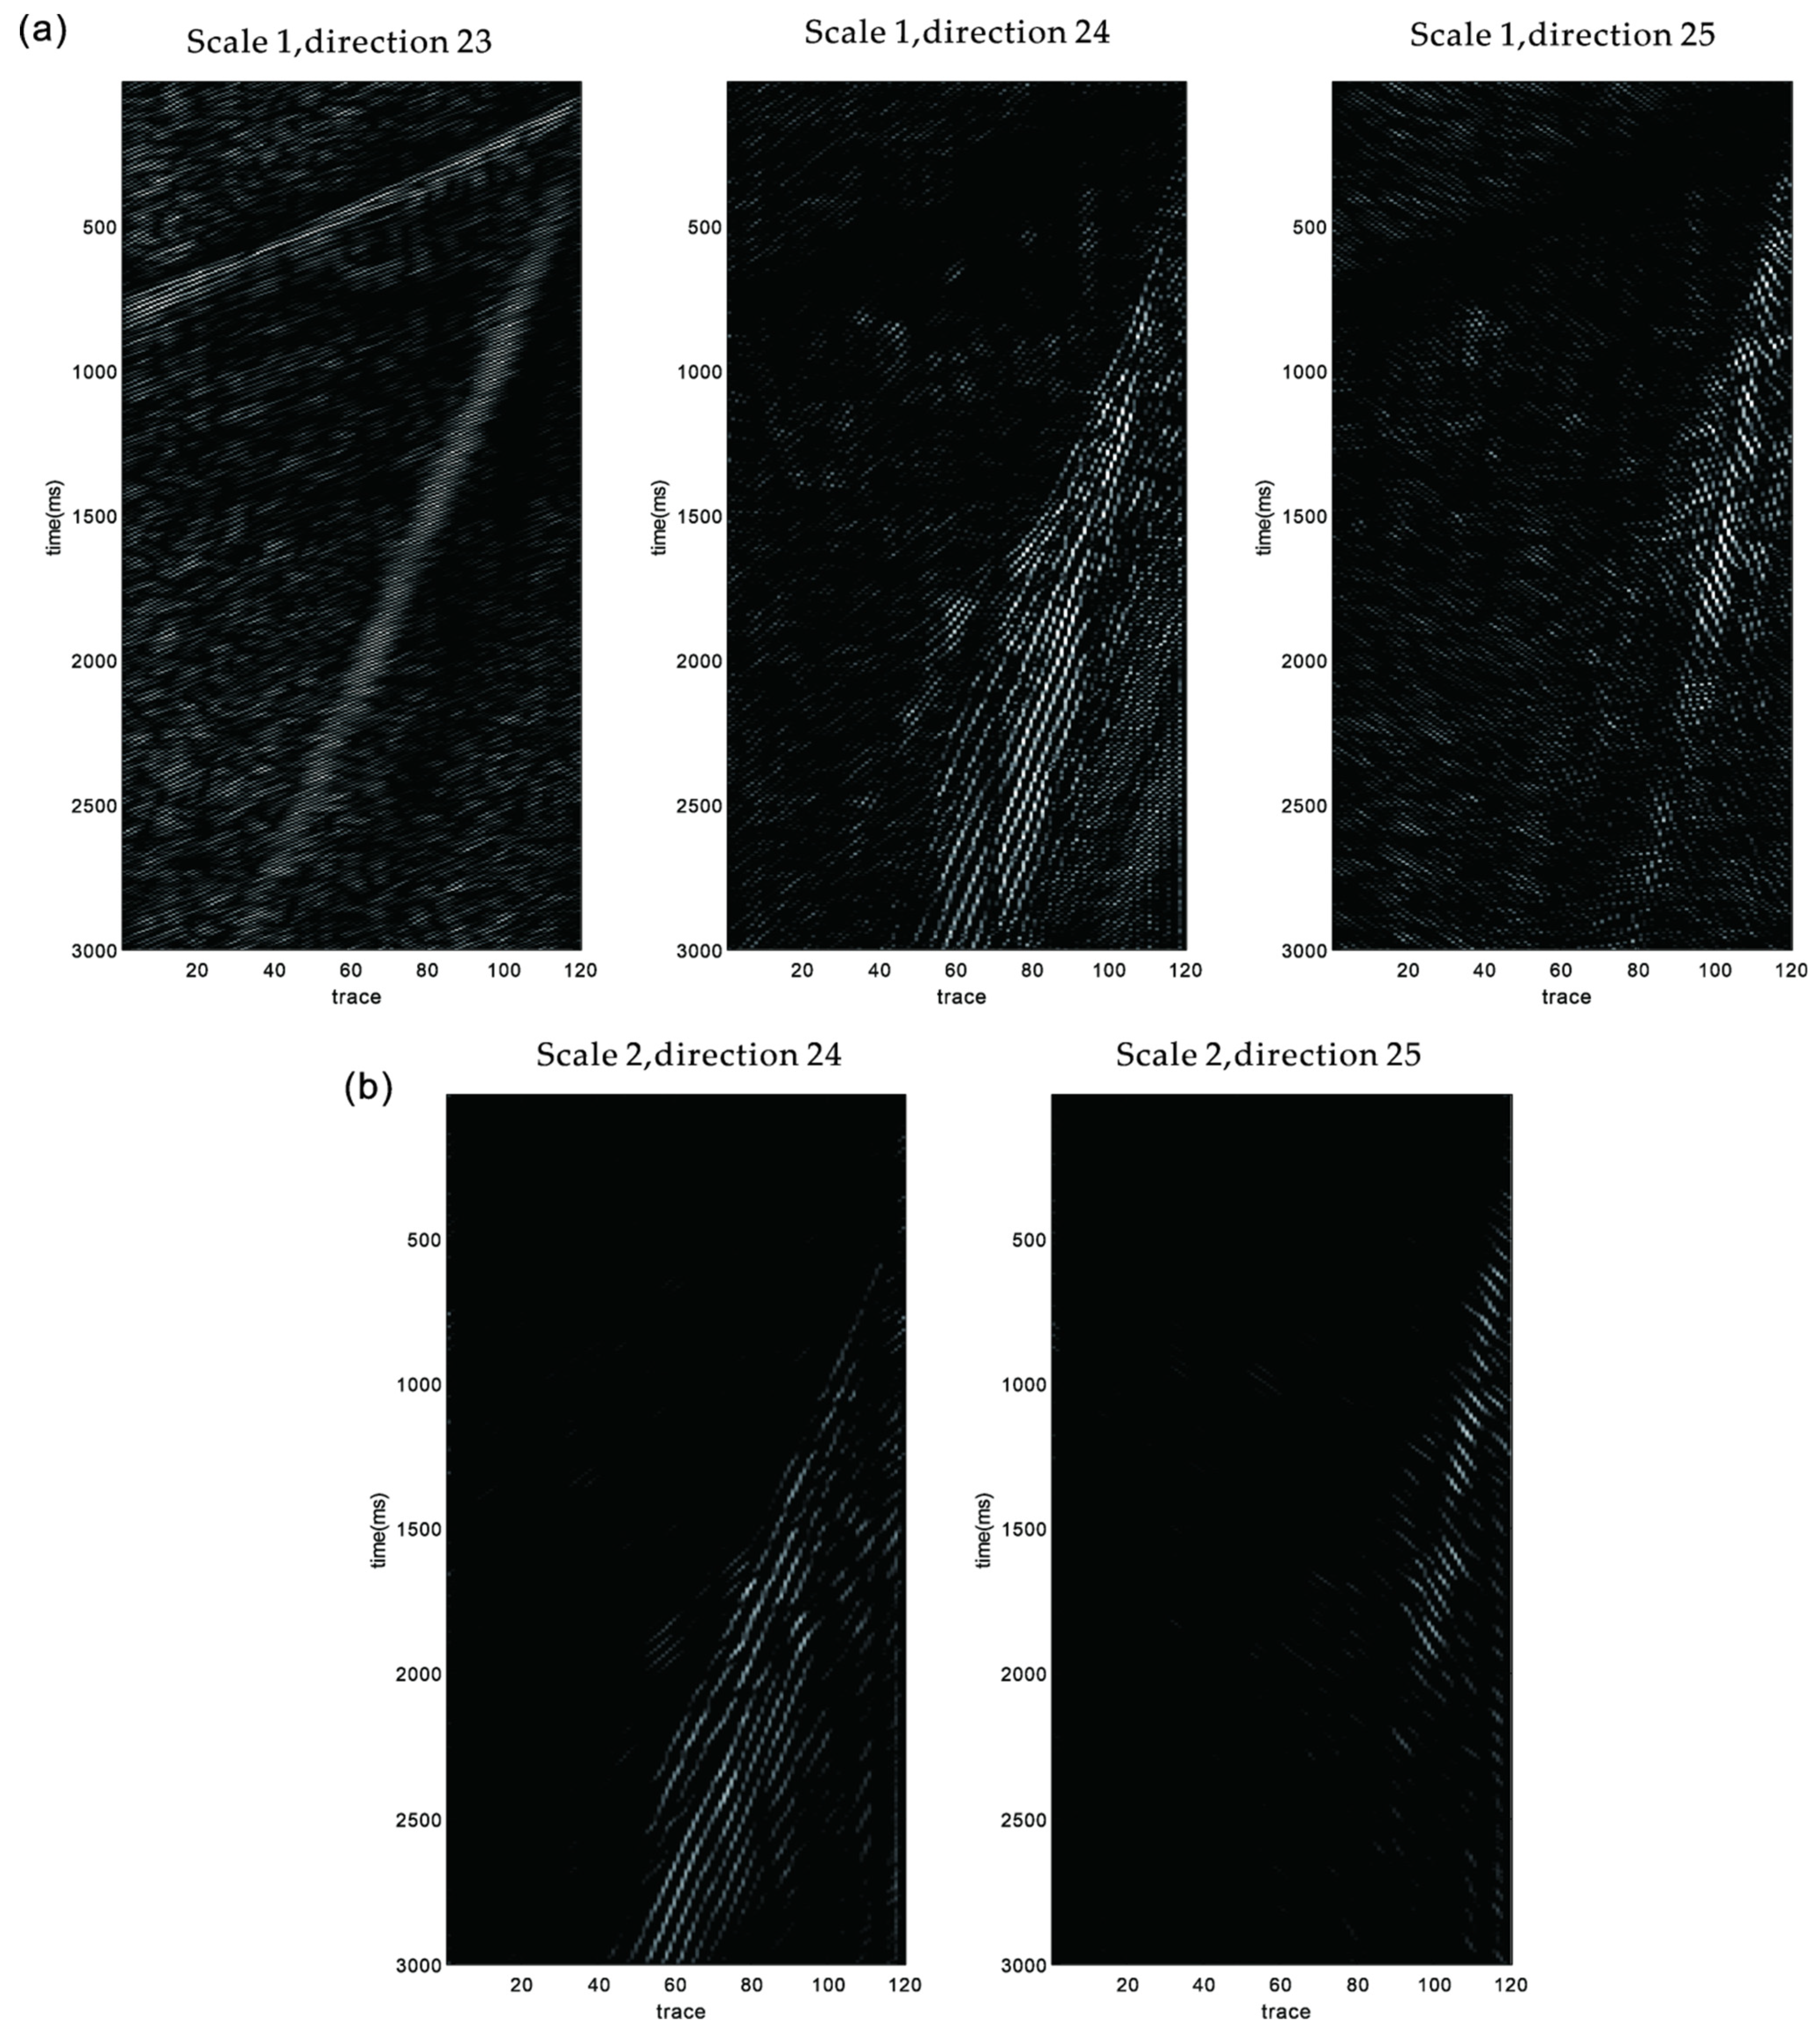
Figure 7a shows the field seismic gather. From Figure 7a, we can see that the seismic gather contains obvious coherent noise, including surface wave, acoustic wave, and direct wave. The coherent noise seriously affects the SNR of the seismic gather and bring certain difficulties to the subsequent seismic processing and interpretation. The SNR of the seismic gather in this work area is low, which is suitable for testing the effectiveness and adaptability of the proposed method in this article. We apply the method in this article to remove the coherent noise from this seismic data. Among the processes, the decomposition scale of the NSST is 3 and the direction matrix is [4 5 5]. Figure 8 shows the main NSST coefficients containing the coherent noise after the decomposition of the NSST. Figure 7b shows the removed noise. Figure 7c shows the seismic data after noise removal using the method in this article. From the denoising results in Figure 7, the coherent noise in Figure 7a is effectively removed by this method, and the effective information of the seismic data is greatly protected. The coherent noise removed in Figure 7b is obvious, including surface wave, acoustic wave, and direct wave. The SNR of the seismic data in Figure 7c is greatly improved, the effective reflection signal is well recovered, and the seismic lineups becomes very clear and continuous, which can provide the better basic data for the subsequent seismic processing and interpretation. In order to show the ability of the proposed method, we use the conventional coherent noise suppression method—FK filtering—to compare with this method. As shown in the Figure 7d,e, FK filtering can cause certain damage to the effective signal while suppressing the coherent noise and have certain noise residue. To sum up, the method proposed in this article has a good effect on the removal of the coherent noise in various kinds of the field seismic data.
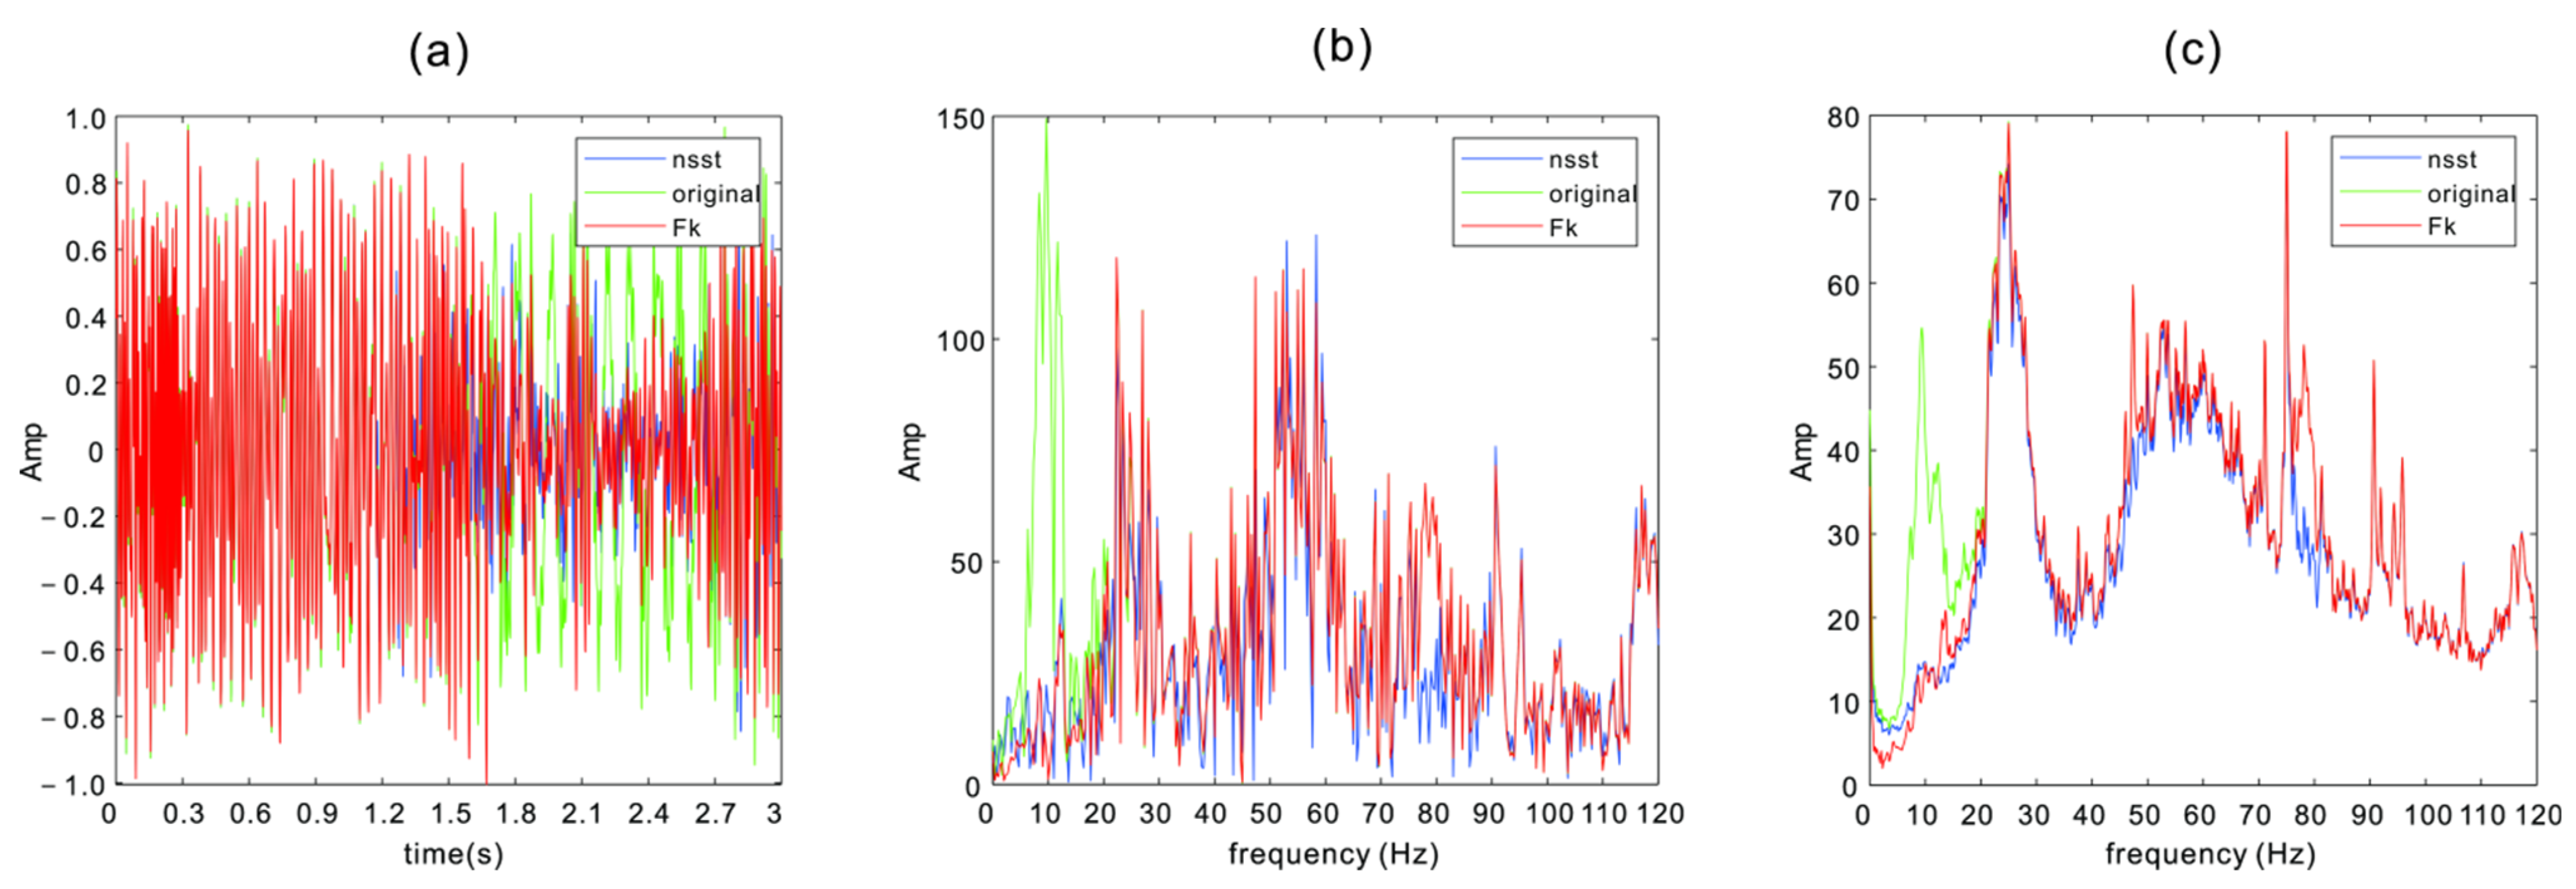
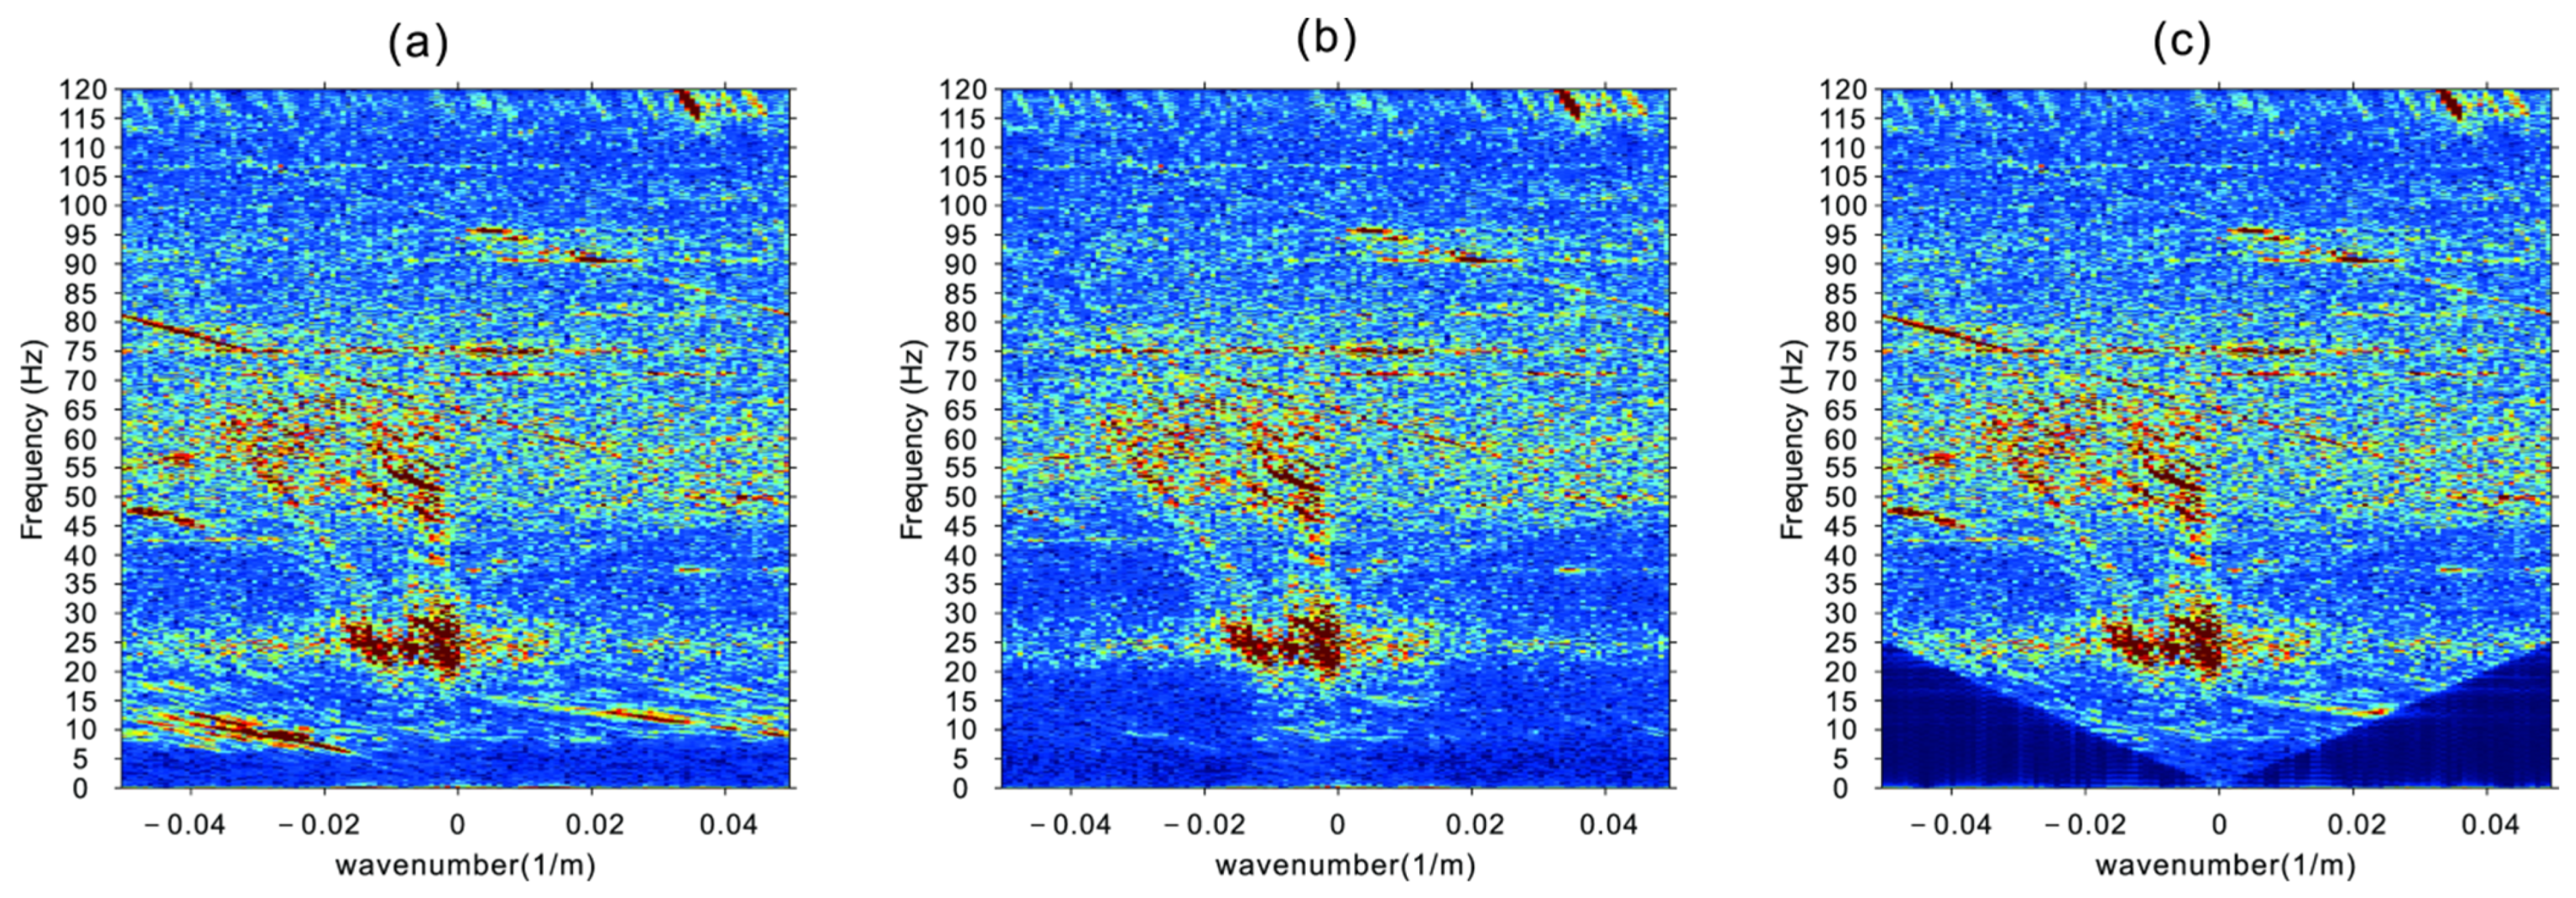
We analyzed the average amplitude spectrum, the single-channel amplitude spectrum, and the f-k spectrum of the original data and the denoised data after processing using this method. The frequency spectrum of the original data and the denoised data in Figure 9 and Figure 10 shows that the effective signal is distributed in the frequency range of 25–40 Hz and the coherent noise is mainly distributed in the frequency range of 5–20 Hz, and 70–85 Hz. The spectrum analysis in Figure 9 shows that the noise signal in the frequency range of coherent noise is well suppressed after the denoising by this method. The deviation of the signal waveform outside the coherent noise frequency range is very small compared with the original signal. The spectral analysis of the f-k spectrum in Figure 10 also shows that the coherent noise is significantly suppressed. The spectral analysis of Figure 9 and Figure 10 further illustrate that the proposed method in this article has good removal ability for coherent noise and can protect the effective signal well.
4. Discussion
As described in Section 3.1 and Section 3.2, we used synthetic data examples and field data examples to analyze the denoising performance of the proposed method in this article. We mainly used the difference in the distribution of noise and signal in the scale and direction through NSST, a multi-scale and multi-directional analysis method, to suppress the noise. The denoising results show that this method can effectively remove the coherent noise from the source array seismic data, especially surface wave, and it can greatly protect the effective information of the seismic data from being lost and greatly improve the SNR of the seismic data. The proposed NSST method is not only a method to suppress noise, but also a beneficial tool for signal analysis. The accurate data analysis, targeted strategy, and sparse representation make NSST have more desirable denoising results. There are some limitations to the proposed method: we need to artificially select the scale, direction, and threshold zone according to the seismic data, which is not adaptive enough, and then we will study further to simplify the process.
5. Conclusions
Coherent noise removal is very important for seismic data processing. The traditional coherent noise removal methods often cause some damage to the effective signal while suppressing coherent noise or cannot suppress the interference wave effectively at all. In this removal, based on the multi-scale and multi-direction properties of the NSST and its simple mathematical structure, a coherent noise removal method in NSST domain is proposed which can effectively remove the coherent noise while ensuring the effective signal is not damaged. The effectiveness and practicability of the proposed method on coherent noise attenuation of the source array seismic data are fully proven using synthetic examples and filed data examples. According to the processing results of the synthetic seismic data and the filed seismic data, the denoising method proposed in thixs article can effectively protect the effective signal, enhance the continuity of in-phase axis, and effectively improve the signal-to-noise ratio and resolution of seismic data while removing the coherent noise, which is of great significance to accurately identify the geological information contained in seismic data.
Author Contributions
Conceptualization, M.Y.; methodology, M.Y., X.G. and X.W.; software, M.Y.; validation, M.Y., X.G. and X.W.; formal analysis, M.Y.; investigation, M.Y.; resources, M.Y.; data curation, M.Y.; writing—original draft preparation, M.Y.; writing—review and editing, M.Y.; visualization, M.Y.; supervision, X.G.; project administration, X.G.; funding acquisition, X.G. All authors have read and agreed to the published version of the manuscript.
Funding
This research was supported by the National Natural Science Foundation of China (42074151).
Institutional Review Board Statement
Not applicable.
Informed Consent Statement
Not applicable.
Data Availability Statement
Not applicable.
Conflicts of Interest
The authors declare no conflict of interest.
References
- Mafakheri, J.; Kahoo, A.R.; Anvari, R.; Mohammadi, M.; Radad, M.; Monfared, M.S. Expand Dimensional of Seismic Data and Random Noise Attenuation Using Low-Rank Estimation. IEEE J. Sel. Top. Appl. Earth Obs. Remote Sens. 2022, 15, 2773–2781. [Google Scholar] [CrossRef]
- Anvari, R.; Kahoo, A.R.; Monfared, M.S.; Mohammadi, M.; Omer, R.M.D.; Mohammed, A.H. Random Noise Attenuation in Seismic Data Using Hankel Sparse Low-Rank Approximation. Comput. Geosci. 2021, 153, 104802. [Google Scholar] [CrossRef]
- Yaghmaei-Sabegh, S. Evaluation of Pulse Effect on Frequency Content of Ground Motions and Definition of a New Characteristic Period. Earthq. Struct. 2021, 20, 457–471. [Google Scholar]
- Linville, A.F.; Meek, R.A. A Procedure for Optimally Removing Localized Coherent Noise. Geophysics 1995, 60, 191–203. [Google Scholar] [CrossRef]
- Duncan, G.; Beresford, G. Slowness Adaptive f-k Filtering of Prestack Seismic Data. Geophysics 1994, 59, 140–147. [Google Scholar] [CrossRef]
- Liu, X. Ground Roll Supression Using the Karhunen-Loeve Transform. Geophysics 1999, 64, 564–566. [Google Scholar] [CrossRef]
- Montagne, R.; Vasconcelos, G.L. Optimized removal of Coherent Noise from Seismic Data Using the Karhunen-Loève Transform. Phys. Rev. E 2006, 74, 016213. [Google Scholar] [CrossRef] [PubMed] [Green Version]
- Turner, G. Aliasing in the Tau- p Transform and the Removal of Spatially Aliased Coherent Noise. Geophysics 1990, 55, 1496–1503. [Google Scholar] [CrossRef]
- Foster, D.J.; Mosher, C.C. removal of Multiple Reflections Using the Radon Transform. Geophysics 1992, 57, 386–395. [Google Scholar] [CrossRef]
- Henley, D.C. The Radial Trace Transform: An Effective Domain for Coherent Noise Attenuation and Wavefield Separation. In SEG Technical Program Expanded Abstracts 1999; Society of Exploration Geophysicists: Houston, TX, USA, 1999; pp. 1204–1207. [Google Scholar]
- Henley, D.C. Coherent Noise Attenuation in the Radial Trace Domain. Geophysics 2003, 68, 1408–1416. [Google Scholar] [CrossRef]
- Bekara, M.; van der Baan, M. Random and Coherent Noise Attenuation by Empirical Mode Decomposition. Geophysics 2009, 74, V89–V98. [Google Scholar] [CrossRef]
- Xiao, L.; Zhang, Z.; Gao, J. Ground Roll Attenuation of Multicomponent Seismic Data with the Noise-Assisted Multivariate Empirical Mode Decomposition (NA-MEMD) Method. Appl. Sci. 2022, 12, 2429. [Google Scholar] [CrossRef]
- Goudarzi, A.; Riahi, M.A. Seismic Coherent and Random Noise Attenuation Using the Undecimated Discrete Wavelet Transform Method with WDGA Technique. J. Geophys. Eng. 2012, 9, 619–631. [Google Scholar] [CrossRef]
- Sinha, S.; Routh, P.S.; Anno, P.D.; Castagna, J.P. Spectral Decomposition of Seismic Data with Continuous-Wavelet Transform. Geophysics 2005, 70, P19–P25. [Google Scholar] [CrossRef]
- Zhang, H.; Liu, T.; Zhang, Y. Denoising of Seismic Data via Multi-Scale Ridgelet Transform. Earthq Sci. 2009, 22, 493–498. [Google Scholar] [CrossRef] [Green Version]
- Bao, Q.-Z.; Gao, J.-H.; Chen, W.-C. Ridgelet Domain Method of Ground-Roll removal. Chin. J. Geophys. 2007, 50, 1041–1047. [Google Scholar] [CrossRef]
- Zhang, J.; Liang, X.; Fu, J.; Guo, J.; Zheng, X. Curvelet Transform and Its Application in Seismic Data Denoising. In Proceedings of the Beijing 2009 International Geophysical Conference and Exposition, Beijing, China, 24–27 April 2009; Society of Exploration Geophysicists: Beijing, China, 2009; p. 110. [Google Scholar]
- Neelamani, R.; Baumstein, A.I.; Gillard, D.G.; Hadidi, M.T.; Soroka, W.L. Coherent and Random Noise Attenuation Using the Curvelet Transform. Lead. Edge 2008, 27, 240–248. [Google Scholar] [CrossRef]
- Song, P.; Li, Y.; Ma, H.; Sun, H.; He, X. Attenuation of Random Noise for Seismic Data Based on Nonsubsampled Contourlet Transform. In Recent Advances in Computer Science and Information Engineering; Qian, Z., Cao, L., Su, W., Wang, T., Yang, H., Eds.; Lecture Notes in Electrical Engineering; Springer: Berlin/Heidelberg, Germany, 2012; Volume 128, pp. 103–108. ISBN 978-3-642-25791-9. [Google Scholar]
- Li, Y.; Yuan, C.; Zhong, Y.; Wang, Y. Non-Subsampled Contourlet Transform Based Seismic Signal De-Noising. In Proceedings of the 2009 WRI World Congress on Computer Science and Information Engineering, Washington, DC, USA, 31 March–2 April 2009; IEEE: Los Angeles, CA, USA, 2009; pp. 456–459. [Google Scholar]
- Liu, J.; Gu, Y.; Chou, Y.; Gu, J. Seismic Random Noise Reduction Using Adaptive Threshold Combined Scale and Directional Characteristics of Shearlet Transform. IEEE Geosci. Remote Sens. Lett. 2020, 17, 1637–1641. [Google Scholar] [CrossRef]
- Easley, G.; Guo, K.; Labate, D. Analysis of Singularities and Edge Detection Using the Shearlet Transform. In Proceedings of the SAMPTA’09, Marseille, France, 18–22 May 2009; Fesquet, L., Torrésani, B., Eds.; Special session on geometric multiscale analysis; HAL: Marseille, France, 2009. [Google Scholar]
- Guorong, G.; Luping, X.; Dongzhu, F. Multi-focus Image Fusion Based on Non-subsampled Shearlet Transform. IET Image Process. 2013, 7, 633–639. [Google Scholar] [CrossRef]
- Karami, A.; Heylen, R.; Scheunders, P. Denoising of Hyperspectral Images Using Shearlet Transform and Fully Constrained Least Squares Unmixing. In Proceedings of the 2016 8th Workshop on Hyperspectral Image and Signal Processing: Evolution in Remote Sensing (WHISPERS), Los Angeles, CA, USA, 21–24 August 2016; IEEE: Los Angeles, CA, USA, 2016; pp. 1–5. [Google Scholar]
- Priya, B.L.; Jayanthi, K. Edge Enhancement of Liver CT Images Using Non Subsampled Shearlet Transform Based Multislice Fusion. In Proceedings of the 2017 International Conference on Wireless Communications, Signal Processing and Networking (WiSPNET), Chennai, India, 22–24 March 2017; IEEE: Chennai, India, 2017; pp. 191–195. [Google Scholar]
- Qu, Z.; Xing, Y.; Song, Y. An Image Enhancement Method Based on Non-Subsampled Shearlet Transform and Directional Information Measurement. Information 2018, 9, 308. [Google Scholar] [CrossRef] [Green Version]
- Li, L.; Si, Y. Enhancement of Hyperspectral Remote Sensing Images Based on Improved Fuzzy Contrast in Nonsubsampled Shearlet Transform Domain. Multimed Tools Appl. 2019, 78, 18077–18094. [Google Scholar] [CrossRef]
- Ramakrishnan, V.; Pete, D.J. Non Subsampled Shearlet Transform Based Fusion of Multiple Exposure Images. SN Comput. Sci. 2020, 1, 326. [Google Scholar] [CrossRef]
- Shen, F.; Wang, Y.; Liu, C. Change Detection in SAR Images Based on Improved Non-Subsampled Shearlet Transform and Multi-Scale Feature Fusion CNN. IEEE J. Sel. Top. Appl. Earth Obs. Remote Sens. 2021, 14, 12174–12186. [Google Scholar] [CrossRef]
- Liang, X.; Li, Y.; Zhang, C. Noise removal for Microseismic Data by Non-subsampled Shearlet Transform Based on Singular Value Decomposition. Geophys. Prospect. 2018, 66, 894–903. [Google Scholar] [CrossRef]
- Sang, Y.; Guo, P.; Liu, S.; Song, Z.; Gao, D. Denoising of Petroleum Seismic Exploration Based on Non-Subsampled Shearlet Transform. In Proceedings of the International Geophysical Conference, Beijing, China, 24–27 April 2018; Society of Exploration Geophysicists and Chinese Petroleum Society: Beijing, China, 2018; pp. 468–471. [Google Scholar]
- Sang, Y.; Sun, J.; Meng, X.; Jin, H.; Peng, Y.; Zhang, X. Seismic Random Noise Attenuation Based on PCC Classification in Transform Domain. IEEE Access 2020, 8, 30368–30377. [Google Scholar] [CrossRef]
Figure 1.
Frequency domain subdivision and its support interval.

Figure 2.
The decomposition process of the NSST.

Figure 3.
The flowchart of seismic coherent noise removal method in the NSST domain.

Figure 4.
The processing results of the synthetic seismic data by the proposed method. (a) The original synthetic seismic data. (b) The removed noise. (c) The seismic data after the denoising.
Figure 4.
The processing results of the synthetic seismic data by the proposed method. (a) The original synthetic seismic data. (b) The removed noise. (c) The seismic data after the denoising.

Figure 5.
The NSST coefficients after the decomposition of the NSST. (a) The approximate NSST coefficients. (b) The detail NSST coefficients at scale 2, 2 directions. (c) The detail NSST coefficients at scale 1, 4 directions.
Figure 5.
The NSST coefficients after the decomposition of the NSST. (a) The approximate NSST coefficients. (b) The detail NSST coefficients at scale 2, 2 directions. (c) The detail NSST coefficients at scale 1, 4 directions.

Figure 6.
The overview of the field exploration area.

Figure 7.
The processing results of the field seismic data using the proposed method. (a) The field seismic data. (b) The removed noise by NSST. (c) The seismic data after the NSST. (d) The removed noise by FK filter. (e) The seismic data after the FK filter.
Figure 7.
The processing results of the field seismic data using the proposed method. (a) The field seismic data. (b) The removed noise by NSST. (c) The seismic data after the NSST. (d) The removed noise by FK filter. (e) The seismic data after the FK filter.

Figure 8.
The main NSST coefficients containing the coherent noise. (a) The detail NSST coefficients at scale 2, 2 directions. (b) The detail NSST coefficients at scale 1, 3 directions.
Figure 8.
The main NSST coefficients containing the coherent noise. (a) The detail NSST coefficients at scale 2, 2 directions. (b) The detail NSST coefficients at scale 1, 3 directions.

Figure 9.
Waveform and amplitude spectra of the seismic data. (a) The waveform of trace 80 of the original seismic data (the green curve), the denoised seismic data by the NSST (the blue curve), and the denoised seismic data by the FK filter (the red curve). (b) The amplitude spectra of trace 80 of the original seismic data (the green curve), the denoised seismic data by the NSST (the blue curve) and the denoised seismic data by the FK filter (the red curve). (c) The average amplitude spectra of the original seismic data (the green curve), the denoised seismic data by the NSST (the blue curve) and the denoised seismic data by the FK filter (the red curve).

Figure 10.
The results of applying f-k transform in the original seismic data and the denoised seismic data. (a) The original data. (b) The seismic data after the NSST. (c) The seismic data after the FK filter.
Figure 10.
The results of applying f-k transform in the original seismic data and the denoised seismic data. (a) The original data. (b) The seismic data after the NSST. (c) The seismic data after the FK filter.


Table 1.
Field seismic data parameters.
| The Source Excitation Mode | The Simultaneous Excitation of the Four Vibrators |
|---|---|
| the sweep frequency | 5–120 Hz |
| the scanning duration | 20 s |
| the receiving mode | one-sided 120 channels |
| the sampling interval | 1 ms |
| the trace interval | 10 m |
| the recording length | 5 s |
| the time window | 0–3 s |
Publisher’s Note: MDPI stays neutral with regard to jurisdictional claims in published maps and institutional affiliations. |
© 2022 by the authors. Licensee MDPI, Basel, Switzerland. This article is an open access article distributed under the terms and conditions of the Creative Commons Attribution (CC BY) license (https://creativecommons.org/licenses/by/4.0/).
Share and Cite
MDPI and ACS Style
Yu, M.; Gong, X.; Wan, X. Seismic Coherent Noise Removal of Source Array in the NSST Domain. Appl. Sci. 2022, 12, 10846. https://0-doi-org.brum.beds.ac.uk/10.3390/app122110846
AMA Style
Yu M, Gong X, Wan X. Seismic Coherent Noise Removal of Source Array in the NSST Domain. Applied Sciences. 2022; 12(21):10846. https://0-doi-org.brum.beds.ac.uk/10.3390/app122110846
Chicago/Turabian StyleYu, Minghao, Xiangbo Gong, and Xiaojie Wan. 2022. "Seismic Coherent Noise Removal of Source Array in the NSST Domain" Applied Sciences 12, no. 21: 10846. https://0-doi-org.brum.beds.ac.uk/10.3390/app122110846
Note that from the first issue of 2016, this journal uses article numbers instead of page numbers. See further details here.