Article

Maritime Traffic Evaluation Using Spatial-Temporal Density Analysis Based on Big AIS Data

1
Graduate School, Korea Maritime and Ocean University, Busan 49112, Korea
2
Human Activities, European Marine Observation and Data Network, 00198 Roma, Italy
3
Marine Spatial-Environmental Policy Research Section, Korea Institute of Ocean Science and Technology, Busan 49111, Korea
4
Division of Maritime AI & Cyber Security, Korea Maritime and Ocean University, Busan 49112, Korea
*
Author to whom correspondence should be addressed.
Submission received: 7 October 2022 / Revised: 26 October 2022 / Accepted: 3 November 2022 / Published: 6 November 2022
(This article belongs to the Special Issue Transportation Big Data and Its Applications)

Abstract

:
For developing national maritime traffic routes through the coastal waters of Korea, the customary maritime traffic flow must be accurately identified and quantitatively evaluated. In this study, the occupancy time of ships in cells was calculated through a density analysis based on automatic identification system data. The density map was statistically created by logarithmically transforming the density values and adopting standard deviation-based stretch visualization to increase the normality of the distribution. Many types of traffic routes such as open-sea, coastal, inland, and coastal access routes were successfully identified; moreover, the stretch color ramp ratio was reduced to identify routes having relatively high density. Adopting a single standard deviation and demonstrating the top 25% of color ramps, the analysis afforded the main routes through which customary traffic flows. This novel density analysis method and statistical visualization method is expected to be used for developing national maritime traffic routes and should ultimately contribute to maritime safety. Moreover, it provides a scientific means and simulator for determining the navigation area and analyzing conflicts with other activities in marine spatial planning.

1. Introduction

The importance of maritime traffic in the shipping industry continues to increase because shipping activities are wide-ranging and directly affect the security, safety, and environmental and socio-economic factors [1]. Moreover, maritime traffic is impacted by rapid technological developments and various marine environments such as increases in ship size, the emergence of autonomous ships, marine tourism, and offshore wind farms [2,3,4]. Such changes in the marine traffic environment and interactions among multiple stakeholders in the marine space threaten the safety of ship passage [5,6]. In this context, Korea is attempting to develop a national maritime traffic route to ensure the safety of navigation. A national maritime traffic route is a water area designated by the country as a route for ships [7] and is organically combined with maritime traffic facilities to ensure fast, safe, and convenient ship navigation [8]. For example, in Taiwan, the Changhua wind farm channel implements a two-way traffic scheme that separates the northbound and southbound traffic to preserve the existing customary traffic flow in offshore wind farms [9]. As another example, a main public shipping route was established along the complicated coast of Zhejiang, China, to ensure the safety of ships [10].
To improve the efficiency, sustainability, and environment friendliness of marine-resource use, multiple countries have adopted marine spatial planning (MSP) for maritime policy and decision making [11,12]. Based on the MSP concept, marine use zones in Korea are classified into nine types by purpose of use. The zone related to maritime traffic is defined as a port and navigation zones to ensure the maintenance of port functions and safe navigation of ships [13]. Most zones comprise port areas, fairways, traffic lanes, traffic separation schemes (TSS), anchorages, and specific sea areas for traffic safety (designated as legal areas under the Maritime Safety Act) [14]. However, the customary traffic flow of ships along the coast is not preserved [15] and traffic density is assigned a smaller weight than the other evaluation items for designating ports and navigation zones [16]. Moreover, the grid resolution is extremely low to properly capture the traffic density when establishing a marine spatial plan. Therefore, an effective methodology for traffic-density zone mapping is important for a quantitative MSP-based evaluation of actual maritime traffic in the coastal waters of Korea.
Maritime traffic analysts use automatic identification system (AIS) data, which are based on ship trajectory data, to understand the characteristics and distribution of maritime traffic and perform statistical and risk analysis [17,18,19]. It is a system for transmitting messages containing dynamic and static information from ships and for receiving messages from base stations and other ships [20,21,22]. Installation of AIS system is mandatory for all ships of 300 gross tonnages and upwards on international voyages, cargo ships of 500 gross tonnage and upwards not engaged on international voyages and passenger ships irrespective of size [23]. The AIS automatically informs ships of other ships’ positions and identifications [24], which not only helps with collision avoidance but also provides trajectory information reflecting the density of vessels at sea [25]. The traffic flows of ships are not random but collectively form patterns. Therefore, methods that evaluate the density of maritime traffic and quantitatively extract the hotspots have become an important part of maritime intelligence services [26].
In addition to the recent development of sensing technology and storage and processing technologies for big data, voluminous AIS data have been accumulating in real time. Therefore, various studies such as ship densities, motion patterns, traffic predictions, and routes extractions are being conducted using AIS data [27,28]. To begin, some studies have performed clustering algorithm based on AIS trajectories. Lee et al. grouped similar AIS trajectories using the Hausdorff distance and Douglas–Peaker algorithms and then identified traffic routes using the density-based spatial clustering of applications with noise (DBSCAN) algorithm [29]. Based on kernel density estimation (KDE) analysis, finally determined the width of the route and statistically evaluated the waypoints. Applying the Douglas–Peucker and DBSCAN algorithms, Rong et al. divided each ship route into a turning section and a route leg for characterizing ship behavior [30]. Wang et al. proposed a new ship-trajectory clustering method based on a Hausdorff distance algorithm and hierarchical DBSCAN (HDBSCAN) [31]. Chen et al. applied a DBSCAN algorithm to identify the hotspots of ship traffic as an indicator for maritime safety operators [32]. Several other studies have analyzed ship density by using AIS data and grid cells. To gain geographic visualization and insights into shipping movements, Willems et al. applied KDE to density analysis while accounting for ship velocities [33]. Wu et al. conceptualized shipping density as both vessel and traffic density calculating the number of ships per unit area per unit time and thereby developed a density map [34]. Yang et al. proposed a ship-size conversion and grid-based density model based on nonparametric KDE, which considers the effect of ship size on traffic safety [35]. Finally, there are study on the extraction of maritime traffic routes using AIS data. Lee et al. analyzed AIS data using KDE and extracted the traffic routes using an image processing technique [36]. As another study, Lee et al. extracted marine traffic routes in Korea coastal waters by dividing in 16 areas and selecting the top 50% of results of density analysis based on ship trajectories [37].
Most studies based on AIS data identify the traffic patterns and create routes using clustering algorithms, KDE, density analysis, and similar methods. However, the spatial extent of ports and other relevant areas is on the regional scale and the analytical data are collected over several days or months, insufficient for explaining the seasonal effect. Moreover, the visualization method cannot be quantified for map creation from the maritime traffic analysis result. Most of the ship density models in previous studies were based on the number of ships or AIS messages within each cell or adopted probabilistic analyses such as KDE. These analytical methods have specific limitations; for example, AIS-message intervals are irregular and the actual traffic conditions, such as the ship’s moving speed and sailing time, cannot be captured. As no global standard method exists for density analysis and evaluation in the maritime traffic field [38], one must study and develop various types of methodologies based on the historical AIS data.
This study proposes a new methodological concept of spatial-temporal density analysis using maritime traffic data to build Korea’s national maritime traffic route. The voyage time of the ships in each cell is calculated by combining the ship occupancy time (the temporal concept) with the trajectory (spatial concept). This combination of concepts solves the problems caused by the irregular reporting intervals of AIS messages; in particular, it requires no data interpolation or parameter selection. Furthermore, as this new method can reflect the ship speed, it can accurately calculate the density similar with actual traffic situations. Through appropriate visualization and extraction of the density analysis results, this new method enables the final selection of the primary traffic route to be defined as the navigation area for ships in MSP. This basic principle and methodology for building a national maritime transport route will possibly contribute to navigation safety and marine accident prevention. Among the possible contributions are optimal route determination, passage planning, and vessel traffic services.
The rest of this paper is organized as follows: Section 2 provides a general overview of the study, the data used, and the analysis area and methodology. The detailed analytical results are presented in Section 3. Section 4 compares the results with those of a previous study that extracts Korea’s maritime traffic routes through a density analysis. Section 5 concludes the study, describes the limitation of the study, and suggests primary directions for future research.

2. Materials and Methods

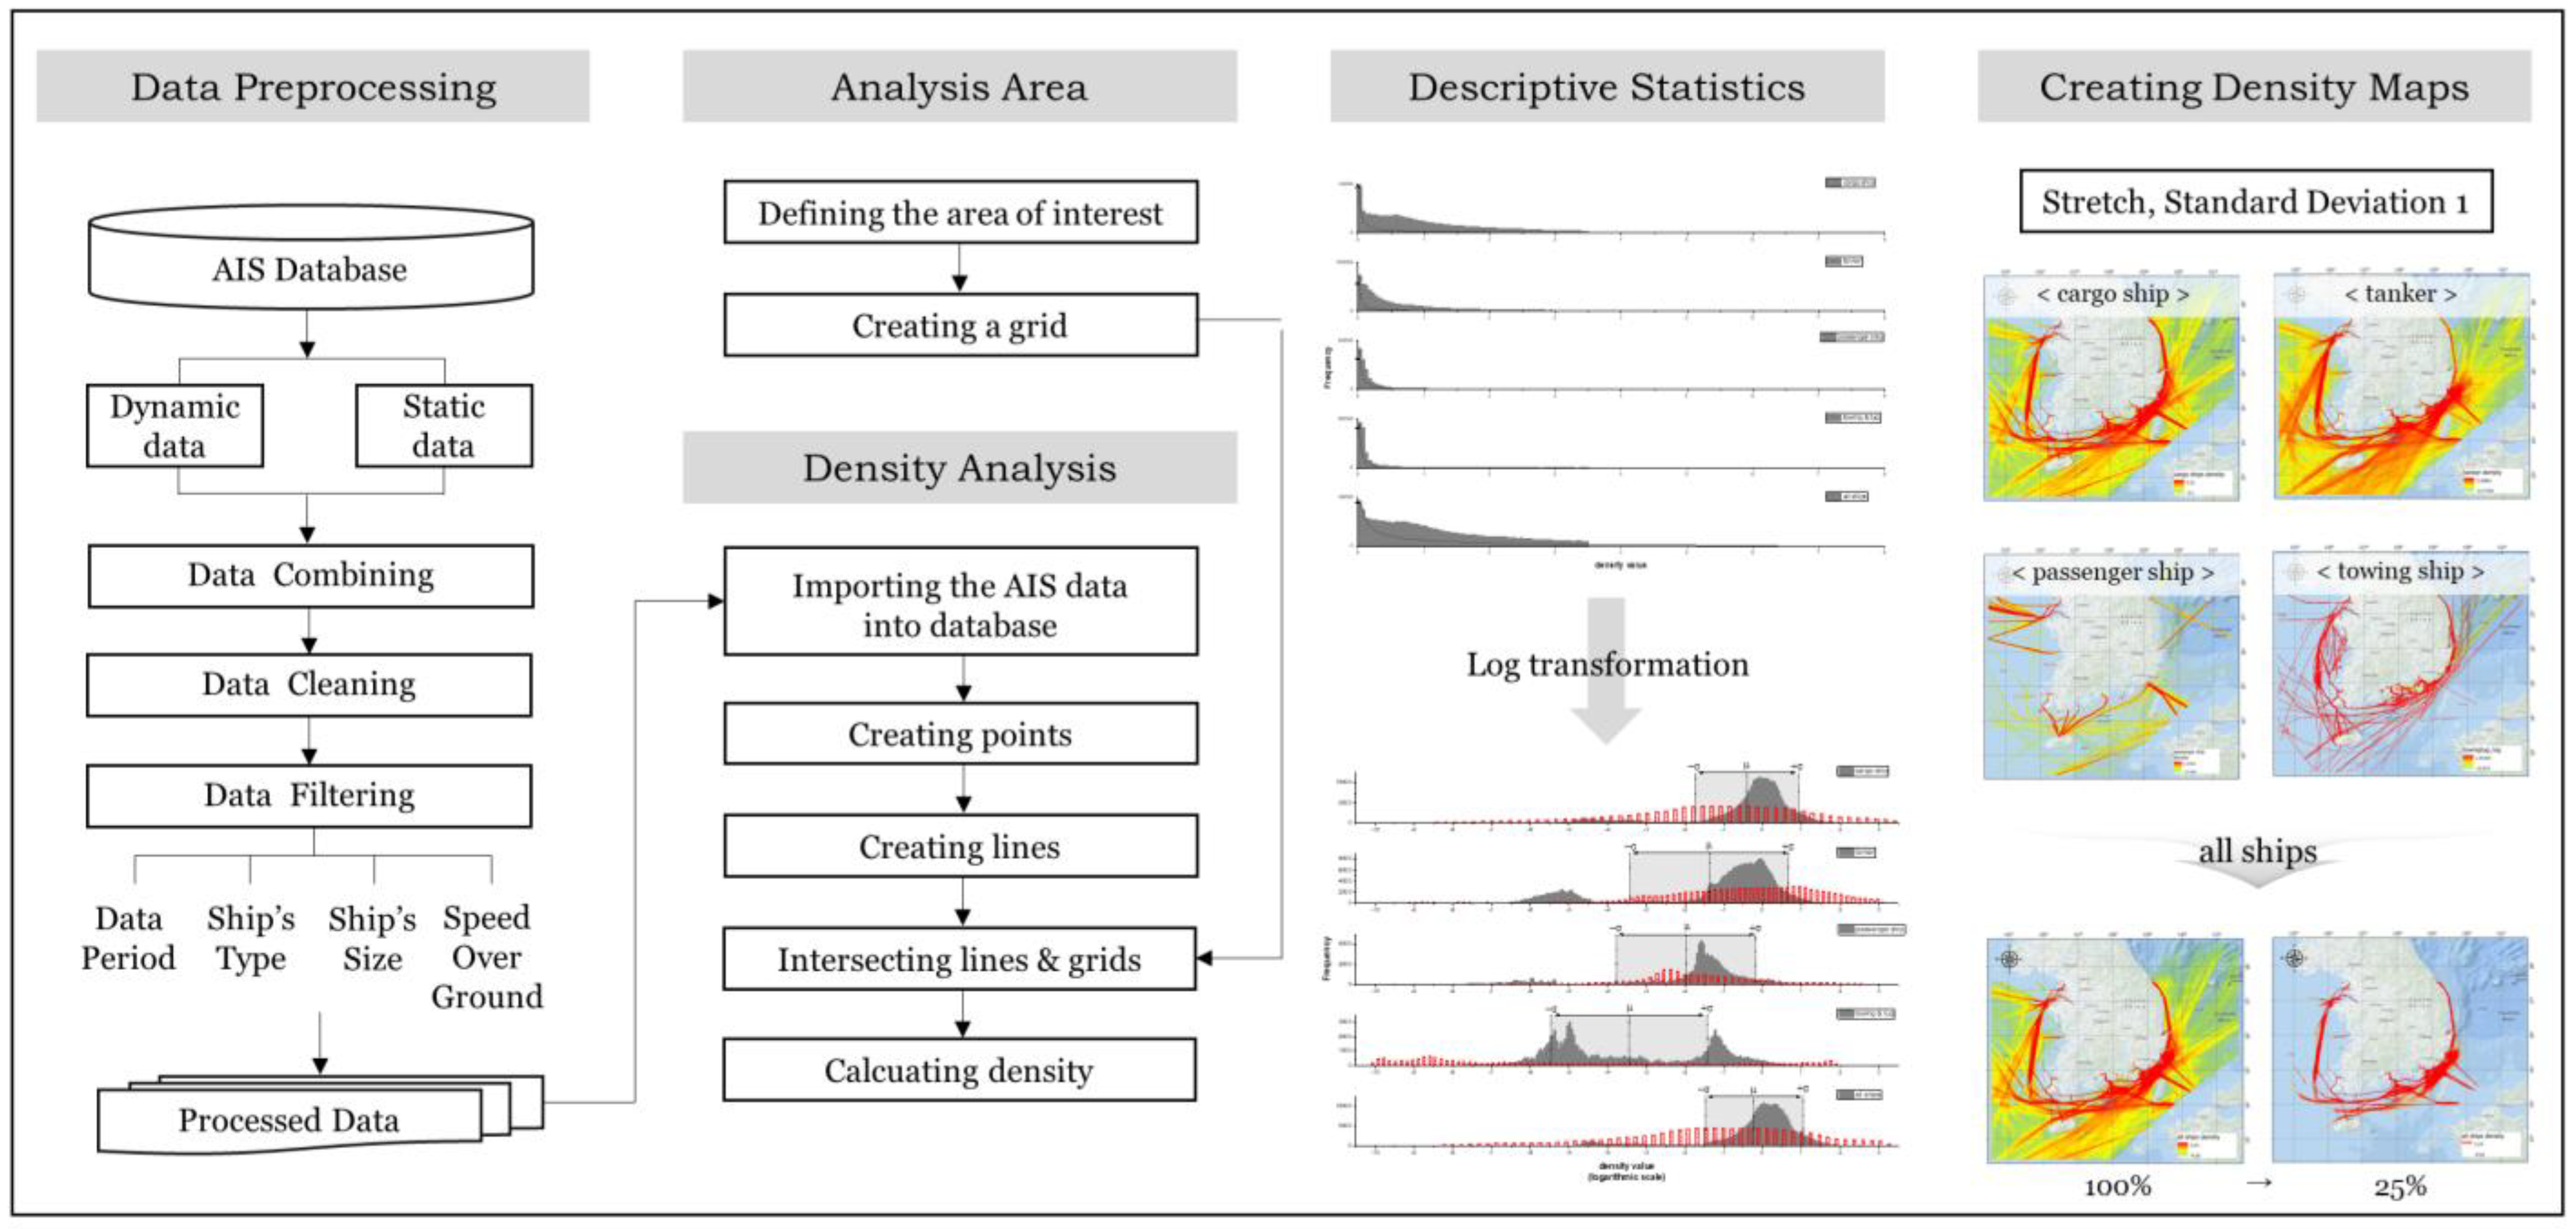
2.1. Overview of Study

In this study, the ship occupancy time in each cell was calculated by density analysis using AIS data and a density map was created from the results. Figure 1 shows a flowchart of the study process. First, a large volume of AIS data was preprocessed with Python, and the extracted data were divided into data period of season, ship type, length, and speed. Then, in the geographical information system (GIS), the spatial extent of the area of interest (AOI) was defined and the grid of a certain size was created. The densities were calculated using structured query language (SQL) by importing the preprocessed AIS data and grid cells into database. The density values were subjected to descriptive statistical analysis and the data were scaled via log transformation. Finally, a density map was created in GIS environment using a standard-deviation-based stretch symbolization method. After visualizing the traffic patterns for each type of ship, the high-density areas were quantitatively extracted by adjusting the color ramp ratio of the stretch with the density values of all ships.

2.2. AIS Data

This study performs a maritime traffic-density analysis on AIS data collected by the General Information Center on Maritime Safety and Security (GICOMS), which is operated by the Ministry of Oceans and Fisheries of the Republic of Korea. The data were collected through AIS base stations and satellites for monitoring the ships and preventing marine accidents [39]. AIS message information is divided into dynamic and static information. Dynamic information includes the locations (latitude, longitude), dates and times, speeds, and courses of ships, while the static information includes the Maritime Mobile Service Identity (MMSI) number, ship type, International Maritime Organization (IMO) number, ship length, and ship width [21].
The AIS data in the present analysis cover the entirety of Korea’s coastal waters and their temporal range is several months (covering various seasons). The ship types in AIS data are classified into 90 identifier numbers [40]; excluding the identifier numbers reserved for future use, 20 types of ships with different use characteristics can be identified. This study targets four types of ships with constant and customary traffic patterns: cargo ships, tankers, passenger ships, and towing ships. As these four types of ships carry cargoes or people, they establish a regular and clear traffic pattern based on the major trade ports. Such traffic patterns have large-scale consequences in the event of a marine accident. For example, when the oil tanker MV Hebei Spirit collided with a barge carrying a crane that was towed by a tugboat, a large amount of crude oil spilled off the west coast of Korea, causing serious marine pollution [41]. To identify the main traffic patterns of the ships, the density calculations were based on occupancy times alone, ignoring the data of ship berthing, unberthing, mooring, and anchoring. The dynamic information of reporting intervals of Class A ships is specified in the ITU technical standards (see Table 1). Note that the reporting intervals of anchored or moored ships depend on speed (≥3 knots (kts) or <3 kts) [40]. This study excludes the trajectory data of ships moving at 3 kts or less. Because the navigation patterns of small ships are irregular and widely distributed, the trajectories of ships <60 m length are excluded.
Table 2 compares the characteristics of our data with those used by Lee et al. [37] who previously analyzed maritime traffic in Korea. Both studies used the seasonal data in March, June, September, and December of 2018. Lee et al. used one week of data in each of the four seasons, whereas this study uses one month of data in each of the four seasons. Both studies considered the same types and lengths of ships, but this study imposes additional conditions on ship speed as noted above.

2.3. Analysis Area and Grid Division

The coastal waters of the Republic of Korea, located in East Asia, were selected for analysis. Note that >90% of Korea’s import and export cargo is transported by ships and the geographical characteristics of Korea have prompted the development of Korea’s shipping industry [42]. Therefore, many ships pass via the coastal waters of the Republic of Korea and handle large volumes of cargo, primarily in the ports of Busan and Incheon. The complete area (including the territorial waters) and the exclusive economic zone (EEZ) as a partial area were selected for analysis. Figure 2 shows the approximate geographical location of the analysis area. The internal boundary is the territorial sea (the sea area adjacent to the territory), which comprises the coastal sea, the inland sea, bays, and straits. It extends to a width of 12 nautical miles from the baseline. The territorial sea includes multiple islands and dangerous zones such as low-depth areas requiring special attention for ship passage. The external boundary is the EEZ, a sea area up to 200 nautical miles from the baseline, where marine scientific research or installation and use of facilities is permitted.
A density analysis requires a grid of certain-sized cells within the analysis area [34]. Both Marine Cadastre and the Northeast Ocean Data portal, an integrated maritime information system in the United States, supply information related to maritime traffic (particularly vessel transit counts) in 100-m cells [43]. European marine observation and data network (EMODnet), supported by the EU’s integrated maritime policy, adopts 1-km cells to cover all EU waters and certain adjacent areas [44]. In this study, the cell size was selected as 1 km considering the speed and capacity problems caused by processing and calculating big data. To prevent unnecessary computation and excessive data size in the cells of the analysis area, the portions overlapping land were removed. The final set of cells was only composed of sea area. The resulting grid contained 323,691 cells, including the harbour along the coastlines.

2.4. Density Model

2.4.1. Definition of Ship Density

Although there is no standard definition of density and no standardized methodology for analyzing maritime traffic fields, density is generally defined as the number of ships per unit area [45]. However, since all maritime traffic-density analyses are based on historical AIS data, various analysis can be performed depending on the data types (e.g., points or lines) and analysis methods, all with potentially different results. One method calculates the density from raw AIS point data; another method calculates the line density based on line data that connect points belonging to the same MMSI over time; the other method counts the number of lines as the number of ships [37,38,44].
Point density calculates the density of point features in the neighborhood of each output cell. The neighborhood, which is the search radius, is defined around each cell center, and the number of points within the neighborhood are summed and divided by the area of the neighborhood.
The line density defines the density of linear features in the neighborhood of each output cell. The line density is expressed as length per unit area and is calculated by Equation (1). A circle representing the search radius is centered on each output cell and the length of each line in the circle is multiplied by its weight value. The density of each cell is obtained by adding these individual products and dividing the result by the circle’s area:
L i n e   D e n s i t y = L n × V n + L n + 1 × V n + 1   A r e a   o f   U n i t .
where L n represents the length of the portion of each line within the circle and V n represents the corresponding weight, which may be a ship attribute value.
Another analysis method can yield the probability density function of ship density to visualize the maritime traffic [35]. The KDE method estimates the data distribution non-parametrically rather than assuming the parametric form of a data sample in advance. To determine the probability density function of ship density, KDE determines the appropriate kernel function and bandwidth by generating a kernel function based on the data value of each observation, adding all the generated kernel functions, and dividing by the total number of samples. The formula is then determined by.
f ^ x = 1 n h i = 1 n K x x i h .
where f ^ x is the estimate of f x , x is a random variable representing ship density,   x i is an observation, K is the kernel function, h is the bandwidth, and n is the number of samples.
The message reporting interval in AIS data varies from 2 to 10 s depending on ship speed and on whether a ship is changing course (Table 1) [40,46,47]. This variability limits the accuracy of density calculation methods based on the number of AIS data points. Because a ship’s trajectory is recorded at irregular intervals, slower ships record additional data points per unit track than fast ships, thus distorting the volume of passage [48]. This problem can be overcome by developing trajectory lines based on the AIS positional data and performing a density analysis of the number of transiting ships (i.e., the number of trajectory lines in a cell). Although this method is simple and intuitive, the analysis result of the same dataset widely varies with cell size, and a ship that only barely crosses a given cell is counted equal to a ship crossing the full length of the cell. These weaknesses reduce the accuracy of this method. A third alternative calculates the length of each trajectory line in the cell. This method overcomes the limitations of the previous method and is more quantitative, but the resulting values are non-intuitive and the given result cannot be interpreted as the concentration of transiting ships.
This study calculates the density of maritime traffic from the occupancy time, defined as the time in which a ship crosses a unit area (therefore, its units are time per area). This new analysis method adopts the updates of the EU vessel density map detailed method of EMODnet Human Activities [44]. As the summed occupancy times are calculated over a span of 1 month, the density can be defined as the occupancy time in hours per square kilometer per month. This analysis method can transcend the limitations of the temporal AIS data in which different ships are sampled at different intervals. Even when multiple ships sail the same track or the same distance, this new method is sensitive to ship speed and thus best reflects the real traffic environment.

2.4.2. Density Analysis Procedure

Figure 3 shows the flowchart of the spatial-temporal density analysis procedure. First, an area is defined and grid cells of a certain size are created. Next, the collected AIS data is pre-processed for density analysis. This step divides the large dataset to facilitate data processing. The dynamic and static data of each individual files are based on the same MMSI number. Next, the AIS data for analysis are extracted by filtering under multiple conditions such as data period, analysis area, ship type, and ship size. The preprocessed AIS data in csv format are then imported into a relational database that handles data importing, analysis, and lookup operations. The preprocessed AIS data are point data, including the ship-position information and various attributes of ship information.
A spatial analysis on a continuous 2D space requires a geometric scheme and a coordinate system. As the spatial coordinate system, this study adopts the EPSG:4326 spatial coordinate system of the European Petroleum Survey Group (EPSG) standard developed for mapping, surveying, and geodetic data storage. EPSG:4326 is based on the World Geodetic System 1984 (WGS84) and is used for global position system (GPS) data.
For each given MMSI, every two-consecutive ship position can be connected by a line. As each trajectory point contains a timestamp record, the occupancy time along a line can be determined by calculating the time (in h) difference between two consecutive points. Moreover, the length of each line (in km) can be obtained from the spatial coordinates. By intersecting the created lines with the cells and using the time and length properties along each line, one can determine the density of the occupancy time of a ship in a given cell over a given timespan.

2.4.3. Density Calculation

The density is calculated as follows. If the line developed between a pair of consecutive positions of a ship crosses two or more cells, the length of the line segment that crosses a cell can be calculated. To calculate the occupancy time of a ship in each cell, the length of the line segment is divided by the total line length and then multiplied by the total line time. The density in each individual cell is then determined by calculating the time value of each line segment and adding all time values associated with the cell:
D i = j = 1 n S j L j × T j
where D i is the ship density (h) in cell i , L j is the total length (km) of the line, S j is the partial length (km) of the line j intersecting the cell i , T j is the total time (h) along the line j and n is the number of lines associated with the cell. Therefore, the density is the time spent by each ship (in hours) in a given cell during the full timespan (e.g., one month).

3. Results

3.1. Basic Data Analysis

Table 3 shows the basic AIS data parameters used in the analysis. Based on these data, the numbers of positions and ships were largest for cargo ships, followed by tankers, then passenger ships, and finally towing ships. Among all positional data, the proportions of positions with speeds over 3 kts were 78.7% for cargo ships, 64.8% for tankers, 61.0% for passenger ships, and 33.0% for towing ships. The low value for towing ships can be explained by the main usages of towing ships (berthing and unberthing processes when entering and leaving ports), which are generally performed at low speed. Considering the total numbers of ships over the full timespan, cargo ships were more than three times as numerous as tanker ships. In the case of passenger ships, although the number of ships per season maintained a relatively constant order of magnitude, it decreased by half in winter (December). The increases and decreases in traffic volume of each type of ship demonstrated similar seasonal trends.

3.2. Creating Ship Trajectory Lines

Figure 4 shows the trajectory lines of the different ship types derived from the point data and used in the density analysis. All plots are presented on the same scale to include the analysis area of the coastal waters of Korea. On this scale, we can compare and understand the overall international and local routes of different ship types. The lines between each two consecutive points for the same MMSI were constructed based on chronologically sorted records. To prevent the creation of inaccurate or incorrect lines, lines of 30 km or longer and time intervals of 6 h or more between two consecutive points were excluded. This restriction avoided potential errors caused by the irregular reporting intervals of AIS data, in addition to potential errors created when ships stop sending messages during a voyage and resume communication after several days.

3.3. Density Calculation Results

Table 4 shows the descriptive density statistics of the four ship types and of all ships. As mentioned above, the temporal span of the analysis was one month. The density value in each cell is the total occupancy time (in hours) of the ships in that cell during one month. As four months of data were analyzed for each ship type, the density can be interpreted as the total occupancy time of the ships in a given cell over a four-month span. The results of this analysis method are easily interpreted because the density value has a temporal meaning. Moreover, the average instantaneous number of ships per square kilometer can be obtained by dividing the cell density value by the total timespan of the dataset (in this case, four months, equal to 2928 h). However, as this study targeted only trajectories with speeds of >3 kts, an instantaneous value can be defined as the average number of ships sailing at a certain speed rather than all ships in the actual environment.
Among the total number of cells constructed within the area of interest (323,691 cells), N cells were used for the density calculation of a given ship type. The grid number N was smallest for passenger ships, which are known to closely adhere to specified repeated routes. Towing ships, with the second-smallest N, typically sail close to the coast rather than on the open sea. The largest numbers of cells were occupied by cargo ships and tankers whose voyages vary widely. The average ship-occupancy times per cell during the four-month span, obtained as the means of the density calculation results, were 2.4 h for cargo ships, 1.1 h for tankers, 0.3 h for passenger ships, and 0.1 h for towing ships.

3.4. Creating Density Maps

3.4.1. Logarithmic Scale and Symbolization

The density calculation results show a broad statistical distribution with large skewness and kurtosis values. The analyzed datasets reduced the normality because they are asymmetric and heavily concentrated around the mean. In general, values that range by orders of magnitude are logarithmically scaled to close the gap between the large and small values while reducing the skewness and kurtosis. The logarithmically scaled dataset with increased normality is suitable for a broad range of data analysis [49]. In this study, the density distribution was logarithmically scaled to improve the visibility of low values in particular. Figure 5 shows the histograms developed by applying a logarithmic scale to the density analysis results of each ship type and the set of all ships. After log-transformation, the data distribution closely approached the normal distribution.
To improve the visualization of the log-transformed density-analysis results, this study adopted a raster data symbolization method called stretch. When applied to a raster dataset histogram, stretch increases the visual contrast among the cells and enhances the image by spreading the pixel values along a histogram. The color of a stretched data point indicates the extent of the value along the color ramp [50]. This method is advantageous because it emphasizes the variation among the most common values without overemphasizing the lowest or highest values. That is, it adapts to the specified range of values by focusing on the common input values while ignoring outliers and tails of the distribution. Stretch types include minimum maximum, percent clip, and standard deviation. In general, most of the values can be assumed to fall within the upper and lower limits, and therefore trimming off the extreme values is statistically reasonable [50].
In this study, standard deviation was adopted as the stretch type and linear stretching was applied between the limit values defined by the standard deviation. In normally distributed data, these limits cover ~68.2% of the data at ±1 standard deviation, ~95.4% at ±2 standard deviations, and ~99.5% at ±3 standard deviations from the mean [51]. Here, the number of standard deviations in the stretch method was set to one for identifying the customary maritime traffic patterns that are relatively unaffected by extremely high-traffic ports or low-traffic sea areas. As shown in Figure 5, stretching redistributed the range corresponding to one standard deviation on both sides of the mean in the original histogram of density values. The redistribution was achieved by linearly extending the selected range over the entire observed range.

3.4.2. Density Maps by Ship Type

Figure 6 shows the visualization results of the density calculations for each ship type. The traffic density of cargo ships was high along the coast from Incheon to Donghae, and the routes of ships entering and departing from major domestic ports were clearly evident. In addition to coastal routes such as harbor approach routes and coastal access routes, open-sea routes with low density values were clarified. However, tankers were reported at high density in Ulsan, which handles voluminous liquid cargo. Other tanker routes, namely, to Incheon, Pyeongtaek, Daesan, Gunsan, and Yeosu, demonstrated high densities too. The tanker density on the route around the coast was similar to that of cargo ships along the west and south coasts but lower than that of cargo ships along the east coast. Passenger ships were divided into domestic and international routes. The domestic passenger ships traveled from Jeju to Mokpo, Wando, and Geomundo, along simple routes between Pohang and Ulleungdo, and along major routes between islands. The international passenger ships traveled between Japan and Busan and between China and Incheon, Pyeongtaek, and Gunsan. Towing ships demonstrated a more irregular traffic pattern than the other three ship types, with complex and variable routes. They included a route from the coast to the open sea (probably taken by rather large towing ships) and a route within the waterway (probably taken by small tug boats supporting port entry and exit).
Figure 7a shows the result of merging the density analysis results across all ship types. By adding the four-month density analysis values of the cargo ships, tankers, passenger ships, and towing ships, we can determine the customary maritime traffic flows of major ships through the coastal waters of Korea. Open-sea routes were identified as routes in the ocean and the near-seas connecting coastal routes, whereas inland routes were identified between islands and through relatively narrow waterways. Routes designated for entering and exiting ports, which can be potentially utilized under the current Maritime Safety Act, were identified, in addition to coastal access routes connecting coastal and inland sea routes with port entry and exit routes.
The high-density routes were those that remained after sequentially reducing the total percentage of the stretch color ramp from 100% to the top 75%, 50%, and 25%. The route with the highest density, which circulates along the coast, was apparent even when only the top 25% of the stretch ramp was shown. After reducing the percentage of the stretch color ramp to 25% (Figure 7d), most of the open-sea routes disappeared and only the inland routes, coastal access routes, and coastal routes remained. These analysis results provide a quantitative scientific method for extracting and designating a major maritime traffic route within the coastal waters of Korea because they allow an objective, accurate visualization of the main route.

4. Discussion

The results of the present study differed to some extent from those of Lee et al. [37] who extracted the maritime traffic routes in Korea based on a density analysis [37]. Three key features of Lee et al.’s study are important. First, they divided the coastal waters of Korea into 16 areas for the density analysis. Second, the density calculation was based on the lengths of the ship trajectory lines, with a search radius of 500 m and an individual cell size of 100 m × 100 m. Third, the density values were divided into equal-size sets using a quantile classification method. The top 50% of the total maritime traffic data were extracted as maritime traffic routes, which were then divided into three categories: main route, outer branch route, and inner branch route.
The contribution of Lee et al. [37] is highly valued as the first attempt to develop a national maritime traffic route for safe navigation of ships through Korean coastal waters. However, the analysis method and extraction process have certain limitations. First, the area division was based on the volume of maritime traffic and the geographic distribution of major ports. Although the traffic volume differed across sea areas, the same threshold of maritime traffic volume was applied to the route extraction in each area, which degraded the consistency and reliability of the relative analysis results. The line density method allows a quantitative analysis because it calculates the length of the ship trajectory lines; however, the analysis result depends on the parameter settings. Furthermore, the quantile classification method used in the route extraction process can excellently explain maritime traffic ratios but is inapplicable to ship density data, which have wide and skewed statistical distributions. For example, cells with density values of 10 and 1500 are displayed in the same color with no difference between them, indicating that extremely high densities are not distinguished from lower densities. Another limitation is that the traffic route is extracted and classified in a polygon-like form by the author rather than by an algorithm based on the 50% density value.
To overcome the limitations of the previous study, the method proposed in this study performs a density analysis over the entire coast of Korea with no spatial division. Moreover, the new method efficiently automates the processing of large amounts of data using an SQL database. By adopting a spatial-temporal approach, it overcomes the limitations of the AIS data characteristics that influence the existing density analysis methods. Furthermore, the stretching method adopted in the new study is advantageous for visualization. Stretching is a statistical method that reduces the influence of extreme values and extracts the values within a range of one single standard deviation from the mean. Table 5 comprehensively summarizes the differences between this study and Lee et al. [37], each of which analyzed the maritime traffic density in the coastal waters of Korea. The final density analysis results of the two studies are compared in Figure 8.

5. Conclusions

This study proposed a new method for density analysis of AIS data of the coastal waters in Korea. The data of cargo ships, tankers, passenger ships, and towing ships with customary traffic patterns were restricted to ship lengths of 60 m or more and ship speeds of 3 kts or more. To reflect the influence of the seasons, the data were collected over four-months, each month representing one of the four seasons. The analysis method calculated the occupancy time of each ship in each cell from the position and time information contained in the AIS data. The density distribution was determined by a descriptive statistical analysis and was normalized through a log-transformation of all density values. Finally, the calculated density was visualized using the stretch symbolization method to create a density map. The converted density values visualized using the stretch symbolization method can confirm the identification of major and distinct maritime traffic patterns. This approach differs from the density analysis methods widely used in existing maritime traffic research, and is valuable for confirming the maritime traffic pattern and density in the coastal area of Korea.
The proposed spatial-temporal density analysis and visualization method constitutes a key technology for building a national maritime transportation network. This method can extract traffic routes through a quantitative analysis of big data and further identifies traffic networks. In addition, the density analysis results can be actively utilized for route planning by onboard navigation officers and captains. Judging from the accumulated records where numerous ships have safely completed their voyages, many ships have sailed along particular trends, having considerable reliability to the analysis result.
A limitation of this study is that the density analysis ignores the influence of ship size on ship density. Suppose that a small ship and a large ship sail at the same speed and route through the same cell. The two ships occupy different areas and pose different degrees of risk to nearby passing ships. If the ship size is ignored, the calculated maritime traffic density may differ meaningfully from the actual traffic environment. Furthermore, the constructed traffic route might not secure the safety of large ships because it does not reflect the traffic pattern of large ships with relatively small ratios. In future study, a ship- scale conversion factor based on ship tonnage, length, and width will be constructed by analyzing the specifications of ships passing through the coast of Korea. This factor will be used as a density weight in a more quantitative and advanced density analysis.

Author Contributions

Conceptualization, Y.-J.K., J.-S.L. and I.-S.C.; methodology, Y.-J.K., A.P. and L.F.; software, Y.-J.K., A.P. and L.F.; validation, Y.-J.K., J.-S.L., K.-K.Y., M.-S.L. and I.-S.C.; formal analysis, Y.-J.K.; investigation, Y.-J.K.; resources, Y.-J.K., A.P. and L.F.; data curation, Y.-J.K.; writing—original draft preparation, Y.-J.K.; writing—review and editing, I.-S.C.; visualization, Y.-J.K.; supervision, I.-S.C.; project administration, M.-S.L. and I.-S.C.; funding acquisition, M.-S.L. All authors have read and agreed to the published version of the manuscript.

Funding

This research was supported by Korea Institute of Marine Science & Technology Promotion (KIMST), funded by the Ministry of Oceans and Fisheries (1525013332).

Institutional Review Board Statement

Not applicable.

Informed Consent Statement

Not applicable.

Data Availability Statement

This research was conducted with data provided by the Ministry of Oceans and Fisheries (MOF, Korea) for Ship Traffic Route research in 2021.

Conflicts of Interest

The authors declare no conflict of interest.

References

  1. Alessandrini, A.; Mazzarella, F.; Vespe, M. Estimated Time of Arrival Using Historical Vessel Tracking Data. IEEE Trans. Intell. Transp. Syst. 2019, 20, 7–15. [Google Scholar] [CrossRef]
  2. Son, W.J.; Cho, I.S. Analysis of Trends in Mega-Sized Container Ships Using the K-Means Clustering Algorithm. Appl. Sci. 2022, 12, 2115. [Google Scholar] [CrossRef]
  3. Goerlandt, F. Maritime Autonomous Surface Ships from a risk governance perspective: Interpretation and implications. Saf. Sci. 2020, 128, 104758. [Google Scholar] [CrossRef]
  4. Mendel, B.; Schwemmer, P.; Peschko, V.; Müller, S.; Schwemmer, H.; Mercker, M.; Garthe, S. Operational Offshore Wind Farms and Associated Ship Traffic Cause Profound Changes in Distribution Patterns of Loons (Gavia spp.). J. Environ. Manag. 2019, 231, 429–438. [Google Scholar] [CrossRef]
  5. Noble, M.M.; Harasti, D.; Pittock, J.; Doran, B. Understanding the Spatial Diversity of Social Uses, Dynamics, and Conflicts in Marine Spatial Planning. J. Environ. Manag. 2019, 246, 929–940. [Google Scholar] [CrossRef] [PubMed]
  6. Rawson, A.; Rogers, E. Assessing the Impacts to Vessel Traffic from Offshore Wind Farms in the Thames Estuary. Sci. J. Mar. Univ. Szczecin. 2015, 43, 99–107. [Google Scholar]
  7. Chuah, L.F.; Mohd Salleh, N.H.; Osnin, N.A.; Alcaide, J.I.; Abdul Majid, M.H.; Abdullah, A.A.; Bikhari, A.; Jalil, E.E.A.; Klemeš, J.J. Profiling Malaysian ship registration and seafarers for streamlining future Malaysian shipping governance. Aust. J. Marit. Ocean Aff. 2021, 13, 225–261. [Google Scholar] [CrossRef]
  8. Chuah, L.F.; Mokhtar, K.; Bakar, A.A.; Othman, M.R.; Osman, N.H.; Bokhari, A.; Mubashir, M.; Abdullah, M.A.; Hasan, M. Marine environment and maritime safety assessment using Port State Control database. Chemosphere 2022, 304, 135245. [Google Scholar] [CrossRef]
  9. Tsai, Y.-M.; Lin, C.-Y. Investigation on Improving Strategies for Navigation Safety in the Offshore Wind Farm in Taiwan Strait. J. Mar. Sci. Eng. 2021, 9, 1448. [Google Scholar] [CrossRef]
  10. Huatai Insurance Agency & Consultant Service LTD. Available online: https://www.huataimarine.com/news/synopsis/Circulars/article/PNI-SPRO%5B2021%5D12----Coastal-Waters-of-Zhejiang-Province,-China---Public-Notice-on-the-Adjustment-of-Main-Public-Shipping-Routes (accessed on 27 September 2022).
  11. Foley, M.M.; Halpern, B.S.; Micheli, F.; Armsby, M.H.; Caldwell, M.R.; Crain, C.M.; Prahler, E.; Rohr, N.; Sivas, D.; Beck, M.W.; et al. Guiding ecological principles for marine spatial planning. Mar. Policy 2010, 34, 955–966. [Google Scholar] [CrossRef]
  12. Douvere, F. The Importance of Marine Spatial Planning in Advancing Ecosystem-based Sea Use Management. Mar. Policy 2008, 32, 762–771. [Google Scholar] [CrossRef]
  13. National Law Information Center. Act on Marine Spatial Planning and Management; Republic of Korea. Available online: http://elaw.klri.re.kr/kor_service/lawView.do?hseq=51031&lang=ENG (accessed on 27 September 2022).
  14. National Law Information Center. Maritime Safety Act; Republic of Korea. Available online: https://elaw.klri.re.kr/kor_service/lawView.do?hseq=53491&lang=ENG (accessed on 27 September 2022).
  15. Lee, J.S. A Study on Navigable Spatial Planning Using Big Data on Maritime Traffic in Geographic Information System Environment. Master’s Thesis, Korea Maritime and Ocean University, Busan, Korea, 2020. [Google Scholar]
  16. MOF (Ministry of Oceans and Fisheries). Guidelines for Marine Spatial Characteristics Assessment; MOF: Sejong, Korea, 2019. [Google Scholar]
  17. Silveira, P.; Teixeira, A.; Soares, C.G. Use of AIS data to characterise marine traffic patterns and ship collision risk off the coast of Portugal. J. Navig. 2013, 66, 879–898. [Google Scholar] [CrossRef] [Green Version]
  18. Yan, W.; Wen, R.; Zhang, A.N.; Yang, D. Vessel movement analysis and pattern discovery using density-based clustering approach. In Proceedings of the 2016 IEEE International Conference on Big Data (Big Data), Washington, DC, USA, 5–8 December 2016; pp. 3798–3806. [Google Scholar]
  19. Xiao, F.; Ligteringen, H.; Van Gulijk, C.; Ale, B. Comparison Study on AIS Data of Ship Traffic Behavior. Ocean Eng. 2015, 95, 84–93. [Google Scholar] [CrossRef] [Green Version]
  20. Son, W.J.; Lee, J.S.; Lee, H.T.; Cho, I.S. An Investigation of the Ship Safety Distance for Bridges across Waterways based on Traffic Distribution. J. Mar. Sci. Eng. 2020, 8, 331. [Google Scholar] [CrossRef]
  21. Tetreault, B.J. Use of the Automatic Identification System (AIS) for Maritime Domain Awareness (MDA). In Proceedings of the MTS (Marine Technology Society) IEEE Oceans, Washington, DC, USA, 17–23 September 2005; pp. 1590–1594. [Google Scholar]
  22. Zhang, D.; Zhang, Y.; Zhang, C. Data mining approach for automatic ship-route design for coastal seas using AIS trajectory clustering analysis. Ocean Eng. 2021, 236, 109535. [Google Scholar] [CrossRef]
  23. Safety of Life at Sea Convention Chapter V, Regulation 19; SOLAS: London, UK, 2000.
  24. Liu, H.; Jurdana, I.; Lopac, N.; Wakabayashi, N. BlueNavi: A Microservices Architecture-Styled Platform Providing Maritime Information. Sustainability 2022, 14, 2173. [Google Scholar] [CrossRef]
  25. Dai, Z.; Zhang, L.; Jia, S.; Pang, H. Shipping Density Assessment Based on Trajectory Big Data. IOP Conf. Ser. Earth Environ. Sci. 2019, 310, 022032. [Google Scholar] [CrossRef]
  26. Scheepens, R.; Hurter, C.; Van De Wetering, H.; Van Wijk, J.J. Visualization, Selection, and Analysis of Traffic Flows. IEEE Trans. Vis. Comput. Graph. 2016, 22, 379–388. [Google Scholar] [CrossRef] [Green Version]
  27. Liu, R.W.; Nie, J.; Garg, S.; Xiong, Z.; Zhang, Y.; Hossain, M.S. Data-driven trajectory quality improvement for promoting intelligent vessel traffic services in 6G-enabled maritime IoT systems. IEEE Internet Things J. 2020, 8, 5374–5385. [Google Scholar] [CrossRef]
  28. Yan, Z.; Xiao, Y.; Cheng, L.; He, R.; Ruan, X.; Zhou, X.; Li, M.; Bin, R. Exploring AIS data for intelligent maritime routes extraction. Appl. Ocean Res. 2020, 101, 102271. [Google Scholar] [CrossRef]
  29. Lee, J.S.; Lee, H.T.; Cho, I.S. Maritime Traffic Route Detection Framework Based on Statistical Density Analysis from AIS Data Using a Clustering Algorithm. IEEE Access 2022, 10, 23355–23366. [Google Scholar] [CrossRef]
  30. Rong, H.; Teixeira, A.P.; Guedes Soares, C. Data mining approach to shipping route characterization and anomaly detection based on AIS data. Ocean Eng. 2020, 198, 106936. [Google Scholar] [CrossRef]
  31. Wang, L.; Chen, P.; Chen, L.; Mou, J. Ship AIS trajectory clustering: An HDBSCAN-based approach. J. Mar. Sci. Eng. 2021, 9, 566. [Google Scholar] [CrossRef]
  32. Chen, P.; Li, M.; Mou, J. A velocity obstacle-based real-time regional ship collision risk analysis method. J. Mar. Sci. Eng. 2021, 9, 428. [Google Scholar] [CrossRef]
  33. Willems, N.; Van De Wetering, H.; Van Wijk, J.J. Visualization of vessel movements. Comput. Graph. Forum 2009, 28, 959–966. [Google Scholar] [CrossRef]
  34. Wu, L.; Xu, Y.; Wang, Q.; Wang, F.; Xu, Z. Mapping global shipping density from AIS data. J. Navig. 2017, 70, 67–81. [Google Scholar] [CrossRef]
  35. Yang, J.; Ma, L.; Liu, J. Modeling and application of ship density based on ship scale conversion and grid. Ocean Eng. 2021, 237, 109557. [Google Scholar] [CrossRef]
  36. Lee, J.S.; Son, W.J.; Lee, H.T.; Cho, I.S. Verification of novel maritime route extraction using kernel density estimation analysis with automatic identification system data. J. Mar. Sci. Eng. 2020, 8, 375. [Google Scholar] [CrossRef]
  37. Lee, J.S.; Cho, I.S. Extracting the Maritime Traffic Route in Korea Based on Probabilistic Approach Using Automatic Identification System Big Data. Appl. Sci. 2022, 12, 635. [Google Scholar] [CrossRef]
  38. Nicolas, F.; Frias, M.; Backer, H. Mapping Maritime Activities within the Baltic Sea. Baltic Scope 2016. [Google Scholar]
  39. Ryu, Y.H.; Park, K.G.; Kim, H.Y. A Study on the Advancement Structure Model of Maritime Safety Information System (GICOMS) using FSM. J. Korean Inst. Intell. Syst. 2014, 24, 337–343. [Google Scholar]
  40. ITU. Technical Characteristics for an Automatic Identification System Using Time Division Multiple Access in the VHF Maritime Mobile Frequency Band; International Telecommunication Union: Geneva, Switzerland, 2014. [Google Scholar]
  41. Kim, M.; Yim, U.H.; Hong, S.H.; Jung, J.H.; Choi, H.W.; An, J.; Won, J.; Shim, W.J. Hebei Spirit oil spill monitored on site by fluorometric detection of residual oil in coastal waters off Taean, Korea. Mar. Pollut. Bull. 2010, 60, 383–389. [Google Scholar] [CrossRef] [PubMed]
  42. Lee, J.; Dhesi, S.; Phillips, I.; Jeong, M.; Kwon, K.; Jung, D.; Lee, C. Equal Opportunities for Foreign Seafarers to Ensure Sustainable Development in the Korean Merchant Shipping Industry. J. Mar. Sci. Eng. 2022, 10, 830. [Google Scholar] [CrossRef]
  43. MarineCadastre.gov. Available online: https://marinecadastre.gov/ais/faq/ (accessed on 27 September 2022).
  44. EMODnet (European Marine Observation and Data Network). EU Vessel Density Map Detailed Method_v1.5; EMODnet Human Activities: Roma, Italy, 2019. [Google Scholar]
  45. Zhu, F.; Lei, L. Research on a method for analysis of ship traffic density in harbor water area based on GIS. In Proceedings of the IEEE Conference Anthology, Chongqing, China, 1–8 January 2013. [Google Scholar]
  46. Li, X.; Xiao, Y.; Su, F.; Wu, W.; Zhou, L. AIS and VBD Data Fusion for Marine Fishing Intensity Mapping and Analysis in the Northern Part of the South China Sea. ISPRS Int. J. Geo Inf. 2021, 10, 277. [Google Scholar] [CrossRef]
  47. Jurdana, I.; Lopac, N.; Wakabayashi, N.; Liu, H. Shipboard Data Compression Method for Sustainable Real-Time Maritime Communication in Remote Voyage Monitoring of Autonomous Ships. Sustainability 2021, 13, 8264. [Google Scholar] [CrossRef]
  48. Barco, S.G.; Lockhart, G.G.; Swingle, W.M. Using RADAR & AIS to investigate ship behavior in the Chesapeake Bay ocean approach off of Virginia, USA. In Proceedings of the IEEE OCEANS, Virginia Beach, VA, USA, 14–19 October 2012. [Google Scholar]
  49. Leydesdorff, L.; Bensman, S. Classification and powerlaws: The logarithmic transformation. J. Am. Soc. Inf. Sci. Technol. 2006, 57, 1470–1486. [Google Scholar] [CrossRef]
  50. Esri. Available online: https://desktop.arcgis.com/en/arcmap/10.3/manage-data/raster-and-images/stretch-function.htm (accessed on 27 September 2022).
  51. Limpert, E.; Stahel, W.A.; Abbt, M. Log-normal distributions across the sciences: Keys and clues: On the charms of statistics, and how mechanical models resembling gambling machines offer a link to a handy way to characterize log-normal distributions, which can provide deeper insight into variability and probability—Normal or log-normal: That is the question. BioScience 2001, 51, 341–352. [Google Scholar]
Figure 1. Flowchart of the proposed maritime traffic density analysis using an automatic identification system (AIS) data and density map creation.
Applsci 12 11246 g001
Figure 2. Analysis area covering the coastal waters of Korea and the grid composed of 1 km × 1 km cells.
Applsci 12 11246 g002
Figure 3. Flowchart of the spatial-temporal density analysis.
Applsci 12 11246 g003
Figure 4. Trajectory line segments constructed from consecutive position points in AIS data: (a) cargo ships, (b) tankers, (c) passenger ships, and (d) towing ships.
Applsci 12 11246 g004
Figure 5. Histograms of logarithmically transformed density values representing raster pixel values. The red histogram shows the linear redistribution of the values originally lying between -1 standard deviation and +1 standard deviation from the mean over the entire observed range.
Applsci 12 11246 g005
Figure 6. Visualization of log-transformed density values by ship type using standard-deviation-based stretch symbolization: (a) cargo ships, (b) tankers, (c) passenger ships, and (d) towing ships.
Applsci 12 11246 g006
Figure 7. Visualization of log-transformed density values for all ships using the standard-deviation-based stretch symbolization. The continuous color scheme of stretching is applied to (a) 100%, (b) the top 75%, (c) the top 50%, and (d) the top 25% of the full range.
Applsci 12 11246 g007
Figure 8. Comparison of ship traffic densities in the coastal area of Korea analyzed and visualized using two sets of methods: (a) Lee et al. [31] used the top 50% of total traffic volume for route extraction via the line density analysis and quantile methods; (b) the present study uses the top 25% of the total traffic volume for main route extraction using spatial-temporal density analysis and standard-deviation-based stretch symbolization.
Applsci 12 11246 g008
Table 1. Reporting intervals of Class A shipborne mobile equipment.
Ship’s Dynamic ConditionsReporting Interval
Ship at anchor or moored and not moving faster than 3 knots3 min
Ship at anchor or moored and moving faster than 3 knots10 s
Ship moving at 0–14 knots10 s
Ship moving at 0–14 knots and changing course3⅓ s
Ship moving at 14–23 knots6 s
Ship moving at 14–23 knots and changing course2 s
Ship moving at 23 knots or more2 s
Ship moving at 23 knots or more and changing course2 s
Table 2. Comparison of the AIS data used in the analysis of Lee et al. [37] and the present study.
CategorizationLee et al.’s Study [37]This Study
Data periodone week by season
1–7 March 2018
1–7 June 2018
1–7 September 2018
1–7 December 2018
one month by season
1–31 March 2018
1–30 June 2018
1–30 September 2018
1–31 December 2018
Ship typescargo ships, tankers, passenger ships, towing ships
Ship lengthover 60 m (≥60 m)
Ship speed-over 3 knots (≥3 kts)
Table 3. Basic characteristics of the AIS data used for analysis.
Ship TypeMonth
of 2018
Number of PositionsNumber of Positions
(SOG > 3 knots)
Number of Ships
(length ≥ 60 m)
Data Volume
(GB)
Cargo
ship
03112,602,93389,955,498776312.5
06131,960,904110,392,193897215.4
0998,351,98075,955,889688610.7
1289,252,99966,234,58043849.31
Tanker0353,489,80634,745,22922334.85
0654,331,71636,546,68523345.10
0947,709,50731,655,32118404.42
1248,044,50229,162,58613774.05
Passenger
ship
036,568,0323,737,1381410.52
068,046,0745,322,0551650.75
096,780,0664,281,1181450.61
126,662,9763,862,198760.55
Towing
ship
032,036,415719,845590.10
062,194,433959,639890.13
092,553,897696,911900.09
122,926,842756,068470.10
Table 4. Descriptive statistics of density calculation results by ship type.
Ship TypeN TotalMeanSDSumSkewnessKurtosisMinMedianMax
Cargo ship323,6742.348.22756,84056.3679337.9 × 10−100.86211718
Tanker321,4241.157.58368,43087.9412,8761.7 × 10−100.24621617
Passenger ship92,9480.335.2530,30090.6710,5335.2 × 10−110.0316757
Towing ship106,0300.120.9612,67147.7832609.7 × 10−118.5 × 10−586
All ships323,6883.6114.01,168,24143.1235785.5 × 10−91.20781725
Table 5. Overall comparison of this study and Lee et al. [37] in terms of data, analysis methods, and symbolization.
ParameterLee et al. [37]This Study
Data volume1 week per season,
Totaling 1 month
1 month per season,
Totaling 4 months
Analysis areaKorean coastal waters
(divided into 16 areas)
Korean coastal waters
Density analysisLine density
(based on ship tracks)
Spatial-temporal density
(based on ship occupancy time)
Density valuesSummed line length per square meterSummed hours per square kilometer
VisualizationQuantile
(10 classes)
Stretch
(1 standard deviation)
Publisher’s Note: MDPI stays neutral with regard to jurisdictional claims in published maps and institutional affiliations.

