Article

Enhanced Firefly-K-Means Clustering with Adaptive Mutation and Central Limit Theorem for Automatic Clustering of High-Dimensional Datasets

by
Abiodun M. Ikotun
1 and
Absalom E. Ezugwu
1,2,*
1
School of Mathematics, Statistics, and Computer Science, Pietermaritzburg Campus, University of KwaZulu-Natal, King Edward Avenue, Pietermaritzburg 3201, South Africa
2
Unit for Data Science and Computing, North-West University, Potchefstroom, 1 Hoffman Street, Potchefstroom 2520, South Africa
*
Author to whom correspondence should be addressed.
Submission received: 9 October 2022 / Revised: 24 November 2022 / Accepted: 28 November 2022 / Published: 30 November 2022
(This article belongs to the Special Issue Evolutionary Algorithms and Large-Scale Real-World Applications)

Abstract

:
Metaheuristic algorithms have been hybridized with the standard K-means to address the latter’s challenges in finding a solution to automatic clustering problems. However, the distance calculations required in the standard K-means phase of the hybrid clustering algorithms increase as the number of clusters increases, and the associated computational cost rises in proportion to the dataset dimensionality. The use of the standard K-means algorithm in the metaheuristic-based K-means hybrid algorithm for the automatic clustering of high-dimensional real-world datasets poses a great challenge to the clustering performance of the resultant hybrid algorithms in terms of computational cost. Reducing the computation time required in the K-means phase of the hybrid algorithm for the automatic clustering of high-dimensional datasets will inevitably reduce the algorithm’s complexity. In this paper, a preprocessing phase is introduced into the K-means phase of an improved firefly-based K-means hybrid algorithm using the concept of the central limit theorem to partition the high-dimensional dataset into subgroups of randomly formed subsets on which the K-means algorithm is applied to obtain representative cluster centers for the final clustering procedure. The enhanced firefly algorithm (FA) is hybridized with the CLT-based K-means algorithm to automatically determine the optimum number of cluster centroids and generate corresponding optimum initial cluster centroids for the K-means algorithm to achieve optimal global convergence. Twenty high-dimensional datasets from the UCI machine learning repository are used to investigate the performance of the proposed algorithm. The empirical results indicate that the hybrid FA-K-means clustering method demonstrates statistically significant superiority in the employed performance measures and reducing computation time cost for clustering high-dimensional dataset problems, compared to other advanced hybrid search variants.

1. Introduction

Explosive growth in data generation, acquisition, and storage has been observed recently, with significant and valuable knowledge hidden within this large amount of stored data. There is a need to extract the information and knowledge trapped within this massive data to improve organizations’ decision-making processes. However, the explosive yet increasing data size makes the extraction process difficult and complex, surpassing the usual ability required to process, analyze, and understand the data [1]. Data mining as a part of knowledge discovery in databases is one method to address this challenge.
Data clustering is an essential unsupervised data classification technique in data mining. It involves grouping unlabeled data objects into clusters based on their similarities, such that objects within a cluster are more similar to each other than to data objects in other clusters. It has found wide application in different areas such as pattern recognition, image analysis, artificial intelligence, machine learning, computer vision, recommendation systems, spatial databases, medicine, information retrieval, marketing, web mining, and statistics [2,3].
High-dimensional datasets involve those whose dimensions vary from a few scores to several thousands of dimensions [1]. According to [4], a dataset can be judged as large in three ways: when the number of elements in the dataset is large, when each element in the dataset has many dimensions, and when the dataset has many clusters. Large datasets are common in domains such as social media data, recommendation systems, microarray data, medicine, bioinformatics, text document clustering, and biology [1,5]. It is computationally expensive to use a traditional clustering algorithm for a high-dimensional dataset [5]. This problem associated with clustering high-dimensional data is generally referred to as the “curse of dimensionality”.
The K-means algorithm is a traditional clustering algorithm that has gained wide popularity and acceptability with wide usage based on its efficiency, ease of implementation, and simplicity. It is categorized as a partitional clustering algorithm where data objects of datasets are divided into separate groups such that each data object can only belong to a single group. It employs a distance-based optimization criterion to minimize the intra-cluster distance and maximize the inter-cluster distance. Several limitations, however, have been identified in using the K-means clustering algorithm, including sensitivity to initialization parameters, undesirable sample distribution vulnerability, and susceptibility to noise [6,7]. The optimum performance of K-means is premised on the specification of the correct number of clusters (which is difficult to determine in a real-life dataset) and the selection of the optimum number of the initial cluster centroid. The K-means algorithm uses the hill-climbing approach in its search for the optimum cluster centroid resulting in local search around the initial cluster centroid with the algorithm having a high probability of getting trapped into local optima. Moreover, the clustering process of the classical K-means uses square distance limits to discover spherical-shaped clusters, which is often unsuitable considering the actual nature of the complex data distribution of real-life datasets. The clustering of real-life datasets characterized by high-dimensionality, presence of noise and outliers, imbalance, sparse and irregular sample distribution, and narrow or overlapping cluster margins poses many challenges to the K-means algorithm. According to Xie et al. [8], the K-means finds it difficult to obtain the desired clustering results when dealing with a high-dimensional dataset due to the dimensional disaster impact, data size, noise, and distribution with low computational efficiency. The wide acceptability and usage of K-means makes its performance enhancements inevitable; thus, this paper aims at addressing the high computation time challenge of K-means due to the inherent problem of the curse of dimensionality in big data. to improve its performance in finding solution to automatic clustering problems of big data.
Several approaches have been proposed in the literature to address the high-computation-time problems of the classical K-means algorithm in clustering high-dimensional data. According to Xie et al. [8], a common approach is the dimensionality reduction approach which involves seeking and clustering within low-dimensional features of high-dimensional data. However, some of the difficulties identified in this approach are that there is a need first to determine whether low-dimensional data are the dominating feature needed for clustering practical problems, and if the distance mapping between low-dimensional data points is conductive clustering [8]. In Alguliyev et al. [9], a K-means-based parallel batch clustering algorithm was proposed, where the dataset is divided into equal partitions to reduce the exponential computation growth. Each partition’s cluster centers are calculated using the K-means algorithm, and the generated cluster centroids are merged and clustered. Although the dataset’s characteristics are preserved with increased clustering speed, determining the optimum number of clusters within each partition is still a problem. An improved K-means algorithm based on density canopy was proposed in [10] which uses density canopy as a preprocessing method for the K-means algorithm to determine the number of clusters and initial cluster centroids. According to the authors, the main goal is to resolve the initialization problems, while the issue with clustering big data in terms of high computation time is not addressed. In Alguliyev et al. [11], a batch clustering algorithm for big data sets is proposed where large data sets are clustered in batches. Each batch is clustered using the K-means algorithm, with cluster centroids of the previous batch added to the subsequent batches until all batches are clustered. The cluster centroid obtained from the final batch is used as the final cluster centroid for the final data points’ assignments. Although the exponential growth of computational time is avoided, there is no guarantee that the final cluster centroid is optimum for the entire dataset. In Olukanmi et al. [12], a simple algorithm that addresses the poor scalability of K-means in relation to clustering large datasets based on a statistical inference approach was proposed. Their algorithm uses samples from the dataset to compute the centroids based on an intuitive extension of the classical central limit theorem (CLT).
In recent times, hybridizing K-means with metaheuristics has also assisted in solving most of the problems associated with real-life datasets based on their global search capability for the optimized number of clusters and cluster centroids [6,13,14,15,16,17,18,19,20,21]. Primarily, metaheuristics algorithms have been used to help the K-means algorithm to escape from local optima convergence by searching for global optimum initial cluster centroids. Their effectiveness has been extensively validated in the literature [22]. However, some of the metaheuristic algorithms has been hybridized with K-means algorithm to improve its performance in solving automatic clustering problems [23]. In this paper, a further enhancement is proposed for the firefly-based K-means hybrid algorithm for automatic clustering of high-dimensional data by using a CLT-based K-means in the hybrid algorithm to reduce the number of distance calculations required in the K-means phase thereby reducing the algorithm’s computational time.
The firefly algorithm (FA) is a population-based metaheuristic algorithm proposed by [24]. It has been applied to solve numerous problems in different fields because of its efficiency, robustness, versatility, and ability to find an approximate solution to NP-hard problems, among other benefits [25]. FA has been extensively used for automatic clustering [25,26] with superior clustering performance reported in literatures in comparison with other metaheuristic algorithms. The FA is easy to understand, simple to implement, and has been used successfully to find the solution to problems in different areas. It has outperformed several other metaheuristic algorithms and has demonstrated superior performance when hybridized with other metaheuristic algorithms [25,27]. According to Kumar and Kumar [28], the efficient performance of FA is based on the fact that it combines the advantages of some of the existing metaheuristic algorithms, namely, simulated annealing (SA), particle swarm optimization (PSO) and differential evolution (DE). Thus, FA is regarded as a generalized form of DE, SA and PSO [28]. The FA has been combined with K-means in several studies. In Hassanzadeh and Meybodi [29], the FA was combined with the classical K-means; similarly, the investigation presented in [30] combined the FA with parallel K-means, while [31] adopted optimized K-means and canopies in their hybridization with FA. Behera et al. [16] used fuzzy C-means with FA. The study presented in [32,33] aimed to improve the general clustering performance in their modification of FA hybridized with the K-means algorithm. The popularity of the FA among global optimization researchers is due to the algorithm’s application versatility in terms of robustness and performance superiority, and because it is backed with mathematical proofs in dealing with diverse, complex optimization problems encountered in the real-world, making it the first choice for enhancing the inferior performance stability of the classical K-means clustering algorithm [16]. However, the primary motivation for selecting the FA as a global optimization enhancer for the classical K-means is because of its multimodality features, adaptability to the problem landscape, and automatic subdivision of its population into subgroups, which best fits the context of the problem at hand [16].
In this paper, an enhanced adaptive mutation-based FA is combined with the classical K-means for the automatic clustering of high-dimensional data with a focus on addressing the curse of dimensionality problem of big data; this paper adopted the idea from the CLT proposed in [12] to break the high-dimensional dataset into several overlapping subsets on which the K-means algorithm is applied to obtain representative cluster centers for the final clustering procedure. This preprocessing task reduces the number of distance calculations needed in the K-means phase of the hybrid algorithm, thereby reducing the computation time required for the clustering process to ensure scalability when handling high-dimensional datasets. An initial investigation was conducted involving the proposed algorithm and seven other metaheuristic-based K-means modelled using the same framework as the proposed algorithm to justify the selection of the proposed algorithm. The proposed hybrid algorithms’ performance was investigated using 20 high-dimensional datasets, with the Davies Bouldin cluster validity index (DBI) [34] serving as the measuring index to determine the validity of the clustering solutions obtained.
The rest of the paper is outlined as follows: Section 2 presents the related works on FA-based K-means hybrid algorithms. Section 3 describes the classical firefly algorithm, K-means algorithms, the central limit theorem, and its application in the design of a scalable K-means algorithm. It also describes the proposed improved FA-based K-means hybrid algorithm. Section 4 presents the evaluation of the hybrid algorithm on high-dimensional datasets and comparison with other metaheuristic algorithms from the literature. The conclusion and future research direction are presented in Section 5.

2. Related Research

The FA is a metaheuristic algorithm that has been applied to solve numerous problems in different fields as earlier stated. It has the unique capability of automatic subdivision, which gives it the advantage of handling multimodal optimization problems compared with other metaheuristic algorithms [28]. It records superior performance in clustering analysis due to the clustering process’s high non-linearity and sub-optimal distraction [6]. A systematic review of the FA is presented in [28] describing the various characteristics and variants of the algorithm. A comprehensive review of the FA regarding the various areas of its successful application in a wide spectrum of real-world applications is discussed in [35], and a performance study using classification error percentage criteria on the FA for cluster analysis is presented in [36]. The algorithm used in this study was able to generate the optimal cluster centroids, and their study acknowledged the algorithm’s strength. The authors’ report shows that the classification efficiency of the FA is superior compared with that of PSO, artificial bee colony (ABC) and other clustering methods.
For enhancement of the FA for clustering problems, its hybridization with other metaheuristic algorithms has been reported in the literature. An automatic data clustering using a hybrid firefly particle swarm optimization algorithm was reported by [26], where an improved FA was integrated with PSO (FAPSO). The study result showed superior performance over each of the individual clustering algorithms FA, PSO, and classical DE with a high level of stability. Comparisons with other hybrid algorithms from the literature (ACDE, DCPSO, and GCUK) were also performed, and FAPSO outperformed the competing hybrid algorithms. Rajah and Ezugwu [37] reported a hybrid of SOS with FA (SOSFA) alongside other SOS-based hybrid algorithms for handling automatic clustering. SOSFA was reported as having superior performance in some of the datasets used during the algorithms’ performance investigation.
Moreover, a comparative study of hybrid FAs for automatic data clustering was performed and discussed in [38]. Their work investigated automatic clustering tasks on unlabeled, large-scaled and high-density datasets using four firefly-based hybrid algorithms. The FA was combined with PSO, ABC, invasive weed optimization (IWO), and teaching–learning-based optimization (TLBO). These hybrid algorithms require no prior knowledge of the data object to be classified, and the optimal number of clusters is automatically determined during the execution of the hybrid algorithms. The cluster separation index (CSI) and DBI cluster validity indices were used to evaluate the hybrid algorithms’ performances on 12 University of California Irvine (UCI) machine learning repository datasets. The clustering results were compared with other hybrid algorithms from the literature with a noticeable performance improvement. However, it was observed that there was an exponential increment in the computational cost of the hybrid algorithm relative to the population size.
Based on the superior performances of the FA in handling both general and automatic clustering, a few hybridizations of FA with K-means have been reported in the literature. One of the earliest hybridizations with K-means is presented by [29] as a new approach to clustering algorithm using FA tagged KFA. The FA finds optimum k-numbered cluster centroids for the K-means algorithm to refine the cluster centroids. Their proposed algorithm used a modified FA that uses global optima in the firefly’s movement in such a way that the firefly with the maximum or minimum value influences the movement of other fireflies. The cartesian distance was used to calculate the distance of fireflies for global optima convergence. The performance of their algorithm was evaluated using five UCI datasets and compared with other clustering algorithms. Their result recorded a relatively stable algorithm with better clustering efficiency. Performance on the high-dimensional datasets was not investigated, and the classical K-means algorithm was used.
The hybridization of the K-means algorithm with firefly using parallel architecture to handle a large number of clusters was proposed by [30]. The K-means algorithm was used in refining the initial optimal cluster centroids generated by the FA for improved clustering accuracy. The FA was executed with the K-means algorithm for data clustering in a sequential manner to avoid local optimal convergence entrapment. Parallel architecture was adopted to reduce the execution time for large dimensional datasets, thus making this class of problems more computationally feasible which otherwise would have been computationally prohibitive. The proposed algorithm’s performance was evaluated using four UCI repository datasets using six validity metrics (DBI, sum of squares within (SSW), sum of squares between (SSB), Dunn-Dunn index, accuracy, and silhouette coefficient) to establish the validity of the clustering results. Their results were compared with the standard parallel K-means algorithm showing a better clustering result with higher accuracy.
The FA was hybridized with fuzzy C-means in [16]. The fuzzy C-means (FCM) algorithm is a variant of the K-means algorithm that uses a generalized least square objective function to generate fuzzy partitions and prototypes for numerical data [39]. The FA was integrated with the FCM to generate initial optimal cluster centroids for the FCM and avoid the latter from converging into local optimal. The performance of the hybridized FCM-FA was investigated using various real-world datasets and compared with other algorithms. The experimental results showed a better and more effective clustering algorithm. In the same vein, Nayak et al. [32] leveraged the global search capacity of the FA to assist the classical K-means in escaping convergence into local minimal in their proposed firefly-based K-means (FA-K-means). Their simulation results showed that the hybrid algorithm can efficiently handle the clustering problems without the K-means getting trapped into local minimal and faster convergence.
The FA was integrated with the canopy pre-clustering algorithm in [31] and hybridized with K-means. The canopy pre-clustering algorithm uses an approximate and inexpensive distance measure to partition initial data into overlapping subsets tagged as canopies. The main clustering is then performed using distances between points that occur in the common canopy [40]. The Haberman’s survival dataset from the UCI repository was used to investigate their proposed algorithm’s performance. The result showed that the proposed data clustering algorithm had a better classification accuracy when compared with the traditional K-means algorithm.
Two variants of the FA were hybridized with K-means by [6] to resolve the K-means algorithm’s local optimal trap and initialization sensitivity problems. Their hybrid model was based on the FA’s unique property of automatic sub-division and ability to tackle multimodal optimization problems of the firefly algorithm. To improve the performance of the FA, matrix-based search parameters and dispersing mechanisms were embedded into the two FA variants. These enhance the exploration and exploitation capability of the variants. In the first variant, a randomly generated control matrix replaces the FA’s attractiveness coefficient to elevate the one-dimensional search mechanism to a multi-dimensional one. In the second variant, fireflies with high similarities are moved to a new position using the dispersing mechanism for global exploration. The dispersing mechanism introduces enough variance between fireflies to increase search efficiency. Their proposed algorithms were evaluated on 15 UCI datasets and a skin lesion dataset. The algorithms significantly outperformed the classical K-means algorithm in performance and distance measure.
The FA-based-K-means hybrid algorithms have also been applied in solving some real-life problems. The FA-K-means algorithm was applied for color image quantization, computer graphics, and processing problems to reduce colors in an image with minimum distortion [41]. The hybrid algorithm was tested on three commonly used images and the results were compared with the outputs from classical K-means and conventional FA. Their algorithm produced a better result than the baseline techniques. A hybrid algorithm that integrated FA-based K-means with wavelet transform and FA-based support vector regression was proposed by [42] as a three-stage forecasting model to develop a prediction system for export trade value. The FA-based K-means was adopted to perform cluster analysis on the export trade value dataset. The prediction model was then built for each cluster, resulting in better performance of the prediction system.
In Kaur et al. [18], the FA-based K-means algorithm was applied for data-clustering purposes in the clustering-based intrusion detection system (IDS), which replaced the regular signature-based IDS. The clustering phase was used to build the training model for the IDS, which then evaluated the test set using classification. Compared with the results from other clustering algorithms, an impressive result was observed when the system was tested on the NSL-KDD (network security laboratory–knowledge discovery dataset). K-member fuzzy clustering was integrated with the FA by [43] for a combined anonymizing algorithm for privacy preservation in social networks. In the hybrid algorithm, the modified version of the fuzzy C-means—the K-member fuzzy algorithm—is employed for creating balance clusters, with each cluster having at least K-members. The FA is then used to optimize the clusters to anonymize the network graph and data. The system was tested using four social network databases and observed a minimal loss of information on the published graph and data.
Using a firefly-based K-means hybrid algorithm, a meteorological system was built to accurately and quickly estimate reference evapotranspiration [37]. Reference evapotranspiration is used in designing irrigation schedules, determining crop water requirements, and planning and managing agricultural water resources when the available meteorological data are limited. They coupled K-means clustering and FA with a novel kernel extreme learning machine model alongside limited meteorological data ranging from 5 to 40 with pooled temperature data from 26 weather stations in parallel computation to estimate monthly evapotranspiration in the Poyang Lake basin of South China. Their algorithm outperformed the existing methods in terms of the count of absolute errors. There was a significant reduction in the computation time recorded by the proposed parallel algorithm compared with its sequential counterpart and other competing existing methods.
Most of the existing methods focused on addressing the fundamental problems of local optimal convergence and initialization sensitivity of the K-means algorithm except [30,31]. Hence, all except [31] used the convectional K-means algorithm or its fuzzy c-means variants in their hybridization with the FA. A parallel implementation approach was adopted by [30] to reduce the computation time for high-dimensional datasets. In Nayak et al. [31], the problem of the curse of dimensionality is also considered; the authors incorporated the canopy pre-clustering method along with their proposed firefly-K-means hybridization algorithm. The canopy pre-clustering method requires two parameter specifications of T1 and T2 representing the two distance thresholds required to determine the canopy center that a data point will be assigned to, in order to specify the accurate number of clusters. Determining the accurate distance thresholds for canopy formation for optimum clustering is difficult. In this work, we aimed to achieve better clustering robustness, clustering optimality and efficient clustering results with reduced computational time when dealing with the issue of high-dimensional datasets.

3. Methodology

This section describes the classical FA model, the conventional K-means algorithm model, the central limit theorem, and its application in the design of a scalable K-means algorithm. It also presents the hybridization models of the CLT-based hybrid FA-K-means algorithm for the automatic clustering problem. The DBI is also described.

3.1. Firefly Algorithm

The FA is a nature-inspired metaheuristics algorithm developed by Yang et al. [44]. It is characterized as a swarm-based metaheuristic optimization algorithm with a high convergence rate and short execution time compared to other metaheuristic techniques.
Fireflies emit bioluminescence flashes as a signaling system to communicate among themselves. The signaling system uses the flashing rate, the flashes’ intensity, and the amount of time between the flashes to pass a message across to other fireflies. The brightness of a firefly flash and the timing accuracy of the flashes determines its attractiveness [44]. The characteristics of the signaling system inherent in the firefly formed the basis for developing the FA. A nonlinear term based on the exponential decay of light absorption and the inverse square of light variation with distance is applied in simulating the variation in the intensity of the light flashes of the firefly to determine its attractiveness [44].
In finding the optimization problem’s solution vector, the FA algorithmic equation is given in Equation (1), illustrating the firefly’s movement from point i to point j
X i t + 1   = X i t + β 0 e γ r i j 2 ( X j t X i t ) + α ϵ i t
where:
  • α —a scaling factor that controls the random walk step sizes.
  • β0—the attractiveness constant when the distance between two fireflies equals zero, that is, r i j = 0 .
  • γ—the scale-dependent parameter that controls the visibility of the fireflies.
  • β 0 e γ r i j 2 ( X j t X i t ) —gives the nonlinear attractiveness of a firefly, which varies with distance.
  • α ϵ i t —the randomization term (where ϵ i t refers to the use of Gaussian distribution for generating random values at each iteration).
The distance between two fireflies can be defined as the Cartesian distance between them. Sometimes, it could be the delay time in a routing problem or even the Hamming distance between them for combinatorial problems. The firefly’s brightness is associated with its objective landscape with its position as the indicator; thus, its attractiveness is determined by its relative positions and relative brightness in relation to another firefly. This necessitates a paired comparison of fireflies.
Three assumptions are made in the basic design of the FA: one, all fireflies are considered as unisex; two, the attractiveness of a firefly is directly proportional to its brightness; and three, the fitness function landscape determines the brightness of the flashlight produced by any firefly. The distance and intensity of light emitted into the atmosphere affects the brightness of any firefly. This is illustrated in Equation (2).
I ( r ) = I 0 e γ r 2
where:
  • I0—the intensity of light when r   = 0.
  • γ —the coefficient of light absorption.
  • r —the distance.
The distance between two fireflies is illustrated by Equation (3)
r i j = x i x j = k = 1 d ( x i , k x j , k ) 2
where:
  • d is the dimension of the problem.
For an automatic clustering problem, a given dataset D S = { d s 1 ,   d s 2 , , d s n } with dimensions d i ( i = 1 , 2 ,   , n ) is required to be partitioned into non-overlapping groups called clusters C = { c 1 ,   c 2 , , c k } with cluster centers c c i ( i = 1.2 .   , k ) such that:
C i   C j = ,                         i , j = 1 , 2 ,     ,   K ,           i   j
C 1     C 2   C k = D S
where:
  • C i   D S   a n d   C i   0 ,   i = 1 ,   2 , , K
At the initialization stage, a population of size n is defined as X = (x1, x2, …, xn) as a representative data point with reference to a clustering problem where x is a k   x   d -dimensional vector D S n × b defined as X =   x 1 ,   x 2 ,   , x   k = (   x 11 ,   x 12 ,   , x 1 d ) ,   (   x 21 ,   x 22 ,   , x 2 d ) ,   , (   x k 1 ,   x k 2 ,   , x k d ) . The FA uses Equation (5) as the optimization function to minimize the sum of the distance between the datasets ds and the cluster center cc with the lower and upper bound set as min { d s 1 ,   d s 2 , , d s d } and max { d s 1 ,   d s 2 , , d s d } represented as l b = ( l b 1   , l b 2 ,   , l b d ) and u b = ( u b 1   , u b 2 ,   . u b d ) ,   respectively , for the number of groups in the population.
To find the solution to the clustering problem, the ith particle X i is evaluated using Equation (6)
X i =   r a n d   ( 1 , k × d )   .   * ( u b l b ) + l b  
where rand ( 1 ,   k   ×   d ) represents a vector of uniformly distributed random integer numbers with values between 0 and 1. The FA algorithm uses the squared error function shown in Equation (7) as its objective function.
f ( D S ,   C ) = i = 1   n m i n { d c i c j 2       | j = 1 , 2 ,   ,   k }
For cluster analysis, the cluster centers are the decision variables, and the cluster validity index is used as the fitness function to evaluate the quality of each firefly with respect to its light intensity.
For a more efficient clustering task, the concept of mutation strategy suggested by [38] is incorporated to improve the exploitation and exploration of the FA. The mutation operator probability represented by Equation (8) is used for additional diversity among the swarm of fireflies.
M p = f ( ( x n e w ) f ( x o l d )
where f ( x n e w ) is the fitness value of the new firefly and f ( x o l d ) is the fitness value of an old firefly. For optimum performance of FA, Kumar and Kumar [28] suggested the range of values for the algorithm parameters β ,     γ ,   and   α . The mutation strategy leverages the desirable features of the attractive fireflies added to the less bright fireflies to enhance their attractiveness. The mutation probability is used to calculate the extent of the feature enhancement modification of any identified less bright firefly, such that fireflies with low light intensity have a higher mutation probability. In comparison, those whose light intensity is high have a lower mutation probability [38]. The introduction of the mutation probability ensures that good-quality solutions are not reduced and low-quality solutions are improved. The basic algorithm listing for the standard FA can be found in [24], while the improved FA used in this paper is given in Algorithm 1 [38].
The choice of using the FA over other metaheuristic algorithms for improving the clustering capability of the classical K-means algorithm is justified by the track record of the application of FA in handling similar clustering problems as presented in the literature. Highlights of some of the outstanding performances of the FA in achieving better clustering results are discussed in the extensive experimentation presented in [38].
Algorithm 1: Pseudocode for the improved FA
Input

Output
1
2
3
4
5
6
7
8
9
10
11
12
13
14
15
16
17
18
19
20
21
22
23
24
Data   points   X = { x 1 ,   x 2 ,   .   .   .   ,   x n }

Obtained   best   location :   x 1 m i n
Begin
    Define   the   initial   parameters   for   the   firefly   algorithms :   M a x G e n ,   β ,   γ ,   α ,   a n d   n
    Specify   the   fitness   function   f i t f u n c ( a ) ,     a = ( a 1 , a 2 , , a D ) i t e r
    Generate   n   initial   positions   of   fireflies   ( i = 1 ,   2 ,   , k )
    Calculate   the   f i t f u n c ( a )   to   generate   the   light   intensity   L i n t i of   firefly   a f i r e f l y ( i )
  Do
     for i = 1:n
       for   j = 1 : n
        if   L i n t i < L i n t j
         Move   a f i r e f l y ( i )   towards   a f i r e f l y ( j ) using Equations (2) and (3);
         end
       Compute   M P = f f ( a f i r e f l y n e w ) f f ( a f i r e f l y o l d )
        Execute mutation ()
       End
       Compute   the   attractiveness   variance   with   distance   r   using   exp ( γ r )

       Compute new fitness value for all fireflies
       Accept new solutions with the best fitness
      End
     Perform   firefly   light   intensity   L i n t i update
     Increment   algorithm   counter   i t e r = i t e r + 1
     Perform α reduction by a factor;
   While   i t e r < M a x G e n
End

3.2. K-Means Algorithm

The K-means algorithm uses the Euclidean distance as the objective function to group N data points of D -dimensions into a predefined number of clusters k. The algorithm selects a user-specified k number of data points at the initialization level to represent the initial cluster centroids. Two significant steps follow this: the assignment step and the centroid update step, which are iteratively repeated until the convergence condition is achieved. In the assignment step, the algorithm calculates the distance of each data point from the cluster centroids and assigns it to the closest cluster. The centroid update is then performed by calculating the cluster’s mean to find a new cluster center. The algorithm stops when a maximum number of iterations has been reached or when there are no longer changes in the centroid vectors over many iterations. According to [45,46,47,48], the basic steps of the K-means algorithm are:
i.
Perform an initial partition into k number of clusters based on user-specified k .
ii.
Repeat steps 3 and 4 until cluster membership is stable.
iii.
Assign each data object to the closest cluster to it to generate a new partition.
iv.
Perform cluster center update.
The pseudocode for the basic steps of the classical K-means algorithm is given in Algorithm 2 [23].
Algorithm 2: Standard K-means Pseudocode
Input:Array D { d 1 , d 2 , , d n }    //Input Dataset
                            k            //Specified k number of clusters
Output: F C C = { f c c 1 , f c c 2 , , f c c k } //Final cluster centroids
1Begin
2    //Parameter Initialization
3                           A = (   a 1 , a 2 , , a n } )     //dataset
4                           R C C = (   r c c 1 , r c c 2 , , r c c k   } ) //Select initial cluster centroids randomly
5    Do
6    //Calculations of Distance
7        for i = 1   t o   n do
8          for  j = 1   t o   k do
9            Compute data objects’ Euclidean distance to all clusters
10           end  j
11    //Data object Assignment to clusters
12         Assign data objects to the closest cluster
13        end  i
14    //Updating Cluster centroid
15     Evaluate the new cluster centroid
16    While cluster centroids’ difference of two consecutive iterations are not the same
End
The number of distance calculations in the convectional K-means algorithm increases as the data points in a dataset increase. This increases the computation time of the algorithm. As a result, the classical K-means scalability in terms of a high-dimensional datasets is poor. There is a significant performance increase and efficiency in the K-means algorithm’s clustering process if the distance calculations required are significantly reduced.
Some distance-calculation reduction strategies have been proposed in the literature. The use of Kd tree-based techniques was suggested by [48,49] and the single pass method is another strategy proposed by [50,51]. For these two techniques, the uniformity of the cluster centroid is not guaranteed. In view of this, Jin et al. [52] proposed the exact method, which corrects the approximate cluster centroid as an improvement on the earlier techniques. In Domingos and Hulten. [53], a general framework for scaling machine learning algorithms was developed and applied to K-means. The objective was to develop a system that guarantees results close to what is obtainable for infinite data points while minimizing the running time. Their method is based on computation of bounds for the loss as a function of the number of data points used at each step.
A distance-calculation reduction strategy inferred from the classical central limit theorem was proposed by [54]. It involves making inferences from a few small samples of data points to avoid exhaustive comparisons between the data points and centroids. This method is incorporated in this hybridization of K-means with the FA for automatic clustering of high-dimensional datasets.

3.3. The Central Limit Theorem

The classical central limit theorem (CLT) is fundamental and popular in probability theory and inferential statistics. It is mostly applicable in many practical scenarios where the exhaustive study of the entire population of interest is not feasible. In CLT, samples from large populations are used to draw a meaningful conclusion about the population. The central limit theorem states that “Given a population with a mean μ and standard deviation σ , regardless of the distribution of the population; the distributions of means μ 1     μ n , of n samples of size s collected from the population approaches a normal distribution with mean μ and standard deviation σ s as n , s ”.
The statistical tradition for sample size given as n , s 30 is considered sufficiently large enough for the inference to be true [54]. According to Olukanmi et al. [54], the K-means algorithm is a particular case of the classical CLT with k = 1 (which can be generally inferred for other values of k) where the entire dataset is regarded as a single cluster k with the μ representing the centroid. In K-means clustering, the central μ for the entire population can be obtained by clustering several data samples from the entire population to find the means μ 1     μ n of n samples of size s which represents the centroids of the n data samples. Clustering the collection of the n data sample means μ 1     μ n (the centroids for the sample means) using k = 1 produces a central mean μ of the entire population as n , s grows in value.
Based on this basic understanding of the central limit theorem and its inference on the design of the K-means algorithm, the CLT-based version follows these simple steps [54]:
i.
Select n number of samples such that n , s   30 .
ii.
Use the K-means algorithm on the selected data samples and store the cluster centroids of each sample.
iii.
Combine the n numbered cluster centroids obtained from step 2 to produce a new population of cluster centroids of size nk.
iv.
Perform the data assignment step using the centroids obtained from step 3.
The pseudocode for the basic steps of the CLT-based K-means algorithm is given in Algorithm 3.
Algorithm 3: Pseudocode for CLT-based K-means
Input:


Output:
1
2
3
4
5
6
7
8
9
10
11
12
13
14
15
16
17
18
19
20
21
22
23
24
25
26
27
28
29
30
31
32
33
34
35
36
37
38
39
40
41
42
43
44
45
46
47
Array D { d 1 , d 2 , , d n }    //input Dataset
                                                          k           //specified number of clusters
         ns          //number of samples
         ss          //sample size
F C C = { f c c 1 , f c c 2 , , f c c k } //final cluster centroids
For I = 1 to  n s
    //Generate random samples from dataset
                          S A ( i ) = D a t a s a m p l e   ( D S , s s )     //select Sample Dataset randomly
   //Generate optimal cluster centroids for the data sample
   //Run K-means algorithm on the data sample
Begin
    //Parameter Initialization
                          S A ( i ) = (   s a 1 , s a 2 , , s a s s } )     //dataset
                        R S A C C ( i ) = (   r s a c c 1 , r s a c c 2 , , r s a c c k   } ) //Select initial cluster centroids randomly
    Do
    //Calculations of Distance
        for i = 1 to ss do
          for  j = 1   t o   k do
            Compute data objects’ Euclidean distance to all cluster centroids
           end  j
    //Data object assignment to clusters
          Assign data objects to the closest cluster
         end i
    //Updating cluster centroids

      2Evaluate the new cluster centroid
                              I F C C ( i ) = { i f c c 1 , i f c c 2 , , i f c c k }
    While cluster centroids’ difference of two consecutive iterations are not the same
 //Keep the generated sample cluster centroids as a representative dataset
    Add the generated sample cluster centroid to the existing collation of cluster centroids
                          I F C C = {   i f c c 1 , i f c c 2 , , i f c c k × n s } End
   //
  //Generate final cluster centroids from the combined cluster centroids obtained from each data sample
                                I F C C = { i f c c 1 , i f c c 2 , , i f c c k × n s }
    //Run K-means on collated cluster centroids as the new datasets
Begin
     //Parameter Initialization
                                I F C C = {   i f c c 1 , i f c c 2 , , i f c c k × n s } //collated cluster centroids form the new dataset
                              R I F C C = (   r i f c c 1 , r i f c c 2 , , r i f c c k   } ) //Select initial cluster centroids randomly
    Do
    //Calculations of distance
        for i = 1   t o   ( n s × k ) do
          for j = 1 to k do
            Compute data objects’ Euclidean distance to all clusters
          end  j
    //Data object Assignment to clusters
         Assign data objects to the closest cluster
       end  i
    //Updating Cluster centroid
      Evaluate the new cluster centroid
    While cluster centroids’ difference of two consecutive iterations are not the same
End

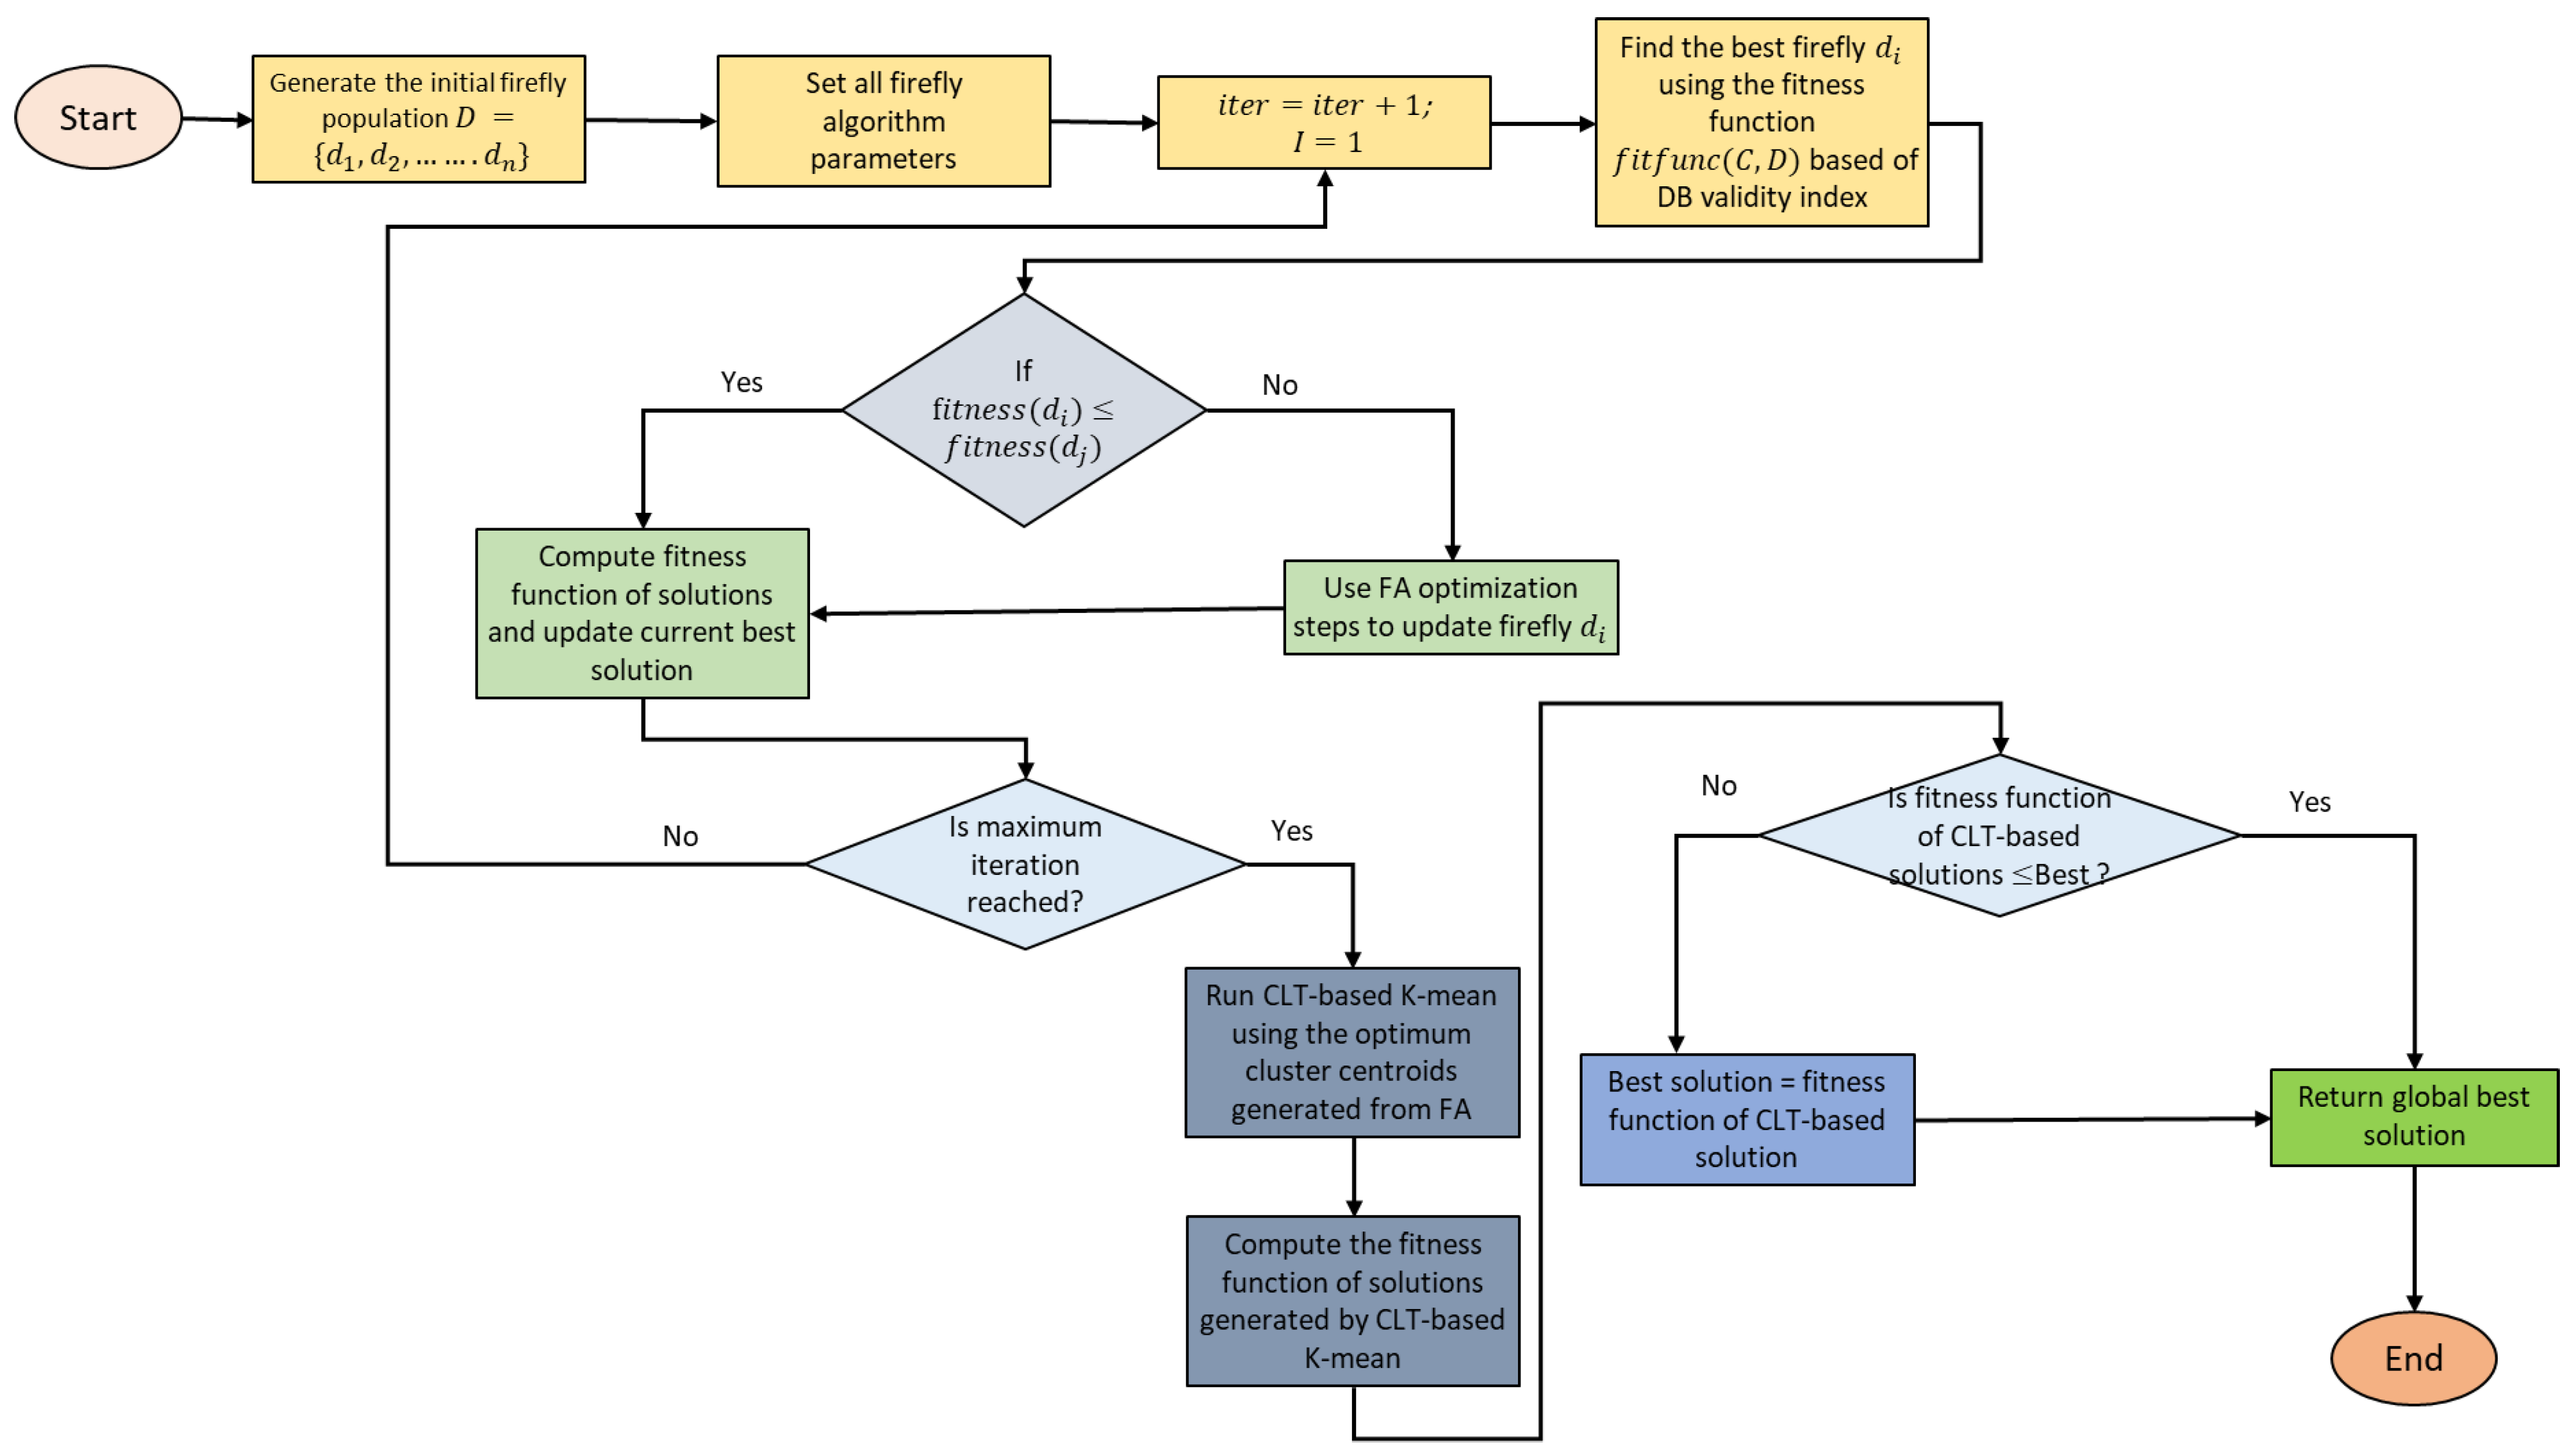
3.4. The Proposed CLT-Based FA-K-Means Model

The proposed improved hybridized algorithm focuses on improving the scalability of the FA-K-means algorithm on high-dimensional datasets. The advantages of FA and K-means have been combined and enhanced by reducing the computation time required for clustering datasets with massive data points and those with higher dimensions. An improved FA suggested by [38] introduced a mutation priority into the classical FA to maintain a good exploitation and exploration balance during the search process. The improved FA increases convergence speed, population diversity, and classical FA’s solution accuracy.
For the implementation strategy of our algorithm, the search process is initiated by the FA for a global search of the search space. This is preferred because of its ability for strong exploration of the search space. The K-means is then used as a local search algorithm for intense exploitation around the promising region, thus enhancing the intensification process of the proposed hybrid algorithm. The proposed hybrid algorithm’s efficiency and effectiveness are measured using the DBI discussed in the next section. The DBI assists in finding the best partition and also assists in determining the optimal number of clusters.
The search process commences by generating an initial population of fireflies, each representing a candidate solution. The fitness of each candidate solution is evaluated using the DBI cluster validity index. Subsequently, in an iterative manner, new solutions with the best fitness values are updated using the operators of the firefly algorithm. The results obtained from the first phase are improved using the K-means algorithm. The best results generated by the FA algorithm are passed on to the K-means algorithm as its initial cluster centroids. The execution of the two phases to convergence forms a complete run cycle of the proposed algorithm. The best fitness with the smallest DBI value of the two cycles is compared, and the best of the two is selected as the optimal value for the run. The steps illustrated above are depicted in Algorithm 4, and the implementation flowchart of the proposed algorithm is presented in Figure 1.
Algorithm 4: Pseudocode for the HFA-K-means Algorithm
Input:

Output:
1
2
3
4
5
6
7
8
9
10
11
12
13
14
15
16
17
18
19
20
21
22
23
24
25
26
27
28
29
30
Data   point   D = { d 1 ,   d 2 , , d n }

Optimal   Cluster   centers   O C C = { o c c 1 ,   o c c 2 , o c c n }
Begin
Randomly   create   a   k number of cluster centres as the initial population
Evaluate   the   objective   function   using   the   DB   cluster   validity   index
for i = 1   t o   n
   Compute   the   cost   function   to   determine   the   best   individual   using   the   Euclidean   distance
   if current   P o p ( i ) . C o s t < = B e s t S o l . C o s t
     Update   Current   P o p ( i ) as the best solution;
   end   if
end for
while iteration is not more than the maximum do
   for   i = 1   t o   n
      for j = 1 to n
       if   P o p ( j ) < P o p ( i ) . C o s t
         Use   the   firefly   operators   to   move   P o p ( i )   towards   P o p ( j )
         if   N e w S o l . C o s t < = N e w P o p ( i ) . C o s t
            NewPop(i)   is   made   the   new   solution ;
           if NewPop(i).Cost <= BestSol.Cost
             Update NewPop(i) as the new solution
           end   if
         end   if
       end   if
     end   For
   end   for
end while
Apply CLT-based K-means using output from FA
Compute cost function using optimal clusters from CLT-based K-means
  if   C L T K m e a n s . C o s t < = B e s t S o l . C o s t
    B e s t S o l . C o s t = C L T K m e a n s . C o s t
 end if
end

3.5. Davies Bouldin Index

The Davies Bouldin index (DBI) is a cluster validity index introduced by [34]. In the DBI, the quality of clustering is evaluated using the mean distances of data points from the centroid (intra-cluster distance) and the mean distances between the cluster centroids (inter-cluster distance) based on Equation (9).
Y i = [ 1 A i C A i Z ( P , c i ) t ] 1 t
where Z ( P ,   c i ) represents the distance between the data points in A i and its centroid c i and t   1 represents an independently selected integer. The value Y i is the average Euclidean distance of the objects from the centroid with the cluster when the value of t = 1 . However, when the value of t = 2 , Yi represents the standard deviation of the objects’ distances from the centroid within a cluster. If Lij represents the inter-cluster distance between two centroids c i and c j , then
L i j = Z ( c i , c j ) ,    i   j
let Z i be defined as:
Z i = m a x { Y i + Y j L i j | 1 i ,   j K ,   i j }
Then, the DBI is given as:
D B v a l ( A , Z ) = 1 K K 1 Z i
where K is the number of clusters.

3.6. Computational Complexity of the HFA-K-Means Algorithm

The proposed HFA-K-means clustering method is simple in terms of complexity, making it easy to implement for the problem at hand. The HFA-K-means is designed to retain the two inner loop structures of the classical FA when going through the population n and one outer loop for evaluation in terms of the maximum number of function evaluations (MaxFE). So, the complexity in the extreme case is as of the standard FA, which is O ( n 2 M a x F E ) . Moreover, as n is small (typically the value of n = 25 in our case), and MaxFE is large (MaxFE = 50,000), the computation cost is relatively inexpensive because the algorithm complexity is linear in terms of MaxFE. Therefore, considering the clustering objective, in this case, the algorithm’s overall computational complexity is O ( n . K . M a x F E ) .

4. Experimentation, Performance Evaluation, and Discussion

This section discusses the experimental configuration of the proposed enhanced HFA-K-means with the parameter settings for its performance evaluation. The benchmark datasets used in validating the HFA-K-means are also described. The simulation results and discussion on the proposed algorithm are presented alongside its comparison with other results found in the literature.

4.1. System Configuration

Experiments were carried out using a 2.80 GHz Intel® Core™ i7-1165 processor with 8 GB RAM on the Windows 11 OS Version 21H2. The proposed algorithm was programmed in MATLAB R2020b and used the IBM SPSS statistics Version 25 to validate the experimental results’ statistically significant differences.

4.2. Parameter Settings

The proposed HFA-K-means algorithm was set up using the following parameter settings: the population size is set using the established statistical tradition of a population size 30. Therefore, a population size of n = 40 + 2k is adopted for the FA algorithm and for the size of the dataset subsets used in the K-means phase of the HFA-K-means algorithm. The MaxFE (maximum function evaluation) is 50,000; mutation coefficient m is 2; attraction coefficient β is 2, the coefficient for light absorption γ is 1; and the damping ratio α for the mutation coefficient is 1. The parameter configuration for the different algorithms is detailed in Table 1.

4.3. Data Sets

The characteristics of data samples, such as dimensionality, data distribution, and noise, significantly influence the performance of clustering algorithms. Given this, 20 datasets from different domains with various characteristics were used to investigate the proposed algorithm’s efficiency. Specifically, among the datasets are 12 synthetically generated high-dimensional datasets, including three A-datasets (A1, A2, and A3), three Birch datasets (Birch1, Birch 2, and Birch 3), two DIM datasets (DIM002 and DIM1024) and four S-datasets (S1, S2, S3, and S4). The A-datasets and the Birch datasets are two-dimensional, with the A-datasets having varying clusters: 20, 35, and 50, respectively, while the Birch datasets have a uniform number of clusters which is 100, each with varying structures. The DIM 002 dataset has 15 dimensions with clusters, while the DIM1024 has 1024 dimensions with 16 clusters characterized by well-separated clusters. The S-datasets are spatial-distribution-based two-dimensional datasets with 15 clusters of varying complexity. Additionally, included among the datasets are two high-dimensional UCI datasets: Letter with 16 dimensions and 26 clusters, and Yeast with 8 dimensions and 10 clusters; two high-dimensional RGB images, Housec5 and Housec8, have 3 dimensions and 256 clusters, each having 34,112 data points. A two-dimensional shape set, D31, with 31 clusters was also included. Two-dimensional Mopsil-location datasets (Finland) with four clusters and one two-dimensional miscellaneous dataset with three clusters completed the number of datasets used. The summary of the 20 datasets is presented in Table 2.

4.4. Metrics for Performance Evaluation

At the first instance, experiments were conducted coupling seven other metaheuristic algorithms (ABC, IWO, SOS, TLBO, DE, PSO and genetic algorithm (GA)) with K-means using the same framework as the proposed HFA-K-means algorithm. Their performances were evaluated and compared with that of the proposed HFA-K-means algorithm over the 20 high-dimensional datasets using the DBI as the cluster validity index. This was to investigate the performance of the proposed HFA-K-means algorithm in comparison with these metaheuristic-based K-means hybrid algorithms in order to further justify its selection as the best option before its comparison with results from the literature. The experimental results of the performances of these seven metaheuristic-based K-means hybrid algorithms compared with the proposed HFA-K-means algorithm are presented in Table 3. The non-parametric Friedman mean rank test was also conducted to further validate the clustering solution of the various metaheuristic-based K-means hybrid algorithms. The results from the Friedman mean rank test are presented in Table 4.
The proposed HFA-K-means algorithm was compared with conventional metaheuristic search methods and other FA-based hybrid algorithms for a comprehensive and objective investigation of the clustering performance. The proposed algorithm was evaluated against classical FA, K-means, GA, DE, PSO, and IWO with four hybridized metaheuristics algorithms (FADE, PSODE, IWODE, Improved SOSK-means) and other FA variants (FAPSO, FATLBO, and FADE). The DBI was used to evaluate the proposed algorithm’s performance over 20 high-dimensional datasets with dimensions between 9 and 256 and dataset sizes between 1000 and 100,000, as shown in Table 2.
The summary of the results obtained by the proposed HFA-K-means for the clustering problem over 20 high-dimensional datasets is presented in Table 5. The results are presented to show the best, worst, average, and standard deviation values over 20 independent runs of each of the algorithms on 20 datasets. This signifies the optimal, the worst, the mean, and the standard deviation of the clustering solutions. The average computation time taken to achieve the optimal solution for the HFA-K-means is shown in Figure 2. To investigate the performance gain in terms of the computation time, the HFA-K-means computation time is compared with the computation time of a standard hybrid of FA and K-means. This is presented in Figure 3. The computation results of the HFA-K-means are compared with the classical FA and K-means algorithms. The summary of the results obtained by the proposed HFA-K-means compared with the classical FA and K-means algorithm for the problem at hand over 20 high-dimensional datasets is presented in Table 6.
The performance of the HFA-K-means is also compared with results from the literature. The mean and standard deviation metrics from experiments in this study and that available in the literature are used for the comparisons. There are three categories of comparisons with results from the literature. The first category compares with classical metaheuristics algorithms GA, DE, PSO, and IWO. This is presented in Table 7. The second category compares HFA-K-means with other hybrid metaheuristics algorithms: ISOSK-means, PSODE, FADE, and IWODE, as shown in Table 8. A comparison with other FA-based hybrid metaheuristics algorithms, FADE, FAPSO, and FATLBO, is considered in the third category. This can be seen in Table 9.
In comparing the performance of the proposed HFA-K-means with other algorithms, the solution quality determined by the DBI, which was used as the clustering objective during the program execution, was used. The clustering solutions are recorded using four decimal place values, and optimal clustering solutions are marked in boldface to indicate which algorithm produced the optimal clustering solution for each dataset.
For validating the significant difference between the clustering results produced by the separate algorithms statistically, the Friedman statistical test with the Wilcoxon post hoc test was performed. The results of both tests are presented and recorded in Table 10 and Table 11, respectively.

4.5. Results and Discussion

The experimental results presented in Table 3 indicate that the proposed HFA-K-means algorithm had the lowest mean clustering value of 0.5522 for all the 20 high-dimensional datasets. This indicates that the proposed algorithm averagely performed better compared to the other seven metaheuristic-based K-means algorithms. The proposed HFA-K-means algorithm and PSO-based K-means recorded best results in five of the datasets each while the best performance records for the other ten datasets were shared among the other competing K-means-based hybrid algorithms. The Friedman mean rank test result of the eight competing algorithms presented in Table 4 also shows that the proposed HFAK-means algorithm ranked better with the lowest mean rank of 2.48 to further justify its superior performance over the PSO-based K-means that recorded a mean rank of 3.67.
The computation results shown in Table 5 show that the proposed HFA-K-means can cluster high-dimensional datasets efficiently. The high convergence rate of the HFA-K-means is reflected in Figure 2, showing the average computation time required to achieve convergence. In comparison with the classical FA and K-means algorithms, as shown in Table 4, the proposed HFA-K-means recorded the best performance in 16 of the 20 datasets, namely, A1, A2, Birch1, Birch2, Birch3, Bridge, D31, DIM1024, Housec5, Housec8, Finland, S1, S2, S3, S4, and T4.8k. HFA-K-means recorded ties with FA in the remaining ones, namely A3, DIM002, Letter, and Yeast. In terms of average performance across all the 20 datasets, the HFA-K-means recorded the lowest value, followed by the FA. The lesser values of HFA-K-means compared with FA and K-means in most datasets show better performance. Based on this, we can infer that HFA-K-means can effectively and efficiently automatically cluster high-dimensional datasets.
Table 7 compares the proposed algorithm with other classical metaheuristic algorithms. The results show that HFA-K-means demonstrated the best performance in f14 datasets, namely, A1, A2, Birch2, Birch3, Bridge, D31, DIM1024, Housec5, Housec8, Letter, Finland, S3, T4.8k, and Yeast. PSO outperformed the HFA-K-means in three datasets, namely A3, S2, and S4. The remaining algorithms, GA, DE, and IWO, outperformed the HFA-K-means in one dataset, namely S1, Birch1, and DIM002, respectively. HFA-K-means had the minimum average clustering results compared with the classical metaheuristic algorithms. This shows that the proposed HFA-K-means demonstrates superior performance over all the other competing metaheuristic algorithms.
Table 8 compares the HFA-K-means with other hybrid algorithms, namely ISOS-K-means, PSODE, FADE, and IWODE. From the table, HFA-K-means also shows the best optimal solutions in 14 datasets, namely, A1, A2, Birch2, Birch3, Bridge, D31, DIM1024, Housec5, Housec8, Letter, Finland, S3, T4.8k, and Yeast. PSODE recorded a better performance in S1, S2, and S4, while FADE performed better on the A3, Birch1, and DIM002 datasets. The minimum average clustering result across the 20 datasets was recorded by HFA-K-means followed by FADE, ISOSK-means, PSODE, and IWODE. This indicates that HFA-K-means had performance superiority compared with other competing hybrid metaheuristic algorithms.
The HFA-K-means algorithm was also compared with three other FA-based hybrid metaheuristic algorithms, FAPSO, FADE, and FATLBO, on seven high-dimensional datasets, as shown in Table 8. From the results, the HFA-K-means recorded superior performance in five of the seven datasets, namely, Birch2, Birch3, Bridge, Housec5, and Housec8. FAPSO demonstrated better performance in the Birch 1 and Letter datasets. HFA-K-means again recorded the smallest average clustering solution across the seven datasets, followed by FAPSO. Based on this, it can be stated that on the basis of comparison of all the FA-based hybrid metaheuristic algorithms, it is evident that the HFA-K-means had superior performance.
Furthermore, in terms of comparison of HFA-K-means with the K-means-based algorithm ISOSK-means, it can be seen from Table 8 that HFA-K-means outperformed its counterpart in all except one of the datasets, namely, DIM002. This shows that the improvement in the K-means contributes substantially to the superior performances recorded by the HFA-K-means algorithm.
In Figure 3, the performance gain in the computation time using the CLT-based K-means in the proposed hybrid algorithm is clearly demonstrated against the regular hybrid of FA and K-means. The HFA-K-means recorded a lower computation time to achieve convergence than its standard FA-K-means counterpart in all 20 datasets.

4.6. Statistical Analysis Tests

To further validate the results of the clustering solutions of the proposed HFA-K-means, a nonparametric test was performed using the Friedman rank-sum test. This test identifies significant differences and was used in this study to draw statistically meaningful conclusions about the performance claims of the proposed algorithm reported earlier in the previous section. The report of the Friedman rank-sum test for the HFA-K-means and the two classical algorithms tested across the 20 datasets for the 20 algorithm runs is presented in Table 10. The report shows that the HFA-K-means had the best performance having the lowest rank value of 1 and highest rank value of 1.5 compared to FA and K-Means. The FA recorded a minimum rank value of 1.53 and a maximum rank value of 2.0, while the K-means had its minimum and maximum rank values as 3.0.
An additional post hoc test was performed on the Friedman rank-sum test using the Wilcoxon signed-rank test to verify the significant differences between the algorithms. The Wilcoxon signed-rank test presents p values for determining the significant differences between the competing algorithms. The p-values were tested against the significant value of 0.05, meaning that if the p-value is larger than 0.05, there is no significant difference between the two algorithms. The results of the Wilcoxon signed-rank test presented in Table 11 clearly show significant differences in the performance of the representative algorithms. From the report, it can be clearly stated that HFA-K-means achieved a significant performance improvement in clustering high-dimensional datasets over the classical K-means algorithm in all the datasets and over the FA in 11 of the 20 datasets.

5. Conclusions

In this study, a new HFA-K-means algorithm has been proposed and successfully implemented to cluster high-dimensional datasets automatically. The idea of the CLT was incorporated into the K-means phase of the hybrid algorithm to reduce the number of distance calculations required by the K-means algorithm. A mutation probability was also introduced into the FA phase to improve the exploitation and exploration of the FA. An initial investigative experiment conducted using another seven metaheuristic-based K-means hybrid algorithms modelled using the same framework as the proposed algorithm further confirmed the superior performance of the FA for automatic clustering, thus justifying its selection among other metaheuristic algorithms. The non-parametric mean rank test conducted on the experimental results of the eight metaheuristic-based K-means hybrid algorithms provided a further justification for the selection of FA among the other metaheuristic algorithms. The results obtained from the other computation experiments over the 20 high-dimensional datasets clearly show that the HFA-K-means algorithm demonstrates outstanding performance compared with the two classical algorithms, FA and K-means. Statistical tests were conducted on the simulation results to confirm the performance of the proposed hybrid algorithm, namely, the Friedman mean rank test and Wilcoxon rank-sum (a post hoc) test. A comparison of the results with other metaheuristics algorithms from the literature (GA, DE, PSO, and IWO) and other similar hybrid algorithms (SOSK-means, PSODE, FADE, and IWODE) was also performed. The proposed algorithm recorded superior results in 13 (65%) out of the 20 datasets compared with the other metaheuristics and hybrid metaheuristic algorithms. The numerical results were also compared with different FA-based hybrid algorithms from the literature, namely, FAPSO, FADE, and FATLBO, on seven high-dimensional datasets. The results showed that the proposed algorithm had superior performance in five of the seven datasets in terms of the quality of clustering solutions obtained. This indicates that the HFA-K-means performed well in 71% of the total datasets used for the comparison. The computational time for the proposed algorithm was also compared with regular FAK-means, and there was a substantial reduction in the computation time of the proposed HFAK-means over all the 20 high-dimensional datasets. These confirm that the adoption of the CLT in the K-means phase of the proposed algorithm assists in the reduction in the computation time, thereby enhancing the performance of the proposed algorithm in terms of reduced computational cost. The modified CLT-based K-means can be substituted for the standard K-means algorithm in many of the existing applications where it has been used to improve the clustering performance in various domains. For future study, the modified CLT-based K-means can be combined with other metaheuristic algorithms for respective hybridization models. Additionally, a further computation time reduction in the FA phase can be explored by incorporating Levy flights into the algorithm update phase to increase the fireflies’ movement, thereby reducing the foraging time of the fireflies. Moreover, further comparative analysis and performance studies involving FA-based hybrid algorithms and K-means-based metaheuristic algorithms can be carried out. Aside these, the proposed algorithm can also be applied to other real-life applications.

Author Contributions

All authors contributed to the conception and design of the research work. Material preparation, experiments, and analysis were performed by A.M.I. and A.E.E. All authors have read and agreed to the published version of the manuscript.

Funding

This research received no external funding.

Institutional Review Board Statement

Not applicable.

Informed Consent Statement

Not applicable.

Data Availability Statement

Not applicable.

Conflicts of Interest

The authors declare that they have no known competing financial interests or personal relationships that could have appeared to influence the work reported in this article.

References

  1. Esmin, A.A.A.; Coelho, R.A.; Matwin, S. A review on particle swarm optimization algorithm and its variants to clustering high-dimensional data. Artif. Intell. Rev. 2015, 44, 23–45. [Google Scholar] [CrossRef]
  2. Von Luxburg, U. A tutorial on spectral clustering. Stat. Comput. 2007, 17, 395–416. [Google Scholar] [CrossRef]
  3. Kriegel, H.-P.; Kröger, P.; Zimek, A. Clustering high-dimensional data: A survey on subspace clustering, pattern-based clustering, and correlation clustering. ACM Trans. Knowl. Discov. Data 2009, 3, 1–58. [Google Scholar] [CrossRef]
  4. McCallum, A.; Nigam, K.; Ungar, L.H. Efficient clustering of high-dimensional data sets with application to reference matching. In Proceedings of the Sixth ACM SIGKDD International Conference on Knowledge Discovery and Data Mining, Boston, MA, USA, 20–23 August 2000; pp. 169–178. [Google Scholar] [CrossRef]
  5. Agarwal, P.; Mehta, S.; Abraham, A. A meta-heuristic density-based subspace clustering algorithm for high-dimensional data. Soft Comput. 2021, 25, 10237–10256. [Google Scholar] [CrossRef]
  6. Punhani, A.; Faujdar, N.; Mishra, K.K.; Subramanian, M. Binning-Based Silhouette Approach to Find the Optimal Cluster Using K-Means. IEEE Access 2022, 10, 115025–115032. [Google Scholar] [CrossRef]
  7. Ikotun, A.M.; Ezugwu, A.E. A comprehensive survey of K-means clustering algorithm and analysis of variants. Inf. Sci. 2022; in press. [Google Scholar]
  8. Xie, T.; Liu, R.; Wei, Z. Improvement of the Fast Clustering Algorithm Improved by K-Means in the Big Data. Appl. Math. Nonlinear Sci. 2020, 5, 1–10. [Google Scholar] [CrossRef] [Green Version]
  9. Alguliyev, R.M.; Aliguliyev, R.M.; Sukhostat, L.V. Parallel batch k-means for Big data clustering. Comput. Ind. Eng. 2021, 152, 107023. [Google Scholar] [CrossRef]
  10. Zhang, G.; Zhang, C.; Zhang, H. Improved K-means algorithm based on density Canopy. Knowl.-Based Syst. 2018, 145, 289–297. [Google Scholar] [CrossRef]
  11. Alguliyev, R.; Aliguliyev, R.; Bagirov, A.; Karimov, R. Batch clustering algorithm for big data sets. In Proceedings of the 2016 IEEE 10th International Conference on Application of Information and Communication Technologies (AICT), Baku, Azerbaijan, 12–14 October 2016; pp. 1–4. [Google Scholar] [CrossRef]
  12. Olukanmi, P.O.; Nelwamondo, F.; Marwala, T. k-Means-Lite: Real Time Clustering for Large Datasets. In Proceedings of the 2018 5th International Conference on Soft Computing & Machine Intelligence (ISCMI), Nairobi, Kenya, 21–22 November 2018; pp. 54–59. [Google Scholar] [CrossRef]
  13. Islam, Z.; Estivill-Castro, V.; Rahman, A.; Bossomaier, T. Combining K-Means and a genetic algorithm through a novel arrangement of genetic operators for high quality clustering. Expert Syst. Appl. 2018, 91, 402–417. [Google Scholar] [CrossRef]
  14. Sinha, A.; Jana, P.K. A hybrid MapReduce-based k-means clustering using genetic algorithm for distributed datasets. J. Supercomput. 2018, 74, 1562–1579. [Google Scholar] [CrossRef]
  15. Zhang, H.; Zhou, X. A novel clustering algorithm combining niche genetic algorithm with canopy and K-means. In Proceedings of the 2018 International Conference on Artificial Intelligence and Big Data (ICAIBD), Chengdu, China, 26–28 May 2018; pp. 26–32. [Google Scholar] [CrossRef]
  16. Behera, H.S.; Nayak, J.; Nanda, M.; Nayak, K. A novel hybrid approach for real world data clustering algorithm based on fuzzy C-means and firefly algorithm. Int. J. Fuzzy Comput. Model. 2015, 1, 431. [Google Scholar] [CrossRef]
  17. Paul, S.; De, S.; Dey, S. A Novel Approach of Data Clustering Using An Improved Particle Swarm Optimization Based K–Means Clustering Algorithm. In Proceedings of the 2020 IEEE International Conference on Electronics, Computing and Communication Technologies (CONECCT), Bangalore, India, 2–4 July 2020; pp. 1–6. [Google Scholar] [CrossRef]
  18. Kaur, A.; Pal, S.K.; Singh, A.P. Hybridization of K-Means and Firefly Algorithm for intrusion detection system. Int. J. Syst. Assur. Eng. Manag. 2017, 9, 901–910. [Google Scholar] [CrossRef]
  19. Pavez, L.; Altimiras, F.; Villavicencio, G. A K-means Bat Algorithm Applied to the Knapsack Problem. In Proceedings of the Computational Methods in Systems and Software; Springer: Cham, Switzerland, 2020; pp. 612–621. [Google Scholar] [CrossRef]
  20. Kumari, G.V.; Rao, G.S.; Rao, B.P. Flower pollination-based K-means algorithm for medical image compression. Int. J. Adv. Intell. Paradig. 2021, 18, 171. [Google Scholar] [CrossRef]
  21. Wang, X.; Yu, H.; Lin, Y.; Zhang, Z.; Gong, X. Dynamic Equivalent Modeling for Wind Farms With DFIGs Using the Artificial Bee Colony With K-Means Algorithm. IEEE Access 2020, 8, 173723–173731. [Google Scholar] [CrossRef]
  22. Ikotun, A.M.; Almutari, M.S.; Ezugwu, A.E. K-Means-Based Nature-Inspired Metaheuristic Algorithms for Automatic Data Clustering Problems: Recent Advances and Future Directions. Appl. Sci. 2021, 11, 11246. [Google Scholar] [CrossRef]
  23. Ikotun, A.M.; Ezugwu, A.E. Boosting k-means clustering with symbiotic organisms search for automatic clustering problems. PLoS ONE 2022, 17, e0272861. [Google Scholar] [CrossRef]
  24. Yang, X. Firefly Algorithms for Multimodal Optimization. Stoch. Algorithms Found. Appl. 2009, 5792, 169–178. [Google Scholar]
  25. Fister, I.; Fister, I., Jr.; Yang, X.S.; Brest, J. A comprehensive review of firefly algorithms. Swarm Evol. Comput. 2013, 13, 34–46. [Google Scholar] [CrossRef] [Green Version]
  26. Agbaje, M.B.; Ezugwu, A.E.; Els, R. Automatic Data Clustering Using Hybrid Firefly Particle Swarm Optimization Algorithm. IEEE Access 2019, 7, 184963–184984. [Google Scholar] [CrossRef]
  27. Ariyaratne, M.K.A.; Fernando, T.G.I. A Comprehensive Review of the Firefly Algorithms for Data Clustering. Adv. Swarm Intell. 2022, 1054, 217–239. [Google Scholar]
  28. Kumar, V.; Kumar, D. A Systematic Review on Firefly Algorithm: Past, Present, and Future. Arch. Comput. Methods Eng. 2020, 28, 3269–3291. [Google Scholar] [CrossRef]
  29. Hassanzadeh, T.; Meybodi, M.R. A new hybrid approach for data clustering using firefly algorithm and K-means. In Proceedings of the 16th CSI International Symposium on Artificial Intelligence and Signal Processing (AISP 2012), Shiraz, Iran, 2–3 May 2012; pp. 007–011. [Google Scholar] [CrossRef]
  30. Mathew, J.; Vijayakumar, R. Scalable parallel clustering approach for large data using parallel K means and firefly algorithms. In Proceedings of the 2014 International Conference on High Performance Computing and Applications (ICHPCA), Bhubaneswar, India, 22–24 December 2014; pp. 1–8. [Google Scholar] [CrossRef]
  31. Nayak, S.; Panda, C.; Xalxo, Z.; Behera, H.S. An Integrated Clustering Framework Using Optimized K-means with Firefly and Canopies. In Computational Intelligence in Data Mining-Volume 2; Springer: New Delhi, India, 2015; pp. 333–343. [Google Scholar] [CrossRef]
  32. Nayak, J.; Naik, B.; Behera, H.S. Cluster Analysis Using Firefly-Based K-means Algorithm: A Combined Approach. In Computational Intelligence in Data Mining; Springer: Singapore, 2017; pp. 55–64. [Google Scholar] [CrossRef]
  33. Xie, H.; Zhang, L.; Lim, C.P.; Yu, Y.; Liu, C.; Liu, H.; Walters, J. Improving K-means clustering with enhanced Firefly Algorithms. Appl. Soft Comput. 2019, 84, 105763. [Google Scholar] [CrossRef]
  34. Davies, D.L.; Bouldin, D.W. A Cluster Separation Measure. IEEE Trans. Pattern Anal. Mach. Intell. 1979, PAMI-1, 224–227. [Google Scholar] [CrossRef]
  35. Fister, I.; Yang, X.-S.; Fister, D. Firefly Algorithm: A Brief Review of the Expanding Literature. Cuckoo Search Firefly Algorithm 2014, 516, 347–360. [Google Scholar] [CrossRef]
  36. Senthilnath, J.; Omkar, S.; Mani, V. Clustering using firefly algorithm: Performance study. Swarm Evol. Comput. 2011, 1, 164–171. [Google Scholar] [CrossRef]
  37. Rajah, V.; Ezugwu, A.E. Hybrid Symbiotic Organism Search algorithms for Automatic Data Clustering. In Proceedings of the 2020 Conference on Information Communications Technology and Society (ICTAS), Durban, South Africa, 11–12 March 2020; pp. 1–9. [Google Scholar] [CrossRef]
  38. Ezugwu, A.E.-S.; Agbaje, M.B.; Aljojo, N.; Els, R.; Chiroma, H.; Elaziz, M.A. A Comparative Performance Study of Hybrid Firefly Algorithms for Automatic Data Clustering. IEEE Access 2020, 8, 121089–121118. [Google Scholar] [CrossRef]
  39. Bezdek, J.C.; Ehrlich, R.; Full, W. FCM: The fuzzy c-means clustering algorithm. Comput. Geosci. 1984, 10, 191–203. [Google Scholar] [CrossRef]
  40. Kumar, A.; Ingle, Y.S.; Pande, A.; Dhule, P. Canopy Clustering: A Review on Pre-Clustering Approach to K-Means Clustering. Int. J. Innov. Adv. Comput. Sci. (IJIACS) 2014, 3, 22–29. [Google Scholar]
  41. Jitpakdee, P.; Aimmanee, P.; Uyyanonvara, B. A Hybrid Approach for Color Image Quantization Using K-means and Firefly Algorithms. World Acad. Sci. Eng. Technol. 2013, 7, 142–149. [Google Scholar]
  42. Kuo, R.; Li, P. Taiwanese export trade forecasting using firefly algorithm-based K-means algorithm and SVR with wavelet transform. Comput. Ind. Eng. 2016, 99, 153–161. [Google Scholar] [CrossRef]
  43. Langari, R.K.; Sardar, S.; Mousavi, S.A.A.; Radfar, R. Combined fuzzy clustering and firefly algorithm for privacy preserving in social networks. Expert Syst. Appl. 2020, 141, 112968. [Google Scholar] [CrossRef]
  44. Yang, X.-S.; Deb, S.; Zhao, Y.-X.; Fong, S.; He, X. Swarm intelligence: Past, present and future. Soft Comput. 2018, 22, 5923–5933. [Google Scholar] [CrossRef] [Green Version]
  45. Jain, A.K.; Murty, M.N.; Flynn, P.J. Data clustering: A review. ACM Comput. Surv. (CSUR) 1999, 31, 264–323. [Google Scholar] [CrossRef]
  46. Jain, A.K.; Dubes, R.C. Algorithms for Clustering Data; Prentice-Hall, Inc.: Hoboken, NJ, USA, 1988. [Google Scholar]
  47. Jain, A.K. Data clustering: 50 years beyond K-means. Pattern Recognit. Lett. 2010, 31, 651–666. [Google Scholar] [CrossRef]
  48. Pelleg, D.; Moore, A. Accelerating exact k-means algorithms with geometric reasoning. In Proceedings of the Fifth ACM SIGKDD International Conference on Knowledge Discovery and Data Mining, San Diego, CA, USA, 15–18 August 1999; pp. 277–281. [Google Scholar]
  49. Alsabti, K.; Ranka, S.; Singh, V. An Efficient K-Means Clustering Algorithm. 1997. Available online: https://surface.syr.edu/eecshttps://surface.syr.edu/eecs/43 (accessed on 7 October 2020).
  50. Nittel, S.; Leung, K.; Braverman, A. Scaling clustering algorithms for massive data sets using data streams. In Proceedings of the International Conference on Data Engineering, Boston, MA, USA, 30 March–2 April 2004; Volume 20, p. 830. [Google Scholar] [CrossRef]
  51. Bradley, P.S.; Fayyad, U.; Reina, C. Scaling EM Clustering to Large Databases Scaling EM (Expectation-Maximization) Clustering to Large Databases. Electr. Eng. Comput. Sci.—All Scholarsh. 1998, 43, 0–25. Available online: https://surface.syr.edu/eecs/43 (accessed on 8 October 2022).
  52. Jin, R.; Goswami, A.; Agrawal, G. Fast and exact out-of-core and distributed k-means clustering. Knowl. Inf. Syst. 2006, 10, 17–40. [Google Scholar] [CrossRef] [Green Version]
  53. Domingos, P.; Hulten, G. A General Method for Scaling up machine learning algorithm and its application to clustering. In Proceedings of the Eighteenth International Conference on Machine Learning, Williamstown, MA, USA, 28 June–1 July 2001. [Google Scholar]
  54. Olukanmi, P.O.; Nelwamondo, F.; Marwala, T. Rethining k-means clustering in the age of massive datasets: A constant-time approach. Neural Comput. Applic. 2020, 32, 15445–15467. [Google Scholar] [CrossRef]
  55. José-García, A.; Gómez-Flores, W. Automatic clustering using nature-inspired metaheuristics: A survey. Appl. Soft Comput. 2016, 41, 192–213. [Google Scholar] [CrossRef]
  56. Ezugwu, A.E. Nature-inspired metaheuristic techniques for automatic clustering: A survey and performance study. SN Appl. Sci. 2020, 2, 273. [Google Scholar] [CrossRef] [Green Version]
  57. Cheng, M.-Y.; Prayogo, D. Symbiotic Organisms Search: A new metaheuristic optimization algorithm. Comput. Struct. 2014, 139, 98–112. [Google Scholar] [CrossRef]
  58. Das, S.; Konar, A. Automatic image pixel clustering with an improved differential evolution. Appl. Soft Comput. 2009, 9, 226–236. [Google Scholar] [CrossRef]
  59. Bandyopadhyay, S.; Maulik, U. Nonparametric genetic clustering: Comparison of validity indices. IEEE Trans. Syst. Man Cybern. Part C (Appl. Rev.) 2001, 31, 120–125. [Google Scholar] [CrossRef] [Green Version]
  60. Zhou, X.; Gu, J.; Shen, S.; Ma, H.; Miao, F.; Zhang, H.; Gong, H. An Automatic K-Means Clustering Algorithm of GPS Data Combining a Novel Niche Genetic Algorithm with Noise and Density. ISPRS Int. J. Geo-Inf. 2017, 6, 392. [Google Scholar] [CrossRef]
  61. Bandyopadhyay, S.; Maulik, U. Genetic clustering for automatic evolution of clusters and application to image classification. Pattern Recognit. 2002, 35, 1197–1208. [Google Scholar] [CrossRef]
  62. Kumar, V.; Chhabra, J.K.; Kumar, D. Automatic Data Clustering Using Parameter Adaptive Harmony Search Algorithm and Its Application to Image Segmentation. J. Intell. Syst. 2016, 25, 595–610. [Google Scholar] [CrossRef]
  63. Liu, Y.; Wu, X.; Shen, Y. Automatic clustering using genetic algorithms. Appl. Math. Comput. 2011, 218, 1267–1279. [Google Scholar] [CrossRef]
  64. Lai, C.-C. A Novel Clustering Approach using Hierarchical Genetic Algorithms. Intell. Autom. Soft Comput. 2005, 11, 143–153. [Google Scholar] [CrossRef]
  65. Lin, H.-J.; Yang, F.-W.; Kao, Y.-T. An Efficient GA-based Clustering Technique. J. Appl. Sci. Eng. 2005, 8, 113–122. [Google Scholar]
  66. Anari, B.; Torkestani, J.A.; Rahmani, A. Automatic data clustering using continuous action-set learning automata and its application in segmentation of images. Appl. Soft Comput. 2017, 51, 253–265. [Google Scholar] [CrossRef]
  67. Kumar, V.; Chhabra, J.K.; Kumar, D. Automatic cluster evolution using gravitational search algorithm and its application on image segmentation. Eng. Appl. Artif. Intell. 2014, 29, 93–103. [Google Scholar] [CrossRef]
  68. Liu, R.; Zhu, B.; Bian, R.; Ma, Y.; Jiao, L. Dynamic local search based immune automatic clustering algorithm and its applications. Appl. Soft Comput. 2015, 27, 250–268. [Google Scholar] [CrossRef]
  69. Chowdhury, A.; Bose, S.; Das, S. Automatic Clustering Based on Invasive Weed Optimization Algorithm. In International Conference on Swarm, Evolutionary, and Memetic Computing; Springer: Berlin/Heidelberg, Germany, 2011; pp. 105–112. [Google Scholar] [CrossRef]
Figure 1. A flowchart for the proposed hybrid firefly algorithm-K-means clustering.
Applsci 12 12275 g001
Figure 2. Mean execution run time of HFA-K-means on DBI for 20 high-dimensional datasets over 20 runs.
Applsci 12 12275 g002
Figure 3. Mean execution run time of HFA-K-means and standard FA-K-means on DBI for 20 high-dimensional datasets over 20 runs.
Applsci 12 12275 g003
Table 1. Parameter Setting of Algorithms.
GA [55,56]ABC [25]DE [25]PSO [25]FA [24]IWO [25]TLBO [55]SOS [57]
ParameterValueParameterValueParameterValueParameterValueParameterValueParameterValueParameterValueParameterValue
n25n25n25n25n25n25n25n25
Pc, Pm0.8, 0.3a0.009CRmin, CRmax0.2, 1.0W1, W21.0, 0.99 β 0 2s5m2Pc0.2
MP0.02#nOn-looker bees 25F0.8 τ 1 , τ 2 1.5, 2.0 γ 1 Σ 1 , Σ 2 0.5, 0.001 Fl, Fu0.2, 0.8
Kmin2m2Kmin2Kmin2Kmin2 e 2 mr0.02
Kmax16MaxFE50,000Kmax256Kmax256Kmax256Kmax256
MaxFE50,000 MaxFE50,000MaxFE50,000MaxFE50,000MaxFE50,000MaxFE50,000MaxFE40 + 2k
Remarks: n: population size; Pc: crossover probability; Pm: mutation probability; W1: inertia weight; W2: inertia weight damping ratio; τ 1 : personal learning coefficient; τ 2 : global learning coefficient; Kmin and Kmax denote, respectively, the maximum and minimum number of clusters that can be encoded in a single trial solution vector for GA, DE, PSO, FA and IWO; CR: crossover rate; F: scaling factor; Fl: lower bound of scaling factor; Fu: upper bound of scaling factor; mr: mutation rate; MP: mutation probability; β 0 : attractiveness; γ : light absorption coefficient; e = variance reduction exponent; Σ 1 = initial value of standard deviation; Σ 2 = final value of standard deviation; s = maximum number of seeds. Note that FADE [19], PSODE [47], IWODE [47], FAPSO [19], and FATLBO [19] use the same parameter representation scheme as their respective standard algorithms as provided in the given references.
Table 2. The characteristics of twenty high-dimensional datasets.
DatasetsDataset TypesDimension of DataNumber of Data ObjectsNumber of ClustersReferences
A1Synthetically generated2300020[58,59,60]
A2Synthetically generated2525035[58,59,60]
A3Synthetically generated2750050[58,59,60]
Birch1Synthetically generated2100,000100[38,40,61]
Birch2Synthetically generated2100,000100[38,40,61]
Birch3Synthetically generated2100,000100[58,60,61]
BridgeGrey-scale image blocks164096256[60,62]
D31Shape sets2310031[60,63]
Dim002Synthetically generated2–151351–10,1269[58,60,64]
Dim1024High-dimensional1024102416[58,60,65]
Housec5RGB image334,112256[60,62]
Housec8RGB image334,112256[60,66]
LetterUCI dataset1620,00026[60,62]
FinlandMopsi locations213,4674[60,67]
S1Synthetically generated2500015[58,60,68]
S2Synthetically generated2500015[58,60,68]
S3Synthetically generated2500015[58,60,68]
S4Synthetically generated2500015[7,58,60,68]
T4.8kMiscellaneous280003[60,69]
YeastUCI dataset8148410[60,62]
Table 3. Computation results for Improved FA-K-means and other seven metaheuristic-based K-means hybrid algorithms on twenty high-dimensional datasets.
DatasetHFAK-Means HABCK-Means HIWOK-Means HSOSK-Means HTLBOK-Means HDEK-Means HPSOK-Means HGAK-Means
MinMaxMeanStd. DevMinMaxMeanStd. DevMinMaxMeanStd. DevMinMaxMeanStd. DevMinMaxMeanStd. DevMinMaxMeanStd. DevMinMaxMeanStd. DevMinMaxMeanStd. Dev
A10.24410.35030.29420.03040.28920.61230.57940.06910.23870.65500.29640.08660.25190.31260.27680.01940.24240.59020.29830.07170.26380.33230.28530.01480.25120.59010.30170.07200.59020.61160.59440.0087
A20.21860.44060.31550.07460.28650.68400.65940.08790.24450.42750.30270.04650.25300.46220.33440.05730.21980.51990.34070.09160.23490.67760.35950.10250.22260.40160.29540.04930.67760.67800.67780.0002
A30.79080.79220.79150.00070.77960.79290.78810.00360.77300.91720.84020.03220.81240.87430.84060.01810.79080.79700.79320.00260.79080.79220.79120.00050.79220.80190.79940.00370.79090.80430.79670.0054
Birch 10.77740.80180.80010.00530.77530.79650.78810.00590.80810.89960.83350.02040.81650.85770.83450.01430.80100.80180.80140.00030.80100.80180.80100.00020.80100.80250.80200.00050.80100.80340.80180.0006
Birch 20.15850.21540.18800.01980.50700.50820.50740.00040.16170.20710.18520.01170.15110.21700.18860.01920.16300.24900.19720.02310.17400.23180.19770.01550.14710.22260.19090.01670.50700.50710.50700.0000
Birch 30.61300.71600.65390.04210.71610.74380.72440.00820.51880.79730.62640.07470.46790.74130.66310.06900.51870.71390.61550.05780.42170.71600.61600.08820.49280.71790.61500.07220.71600.76600.73560.0223
Bridge0.32890.37140.34890.01320.52020.92660.65490.14710.31101.05760.52100.15090.31680.66700.50140.10960.30640.57950.36670.07510.30440.58100.35890.05670.32160.61170.42770.09300.46500.63050.59300.0551
D310.57730.79290.69230.06580.80170.85560.82710.01140.53850.83540.72510.08580.59060.87010.73740.08210.49450.83630.70560.08450.55030.79300.71340.06690.63150.84120.72900.06790.79300.85910.82360.0237
Dim0020.73090.73090.73090.00000.71600.78410.75630.01600.73090.84290.78620.03040.70460.90540.83950.05990.73090.76140.75520.01100.68720.73770.72930.01010.73090.79130.75470.02170.73110.79280.75860.0183
Dim10240.37171.15111.06980.17831.84251.90231.88140.01660.87001.96191.88970.24030.37012.03371.83500.39871.43231.57691.50230.03061.44951.62821.58080.05410.73682.05281.90860.39911.78551.83081.81220.0137
Housec50.24650.48080.32550.05720.51590.70180.61500.06220.27300.60190.34050.06710.23490.46490.33210.06690.25760.54000.35580.09270.28150.55570.49500.05280.28190.49870.33330.04640.49870.64450.60730.0643
Housec80.31310.47200.41640.04600.39410.57150.52640.03760.34870.51840.41130.04350.32460.70940.42760.08740.26890.52090.39260.05870.35190.48740.44010.04380.30090.47810.41100.04220.46440.52120.50970.0232
Letter0.75480.81570.79210.02310.84570.98140.93680.03590.62941.38851.15580.22530.21801.34600.95720.32560.34610.91890.81580.11670.77730.83050.80640.01460.77010.88800.82330.03460.80330.92840.86160.0261
Finland0.20420.47890.30610.09100.21930.49940.44240.05530.18330.71420.33270.13640.20000.66920.36280.12820.22120.43970.31050.07240.17970.43930.27990.07840.21530.57310.36320.13050.43930.57660.44730.0305
S10.68010.77670.77140.02150.76600.79030.77300.00570.66930.85650.80740.04030.63950.83800.80680.04280.75000.77670.77510.00600.77410.77670.77550.00110.58970.79690.76930.04250.77460.79730.78000.0053
S20.54120.98980.73320.12150.73820.77000.74530.00670.59910.79280.70820.06990.61730.82880.72910.06290.49080.74700.70290.07290.60720.73910.71030.05100.54690.74700.70530.05740.73920.74700.74470.0030
S30.37820.60380.50730.06410.71260.73050.71740.00470.38780.63520.48230.05990.38240.75270.48910.07730.38530.59730.48830.05290.38680.68380.49930.07270.38630.59550.48460.06000.71120.73050.71620.0063
S40.68020.76900.76450.01980.76840.78100.77610.00320.67140.83340.79620.03290.67840.81700.79280.03300.69510.76990.76410.01670.76900.76960.76910.00020.72290.78980.77260.01520.76930.78290.77730.0033
T4.8k0.01780.02270.02180.00200.02130.04270.03000.00670.01780.32290.12480.09900.01790.33410.15820.07830.01760.02270.02200.00170.01820.02270.02200.00160.01790.02270.02150.00200.02180.02270.02260.0002
Yeast0.43790.55590.52050.05700.58820.95830.82320.11410.23350.55690.52860.07840.76940.90570.86650.03000.22480.79310.62280.15140.23230.56600.48920.07450.20210.78690.55390.19920.29860.81310.66370.1409
Overall average0.45330.61640.55220.04670.64020.77170.72760.03490.46040.79110.63470.08160.44090.78030.64870.08900.46780.67760.58130.05450.50280.65810.58600.04000.45810.70050.60310.07130.66890.74240.71160.0225
Table 4. Friedman mean rank for the eight metaheuristic-based K-mean hybrid algorithms.
Metaheuristic-Based K-Means Hybrid AlgorithmMean Rank
HFAK-means2.48
HTLBOK-means3.21
HDEK-means3.36
HPSOK-means3.67
HIWOK-means4.90
HSOSK-means5.62
HABCK-means6.29
HGAK-means6.48
Table 5. Computation result for Improved FA-K-means on twenty high-dimensional datasets.
High-Dimensional DatasetsDB Index
BestWorstMean Std. Dev
A10.24410.35030.29420.0304
A20.21860.44060.31550.0746
A30.79080.79220.79150.0007
Birch10.77740.80180.80010.0053
Birch20.15850.21540.18800.0198
Birch30.61300.71600.65390.0421
Bridge0.32890.37140.34890.0132
D310.57730.79290.69230.0658
Dim0020.73090.73090.73090.0000
Dim10240.37171.15111.06980.1783
Housec50.24650.48080.32550.0572
Housec80.31310.47200.41640.0460
Letter0.75480.81570.79210.0231
Finland0.20420.47890.30610.0910
S10.68010.77670.77140.0215
S20.54120.98980.73320.1215
S30.37820.60380.50730.0641
S40.68020.76900.76450.0198
T4.8k0.01780.02270.02180.0020
Yeast0.43790.55590.52050.0570
Average0.45440.61640.55220.0464
Table 6. Comparison of HFA-K-means with FA and K-means over 20 independent program executions.
High-Dimensional DatasetsHFA-K-MeansFAK-Means
BestWorstMean Std. DevBestWorstMean Std. DevBestWorstMean Std. Dev
A10.24410.35030.29420.03040.59010.59010.59010.00000.77880.77880.77880.0000
A20.21860.44060.31550.07460.67760.67760.67760.00000.92290.92290.92290.0000
A30.79080.79220.79150.00070.79080.79220.79150.00071.24331.27931.26310.0184
Birch10.77740.80180.80010.00530.80100.80180.80130.00031.28751.28751.28750.0000
Birch20.15850.21540.18800.01980.50700.50700.50700.00000.58820.58820.58820.0000
Birch30.61300.71600.65390.04210.71600.71600.71600.00001.15921.17261.16500.0037
Bridge0.32890.37140.34890.01320.61080.61160.61130.00030.98760.98760.98760.0000
D310.57730.79290.69230.06580.79290.79290.79290.00001.34461.34461.34460.0000
Dim0020.73090.73090.73090.00000.73090.73090.73090.00001.15351.15351.15350.0000
Dim10240.37171.15111.06980.17830.94891.15111.11060.06253.42913.42913.42910.0000
Housec50.24650.48080.32550.05720.49870.64220.55610.07210.86780.86780.86780.0000
Housec80.31310.47200.41640.04600.46440.52090.50680.02510.63950.63950.63950.0000
Letter0.75480.81570.79210.02310.75480.81570.79210.02312.03552.03602.03590.0002
Finland0.20420.47890.30610.09100.43930.43930.43930.00000.54610.54610.54610.0000
S10.68010.77670.77140.02150.77430.77670.77620.00101.20481.34631.30440.0455
S20.54120.98980.73320.12150.73910.73910.73910.00001.12301.12301.12300.0000
S30.37820.60380.50730.06410.71110.71110.71110.00001.07501.07501.07500.0000
S40.68020.76900.76450.01980.76900.77710.76940.00181.23541.23541.23540.0000
T4.8k0.01780.02270.02180.00200.02270.02270.02270.00000.96490.96490.96490.0000
Yeast0.43790.55590.52050.05700.43790.55590.52050.05700.70841.78441.72570.2395
Average0.45440.61640.55220.04640.63890.66860.65810.01221.16471.22811.22190.0154
Table 7. Comparison of HFA-K-means with GA, DE, PSO, and IWO on twenty datasets.
High-Dimensional Datasets.HFA-K-MeansGADEPSOIWO
Mean Std. DevMean Std. DevMean Std. DevMean Std. DevMean Std. Dev
A10.29420.03040.69070.04200.60160.01160.66620.04240.63080.0265
A20.31550.07460.75490.02930.70810.03480.71340.02840.74830.0468
A30.79150.00070.77580.04180.73490.01840.72790.02870.75450.0339
Birch10.80010.00530.79760.03090.74800.01710.75280.01690.76440.0211
Birch20.19040.01740.61970.03610.50860.00160.58760.03580.51680.0052
Birch30.65770.06470.77180.04310.74880.02970.72130.03060.75680.0248
Bridge0.34890.0132--0.82920.05160.97860.13311.15750.0967
D310.69230.0658--0.87570.03020.76300.05140.78960.0312
Dim0020.73090.00000.67720.06640.66850.02630.58230.07720.66610.0403
Dim10241.06980.1783--1.76780.01141.82240.04812.01050.0193
Housec50.32550.0572--0.61900.04120.74560.06790.70340.0430
Housec80.41640.0460--0.52450.01390.64180.08580.62060.0546
Letter0.79210.0231--0.98520.03032.03540.10841.22450.0416
Finland0.30610.09100.44070.00090.45750.00820.57610.06300.50360.0398
S10.77140.02150.70060.02930.73630.01500.64720.04700.75720.0315
S20.73320.12150.74170.03930.72560.02210.68780.03180.76250.0296
S30.50730.06410.76820.03950.72650.01790.72610.02820.75670.0333
S40.76450.01980.76630.02400.76350.01800.74550.03160.78090.0191
T4.8k0.02180.00200.00230.00000.02280.000117.500422.68630.11190.0665
Yeast0.52050.0570--0.80530.04010.77100.12190.57000.1055
Average0.55260.04740.65440.03250.72790.02201.66961.18820.77930.0405
Table 8. Comparison of HFA-K-means with ISOS-K-means, PSODE, FADE, and IWODE on 20 high-dimensional datasets.
High-Dimensional DatasetsHFA-K-MeansISOSK-MeansPSODEFADEIWODE
Mean Std. DevMeanStd. DevMeanStd. DevMeanStd. DevMeanStd. Dev
A10.29420.03040.59110.00030.59490.00860.61710.03470.65250.0621
A20.31550.07460.67810.00020.69120.01610.69760.02150.72960.0391
A30.79150.00070.79450.00110.71060.01760.70850.03320.75270.0319
Birch10.80010.00530.80300.00060.72560.02760.72320.02570.76920.0279
Birch20.19040.01740.50710.00010.50700.00020.51550.02350.51760.0084
Birch30.65770.06470.71680.00040.70740.01510.70120.01910.75700.0247
Bridge0.34890.01320.64640.00090.71410.10070.64050.07091.13970.0666
D310.69230.06580.81250.00700.80210.04070.77880.03760.79720.0514
Dim0020.73090.00000.63840.02220.59750.04450.62800.06070.67050.0432
Dim10241.06980.17831.13320.37951.76440.01121.47590.12001.96540.0261
Housec50.32550.05720.53770.01232.24084.08610.54670.02870.68650.0229
Housec80.41640.04600.49190.53050.50220.03150.47070.03830.63440.0408
Letter0.79210.02310.96831.05450.91210.06280.86650.06631.20570.0571
Finland0.30610.09100.44270.00110.44650.00600.46860.05470.48640.0371
S10.77140.02150.77700.00090.67390.03510.67560.02700.75010.0280
S20.73320.12150.74120.00080.68440.02800.69390.03450.75560.0190
S30.50730.06410.71260.00050.71060.01990.70720.01810.75590.0317
S40.76450.01980.77230.00090.72990.01620.73560.02260.78960.0303
T4.8k0.02180.00200.02270.00000.02270.00000.04230.08820.09280.0515
Yeast0.52050.05700.74890.06820.71930.06770.63750.13440.59490.1144
Average0.55260.04740.67680.10410.77290.23180.66650.04800.77520.0407
Table 9. Comparison of HFA-K-means with FA-based hybrid algorithms: FAPSO, FADE, and FATLBO on seven high-dimensional datasets.
High-Dimensional DatasetsHFA-K-MeansFAPSOFADEFATLBO
Mean ValueMean ValueMean ValueMean Value
Birch10.80010.65720.72320.6952
Birch20.19040.50400.51550.5163
Birch30.65770.68120.70120.7596
Bridge0.34890.59010.64050.6108
Housec50.32550.41872.24080.4158
Housec80.41640.42450.50220.4559
Letter0.79210.71460.91210.7775
Average0.50460.57000.89080.6044
Table 10. Friedman rank-sum test for the HFA-K-means and the two classical algorithms tested across the twenty datasets for the twenty algorithm runs.
DatasetsFAK-MeansHFA-K-Means
A12.003.001.00
A22.003.001.00
A31.503.001.50
Birch11.533.001.48
Birch22.003.001.00
Birch31.853.001.15
Bridge2.003.001.00
D311.953.001.05
Dim0021.503.001.50
Dim10241.553.001.45
Housec51.553.001.45
Housec81.953.001.05
Letter1.503.001.50
Finland1.833.001.18
S11.533.001.48
S21.603.001.40
S32.003.001.00
S41.533.001.48
T4.8k2.003.001.00
Yeast1.503.001.50
Table 11. Wilcoxon signed-rank test p values for equal medians on DB Index.
DatasetsHFA-K-Means vs. FAHFA-K-Means vs. K-MeansFA vs. K-Means
A10.0010.0010.001
A20.0010.0010.001
A31.0000.0010.001
Birch10.3170.0010.001
Birch20.0010.0010.001
Birch30.0020.0010.001
Bridge0.0010.0010.001
D310.0010.0010.001
Dim0021.0000.0010.001
Dim10240.1800.0010.001
Housec50.1800.0010.001
Housec80.0010.0010.001
Letter1.0000.0010.001
Finland0.0010.0010.001
S10.3170.0010.001
S20.6380.0010.001
S30.0010.0010.001
S40.3170.0010.001
T4.8k0.0010.0010.001
Yeast1.0000.0010.001
Publisher’s Note: MDPI stays neutral with regard to jurisdictional claims in published maps and institutional affiliations.

