

Analysis and Prediction of Grind-Hardening Surface Roughness Based on Response Surface Methodology-BP Neural Network
School of Mechanical Engineering, Jiangsu University, Zhenjiang 212000, China
*
Author to whom correspondence should be addressed.
Appl. Sci. 2022, 12(24), 12680; https://0-doi-org.brum.beds.ac.uk/10.3390/app122412680
Submission received: 18 November 2022
/
Revised: 7 December 2022
/
Accepted: 9 December 2022
/
Published: 10 December 2022
(This article belongs to the Topic Materials and Surface Treatment Processes Used for Engineering Applications)
Abstract
:Surface morphology and surface roughness are very important properties used to assess the quality of grind-hardening surfaces. In this study, grind-hardening tests for 42CrMo steel were designed using the response surface methodology to reveal the surface morphological characteristics of the grind-hardening surface and the effects of grinding parameters on its roughness. The results showed considerable grinding damage in both the cutting-in and cutting-out areas of the grind-hardened surface, while the middle area was more stable. More specifically, the cutting-in area showed much bonding and damage, while the cutting-out area showed more microcracks. Under the conditions of this test, the surface roughness tended to increase with the increase in cutting depth and workpiece feed speed. The effect of grinding line speed on the grind-hardening surface roughness was not significant. The significance of the effects of grinding parameters on surface roughness ranked as: cutting depth > workpiece feed speed > grinding speed. In turn, a response surface methodology-BP neural network prediction model for the surface roughness of grind-hardening was developed, whose feasibility and validity were confirmed by the experimental results. The model achieved surface roughness prediction of the grind-hardening process with a mean relative error of 2.86%.
1. Introduction
As one of the new integrated manufacturing technologies that have emerged in recent years, the application area and value of the grind-hardening process have attracted much attention worldwide. Two German scholars, Brinksmeier and Brockhoff, first proposed grind-hardening: a new green composite machining process [1,2]. By directly utilizing the heat generated during grinding for quenching of the workpiece surface, there is an enhanced martensite transformation, intensive dislocations and a more desirable carbon distribution on the surface. It is highly possible that the method can be used to incorporate grinding and surface hardening into a single grinding operation to develop a cost-effective production method [3].
Surface roughness is the main indicator for assessing the micro-geometric accuracy of the machined surface and one of the important indicators for evaluating workpiece surface quality. It has a considerable impact on the service life and performance of mechanical parts, including fatigue strength, corrosion resistance, friction and wear properties, etc., especially those working under high temperature, high speed and high pressure [4,5]. For a given grinding system, the machined surface roughness depends mainly on the settable grinding parameters and is inevitably affected by some random factors during grinding [6]. Therefore, to further study the feasibility of grind-hardening and obtain better surface quality, in-depth research on the influencing factors of surface roughness and the influencing patterns is necessary. It is evident that establishing surface roughness prediction models is of great significance for the integrity evaluation and quality control of grind-hardening surfaces.
2. Research and Progress of Surface Roughness Prediction in Metal Processing
In recent years, experts and scholars have conducted experimental and predictive studies on the surface roughness of metal processing techniques such as milling, turning and grinding. The commonly used methods included empirical formula prediction, response surface regression analysis prediction, neural network prediction, genetic algorithms (GAs) and et al.
Natarajan et al. adopted artificial neural networks (ANNs) and developed a surface roughness prediction model for C26000 brass in dry cutting conditions on a CNC turning machine, which (with the interacting terms) took into account the interactions between the parameters and achieved an accuracy of 87.07%. Their study found feed speed as the most influential parameter, followed by grinding speed and the depth of cut [7]. Ding et al. established a machined surface roughness prediction model using fuzzy neural networks based on the grinding wheel wear state and grinding parameters [8]. Gopan et al. combined ANNs with GAs for a post-grinding surface roughness prediction and optimization model [9]. Varma et al. selected the working speed, cutting depth and feed speed as input parameters of the process and used an adaptive neuro-fuzzy inference system (ANFIS), neural network and regression analysis to develop prediction models for surface roughness and the metal removal rate during cylindrical grinding. Compared to neural networks and regression analyses, the surface roughness predictions based on ANFIS agreed well with the experimental results [10]. Chen et al. developed a surface roughness prediction model for Ti-6Al-4V abrasive belt grinding, based on the response surface methodology, and the average error between experimental measurements and model predictions was 6.08% [11]. Gao et al. designed microgrinding tests for composites based on the response surface methodology, and their regression equation model (established by regression analysis and removing the insignificant terms) could relatively accurately reflect the effects of cutting depth, feed speed and spindle speed on surface roughness [12]. Bandapalli et al. conducted experimental research and estimations on the surface roughness of high-speed micro-end milling of titanium alloys using ANNs, group method data processing (GMDH) and multivariate regression analysis (MRA), and their observed results showed that the prediction accuracy of neural networks was higher than the other techniques [13]. Lin et al. developed multivariate regression models (MRMs) and neural network prediction models under various cutting conditions from low-speed to high-speed steady machining, and their results showed that neural network models had higher prediction accuracy [14]. Lei et al. applied empirical models and neural networks to predict the surface roughness for the cryogenic milling of titanium alloys, and the comparative analysis of their results revealed that the maximum relative error between experimental values and predictions by the neural network model was 3.64%, and the error variation was small. Compared with the empirical model, the neural network model had a higher prediction accuracy and generalization ability, which could better predict the effect of each parameter on surface roughness [15]. Asiltürk et al. developed two prediction models based on ANNs and MRMs for predicting the surface roughness of turning machining AISI 1040 steel. In both models, feed speed was identified as the most significant factor affecting surface roughness, followed by the depth of cut and line speed of cut. The results of their study showed that ANNs outperformed MRMs [16]. Therefore, ANNs have achieved certain research results in the prediction of surface roughness after machining. However, no research on the surface roughness prediction of the grind-hardening process or related results has been reported. To this end, this paper further explores the construction of a grind-hardening surface roughness prediction model by regression analysis and BP neural network after obtaining raw data through grind-hardening tests. Thus, the surface roughness formation and variation patterns can be systematically revealed, and the surface roughness prediction of grind-hardening can be achieved. This study could provide a theoretical and experimental basis for the application of the grind-hardening process.
3. Grind-Hardening Test Design Based on the Response Surface Methodology
3.1. Material Selection
As a structural alloy with high strength, high toughness, good hardenability and mechanical properties, 42CrMo is widely used in the manufacture of mechanical products, such as engine cylinders and deep well drilling rod joints. Its mechanical behavior and chemical composition are presented in Table 1 and Table 2.
3.2. Test Parameter Setting
According to previous experimental studies on the grind-hardening mechanism, the grinding parameters were set as follows: the grinding line speed vs. was 25 to 35 m·s−1; the workpiece feed speed was 0.2 to 0.6 m·min−1; and the grinding depth was 0.2 to 0.4 mm. With the above grind-hardening parameters setting, the hardness of the high hardening area of the grind-hardened layer was always in the range of 620 to 700 HV and the average depth of the hardened layer was 1.9 mm, thus achieving a relatively good hardening effect [17]. Therefore, the grinding parameters in this study were set as listed in Table 3 to investigate the grind-hardening surface morphology and surface roughness of 42CrMo steel.
3.3. Test Protocol Design
Before the grind-hardening process, the surface and sides of the specimens were finely ground with a surface grinder and the edges and corners were resharpened with sandpaper. The grinding wheel surface was sharpened and shaped with a diamond dresser. The specific test preparations and conditions are presented in Table 4.
In this test, the Box–Behnken response surface methodology was used, and three levels of each factor were recorded, namely, the workpiece feed speed, cutting depth and grinding line speed. Based on the three-factor and three-level response surface methodology guidelines, each factor had an equal chance of occurring at each level, and 12 trials were conducted. Five more replicate tests at the 0 level of each factor were added, totaling 17 tests. To ensure the accuracy of the test result prediction, three replicate tests were conducted for each set of parameters. The experimental design is presented in Table 5.
4. Analysis of Surface Morphology and Surface Roughness after Grind-Hardening
4.1. Surface Morphology Analysis
The surface morphology after grind-hardening was observed using an OLYMPUS-DSX500 optical digital microscope (Figure 1). As shown in Figure 2, Figure 3, Figure 4 and Figure 5, the specimen surface after grind-hardening is not smooth and the grinding texture is coarse, with many defects and damage, such as scratches and bonding.
In the cutting-in area of the grind-hardened surface, the grinding pattern is clear, and many grinding defects, such as bonding and breakage, can be observed. As the abrasive grains on the grinding wheel were sharp after dressing, their cutting effect was strong. As a result, they left clearer patterns in the cutting-in area. Due to the large grinding thickness, the abrasive grains directly entered the cutting stage as soon as they came into contact with the workpiece (skipping the slipping and plowing), and the chips could not be discharged in time. The combined action of excessive grinding force and grinding temperature caused a series of physical and chemical reactions of the dislodged abrasive grains and chips, which adhered to the surface of the workpiece, resulting in bonding and burn.
In the middle area there is a section of a relatively stable and flat surface with localized flow coating and pits. As the grinding wheel passed through the cutting-in area, the abrasive grains produced a certain degree of dullness and had no time to self-sharpen. Under high temperatures and pressure, the air holes of the grinding wheel were blocked by the chips that were not discharged in time, rendering the grinding wheel surface smooth. At this time, the metal in the vicinity of the grinding arc was in a plastic flow state due to the high temperature. Thus, the “smooth” state of the wheel was “copied” onto the grinding surface, creating a relatively flat machined area. Compared with the cutting-in area, the grinding temperature in the middle area increased further, and traces of flow coating of the metal material appeared in some areas. Meanwhile, as the hardness of the metal material reduced with the increasing temperature in the grinding area, and the chipped abrasive grains were not discharged in time, the grinding wheel “pressed” some of the chipped abrasive grains into the grinding area, creating craters.
In the cutting-out area, numerous microcracks, breakages and folds appeared. The grinding wheel was worn badly and the air holes were clogged severely, resulting in further increases in the grinding force and grinding temperature. In the final grinding area, as part of the grinding wheel that left the grinding surface, the metal grinding rate decreased suddenly. Consequently, the grinding force dropped sharply, causing a sudden increase in the unbalanced vibration of the grinding wheel and workpiece. When the grinding wheel was completely off the workpiece, the temperature dropped sharply, leading to the initiation and extension of microcracks. Microcracks are observed in both the longitudinal and transverse directions and are longer in the longitudinal direction (workpiece feed direction).
4.2. Formation and Variations of Surface Roughness in Grind-Hardening
The above grinding surface morphology analysis revealed a certain unevenness in the surface after grind-hardening. Therefore, five measurements were taken in the cutting-in area, middle area and cutting-out area of the specimens during surface roughness measurement and analysis under the OLYMPUS-DSX500 optical digital microscope. To reduce the measurement error, the maximum and minimum values of each area were removed and the mean of the remaining measurement data was taken as the roughness measurement result. The test matrix and surface roughness measurements are presented in Table 6.
The influence patterns of each interaction term in the grinding parameters on the surface roughness were obtained through the Box–Behnken response surface analysis, as shown in Figure 6, Figure 7 and Figure 8.
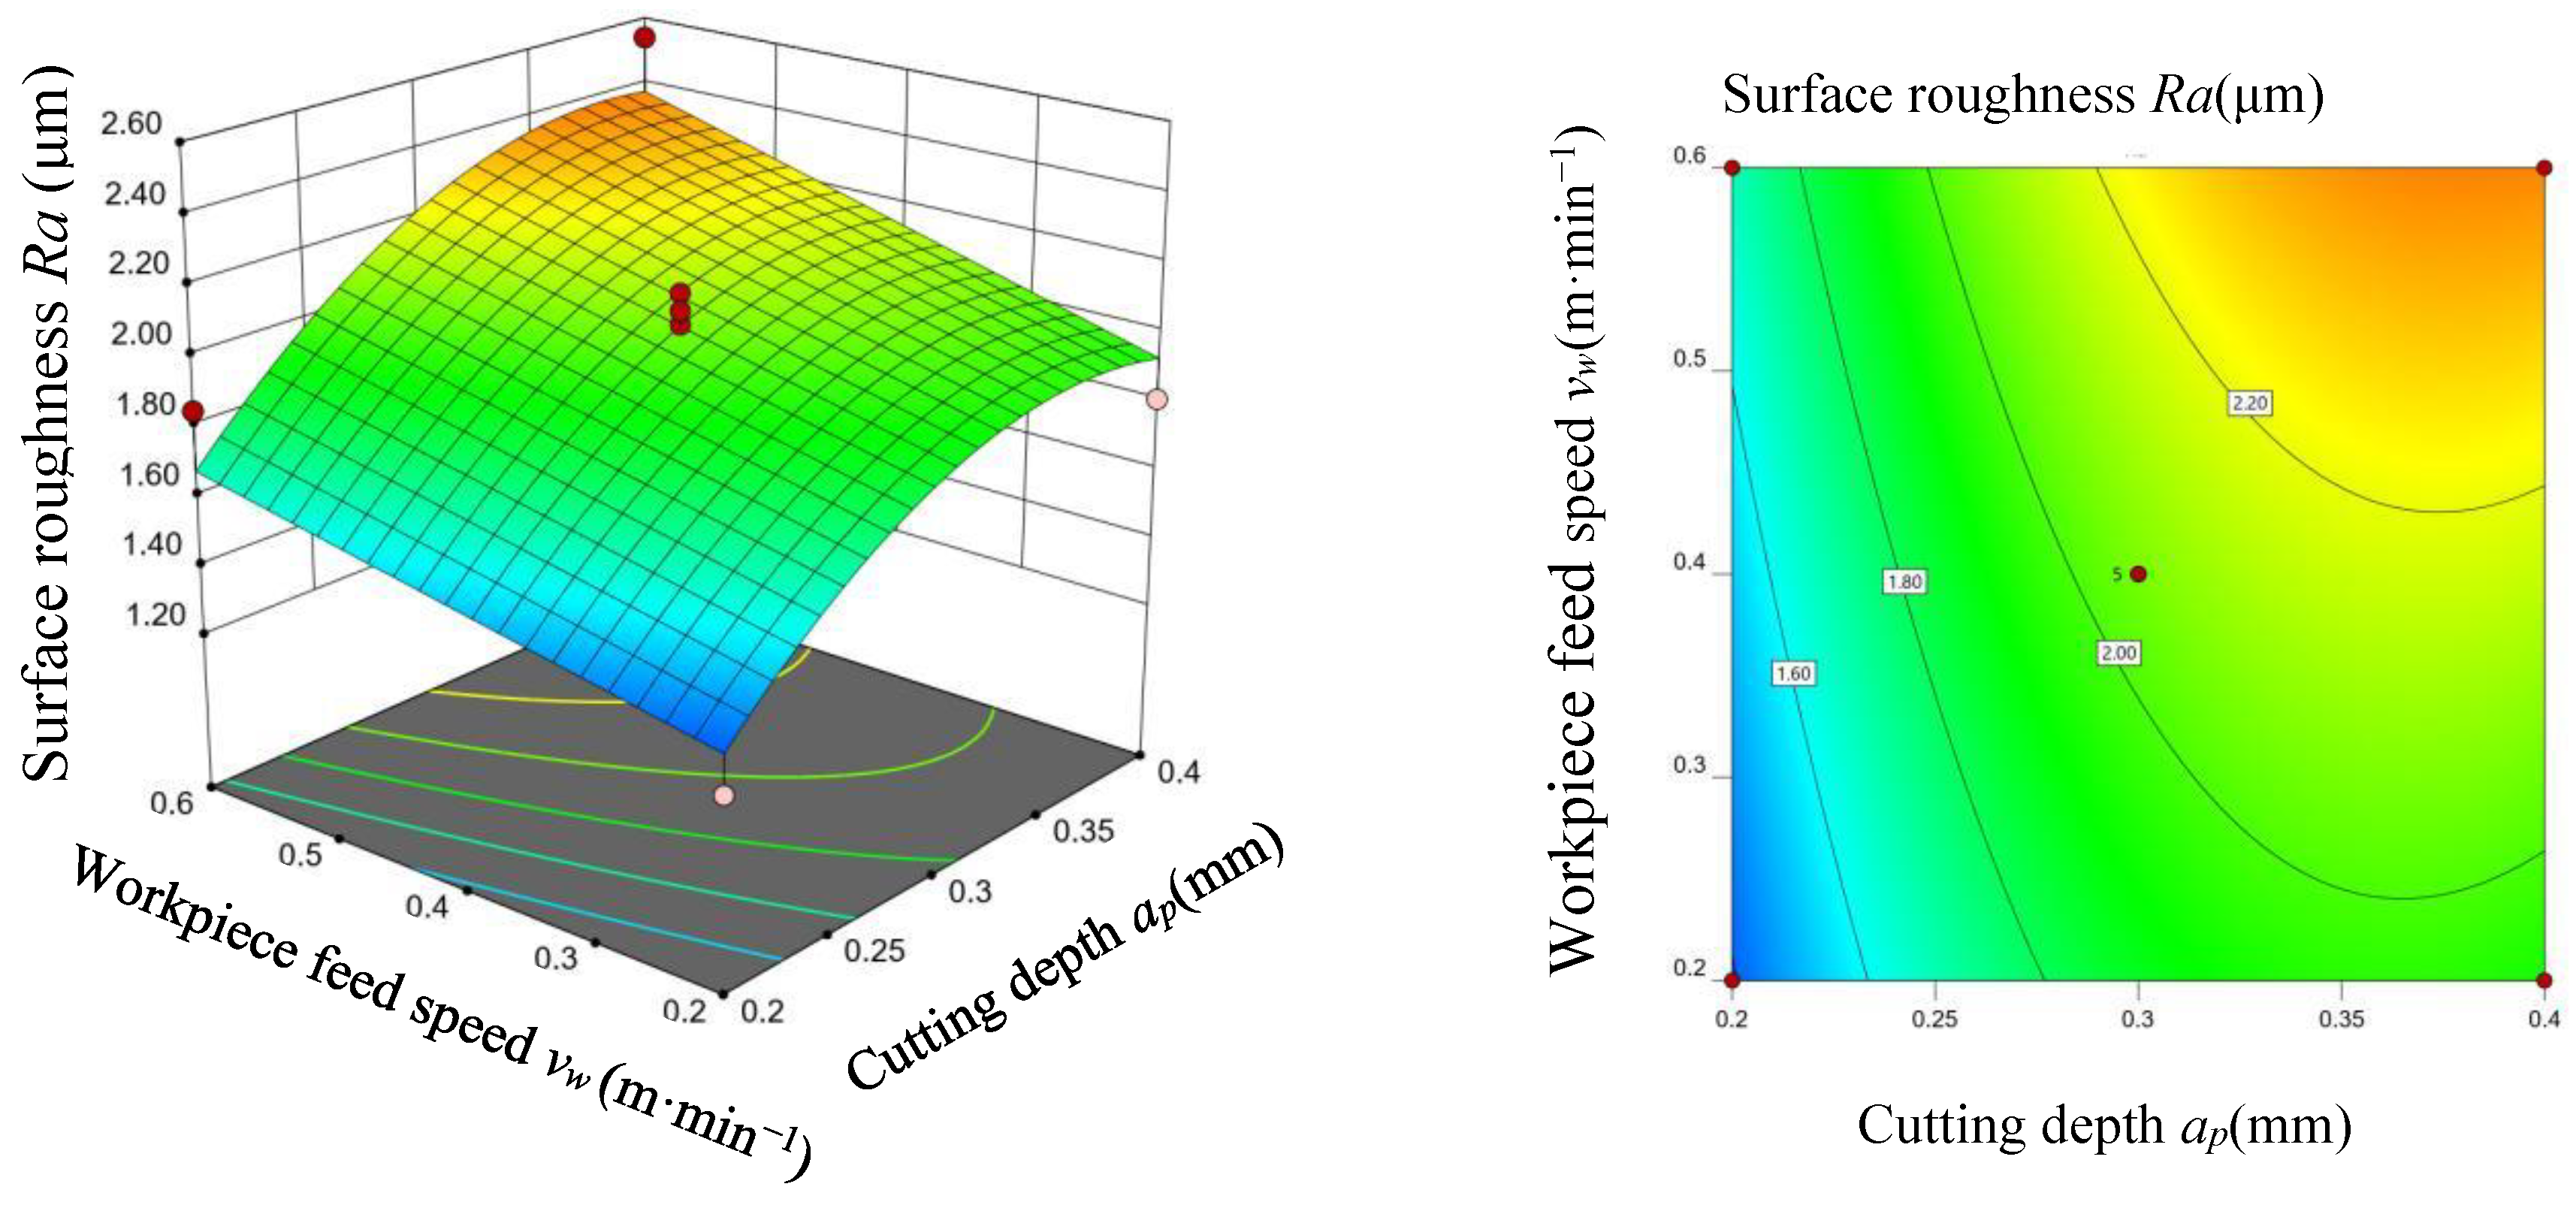
Figure 6 shows the response surface and contour map of the surface roughness Ra after grind-hardening at a cutting depth ap and workpiece feed speed vw when the grinding speed is at the zero level, i.e., vs = 30 m·s−1. As can be observed from the response surface plot, the surface roughness tends to increase gradually with the increase of cutting depth and workpiece feed speed. According to the grinding mechanism, the increases in cutting depth and workpiece feed speed increase the number of effective dynamic grinding edges and the maximum undeformed chip thickness, which, in turn, increases the depth of the grinding marks, the grinding force and the grinding heat. As a result, the plastic deformation and stress of the material increase, thus rendering the surface increasingly rough and uneven, i.e., the surface roughness Ra increases. According to the contour map, the effect of the cutting depth on surface roughness is greater than that of the workpiece feed speed under the parameters in this test.
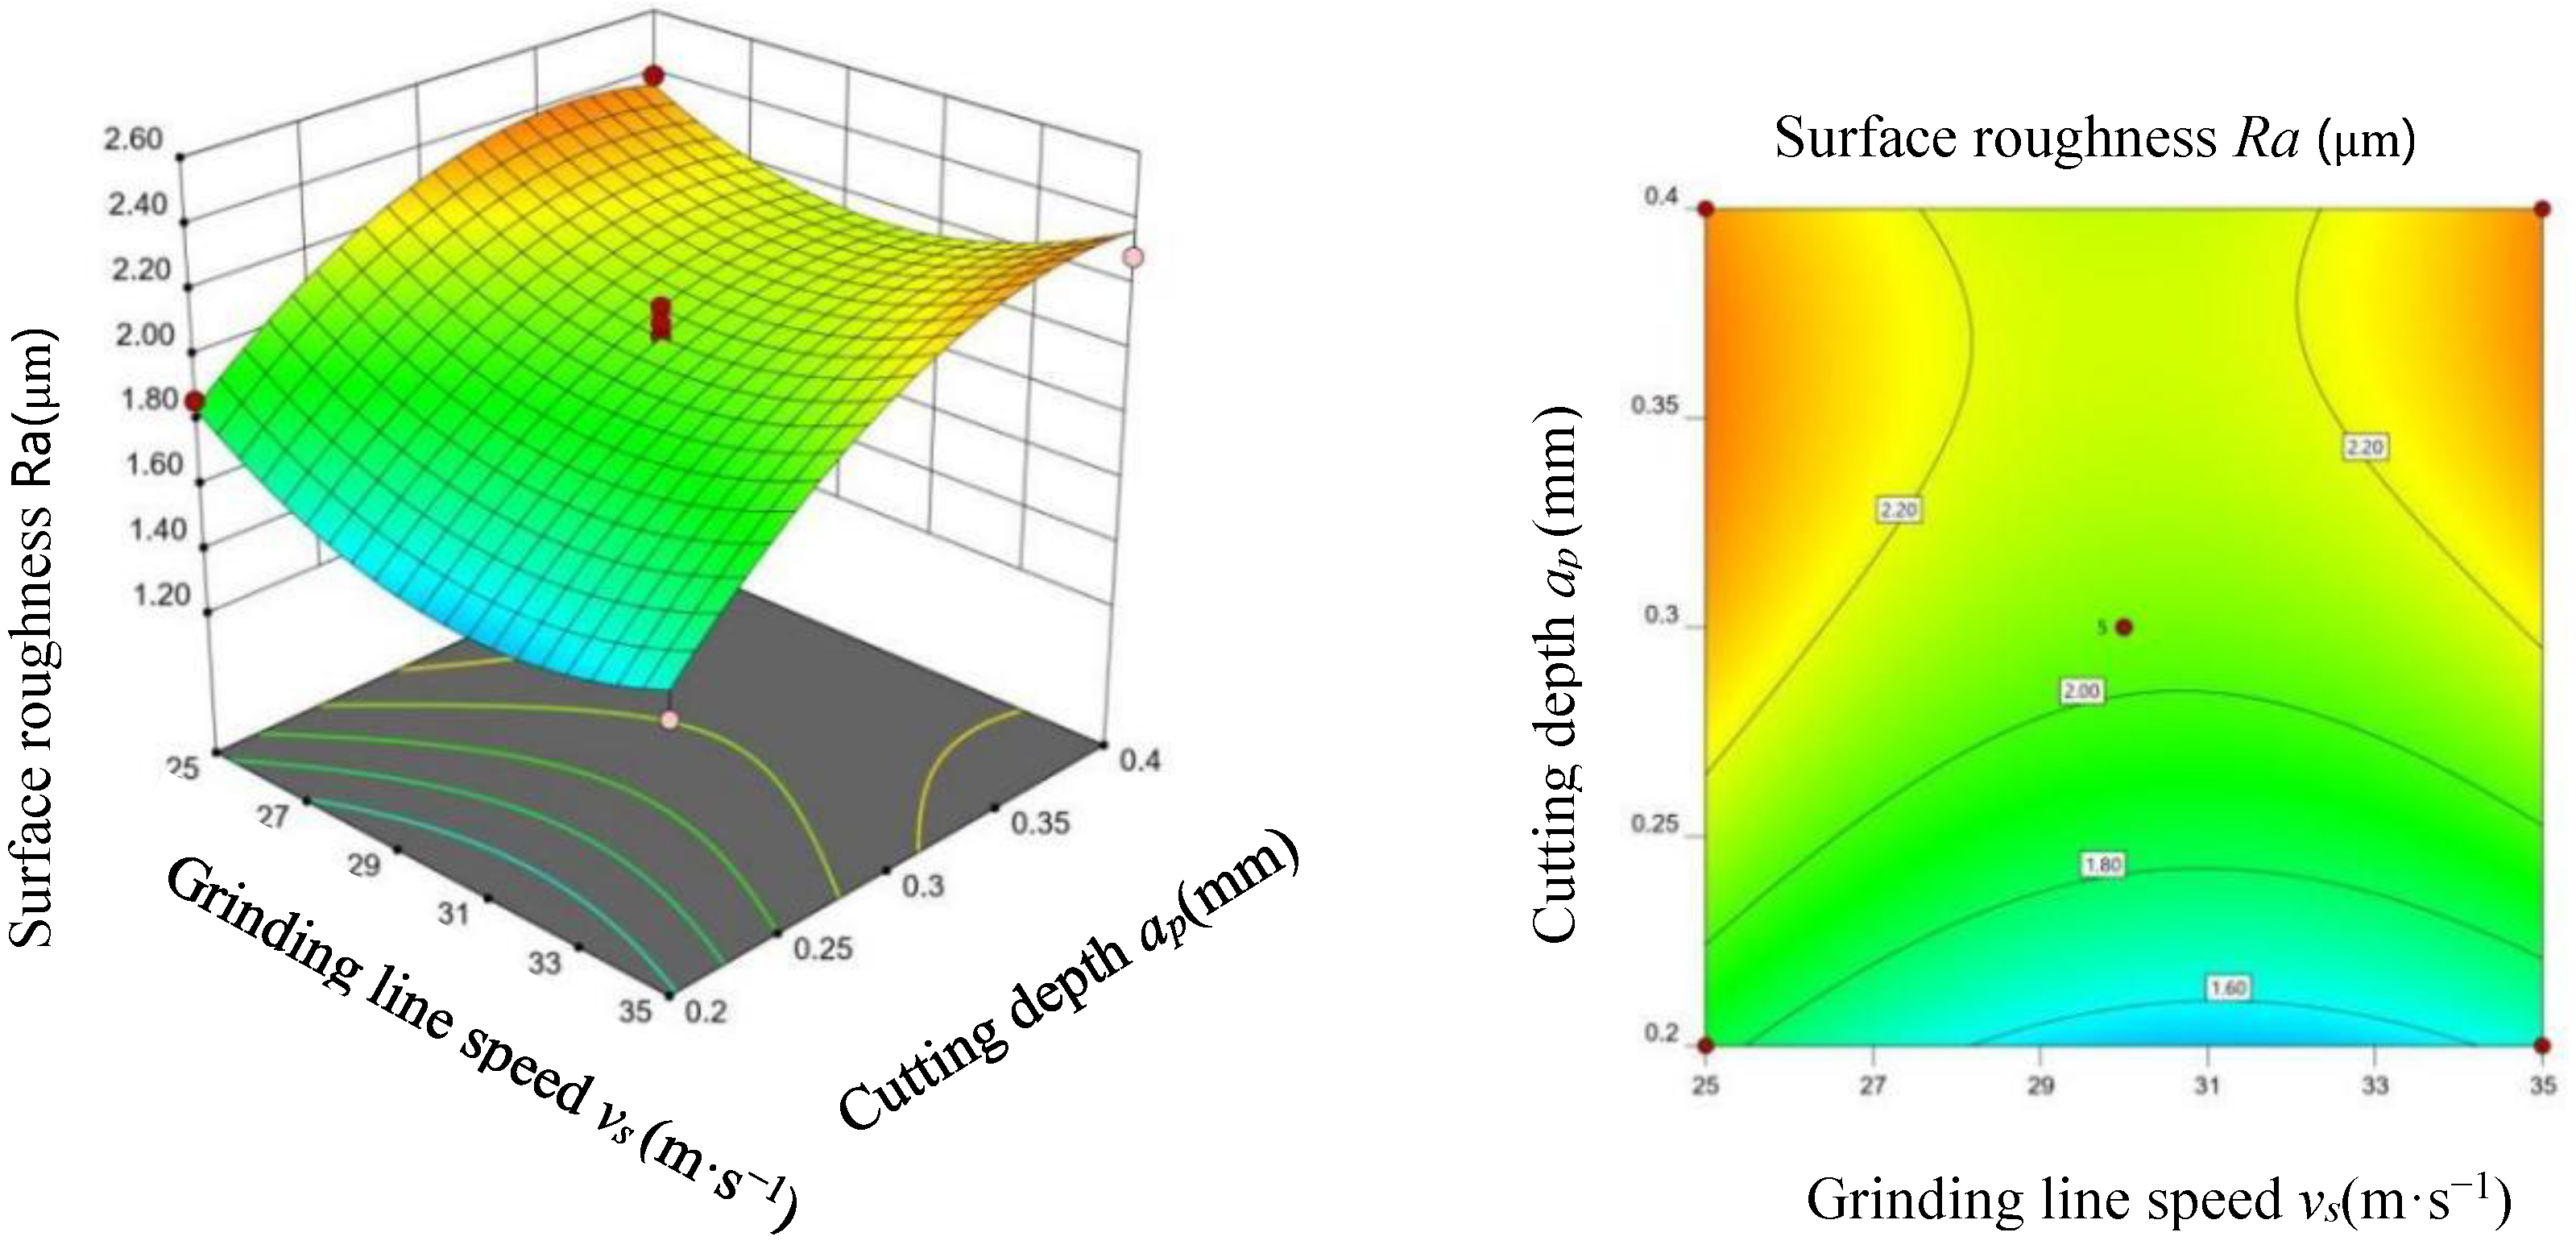
Figure 7 shows the response surface and contour map of surface roughness after grinding at different cutting depths and grinding line speed when the workpiece feed speed is at the zero level, i.e., vw = 0.4 m/min.
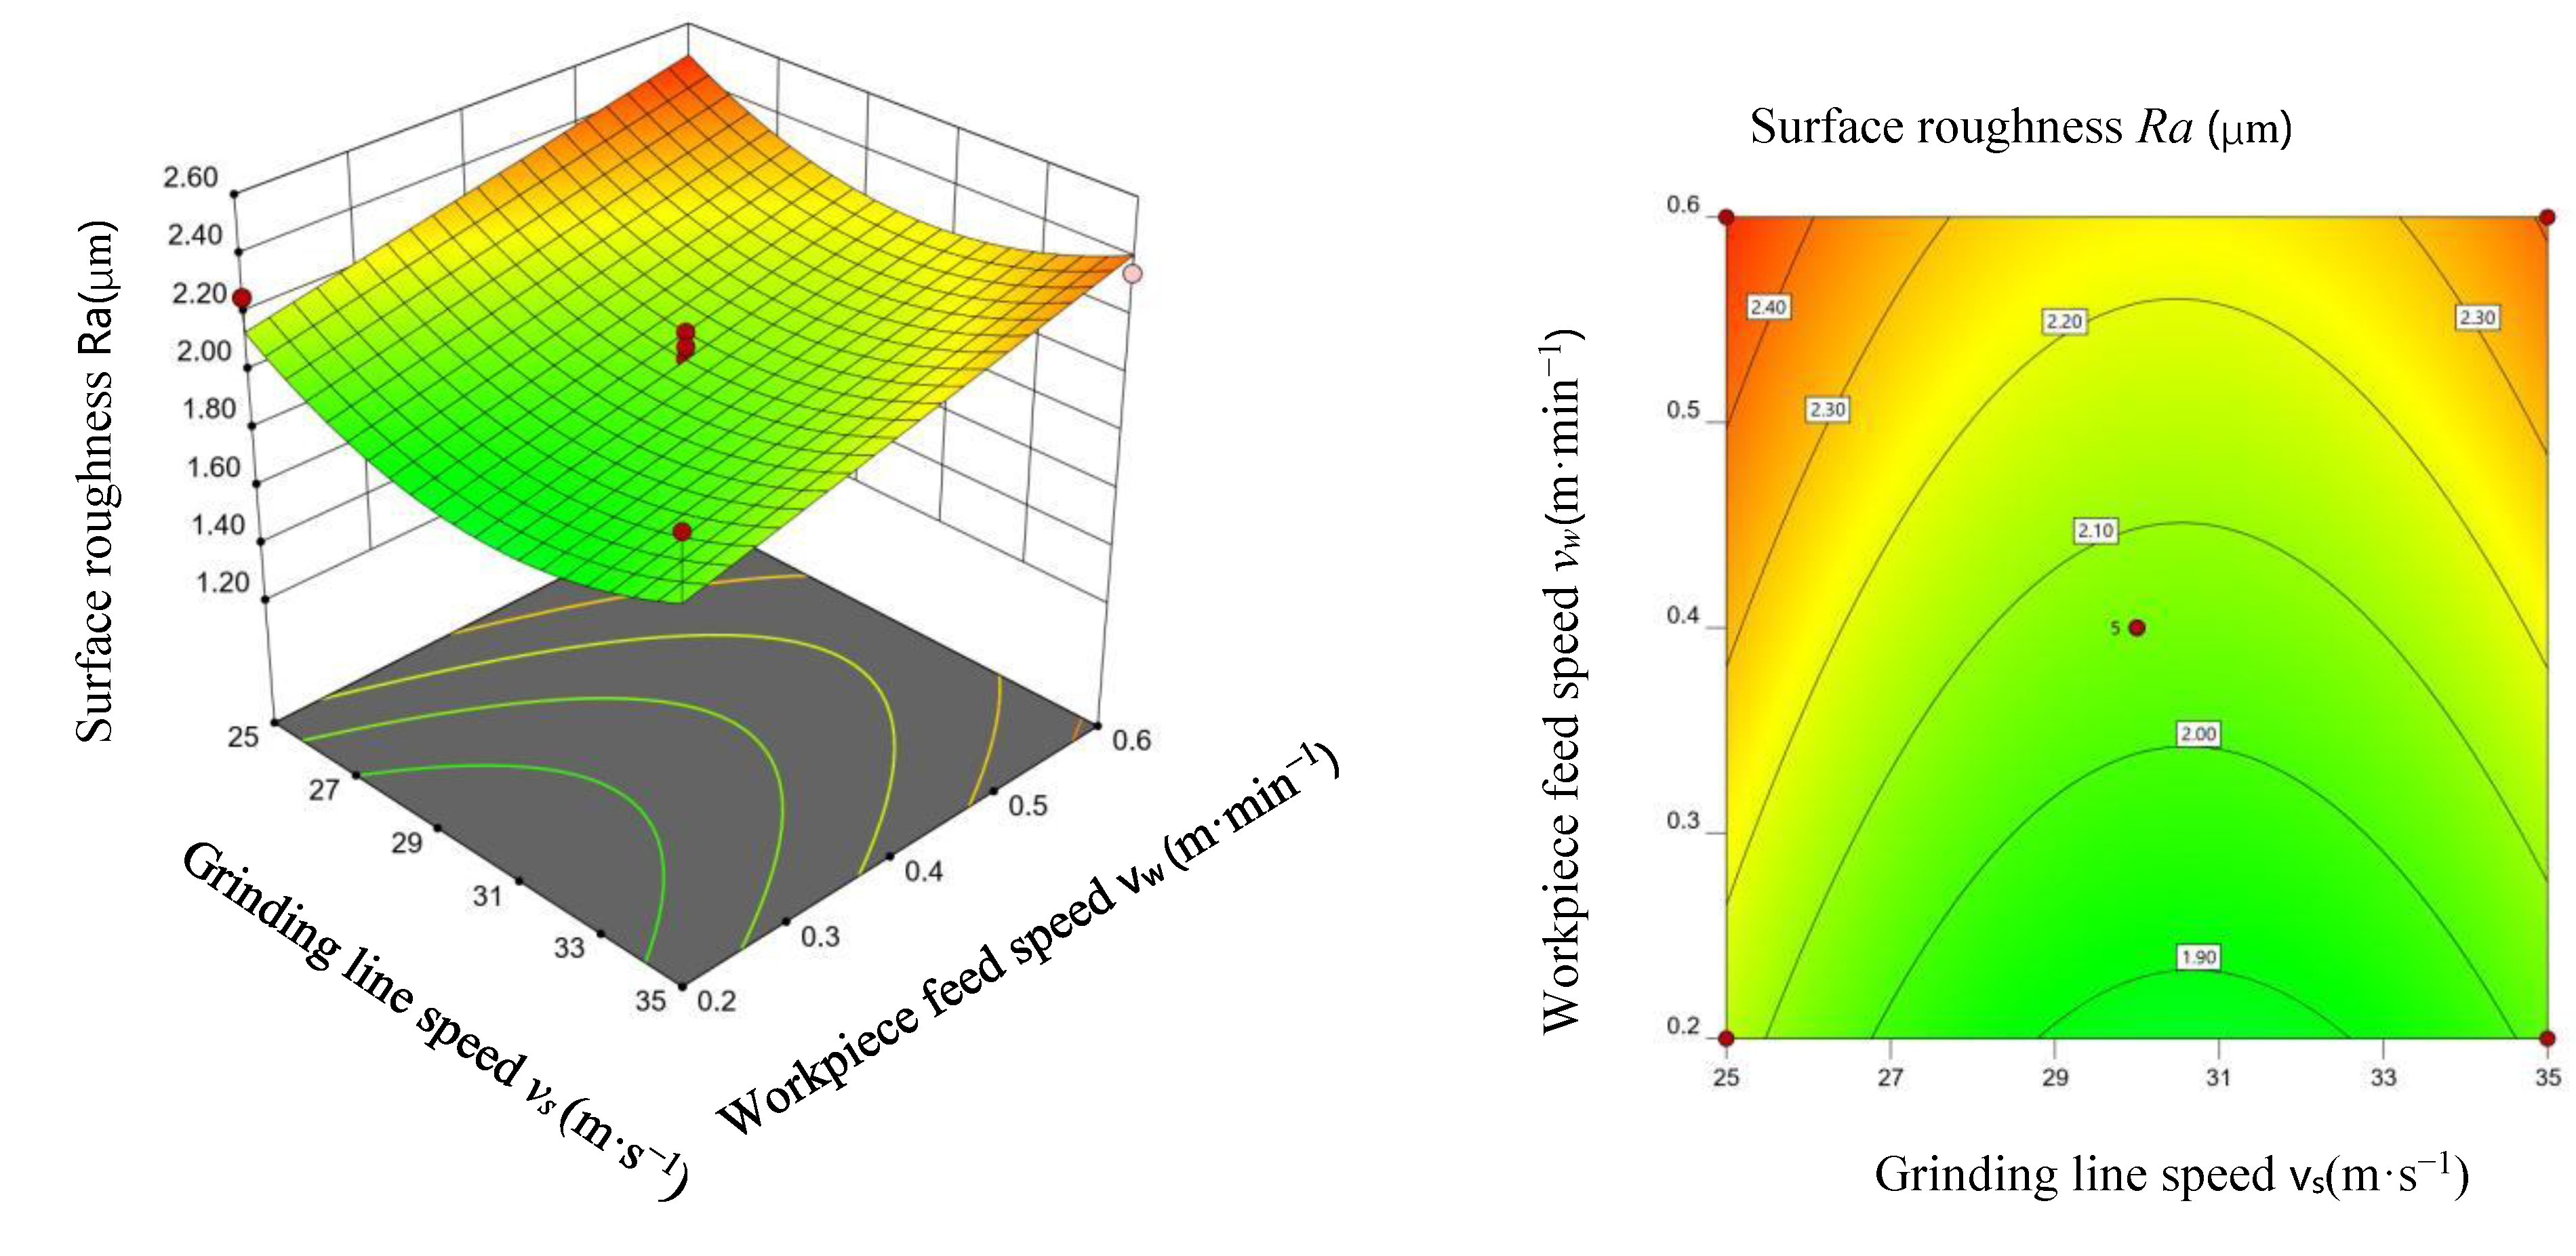
Figure 8 shows the response surface and contour map of surface roughness after grinding at different grinding line speeds and workpiece feed speeds when the cutting depth is at the zero level, i.e., ap = 0.3 mm. As can be observed, with the increase in grinding speed, the surface roughness shows a firstly decreasing and then increasing trend. However, the changes are slight, and the influence is not significant. The reason for this is that as the grinding speed increased, the per-unit-of-time grinding edge density on the contact surface between the workpiece and the grinding wheel increased, and the maximum undeformed chip thickness of the abrasive grains decreased. As a result, the grinding force decreased and the surface roughness tended to decrease. However, due to the dimensional effect, the chip strain increased and the grinding temperature tended to rise. Thus, the plastic deformation increased, increasing the surface roughness instead. Therefore, the effect of grinding speed on surface roughness is not significant under the parameters of this test.
According to the contour maps in Figure 6, Figure 7 and Figure 8, the effects of cutting depth and workpiece feed speed on the surface roughness are consistent under the parameters of this test. That is, the surface roughness tends to increase with the increase in cutting depth and workpiece feed speed. According to the changes in contour curvature, it is clear that the effect of cutting depth on surface roughness is greater than that of the workpiece feed speed. At the same time, the effect of grinding line speed on surface roughness is not significant.
5. Construction and Validation of Surface Roughness Prediction Model for Grind-Hardening
5.1. Response Surface Methodology—Quadratic Regression Prediction Model Construction
In this paper, an analysis of variance (ANOVA) was performed on the experimental results, and the formation of a prediction model was attempted using regression analysis. Although the F-test found that p = 0.0102 < 0.05, and the misfit term f = 0.0786 > 0.05, indicating that the regression model developed was significant, the misfit term was not significant. Thus, the regression prediction was feasible. However, the correction coefficient of determination of the model had a value of R2 = 0.8571, the adjusted value was R2 = 0.7143, the prediction of R2 was negative and the model predictions were poor. Thus, it was not possible to build a response surface regression prediction model.
5.2. Response Surface-BP Neural Network Prediction Model Construction and Validation
BP neural network, also known as error-back propagation network (EBPN), was proposed and developed by a group of scientists led by Rumelhart and McClelland in 1986. As a feed-forward network composed of nonlinear transform units, it systematically solved the problem of learning connection weights in multilayer networks and proved to be particularly suitable for fuzzy, nonlinear and ill-defined pattern characteristics [18]. In grind-hardening, there are complex nonlinear mapping relationships between grinding parameters (grinding line speed, cutting depth and workpiece feed speed) and surface roughness. Therefore, this paper proposed a BP neural network grind-hardening surface roughness prediction model based on response surface experimental design. The prediction model was be constructed in MATLAB software.
The BP neural network surface roughness prediction model developed in this paper has a three-layer structure, as shown in Figure 9, i.e., an input layer, a hidden layer and an output layer. The input samples are the three parameters of workpiece feed speed vw, cutting depth ap and grinding line speed vs; i.e., the number of input nodes is 3. The output sample is the surface roughness Ra; i.e., the number of output nodes is 1. The number of nodes in the hidden layer of the BP neural network has a significant impact on its prediction accuracy. Too few nodes may lead to low learning efficiency of the network (which requires increasing the number of training sessions) and affect the accuracy of training. Too many nodes increase the training time and could easily cause overfitting. The optimal number of hidden layer nodes can be determined by referring to the empirical formula [19]:
where p is the number of neurons in the hidden layer, n represents the number of input layers, and represents a random value.
The number of nodes in the hidden layer was finally determined to be 11 according to Equation (1) and the error calculation results, i.e., the BP neural network had a 3-11-1 structure. Specifically, the 1st to 11th neuron of the hidden layer were denoted as W1 to W11, the weights between the input layer nodes and the hidden layer nodes were denoted as Aij and the weights between the hidden layer and the output layer nodes were denoted as Bjk. The BP neural network model flow chart is shown in Figure 10.
The above experimental results (in Table 6; Surface roughness Ra measurements of the test based on response surface methodology) were used as sample data for the BP neural network. Of these, 70% were randomly selected as the training set, 15% as the validation set and 15% as the test set. The data samples were normalized to eliminate the effect of magnitudes between sample parameters. The model expression is as follows.
xi* = (xi − xmin)/(xmax − xmin)
In the equation, xi is the initial data, xi* is the data after normalization, i is the test number, and xmax and xmin are the maximum and minimum values, respectively, in the initial data.
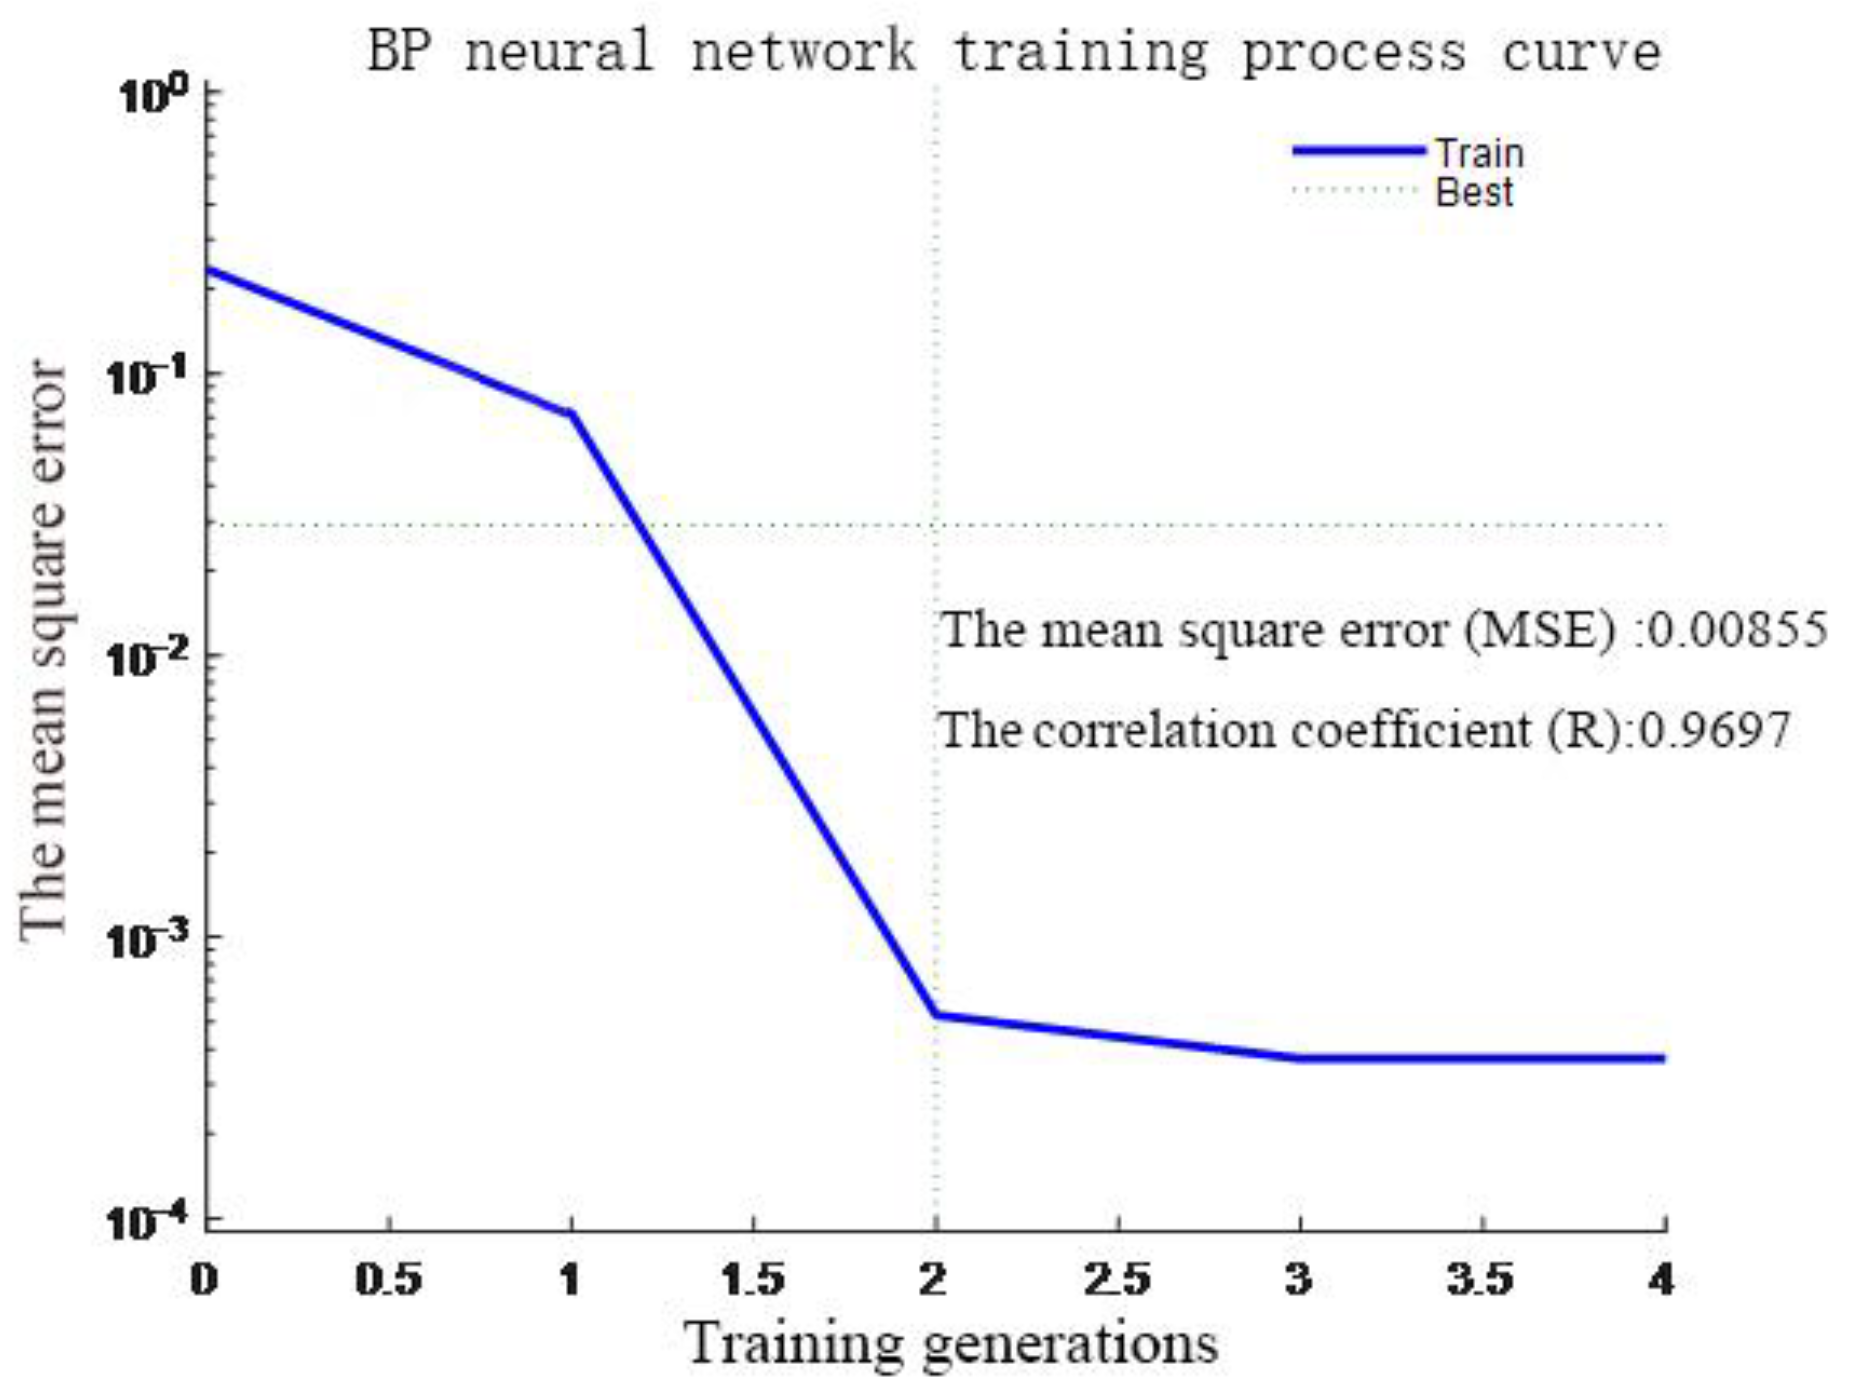
After several tests and training, the training process of the BP neural network is shown in Figure 11. The mean square error (MSE) of BP training is 0.00855 and the correlation coefficient (R) is 0.9697. The surface roughness Ra’ was predicted using the proposed model. The predictions, test values and prediction errors are shown in Table 7. According to the prediction results, only one prediction has a relative error of 10.78% and the rest of the predictions have relative errors below 10%, with a mean relative error of 2.86%. A comparison of the measured and predicted values is shown in Figure 12.
Three sets of data were selected for grind-hardening tests again, and the measured and predicted values are shown in Table 8. Since the relative errors are below 10%, the BP neural network can predict the surface roughness after grind-hardening with good accuracy. Thus, the developed response surface methodology-BP neural network prediction model is ready and reliable in predicting the surface roughness based on the grind-hardening parameters.
6. Conclusions
In this study, grind-hardening tests were designed based on the response surface methodology, theoretical analysis was conducted and the prediction model for the surface roughness of grind-hardening was developed. The following conclusions have been obtained:
- (1)
- Uneven morphology exists on the surface after grinding, which can be roughly divided into the cutting-in, middle and cutting-out areas. In the cutting-in area, the grinding texture is clearer, with much bonding and trace damage. In the middle area, the surface is relatively flat, with a small amount of bonding and some damage. In the cutting-out area, the grinding texture is coarse, with more microcracks and grinding damage.
- (2)
- Under the conditions in this test, the surface roughness tends to increase with the increase of cutting depth and workpiece feed speed, while the variation over the grinding line speed is not significant.
- (3)
- The effects of grinding parameters (grinding line speed, workpiece feed speed and cutting depth) on grinding surface roughness in order of significance are cutting depth > workpiece feed speed > grinding line speed.
- (4)
- It was not possible to build a response surface regression prediction model. The response surface methodology-BP neural network-based surface roughness prediction model for grind-hardening is established, which has a mean relative error of 2.38% (only one has an error of 10.86%) thus, it can be used to predict the surface roughness after grind-hardening. This study could provide a theoretical and experimental basis for the engineering applications and grinding surface quality improvement of grind-hardening.
Author Contributions
Conceptualization, G.W., C.S. and C.W.; methodology, C.W. and C.S.; software, C.W.; validation, C.S. and C.W.; formal analysis, C.W.; investigation, C.W.; resources, C.W.; data curation, C.W.; writing—original draft preparation, C.W.; writing—review and editing, G.W. and C.S.; visualization, C.W. and C.S.; supervision, G.W.; project administration, G.W.; funding acquisition, G.W. All authors have read and agreed to the published version of the manuscript.
Funding
This study was supported by the National Natural Science Foundation of China (No.50275066) and the National Major Science and Technology Project (No.2013ZX04009-030).
Institutional Review Board Statement
Not applicable.
Informed Consent Statement
Not applicable.
Data Availability Statement
Not applicable.
Conflicts of Interest
The authors declare that they have no conflict of interest.
References
- Brinksmeier, E.; Brockhoff, T. Randschicht-Wärmebehandlung dursh Schleifen. Häerterei-Tech. Mitt. 1994, 49, 327–330. [Google Scholar]
- Brinksmeier, E. Utilization of Grinding heat as a New Heat Treatment Process. CIRP Ann. —Manuf. Technol. 1996, 45, 283–286. [Google Scholar] [CrossRef]
- Zarudi, I.; Zhang, L.C. Mechanical property improvement of quenchable steel by grinding. J. Mater. Sci. 2002, 37, 3935–3943. [Google Scholar] [CrossRef]
- Gu, S.C.; Zhu, L.H.; Duan, Y.M.; Wu, X.C.; Gu, B.F. Effect of surface roughness on high temperature friction and wear properties of largediameter M2 high speed steel. Trans. Mater. Heat Treat. 2020, 41, 127–132. [Google Scholar]
- Zhu, L.N.; Deng, C.Y.; Wang, D.P.; Hu, S.S. Effect of surface roughness on very high cycle fatigue behavior of Ti-6Al-4valloy. Acta Metall. Subuca 2016, 52, 583–591. [Google Scholar]
- Li, X.D.; Lin, B. Experimental Research on the Effect of Grinding Parameters on Ceramic Machined Surface Roughness. Rare Met. Mater. Eng. 2007, 36 (Suppl. 2), 465–467. [Google Scholar]
- Chinnasamy, N.; Muthu, S.; Karuppuswamy, P. Prediction and analysis of surface roughness characteristics of a non-ferrous material using ANN in CNC turning. Int. J. Adv. Manuf. Technol. 2011, 57, 1043–1051. [Google Scholar]
- Ding, N.; Zhao, C.L.; Luo, X.C.; Li, Q.H.; Shi, Y.C. An Intelligent Prediction of Surface Roughness on Precision Grinding. Solid State Phenom. 2017, 261, 221–225. [Google Scholar] [CrossRef]
- Gopan, V.; Wins, K.L.D.; Surendran, A. Integrated ANN-GA Approach for Predictive Modeling and Optimization of Grinding Parameters with Surface Roughness As the Response. Mater. Today Proc. 2018, 5, 12133–12141. [Google Scholar] [CrossRef]
- Varma, N.S.K.; Varma, I.; Rajesh, S.; Raju, K.S.R.; Raju, V.M.K. Prediction of surface roughness and MRR in grinding process on Inconel 800 alloy using neural networks and ANFIS. Mater. Today Proc. 2018, 5, 5445–5451. [Google Scholar] [CrossRef]
- Chen, Y.X.; Huang, Y.; Xiao, G.J.; Chen, G.L.; Liu, Z.W.; Liu, X.M. Experiment and Surface Roughness Prediction Model for Ti-6Al-4V in Abrasive Belt Grinding. Adv. Mater. Res. 2016, 1136, 42–47. [Google Scholar] [CrossRef]
- Gao, Q.; Guo, G.Y.; Jing, X.F.; Li, W.B. Experimental study on micro grinding surface roughness of high volume fraction SiC/Al composites. Technol. Manuf. 2021, 9, 64–68. [Google Scholar]
- Bandapalli, C.; Sutaria, B.M.; Bhatt, D.V.; Singh, K.K. Experimental Investigation and Estimation of Surface Roughness using ANN, GMDH & MRA models in High Speed Micro End Milling of Titanium Alloy (Grade-5). Mater. Today Proc. 2017, 4, 1019–1028. [Google Scholar]
- Lin, Y.C.; Wu, K.D.; Shih, W.C.; Hsu, P.K.; Hung, J.P. Prediction of Surface Roughness Based on Cutting Parameters and Machining Vibration in End Milling Using Regression Method and Artificial Neural Network. Appl. Sci. 2020, 10, 3941. [Google Scholar] [CrossRef]
- Lei, Y.; Zhao, W.; He, N.; Li, L. Prediction of Surface Roughness for Cryogenic Milling TC 17 Titanium Alloys. China Mech. Eng. 2022, 33, 583–588. [Google Scholar]
- Lhan, A. Predicting surface roughness of hardened AISI 1040 based on cutting parameters using neural networks and multiple regression. Int. J. Adv. Manuf. Technol. 2012, 63, 249–257. [Google Scholar]
- Jiao, B. Surface Integrity and Experimental Research on Grind-Hardening Process of 42CrMo Steel; Jiangsu University: Zhenjiang, China, 2016. [Google Scholar]
- Zhang, J. Study the Application of Artificial Neural Network in Experiments Optimal Design of Response Surface Methodology; Qinghai Normal University: Xining, China, 2014. [Google Scholar]
- Zhang, Y.D.; Xiao, G.J.; Gao, H.; Zhu, B.; Huang, Y.; Li, W. Roughness Prediction and Performance Analysis of Data-Driven Superalloy Belt Grinding. Front. Mater. 2022, 9, 2296–8016. [Google Scholar] [CrossRef]
Figure 1.
OLYMPUS-DSX500 optical digital microscope.

Figure 2.
Two-dimensional view of the surface morphology of sample No. 5 (20×). (a) cutting-in area; (b) middle area; (c) cutting-out area.
Figure 2.
Two-dimensional view of the surface morphology of sample No. 5 (20×). (a) cutting-in area; (b) middle area; (c) cutting-out area.

Figure 3.
Three-dimensional view of the surface morphology of sample No. 5. (a) cutting-in area; (b) middle area; (c) cutting-out area.
Figure 3.
Three-dimensional view of the surface morphology of sample No. 5. (a) cutting-in area; (b) middle area; (c) cutting-out area.

Figure 4.
Two-dimensional view of the surface morphology of sample No. 7 (20×). (a) cutting-in area; (b) middle area; (c) cutting-out area.
Figure 4.
Two-dimensional view of the surface morphology of sample No. 7 (20×). (a) cutting-in area; (b) middle area; (c) cutting-out area.

Figure 5.
Three-dimensional view of the surface morphology of sample No. 7. (a) cutting-in area; (b) middle area; (c) cutting-out area.
Figure 5.
Three-dimensional view of the surface morphology of sample No. 7. (a) cutting-in area; (b) middle area; (c) cutting-out area.

Figure 6.
Cutting depth–workpiece feed speed response surface and contour map.

Figure 7.
Cutting depth–grinding line speed response surface and contour map.

Figure 8.
Grinding line speed–workpiece feed speed response surface and contour map.

Figure 9.
BP neural network structure.

Figure 10.
BP neural network model flow chart.

Figure 11.
BP neural network training process curve.

Figure 12.
Test values compared with the predictions.


Table 1.
Mechanical behavior of 42CrMo steel.
| Hardness (HB) | Tensile Strength Rm (MPa) | Yield Strength Rc (MPa) | Reduction of Area ψ (%) | Elongation (%) |
|---|---|---|---|---|
| ≤217 | ≥1080 | ≥930 | ≥45 | ≥12 |
Table 2.
Chemical composition of 42CrMo steel (wt.%).
| Composition | wt.% | Composition | wt.% |
|---|---|---|---|
| C | 0.38–0.45 | Cr | 0.90–1.20 |
| Mo | 0.15–0.25 | Si | 0.17–0.37 |
| Mn | 0.50–0.80 | S | ≤0.035 |
| P | ≤0.035 | Cu/Ni | ≤0.30 |
Table 3.
Grinding parameters setting of grinding hardening test.
| Grinding Parameters | Parameters Setting |
|---|---|
| Grinding line speed vs (m·s−1) | 25, 30, 35 |
| Grinding depth ap (mm) | 0.2, 0.3, 0.4 |
| Workpiece feed speed vw (m·min−1) | 0.2, 0.4, 0.6 |
| Grinding way | Down grinding |
| Cooling conditions | Air cooling |
Table 4.
Experimental conditions.
| Details | Unit Type | Notes |
|---|---|---|
| Grinding machine | MKL7132 × 6/12 surface grinding machine | Slow feed surface CNC grinder |
| Test material | 42CrMo steel | Better hardenability |
| Wheel | WA60L6V White corundum grinding wheel | Ceramic bonding agent |
| Specimen size | Length 60 mm; Width 20 mm; Height 25 mm | Quenched and tempered state |
| Grinding way | One-way suitable grinding |
Table 5.
Design of experiments with response surfaces.
| Samples | Workpiece Feed Speed vw (m·min−1) | Grinding Depth ap (mm) | Grinding Line Speed vs (m·s−1) |
|---|---|---|---|
| 1 | 0.4 | 0.2 | 25 |
| 2 | 0.4 | 0.2 | 35 |
| 3 | 0.4 | 0.4 | 25 |
| 4 | 0.4 | 0.4 | 35 |
| 5 | 0.2 | 0.3 | 25 |
| 6 | 0.2 | 0.3 | 35 |
| 7 | 0.6 | 0.3 | 25 |
| 8 | 0.6 | 0.3 | 35 |
| 9 | 0.2 | 0.2 | 30 |
| 10 | 0.2 | 0.4 | 30 |
| 11 | 0.6 | 0.2 | 30 |
| 12 | 0.6 | 0.4 | 30 |
| 13 | 0.4 | 0.3 | 30 |
| 14 | 0.4 | 0.3 | 30 |
| 15 | 0.4 | 0.3 | 30 |
| 16 | 0.4 | 0.3 | 30 |
| 17 | 0.4 | 0.3 | 30 |
Table 6.
Surface roughness Ra measurements of the test based on response surface methodology.
| Samples | 1 | 2 | 3 | 4 | 6 | 7 | 8 | 9 |
|---|---|---|---|---|---|---|---|---|
| Ra(μm) | 1.87 | 1.56 | 2.39 | 2.29 | 2.03 | 2.32 | 2.3 | 1.28 |
| Samples | 10 | 11 | 12 | 13 | 15 | 16 | 17 | |
| Ra(μm) | 1.81 | 1.85 | 2.54 | 1.85 | 1.95 | 1.91 | 2.1 |
Table 7.
Test values, predicted values, absolute errors and relative errors.
| Grinding Parameters | Test Values Ra (μm) | Predicted Values Ra’ (μm) | Absolute Errors (μm) Ra’−Ra | Relative Errors (%) |Ra’−Ra|/Ra | ||
|---|---|---|---|---|---|---|
| vw (m·min−1) X1 | ap (mm) X2 | vs (m·s−1) X3 | ||||
| 0.4 | 0.2 | 25 | 1.87 | 1.8716 | 0.0016 | 0.09% |
| 0.4 | 0.2 | 35 | 1.56 | 1.5676 | 0.0076 | 0.49% |
| 0.4 | 0.4 | 25 | 2.39 | 2.3944 | 0.0044 | 0.18% |
| 0.4 | 0.4 | 35 | 2.29 | 2.3067 | 0.0167 | 0.73% |
| 0.2 | 0.3 | 25 | 2.26 | 2.4033 | 0.1433 | 6.34% |
| 0.2 | 0.3 | 35 | 2.03 | 2.4926 | 0.2426 | 10.78% |
| 0.6 | 0.3 | 25 | 2.32 | 2.3168 | −0.0032 | 0.14% |
| 0.6 | 0.3 | 35 | 2.30 | 2.3413 | −0.0087 | 0.37% |
| 0.2 | 0.2 | 30 | 1.28 | 1.2608 | −0.0192 | 1.50% |
| 0.2 | 0.4 | 30 | 1.81 | 1.9064 | 0.0964 | 5.33% |
| 0.6 | 0.2 | 30 | 1.85 | 1.8625 | 0.0125 | 0.68% |
| 0.6 | 0.4 | 30 | 2.54 | 2.5583 | 0.0183 | 0.72% |
| 0.4 | 0.3 | 30 | 1.85 | 2.0879 | 0.1379 | 7.07% |
| 0.4 | 0.3 | 30 | 2.06 | 2.0879 | 0.0279 | 1.35% |
| 0.4 | 0.3 | 30 | 1.95 | 2.0879 | −0.0621 | 2.89% |
| 0.4 | 0.3 | 30 | 1.91 | 2.0879 | 0.1779 | 9.31% |
| 0.4 | 0.3 | 30 | 2.10 | 2.0879 | −0.0121 | 0.58% |
Table 8.
Test values of grind-hardening compared with the predictions of BP neural network.
| Grinding Parameters | Test Values Ra (μm) | Predictions Ra’ (μm) | Absolute Errors (μm) Ra’−Ra | Relative Errors (%) |Ra’−Ra|/Ra | ||
|---|---|---|---|---|---|---|
| vw (m·min−1) X1 | ap (mm) X2 | vs (m·s−1) X3 | ||||
| 0.4 | 0.4 | 30 | 2.15 | 2.0750 | −0.075 | 3.49% |
| 0.2 | 0.2 | 35 | 1.75 | 1.8957 | 0.1457 | 8.33% |
| 0.4 | 0.3 | 25 | 2.23 | 2.2165 | −0.0135 | 0.61% |
Publisher’s Note: MDPI stays neutral with regard to jurisdictional claims in published maps and institutional affiliations. |
© 2022 by the authors. Licensee MDPI, Basel, Switzerland. This article is an open access article distributed under the terms and conditions of the Creative Commons Attribution (CC BY) license (https://creativecommons.org/licenses/by/4.0/).
Share and Cite
MDPI and ACS Style
Wang, C.; Wang, G.; Shen, C. Analysis and Prediction of Grind-Hardening Surface Roughness Based on Response Surface Methodology-BP Neural Network. Appl. Sci. 2022, 12, 12680. https://0-doi-org.brum.beds.ac.uk/10.3390/app122412680
AMA Style
Wang C, Wang G, Shen C. Analysis and Prediction of Grind-Hardening Surface Roughness Based on Response Surface Methodology-BP Neural Network. Applied Sciences. 2022; 12(24):12680. https://0-doi-org.brum.beds.ac.uk/10.3390/app122412680
Chicago/Turabian StyleWang, Chunyan, Guicheng Wang, and Chungen Shen. 2022. "Analysis and Prediction of Grind-Hardening Surface Roughness Based on Response Surface Methodology-BP Neural Network" Applied Sciences 12, no. 24: 12680. https://0-doi-org.brum.beds.ac.uk/10.3390/app122412680
Note that from the first issue of 2016, this journal uses article numbers instead of page numbers. See further details here.