Article

Bioinformatics Characterization of Candidate Genes Associated with Gene Network and miRNA Regulation in Esophageal Squamous Cell Carcinoma Patients

by
Bharathi Muruganantham
1,
Bhagavathi Sundaram Sivamaruthi
1,2,*,
Periyanaina Kesika
1,
Subramanian Thangaleela
1 and
Chaiyavat Chaiyasut
1,*
1
Innovation Center for Holistic Health, Nutraceuticals, and Cosmeceuticals, Faculty of Pharmacy, Chiang Mai University, Chiang Mai 50200, Thailand
2
Office of Research Administration, Chiang Mai University, Chiang Mai 50200, Thailand
*
Authors to whom correspondence should be addressed.
Submission received: 18 November 2021 / Revised: 17 December 2021 / Accepted: 26 December 2021 / Published: 20 January 2022

Abstract

:

Featured Application

Esophageal squamous cell carcinoma (ESCC) is the most common and frequent epithelial malignancy of the esophageal diagnosed among esophageal carcinoma (ESCA) worldwide. Despite enormous studies, the effect of gene overexpression and the overall survival rate associated with a genes mutation is still poorly understood. A biomarker to predict survival is a critical need in ESCC treatment. We hypothesized that a top ten hub gene (HGsT10) could be used as a predictive biomarker for the treatment response in metastatic ESCC. We found that HGsT10 expressed highly at the tumor state, reflecting the tumor development and poor survival rate in ESCC.

Abstract

The present study aimed to identify potential therapeutic targets for esophageal squamous cell carcinoma (ESCC). The gene expression profile GSE161533 contained 84 samples, in that 28 tumor tissues and 28 normal tissues encoded as ESCC patients were retrieved from the Gene Expression Omnibus database. The obtained data were validated and screened for differentially expressed genes (DEGs) between normal and tumor tissues with the GEO2R tool. Next, the protein–protein network (PPI) was constructed using the (STRING 2.0) and reconstructed with Cytoscape 3.8.2, and the top ten hub genes (HGsT10) were predicted using the Maximal Clique Centrality (MCC) algorithm of the CytoHubba plugin. The identified hub genes were mapped in GSE161533, and their expression was determined and compared with The Cancer Genome Atlas (TCGA.) ESCC patient’s samples. The overall survival rate for HGsT10 wild and mutated types was analyzed with the Gene Expression Profiling Interactive Analysis2 (GEPIA2) server and UCSC Xena database. The functional and pathway enrichment analysis was performed using the WebGestalt database with the reference gene from lumina human ref 8.v3.0 version. The promoter methylation for the HGsT10 was identified using the UALCAN server. Additionally, the miRNA-HGsT10 regulatory network was constructed to identify the top ten hub miRNAs (miRT10). Finally, we identified the top ten novel driving genes from the DEGs of GSE161533 ESCC patient’s sample using a multi-omics approach. It may provide new insights into the diagnosis and treatment for the ESCC affected patients early in the future.

1. Introduction

Esophageal carcinoma (ESCA) is the eighth most frequent cancer globally in terms of incidence and fatality. ESCA pathogenesis is complicated by several genes and proteins with aberrant expression and activity, although the precise cause is unknown [1,2,3]. The etiology of this condition remains unclear, and there is no definitive serum marker [1,4]. It has been recognized that ESCA has various histological subtypes, the most common of which are esophageal adenocarcinoma (AC), esophageal squamous cell carcinoma (ESCC), and small cell carcinoma (SCC) [5]. The squamous cell carcinoma is the most frequent epithelial malignancy of the esophageal [6,7]. Despite continual advancements in the use of surgeries, radiation, chemotherapy, targeted therapy, immunotherapy, and anti-cancer drugs in the holistic treatment of cancer, the 5-year mortality rate is less than 10% globally [8,9,10,11]. The molecular mechanism underlying the incidence and progression of ESCC has yet to be fully understood [12]. Therefore, it is urgent to explore novel biomarkers for diagnosis, prognosis, and development of new anti-cancer drugs for ESCC susceptible individuals. Although, deep processing of publicly accessible genomic data to find new and unique gene predictive signals can help patients with prognostic classification and tailored treatment. Presently, one of the primary goals of ESCC research is to find essential genes or particular biomarkers. It influences the onset and progression of ESCC to identify genetic and epigenetic risk factors and better understand their possible underlying molecular mechanism [12,13,14].
Epigenetics is the study to describe any heritable change in gene expression that is not associated with a difference in the chromosomal DNA sequence [15,16,17]. The most prevalent epigenetic modification is DNA methylation, linked to gene expression regulation, fetal development, specific gene inactivation, genomic integrity, genomic imprinting, and cell proliferation [18,19,20]. DNA methylation of genes at the promoter region is linked to the silence of essential genes, including oncogenes and tumor suppressors, and is considered a cornerstone of many malignancies [21,22,23]. Even though several researchers have demonstrated that specific genes with aberrant DNA hyper or hypomethylation are involved in various stages of ESCC development, determining the complete profile and mechanisms of the interaction network remains problematic [24,25,26]. In this pertain, we have predicted methylation at the promoter region for the top ten hub genes (HGsT10).
The ability to accurately identify and characterize the metabolic pathway from the identified hub genes that regulate the biological processes related to ESCC is essential. It may be provided by implementing an extensive assessment of numerous datasets. This perspective identifies the biological process, molecular function, and metabolic pathway of hub genes/oncogenes using the WebGestalt toolkit to understand the underlying interactive mechanisms extensively. Likewise, Liu et al. predicted the prognostic marker and hub genes by analyzing the hepatocellular and gynecological carcinoma TCGA samples. The study’s outcome stated that it might be helpful in personalized therapy to decide medical practice [27,28]. Feng et al. also described that identifying signature genes in ovarian cancer patients’ samples is vital as potential therapeutic targets [29]. Wang et al. determined that the vital role of hub genes in the progression of head and neck cancer might be used to invent the novel diagnostic method and treatment [30]. However, no extensive investigation has been conducted to determine the mutational essentiality and its impact on the overall survival rate of ESCC patients [31,32]. We integrated genome-wide DNA methylation and gene expression data to find DNA methylation indicators for early ESCC diagnosis.
The present study found the top ten hub genes and their essentiality in tumor growth by implementing publicly available a gene expression omnibus (GEO) dataset, GSE161533, which contains DEGs across 28 tumors and 28 normal tissues of the esophagus from ESCC patients. At the first top 250 DEG’s, they were predicted from the GEO dataset GSE161533 based on the p-value GEO2R analyzer. We constructed a protein–protein interaction (PPI) network for the top 250 DEGs using STRING 2.0 with hierarchical clustering and functional enrichment analyses of Gene Ontology (GO) and Kyoto Encyclopedia of Genes and Genomes (KEGG) pathways. We identified HGsT10 with the help of CytoHubba. Likewise, we have analyzed the finding essentiality in expression at various stages, mutation and its effect on overall survival rate and promoter methylation with its histology.
Furthermore, the miRNAs that targeted the HGsT10 were also predicted to play central roles in cancer development via the regulation of its target genes. On the other hand, mutation-based studies often focus on a single gene or cancer type and do not contain extensive assessments of possible gene interactions that might predict survival. The overall survival analysis for HGsT10 and its variant was performed using the Gene Expression Profiling Interactive Analysis 2 (GEPIA2) and University of California, Santa Cruz (UCSC) Xena databases. Our study combined the multi-omics analysis platform, which included gene expression profiling microarrays, comparative analysis with various stages, functional enrichment, promoter methylation, wild and mutated type overall survival analysis, miRNA regulation. We suggested that our data provided detailed biological information about differentially expressed novel hub genes. These findings may be used to improve our understanding of ESCC to derive novel diagnostic methods and anti-cancer drugs against ESCC.

2. Materials and Methods

2.1. Affymetrix Microarray Data

The gene expression profile dataset no. GSE161533 deposited in the Gene Expression Omnibus (GEO) database (https://0-www-ncbi-nlm-nih-gov.brum.beds.ac.uk/geo/) (accessed on 17 December 2021) [33] by Qiu et al., based on the GPL570 platform (Affymetrix Gene Chip Human Genome U133 plus 2.0 Array), was subjected to bioinformatics analysis in the present study [34]. The dataset contained a total of 84 samples, including 28 esophageal squamous cell carcinoma tissues and 28 normal paired esophageal tissues, and 28 para-tumor esophageal tissues obtained from ESCC patients.

2.2. DEG’s Processing Using GEO2R

The GEO2R back-end transforms and analyses GEO data using well-known Bioconductor [35] R tools and then delivers the findings as a table of genes sorted by relevance displayed with GEO Profile visualizations. DEGs between ESCC tissues and normal esophageal tissues were identified via GEO2R online tools with |logFC| > 2 and adjusted p-value < 0.05 with default false discovery rate for multi testing. The top 250 genes were extracted from the whole dataset for further analysis. The DEGs of genes were designated as downregulated ones with log FC < 0, whereas upregulated ones were designated with log FC > 0.

2.3. PPI Network Construction to Identify Hub Genes

The gene network for the anticipated top 250 DEGs from the previous analysis was constructed using the STRING 2.0 database with a clustering coefficient of 0.395 and a PPI enrichment p-value of <1.0 × 10⁻¹⁶ [36]. The network was enriched functionally with Kyoto Encyclopedia of Genes and Genomes (KEGG), Orthology [37], and Gene Ontology [38]. The functionally enriched network was obtained and reconstructed with the CytoScape 3.8.2 with a clustering coefficient of 0.098. The hub genes were identified from the reconstructed network using the CytoHubba module for the highly interacted top 10 genes using the Maximal Clique Centrality (MCC) algorithm with the clustering coefficient of 0.898 [39,40].

2.4. Analysis and Validation of HGsT10 Expression and Its Various ESCC Stages

The predicted HGs10 expressions were analyzed in the ESCC patient’s sample data GSE161533 and then compared with TCGA (https://portal.gdc.cancer.gov) (accessed on 16 September 2021) samples of ESCC patients. The TCGA. samples were accessed via GEPIA2 (http://gepia.cancer-pku.cn/) (accessed on 16 September 2021) tool with the cutoff of |Log2FC| = 1.0 and p-value = 0.01 matched with TCGA normal samples and GTEx data [41]. The TCGA sample size for the normal is 286, and the ESCC tumor is 182. The HGsT10 expression was analyzed in the ESCC major stages may be implied to predict different stages of ESCC patients.

2.5. The Overall Survivability and Promoter Methylation

The overall survival (OS) rate of HGsT10 was analyzed. The TCGA patient samples were differentiated into two groups (high vs. low expression) and assessed by a Kaplan–Meier survival plot, with a log-rank p-value of 0.5 generated from GEPIA2. The survival rate was measured by,
S ^   t   = i : t i     t 1 d i n i
where, S ^   t = survival function; ti = a time when at least one event happened; di = the number of deaths; and ni = the individuals survived up to time [41]. The promoter methylation under the tumor histological condition was analyzed for the HGsT10 genes using the UALCAN server (http://ualcan.path.uab.edu) (Accessed: 10 December 2021). UALCAN is an online resource for exploring cancer transcriptome data [42]. TCGA data may investigate gene expression, promoter methylation, correlation, and prognosis across cancers.

2.6. Comparison of HGsT10 Gene Expression and Somatic Mutation Identification

From the University of California Santa Cruz (UCSC) Xena database (https://xenabrowser.net/datapages/) (Accessed: 10 December 2021) [43], the HTSeq counts of RNA-seq data for ESCC including 251 tumor samples were obtained (Fragments Per Kilobase of transcript per Million mapped reads upper quartile) with its log-transformed value as follow,
l o g 2 f p k m u q + 1
and analyzed. The overall survival data of the mutated HGsT10 gene for the ESCA patients were obtained. The Kaplan–Meier analysis with log-rank test was implemented to compare overall survival across different samples of ESCA.

2.7. HGsT10 Interaction with Other Genes and miRNA

The miRNAs are majorly involved in the pathophysiology of all types of human tumors. It was expressed between tumors and normal tissues with various differential rates in multiple cancers such as lung, glioblast, hepatocellular carcinomas, pancreatic, pituitary adenomas, cervical, brain, etc. However, the interaction between miRNAs and oncogenes remains unknown in ESCC. Here, the study constructed the miRNA- HGsT10 network to know the miRNA regulation in ESCC. The study used the miRNet 2.0 databases [44] to obtain the raw data and then reconstructed using CytoScape 3.8.2 with the help of the CytoHubba module ranked by the clustering coefficient algorithm and identified the top 10 hub miRNA (HmiRT10) for the predicted HGsT10 [38,39]. The network parameter was analyzed with the Network Analyzer plugin [45].

2.8. Functional and Pathway Enrichment Analysis for the Predicted HGsT10 Genes

DEGs from the two datasets were intersected to identify appropriate differential genes, which were then used to investigate the proper functioning of particular genes. Gene Ontology (GO) and KEGG enrichment analysis were used to explore molecular functions, biological pathways, and cellular components using the WebGestalt online tool (http://www.webgestalt.org) (Accessed: 17 December 2021) [46,47]. It uses the hypergeometric test to evaluate the significance of enrichment. The basic parameters were set to include: Homo sapiens as the organism of interest, over-representation analysis (ORA) as the method of claim, with the reference gene from lumina human ref 8.v3.and gene ID type as the gene symbol. The reference genes mapped with 24,770 Entrez gene IDs and 15,372 IDs were annotated to the selected functional categories of the predicted HGsT10. The significance of the enrichment ratio was calculated using the formula,
P = i = k n m J n i j i m n
where, P = significance of enrichment; m = genes in the reference gene set (B); n—genes in the interesting gene set (A); Significant differences were set as FDR < 0.05.

3. Results

3.1. The GEO Dataset Validation

GSE161533 dataset was downloaded from the Gene Expression Omnibus (GEO) database and validated with GEO2R before starting the analysis. A volcano plot displays statistical significance (−log10 p-value) versus magnitude of change (log2 fold change), and the adjusted p-value set as <0.05 is useful for visualizing differentially expressed genes in normal and tumor samples (Figure 1A).
The sample groups are clean and separated significantly, which implements the Uniform Manifold Approximation and Projection method (UMAP) (Figure 1B). The downloaded dataset was analyzed to estimate the normalization generated using an R boxplot with its median-cantered values shown in Figure 1C. It describes that the selected data are normalized and cross-comparable. The results achieved with GEO2R in this study suggest that the selected samples can be used for further analysis.

3.2. Identification of DEGs and HGsT10 and PPI Network Construction for ESCC Tumor and Normal Tissues

Our present study has 28 ESCC tumor tissues and 28 normal esophageal tissues. Via GEO2R online tools, we extracted 250 DEGs from GSE161533. Results showed that a total of 113 DEGs were downregulated (logFC < 0), and 117 DEGs were upregulated genes (logFC > 0) in both tumor and normal tissues noted in Tables S1–S3 (Supplementary File S1). The extracted genes were constructed as a PPI network using the STRING 2.0 database, designed to predict gene–gene interactions. The STRING database was used to build a network model, and the genes with a score of ≥0.4 were chosen. The resulted network consisted of 195 nodes and 292 edges and an average local clustering coefficient of 0.395. The constructed network was reconstructed with the CytoScape 3.8.2. and HGsT10 were identified using the CytoHubba module (Figure 2A). It used the Maximal Clique Centrality (MCC) algorithm, the most effective method of finding hub nodes. The top ten genes ranked with MCC scores were deliberated as hub genes in this annotation. The hub genes selected from the PPI network using the MCC algorithm of the CytoHubba plugin are shown in Figure 2B.
According to the MCC sores, the top ten highest-scoring genes, namely matrix metallopeptidase 9 (MMP9), matrix metallopeptidase 3 (MMP3), matrix metallopeptidase 1 (MMP1), C-X-C motif chemokine ligand 8 (CXCL8), secreted phosphoprotein 1 (SPP1), urokinase plasminogen activator (PLAU), matrix metallopeptidase 13 (MMP13), collagen type I alpha 1 chain (COL1A1), collagen type I alpha two chains (COL1A2), and plasminogen activator, urokinase receptor (PLAUR), were identified as the hub genes.

3.3. Verification of the HGsT10 Expression Patterns

After the ten hub genes (MMP9, MMP3, MMP1, CXCL8, SPP1, PLAU, MMP13, COL1A1, COL1A2, and PLAUR) were screened out by the CytoHubba plugin, we verified the expression levels of the HGsT10 among the ESCC patient’s sample with the GEO dataset GSE161533. The HGsT10 expression was demonstrated among the ESCC patient’s sample of the TCGA database (Figure 3).
As shown in Figure 3A the MMP9 expression was noted maximum (198.822 TPM) in normal tissues (sample id GSM4909563). The samples GSM4909612, and GSM4909628 showed the expression of 2204.43, and 2231.53 TPM, respectively. Likewise, MMP3 (normal tissue sample max (NTSM), GSM4909557 = 9.8356; tumor tissues sample max (TTSM), GSM4909617 = 987.431), MMP1 (NTSM, GSM4909563 = 128.084; TTSM, GSM4909619 = 3143.52), CXCL8 (NTSM, GSM4909578 = 153.367; TTSM, GSM4909619 = 3034.75), SPP1 (NTSM, GSM4909566 = 106.629; TTSM, GSM4909612 = 2348.91), PLAU (NTSM, GSM4909569 = 133.366; TTSM, GSM4909632 = 1186.85), MMP13 (NTSM, GSM4909568 = 9.7126; TTSM, GSM4909629 = 313.765), COL1A1 (NTSM, GSM4909553 = 38.4753; TTSM, GSM4909622 = 1844.38), COL1A2 (NTSM, GSM4909566 = 2420.06; TTSM, GSM4909622 = 8155.97), and PLAUR (NTSM, GSM4909566 = 110.395; TTSM, GSM4909636 = 488.016 TPM) was upregulated in tumor tissues samples aberrantly, which might be a major cause in the ESCC tumor development. Furthermore, Figure 3B, describes that all of the HGsT10 was significantly upregulated in ESCC patient’s samples compared with normal subjects.

3.4. The Comparison of Expression of HGsT10 in the ESCC Patients with Other Types of EC

The identified gene expression data were represented as a heatmap, which is the common method of visualizing gene expression data (Figure 4A). The heatmap combined with clustering methods includes the identified HGsT10 genes and 160 samples together in the gene expression pattern. The expression pattern is displayed in a grid, and each row represents a gene, and each column represents a sample. The color red represents upregulated genes, blue represents downregulated genes, and white represents an unchanged expression.
Only two patients were affected by cystic, mucinous, and serous neoplasm (CMSN); hence the study excluded the expression comparison of HGsT10 in CMSN. The gene MMP9 was more upregulated in squamous cell neoplasms (SCN) than adenomas and adenocarcinomas (AAC) with the lower quartile (Q1) = −0.444, upper quartile (Q3) = 0.871 and median = 0.219; MMP3 expressed highly in AAC with Q1 = −0.571, Q3 = 0.752 and median = 0.168; MMP1 expressed majorly in SCN with Q1 = −0.705, Q3 = 2.25, and median = 0.279; CXCL8 expression slightly increased in AAC with Q1 = −0.551, Q3 = 0.702, and median 0.137; SPP1 was highly expressed in SCN with Q1 = −0.279, Q3 = 1.10, and median = 0.470; PLAU expressed highly in SCN with Q1 = −1.44, Q3 = 2.36, and median = 0.487; MMP13 expression is highly observed in SCN with Q1 = 0.0822, Q3 = 1.28, and median 0.473; COL1A1 highly expresses in SCN with Q1 = −0.272, Q3 = 1.13, and median = 0.314; Likewise, COL1A2 was expressed highly in SCN with Q1 = −0.561, Q3 = 1.13, and median 0.356; PLAUR expression was increased in AAC with Q1 = −0.477, Q3 = 1.08, and median = 0.532. It describes that genes MMP9, MMP1, SPP1, PLAU, MMP13, COL1A1, and COL1A2 expression might be increased in the advanced stage of ESCC tumor patients.

3.5. Correlation between HGST10 Genes Expression and Tumor Stage in Patients with ESCC Carcinoma

We have analyzed the tumor stage in ESCC patients and represented this in Figure 5. Using TCGA data, the identified HGsT10 gene expression was analyzed by main pathological stages I, II, III, and IV, to reveal the importance of genes for the concerns in the diagnosis and treatment of ESCC patients. The analyses demonstrated that the expression of MMP9, SPP1, PLAU, MMP13, COL1A1, and COL1A2 with the Pr-value 0.01, 0.000951, 0.0491, 0.0237, 0.0217, and 0.00258 (Pr-value < 0.05), respectively. The major stage plot annotation revealed their high expression levels significantly associated with the advanced ESCC stage. The remaining genes such as MMP3, MMP1, CXCL8, and PLAUR with the Pr-value of 0.421, 0.981, 0.369, and 0.596 are not significantly associated with the advanced stage of ESCC, respectively. In addition, OS analyses of the predicted HGsT10 genes were performed by the GEPIA2 database (Figure S1) to investigate the hub genes’ predictive values in the ESCC patients. The relationship of HGsT10 overexpression with prognosis in all 182 ESCC patients was also analyzed. ESCC patients were divided into low (91) and high (91) patients and identified the overall survival rate in months based on the gene expression median value. The results showed that patients with a high expression level of HGsT10 genes have a lower overall survival rate. It suggests that the inhibition of the expression level of the anticipated HGsT10 might reduce the tumor growth of ESCC patients.

3.6. The Validation of HGsT10 Expression by Promoter Methylation in ESCC Patients

The predicted HGsT10 promoter methylation under tumor histology was analyzed in ESCC patients using UALCAN server (Figure 6).
The results showed that the methylation was reduced in ESCC more than the normal (N) and adenocarcinoma (AC) for the following genes, MMP3 (N = 0.84; AC = 0.73; Squamous cell carcinoma (SCC) = 0.69) (Figure 6B), PLAU (N = 0.18; AC = 0.17; SCC = 0.17) (Figure 6F) and COL1A2 (N = 0.20; AC = 0.39; SCC = 0.17) (Figure 6I). The resulted median value of the methylated genes indicates higher expression in ESCC patients’ samples. Hence, the hypomethylated genes such as MMP3, PLAU, and COL1A2 could lead to cell proliferation, dysregulation of metabolic pathways, uncontrollable activation of tumor-relevant signaling networks, and cell cycle dysregulation. A convincing argument for a tumor-driving role of DNA methylation can be made when the same genes are also frequently mutated in cancer. Identification of somatic mutation and mRNA gene expression is crucial, which typically affects the survival outcomes of ESCA patients. We have also ensured the predicted survival outcomes are not generated randomly with null models while maintaining the correlations among variables. The predicted KM plot for the somatic mutation and its effect on the overall survival rate of the ESCA patients are shown in Figure S2 (Supplementary File S2). The mutation that occurs in the HGsT10 drastically decreases the patient’s survival rate. However, the mutation occurs only in smaller samples and reveals targetable combinations of mRNA expression events. Notably, COL1A2 and MMP9 mutated in six (1 Splice, 3 Missense/Inframe, 1 Silent, and 1 Intron/R.N.A.) and five (2 Missense/Inframe, 2Silent, and 1Intron/R.N.A.) genes samples resulted in the decreased survival rate with the p-value of 0.9460 and 0.06011. To our knowledge, this is the first systematic analysis of the association between genes wild-type and mutated type effects in the overall survivability of the ESCA patients.

3.7. The Predicted HmiRT10 from the Constructed miRNA-HGsT10 Regulatory Network

The miRNA-HGsT10 genes network was constructed to identify the greatest number of possible miRNAs involved in the pathogenesis of ESCC (Figure 7A).
The constructed network targeted 367 miRNA nodes and 597 edges. The top ten hub miRNAs (HmiRT10) were predicted with the constructed miRNA-HGsT10 regulatory network. The identified HmiRT10 are hsa-let-7b-5p, hsa-let-7f-5p, hsa-let-7c-5p, hsa-let-7d-5p, hsa-mir-19a-3p, hsa-mir-21-5p, hsa-let-7e-5p, hsa-let-7a-5p, hsa-mir-16-5p, and hsa-mir-19b-3p (Figure 7B). The parameter for the constructed HmiRT10 was tabulated (Table 1).

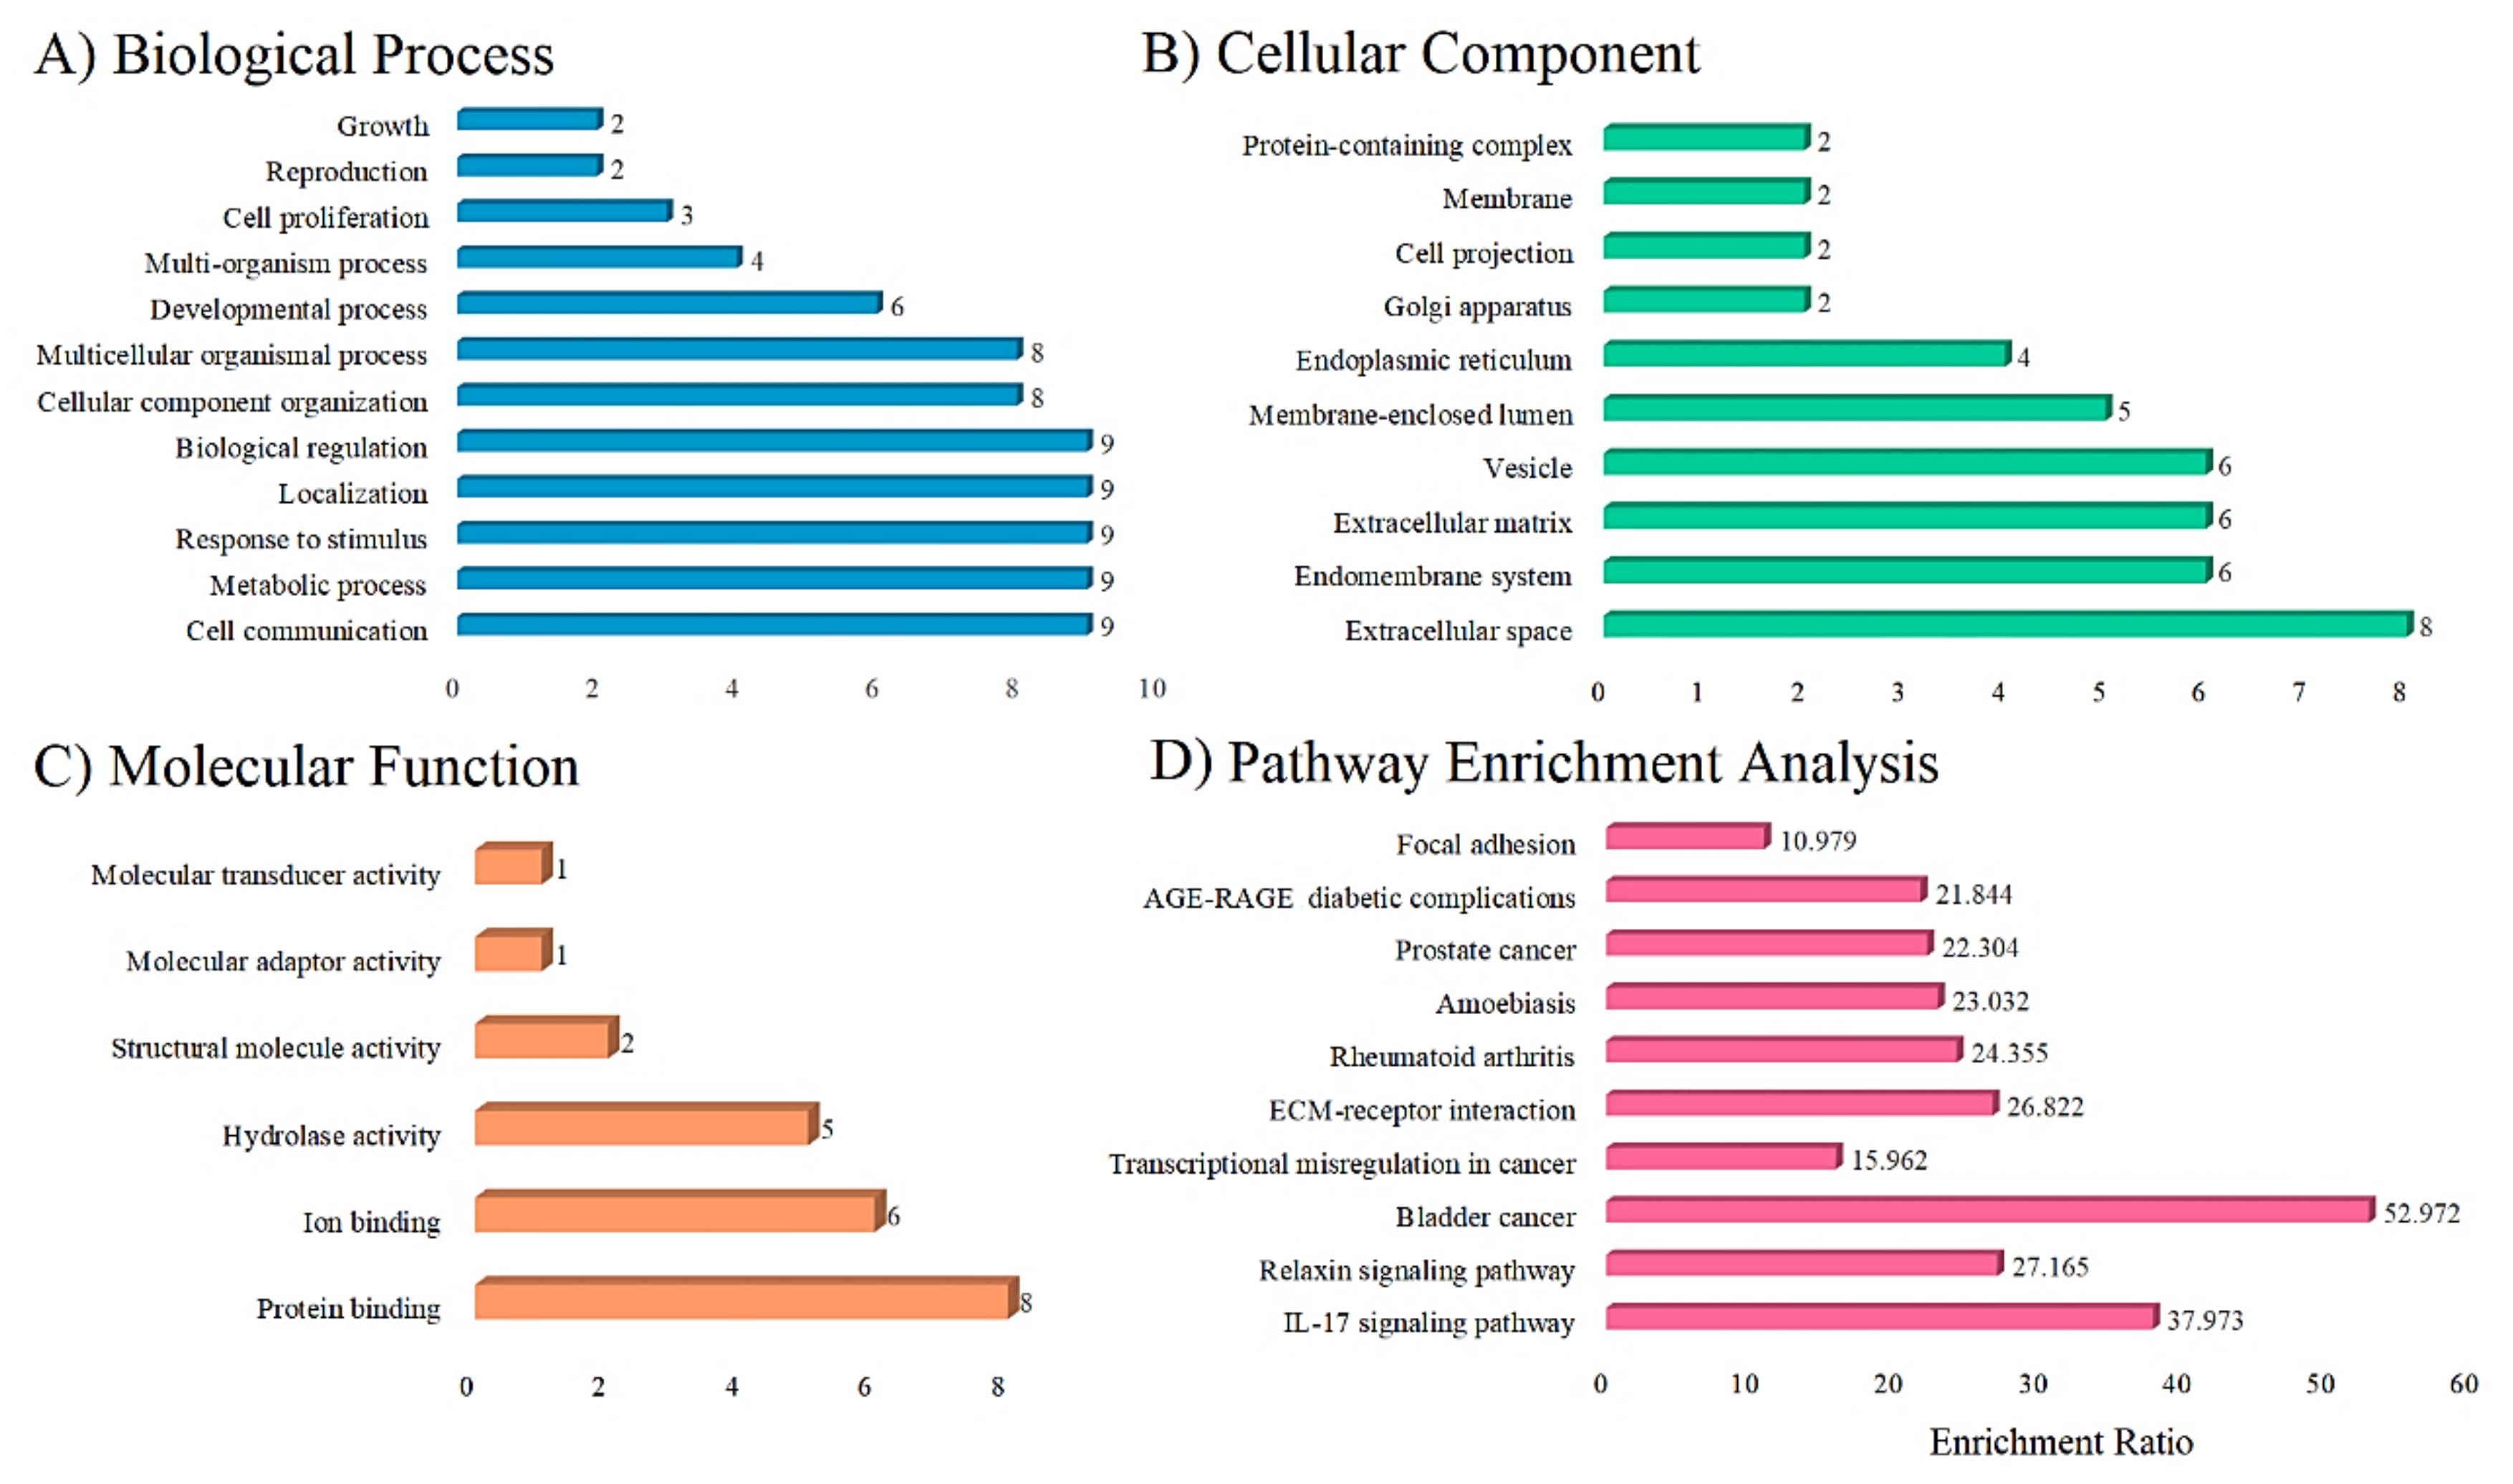
3.8. Functional and Pathway Enrichment Analysis

The illumina_humanht_12_v3 was used as the reference to map 24,770 Entrez gene IDs, and 15,372 IDs are annotated to the selected functional categories for HGsT10 genes to enrich the pathway. The biological function was predicted with the KEGG ontology to know the functional integrity of the HGsT10 (Figure 8). Notably, most of the genes are involved in cell communication, metabolic process, stimulus-response, and biological regulation. Likewise, most of the genes located in the extracellular matrix is a key determinant of tumor development and prognosis and are involved in the protein-binding activity.
The enriched pathway significantly resulted in group one HGsT10 (CXCL8, MMP1 and, MMP9) and group two HGsT10 (CXCL8, MMP1, MMP13, MMP3 and, MMP9) are involved in the bladder cancer and IL-17 signaling pathway response with the enrichment ratio of 52.972 and 37.973. The predicted biological process (Figure 8A), cellular component (Figure 8B), and molecular function (Figure 8C). The enriched and annotated pathway was depicted in Figure 8D as a bar chart.
The resulting enriched pathway for the mapped HGsT10 genes is noted in Table 2 and Table S5 (Supplementary File S1).

4. Discussion

ESCA is the most common cause of cancer death and starts in the esophageal mucosa’s epithelial tissues. ESCA is the world’s eighth most prevalent cancer and the sixth most lethal worldwide. The most frequent histologic subtype of ESCA in ESCC. Most of the patients affected by EC are discovered at an advanced stage and are typically incurable. Despite extensive research into the mechanisms causing ESCC, reliable biomarkers for ESCC diagnosis, prognosis, and clinical targeting are still lacking. The mechanisms regulating ESCC have still not been completely understood [48,49]. In the present study, GEO dataset GSE161533 with high quality was selected to identify the hub genes associated with ESCC and their associated biological pathways by integrated multi-omics analysis. We chose the top 250 DEGs consisting of 136 upregulated genes, and 113 downregulated genes were identified, and they were used to construct the PPI network. Finally, we identified the HGsT10 significantly on the MCC scores in the PPI network.
The expression of HGsT10 genes (namely, MMP9, MMP3, MMP1, CXCL8, SPP1, PLAU, MMP13, COL1A1, COL1A2, and PLAUR) was identified in the GSE161533 sample and validated with the TGCA dataset. The expression rate of HGsT10 was increased for all the predicted hub genes. Notably, MMP1, SPP1, and MMP13 log-transformed TPM values are highly increased compared to other HGsT10 genes. The overexpression of MMP1 promoted tumor growth and metastasis by activating the PI3K/AKT pathway [50]. Furthermore, it makes a significant contribution to the extracellular matrix remodeling that occurs during tumor progression and metastasis [51]. Likewise, SPP1 plays a crucial role in the tumor growth of ESCC and can be used as a molecular biomarker in the early detection and diagnosis [52]. Similarly, the upregulation of MMP13 by activating the ERK1/2 pathway promoted tumor progression at metastasis and transformed squamous epithelial cells across various tissues [53,54,55].
The expression of HGsT10 genes based on the type of diseases was predicted with the GDC TCGA ESCA patients, including 160 patient samples. The expression level of MMP9, MMP1, SPP1, PLAU, MMP13, COL1A1 and COL1A2 genes was more highly increased in the squamous cell carcinoma than other ESCA types and worsened the overall survival rate of the patients. Most of the predicted HGsT10 genes are overexpressed early, such as MMP9, MMP1, CXCL8, SPP1, PLAU, MMP13, COL1A1, and PLAUR may be used as significant biomarkers to diagnose and treat the ESCC patients at an early stage. The overall survival rate of ESCA patients was drastically decreased with the increased expression of the predicted HGsT10 genes, especially CXCL8, SPP1, PLAU, MMP13, and PLAUR. Jiao et al. and Sedighi et al. stated that the MMP13 concentration in serum was used to diagnose and treat ESCC patients early [56,57]. Likewise, MMP-9, MMP1, and MMP13 serum concentrations were linked to clinical stages, and tumor size may decrease the overall survival rate of the ESCC patients [58,59,60]. The upregulation of CXCL8 in the microenvironment may lead to ESCC tumor development. Its regulation is triggered by the activation of the Akt and Erk1/2 pathways. It was accelerating the cancer cell movement and penetration. It also affects the overall survival rate of the patients drastically [61,62,63,64]. PLAU is abundantly elevated in ESCC, which triggers the formation of fibroblasts to inflammatory cancer-associated fibroblasts by activating the uPAR/Akt/NF-κB/IL8 pathway, which leads to a poor prognosis of ESCC patients [65].
The overexpression of MMP1 promoted tumor growth and metastasis by activating the PI3K/AKT pathway [50]. Furthermore, COL1A1 showed a poor survival rate associated with PI3K/Akt/mTOR, p53, apoptosis, and cell cycle pathway [66]. These findings imply that further research into the involvement of collagen family members in ESCC is needed in the future to advance ESCC identification and therapy [67]. Furthermore, the somatic mutations were identified and warranted meaningful association with decreased overall survival rate compared with wild-type. The mutated genes such as MMP9, PLAU, MMP13, and COL1A1 all drastically reduced the overall survival of ESCA patients. Booka et al. also identified that the somatic mutations in NFE2L2, CDKN2A and, KMT2D in ESCC significantly diminish overall survivability compared with its wild-type [68]. Our results suggest, the mutations, on the other hand, are found in only a few samples. Even with its overexpression rather than the mutation, the overall survival rate is reduced significantly.
The promoter methylation identified for the predicted HGsT10 genes based on the disease type by utilizing the TCGA ESCA samples consisted of 201 samples. The hypo-methylation was observed in MMP3, MMP1, CXCL8, SPP1, PLAU, MMP13, COL1A1, COL1A2, and PLAUR in ESCC patient’s samples when compared with normal samples. Our promoter methylation results suggested that hypo-methylated nine genes among HGsT10 are overexpressed in ESCC patient samples. Our findings suggest that the hypo-methylation at the promoter region directly correlated with overexpression, which leads to tumor proliferation and poorer prognosis of ESCC patients, as noted in the overall survival analysis of HGsT10. Li et al. and Cui et al. described that aberrant expression of overexpressed in the lung cancer 1 (OLC1) gene and the phospholipase C epsilon 1 (PLCE1) and nuclear factor-kappaB (NF-kappaB)-related proteins highly promote the ESCC tumorigenesis [69,70]. Likewise, Iwaya et al. described that the downregulation of the ST6GALNAC1 gene might be a possible causative gene for ESCC tumor proliferation due to its hypermethylation [71].
The MicroRNAs (miRNAs) regulate gene expressions in tumor and tumor-adjacent tissue [72]. Lorusso et al. explained that miRNAs could facilitate communication between tumor cells and their surroundings and control tumor immunity by directly regulating genes associated with immune stimulation or inactivation [73]. Here, we analyzed prognostic miRNAs of crucial histopathological subtypes ESCC on the predicted HgsT10 genes from the GSE161533 dataset. The constructed miRNA-HGsT10 network consisted of 367 miRNAs. The top ten hub miRNAs (HmiRT10) were identified, which regulates HGsT10 (namely hsa-let-7b-5p, hsa-let-7f-5p, hsa-let-7c-5p, hsa-let-7d-5p, hsa-mir-19a-3p, hsa-mir-21-5p, hsa-let-7e-5p, hsa-let-7a-5p, hsa-mir-16-5p and hsa-mir-19b-3p). The miRNA hsa-let-7b-5p, hsa-let-7f-5p, hsa-let-7c-5p, hsa-let-7d-5p and hsa-let-7a-5p regulates the target genes COL1A1, COL1A2 and CXCL8. The miRNA hsa-let-7e-5p regulates CXCL8, COL1A2, and MMP9. Let-7 family miRNAs are known to serve as tumor suppressor genes, and decreased expression of these miRNAs is linked to a poor prognosis in cancer patients [74,75,76,77].
The miRNA hsa-mir-21-5p regulates CXCL8 and MMP9 with the decreased overall survival rate of the ESCA patients in the TCGA dataset. Furthermore, the resulting mutations for CXCL8 and MMP9 clearly stated that the ESCC tumor progression was directly correlated with overexpression. Zheng et al., also stated that hsa-miR-21-5p upregulates the MMP9 gene in cardioembolic stroke patients [78]. Likewise, the miRNA hsa-mir-16-5p upregulated the HGsT10 such as CXCL8, COL1A1, MMP3, PLAUR, SPP1, and PLAU, which might affect the overall survival rate of the ESCC patients. The miRNA hsa-mir-19b-3p regulates PLAU and COL1A2, and hsa-mir-19a-3p regulates COL1A2 and PLAU, respectively. Jiang et al. identified that the miR-19b-3p significantly upregulated and led to colon cancer progression in 211 colon samples [79]. Similarly, overexpression of miR-19a was linked to a poor prognosis in various human cancers, including ESCC [80]. Our results revealed that the predicted HmiRT10 could be used as independent predictive biomarkers for the appropriate identification and treatment of ESCC.
GO analysis of the HGsT10 demonstrated that they were significantly enriched in the extracellular matrix (GO:0031012), biological processes of cell communication (GO:0007154), and protein binding (GO:0005515). The extracellular matrix has been linked to various elements of ESCA advancement, with this compartment being linked to several characteristics of EC genesis and progression [81]. The resulting pathway enrichment analysis evidenced that the HGsT10 genes are majorly involved in bladder cancer, IL-17 signaling pathway, and ECM-receptor interaction in rheumatoid arthritis (RA). Ahn et al. analyzed the association between breast cancer and RA using mendelian randomization (MR) analysis and reported that the underlying mechanism between these two diseases is still unclear [82].

5. Conclusions

Our study established a unique top ten signature genes and predicted the overall survival of ESCC, which can help in clinical decision-making for individual treatment by quantifying the expression of HGsT10 using quantitative real-time PCR (qPCR) technique. Accordingly, medications have to provide for the ESCC patients to save their lives. Additionally, independent miRNA datasets acquired from miRNet, the identified let-7 family and other miRNAs, mir-21-5p, miR-21-5p, mir-16-5p, mir-19b-3p, and mir-19a-3p were identified as independent prognostic miRNAs for ESCC overexpression of the predicted miRNAs, which might increase expression of HGsT10 within the GSE161533 and GDC TCGA samples. Our findings could also be clinically valuable in predicting the prognosis of ESCC in the advanced tumor stage. However, further experiments are warranted to confirm the miRNA utility in the expression of HGsT10, which is involved in the ESCC progression and development. Furthermore, further validation, such as small molecule discovery and transdifferentiation, are needed to develop appropriate medications to treat ESCC cancer patients even at the advanced stage.

Supplementary Materials

The following supporting information can be downloaded at: https://0-www-mdpi-com.brum.beds.ac.uk/article/10.3390/app12031083/s1, Table S1: The predicted top 250 DEGs of GSE161533 dataset from GEO Database; Table S2: The predicted down-regulated genes from the top 250 DEGs of GSE161533 dataset from GEO Database; Table S3: The predicted up-regulated genes from the top 250 DEGs of GSE161533 dataset from GEO Database; Table S4: FDR values for the enriched pathway terms; Table S5: The annotated GO function, Process and KEGG Pathway; Figure S1: Kaplan–Meier analysis of the relationship between overall survival and HGsT10 expression using GEPIA analysis included 91 normal and 91 tumor samples. The green trend line indicated the lower expression of HGsT10 and increased survivability. The red trend line indicates the overexpression of HGsT10 and decreased survivability in ESCA samples; Figure S2: The identification of somatic mutation for the HGsT10 and its co-relation with the overall survivability of the ESCA patients using the GDC TCGA dataset includes 160 samples (A–J). The Greyline indicates the overall survivability of the ESCA patients without the mutation. The blue line represents the overall survivability of the patients with mutations. Abbreviation: LRTS—Log-rank test statistics. The gene COL1A2 (I) and MMP9 (A) mutations were noted in 6 and 5 samples, respectively, with the decreased overall survivability.

Author Contributions

Conceptualization, B.M., B.S.S., P.K. and C.C.; methodology, B.M.; software, B.M.; validation, B.M., B.S.S. and C.C.; formal analysis, B.M.; investigation, B.M.; resources, C.C.; data curation, B.M.; writing—original draft preparation, B.M. and B.S.S.; writing—article and editing, B.M., B.S.S., P.K., S.T. and C.C.; supervision, C.C.; project administration, C.C. and B.S.S.; funding acquisition, C.C. All authors have read and agreed to the published version of the manuscript.

Funding

This research received no external funding.

Institutional Review Board Statement

Not applicable.

Informed Consent Statement

Not applicable.

Data Availability Statement

The data presented in this study are available within the article.

Acknowledgments

The authors gratefully acknowledge the Faculty of Pharmacy, Chiang Mai University, Chiang Mai for the support. The research was partially supported by the Chiang Mai University, Chiang Mai, Thailand. Also, B.M. would like to thank CMU Presidential Scholarships for their kind support on Post-Doctoral research.

Conflicts of Interest

The authors declare no conflict of interest.

References

  1. Li, Z.; Dong, K.; Guo, P.; Tan, Z.; Zhang, F.; Tian, Y.; Lv, H. Identification of Autophagy-Related Genes and Small-Molecule Drugs in Esophageal Carcinoma. Med. Sci. Monit. 2020, 16, e921855. [Google Scholar] [CrossRef] [PubMed]
  2. Ren, C.; Zhou, Z.; Wang, X.; Hua, X.; Zou, M.; Zhang, X. SHCBP1 Promotes the Progression of Esophageal Squamous Cell Carcinoma Via the TGFβ Pathway. Appl. Immunohistochem. Mol. Morphol. 2021, 29, 136–143. [Google Scholar] [CrossRef]
  3. Chen, Y.; Bieerkehazhi, S.; Li, X.; Ma, L.; Yibulayin, W.; Ran, J. Survivin Regulates Bad Gene Expression by Binding to Its Promoter and Modulates Cell Cycle and Apoptosis in Esophageal Carcinoma Cell. J. Oncol. 2021, 2021, 1384289. [Google Scholar] [CrossRef] [PubMed]
  4. Guo, W.; Jiang, Y.G. Current gene expression studies in esophageal carcinoma. Curr. Genom. 2009, 10, 534–539. [Google Scholar] [CrossRef] [PubMed] [Green Version]
  5. Lu, T.; Xu, R.; Li, Q.; Zhao, J.Y.; Peng, B.; Zhang, H.; Guo, J.D.; Zhang, S.Q.; Li, H.W.; Wang, J.; et al. Systematic profiling of ferroptosis gene signatures predicts prognostic factors in esophageal squamous cell carcinoma. Mol. Ther. Oncolytics 2021, 21, 134–143. [Google Scholar] [CrossRef] [PubMed]
  6. Cheng, X.Y.; Liu, Z.; Shang, L.; Cai, H.Q.; Zhang, Y.; Cai, Y.; Xu, X.; Hao, J.J.; Wang, M.R. Deletion and downregulation of MTAP contribute to the motility of esophageal squamous carcinoma cells. Onco Targets Ther. 2017, 10, 5855–5862. [Google Scholar] [CrossRef] [PubMed] [Green Version]
  7. Zhao, R.; Shan, Y.; Zhou, X.; Zhang, C.; Zhao, R.; Zhao, L.; Shan, B. MicroRNA-485-5p suppresses the progression of esophageal squamous cell carcinoma by targeting flotillin-1 and inhibits the epithelial-mesenchymal transition. Oncol. Rep. 2021, 45, 93. [Google Scholar] [CrossRef]
  8. Predescu, D.; Gheorghe, M.; Boeriu, M.; Constantin, A.; Iosif, C.; Anghel, R.; Constantinoiu, S. Molecular factors and criteria for predicting the response to neoadjuvant treatment in patients with esophageal squamous cell carcinoma (ESCC)—Responder/non-responder. Chirurgia 2012, 107, 583–590. [Google Scholar]
  9. Napier, K.J.; Scheerer, M.; Misra, S. Esophageal cancer: A Review of epidemiology, pathogenesis, staging workup and treatment modalities. World J. Gastrointest. Oncol. 2014, 6, 112–120. [Google Scholar] [CrossRef]
  10. Businello, G.; Parente, P.; Mastracci, L.; Pennelli, G.; Traverso, G.; Milione, M.; Bellan, E.; Michelotto, M.; Kotsafti, A.; Grillo, F.; et al. The Pathologic and Molecular Landscape of Esophageal Squamous Cell Carcinogenesis. Cancers 2020, 12, 2160. [Google Scholar] [CrossRef]
  11. Redondo, J.A.; Bibes, R.; Vercauteren Drubbel, A.; Dassy, B.; Bisteau, X.; Maury, E.; Beck, B. PER2 Circadian Oscillation Sensitizes Esophageal Cancer Cells to Chemotherapy. Biology 2021, 10, 266. [Google Scholar] [CrossRef]
  12. Lee, T.G.; Jeong, E.H.; Kim, S.Y.; Kim, H.R.; Kim, H.; Kim, C.H. Fhit, a tumor suppressor protein, induces autophagy via 14–3-3τ in non-small cell lung cancer cells. Oncotarget 2017, 8, 31923–31937. [Google Scholar] [CrossRef] [PubMed] [Green Version]
  13. Tung, C.W.; Wu, M.T.; Chen, Y.K.; Wu, C.C.; Chen, W.C.; Li, H.P.; Chou, S.H.; Wu, D.C.; Wu, I.C. Identification of biomarkers for esophageal squamous cell carcinoma using feature selection and decision tree methods. Sci. World J. 2013, 2013, 782031. [Google Scholar] [CrossRef]
  14. Couch, G.; Redman, J.E.; Wernisch, L.; Newton, R.; Malhotra, S.; Dawsey, S.M.; Lao-Sirieix, P.; Fitzgerald, R.C. The Discovery and Validation of Biomarkers for the Diagnosis of Esophageal Squamous Dysplasia and Squamous Cell Carcinoma. Cancer Prev. Res. 2016, 9, 558–566. [Google Scholar] [CrossRef] [PubMed] [Green Version]
  15. De Sario, A. Clinical and molecular overview of inherited disorders resulting from epigenomic dysregulation. Eur. J. Med. Genet. 2009, 52, 363–372. [Google Scholar] [CrossRef]
  16. Fontes, L.P.; Jimenez, Q.P.; Iriarte, M.M. Epigenetics and epilepsy. Neurologia 2015, 30, 111–118. [Google Scholar] [CrossRef]
  17. Dolinoy, D.C.; Das, R.; Weidman, J.R.; Jirtle, R.L. Metastable epialleles, imprinting, and the fetal origins of adult diseases. Pediatr. Res. 2007, 61, 30R–37R. [Google Scholar] [CrossRef] [PubMed]
  18. Barros, S.P.; Fahimipour, F.; Tarran, R.; Kim, S.; Scarel-Caminaga, R.M.; Justice, A.; North, K. Epigenetic reprogramming in periodontal disease: Dynamic crosstalk with potential impact in oncogenesis. Periodontology 2000, 82, 157–172. [Google Scholar] [CrossRef] [PubMed]
  19. Yao, C.; Joehanes, R.; Wilson, R.; Tanaka, T.; Ferrucci, L.; Kretschmer, A.; Prokisch, H.; Schramm, K.; Gieger, C.; Peters, A.; et al. Epigenome-wide association study of whole blood gene expression in Framingham Heart Study participants provides molecular insight into the potential role of CHRNA5 in cigarette smoking-related lung diseases. Clin. Epigenet. 2021, 13, 60. [Google Scholar] [CrossRef]
  20. Leong, M.M.L.; Lung, M.L. The Impact of Epstein-Barr Virus Infection on Epigenetic Regulation of Host Cell Gene Expression in Epithelial and Lymphocytic Malignancies. Front. Oncol. 2021, 11, 629780. [Google Scholar] [CrossRef]
  21. Anastasiadi, D.; Esteve-Codina, A.; Piferrer, F. Consistent inverse correlation between DNA methylation of the first intron and gene expression across tissues and species. Epigenet. Chromatin 2018, 11, 37. [Google Scholar] [CrossRef]
  22. Muhammad, J.S.; Eladl, M.A.; Khoder, G. Helicobacter pylori-induced DNA Methylation as an Epigenetic Modulator of Gastric Cancer: Recent Outcomes and Future Direction. Pathogens 2019, 8, 23. [Google Scholar] [CrossRef] [Green Version]
  23. Spainhour, J.C.; Lim, H.S.; Yi, S.V.; Qiu, P. Correlation Patterns Between DNA Methylation and Gene Expression in The Cancer Genome Atlas. Cancer Inform. 2019, 18, 1176935119828776. [Google Scholar] [CrossRef] [PubMed]
  24. Kang, W.; Wang, Q.; Dai, Y.; Wang, H.; Wang, M.; Wang, J.; Zhang, D.; Sun, P.; Qi, T.; Jin, X.; et al. Hypomethylation of PlncRNA-1 promoter enhances bladder cancer progression through the miR-136-5p/Smad3 axis. Cell Death Dis. 2020, 11, 1038. [Google Scholar] [CrossRef]
  25. Wang, X.; Shi, D.; Zhao, D.; Hu, D. Aberrant Methylation and Differential Expression of SLC2A1, TNS4, GAPDH, ATP8A2, and CASZ1 Are Associated with the Prognosis of Lung Adenocarcinoma. Biomed Res. Int. 2020, 2020, 1807089. [Google Scholar] [CrossRef] [PubMed]
  26. Fu, Y.; Zhuang, X.; Xia, X.; Li, X.; Xiao, K.; Liu, X. Correlation Between Promoter Hypomethylation and Increased Expression of Syncytin-1 in Non-Small Cell Lung Cancer. Int. J. Gen. Med. 2021, 14, 957–965. [Google Scholar] [CrossRef]
  27. Liu, G.M.; Zeng, H.D.; Zhang, C.Y.; Xu, J.W. Identification of a six-gene signature predicting overall survival for hepatocellular carcinoma. Cancer Cell Int. 2019, 19, 138. [Google Scholar] [CrossRef] [PubMed] [Green Version]
  28. Liu, Y.; Yi, Y.; Wu, W.; Wu, K.; Zhang, W. Bioinformatics prediction and analysis of hub genes and pathways of three types of gynecological cancer. Oncol. Lett. 2019, 18, 617–628. [Google Scholar] [CrossRef] [Green Version]
  29. Feng, H.; Gu, Z.Y.; Li, Q.; Liu, Q.H.; Yang, X.Y.; Zhang, J.J. Identification of significant genes with poor prognosis in ovarian cancer via bioinformatical analysis. J. Ovarian Res. 2019, 12, 35. [Google Scholar] [CrossRef]
  30. Wang, M.; Zhong, B.; Li, M.; Wang, Y.; Yang, H.; Du, K. Identification of potential core genes and pathways predicting pathogenesis in head and neck squamous cell carcinoma. Biosci. Rep. 2021, 41, BSR20204148. [Google Scholar] [CrossRef] [PubMed]
  31. Chen, M.; Jin, D.; Wang, B.; Gou, Y.J.; Dong, X.C. Identification of miRNAs as prognostic factors for esophageal squamous cell carcinoma. Math. Biosci. Eng. 2020, 17, 2302–2309. [Google Scholar] [CrossRef] [PubMed]
  32. Jia, R.; Zhao, C.H.; Li, P.S.; Liu, R.R.; Zhang, Y.; Chen, H.E.; Chang, L.P.; Gong, Y.H.; Guan, Y.F.; Yi, X.; et al. Post-radiation circulating tumor DNA as a prognostic factor in locally advanced esophageal squamous cell carcinoma. Oncol. Lett. 2021, 21, 68. [Google Scholar] [CrossRef] [PubMed]
  33. Clough, E.; Barrett, T. The gene expression omnibus database. Methods Mol. Biol. 2016, 14, 93–110. [Google Scholar] [CrossRef] [Green Version]
  34. Qiu, H.; Li, R.; Li, P.; Xing, W. Expression Data from Esophageal Squamous Cell Carcinoma Patients (GSE161533). 2020. Available online: https://0-www-ncbi-nlm-nih-gov.brum.beds.ac.uk/geo/ (accessed on 17 December 2021).
  35. Gentleman, R.C.; Carey, V.J.; Bates, D.M.; Bolstad, B.; Dettling, M.; Dudoit, S.; Ellis, B.; Gautier, L.; Ge, Y.; Gentry, J.; et al. Bioconductor: Open software development for computational biology and bioinformatics. Genome Biol. 2004, 5, R80. [Google Scholar] [CrossRef] [PubMed] [Green Version]
  36. Szklarczyk, D.; Gable, A.L.; Nastou, K.C.; Lyon, D.; Kirsch, R.; Pyysalo, S.; Doncheva, N.T.; Legeay, M.; Fang, T.; Bork, P.; et al. The STRING database in 2021: Customizable protein-protein networks, and functional characterization of user-uploaded gene/measurement sets. Nucleic Acids Res. 2021, 49, D605–D612. [Google Scholar] [CrossRef]
  37. Kanehisa, M.; Goto, S. KEGG: Kyoto encyclopedia of genes and genomes. Nucleic Acids Res. 2000, 28, 27–30. [Google Scholar] [CrossRef]
  38. Gene Ontology Consortium. The Gene Ontology (GO) project in 2006. Nucleic Acids Res. 2006, 34, D322–D326. [Google Scholar] [CrossRef] [PubMed]
  39. Shannon, P. Cytoscape: A software environment for integrated models of biomolecular interaction networks. Genome Res. 2003, 13, 2498–2504. [Google Scholar] [CrossRef]
  40. Fau, C.C.; Chen, S.-H. cytoHubba: Identifying hub objects and sub-networks from complex interactome. BMC Syst. Biol. 2014, 8, S11. [Google Scholar] [CrossRef] [Green Version]
  41. Tang, Z.; Kang, B.; Li, C.; Chen, T.; Zhang, Z. GEPIA2: An enhanced web server for large-scale expression profiling and interactive analysis. Nucleic Acids Res. 2019, 47, W556–W560. [Google Scholar] [CrossRef] [PubMed] [Green Version]
  42. Chandrashekar, D.S.; Bashel, B.; Balasubramanya, S.A.H.; Creighton, C.J.; Ponce-Rodriguez, I.; Chakravarthi, B.V.S.K.; Varambally, S. UALCAN: A Portal for Facilitating Tumor Subgroup Gene Expression and Survival Analyses. Neoplasia 2017, 19, 649–658. [Google Scholar] [CrossRef]
  43. Goldman, M.J.; Craft, B.; Hastie, M.; Repečka, K.; McDade, F.; Kamath, A.; Banerjee, A.; Luo, Y.; Rogers, D.; Brooks, A.N.; et al. Visualizing and interpreting cancer genomics data via the Xena platform. Nat. Biotechnol. 2020, 38, 675–678. [Google Scholar] [CrossRef]
  44. Chang, L.; Zhou, G.; Soufan, O.; Xia, J. miRNet 2.0: Network-based visual analytics for miRNA functional analysis and systems biology. Nucleic Acids Res. 2020, 48, W244–W251. [Google Scholar] [CrossRef] [PubMed]
  45. Assenov, Y.; Ramírez, F.; Schelhorn, S.E.; Lengauer, T.; Albrecht, M. Computing topological parameters of biological networks. Bioinformatics 2008, 24, 282–284. [Google Scholar] [CrossRef] [Green Version]
  46. Zhang, B.; Kirov, S.; Snoddy, J. WebGestalt: An integrated system for exploring gene sets in various biological contexts. Nucleic Acids Res. 2005, 33, W741–W748. [Google Scholar] [CrossRef] [PubMed]
  47. Liao, Y.; Wang, J.; Jaehnig, E.J.; Shi, Z.; Zhang, B. WebGestalt 2019: Gene set analysis toolkit with revamped UIs and APIs. Nucleic Acids Res. 2019, 47, W199–W205. [Google Scholar] [CrossRef] [Green Version]
  48. Chu, L.Y.; Peng, Y.H.; Weng, X.F.; Xie, J.J.; Xu, Y.W. Blood-based biomarkers for early detection of esophageal squamous cell carcinoma. World J. Gastroenterol. 2020, 26, 1708–1725. [Google Scholar] [CrossRef]
  49. Yang, J.; Liu, X.; Cao, S.; Dong, X.; Rao, S.; Cai, K. Understanding Esophageal Cancer: The Challenges and Opportunities for the Next Decade. Front. Oncol. 2020, 10, 1727. [Google Scholar] [CrossRef] [PubMed]
  50. Liu, M.; Hu, Y.; Zhang, M.F.; Luo, K.J.; Xie, X.Y.; Wen, J.; Fu, J.H.; Yang, H. MMP1 promotes tumor growth and metastasis in esophageal squamous cell carcinoma. Cancer Lett. 2016, 377, 97–104. [Google Scholar] [CrossRef] [PubMed]
  51. Li, Y.; Ma, J.; Guo, Q.; Duan, F.; Tang, F.; Zheng, P.; Zhao, Z.; Lu, G. Overexpression of MMP-2 and MMP-9 in esophageal squamous cell carcinoma. Dis. Esophagus 2009, 22, 664–667. [Google Scholar] [CrossRef]
  52. Song, Y.; Wang, X.; Wang, F.; Peng, X.; Li, P.; Liu, S.; Zhang, D. Identification of four genes and biological characteristics of esophageal squamous cell carcinoma by integrated bioinformatics analysis. Cancer Cell Int. 2021, 21, 123. [Google Scholar] [CrossRef]
  53. Shi, X.; Chen, Z.; Hu, X.; Luo, M.; Sun, Z.; Li, J.; Shi, S.; Feng, X.; Zhou, C.; Li, Z.; et al. AJUBA promotes the migration and invasion of esophageal squamous cell carcinoma cells through upregulation of MMP10 and MMP13 expression. Oncotarget 2016, 7, 36407–36418. [Google Scholar] [CrossRef] [PubMed] [Green Version]
  54. Liu, S.; Huang, M.; Chen, Z.; Chen, J.; Chao, Q.; Yin, X.; Quan, M. FTO promotes cell proliferation and migration in esophageal squamous cell carcinoma through up-regulation of MMP13. Exp. Cell Res. 2020, 389, 111894. [Google Scholar] [CrossRef]
  55. Mahmoudian, R.A.; Gharaie, M.L.; Abbaszadegan, M.R.; Alasti, A.; Forghanifard, M.M.; Mansouri, A.; Gholamin, M. Crosstalk between MMP-13, CD44, and TWIST1 and its role in regulation of EMT in patients with esophageal squamous cell carcinoma. Mol. Cell. Biochem. 2021, 476, 2465–2478. [Google Scholar] [CrossRef]
  56. Jiao, X.L.; Chen, D.; Wang, J.G.; Zhang, K.J. Clinical significance of serum matrix metalloproteinase-13 levels in patients with esophageal squamous cell carcinoma (ESCC). Eur. Rev. Med. Pharmacol. Sci. 2014, 18, 509–515. [Google Scholar]
  57. Sedighi, M.; Aledavood, S.A.; Abbaszadegan, M.; Memar, B.; Montazer, M.; Rajabian, M.; Gholamin, M. Matrix Metalloproteinase-13—A Potential Biomarker for Detection and Prognostic Assessment of Patients with Esophageal Squamous Cell Carcinoma. Asian Pac. J. Cancer Prev. 2016, 17, 2781–2785. [Google Scholar]
  58. Sato, F.; Shimada, Y.; Watanabe, G.; Uchida, S.; Makino, T.; Imamura, M. Expression of vascular endothelial growth factor, matrix metalloproteinase-9 and E-cadherin in the process of lymph node metastasis in oesophageal cancer. Br. J. Cancer 1999, 80, 1366–1372. [Google Scholar] [CrossRef] [Green Version]
  59. Gu, Z.D.; Li, J.Y.; Li, M.; Gu, J.; Shi, X.T.; Ke, Y.; Chen, K.N. Matrix metalloproteinases expression correlates with survival in patients with esophageal squamous cell carcinoma. Am. J. Gastroenterol. 2005, 100, 1835–1843. [Google Scholar] [CrossRef] [Green Version]
  60. Tao, Y.S.; Ma, X.Y.; Chai, D.M.; Ma, L.; Feng, Z.Z.; Cheng, Z.N.; Lai, M.D. Overexpression of MMP-1 and VEGF-C is associated with a less favorable prognosis in esophageal squamous cell carcinoma. Onkologie 2012, 35, 651–656. [Google Scholar] [CrossRef]
  61. Hosono, M.; Koma, Y.I.; Takase, N.; Urakawa, N.; Higashino, N.; Suemune, K.; Kodaira, H.; Nishio, M.; Shigeoka, M.; Kakeji, Y.; et al. CXCL8 derived from tumor-associated macrophages and esophageal squamous cell carcinomas contributes to tumor progression by promoting migration and invasion of cancer cells. Oncotarget 2017, 8, 106071–106088. [Google Scholar] [CrossRef] [Green Version]
  62. Zhang, J.; Wang, J.L.; Zhang, C.Y.; Ma, Y.F.; Zhao, R.; Wang, Y.Y. The prognostic role of FZD6 in esophageal squamous cell carcinoma patients. Clin. Transl. Oncol. 2020, 22, 1172–1179. [Google Scholar] [CrossRef] [PubMed]
  63. Goto, M.; Liu, M. Chemokines and their receptors as biomarkers in esophageal cancer. Esophagus 2020, 17, 113–121. [Google Scholar] [CrossRef] [PubMed]
  64. Yue, D.; Liu, S.; Zhang, T.; Wang, Y.; Qin, G.; Chen, X.; Zhang, H.; Wang, D.; Huang, D.; Wang, F.; et al. NEDD9 promotes cancer stemness by recruiting myeloid-derived suppressor cells via CXCL8 in esophageal squamous cell carcinoma. Cancer Biol. Med. 2021, 18, 705. [Google Scholar] [CrossRef] [PubMed]
  65. Fang, L.; Che, Y.; Zhang, C.; Huang, J.; Lei, Y.; Lu, Z.; Sun, N.; He, J. PLAU. directs conversion of fibroblasts to inflammatory cancer-associated fibroblasts, promoting esophageal squamous cell carcinoma progression via uPAR/Akt/NF-κB/IL8 pathway. Cell Death Discov. 2021, 7, 32. [Google Scholar] [CrossRef] [PubMed]
  66. Li, J.; Wang, X.; Zheng, K.; Liu, Y.; Li, J.; Wang, S.; Liu, K.; Song, X.; Li, N.; Xie, S.; et al. The clinical significance of collagen family gene expression in esophageal squamous cell carcinoma. PeerJ 2019, 7, e7705. [Google Scholar] [CrossRef] [PubMed]
  67. Xue, J.; Jia, E.; Ren, N.; Xin, H. Identification of prognostic miRNA biomarkers for esophageal cancer based on The Cancer Genome Atlas and Gene Expression Omnibus. Medicine 2021, 100, e24832. [Google Scholar] [CrossRef]
  68. Booka, E.; Tsubosa, Y.; Yokota, T.; Mayanagi, S.; Ishii, K.; Urakami, K.; Ohshima, K.; Ohnami, S.; Nagashima, T.; Yamaguchi, K. Whole exome sequencing and deep sequencing of esophageal squamous cell carcinoma and adenocarcinoma in Japanese patients using the Japanese version of the Genome Atlas, JCGA. Esophagus 2021, 18, 743–752. [Google Scholar] [CrossRef] [PubMed]
  69. Li, X.; Suo, J.; Shao, S.; Xue, L.; Chen, W.; Dong, L.; Shi, J.; Fu, M.; Lu, N.; Zhan, Q.; et al. Overexpression of OLC1 promotes tumorigenesis of human esophageal squamous cell carcinoma. PLoS ONE 2014, 9, e90958. [Google Scholar] [CrossRef]
  70. Cui, L.; Feng, L.; Zhang, Z.H.; Jia, X.B. The anti-inflammation effect of baicalin on experimental colitis through inhibiting TLR4/NF-κB pathway activation. Int. Immunopharmacol. 2014, 23, 294–303. [Google Scholar] [CrossRef] [PubMed]
  71. Iwaya, T.; Sawada, G.; Amano, S.; Kume, K.; Ito, C.; Endo, F.; Konosu, M.; Shioi, Y.; Akiyama, Y.; Takahara, T.; et al. Downregulation of ST6GALNAC1 is associated with esophageal squamous cell carcinoma development. Int. J. Oncol. 2017, 50, 441–447. [Google Scholar] [CrossRef] [PubMed]
  72. Lessi, F.; Aretini, P.; Rizzo, M.; Morelli, M.; Menicagli, M.; Franceschi, S.; Mazzanti, C.M. Analysis of exosome-derived microRNAs reveals insights of intercellular communication during invasion of breast, prostate and glioblastoma cancer cells. Cell Adhes. Migr. 2021, 15, 180–201. [Google Scholar] [CrossRef]
  73. Lorusso, C.; De Summa, S.; Pinto, R.; Danza, K.; Tommasi, S. miRNAs as Key Players in the Management of Cutaneous Melanoma. Cells 2020, 9, 415. [Google Scholar] [CrossRef] [Green Version]
  74. He, F.C.; Meng, W.W.; Qu, Y.H.; Zhou, M.X.; He, J.; Lv, P.; Ming, L. Expression of circulating microRNA-20a and let-7a in esophageal squamous cell carcinoma. World J. Gastroenterol. 2015, 21, 4660–4665. [Google Scholar] [CrossRef] [PubMed]
  75. Xi, X.; Chu, Y.; Liu, N.; Wang, Q.; Yin, Z.; Lu, Y.; Chen, Y. Joint bioinformatics analysis of underlying potential functions of hsa-let-7b-5p and core genes in human glioma. J. Transl. Med. 2019, 17, 129. [Google Scholar] [CrossRef]
  76. Chirshev, E.; Oberg, K.C.; Ioffe, Y.J.; Unternaehrer, J.J. Let-7 as biomarker, prognostic indicator, and therapy for precision medicine in cancer. Clin. Transl. Med. 2019, 8, 24. [Google Scholar] [CrossRef] [Green Version]
  77. Aghdam, A.M.; Amiri, A.; Salarinia, R.; Masoudifar, A.; Ghasemi, F.; Mirzaei, H. MicroRNAs as Diagnostic, Prognostic, and Therapeutic Biomarkers in Prostate Cancer. Crit. Rev. Eukaryot. Gene Expr. 2019, 29, 127–139. [Google Scholar] [CrossRef] [PubMed]
  78. Zheng, L.; Xiong, Y.; Liu, J.; Yang, X.; Wang, L.; Zhang, S.; Liu, M.; Wang, D. MMP-9-Related microRNAs as Prognostic Markers for Hemorrhagic Transformation in Cardioembolic Stroke Patients. Front. Neurol. 2019, 10, 945. [Google Scholar] [CrossRef]
  79. Jiang, T.; Ye, L.; Han, Z.; Liu, Y.; Yang, Y.; Peng, Z.; Fan, J. miR-19b-3p promotes colon cancer proliferation and oxaliplatin-based chemoresistance by targeting SMAD4: Validation by bioinformatics and experimental analyses. J. Exp. Clin. Cancer Res. 2017, 36, 131. [Google Scholar] [CrossRef] [Green Version]
  80. Peng, Y.; Huang, D.; Ma, K.; Deng, X.; Shao, Z. MiR-19a as a prognostic indicator for cancer patients: A meta-analysis. Biosci. Rep. 2019, 39, BSR20182370. [Google Scholar] [CrossRef] [Green Version]
  81. Palumbo, A., Jr.; Da Costa, N.M.; Pontes, B.; de Oliveira, F.L.; Codeço, M.L.; Pinto, L.F.R.; Nasciutti, L.E. Esophageal Cancer Development: Crucial Clues Arising from the Extracellular Matrix. Cells 2020, 9, 455. [Google Scholar] [CrossRef] [Green Version]
  82. Ahn, C.; Lee, S.; Park, S.K. Causal Inference between Rheumatoid Arthritis and Breast Cancer in East Asian and European Population: A Two-Sample Mendelian Randomization. Cancers 2020, 12, 3272. [Google Scholar] [CrossRef]
Figure 1. Dataset GSE161533 samples validation. (A) Volcano plot using limma for the normal and tumor samples shows the up and downregulated genes. (B) UMAP test to predict the samples clearer separation. (C) Boxplot of normalized expression values for the dataset GSE161533. The dots represent the median of each sample in the center of each box. Its variation among samples reflects the amount of data normalized, with a relatively straight line suggesting a reasonable level of normalization. Module preservation test with an independent dataset.
Applsci 12 01083 g001
Figure 2. Visualization of the top 250 genes interaction as protein–protein interaction network and the HGsT10 genes, (A) PPI network of the genes interacted with two co-expression modules nodes and edges. Edges represent the HGsT10 genes’ interactions. Edges indicate interaction associations between nodes, (B) The predicted HGsT10 gene using MCC algorithm. Genes with a higher MCC sore are shown by red nodes, whereas yellow nodes represent genes with a minimal MCC sore.
Applsci 12 01083 g002
Figure 3. The gene expression analysis for the predicted HGsT10 genes. (A) The HGsT10 gene expression at ESCC tumor condition was compared with normal samples showed the upregulation. (BK) The HGsT10 genes expression were validated with TCGA samples with the log-transformed expression value, which includes 13 normal and 182 tumor samples. * denotes statistical significance (p < 0.05).
Applsci 12 01083 g003
Figure 4. The HGsT10 gene expression using the UCSC Xena database. (A) The HGsT10 gene expression using RNAseq-HTseq based on the Fragments Per Kilobase of transcript per Million mapped reads upper quartile. (B) The HGsT10 gene expression compared with the subgroups based on the disease type. The HGsT10 upregulated genes were shown in red, and downregulated genes were blue. Abbreviation: HT-Seq-FPKM-UQ: High throughput sequencing-Fragments Per Kilobase of transcript per Million mapped reads upper quartile.
Applsci 12 01083 g004
Figure 5. The association between HGsT10 expression and ESCA stages was analyzed by stage-plot with the F and Pr (>F) value. (AJ) Gene expression patterns of the HGsT10 validated with TCGA database. Log2(TPM + 1) was used for the log scale. (Red violin plotted genes are associated with ESCC major stages namely (A) MMP9, (E) SPP1, (F) PLAU, (G) MMP13, (H) COL1A1, (I) COL1A2, and grey violin plotted genes are not associated with major stages namely (B) MMP3, (C) MMP1, (D) CXCL8, and (J) PLAUR.
Applsci 12 01083 g005
Figure 6. The promoter methylation for the HGsT10 genes was identified with the TCGA ESCA samples based on the disease type (AJ). UALCAN server was used to determine if hyper-methylation [beta value: 0.7–0.5] or hypo-methylation [beta value: 0.3–0.25] were prevalent. A statistically significant comparison was made between normal and non-normal variables.
Applsci 12 01083 g006
Figure 7. Visualization of the miRNA-gene regulatory network consisted of 377 miRNAs as nodes and 577 edges, including HGsT10 (A). The predicted hub miRNA-gene network representation uses the clustering coefficient algorithm consisting of 10 miRNAs as nodes, and 30 edges include HGsT10 (B).
Applsci 12 01083 g007
Figure 8. The functional and pathway enrichment analysis visualization mapped with illumina_humanht_12_v3 genes as a reference. (A) The biological process of HGsT10, (B) The cellular component of HGsT10, (C) The molecular function of the HGsT10, (D) The enriched pathway for HGsT10 with its Enrichment ratio. Furthermore, the FDR and p-values for enriched pathway terms are noted in Table S4 (Supplementary File S1).
Applsci 12 01083 g008
Table 1. The network parameter for the constructed PPI network for the top 250 genes, predicted HGsT10, miRNA-HGsT10, predicted HmiRT10 were analyzed using the Network Analyzer plugin and tabulated.
S.No.Name of the ParameterTop 250 Genes (GSE161533 Samples)Predicted HGs T10miRNA Regulatory NetworkPredicted HmiR T10
1.Number of Nodes1291037710
2.Number of edges2623859730
3.Avg.number of neighbors4.3397.6003.1673.333
4.Network diameter13244
5.Network radius7133
6.Characteristic path length4.1961.1563.1702.261
7.Clustering coefficient0.2150.8980.0000.000
8.Network density0.0370.8440.0080.196
9.Network heterogeneity0.1800.1693.8800.640
Table 2. The pathway enrichment analysis resulted in the following parameter for the predicted HGsT10 genes.
GroupPathway EnrichedGene SymbolFDRp-ValueExpected ValueEnrichment Ratio
1.Bladder cancerCXCL8, MMP1 and MMP90.00212210.0000196490.05663352.972
2.IL-17 signaling pathwayCXCL8, MMP1, MMP13, MMP3, MMP90.0000275358.4985 × 10−80.1316737.973
3.Relaxin signaling pathwayCOL1A1, COL1A2, MMP1, MMP13, MMP90.0000741714.5785 × 10−70.1840627.165
4.ECM-receptor interactionCOL1A1, COL1A2, SPP10.00989860.000152760.1118526.822
5.Rheumatoid arthritisCXCL8, MMP1, MMP30.0101160.000203530.1231824.355
6,AmoebiasisCOL1A1, COL1A2, CXCL80.0101160.000240230.1302623.032
7.Prostate cancerMMP3, MMP9, PLAU0.0101160.000264190.1345022.304
8.AGE-RAGE signaling pathway in diabetic complicationsCOL1A1, COL1A2, CXCL80.0101160.000281000.1373421.844
9.Transcriptional misregulation in cancerCXCL8, MMP3, MMP9, PLAU0.00576350.0000711540.2506015.962
10.Focal adhesionCOL1A1, COL1A2, SPP10.0616160.00209190.2732510.979
Publisher’s Note: MDPI stays neutral with regard to jurisdictional claims in published maps and institutional affiliations.

