1. Introduction
Cyber attacks have become increasingly common with a considerable increase in the number of reported attacks, such as ransomware, phishing, social engineering, outdated systems exploit and others [
1,
2]. Attackers have increasingly exploited weaknesses in large corporate systems, government agencies and individual vulnerabilities so much that private and public institutions have been concerned about the lack of professionals that can meet the increasingly urgent demand for cyber protection and cyber threat intelligence (CTI).
Allied to this, data indicates that 38% of respondents reported that CTI requirements are primarily updated in an ad hoc manner inside their companies, without a defined periodic revision [
3], weakening cyber-attacks mitigation and vulnerabilities avoidance. Thus, the creation of methodologies capable of simplifying and adding intelligence to cyber-threat data is essential for the latent demands of the market, making the work of cyber analysts more efficient and, consequently, increasing the organizations’ defenses.
It is known that CTI must explore the collection while filtering, sharing and analyzing vulnerabilities in intel and threat data regardless of vendor, technology or source. For that, much research has been developed to address the collection and filtering of threat intelligence [
4,
5], as well as sharing and using that data to mitigate threats [
6,
7].
In this sense, a framework that properly addresses these points with the additional of an analytics interface is a desired target both academically and corporately, including issues such as threat hunting, threat intelligence, sharing protocols and data visualization.
Therefore, the motivation and objective of this study is to create a framework that will address the challenges of gathering CTI data from multiple sources to create analytics capable of shortening threat mitigation time, as well as improving CTI in terms of collection, filtering, sharing, visualization and analysis with the proposal of a new eight-step model for CTI with analytics and temporal analysis.
Moreover, the contribution of this study is a complete model to increase CTI effectiveness and improve threat mitigation through the development of enterprise grade-level tool. This work will focus on the last two proposed steps: visualization and analysis, as well as a case study with a real-world analysis example.
This paper is divided in seven sections. The first section introduces our work, while the second section explores important background concepts that are crucial for understanding our research; the third section introduces related work that was used on our work. The fourth section provides a brief description of the problems we addressed in this paper, and the fifth section provides the results of our research, i.e., our eight-step framework, the technical architecture we used and demonstrations of our tool and timeline. The sixth section is the proof of concept of our tool and framework, i.e., the analysis of two real threats. Finally, the last section provides our conclusions and future work.
2. Threat Intelligence Background
The concept of Threat Intelligence (TI) says that it is knowledge acquired by analyzing evidence, data and research information from technology assets and systems. According to [
8] “the set of data collected, evaluated and applied in relation to security threats, threat agents, exploits, malware, vulnerabilities and indicators of compromise,” showing that all information that assists in making decisions against threats can be considered results of TI-generated knowledge.
This shows how intelligent analytics is important to any organization, but in addition to the intrinsic intelligence generated from threat data, it is desirable to achieve real-time or near real-time analytics in such a manner that any type of attack is mitigated as soon as possible, and no cyber or physical damage is taken.
2.1. Cyber Threat Intelligence
The concept of cyber threat intelligence is close to the threat intelligence concept: It is the knowledge generated from various sources of data and information of the cybernetic field. As defined in [
9], CTI “emerged in order to help security practitioners in recognizing the indicators of cyber-attacks, extracting information about the attack methods, and consequently responding to the attack accurately and in a timely manner.” Therefore, a CTI professional must be able to deal with data extraction, data filtration, data manipulation and data standardization to achieve a very important goal: to have data intelligence generation and visualization in (desirable) real-time speed.
Another important CTI goal is that stakeholders should share their data with each other, promoting—according to [
10]—“situation awareness among stakeholders through sharing information about the newest threats and vulnerabilities, and to swiftly implement the remedies” where one should not suffer with the same threat or vulnerability that other has already suffered in the past. This objective helps to avoid rework, since one already discovered threat will be shared with all stakeholders, increasing the defense of systems against threats.
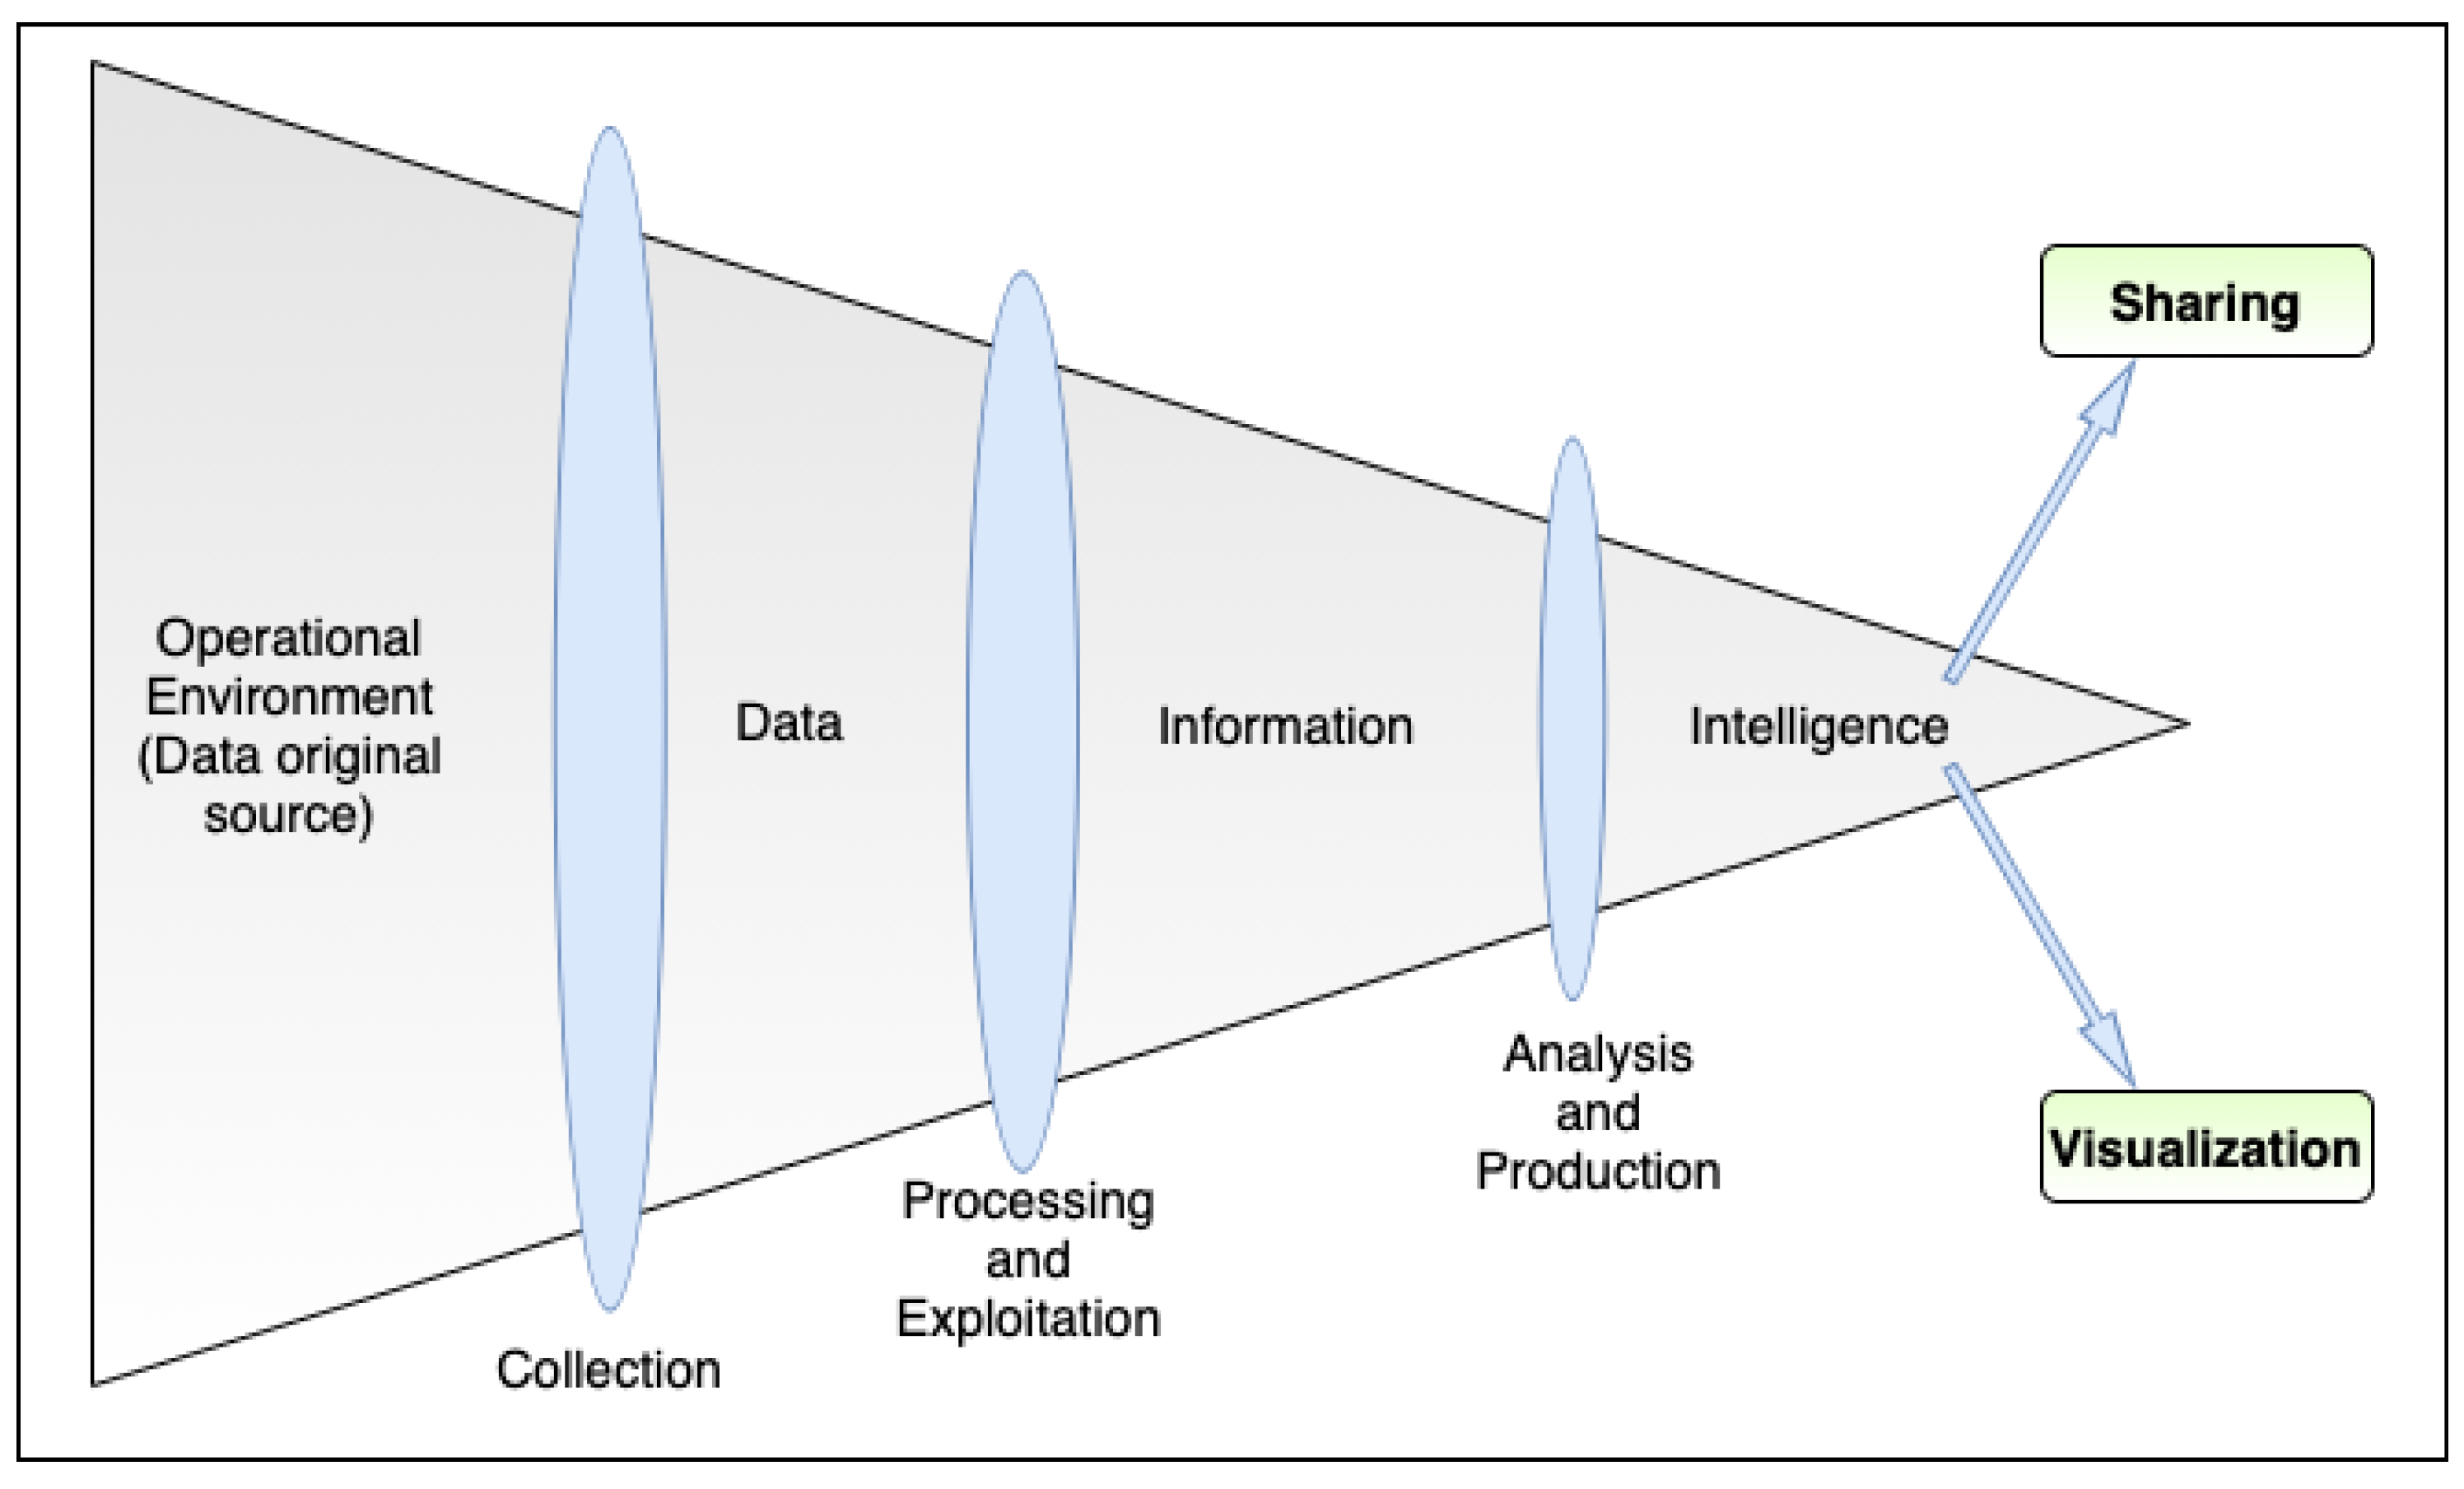
Figure 1 shows all the steps and goals that cyber threat intelligence should achieve, as proposed in [
11].
This work proposes a framework for cyber threat intelligence that consists of acquiring, treating and visualizing Indicators of Compromise (IOCs) and any other relevant data for identifying and mitigating cyber threats.
2.2. Threat Hunting
Threat Hunting (TH) is strongly linked to the concept of Advanced Persistent Threats (APT) because when Indicators of Compromise of a given APT are detected within organizational equipment and networks, security analysts must search and analyze logs from hosts, routers, servers and any other network-connected hardware or software to find if any IOCs entities appears on their logs, showing if the threat has penetrated the network or any hardware/software. This is primarily the definition of threat hunting—finding and discovering threats from IOCs and any other indicators that correlate tracks and footprints to a vulnerability or attacker.
Normally, threat hunting represents a big challenge for those who need to confront it. It has four main challenges [
13,
14]: The first one is about searching at scale, i.e., because of the attack pattern of attackers; it is necessary to link related IOCs together even if the attacker’s footprints exist in a long period of time—such as in weeks or months. Hence, TH must be able to deal with long-time-scattered data and still be able to identify threats and vulnerabilities along its systems.
The second challenge is about identification and correlation of threat entities, i.e., the ability to look the entire scenario of a threat campaign to fully identify all the steps of the attacker, avoiding being cheated by the attacker if he tries to masquerade his footprints.
The third challenge is about the confidence score of threat generated data. These data should have as few false positives as possible so that cyber response operations can be performed smoothly and without rework.
Finally, the last TH challenge is how to obtain a complete picture of a threat when analyzing only fragmented pieces of data such as IP addresses, hashes, domain names, process names or any other useful information. Weak threat-hunting data results in weak analysis, as well as a poor response to any threat that may benefit from that specific vulnerability.
When all these TH challenges are overcome, an organization will have a large set of data—structured, semi-structured and natural language data—composed of text files, images, documents and any other possible kind of data that will be ingested and processed by a CTI tool or a security professional to deliver intelligence and finally to work on threats and vulnerabilities.
2.3. CTI Standards
It is important to highlight that the standards are used to make the sharing of threat information more organized, agile and possible. With the large amount of data acquired with Threat Hunting and with cyber threat intelligence, possessing patterns of entities, objects and their description for identifying threats, actors and targets is extremely valuable for a threat Intelligence ecosystem. The most common standards for CTI are listed as following.
2.3.1. MITRE ATT&CK
According to MITRE [
15], “ATT&CK is largely a knowledge base of adversarial techniques—a breakdown and classification of offensively oriented actions that can be used against particular platforms, such as Windows. Unlike prior work in this area, the focus is not on the tools and malware that adversaries use but on how they interact with systems during an operation”. It is, therefore, an important tool to deal with threats and their mitigation, as it allows the sharing of information in a structured and standardized manner, being widely used in various threat intelligence tools available on the market [
16,
17]. MITRE ATT&CK Enterprise Matrix contains 14 Windows, macOS, Linux, PRE, Azure AD, Office 365, Google Workspace, SaaS, IaaS, Network and Containers tactics representing an adversary’s tactical objective for acting.
MITRE ATT&CK Enterprise Matrix’s 14 tactics include the following: Reconnaissance, Resource Development, Initial Access, Execution, Persistence, Privilege Escalation, Defense Evasion, Credential Access, Discovery, Lateral Movement, Collection, Command and Control, Exfiltration and Impact. They all represent possible a attack pattern in which an attacker can use to infiltrate a system and/or network.
2.3.2. CyBOX
Cyber Observable eXpression provides a common structure to specify, characterize and share information about cyber observables, i.e., objects such as network connection, an IP address, URL and others in a standardized manner [
18].
Furthermore, threat assessment, log management, malware characterization, indicator sharing and incident response can be all patronized by using CybOX structure and objects. It is now part of STIXv2 as Cyber Observable Objects.
2.3.3. STIX
Structured Threat Information eXpression [
19] is a language developed by MITRE to share TI information within stakeholders of an ecosystem. It is used to acquire, classify and share any data related to an attack campaign, providing tools and patterns to represent information in such a manner in which CTI data can be efficiently used by security professionals inside cyber threat intelligence Tools.
It allows users to standardize unstructured data and individual IOCs inside a machine-readable language in which automation and interoperability can be applied. The first version of STIX (STIXv1) was XML-based and had eight cores. The second and current version of STIX (STIXv2) is a JSON-based language [
20] with various architectural improvements to become close to a CTI environment.
2.3.4. TAXII
MITRE also developed TAXII—an application layer protocol that specifies a collection of services—for businesses to exchange threat intelligence information data. It was designed specifically for the transmission of data in the STIX format, but it is not limited to that as the transport protocol used by it is Hyper Text Transfer Protocol Secure (HTTPS), offering a variety of sharing models such as peer-to-peer, spoke-hub distribution and source subscriber [
21].
3. Related Works
Although cyber threat intelligence is a theme that is extremely important in the private business, there are many academic research studies currently being developed, addressing collection, sharing, standardization and usage questions of CTI.
3.1. CTI Protocols and Standards
The work of de Melo e Silva et al. [
22] provided us with the key context of CTI protocols and how important it is to use common standards for sharing CTI data, thus providing a comprehensive evaluation methodology for threat intelligence standards and a method for evaluating cyber threat intelligence platforms and market tools. Tounsi et al. [
23] presented a survey about threat intelligence and open-source threat intelligence tools, showing a comparison that can be used to understand not only open source CTI tools but also enterprise CTI software. The main points found on this research are the secure and compliance-accepted sharing of information, in addition with the possibility of using common protocols such as STIX and TAXII.
Another important research study that compared available formats and languages to share threat intelligence data such as STIX, TAXII and CybOX is Ramsdale et al. [
24]. The authors showed that, even though STIX is sometimes poorly implemented on CTI tools, it is one of the most popular CTI standards used today. In Schlette et al. [
25], the authors shows that CTI needs standardization in order to achieve intelligent information sharing and desirable quality, providing some considerations about STIX language and how it can be used to provide a holistic approach of cyber incidents.
3.2. CTI Main Challenges and Technical Improvements
For further background knowledge, Wagner et al. [
10] presented a survey addressing possible challenges of CTI, e.g., how to proactively mitigate cyber attacks using process automation on CTI sharing and how to trust a stakeholder that has shared threat IOCs data—similar to what was researched in Abu et al. [
13] when the authors enumerated three CTI challenges, where two of them addresses the data quantity and quality, and one addresses the sharing problem between platforms.
In Gao et al. [
26], a CTI model was proposed based on heterogeneous information network, which helps to integrate various types of cyber-threats nodes. The authors came up with a threat type identification system that significantly improved the performance of the state-of-the-art baseline, confirming the main challenge in which this work seeks to address: a CTI model to shorten threat answer time with user-useful tools.
In the context of intelligent CTI data extraction, Sun et al. [
4] proposes an automatic approach to generate CTI data from open-source threat intelligence publishing platforms (i.e., any platform that shares IOCs or any other useful information about threats) using machine learning and natural language processing together with known threat intelligence background in order to achieve accurate and detailed CTI data that can, for example, feed a tool such as ours in order to help cyber security analysts on threat mitigation. In Preuveneers and Joosen [
6], a similar problem was considered by authors when they proposed a solution to complement the sharing of IOCs using machine learning-based threat detection, and they demonstrated their proposed solution by implementing it on state-of-practice open-source CTI sharing and incident response platforms.
Finally, Haastrecht et al. [
7] showed how small and medium size enterprises suffer from the lack of CTI tools and shared information. They created a CTI Feed that can provide these companies with actionable recommendations that are ordered by relevance and helped them avoid vulnerabilities and threats.
Therefore, based on the context of all these studies, we used their conclusions as a basis for our decisions on which technologies should be used on the implementation of our tool such as CTI standards and programming languages, as well as ideas for our eight-step methodological framework.
4. Problem Description
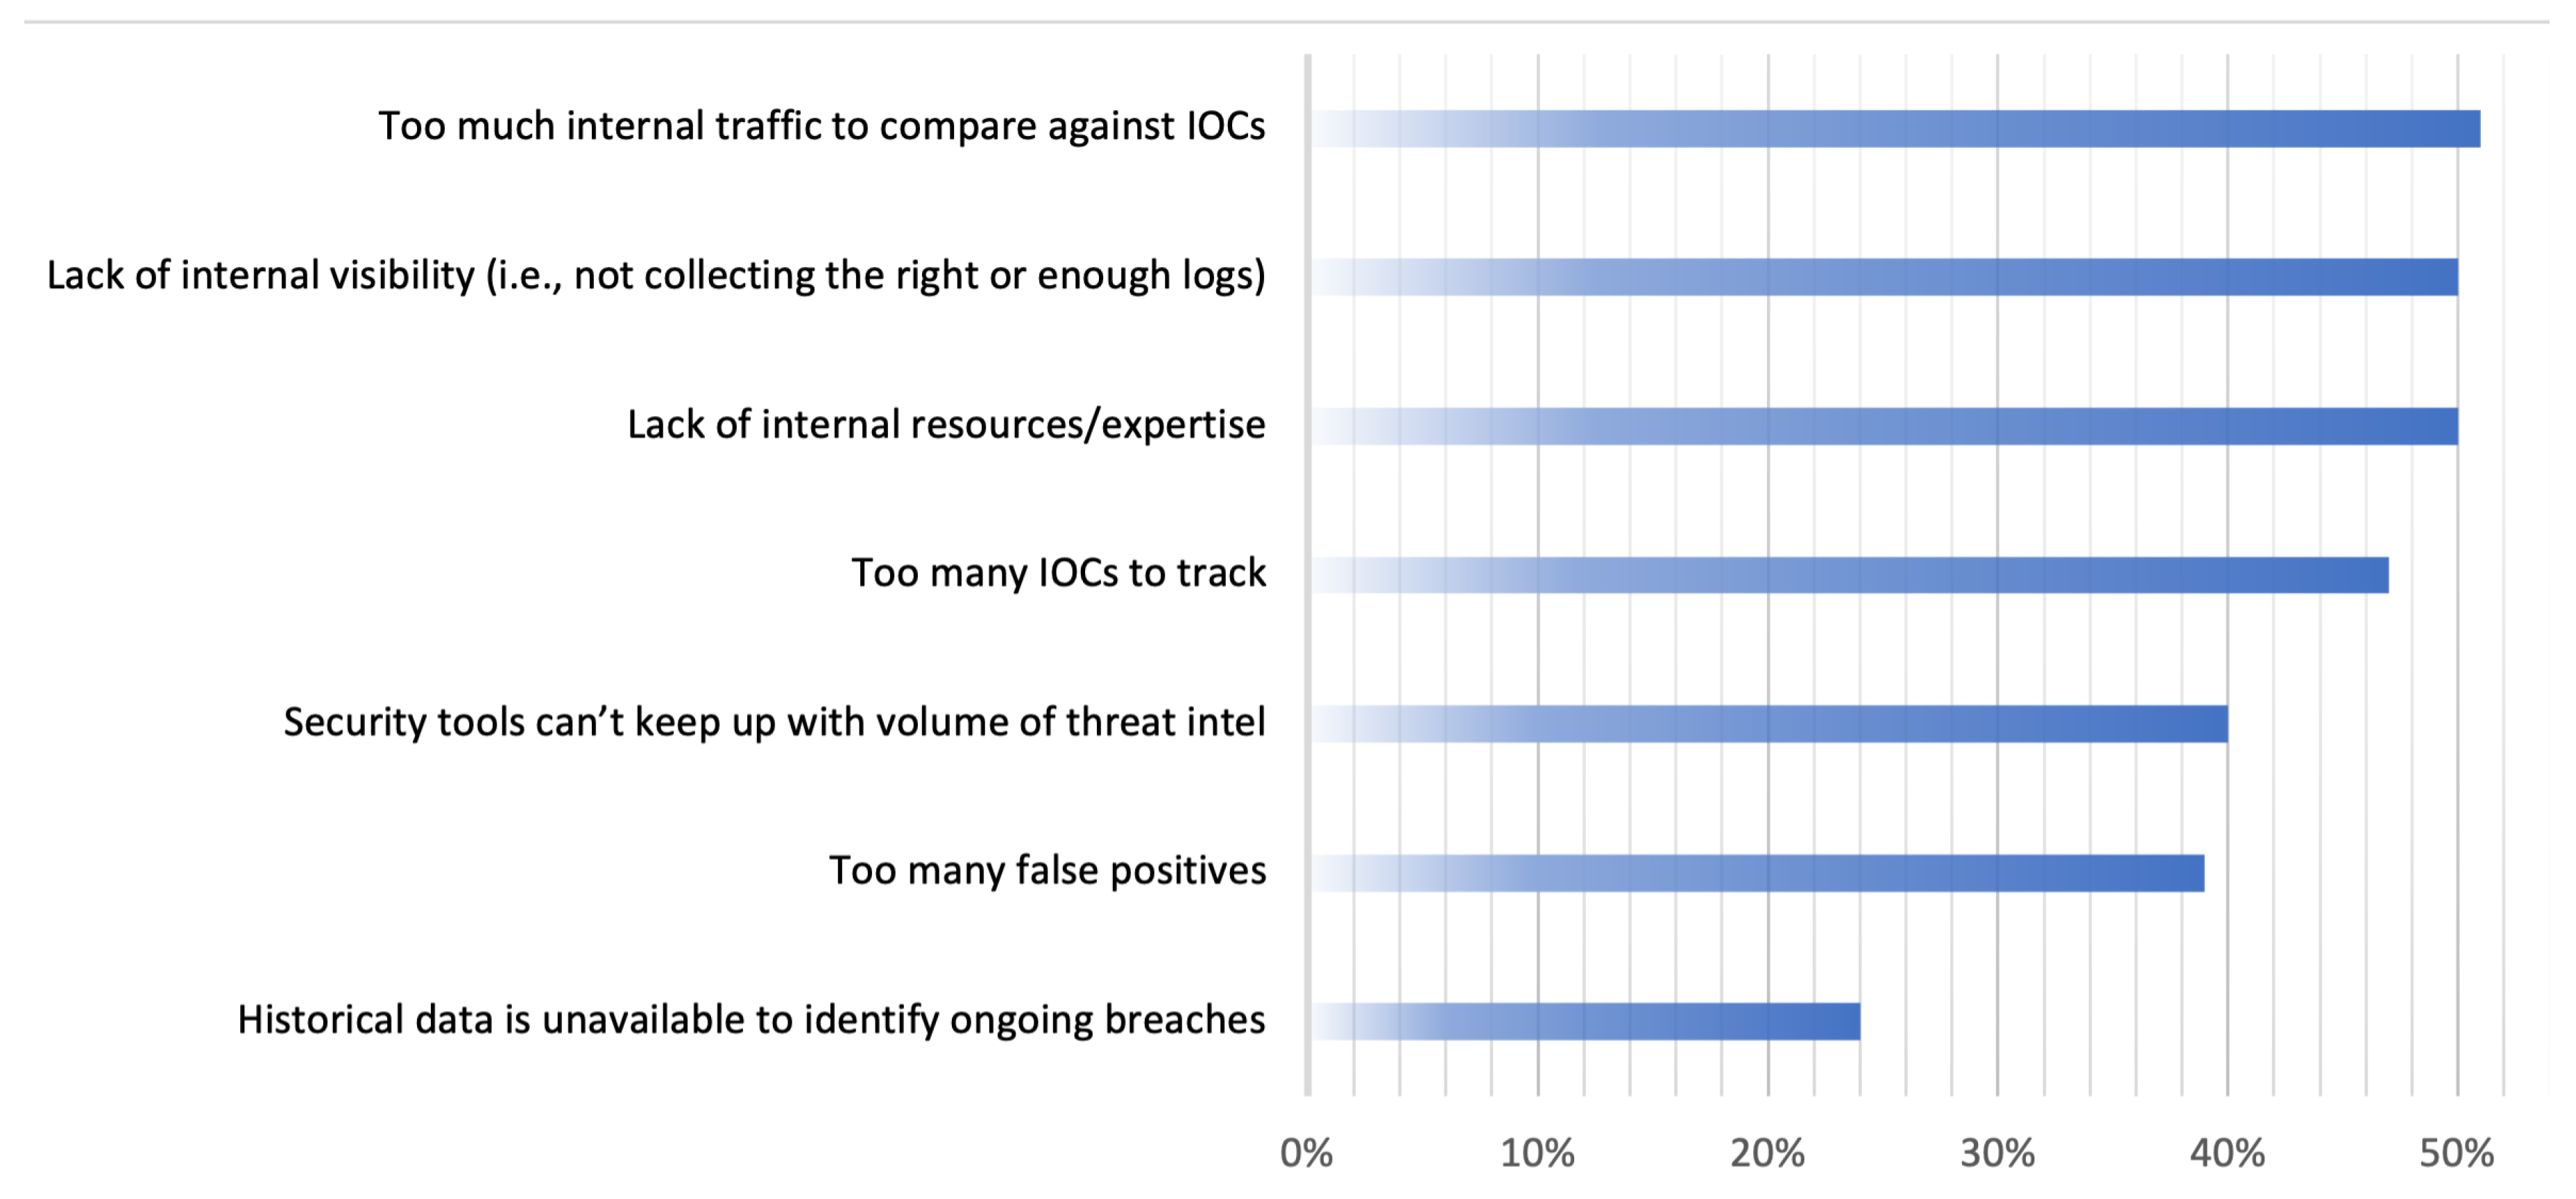
Cyber threat intelligence has become increasingly present in corporate security systems as it has great importance in mitigating threats and, consequently, reducing damage from attacks. According to 1098 IT and IT security practitioners in North America and the United Kingdom [
27], the biggest challenges faced by threat hunters in the search and collection of useful data for threat intelligence analysis are shown in
Figure 2:
This illustrates how CTI is inherently dependent on issues such as the collection of large amounts of unstructured data, many IOCs and the quality of collected data itself.
Another big challenge for cyber threat intelligence is acting fast to understand and neutralize the threat and to share info with other stakeholders. Consequently, real-time tools are needed [
9,
24], as well as user friendly interfaces to simplify the security analysts analyses and the reaction to threats.
An example of the problem behind CTI is the attack named RedEcho that targeted the Indian Power Sector [
28] to exploit Indian servers networks, spoofing over SSL via TCP port 443, HTTP over TCP 8080 and DNS over UDP 53. All these are used to exfiltrate critical data. As observed on
Table 1, from the first trace of the attack until counterattack measures were taken, it took almost 2 years. Much research, network traffic analysis and expert analysis was required to achieve correlation between data and attack patterns.
This is a long period time to mitigate a threat, and it shows the value of a tool that can reunite different threat feeds and IOCs in order to show all their time-stamped footprints that requires neutralization or avoidance.
Thus, the RedEcho attack example provided above illustrates the problem addressed on this paper: unstructured data from different sources that are difficult to unify into a single CTI database to create a global understanding of the threat. This emphasizes the importance of linking threats footprints and IOCs in order to mitigate them quickly—avoiding resource loss and gaining advantages in threat countermeasures.
5. Proposed Solution and Methodology
The study presented in [
29] proposed a six-step CTI model and a proprietary CTI tool. All functionalities related to the context of threat intelligence and each of the six proposed steps were described, as well as CTI tool implementation details and interconnections. The overall result of that work was a tool that allows threat information collection, preparation and sharing.
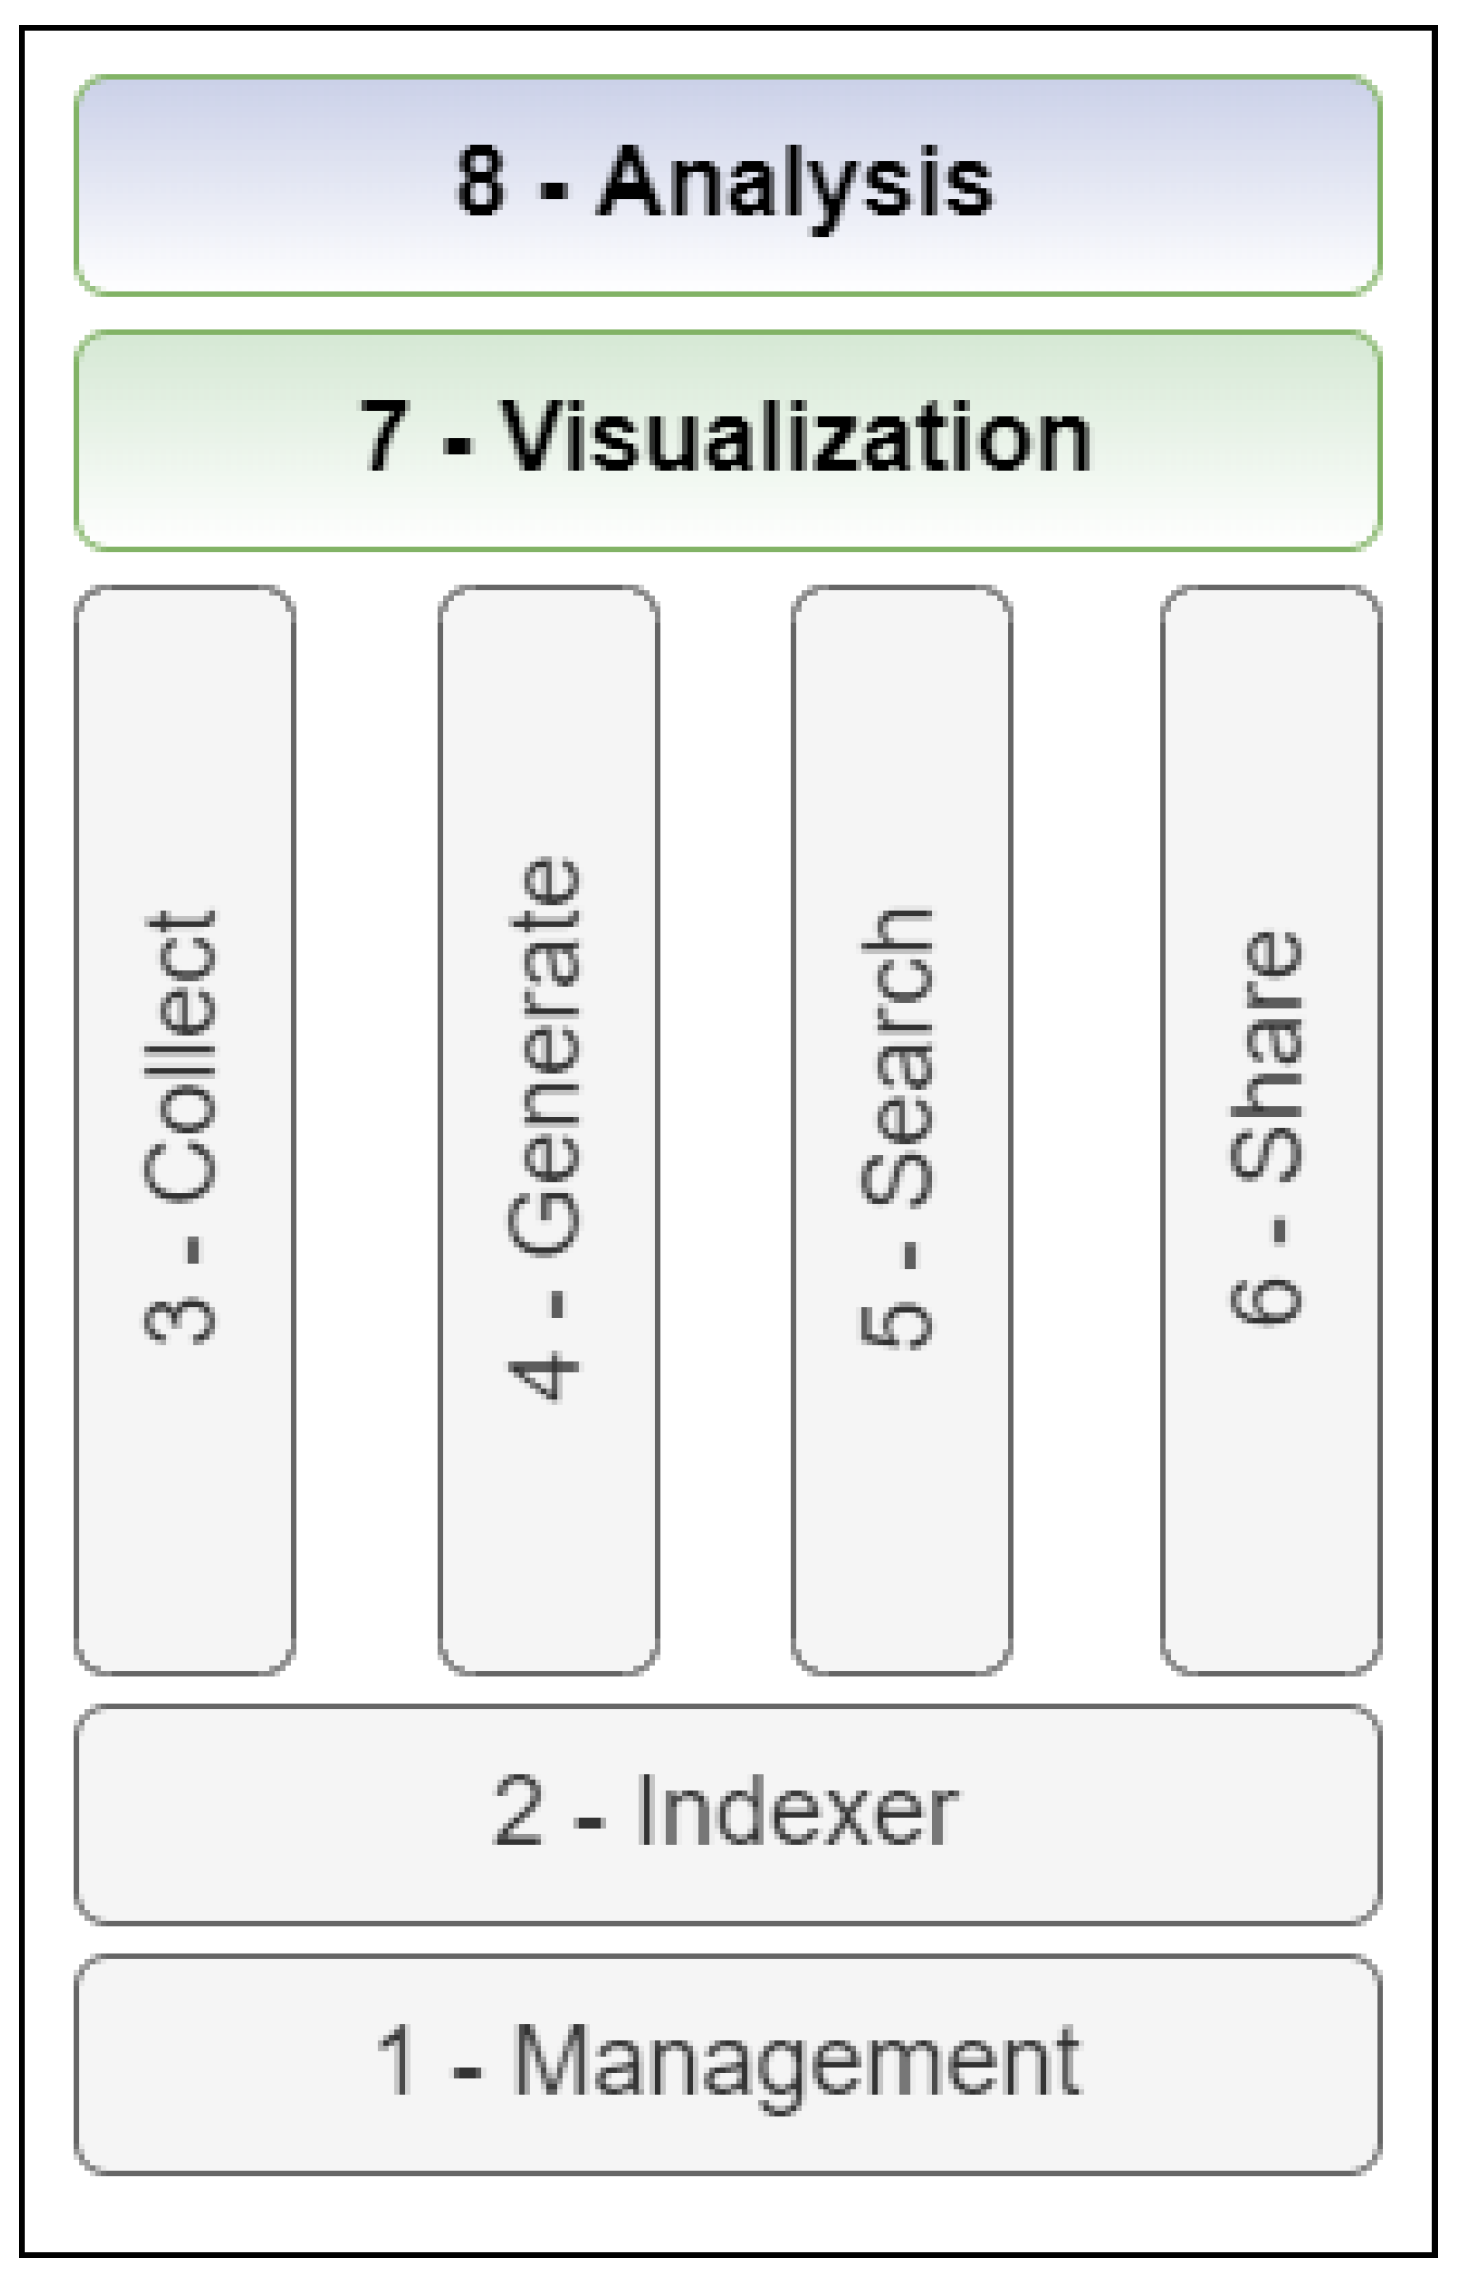
Thus, based on the model proposed at [
29] and the state of the art of the CTI works compiled about collection, sharing, visualizing and analyzing threat data, this work proposes an eight-step CTI model, as shown in
Figure 3.
The two additional steps proposed are visualization and analysis. These two steps as well as all the other six steps are intrinsically related since one does not exist without the other and vice versa. Thus, there is no hierarchy between steps, i.e., they are all important for the correct application of our methodological framework.
Step 1 (Management) is responsible for managing the interaction of users with each functionality that the application offers and the interaction between them. It is also responsible for controlling the flow of data and its access through the management of access permissions. This functionality must be linked to all actions that can be performed by users, such as creating requests to import data, manipulate stored data, share feeds and collections. This is why this step is at the base of our model.
Step 2 (Indexer) must be supported by a storage structure capable of supporting the amount of data input and output on our tool. Relational databases are the main storage structures used on our tool to support the ingestion of collected data and the feeding of upper steps.
Step 3 (Collect) is responsible for providing external data gathering and insertions on our tool. It needs to collect data in different formats and standardize them on the same format required in Step 2.
Step 4 (Generate) must provide the normalization of internal data using the same Step 2 and 3 pattern so that ingested data can be converted into Feeds for later use in our tool.
Step 5 (Search) must provide mechanisms and methods to allow data manipulation and exploration in an effective manner, permitting fast data indexing and full visibility of stored data.
Step 6 (Share) must allow the sharing of internal data such as feeds, collections and threat campaigns between users, as well as sharing with third-party tools that use STIX language.
The visualization step (Step 7) introduces the visualization of the CTI data in a temporal format in order to create a threat timeline so that one can have a “complete picture” of the threat footprints, IOCs and any useful information that was enriched and shared by other interested parties.
The analysis step (Step 8), which is intrinsic to the Step 7, implements functionalities allowing the analysis of data and to manipulate and obtain the best information from available threat data.
5.1. Solution Overview
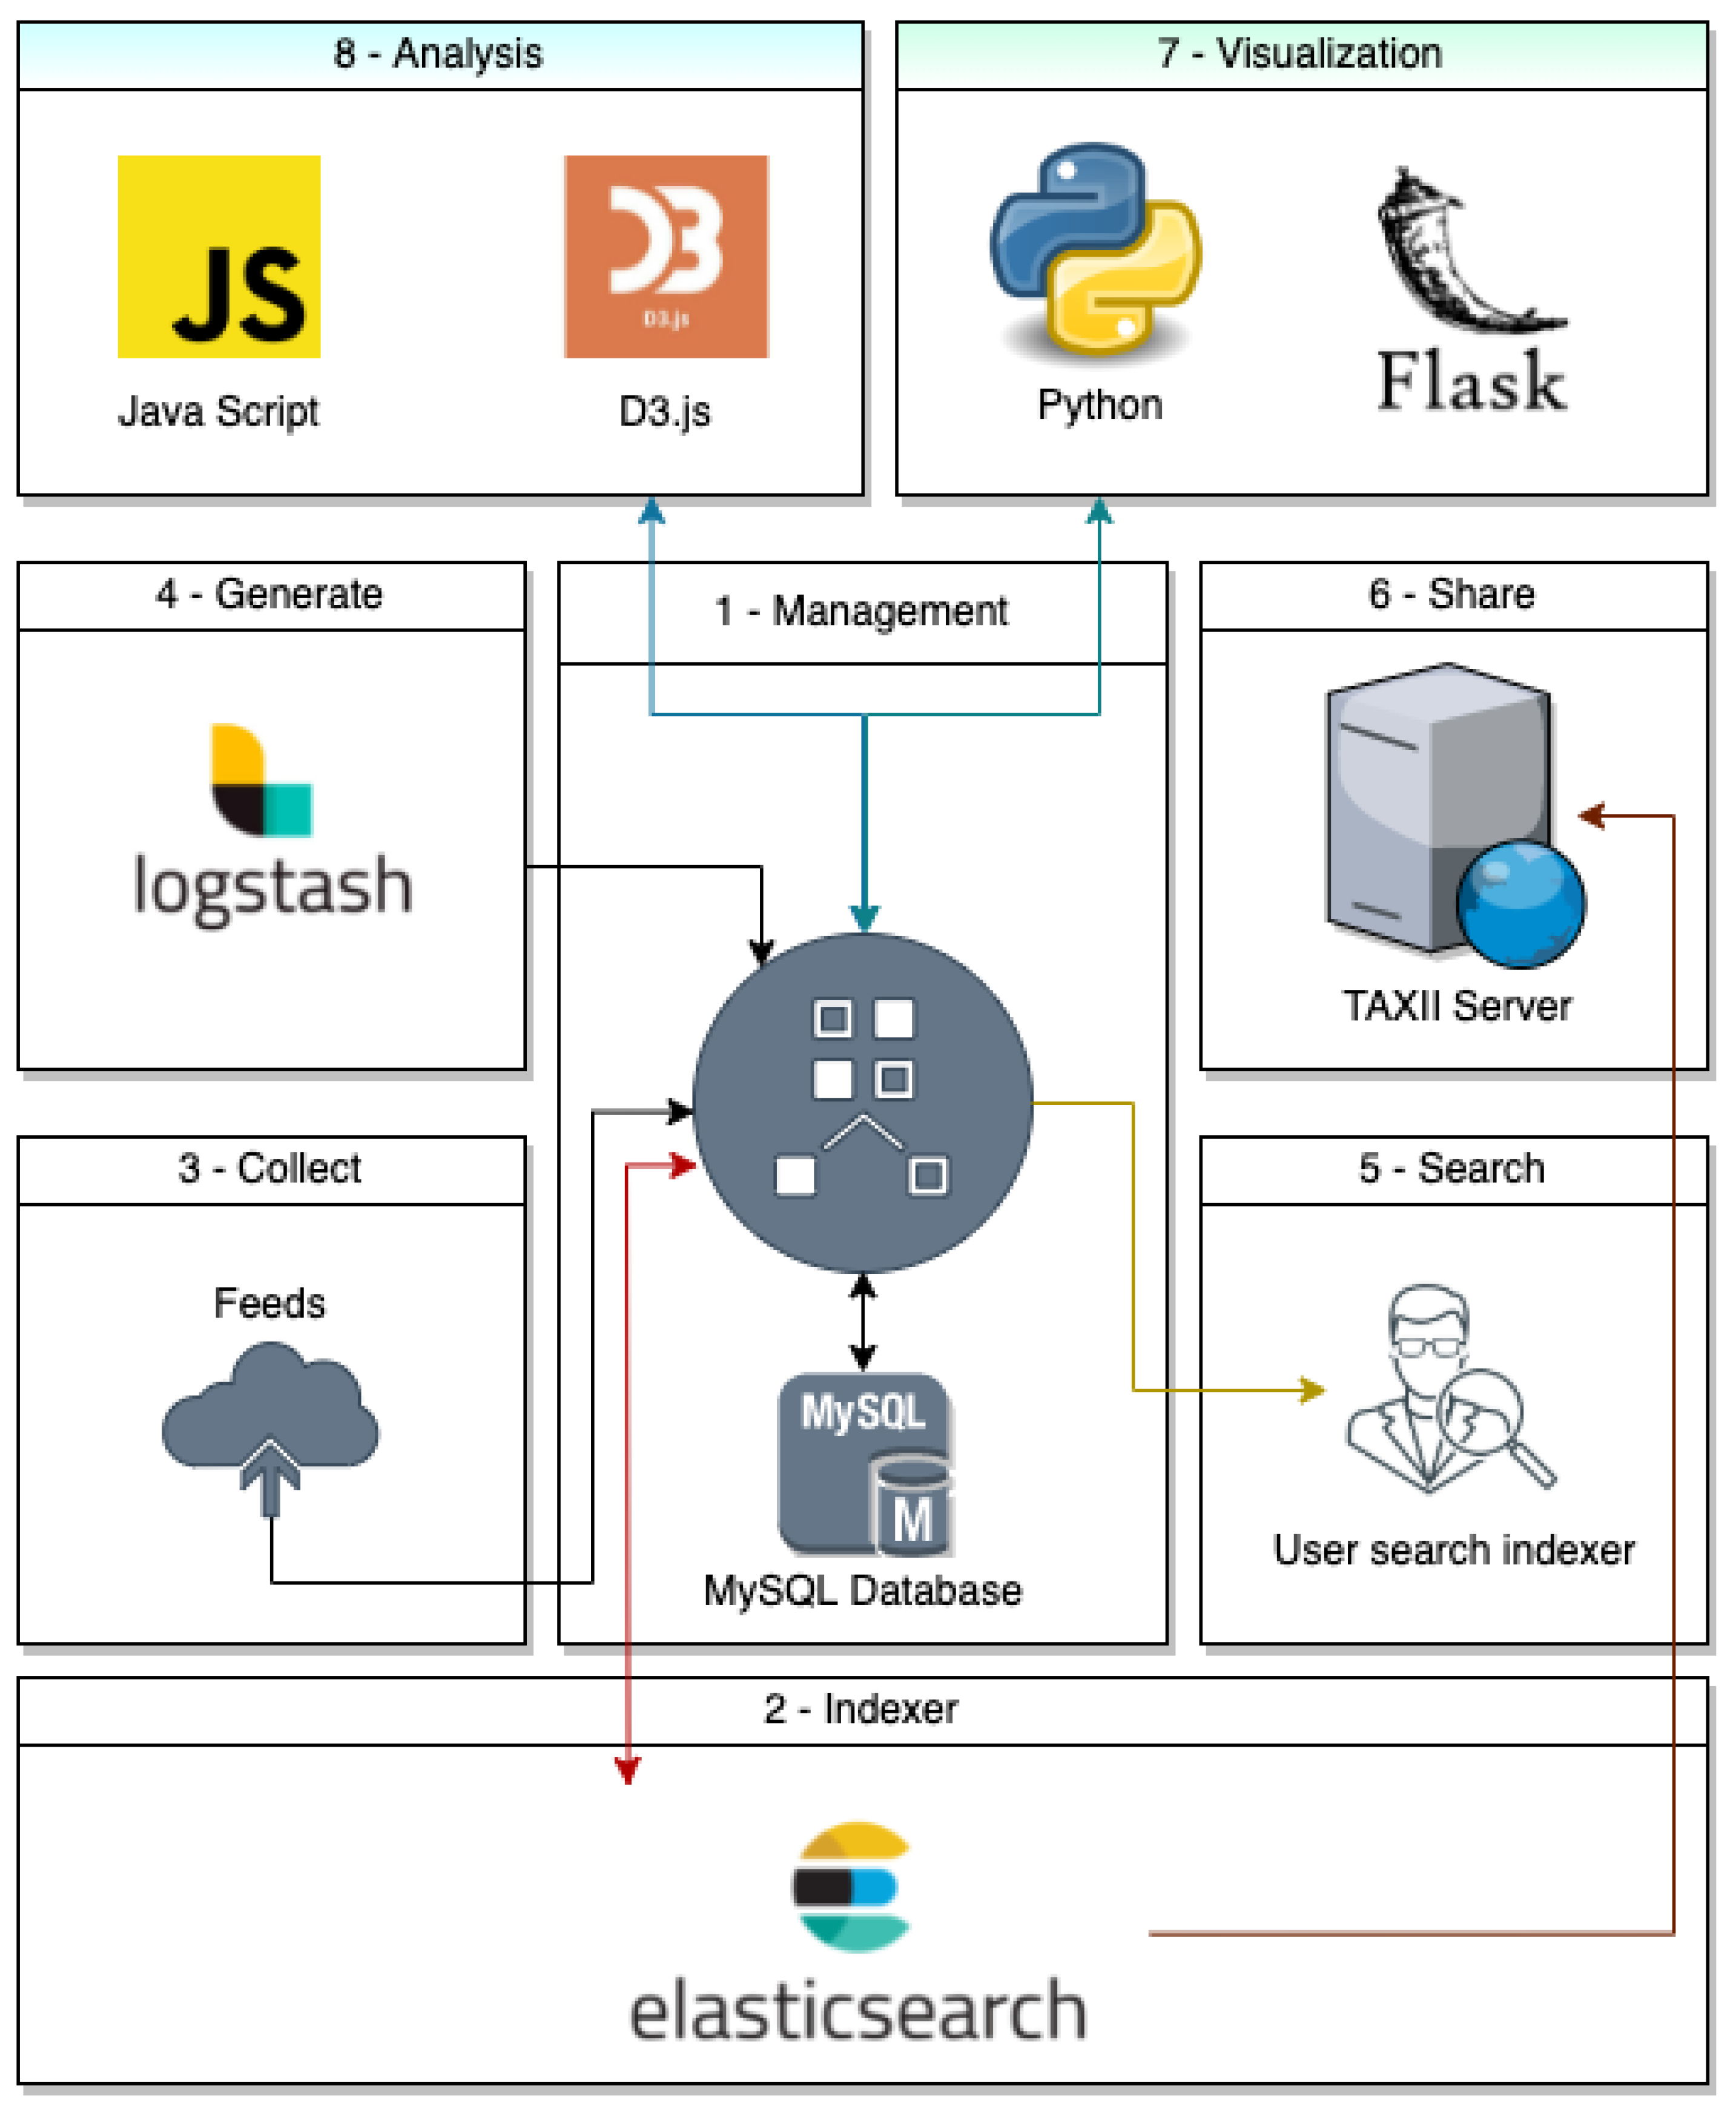
According to the proposed eight-step model,
Figure 4 describes technologies and products behind our tool that supports all eight steps.
Management step can be considered the main hub that connects all the other steps together. It uses MySQL as the main database to store data in a structured man and can be compared to Cold Storage.
Indexer step is where we save our feeds and any other frequently accessed data. We chose Elasticsearch because of its efficiency in indexing and fast search. Analogously to the MySQL comparison, Elasticsearch can be compared to Hot Storage.
Collect step is where we collect feeds from internet and any external source that are manually input on the tool by our user.
Generate step uses Logstash to control data ingestion and data destination inside our tool. With that, we created a pipeline to standardize feed ingestion and its correct storage inside our databases.
Search step is where the user can search for indexed data. It uses all technology embedded under it in order to allow fast and efficient search from the user’s perspective.
Share step uses the TAXII protocol to achieve information sharing. We used a TAXII Server to allow standardized STIX sharing, making our tool integrable with any other market tool.
Step 7 (Visualization) and 8 (Analysis) are web based and were built to run on any modern system. The visualization step was developed using Python and Flask, a microframework for web developing that allows efficient and robust applications. Analysis step was developed using Java Script language because of the D3.js library that allow us to work with large datasets of feeds and create dynamic visualizations of IOCs.
5.2. Feeds Collection
Steps 7 and 8 must be fed with treated and standardized data in order to provide threat information and analytics to the user. However, before that, it is necessary to correctly collect IOCs from different Internet sources—such as forums, sites, archives (PDF, word, freetext, etc.) and feeds. Among these, feeds usually are the most desirable information collection source, because many cyber threat vendors or specialists release their threat research and hunting data in this manner. Feeds are a set of indicators of a specific threat type, e.g., malicious IP addresses that should be blacklisted on firewalls or phishing URLs that must not be accessed by common users. In this study, seven known feeds were used to acquire threat information and IOCs. All information is listed in
Table 2.
Furthermore, it is possible to add manual Feeds or IOCs on the tool as long as data are written in STIX/TAXII format.
5.2.1. Visualization Step
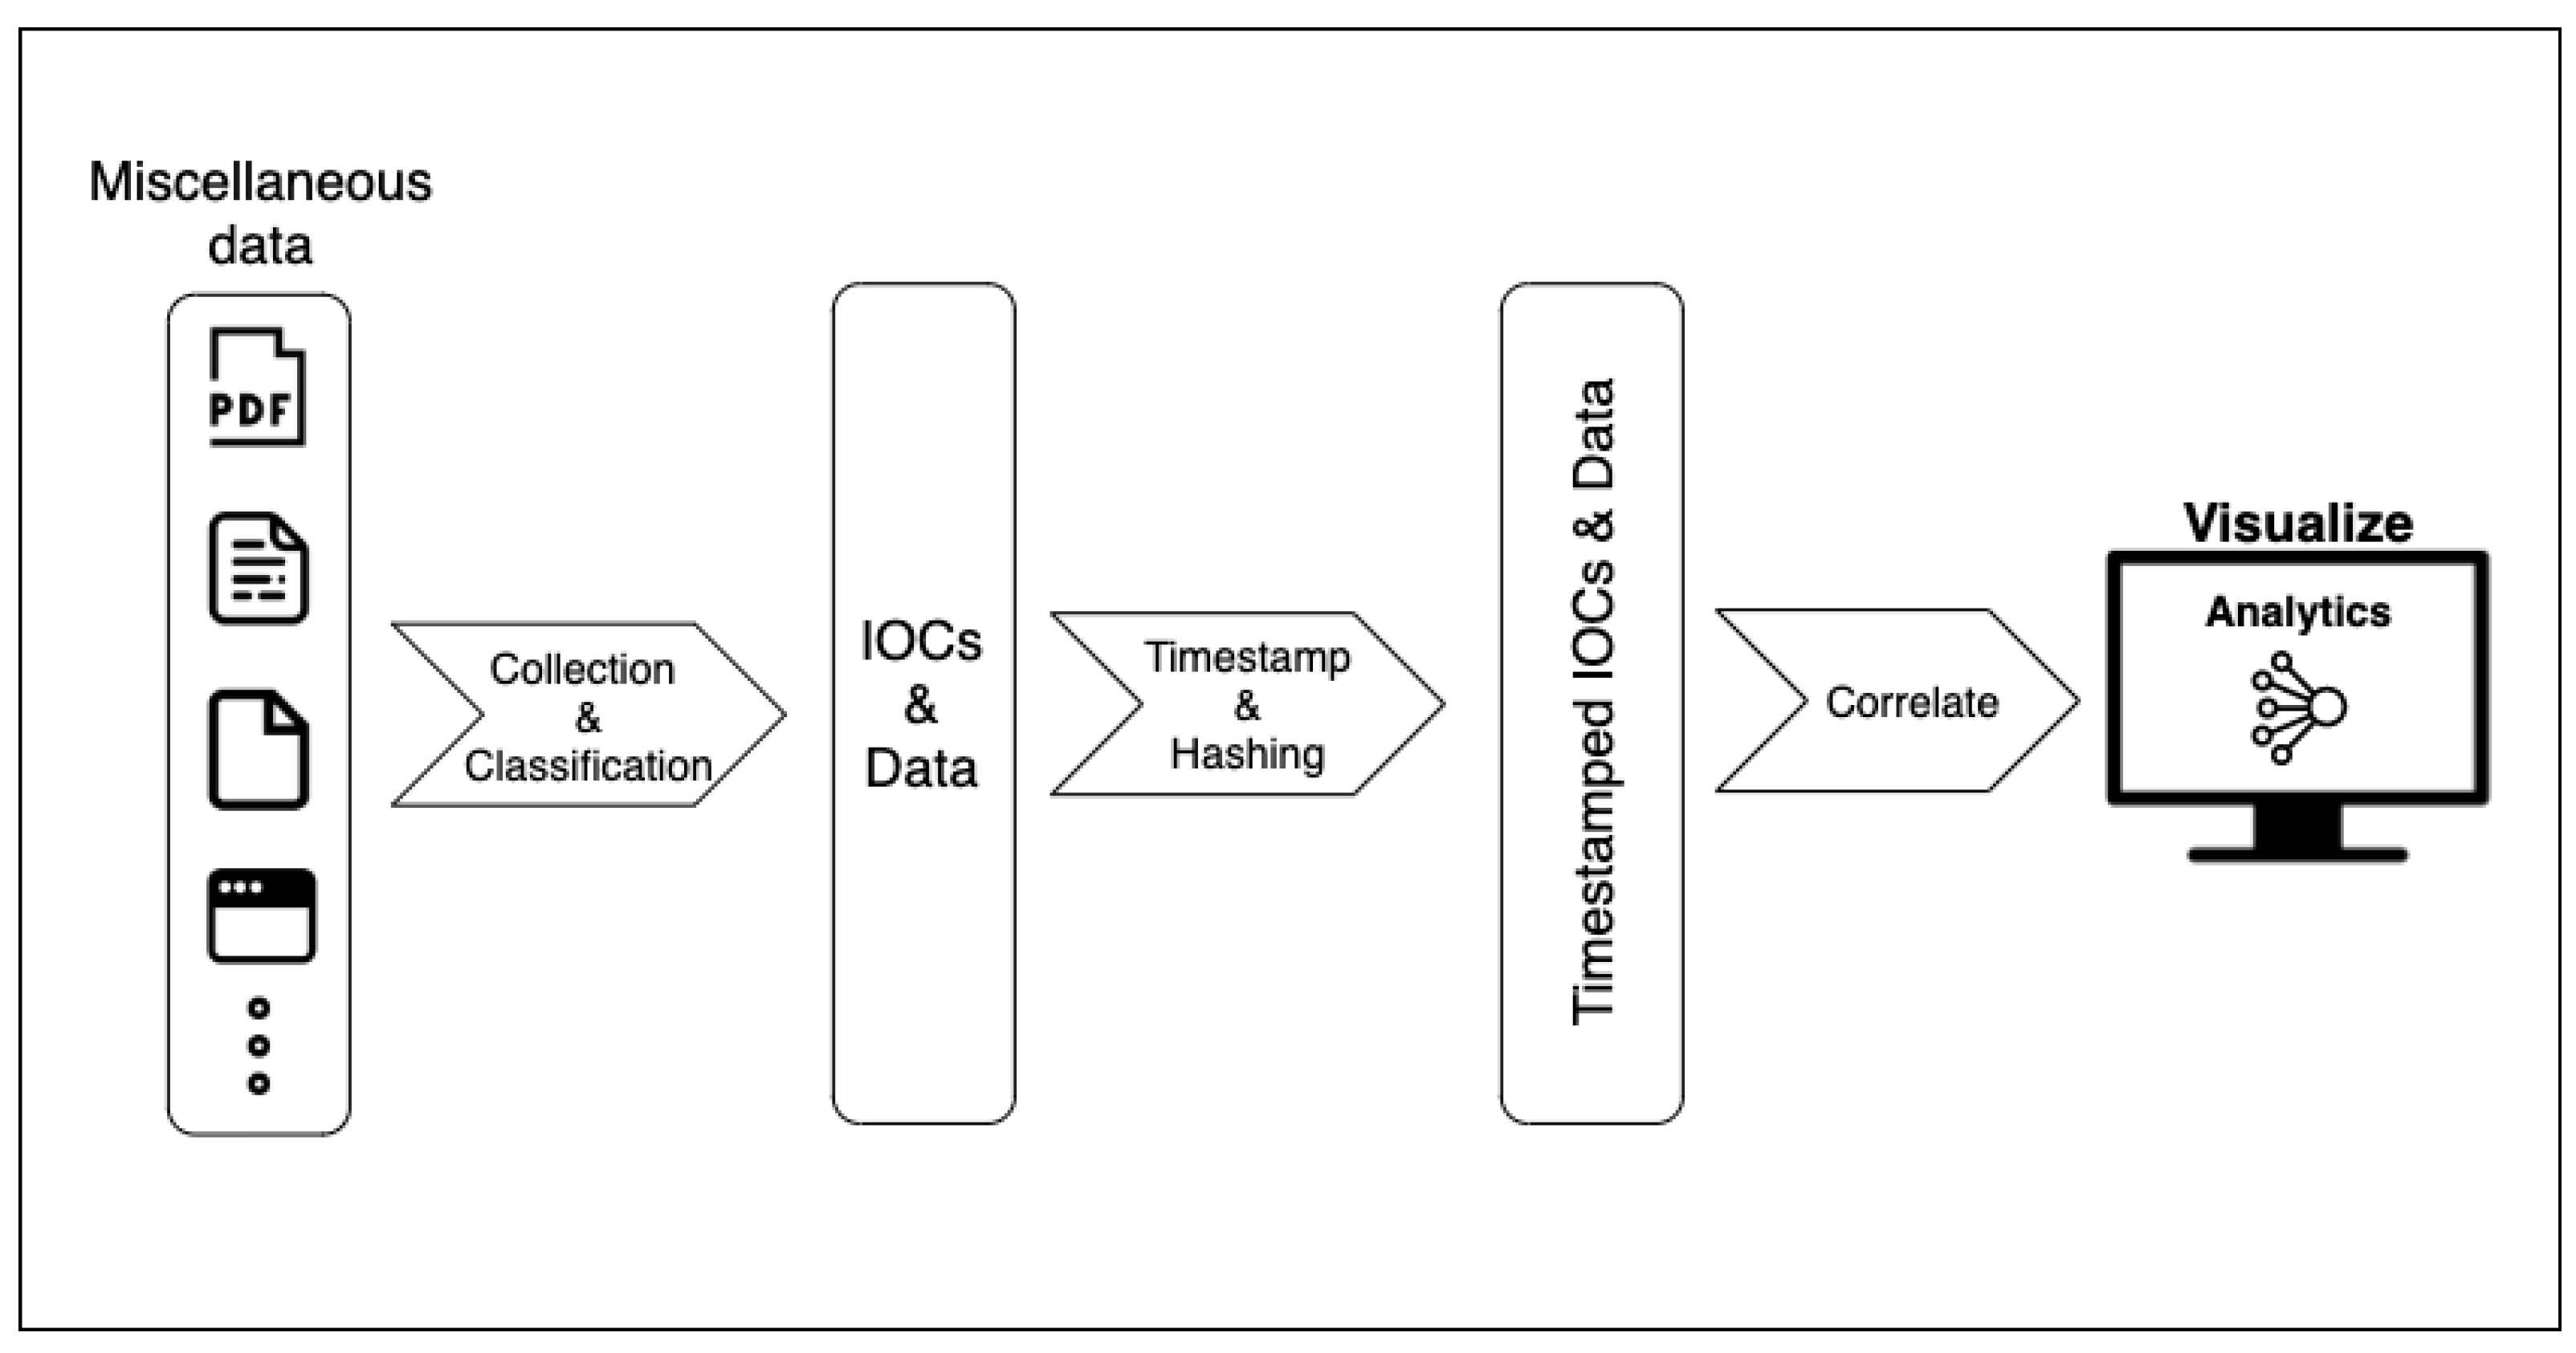
As mentioned above, for a correct execution of the proposed visualization step, a very well determined CTI process of collection and data organization is necessary, which will permit correct IOCs and any other information linkage, as illustrated in
Figure 5. This process illustrates the number of data silos where useful information can be extracted—such as PDFs, blogs, tweets, websites, text files, etc.—which often contain IOCs and threat footprints that can be useful in CTI analysis.
The first important consideration is how to efficiently ingest all data in a manner it can be further used on the CTI process. That said, when collecting a piece of information from any source, a timestamp must be created to uniquely identify data for further validation, indexing and the exhibition of the data in the timeline itself.
Another important point is to create a hash signature for that data; thus, it is possible to avoid collecting already existing data in the CTI tool repository, thus duplicating it. When these two points are implemented, temporal visualization is possible, providing the user with a useful interface that will enhance cyber threat intelligence results.
5.2.2. Analysis Step
With Step 7 (visualization), the tool will allow the exhibition of analytics from CTI-acquired data—such as IOC relationships, quantity, timestamps from when IOCs were added to the platform or discovered by threat hunting and any other possible analytic idea.
For this reason, the analysis step (Step 8) has challenges similar to the business intelligence area, i.e., it will depend upon the cybersecurity engineer to create analytics that make sense for the business situation or the scope of the challenge being addressed at that specific time—choosing the analytic that is the best suitable.
5.3. Timeline Visualization
Analyzing IOCs and threat information is usually a complex task because it is needed to analyze a large amount of text: IPs, URLs, domains, IPs geolocation and any other textual information. The solution proposed in this work helps this task, providing a timeline model in which the user will literally look at threat data in a temporal format, facilitating the understanding and perception of patterns such as the origin of the threat, interconnected domains and IPs and even possible attack groups.
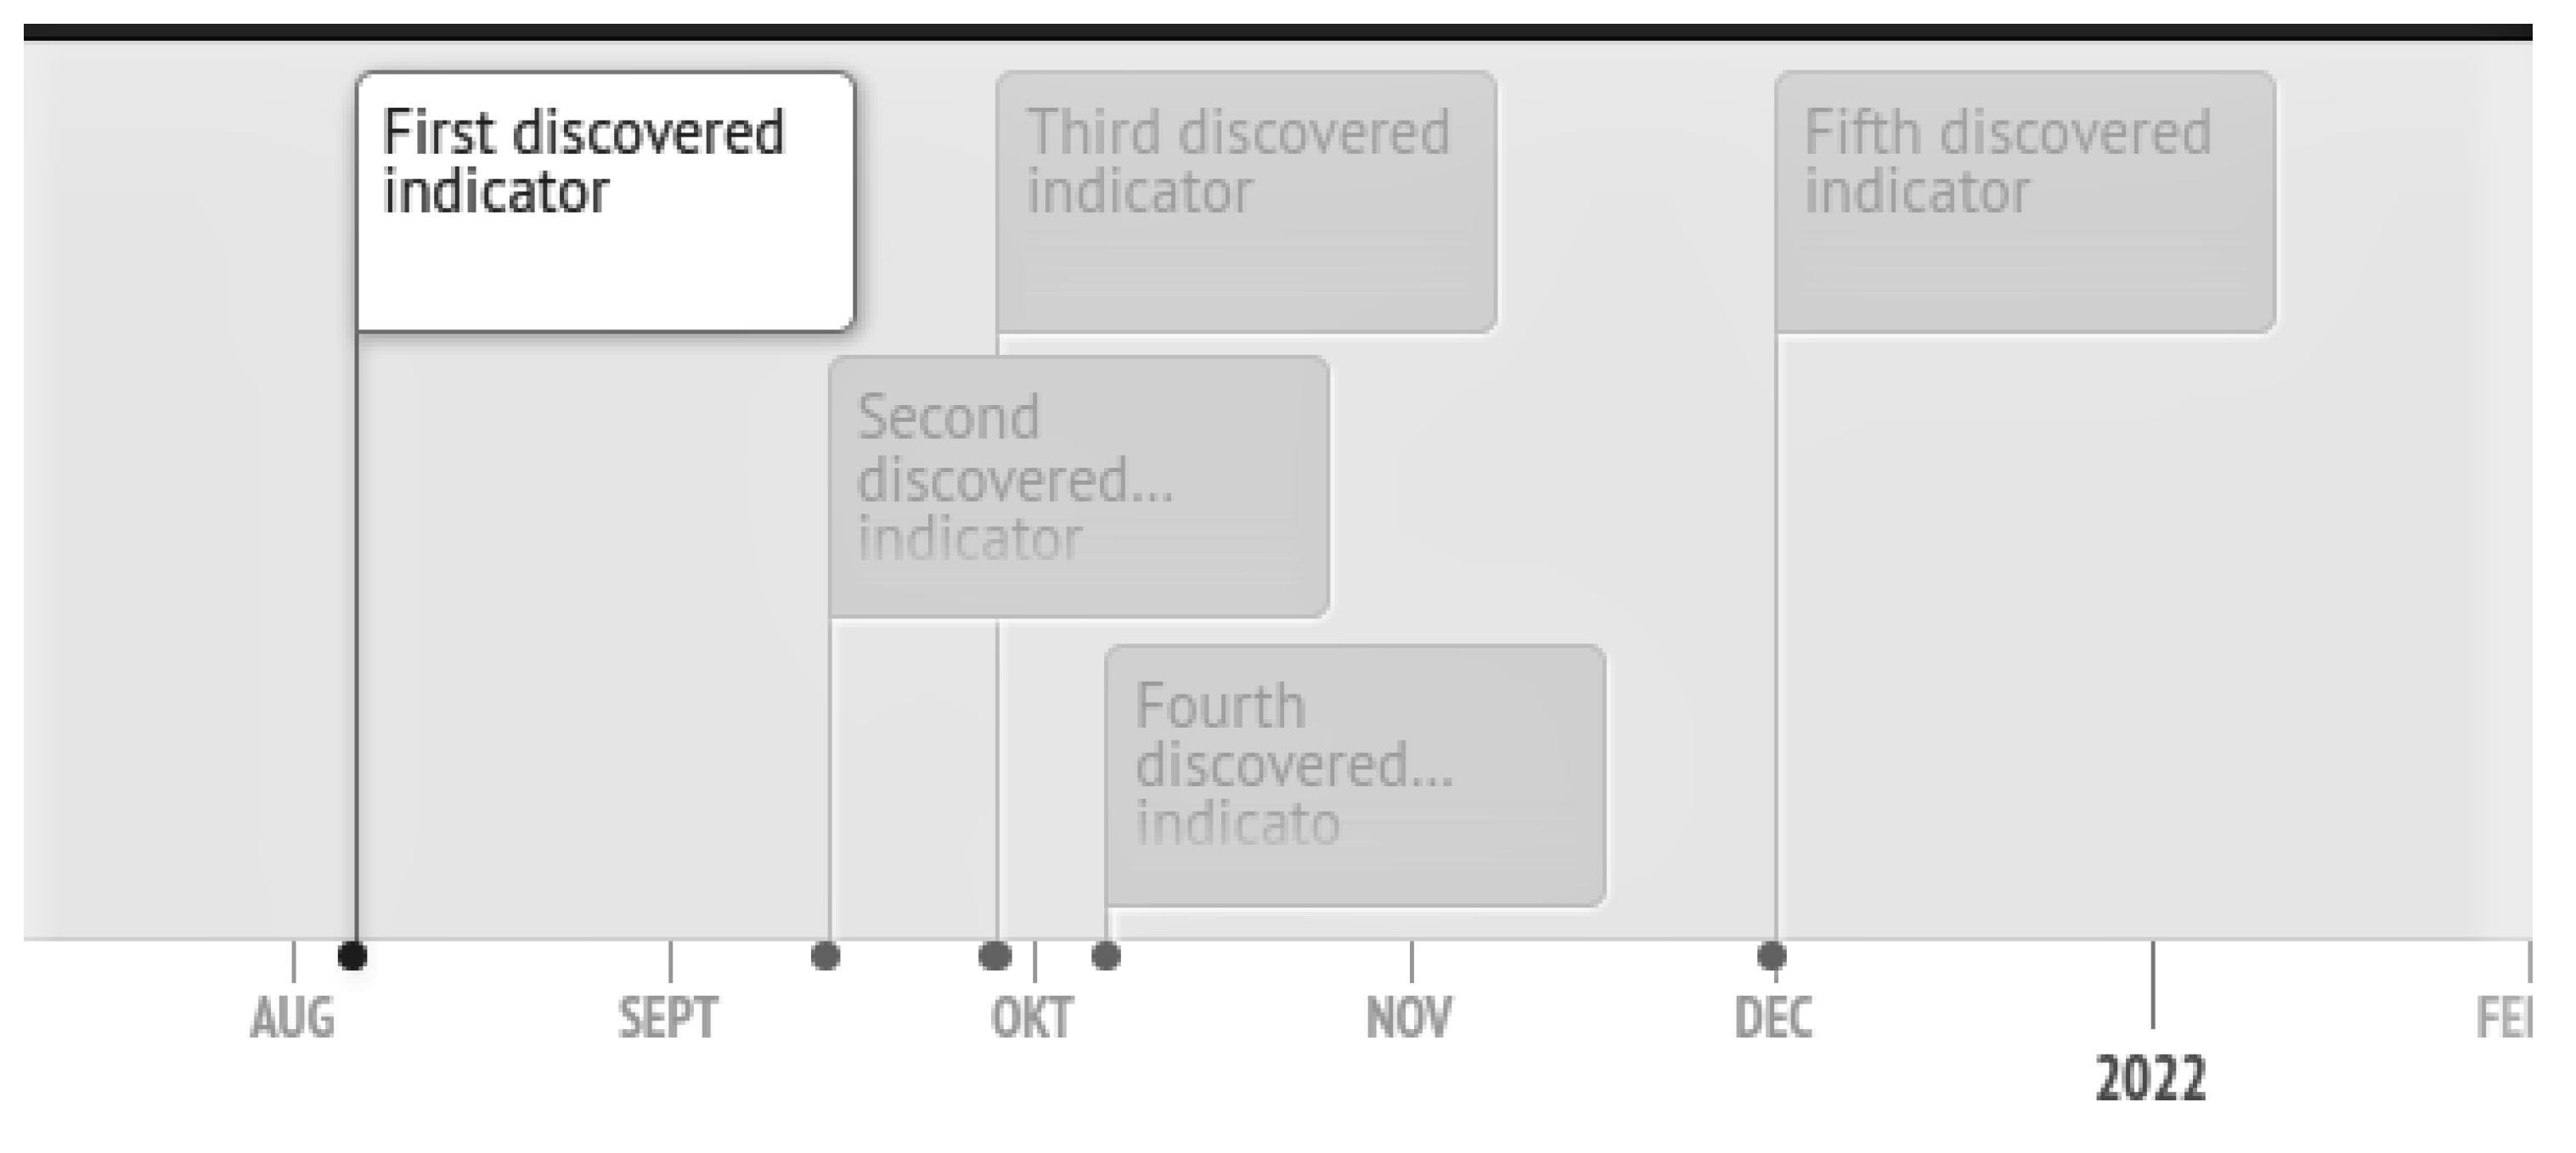
Figure 6 shows an example of the proposed timeline with generic IOCs added to illustrate.
The CTI timeline is customizable and need only to be fed with events. Users can add images to characterize individual IOCs, such as an IP, domain and URL, or it can be left blank as observed in
Figure 6. It is a very easy and lightweight visualization platform built to run on browsers; thus, one can use on any modern OS.
6. Case Studies and Discussion
First, feed collection robots will be demonstrated and listed here, as well as the analysis view of a threat with its objects, relationships and other informations.
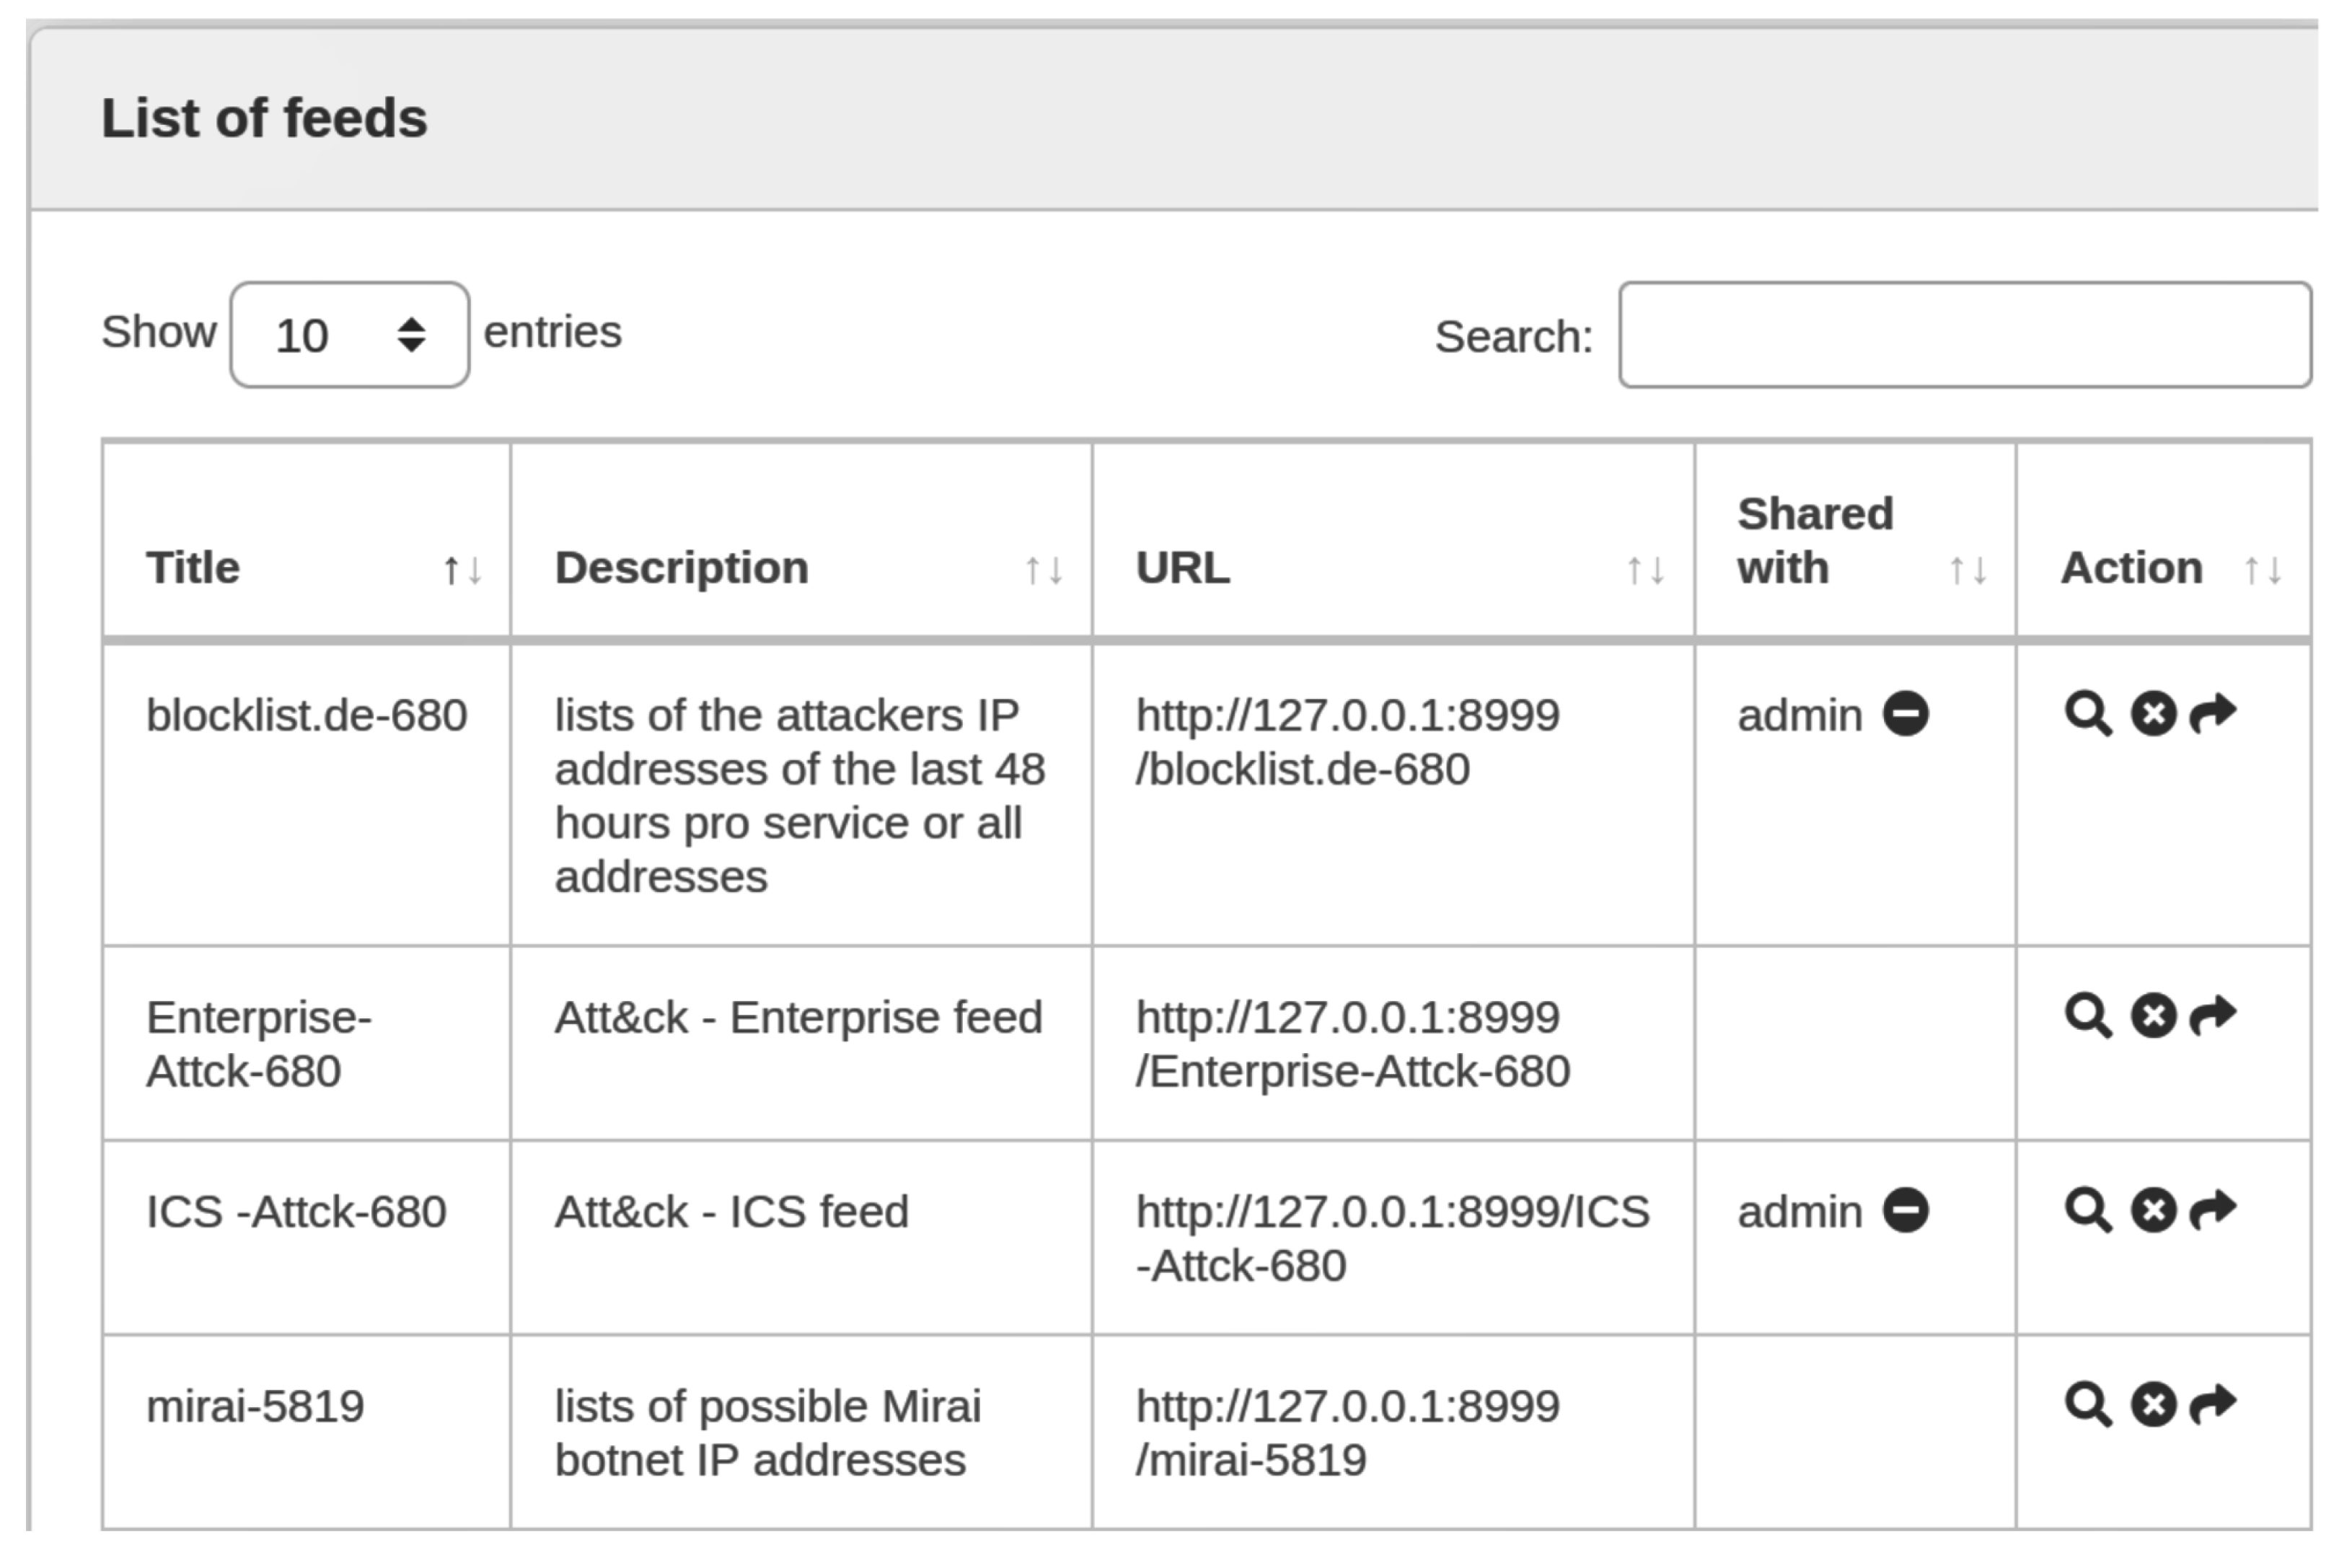
Table 2 shows the list of feed robots aggregated inside the developed tool. All of them are STIXv2/TAXII standardized.
When the user selects one feed and downloads it to the platform, it will be available for exploration. The process of timestamping is automatically performed by our tool, and the feed is exhibited with a short timestamp (e.g., “blocklist.de-680”) indicating the time they were downloaded into the tool, as shown in
Figure 7.
Then, the cyber threat analyst will be able to look at the list of collections of a specific feed. These collections can be a specific type of vulnerability exploitation such as botnets, ssh exploits and any other known vulnerability.
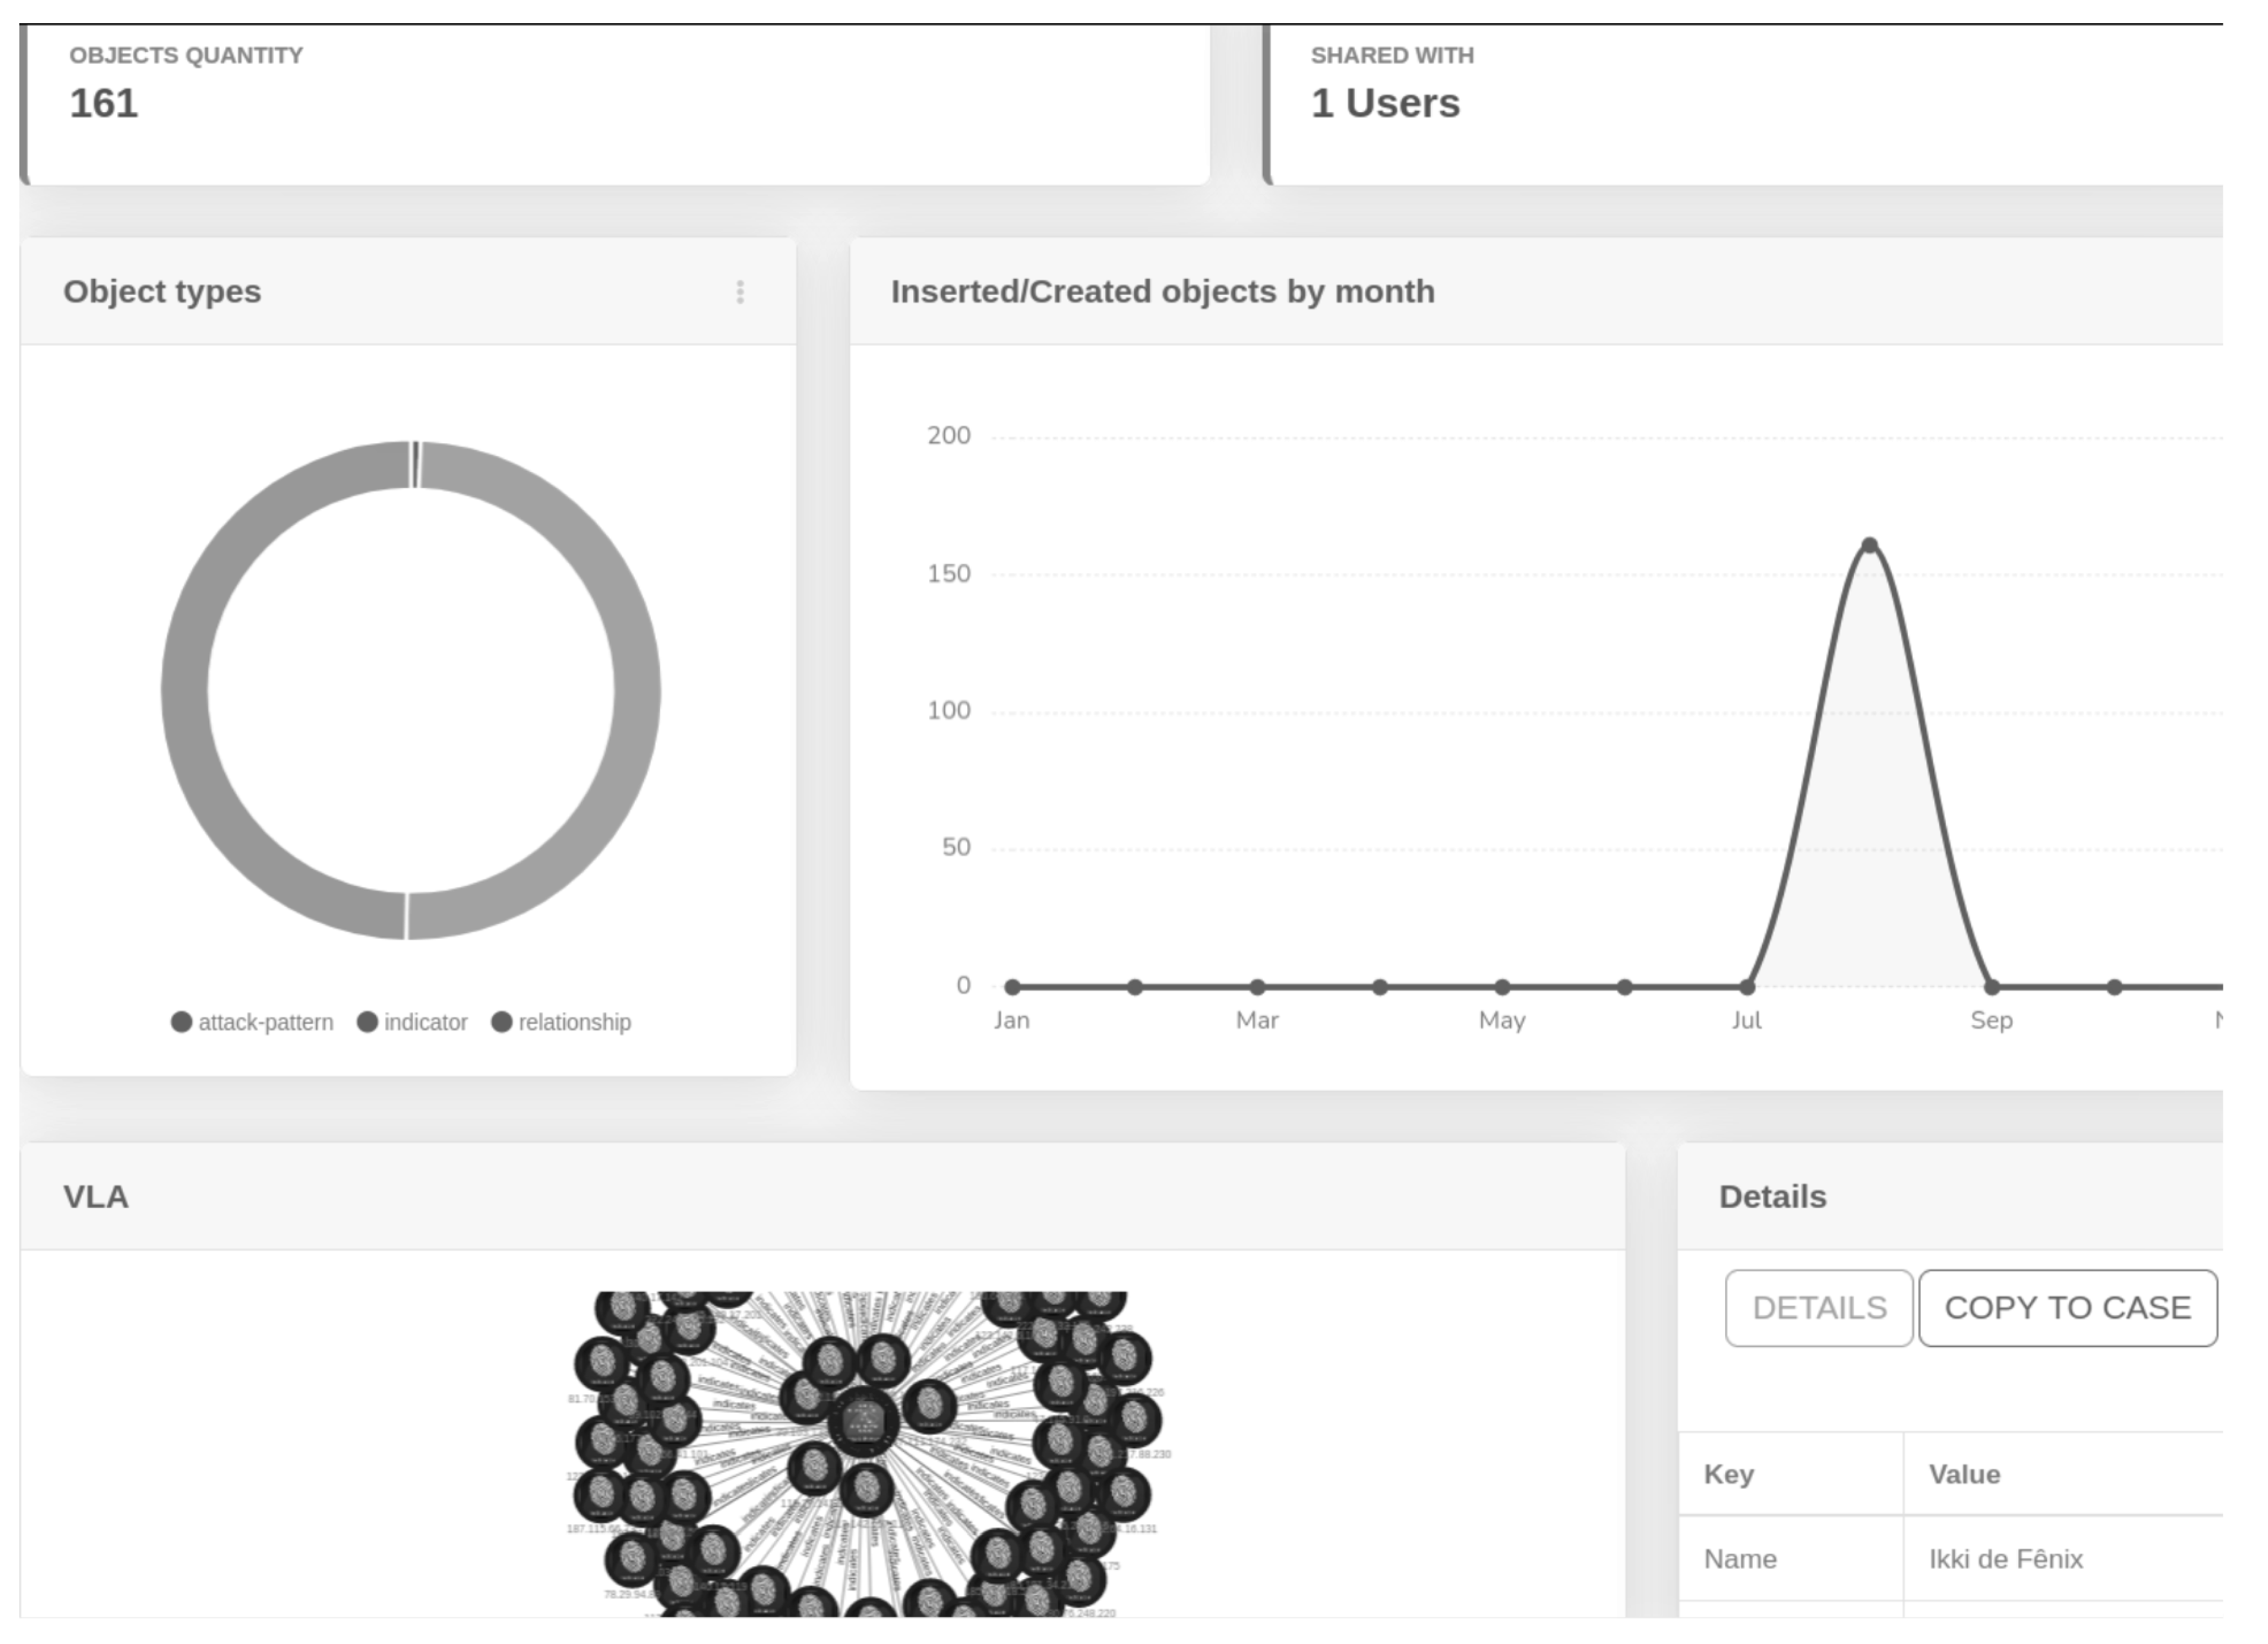
The user can analyze the objects itself to observe some text-information about them. It is possible to have some simple analytic views, such as object quantity and type and a raw view of the data collected.
Furthermore, an analyst can obtain information about a specific collection such as numbers of objects, with whom is it shared with, type of objects and IOCs relationship view (
Figure 8).
Therefore, to illustrate the proposed framework aggregated in the visualization step, the complete CTI process will be demonstrated—collection, treatment and visualization of IOCs arisings from two recent attacks at the time of this writing: Pegasus Spyware (2021) and SolarWinds Orion Trojan (2020).
6.1. Pegasus Spyware Analysis and Timeline
Pegasus spyware is an attack that affected personal Android and/or iOS smartphones with phishing clickbait or even zero-click attacks, which do not require any interaction from the phone’s owner to succeed. This spyware was initially reported in early 2016 and might have gained access to millions of smartphones. It was also used to target political users, disclosing confidential political information.
For this analysis, it is important to highlight that some feed creators do not create the timestamp for each IOCs according to the period in which it was discovered. In fact, many Feeds have a timestamp for when the IOCs were added to that feed. The problem is that since they are added in one batch, they are timestamped on the same day, hour and minute, changing only the milliseconds in which a computer script took to add all IOCs to the feed.
This problem makes an analysis of the threat in the timeline unfeasible since it makes no sense to display a timeline with all IOCs at the same moment of time, especially when this moment is the time when the computer added IOCs to the feed and not the actual time that those IOCs were discovered by a threat hunter. The idea of timeline visualization is to create a storytelling about a threat, helping the understanding of the CTI engineer about the campaign of that threat. Thus, for this demonstration, we acquired Pegasus IOCs from a feed and cyber threat-specialized sites as well.
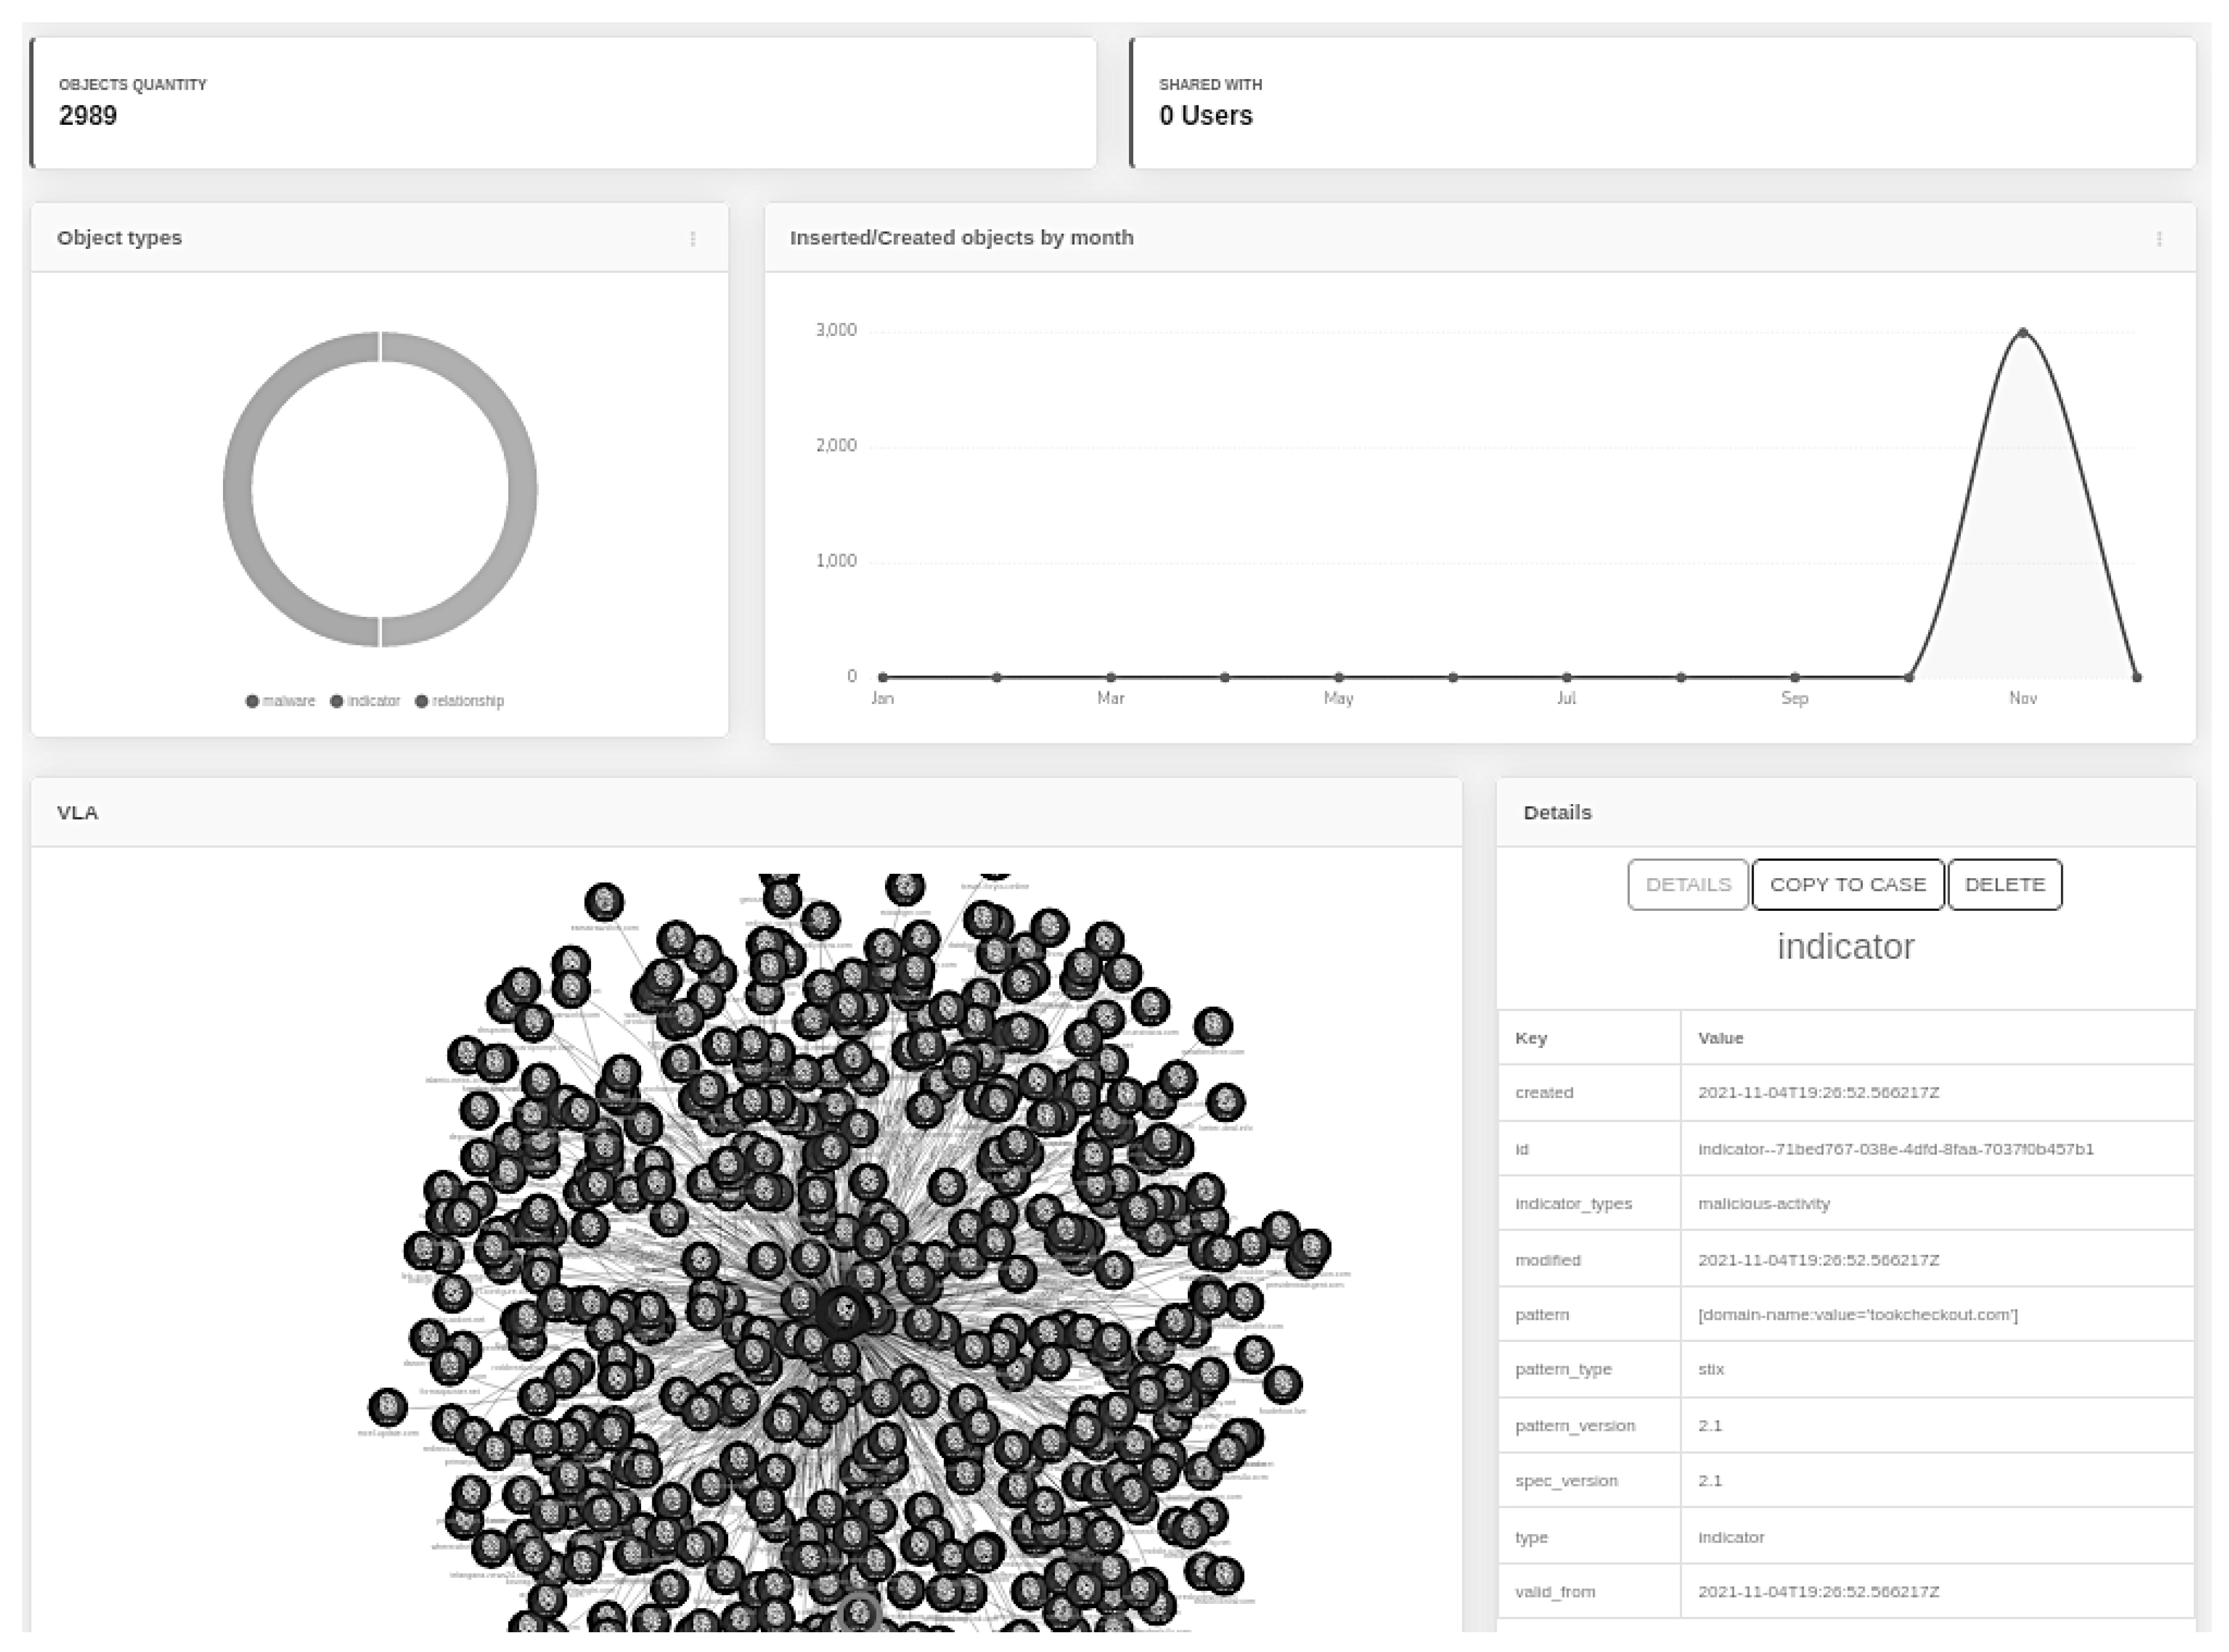
The Pegasus feed was found at Amnesty Tech (the same company that had their employees smartphones hacked by Pegasus) Github repository [
37] and was STIXv2 formatted; thus, it was inserted inside our tool. After insertion, the tool formatted all ingested data, and a feed called “Pegasus” was created. As shown in
Figure 9, there are 2989 objects that are correlated with Pegasus, most of them being Indicators of compromise of the spyware.
Figure 10 shows the Pegasus timeline with four events that were registered by two different organizations: Citizen Lab and Amnesty International. Those events were independently related and were not correlated at the time. With this timeline view, it is possible to observe how the spyware spreads to his targets—most of all iPhone users that were lured to click on a link that downloaded malicious content to their IOS phone system. This attack was brought to light in 2021 but has been reported since 2016, as is observable in the timeline view.
This kind of information could have helped a security analyst to mitigate Pegasus damage earlier, as he would be able to observe that the spyware was making creating more victims from different nationalities.
It is important to highlight that the example of Pegasus used in this case has a more textual description of the attack, and the next SolarWinds timeline analysis was created by using a more “IOCs focused” analysis. This was purposefully performed to demonstrate that our tool supports both types of analysis and that it is possible to create any type of temporal visualization, depending on which is best for a specific threat campaign.
6.2. SolarWinds SunBurst Timeline
In early December 2020 [
38], the security company FireEye announced that they were attacked by a supposedly nation state-backed attack group (probably a Russian group named Cozy Bear [
39,
40]) that stole tools that were used by FireEye red-hackers team. The attackers exploited a vulnerability in Orion updates—a popular IT infrastructure management software that is distributed by SolarWinds—and infiltrated trough the FireEye network, inserting their malware on their servers and opening a backdoor to steal data.
For this analysis, we used IOC data acquired from FireEye GitHub repository [
41]. IOCs were not formatted on STIX format; thus, they were manually added to the timeline. This example shows that the cybersecurity engineer will not always find threat feeds formatted in STIX/TAXII standards, but that, with this tool, he will still be able to create a timeline with any information found on websites and documents that contain useful indicators for a more complete analysis of the threat.
Figure 11 shows part of the timeline created for SunBurst trojan.
The data breach occurred on 8 December 2020. By analyzing the timeline, it is possible to observe that “strange” domain traffic flows were observed on FireEye network logs. These domains were not related to the attack because they probably did not realize the increasing frequency of unknown domain connections inside their network traffic.
With the timeline above, a security engineer can perceive a traffic pattern and then open a case to study that traffic and might be able to identify exploit attempts early. Another important advantage is to observe how the attackers are behaving, i.e., if they are only mapping their targets’ infrastructure/systems or if they have already started their attack campaign against their target, for example.
Thereby, both Pegasus and Amnesty analysis examples provide cyber analysts with a very valuable point of view since it brings a human friendly approach for visualizing threat history and behavior.
7. Conclusions and Future Studies
This work proposes a methodological framework to improve security engineers’ worklife related to cyber threat intelligence. Previous studies were examined in order to find the pain points as well as the most important points of CTI. Currently, there are no tools that allow the collection of threat data from feeds and other sources that can insert, filter and visualize them in a customizable manner. Hence, with the proposed eight-step CTI model, developers can build an application to address CTI needs and improve the previously discussed collection, storage, filtering, analysis, visualization and sharing of cyber threat data when gathered from multiple sources. In addition, with the main idea of exploring data to address a particular case construction, CTI data from multiple sources is still a challenging problem that demonstrates the need for a methodological framework capable of allowing a consistent and reliable case construction.
For this matter, we developed a python-based tool as proof of concept of our framework and provide our reader with a direction in which the CTI dev should proceed, i.e., common feeds aggregation based on STIX language to gather shared threat information across the internet. Furthermore, our method allows single threat details and visualizing them in a temporal manner to obtain a complete view of a threat and their indicators. All this aims to achieve a user friendly interface in order to facilitate user usage of the tool and to provide focus on what it is necessary: threat discovery, countermeasures and information sharing along stakeholders.
The Pegasus Spyware example explored an attack that plagued politicians, celebrities and even ordinary people. Information was available on the internet in an unstructured and non-standardized form, making it difficult to detect and standardize the attack. The same reality is almost equally valid for the SolarWinds SunBurst attack. The difference in this case is that the attack was targeted directly on a cybersecurity company, which detected and recorded all the main indicators of the threat.
Thereby, these two examples illustrated how threat data are diffused and nonstandardized, reinforcing the latent need to standardize the registry of threats and vulnerabilities as much as possible, encouraging the sharing of information between all players interested in protecting themselves, thus allowing a quick mitigation of these threats. Thus, using our tool (or any other existent tool) allows the collection, processing, exploration, analysis and generation of valuable insights in the context of cyber threat intelligence and threat mitigation.
For the visualization step, future studies will explore the improvement of the timeline, allowing the user to attach documents such as PDFs or URLs with hyperlinks such that it can be easier to use the tool as the main CTI tool of the company’s security operation center.
Other important improvement will be on the analysis step, where increased analytic visualizations can be created so that the cyber security analyst has more information at their disposal in a modular and customizable manner, i.e., according to his choice.
Finally, another important future study that will greatly contribute to this theme is the development of methodologies for collecting unstructured and structured data, as well as sharing protocols of IOCs data that will be useful for the correct implementation and execution of CTI best practices such as collecting, filtering and sharing.


 ,
, 


