1. Introduction
The first case of COVID-19 in Greece was recorded on 26 February 2020. From that day and in less than a month, the Greek government began the implementation of restrictions which led to a general quarantine lockdown, affecting people’s mobility, thus creating a new reality for urban mobility (modal shift, mobility restrictions, etc.). It is rather clear that COVID-19 has affected, and continues to affect, people’s transport mode choice. According to surveys “
consumers are already showing an increased cautiousness about health, meaning that safety is likely to be a more important factor for consumers when deciding if, how and when to move” [
1].
Three major European cities during the first months of the pandemic announced measures that allowed bikers and pedestrians to comply with social requirements. Specifically, according to the press, authorities in Milan, Italy, decided to reallocate street space from private cars to cycling and walking, in response to COVID-19. Over 35 km of streets were to be transformed over the summer of 2020, through a rapid experimental citywide expansion of cycling and walking space in order to protect residents. The Strade Aperte plan states: “
included low-cost temporary cycle lanes, new and widened pavements, 30kph speed limits and pedestrian and cyclist priority streets” [
2].
Another European city adopting measures aiming to promote cycling and walking is Paris, France. According to the press, an investment of over 300 million EUR is underway in the Ile-de-France area for the construction of an extensive network of separated broad cycle paths and highways. The local authorities highlighted the fact that cycling is one of those transport means that allows users to maintain necessary and appropriate social distancing and therefore should be supported in order to play its role, not only during the COVID-19 crisis but also after its end [
3]. In addition, the World Health Organization has urged cities to make full use of cycling and walking. Specifically, on a brochure published by the WHO entitled “Moving around during the COVID-19 outbreak”, it is mentioned that whenever feasible, cycling and walking should be selected since they provide physical distancing while helping people meet the minimum requirement for daily physical activity [
4].
Finally, authorities in the city of Brussels, Belgium, decided that the area of Pentagon (city center), the district within the Kleine Ring, will become a residential area at least during the COVID-19 crisis. The measure endured for 3 months, from 11 May 2020, and during that period (a) pedestrians were allowed to use the full width of the public road and not only the pedestrian paths but (b) vehicles were also allowed inside that area with a maximum speed of 20 km/h to ensure pedestrians’ priority and cyclists’ safety and (c) existing pedestrian zones retained their status [
5].
Another press release regarding the performance of bike-sharing systems in the United States of America during the first months of the COVID-19 pandemic, highlights the fact that the bike-sharing systems in Boston, Chicago, and New York (all administrated by the same company) were free for healthcare or public transportation workers and first responders. Moreover, the bike-sharing system in Washington D.C. was free of charge to essential workers while the respective system in Minnesota was free for healthcare workers. The Houston bike-sharing system saw increased usage, even after COVID-19 precautions closed some stations to prevent gatherings in parks. Many systems—including Kansas City, Detroit, and Memphis—were temporarily offering unlimited free rides for all users. Another aspect of the COVID-19 pandemic effects on the bike-sharing systems in the United States concerns the fact that “
some systems had developed partnerships with local restaurants, allowing them to use their bikes for food delivery. Of the more than 189 cities with bike sharing systems in the U.S., only a few had shut down during the time of the pandemic”. However, there were many cases of bike-sharing systems that presented a significant decrease in their level of usage due to the fear of contagion among other reasons (Santa Monica, Central Los Angeles, West Los Angeles, and North Hollywood) [
6].
A questionnaire-based survey conducted by the Laboratory of Renewable and Sustainable Energy Systems of the Environmental Engineering Department of Technical University of Crete, Greece, under the framework of the Horizon 2020 CIVITAS DESTINATIONS research project, addressed to the residents of the cities of Chania and Rethemno, Crete, during the period 16–22 March 2020, revealed that the percentage of choosing bicycles as their transport mode during the previously mentioned period compared to the period of January–February 2020, increased by almost 18% [
7], embossing the dynamic of the bicycle as a primary transport mode.
The effect of the COVID-19 pandemic on bike-sharing systems is still being monitored and recorded by researchers worldwide. Surveys have been implemented focusing on collecting information regarding individuals’ immediate responses to the travel restrictions during the pandemic in specific areas [
8,
9] while others have covered larger areas [
10,
11]. Researchers are focused on four major topics: (a) environmental quality [
12,
13,
14], (b) socio-economic impacts [
15], (c) management and governance, and d) transportation and urban design [
16,
17,
18,
19] without excluding urban road freight transport [
20]. Many of the above-mentioned research activities are focused on the impacts of implemented restriction measures concerning urban mobility in an effort to control the COVID-19 outbreak [
8,
21,
22,
23] by introducing, for example, terms such as “responsible transport” [
24] or by applying Big Data from mobile spatial statistics attempting to estimate population density patterns in order to customize applied measures to the characteristics of urban areas [
25].
Based on the information and knowledge gained through a literature review on this topic (COVID-19 pandemic and mobility restriction measures), it was decided to develop a paper regarding BS systems in Greece. The present paper examines the performance of the bike-sharing system in three Greek cities (Igoumenitsa, Rhodes, and Chania) comparing the periods before, during, and after the general lockdown, based on data provided by the operator (Cyclopolis) of these bike-sharing systems. An attempt has been made to identify changes in travel behavior related to the usage of BS bicycles, aiming to assist policymakers and policy takers to better design and implement appropriate and efficient customized policies. Moreover, the authors’ intention was not to develop a forecasting model or to explain horizontally how restriction measures affected the performance of bike-sharing systems, but through the findings of this paper to provide a small amount of knowledge to the researchers in the specific field and help them understand and compare travel behaviors and impacts in other cities/countries.
Analysis of the provided data was performed by developing a regression model with aggregated data and thus conclusions could be extracted concerning the performance of the bike-sharing systems across three Greek cities. Based on the first level analysis and its findings, it was decided to develop a regression model using aggregated data in an effort to identify correlations among the parameters describing the BS systems’ performance. Since such data were not available at the time the research took place, we were unable to deal with the modal shift in the framework of the present paper. The second section (Materials and Methods) describes the methodology followed for the data collection and analysis while in the third section (Results), the key findings of the descriptive and in-depth statistical analysis are described. Finally, in the Discussion and Conclusions section, the limitations of the study are presented, along with the main conclusions and future research.
2. Materials and Methods
The methodology followed in the current paper was defined mostly by the availability of the collected (by the operator of the selected BS systems) relevant data (number of trips, number of registered users, time period of recorded data, etc.) as well as the examination of the available literature (similar cases, methodologies developed for evaluating the BS systems’ performance during the pandemic). Concerning the available data, the contribution of the operator (Cyclopolis) of several BS systems in Greek cities was crucial for the implementation of the research. The examination of the relevant literature/references revealed that the majority of the information came from press publications and that there were not many scientific publications on the issue during the first six months of the pandemic in Europe.
The methodology followed for the development of the current paper can be summarized in the following steps:
Examining and analyzing the available literature/references.
Communication with the operator of the BS systems (Cyclopolis) requesting available data as well as ensuring the necessary licenses by the authorities of the three Greek municipalities.
Examining the provided data in order to decide the analysis methodology, a process which led to the conclusion that based on the characteristics of the provided data the development of a regression model would be the most appropriate. Furthermore, it was decided that in order for the data to refer to the same time period it was necessary to aggregate the data to a weekly time period.
Analysis of the provided data. The analysis was implemented in two levels: (a) first-level analysis focusing on those attributes that could better describe the performance of the BS systems in terms of a transport mode and (b) an in-depth regression analysis in an effort to identify if and in which level the COVID-19 pandemic affected the performance of the BS systems. Regression analysis was implemented due to its ability to infer the relationship between independent and dependent variables. As the primary objective of the current paper was to present the effect of the pandemic on BS systems, it was necessary to analyze the provided data in two different time periods. The first concerned the lockdown period and the second regarded the periods before and after the lockdown. During these periods, independent and dependent variables were set and then examined in order to identify which was the effect of the pandemic.
To evaluate the effect of general quarantine lockdown on the performance of bike-sharing systems in Greek cities, we used data provided by the operator of the bike-sharing systems (Cyclopolis). It must be mentioned that in the cities of Rhodes and Chania, public transport is operational throughout the entire year while in the city of Igoumenitsa it is operational only during summertime (June–August) and for specific routes (mainly connecting the urban areas with the beaches located near the city). Daily data were collected for three Greek cities (Chania, Igoumenitsa, and Rhodes) for a rather long time. Specifically, for the cities of Chania and Rhodes, collected data were available from May 2019 to May 2020 while for the city of Igoumenitsa data were available for the time period July 2019–July 2020. However, in order to analyze the data in the same time period, the number of trips, avoided cars (the number of private cars that will not be used due to the usage of BS bicycles), and avoided CO2 emissions were examined for the period May 2019–May 2020 by using simple equations. To proxy the performance of the bike-sharing systems, we used the number of rides per week in a given city (a ride refers to the process of an individual renting a bicycle and following a route of their choice before returning it to a rental station, aka a trip). Thus, our dependent variable was the weekly number of rides (Rides) recorded in the city’s bike-sharing system.
Due to limitations in data availability, we used a reduced number of explanatory variables. The main variable of interest was a dummy variable (Lockdown 23 March–4 May 2020) which captures the general quarantine lockdown and all the restrictions imposed due to the COVID-19 pandemic in Greece (it should be noted that on 4 May 2020 the Greek government announced the gradual de-escalation of restrictions that lasted until July 2020, including the partial lifting of movement restrictions and not the total lifting of restrictions). This variable takes the value of 1 during the quarantine lockdown period, i.e., the weeks between 23 March and 4 May 2020 and zero otherwise. Additionally, we included an alternative dummy variable (Lockdown 23 March–forward), which takes the value of 1 during the quarantine lockdown period and beyond, i.e., all the weeks after 23 March 2020 even after the easing of restrictions on 4 May, and zero all the weeks before that date. We assumed that quarantine lockdown was positively related to the performance of bike-sharing systems, increasing the number of rides during the quarantine period and beyond. Therefore, we expected a positive sign for both variables, implying that the quarantine lockdown led to an increased use of rental bicycles. Through this approach, an increase in the BS system would be proven to be a conscious choice of the users and not a random incident.
In order to examine the trips’ duration, we include the average duration of the rides (Duration) per week, expressed in minutes. Although the trips’ duration could be associated with the number of rides, we do not have a priori expectation on the sign of this variable. Finally, taking into account the form of bike-sharing systems and renting infrastructure within each city, the number of rental stations (Stations) was included in the set of regressors. The automatic bike-sharing system of the municipality of Igoumenitsa consists of three rental stations, the municipality of Rhodes has seven rental stations while the municipality of Chania had four rental stations until January 2020 which were reduced to three from February 2020 onwards. Since BSS bicycles were rented and returned by the users to a rental station, we expected a positive effect of the number of available rental stations on the use of BSS bicycles.
Our analysis consists of panel data that contains observations collected at a regular frequency across similar units (i.e., cities in Greece). The use of one panel data model instead of three separate time series models has the advantage of containing more information, variability, and more efficiency than pure time series data. This occurs because panel data models allow for heterogeneity across units (i.e., cities), namely, allowing for any or all the model parameters to vary across cities whereas time series models assume that the model parameters are common across cities.
Furthermore, the idea of developing three discrete (each for a city examined in the framework of this paper) models was examined but not followed as the restriction measures applied were the same for all of Greece and for the same time period and concerned similar BS systems under the same administrator; thus, it was decided that one model should be developed covering all three cities.
Table 1 presents the descriptive statistics and specifically the values of the observations as provided by the administrator. These values were examined and the marginal values were excluded by the model’s developing process, although they represent real cases (for example, the minimum value regarding the average duration in minutes is recorded in one of the three BS systems and refers to a case in which the system failed to properly record the duration of the user’s trip).
The final step of the followed methodology concerns the development of the paper and presents the results of the data analysis by most of the effects of the pandemic on the performance of the BS systems based on the users’ choices made before, during, and after the lockdown period in the above-mentioned Greek cities.
The bike-sharing system in Igoumenitsa was initially installed and operated in the framework of the ADRIMOB (Sustainable coast MOBility in the ADRIatic area) Project by the Regional Unit of Thesprotia. The project was implemented under the European Territorial Cooperation Programme IPA ADRIATIC 2007–2013 [
26]. This is considered the first phase of the bike-sharing system in Igoumenitsa, during which the system was free of charge. The system allowed access to a bike in an automated manner by calculating the actual time of the use of the bicycles. It could accommodate people who were subscribers and made use of the special electronic card EasyBike. The bike-sharing system was operative 24/7 but the working hours of the two contact points were Monday to Friday, 08:00–15:00. The number of registered users was rather small. In 2015, 22 EasyBike cards were subscribed, while in 2016 the number was increased to 25 cards and in 2017 only 1 new card was subscribed. There were two rental stations available equipped with 10 bicycles in total. In the city of Igoumenitsa, there are two bicycle roads constructed and operating. The first one (bicycle and pedestrian road simultaneously, mixed usage) begins near the facilities of the Technological Institute of Epirus at the 28th Oktovriou Str. The bicycle–pedestrian road was constructed in 1998 (total length = 2.8 km and width = 4 m, two-way road) and ends at the road heading to Drepano Beach, which is located 1.5 km from the end of the bicycle–pedestrian road. The users, if they want to continue their trip to Drepano Beach, must use the road constructed for all traffic, which is very dangerous, especially during summertime, when the traffic volumes from and to Drepano Beach are high. The second bicycle road is an urban bicycle road along Leoforos 49 Martiron (location: Ladohori–Igoumenitsa). The total length is 1.1 km, the width of the surface used by the bicycles is approximately 2 m with pavement on both sides. The road crosses roundabouts and the existing horizontal and vertical signs are considered to be adequate [
27].
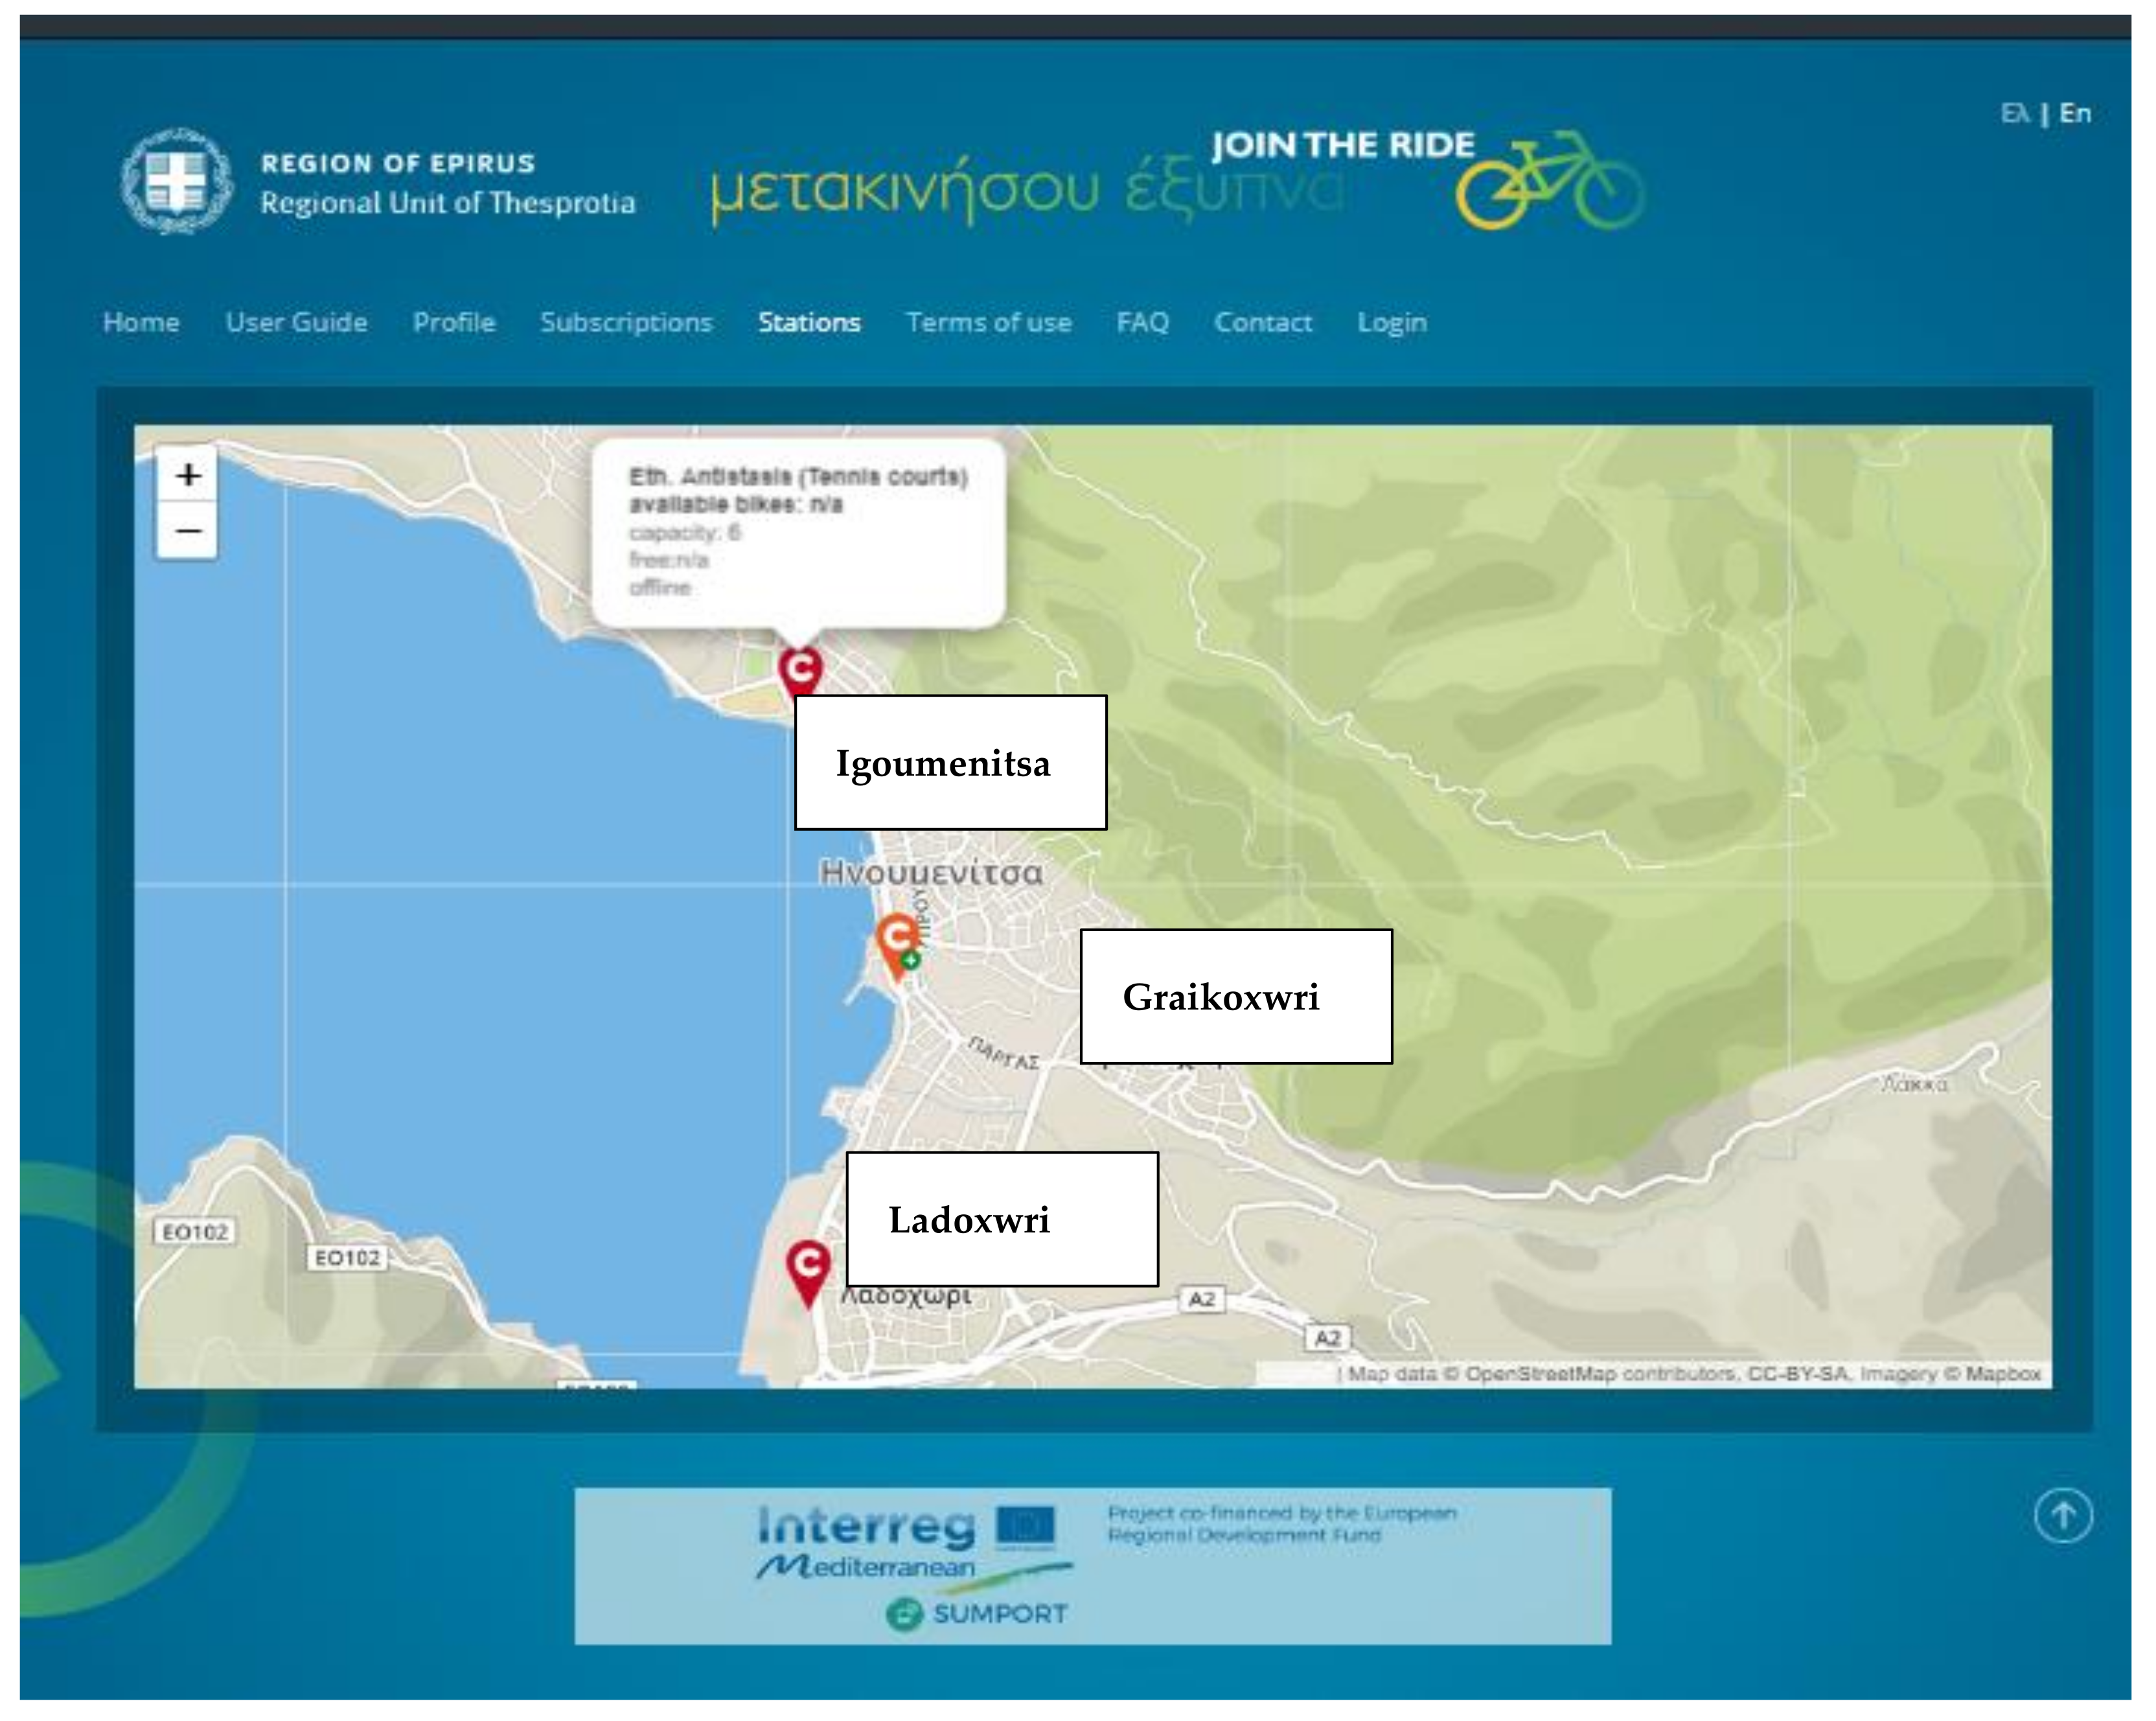
The second phase of the bike-sharing system in Igoumenitsa concerned the time period during which the SUMPORT project was implemented. Aiming to further promote sustainable mobility, a new rental station was installed near the facilities of the Technological Educational Institute of Epirus. The new station of the new and currently active BS system in Igoumenitsa is presented in
Figure 1 [
28]. Through this map, the user is informed not only about the location of the rental stations, but by choosing any of the stations, is informed in real time about the capacity of the station (each station can host up to 6 bikes) as well as the number of available bikes and the number of free docking slots.
A comparison of the previous and current forms of the bike-sharing system in the city of Igoumenitsa is presented in
Table 2 regarding their basic characteristics. The specific comparison highlights that the current system in the city of Igoumenitsa is more organized and user friendly than the previous, encouraging the residents and visitors to use it in an easier way and thus avoiding significant bureaucratic problems. The current system became fully operational just a few months before the COVID-19 pandemic.
Upon securing the assent of the Intermediate Managing Authority of the South Aegean Region for the tendering of the project titled ‘Procurement and installation of bicycle stations in the city of Rhodes’ within the context of the ‘Crete and the Aegean Islands 2017–2013’ Operational Programme, the Municipality of Rhodes conducted an open tender for the procurement and installation of public-use bicycle stations (60 bicycles, 5 bicycling stations, and an operating system) [
30]. Subsequently, a relevant contract was concluded between the Municipality of Rhodes and the company Cyclopolis Ltd., London, UK, concerning seven renting stations in total (Aquarium, Marina, Mitropoli, Ag. Nikolaos Square, Eleftheria Square, Symis Square, Ag. Athanasios—Ag. Fragkiskos Gateways). According to the bike-sharing system operating rules, BSS is defined as the automated bike-sharing system implemented by the municipality of Rhodes, permitting the short-term rental of bicycles. The operation and management of the BSS will be undertaken by the competent services of the municipality and include maintenance of the bicycles and consumables, redistribution of bicycles among stations, promotion of the system, commercial exploitation of the system, and the general operation and management of the system.
The automatic bike-sharing system of Chania’s municipality consists of four renting stations (Defkalionos Square, Katehaki Square, Talo Square, and Markopoulou Square) and 70 bicycles in total of which 50 are available for use. The stations consist of info kiosks where the users can borrow a bicycle by using a touch screen [
31].
3. Results
3.1. Timeline of COVID-19 Related Events
The timeline of the events related to the COVID-19 pandemic in Greece that led to a general quarantine lockdown is presented in
Table 3. The lockdown was announced on 23 March 2020 and endured until 4 May 2020, when the general government announced the beginning of easing restrictions.
In order to fully understand the imposed restrictions concerning the mobility of the Greek people, the central government on 23 March 2020 announced that all non-essential movements throughout the country were restricted. Since that date, Greek citizens were allowed to move outside their houses only for the following cases: (i) moving to or from one’s workplace during work hours, (ii) going to the pharmacy or visiting a doctor, (iii) going to a food store, (iv) going to the bank for services not possible online, (v) assisting a person in need of help and (vi) going to a major ritual (funeral, marriage, baptism) or movement, for divorced parents, which is essential for contact with their children, and (vii) moving outdoors for exercising or taking one’s pet outside, individually or in pairs.
3.2. Exploratiry Data Analysis
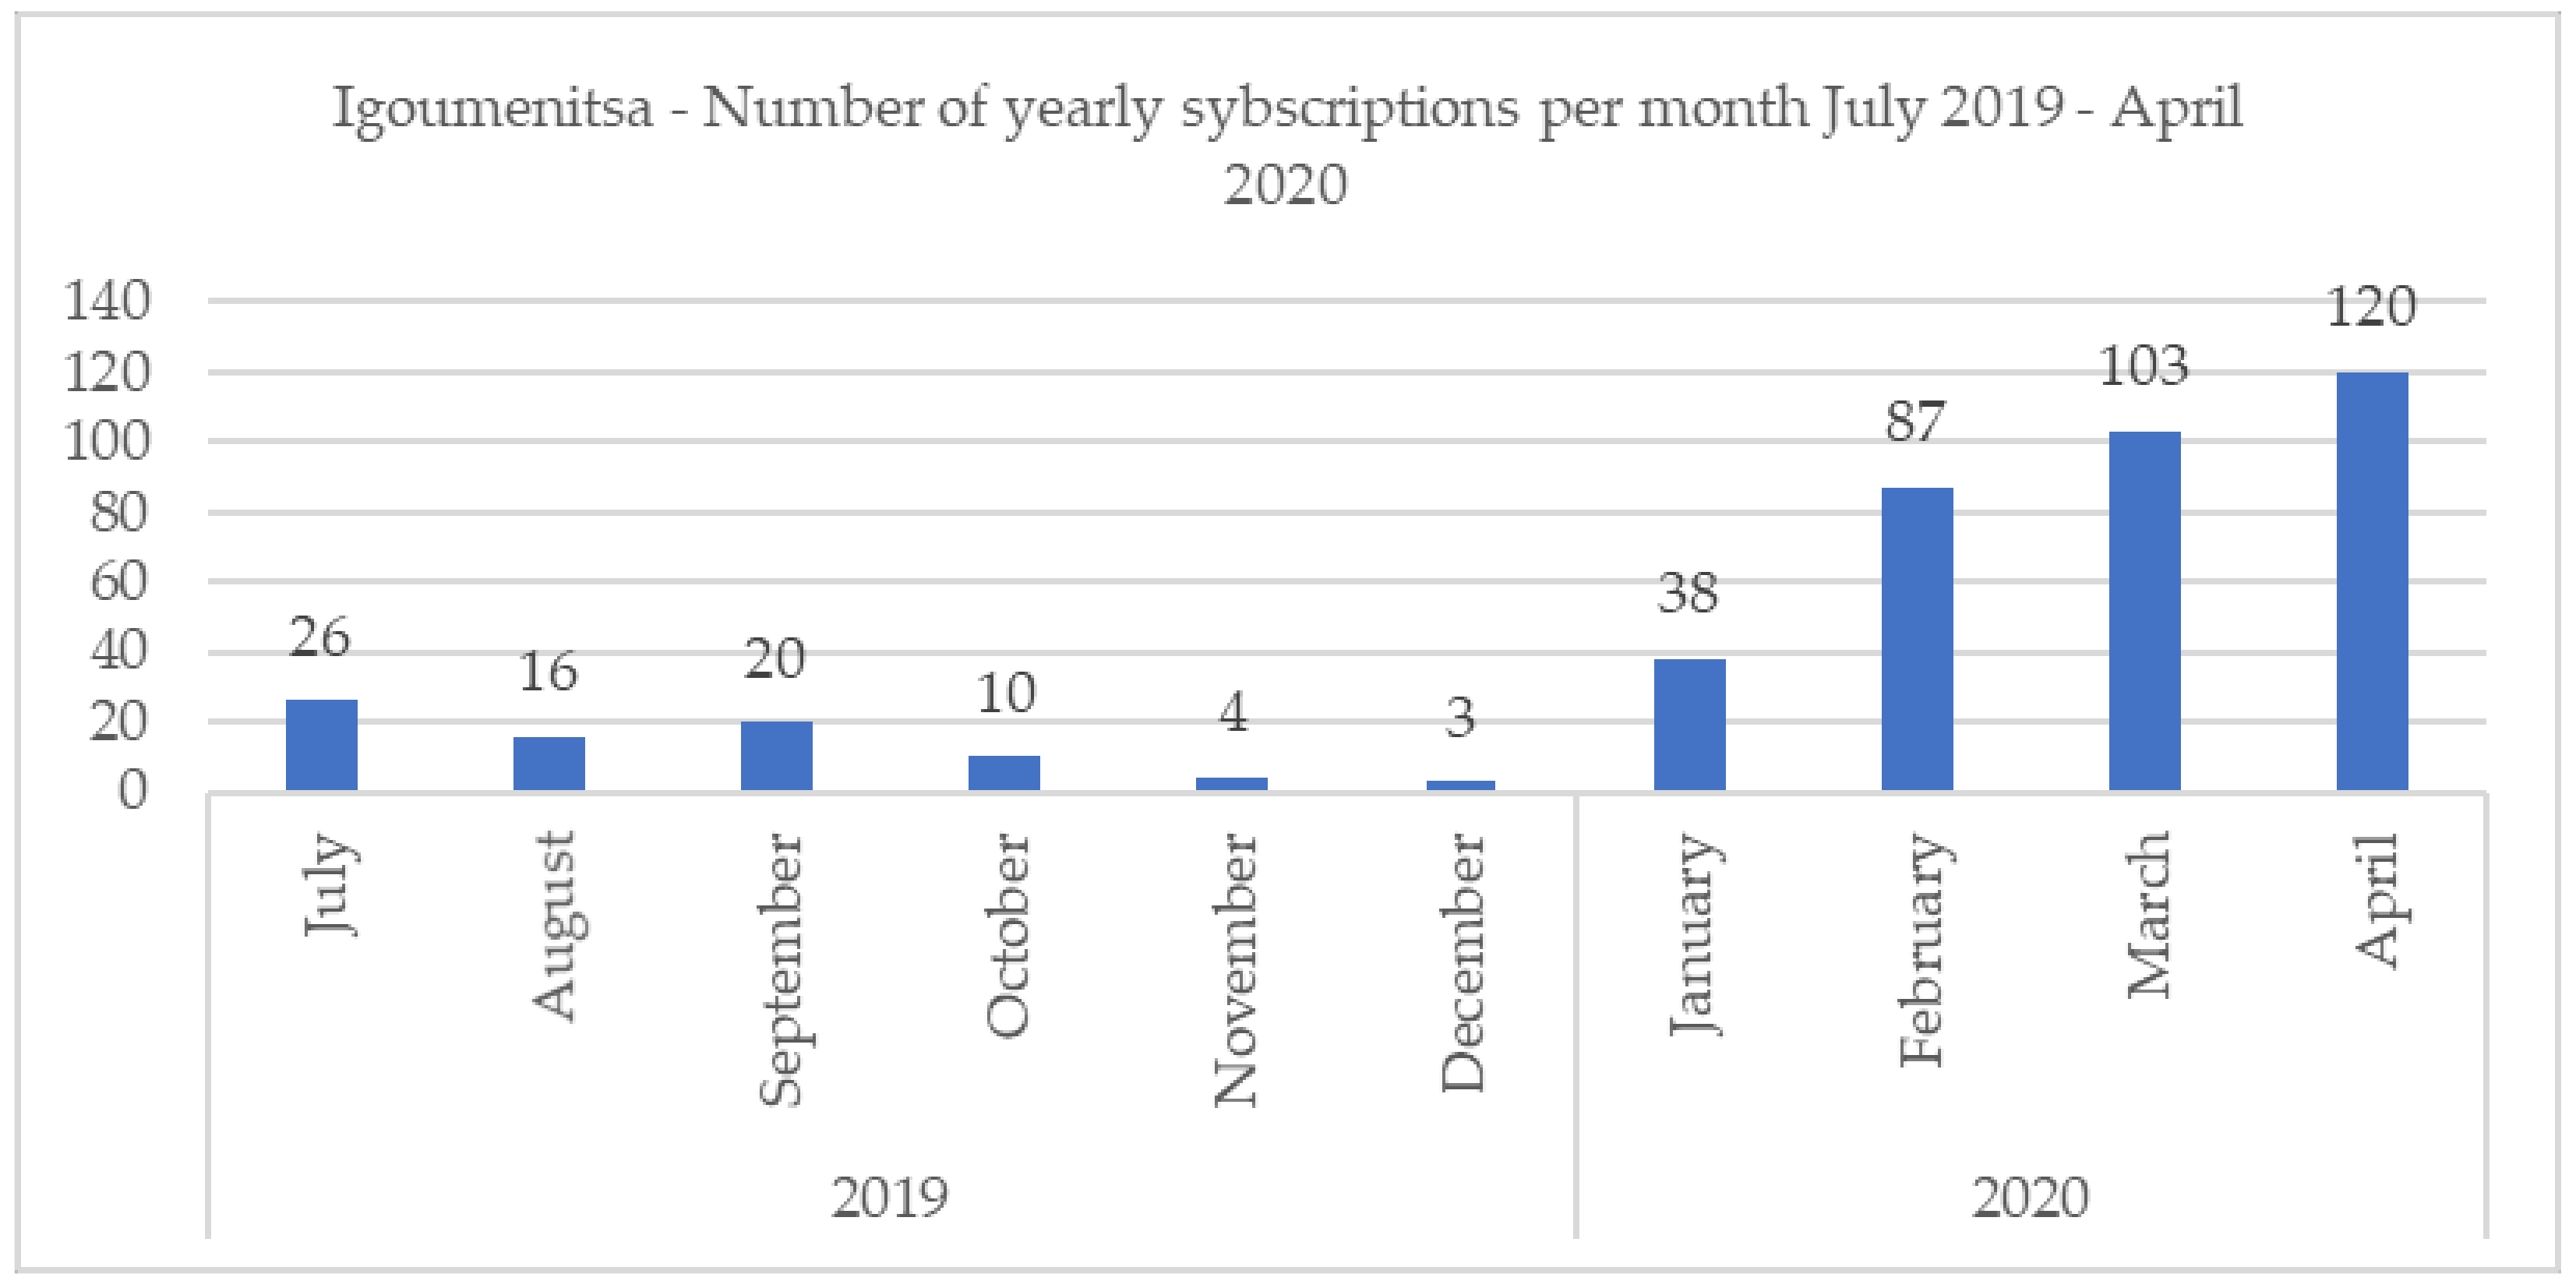
The analysis of the data provided by the administrator of the BS system in Igoumenitsa for the period July 2019–April 2020/May 2020 (depending on the parameter) is presented in
Figure 2,
Figure 3 and
Figure 4. Specifically,
Figure 2 presents the evolution of the number of yearly subscriptions per month.
The increase in yearly subscriptions is important, especially for the period January 2020–April 2020, which is 68%, while the increase for the period February 2020–April 2020 is 38%. In order to better understand the importance of this increase not only in relation to COVID-19 but also in relation to the weather conditions, it must be noted that the average temperature in Igoumenitsa for January was 14 °C, for February was 15 °C, for March was 16 °C, and finally for April was 19 °C [
32]. The average rain precipitation based on historical data for the city of Igoumenitsa is the following: January = 120 mm, February = 125 mm, March = 100 mm, and April = 60 mm [
33].
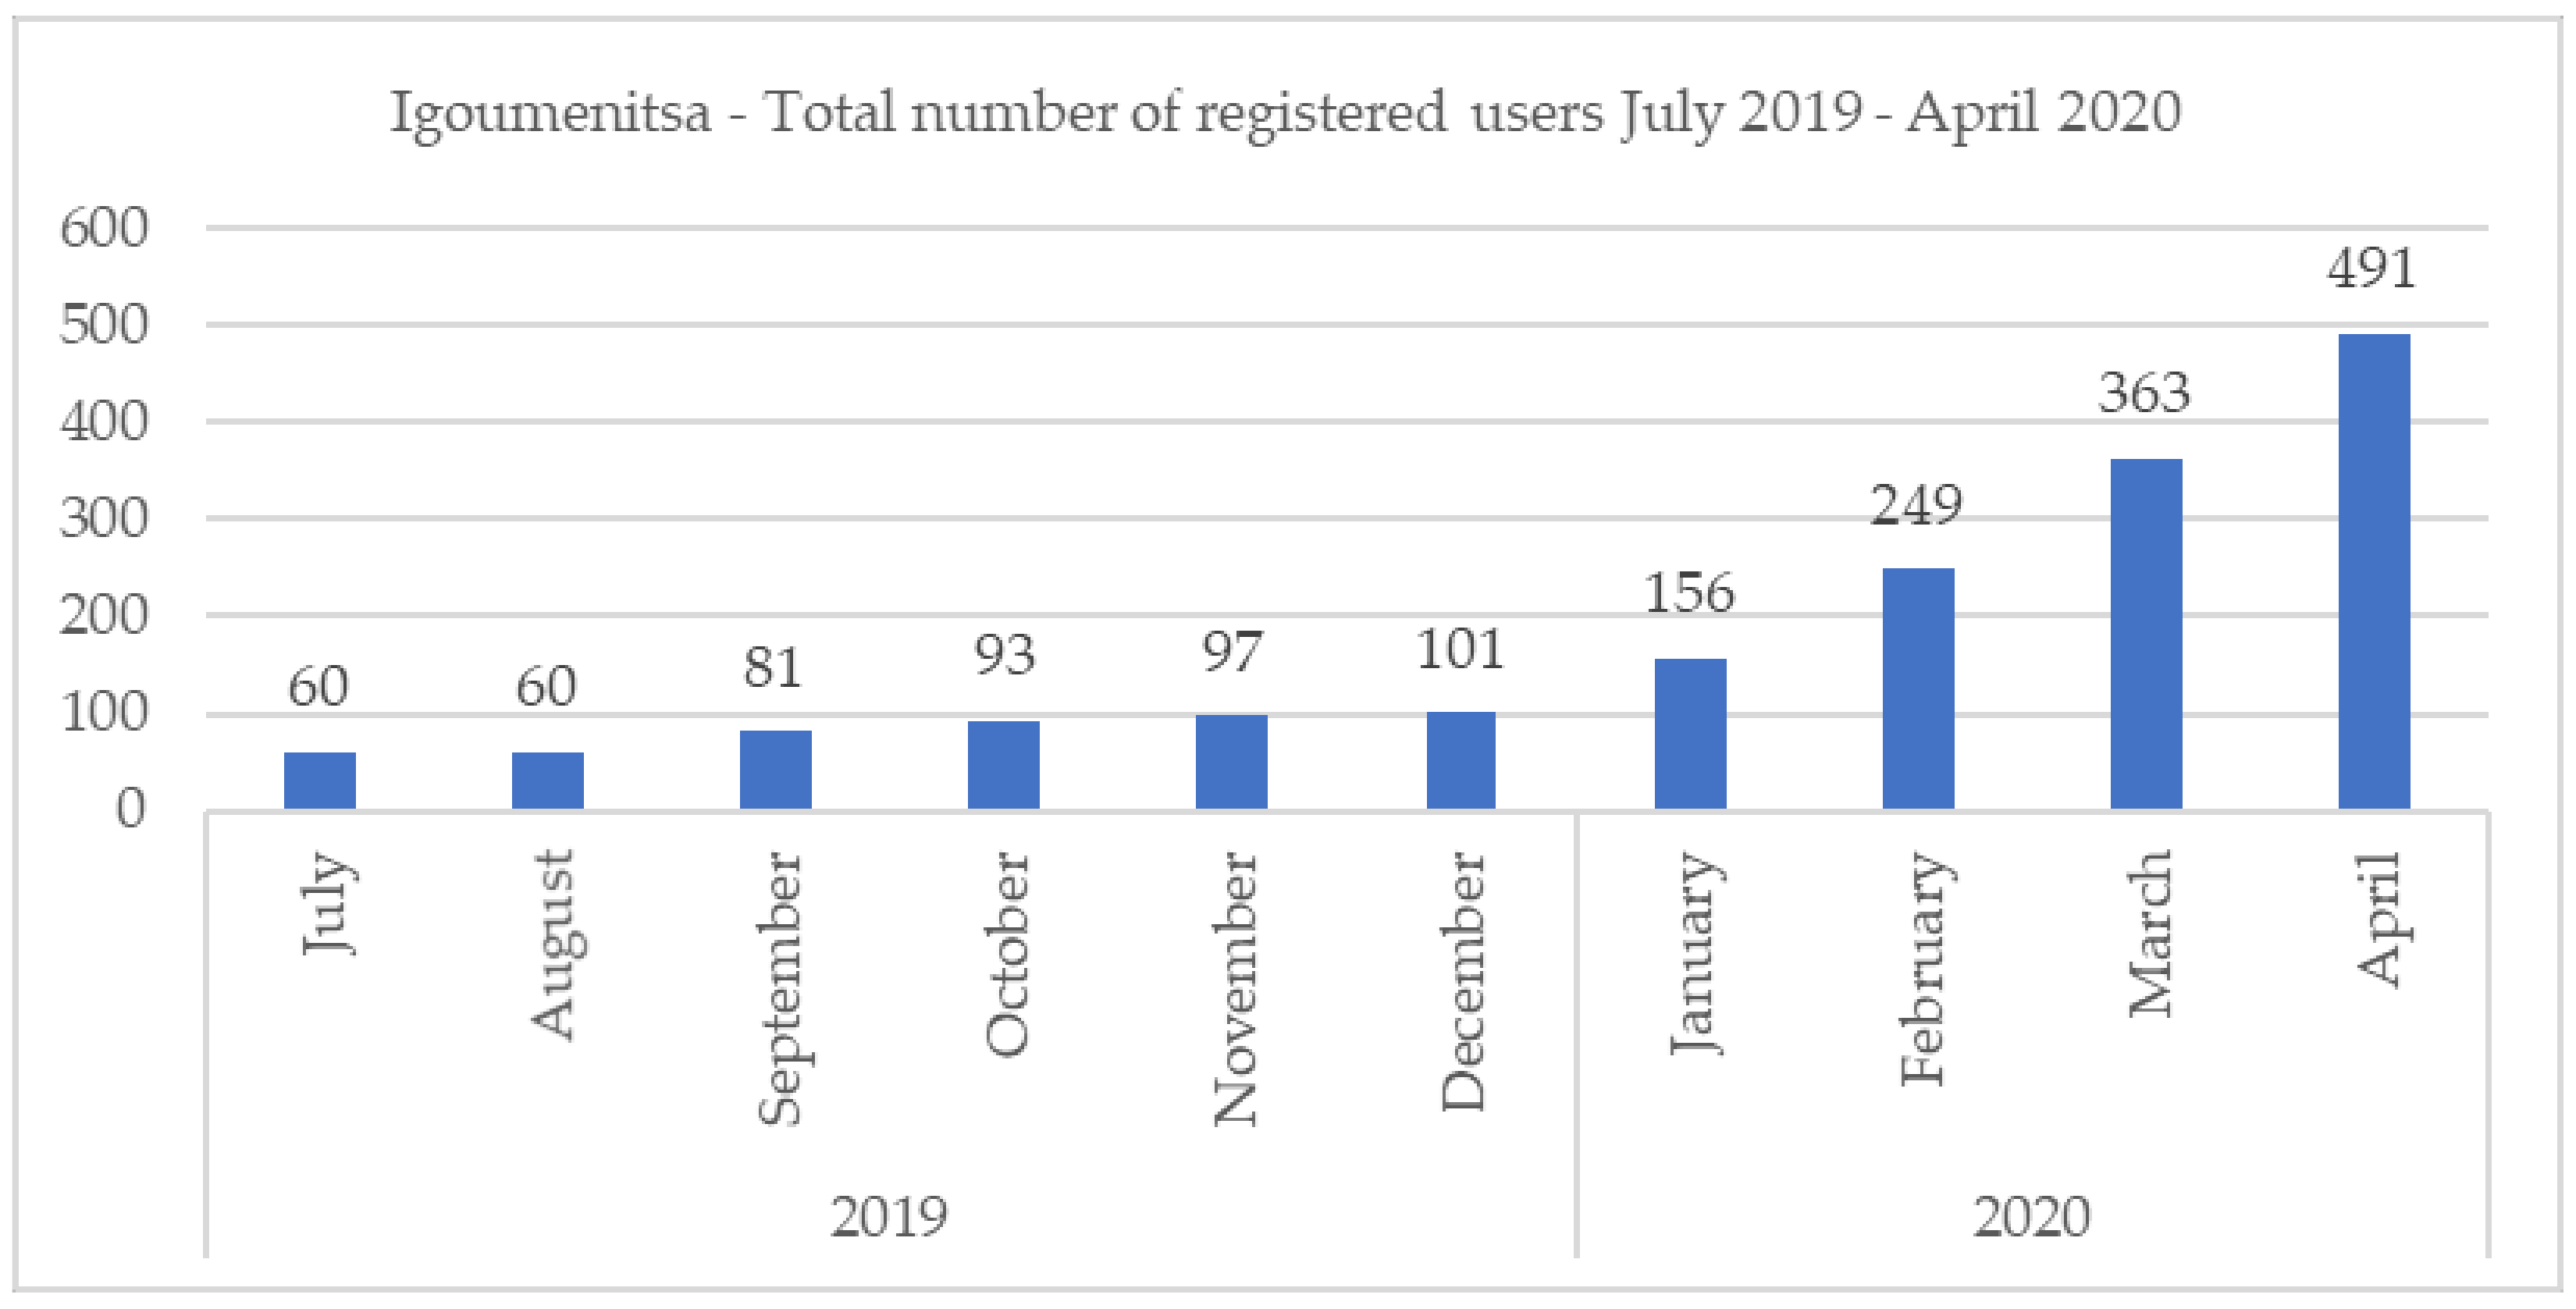
Figure 3 presents the evolution of the total number of registered users for the period July 2019–April 2020.
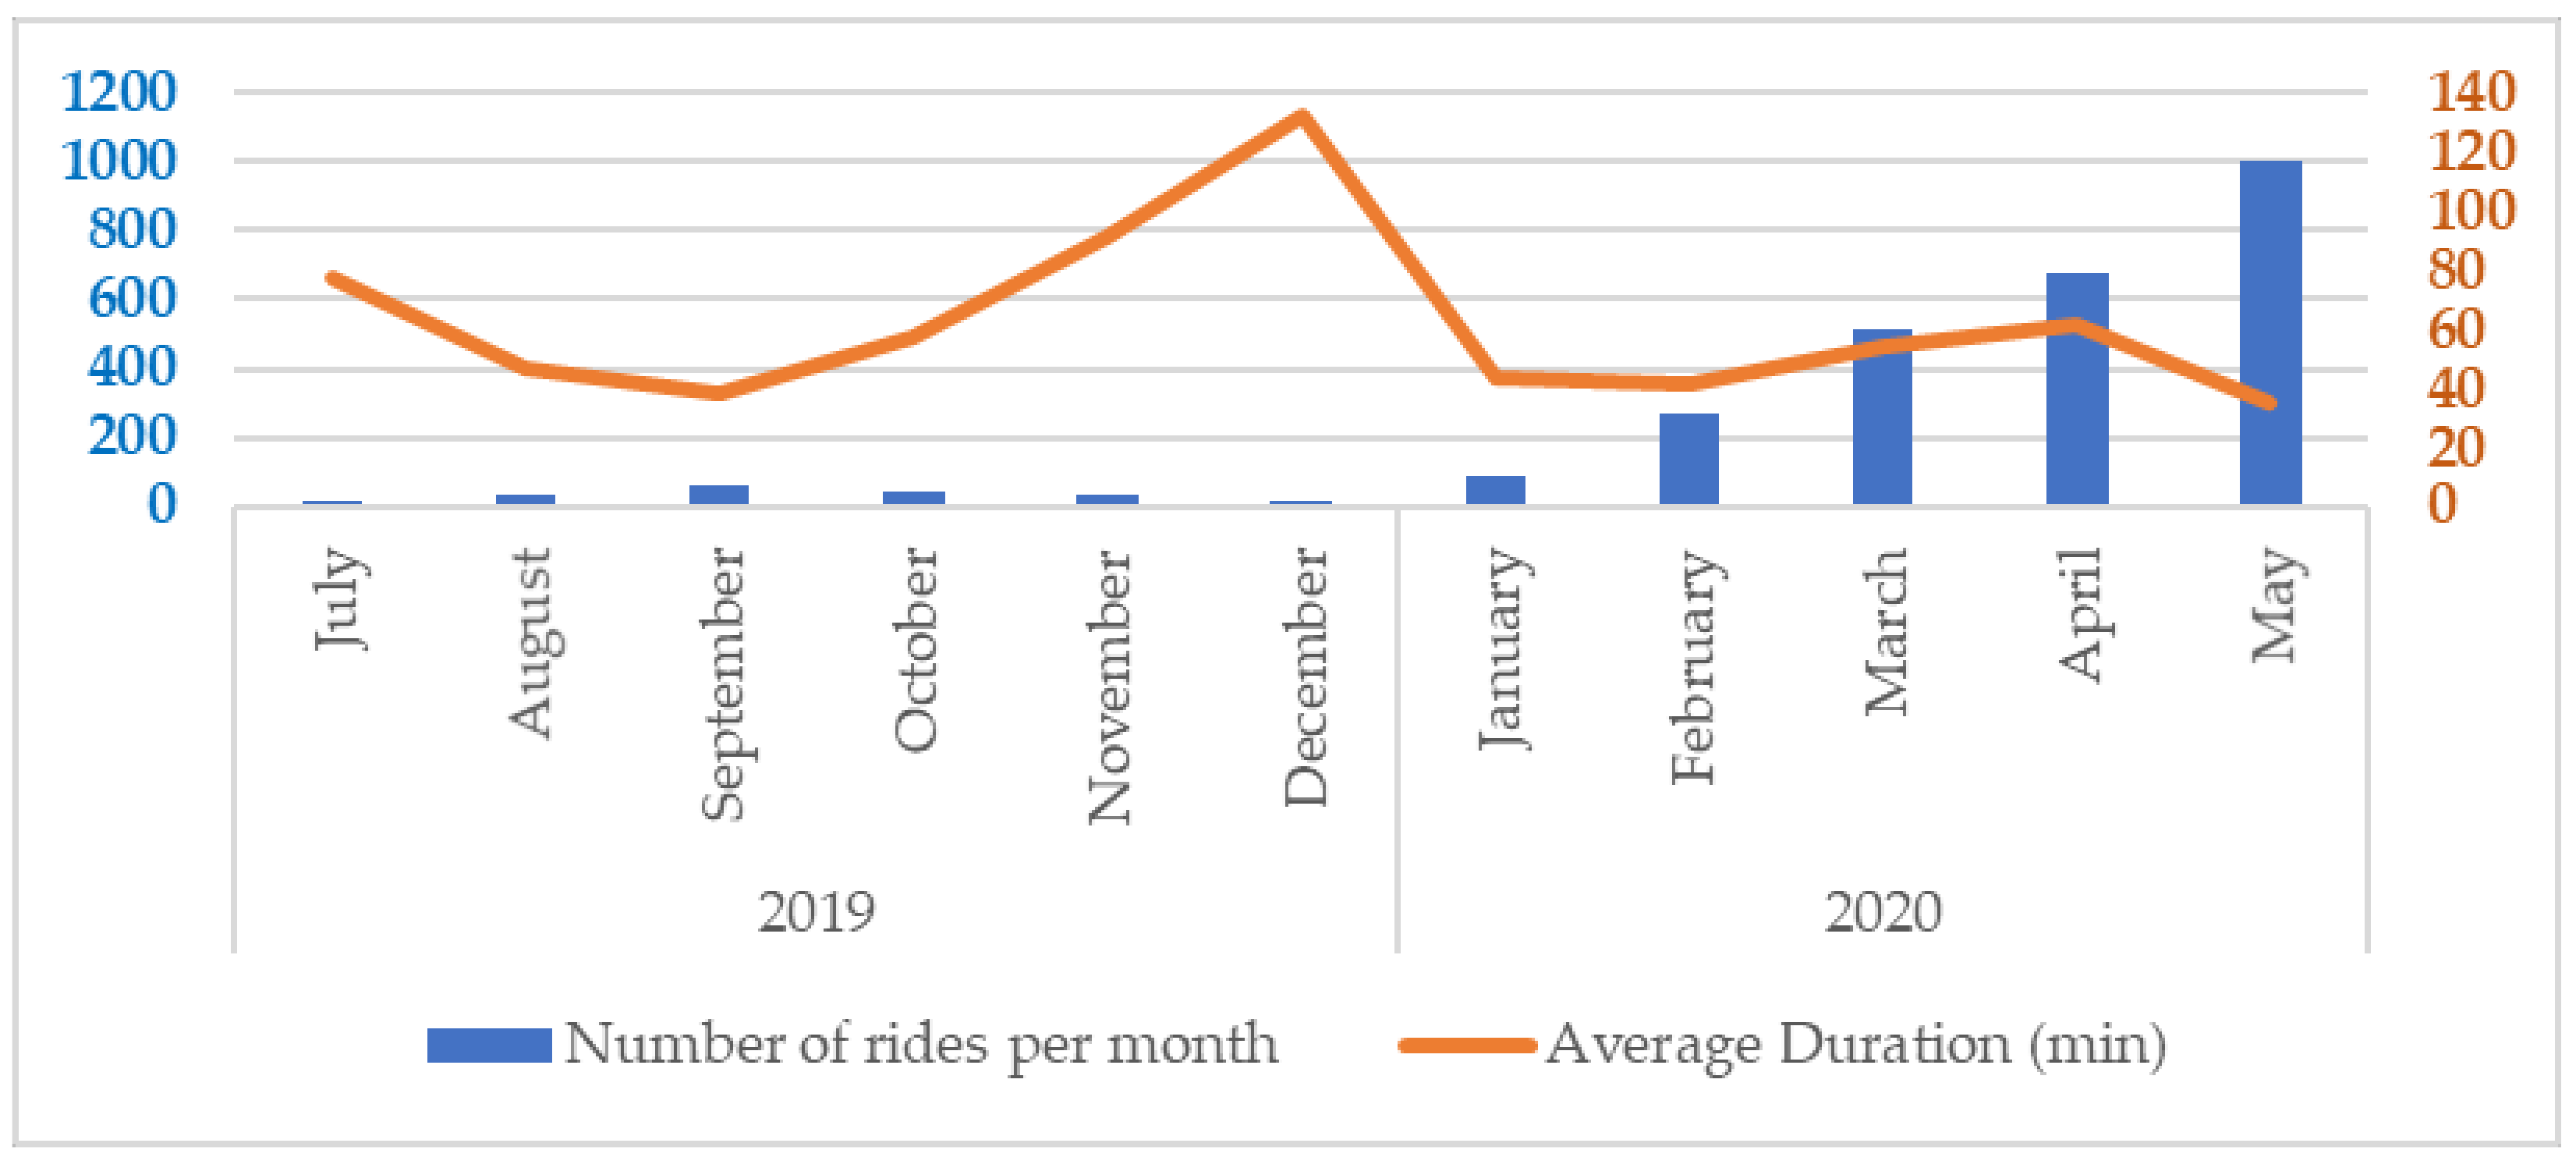
It is clear that after the imposition of restriction measures concerning people’s mobility, the number of registered users in the bike-sharing system in Igoumenitsa was significantly increased. Specifically, in the period February 2020–April 2020, the increase was 97% while the respective increase between March 2020 and April 2020 was 35%. Although restrictions were in force on 23 March 2020 concerning the mobility of people, alongside extended police controls, the number of registered users was significantly increased. Moreover, as presented in
Figure 4, the number of rides per month doubled during the period February 2020–May 2020. Specifically, the increase (for the above-mentioned time period) was 269%, while between March 2020 and May 2020 was 93%.
Figure 4 also presents the average duration of the rides per month. Since the restrictions were terminated, the number of rides during June 2020 was decreased to half compared to May 2020.
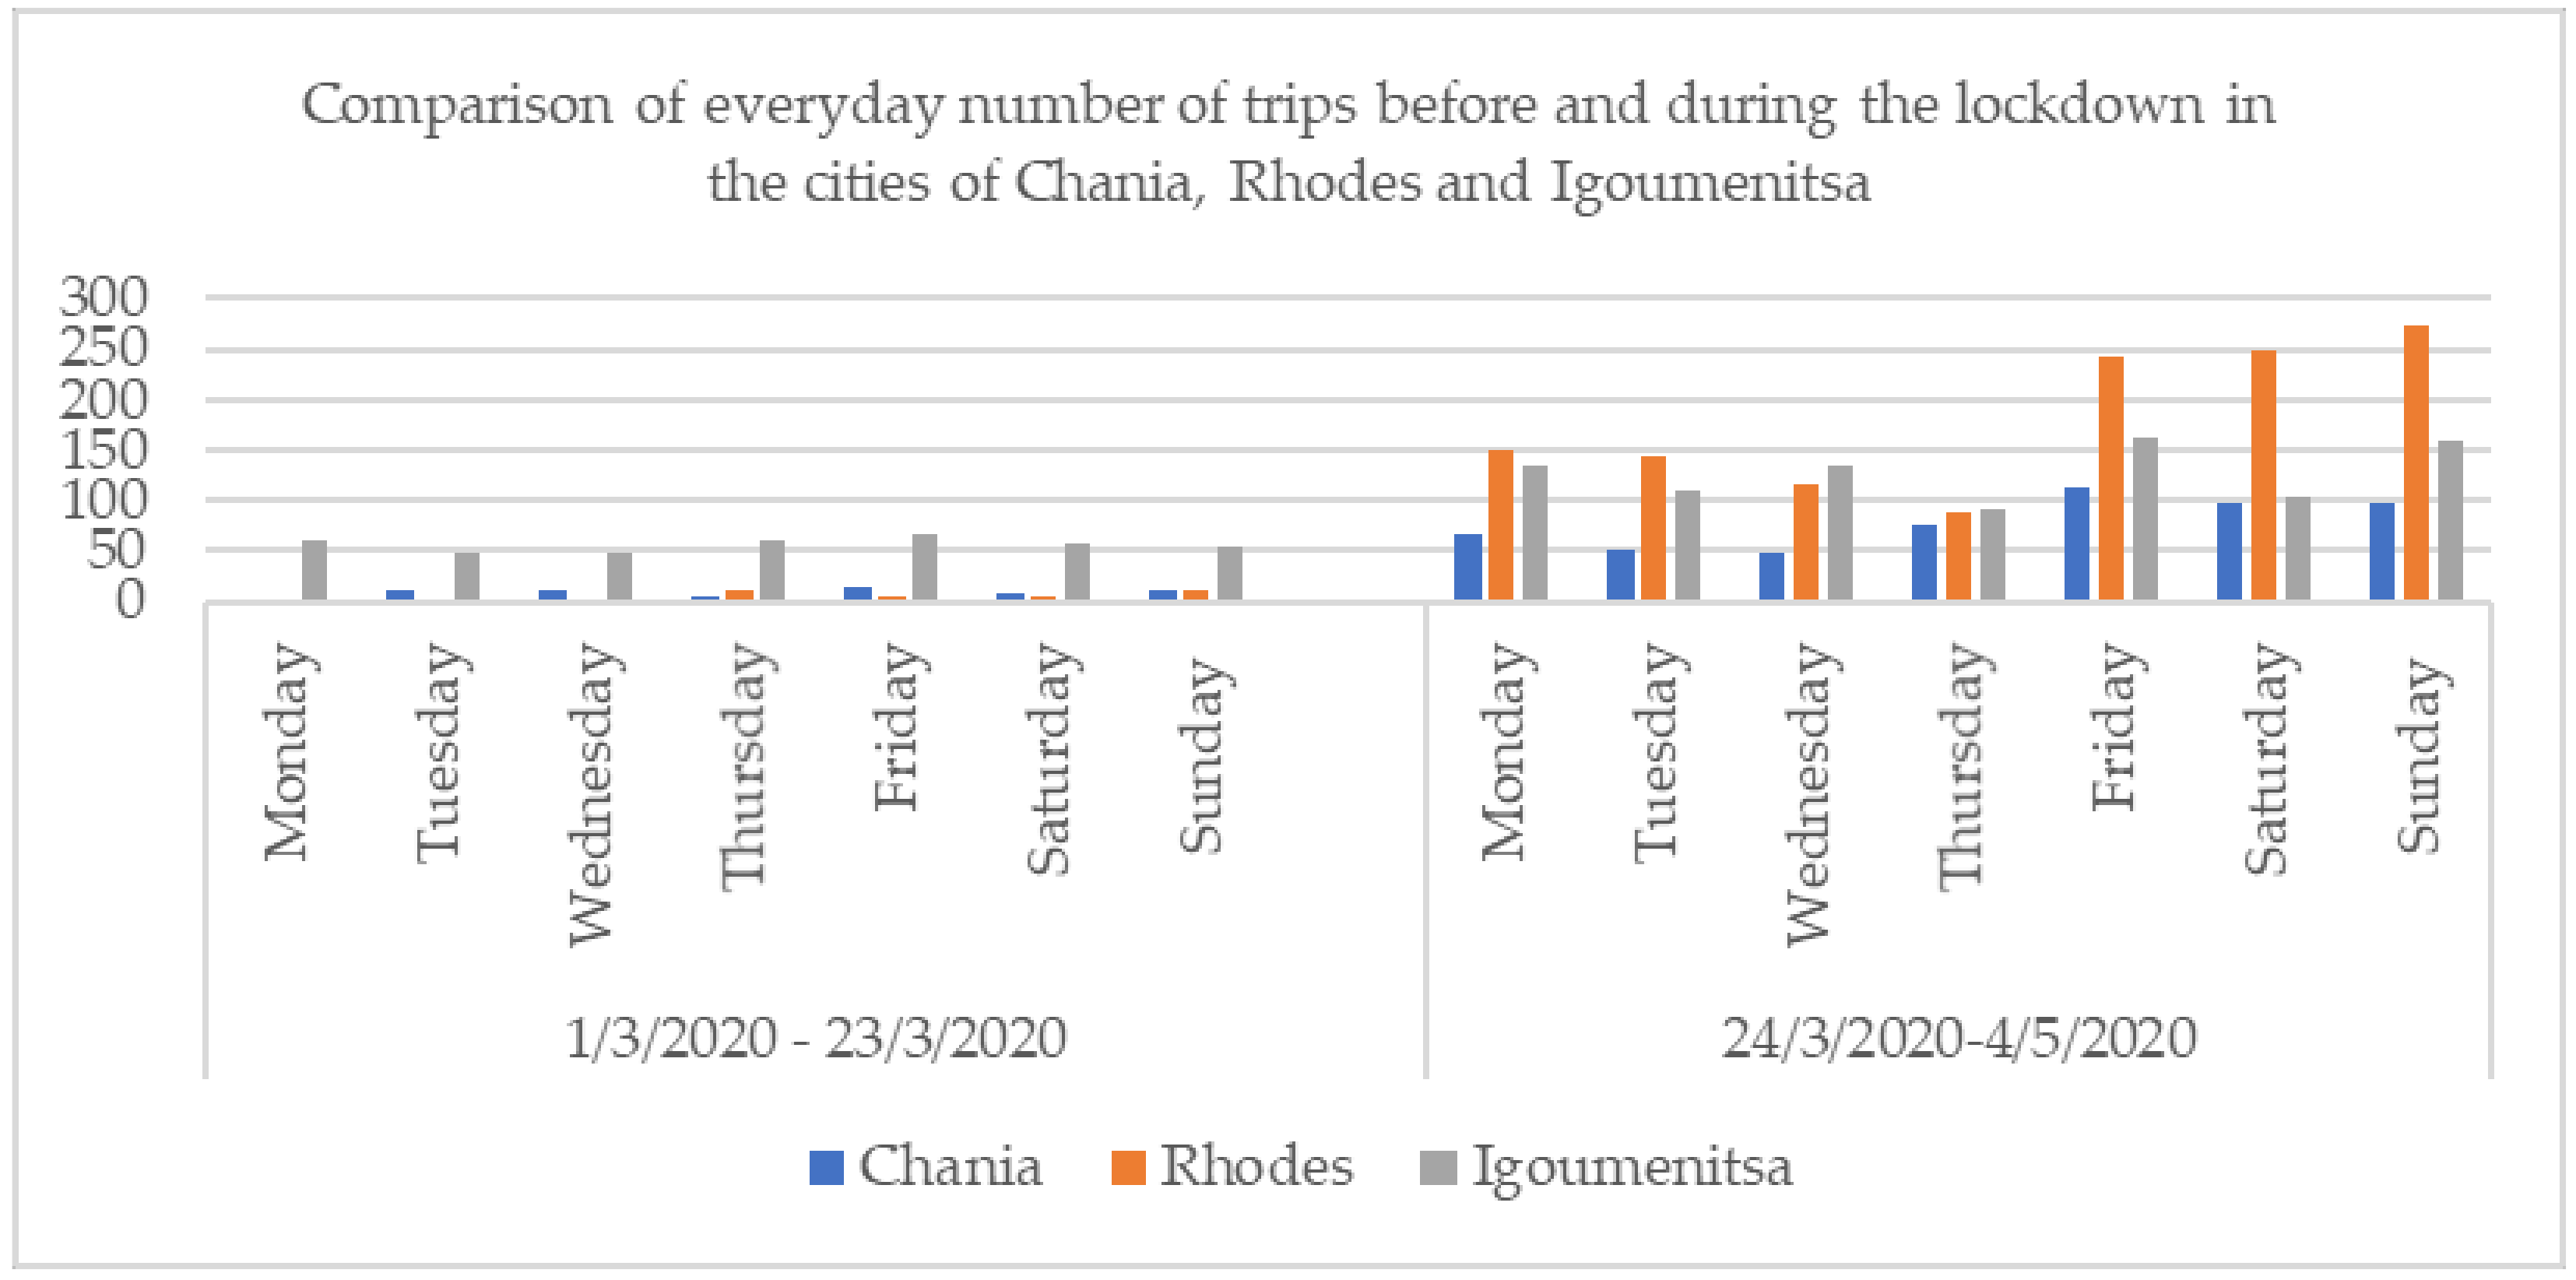
Another interesting finding regarding the characteristics of the system’s performance in the above-mentioned three cities regard the summed up (total) number of rides per day, before (1–23 March 2020), and during the lockdown (24 March 2020–4 May 2020) (see
Figure 5 and
Table 4). The usage of BS bicycles was significantly increased during the lockdown in all cases. It is estimated that the residents of these cities used the BS bicycles not only for leisure trips but also in order to move for their daily needs.
Furthermore, the analysis of the collected data revealed that the majority of the rides during February, March, and April 2020 potentially concerned urban trips as well as leisure purposes, as the bicycles were parked at stations different than those rented [
34]. This assumption was concluded by taking into consideration the locations of the stations and the most important landmarks in the examined cities (retail market, touristic and cultural sightseeing, coastal line, etc.). During the implementation of the current bike-sharing system in the city of Igoumenitsa, the operator estimated that over 400 L of fuel was saved due to the modal shift from private cars to bicycles, preventing almost 700 kg of CO
2 from being emitted into the atmosphere.
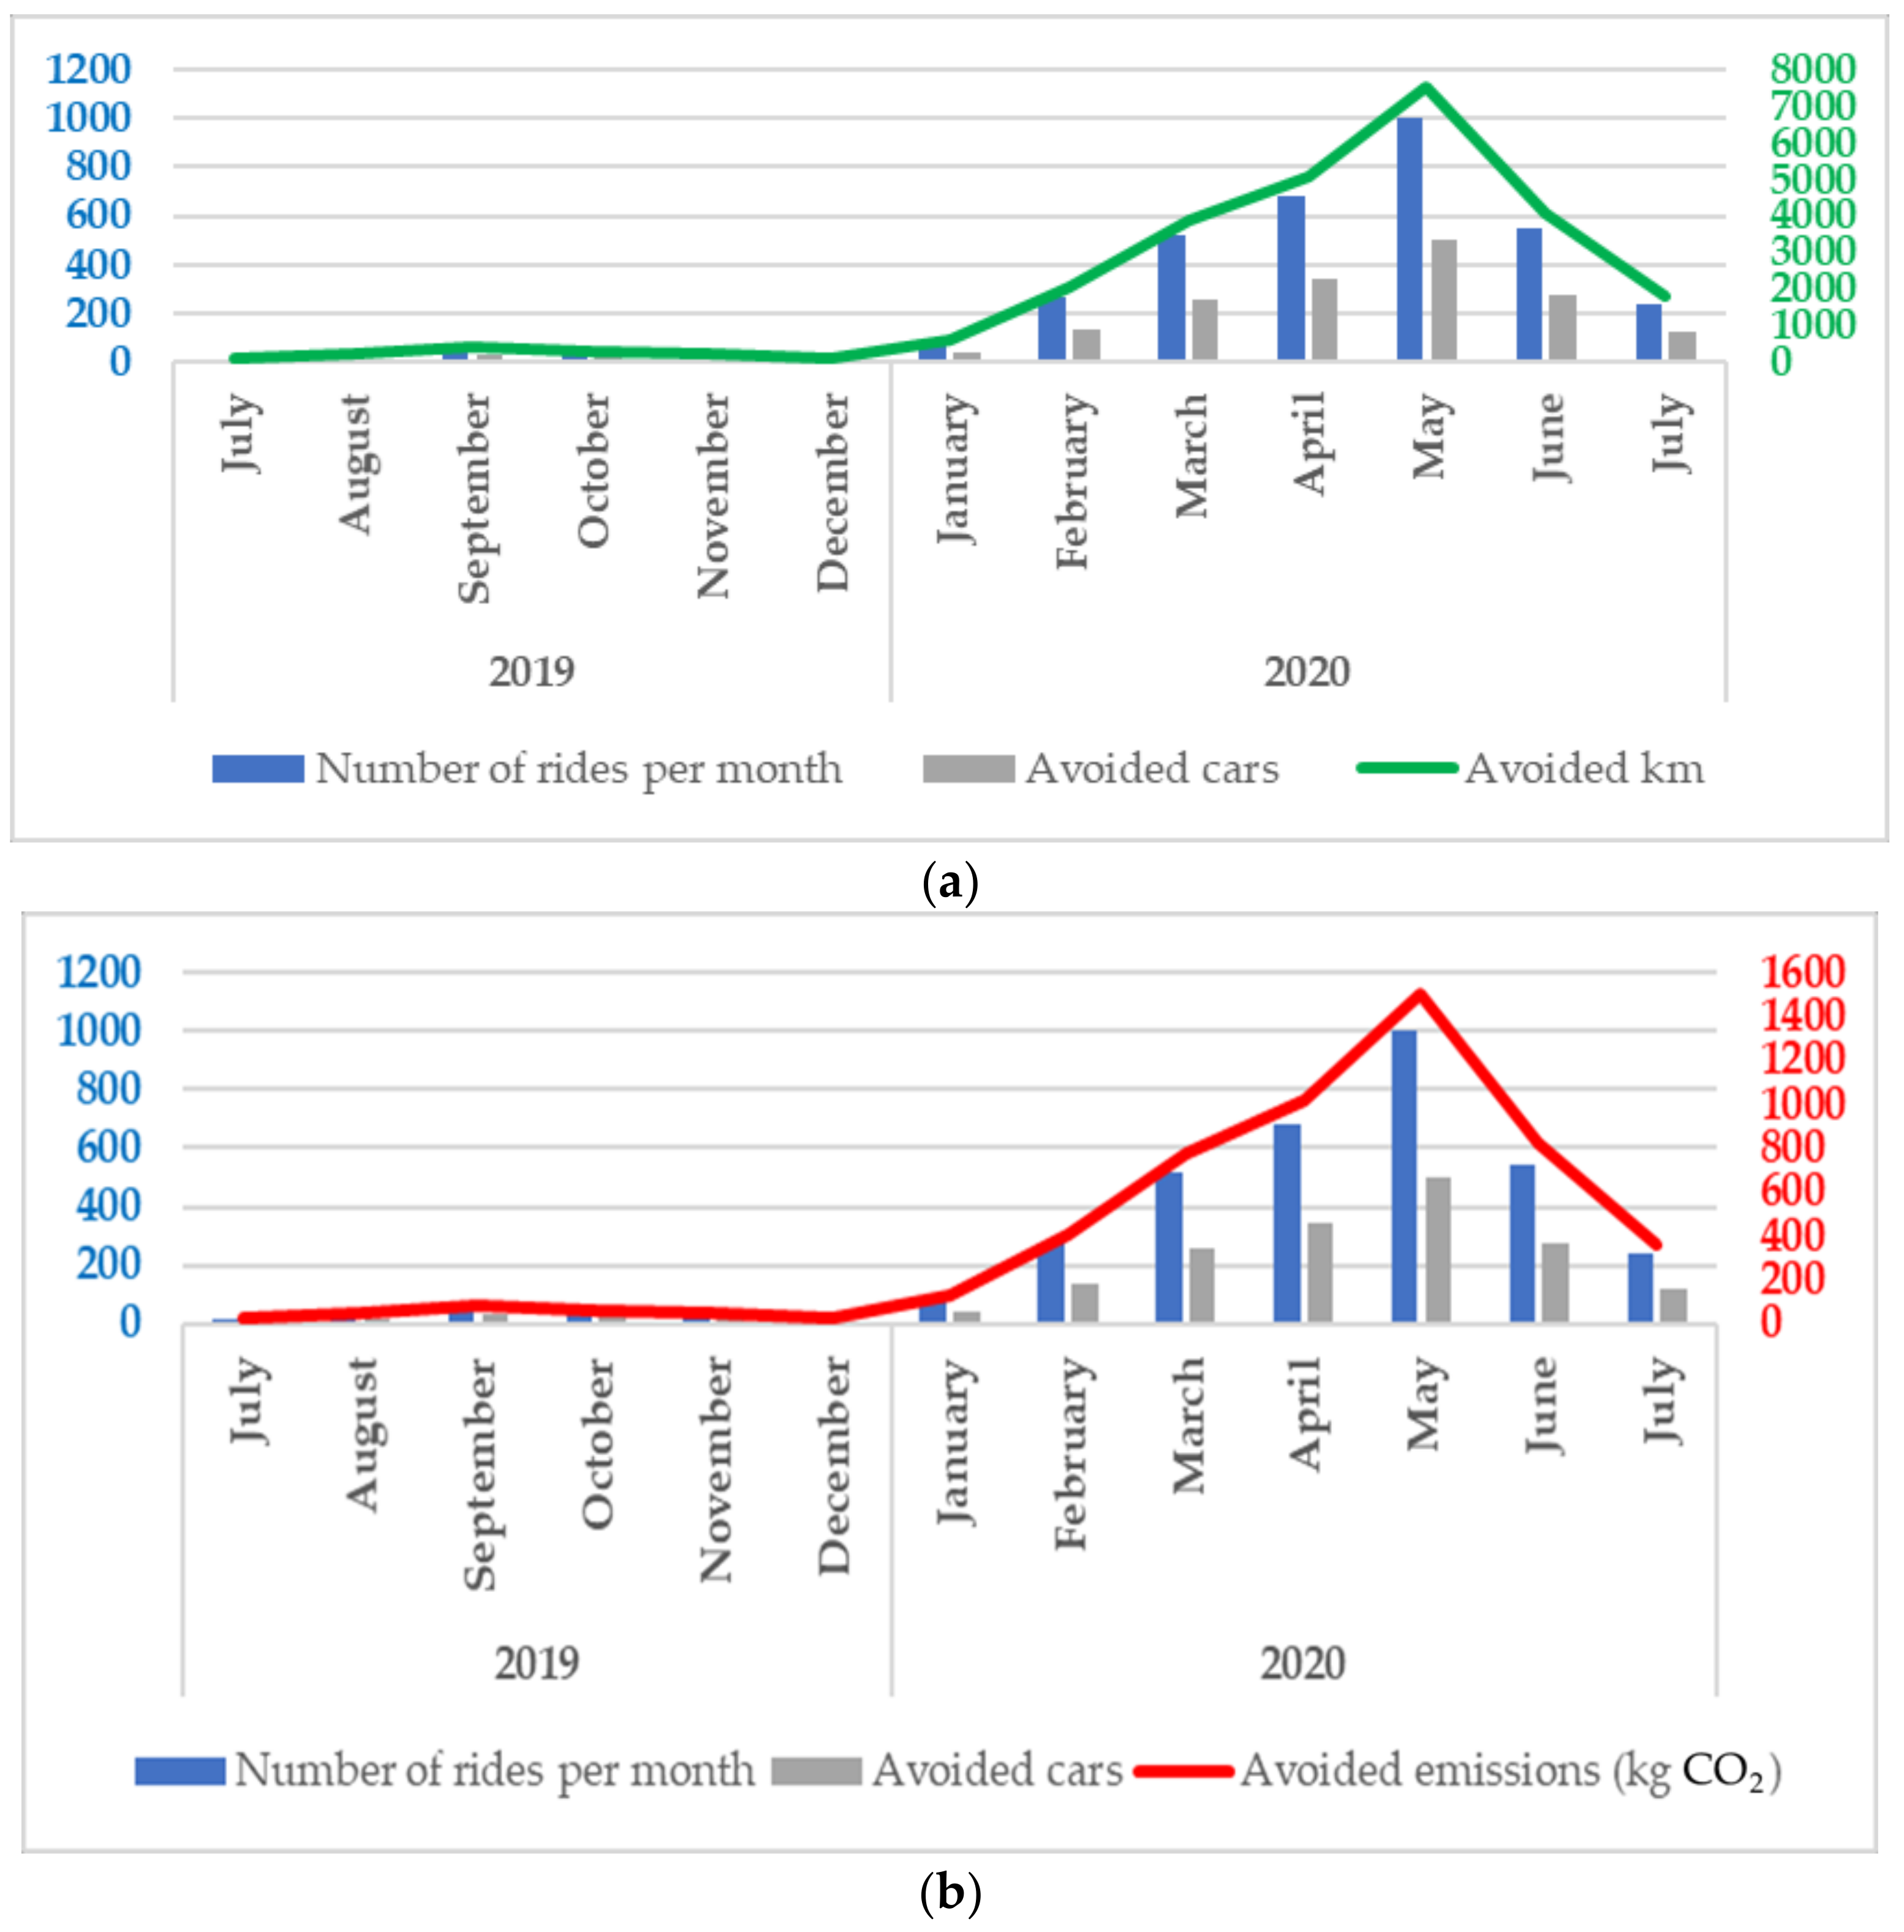
In the framework of the SUMPORT project, key performance indicators (KPIs) were developed in order to be used for monitoring and evaluating the performance of the bike-sharing (and not only) systems [
35]. The indicators used for monitoring and evaluating the performance of Igoumenitsa’s BS system were the following: (a) The number of rented bikes (provided by the operator), (b) km made by the bicycles (provided by the operator), (c) the number of avoided cars (calculated in house based on assumptions. Specifically, it is assumed that two rides would be equal to one avoided car), (d) the number of avoided km due to the usage of the BS system (calculated in-house based on assumptions and specifically the average distance covered by a car is equal to 15 km) and (e) the total amount of saved CO
2 (calculated in-house based on assumptions and specifically that each car produces 200 g CO
2 per km). The comparison of the performance of the BS systems in Igoumenitsa, Rhodes, and Chania is based on the above-mentioned indicators.
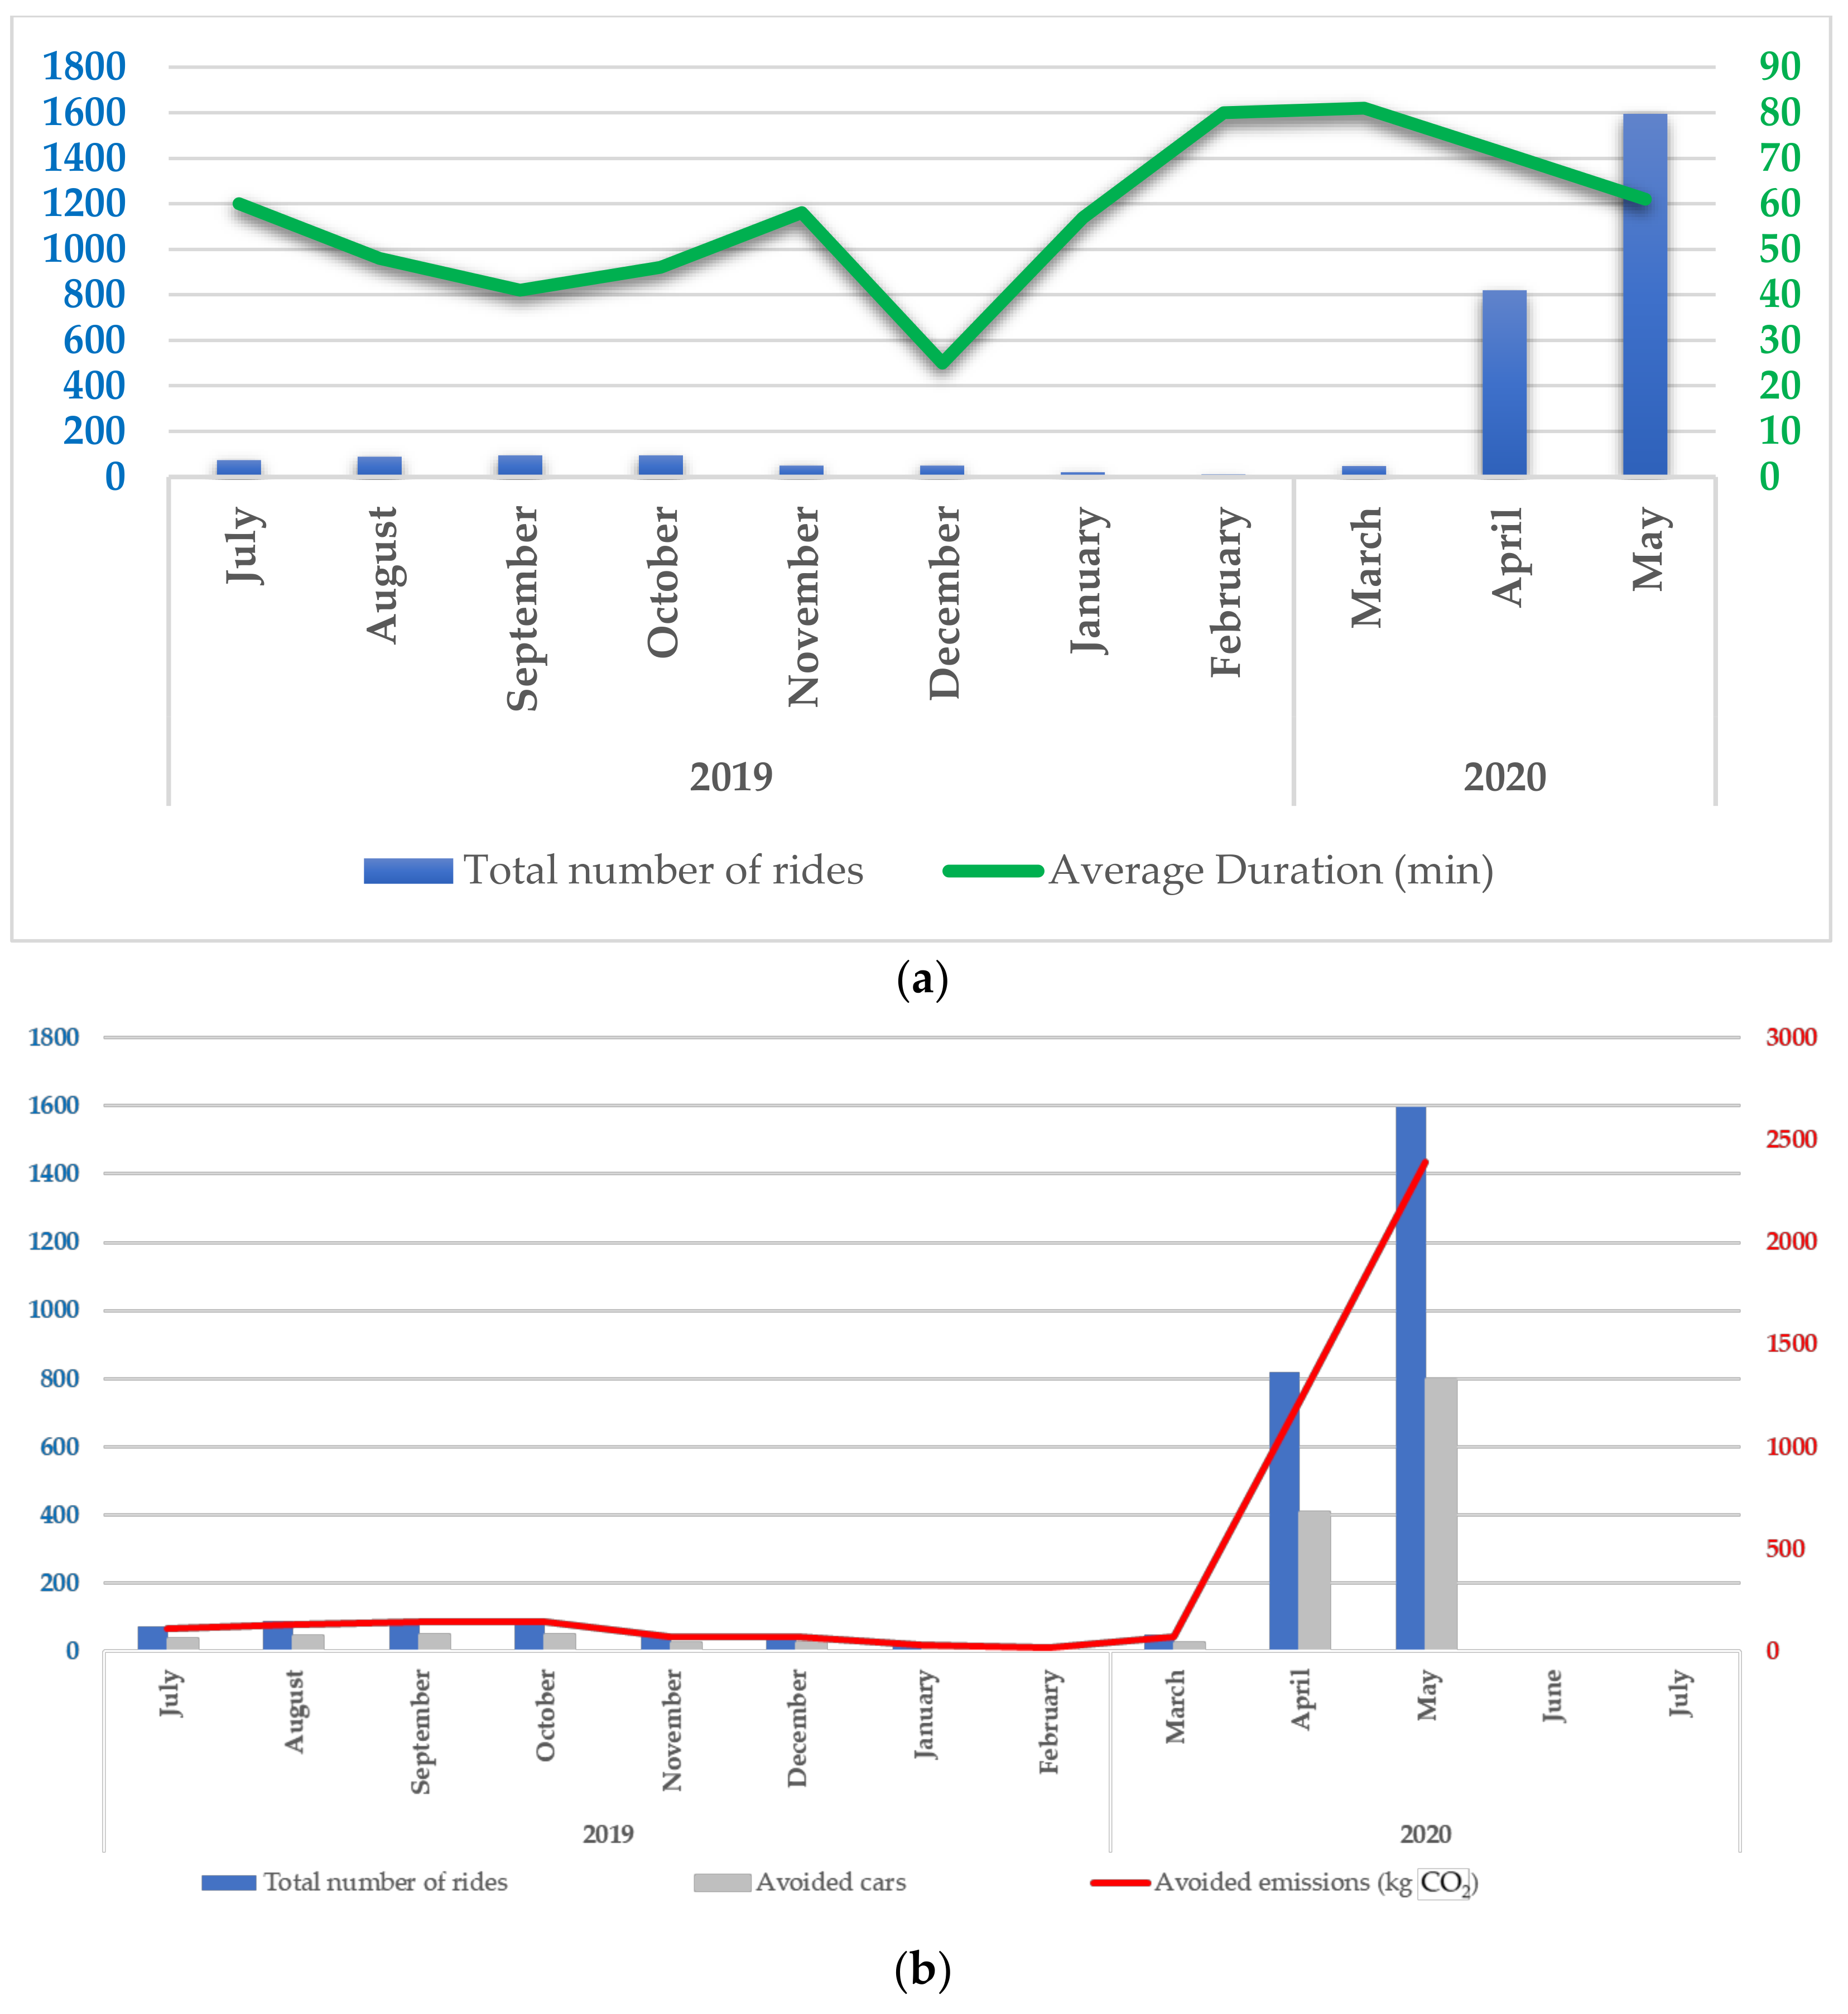
Table 5 presents the performance of Igoumenitsa’s BS system using the above-mentioned indicators, while
Figure 6a,b presents the performance of Igoumenitsa’s system using combo charts for two different sets of variables: (a) The number of rides per month and the number of avoided cars—avoided km and (b) the number of rides per month and the number of avoided cars—avoided emissions (CO
2).
The same indicators were applied for the cases of the cities of Rhodes and Chania. The results are presented in
Table 6 and
Table 7 (see also
Figure 7a,b for the city of Rhodes and
Figure 8a,b for the city of Chania), respectively.
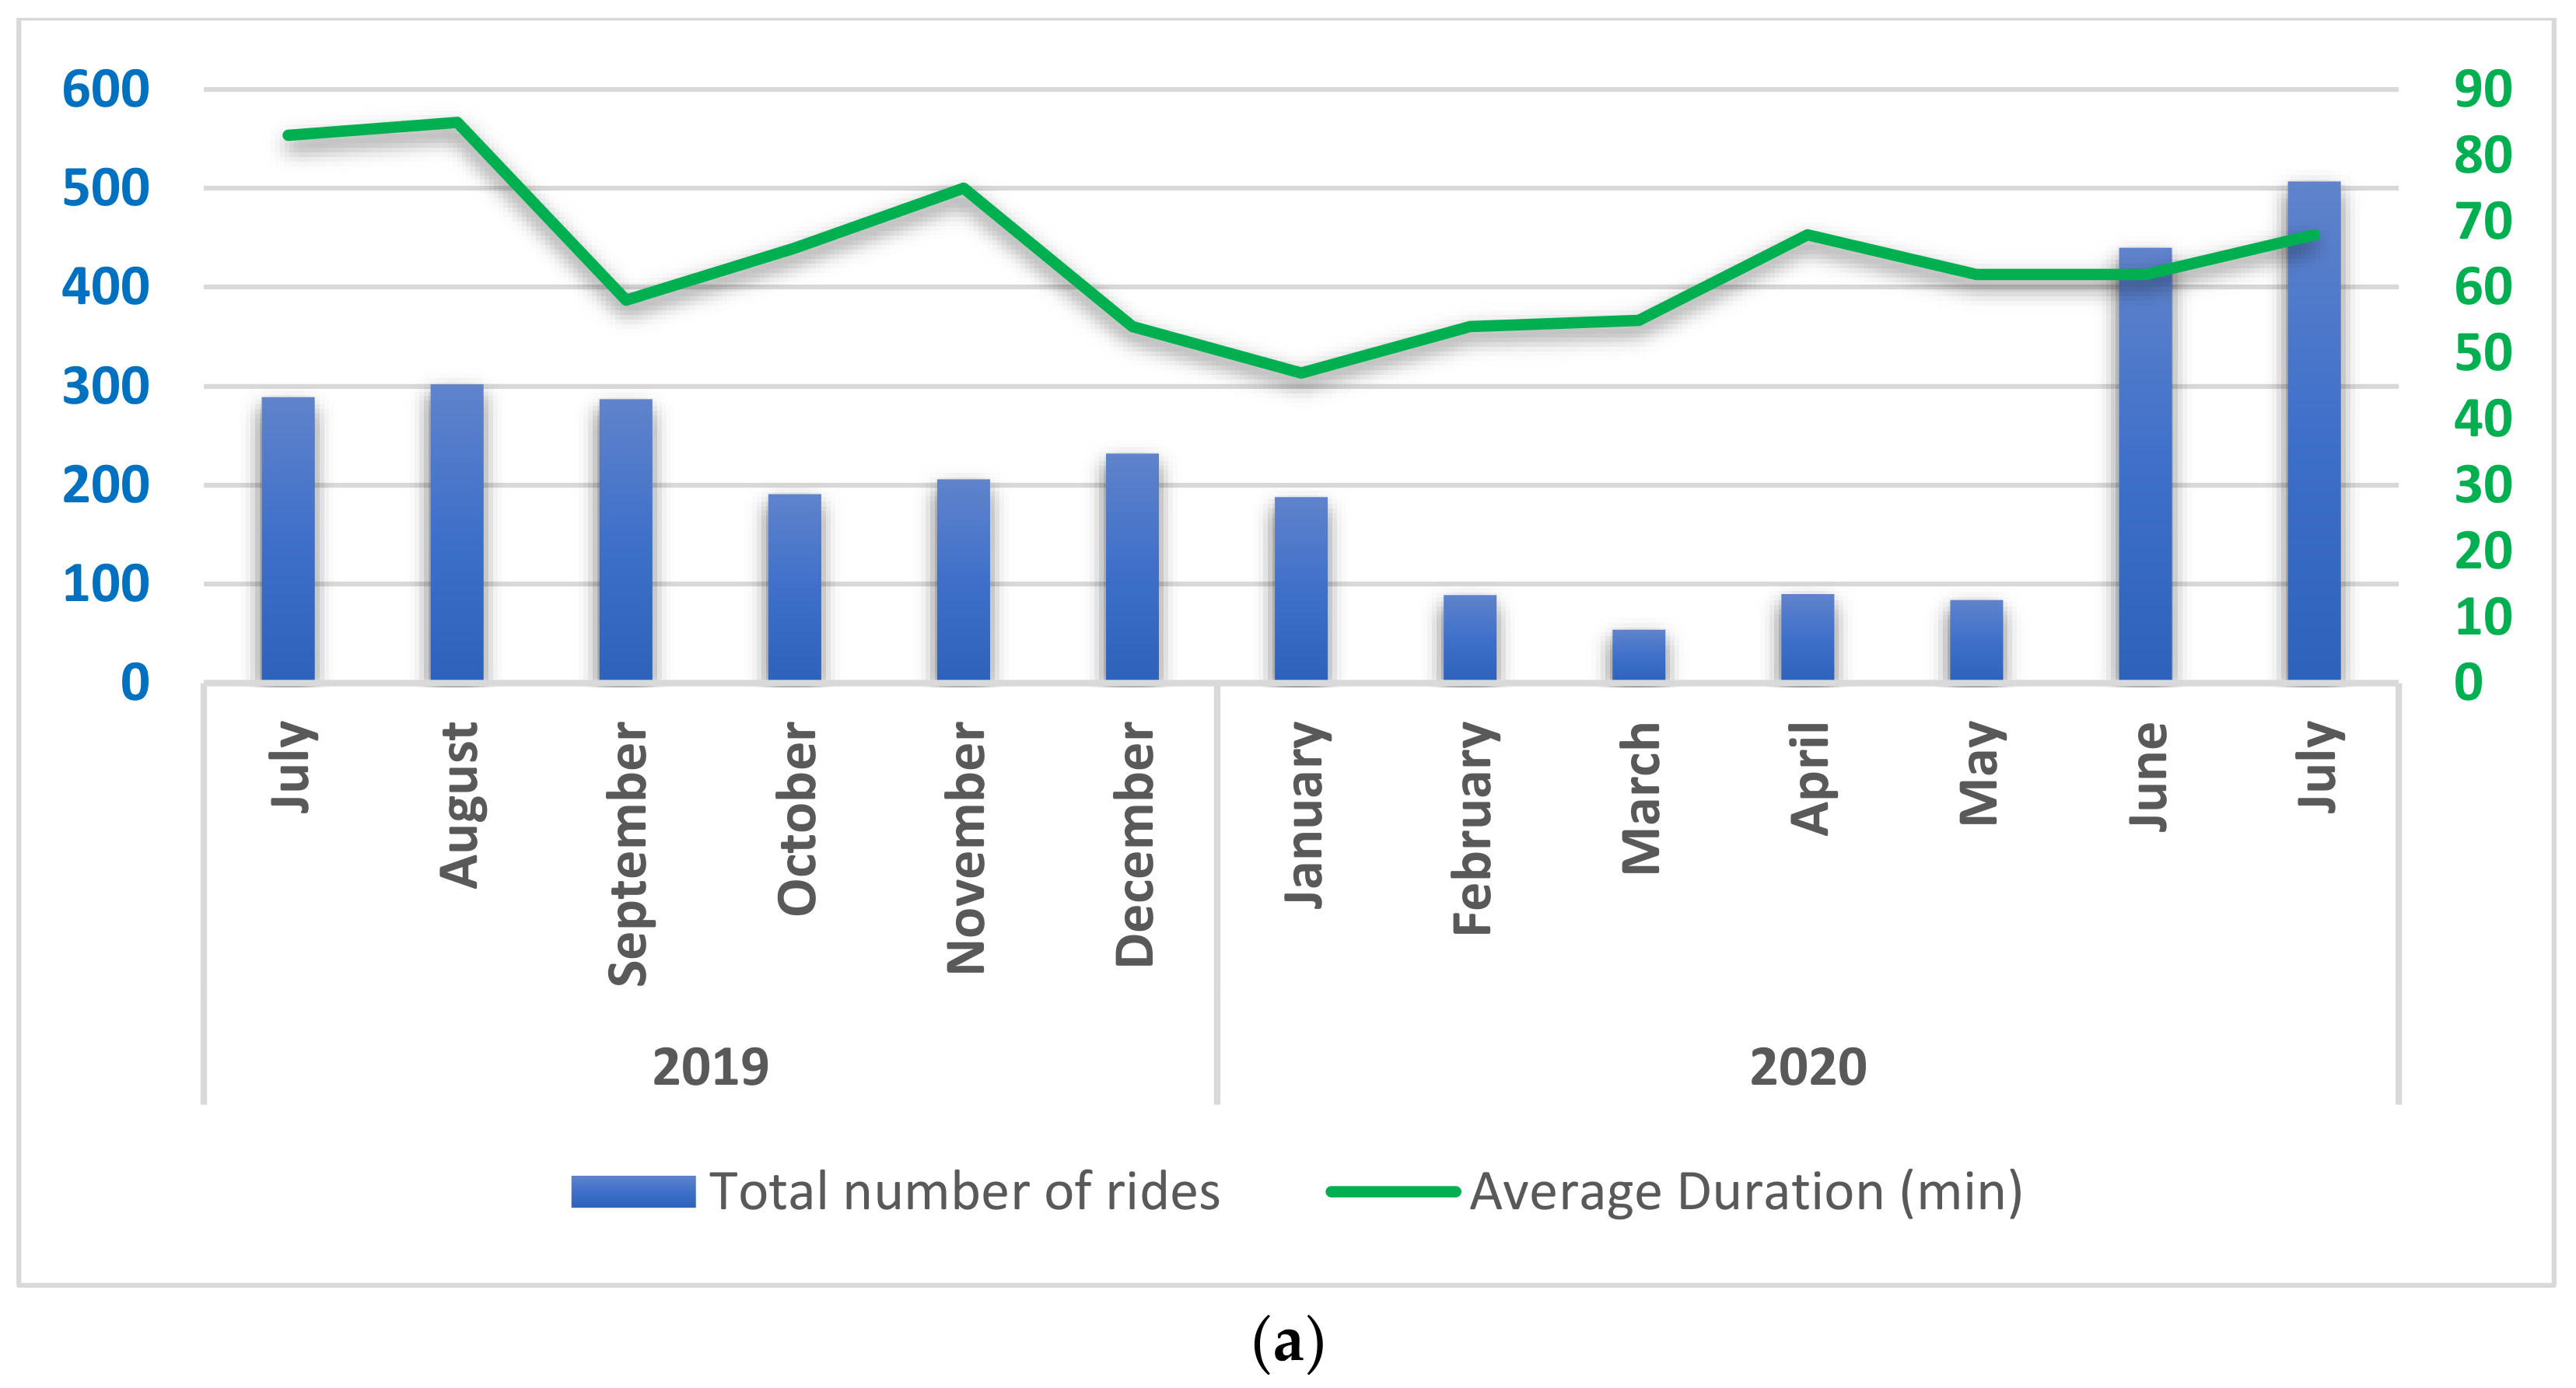
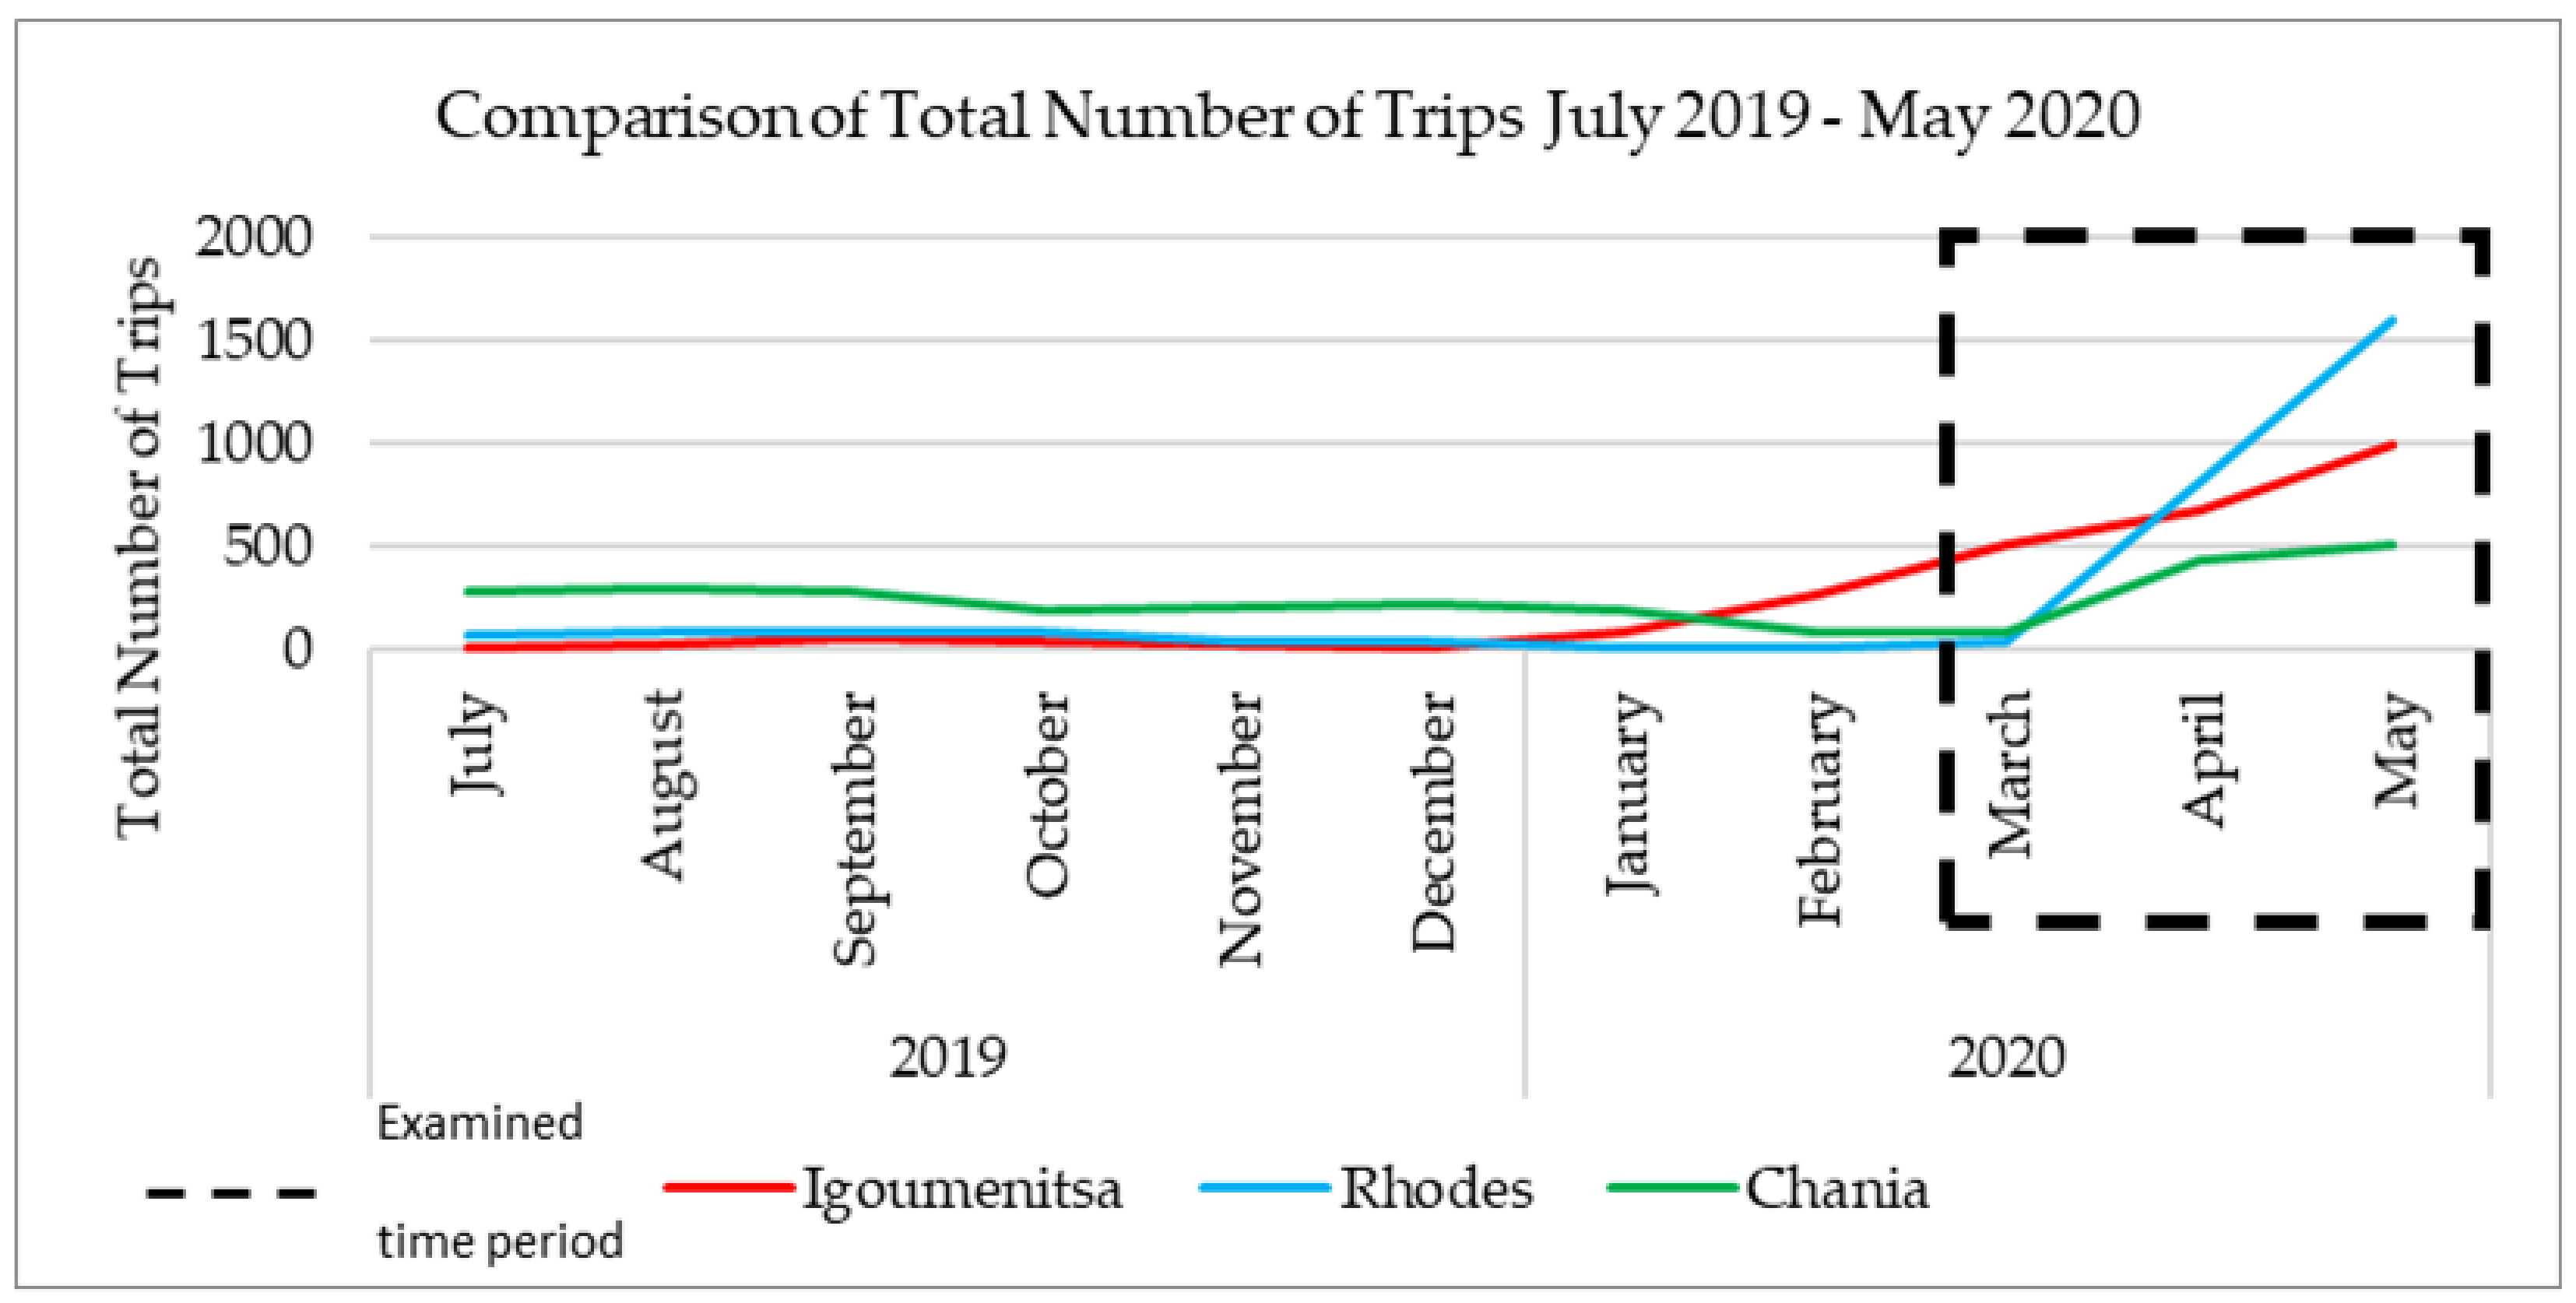
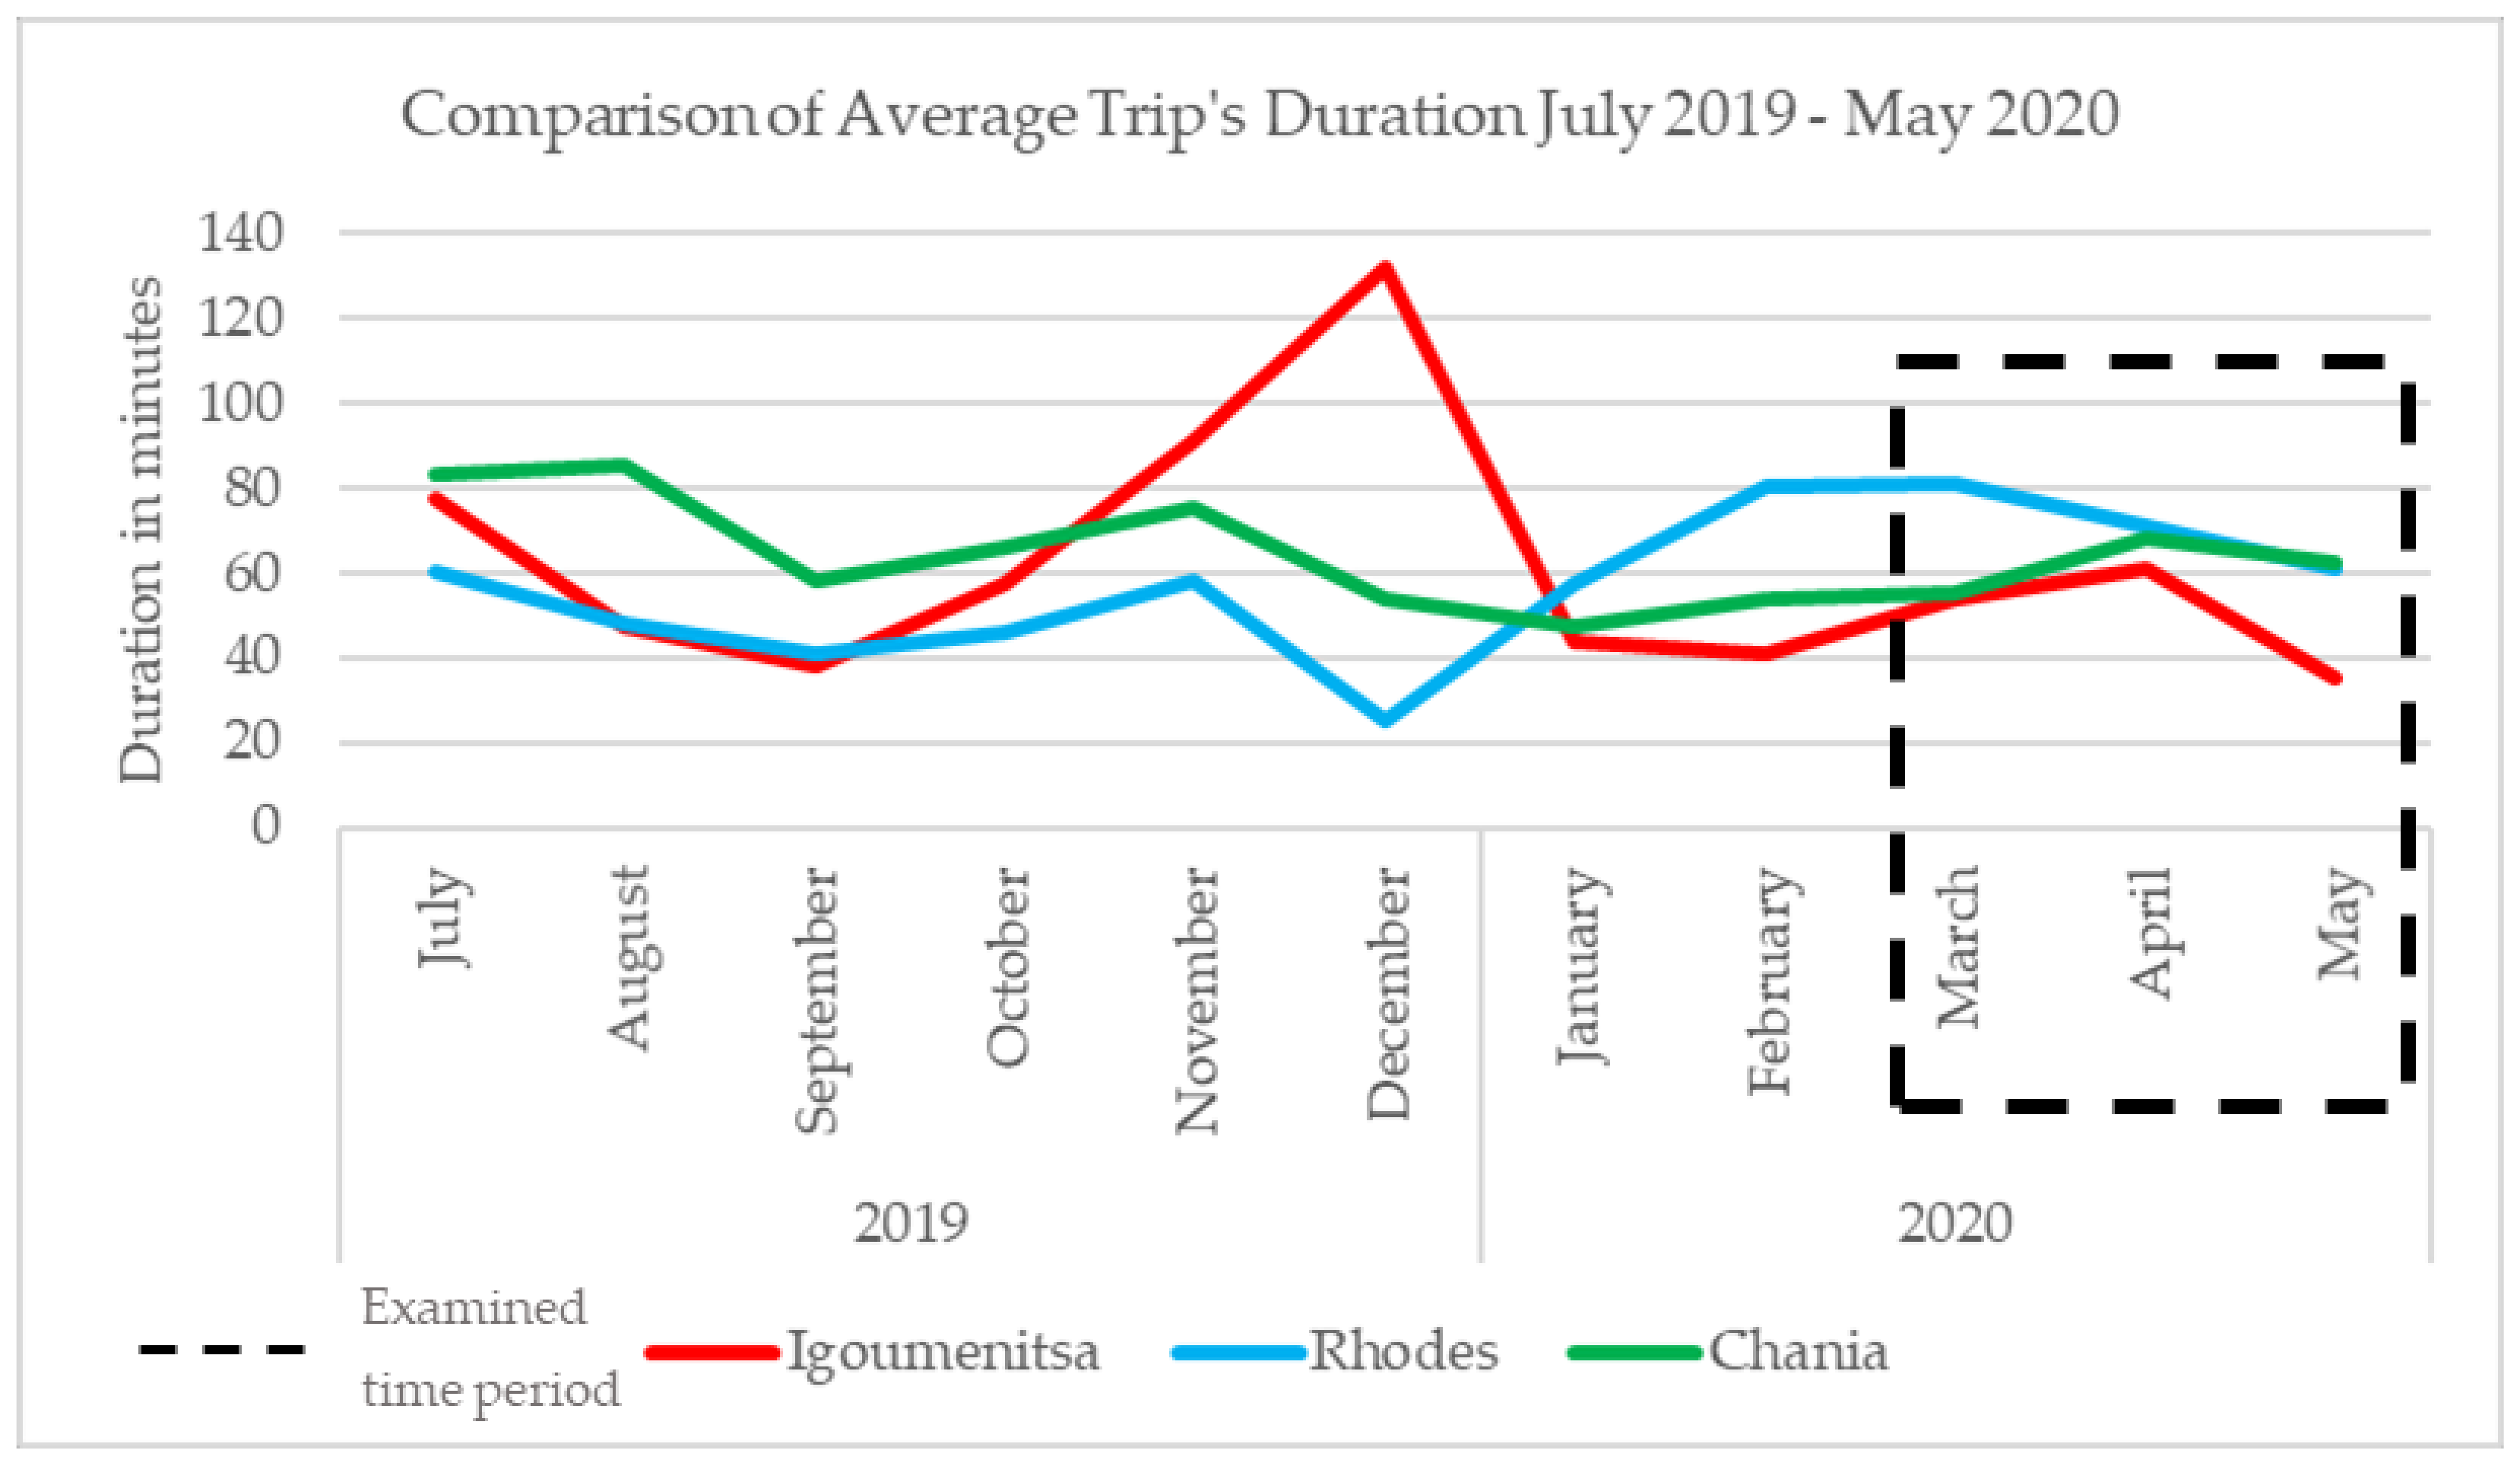
A comparison of the evolution of the total number of rides as well as the average trip’s duration for the period July 2019–May 2020 for the above-mentioned three cities is presented in
Figure 9 and
Figure 10, respectively. The black dotted frame represents the time period during which the restricting measures were applied.
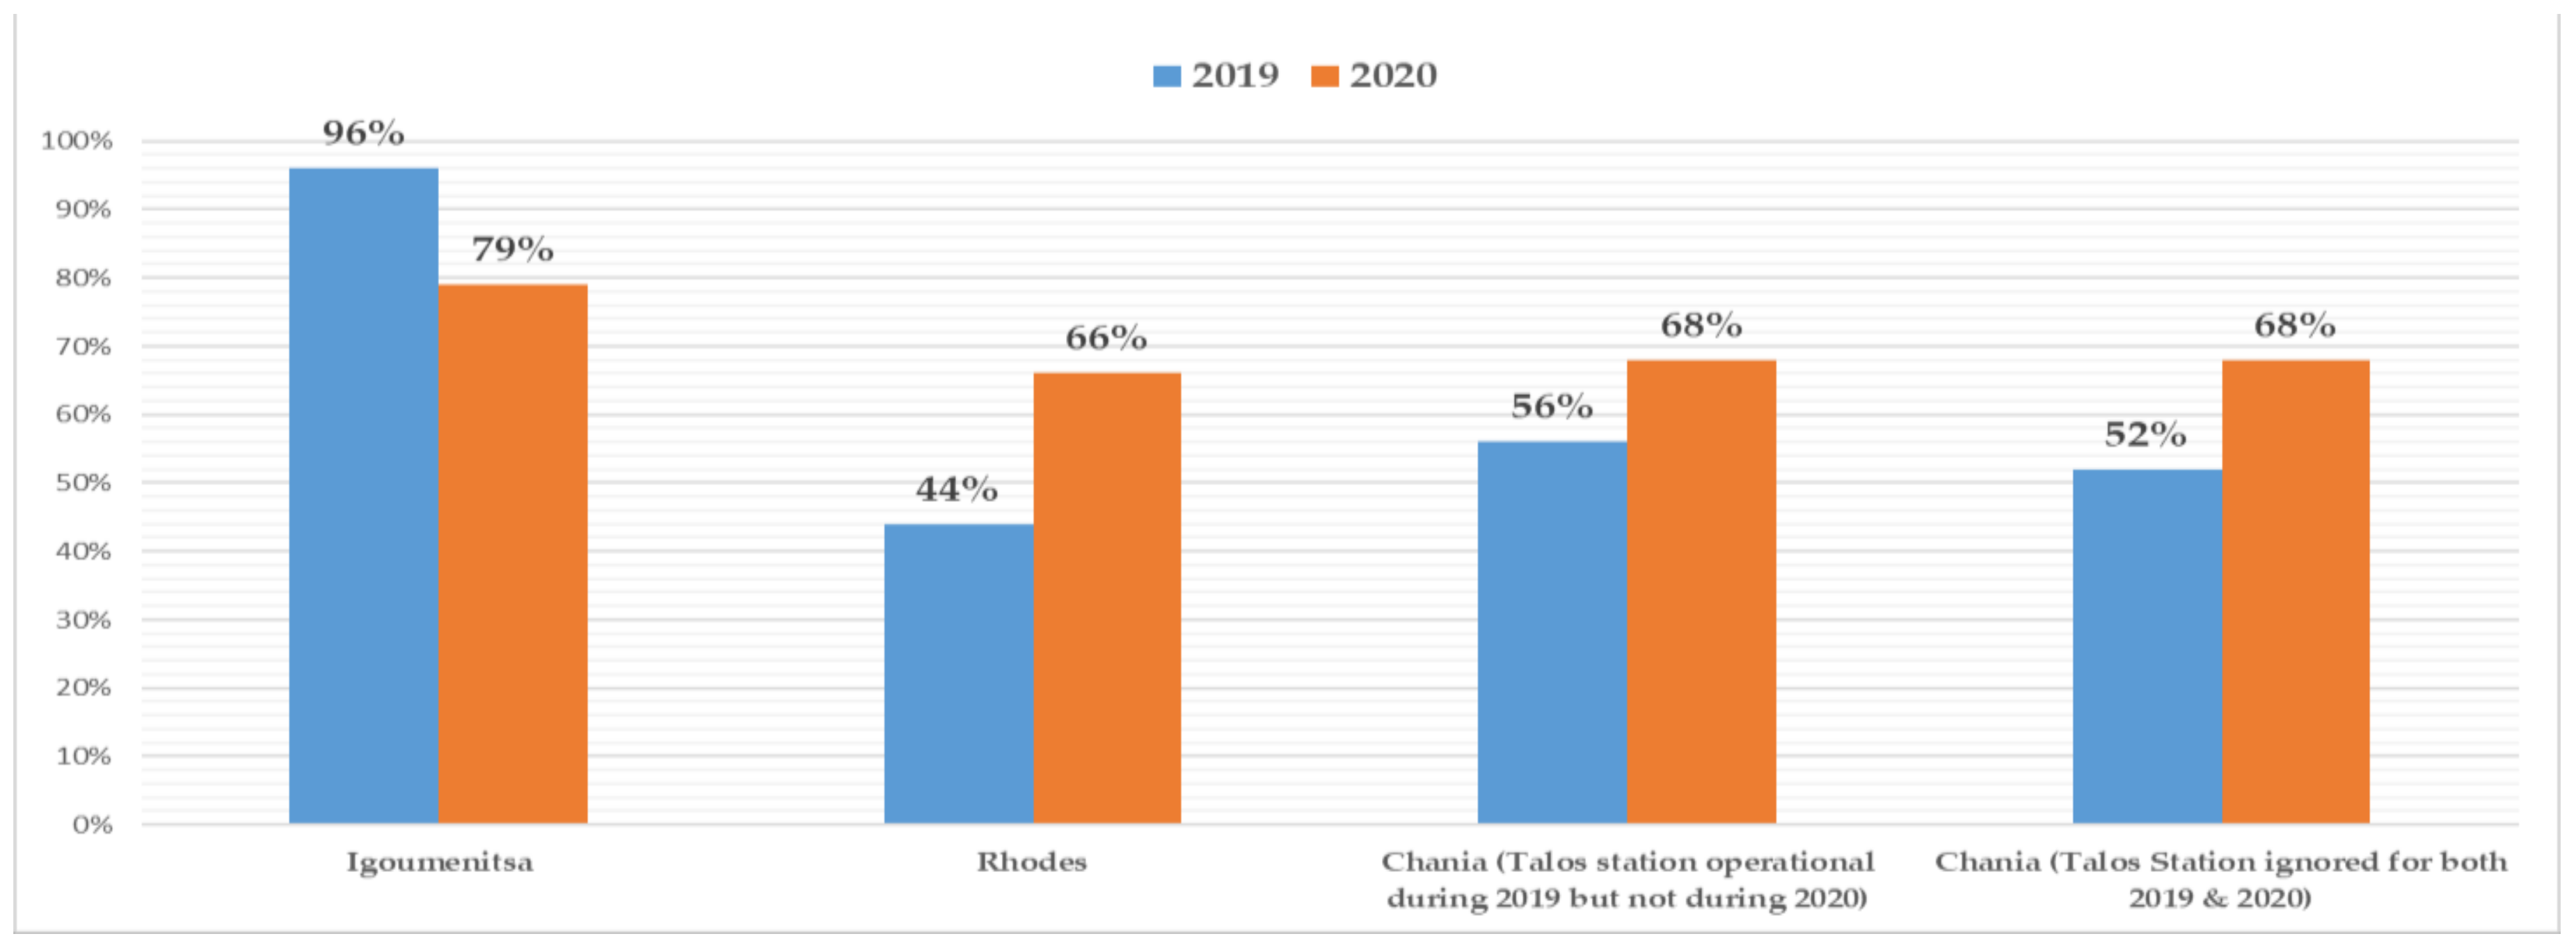
Another interesting finding from the first-level analysis of the provided data (the second-level analysis or in-depth analysis of the data concerned the exploration of the existence or not of correlations among the parameters of the bike-sharing systems based on the choices of the users) concerns the choice of the users to return or not return the bicycles to the renting stations from which they rented them. It can be assumed that this users’ choice can assist in building an origin–destination matrix. An origin point is considered the renting station from which the user rents the bicycle and a destination point refers to the renting station to which the user returns the bicycle. The analysis of the collected data in an aggregated manner is presented in
Figure 11. Specifically, for the city of Chania, two approaches were followed and are presented regarding the Talo renting station, as it was operational only for the year 2019. Therefore, the first approach takes into consideration this fact while in the second the station is totally ignored and excluded from the analysis.
3.3. Number of Rides Regression Model
For the purpose of our analysis, daily data provided by the operator (Cyclopolis) of the BS systems were converted into weekly data, which were then used to construct an unbalanced panel dataset of the bike-sharing system in three Greek cities (Igoumenitsa, Rhodes, and Chania) from July 2019 to May 2020.
To analyze the performance of bike-sharing systems we used as a dependent variable the number of rides recorded per week. This variable measures the level of usage of bike-sharing systems in each of the aforementioned Greek cities. In addition, we used a set of independent variables that can be associated with the number of rides. In many cases, the development of a model is highly affected and dependent on the attributes of the collected data. The model developed in the framework of the present research activity aimed to identify whether the lockdown period and the restriction measures applied affected the performance of the BS systems in three Greek cities which can be measured by how ridership was changed before, during, and after the lockdown. For this to be achieved, the number of rides, their duration, and whether the users returned the bicycles to the stations from which they rented them or not, based on the following assumptions, were used:
The duration could reveal if the users rented the bicycles for pleasure or (a) in order to move to/from their working locations and (b) other than the previous reasons.
The analysis of the data concerning the renting and returning stations of the bicycles was another factor that could reveal the purpose of using the bicycle as most likely the users that rented a bicycle for pleasure would return it to the same station; while the users renting it in order to move for other reasons would return to a station which is located nearest to their destination.
Firstly, to control the effect of quarantine lockdown, we include a dummy variable that takes the value of 1 during the quarantine period, i.e., the weeks between 23 March and 4 May 2020 and zero otherwise. Moreover, we include an alternative dummy variable that takes the value of 1 during the quarantine period and beyond, i.e., all the weeks after 23 March 2020 and zero otherwise. We do so, in order to control whether the effect of quarantine lockdown on the performance of bike-sharing systems remains after the easing of restrictions on 4 May. Secondly, we include the average duration of the rides per week in each city. Finally, taking into account the availability of bike-sharing systems, the number of rental stations in each city is also included.
Accordingly, the empirical model is formulated as follows:
where,
: is the dummy for the general quarantine lockdown in Greece;
: is the weekly average ride duration in each city;
: is the number of rental stations;
: is the composite error term;
: is a random effect, i.e., time-invariant characteristics of a city;
: is the error term;
: parameters to be estimated.
In random-effects models, the random effect is a component of the composite error term, i.e.,
, and is not correlated with any regressor. Both random effect and errors are independently identically distributed,
and
. Our random-effects model is estimated by ordinary least square (OLS) regressions with robust clustered standard errors in order to control for both heteroscedasticity and correlation of the error terms [
36]. To decide between the use of fixed effects or random effects, we applied the standard Hausman test which showed that the appropriate specification is the random-effects model.
The main results are presented in
Table 8. In the first column, we estimate a random-effects model including only our main variable of interest, namely Lockdown (
. Then, in columns (2) and (3), we estimate random-effects models including the remaining independent variables (
). In all three columns, the estimated coefficient of lockdown is positive and statistically significant, indicating a positive effect of quarantine lockdown on the number of rides. Specifically, the estimated coefficient suggests that lockdown leads to an increase in the number of rides via bike-sharing systems, during the the lockdown period. It must be noted that for these calculations, rides with a duration of less than 5 min were excluded.
Concerning the rest of the independent variables, the coefficient of the weekly average duration of rides is insignificant in all regressions, implying that the duration of rides does not affect the number of rides. Similarly, the rental stations variable exerts an insignificant coefficient, indicating that the number of rental stations is not associated with the weekly number of rides. In column (4), we estimate the baseline model using fixed effects instead of random effects in order to see whether the estimated results depend on model specification. As can be seen, estimated results for the main independent variable, i.e., Lockdown (), hold across both random and fixed effects models.
In
Table 9, we re-estimated all regressions of
Table 7 using an alternative dummy for lockdown which measures the effect of lockdown during and after the lockdown period. Yet again, rides with a duration of less than 5 min were excluded by these calculations. As can be seen, the results remain the same since the estimated coefficient of Lockdown is still positive and statistically significant in all regressions. Hence, our results can have an alternative interpretation: Lockdown leads to an increase in the number of rides both during the lockdown period and after the easing of restrictions. Regarding the rest independent variables, estimated results for the average duration of rides remain unchanged. On the contrary, the number of rental stations exerts a positive and statistically significant coefficient, indicating that it is positively associated with the number of rides.
4. Discussion
The statistical analysis of the data provided by the BS systems’ operator revealed that the lockdown affected the modal choice of the residents of the three above-mentioned and analyzed Greek cities. It seems that the users of the BS systems in Igoumenitsa, Rhodes, and Chania acknowledged the benefits of using bike-sharing bicycles and as a result continued to use the bicycles even after the end of the lockdown period, although no campaigns were implemented or measures were taken as those in other European cities aiming to promote the usage of BS systems. Even though a decrease was recorded after the end of the restriction measures, the BS systems continued to have an increased level of usage six or nine months ago. The examination of qualitative and quantitative data for a longer time period, regarding the performance of the BS systems, could reveal if the users developed a new pattern concerning their habits and modal choice or if the effect of the lockdown period leading to an increased level of BS systems usage, fades out as time passes. Toward this direction, our team has addressed an official request to the BS systems operator in order to provide us with data covering a longer time period mainly after the end of the first lockdown period.
Similar results to our research were found and conclusions were extracted for the cities of New York [
37,
38], Budapest [
39], Thessaloniki [
40,
41], Nanjing [
42], and the region of Sicily in Italy [
43], regarding the level of ridership before, during, and after the imposition of restricting measures concerning urban mobility and specifically the usage of bicycles, the rides’ duration [
44], the people’s perception towards BS systems due to the COVID-19 pandemic, and to bicycles in general [
45,
46]. Furthermore, during the early stages of the pandemic, in some cases, bike sharing expanded their memberships or improved accessibility for specific working groups [
47]. However, there are several cases in which despite an initial increase in using BS systems during the first months of the pandemic, ridership declined for several months in 2020 [
48,
49,
50,
51,
52,
53]. There are also systems recovering from the effects of the pandemic and mainly lockdown measures applied in many countries; for example, in the UK, the latest data show a significant recovery [
54]. A study estimating the effect of the pandemic on the London BS system over the period March–December 2020 indicated that although a reduction in cycle hires was recorded in March and April 2020, the demand increased after May 2020 and even more during April, May, and June 2020 the bikes were hired for longer trips (perhaps as the authors mention due to a shift from public transit) [
54]. It is clear that people have reacted differently worldwide concerning the usage of BS systems during the pandemic, making each case unique. For example, in Seoul, the level of usage of the BS system was affected negatively by the number of daily new COVID-19 cases and positively as the necessity for social distancing was becoming a reality for the residents [
34]. Moreover, a study regarding the impact of COVID-19 on the BS system in Slovakia, showed that during the lockdown period, the level of usage was decreased. However, after restrictions were relieved, a slight increase was recorded [
55]. In a recently published study regarding the performance of BS systems in the United States [
56], one of the main conclusions (five out of eleven BS systems provided feedback) was that bike-sharing moderate-frequency riders (1–2 times per month) may increase after the coronavirus restrictions are lifted.
Based on the above-described analysis, we can state with relative safety that the lockdown period affected the performance of the BS systems in the examined cities since during the lockdown period the level of usage of BS systems increased. This evolution can be capitalized by the local authorities by promoting and advertising the benefits of the BS systems, even those that were not initially (and most likely could not be) conceived, but ultimately were revealed during the COVID-19 pandemic [
57,
58,
59]. Specially designed campaigns could be organized by the local authorities in order to inform the people of the benefits of using bicycles, by highlighting that BS systems’ level of usage was increased during the lockdown period providing them a way out from the restriction measures while at the same time maintaining social distancing. Lastly, those campaigns could promote the usage of BS systems as a significant tool to achieve sustainable mobility [
56].
Our study has some limitations. The data provided cover a time period of many months before the applied first lockdown in Greece and only a few months after the easiness of the applied measures. Although the change in the level of BS bicycles’ usage was recorded, analyzed, and examined, a longer time period would provide more solid conclusions and results. Furthermore, our analysis is based on quantitative data for the BS systems and at the same time, we do not have access to data concerning other available transport modes in the examined cities. As a result, no comparison among the available transport modes can be made as, for example, public transport and BS bicycles. Finally, the absence of qualitative data regarding the reasons for users’ choice to use more (or at least at the same level) BS bicycles during and after the lockdown period compared to the pre-lockdown period, does not allow us to perform an in-depth analysis.
As the pandemic continues, it has been proposed that BS systems continue to be constantly monitored by the operators and despite their level of usage, the users’ choices (either these lead to an increase or decrease in their usage) should be investigated through rolling questionnaire-based surveys. As health protocols demand social distancing, it is difficult to perform in situ surveys and therefore it is recommended to exploit digital services such as the internet and smartphones in order to implement these surveys. Furthermore, it is crucial for the sustainability of the BS systems that operators fully comply with the health protocols applied which require decontamination of bicycles and all surfaces in the rental stations ensuring that BS bicycles do not become contagion sources.
If the values presented in
Table 10 and specifically the number of rides per 1000 residents are expressed on a daily basis (30 days per month), then for the case of Igoumenitsa, the respective values are equal to 1.88 for March 2020, 2.48 for April 2020, and 3.65 for May 2020. For the case of Chania, the respective values are equal to 0.03 for March 2020, 0.17 for April 2020, and 0.20 for May 2020 while for the case of Rhodes are equal to 0.03 for March 2020, 0.55 for April 2020, and 1.07 for May 2020. When comparing the highest values of the number of rides per 1000 residents (May 2020) with the respective values for other BS systems, Igoumenitsa outperformed the BS system of Mexico City, Chania’s BS system performed similarly to Seattle’s BS system, and Rhodes’ BS system performed similarly to London’s BS system based on the findings of a report published in 2018 [
60].
5. Conclusions
Based on the presented data, during the first lockdown period in Greece, the residents of the above-mentioned Greek cities, for unknown (up to present) but assumable reasons, decided to use the installed and operational BS systems in their home cities. Although the increase had started a short time period before the lockdown period, it came to a peak during the lockdown. After the end of the lockdown, the residents tended to return to their prior moving patterns with an increased share for the BS systems compared to the pre-lockdown period. The average duration of the BS bicycles usage during the lockdown period was increased compared to the months before it (Igoumenitsa, Chania) and the months after it (Igoumenitsa, Chania, Rhodes) in 2020, despite the fact that during the lockdown the residents were allowed to move only for a period of one hour during daytime if permission was granted to them and for a small number of specific reasons.
It is necessary to better understand the reasons for the (recorded and presented in this paper) performance of the BS systems in the three Greek cities before, during, and right after the first lockdown period in Greece, to perform a questionnaire-based survey addressed to the users asking them for the reasons that led them to use the BS systems during the lockdown. Furthermore, a request has been planned for submission to the operator of the examined BS systems to provide our team with more data covering mainly the time period after the lockdown period, which will allow us to compare the evolution of the BS systems’ performance for a longer time period.
An interesting finding of the above-presented analysis concerns the evolution of the total number of rides after the lockdown. While in the city of Igoumenitsa the total number decreased (but yet remained higher with the respective numbers before the implementation of the restriction measures during the lockdown), in the cities of Rhodes and Chania the total number of rides kept rising. However, based on
Table 10, it is clear that the average daily rides in Igoumenitsa in May 2020, which was the most significant among the three cities, were about 30. Considering there is a population of over 9000 in Igoumenitsa, this amounted to about 0.03% of people who opted to use the bikes in the BS systems in the city. While the effect was statistically significant, in reality, the effect was considered very minor.
The airport at Chania served flights from 1 July 2020 and beyond due to the restriction measures applied worldwide [
64]; therefore, the increase was not caused by visitors. In the city of Rhodes, the decrease in arrived flights at the island’s airport compared to those in 2019 for the period April 2020–June 2020 was 100% [
65]. Moreover, in this case, the increase in the BS system was not caused by visitors. In order to understand the reasons for this phenomenon, as mentioned above, a questionnaire-based survey addressed to the users of the BS systems operating in the currently studied cities is under development.
The current situation (COVID-19 pandemic and the measures applied worldwide) is unique for modern human history in terms of the geographical area and the duration of the applied restricting measures/lockdown. Estimations and assumptions can be made in order to explain the phenomenon and identify the effects (if identified) of the lockdown on the users’ modal choice and modal shift. However, during the first lockdown period in Greece, the residents of three Greek cities in which BS systems were installed and are currently operating decided to use them more than the previous time period. This fact is indisputable; however, the reasons that led to this evolution can be only assumed based on the availability of qualitative data for that time period.
The first and more solid assumption is that the increase in the demand for the BS systems was a countermeasure to the restriction measures implemented due to the COVID-19 pandemic as people chose BS bicycles as a safe transport mode ensuring social distancing, freedom of their movements, and environmental benefits. Specifically, the possible benefits identified by the usage of BS bicycles should be capitalized by local decision-makers based on the fact that sustainable mobility has been, is, and will keep being, one of the most important objectives of the European Commission [
66,
67,
68,
69]. Moreover, there is a high possibility that users that did not own a bicycle and therefore could not exercise (one of the reasons that the residents could go outside for a period of one hour was to exercise), chose the bike-sharing systems as an excuse to go outside and exercise in an effort to decrease the pressure (mainly psychological) created by the lockdown (such a choice was given by the Greek government using a specially developed mobile service) or a transport mode in order to move across those cities covering and serving their needs.


 ,
, 


