
Accurate Image Locating by Hologram Multiplexing in Off-Axis Digital Holography Display

College of Science, China University of Petroleum (East China), Qingdao 266580, China
*
Author to whom correspondence should be addressed.
Appl. Sci. 2022, 12(3), 1437; https://0-doi-org.brum.beds.ac.uk/10.3390/app12031437
Submission received: 24 December 2021
/
Revised: 22 January 2022
/
Accepted: 27 January 2022
/
Published: 28 January 2022
(This article belongs to the Special Issue Holography, 3D Imaging and 3D Display Volume II)
Abstract
:An approach is suggested to recover and then locate the original object image in off-axis digital holography by the multiplexing of hologram (OADHM). The recording configuration is designed by introducing one more plane wave in the interference frame to carry the information for the tilt angle of the reference wave (TARW), which is crucial for the holography recovery and the accurate locating of the reconstructed image. The intensity distribution in a hologram plane and the corresponding spatial spectrum of two sets holograms in Fourier domain are analyzed theoretically. When the specific spectra that come from the interference of the two plane waves are detected, the TARW can be calculated by the coordinates of them and then the recovered image can be retrieved by spectrum operation and located at the original place. Series numerical simulations and optical experiments have been carried out to demonstrate the availability and efficiency of the proposed design.
1. Introduction
Benefits from the invention of laser, the technique of off-axis holography [1] can make the original image separated from other diffraction terms during hologram recovery so that the image quality is improved greatly. After the off-axis optical holography became popular in many application areas, digital holography (DH) [2,3,4,5] also began to show the prosperous potential in applications and attract the interests of researchers because of its merits including the convenient processing procedure, robust signal processing capability in computer, and precise image locating in display.
The weakness of DH is the low resolution of the current recording device used for recording (the pixel size is about several microns), which is much lower than that of wet photographic material by one or two orders of magnitude. For off-axis DH, there exists the contradiction of the need for a largeTARW to separate the original image and the requirement of a small one to satisfy the low resolution of the recording device sensors, which limits the angle to several degrees. Although such on-axis DH method as phase-shifting holography [6,7,8,9,10,11,12] can solve the problem to a certain extent, these methods need more holograms recorded to eliminate the zero-order and the twin image by interferogram calculation, which makes it difficult for dynamic recording and three-dimensional (3D) video display.
Recently, a spatial spectrum operation technique makes it possible to reconstruct the original image by choosing the correspondent spectra of the object term in Fourier domain [13,14,15], where the off-axis angle is crucial for image recovery and the locating of the original image. Unfortunately, the TARW angle is always difficult to control because the usable scope is only several degrees, and it is also inconvenient to record another parameter for the TARW. We have designed the recording geometry to control and monitor the TARW [16]. Two charge coupled devices (CCDs) are needed to record both the angle monitoring interference frame and the hologram separately, which increases the inconvenience by more operation steps, and computer storing, and processing burden. Hologram multiplexing can increase the information capacity in one single hologram [17,18,19,20], and it is always rescued to reduce such inconvenience discussed in application practice. The development of integrated phase-change materials (PCMs) can also enable the phase modulation and control on the object waves in DH [21]. Such new modern metamaterial is also expected to replace the spatial light modulators in holography display. Here we design a multiplexing recording setup to record both the TARW and object wave information in only one single interference frame. The TARW can be extracted easily by detecting the corresponding spectrum on Fourier domain and can then be used in the recovery and accurate locating of the object image in hologram display. We derive the theory of the proposed method first and then carry out numerical simulations and optical experiments to verify our idea before the conclusion.
2. Principle
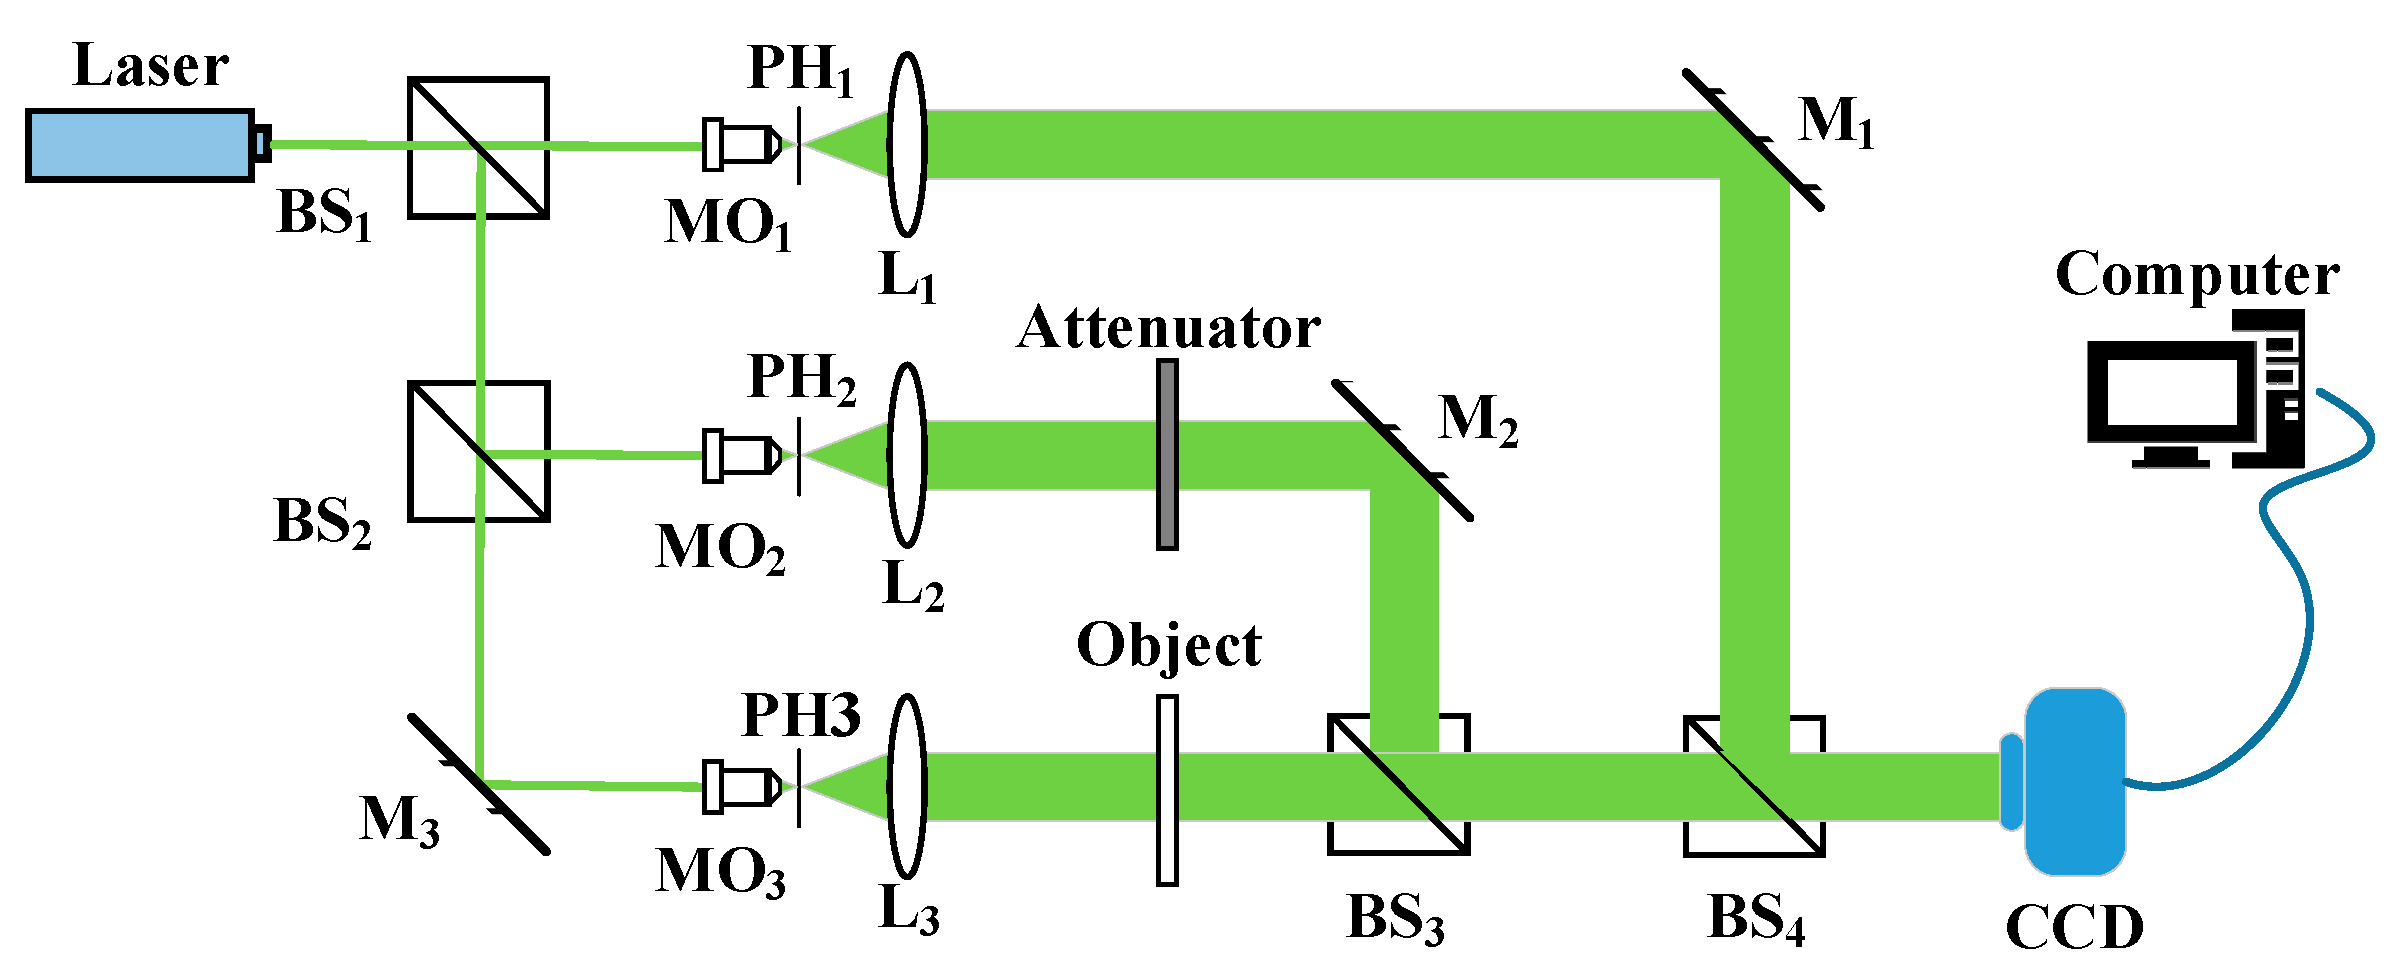
Figure 1 shows the geometry setup for the OADHM design, where BS, M, MO, PH, and L note beam splitter, mirror, microscopic object lens, pinhole, and collimator lens, respectively. To write the TARW information in the hologram, a plane wave is added in the traditional rectangular recording configuration. The new beam denoted as O1(x, y) is reflected by BS2, focused, and filtered by MO2 and PH2, collimated by L2, reflected further by M2 and BS3 consequently, and interfered with the object wave O(x, y) and the reference wave R(x, y) on a CCD chip at last. Both beam O1(x, y) and the illuminating beam are set as on axis, but the tilt reference beam has a tilt angle needed to separate the original image for display. Actually, 1(x, y) can be seen as a real constant AO1 because it is an on-axis plane wave. Based on the description above, the complex amplitudes of object wave O(x, y) and the reference wave R(x, y) in the working plane of the recording CCD can be written as
where we also have assumed Ar a constant for brevity. However, in Equation (2), the phase of the reference wave φr(x, y) should not be a constant but a linear distribution
where λ is the wavelength of the laser, and θx and θy are the TARWs along the x and y directions. In fact, the multiplexing plane wave O1 is a constant and can be represented by a small number “AO1” because it is a normal incident on-axis plane wave. From Equations (1) and (2), the interferogram intensities for the three waves interference can be expressed as
where symbol ‘*’ is the operator of conjugation. From Equation (4), we have
In Equation (5), ‘| |’ represents the absolute value, and the nine terms on the right side of the equation are the interference results of the three waves in Figure 1. Terms , , and contribute to the zero order term during the hologram reconstruction. The 4th and 5th terms are interfering results between O1 and O, which belongs to on-axis interference and can be seen as the zero order terms also when holography display is carried out. The sixth and seventh terms are the interference between the plane waves O1 and R, and the intensity distribution for this interference is the straight stripes modulated by the cosine function, which can be used to record the TARW information. The 8th and 9th terms are the interference terms between reference wave R and object wave O, which contribute the conjugate image and the original image.
To find the TARW information of the hologram, Fourier Transform (FT) can be done on Equation (6), and then we have [8]
where δ(u, v) is a delta function on the original point of the spatial frequency plane, Fo(u, v) is the spectrum distribution of the object wave recorded, and Fo(u, v) ⊕ Fo(u, v) is the auto-correlation of Fo(u, v). The former three terms on the right side of Equation (6) are all centered at the origin of frequency plane in Fourier domain, but the centers of the last two terms are shifted to the coordinates of (±up, ±vp), especially the term AO1Ar δ(u ± up, v ± vp) are two delta functions with obvious extreme values at points (±up, ±vp), which makes them easy to detect by searching for the maximum spectrum values.
After the points on the frequency plane are fixed, we can calculate the off-axis angle by their coordinates [16]:
where M, dx and N, dy are the pixel numbers and pixel size along horizontal and vertical directions correspondently. Since Ar is a real constant, after we fixed the TARW, the plane wave of the reference can be expressed as
When the crucial TARW is achieved, the original object wave can also be reconstructed exactly by the inverse diffraction automatically by [18]
where FT−1{} represents the operator of inverse Fourier transform, w(u, v) is a window functions to choose only one spectrum area on Fourier spectrum domain in the last term of Equation (6), and H(u, v) is the transfer function of the inverse diffraction system. The original object image can be reconstructed though an inverse Fresnel diffraction operation on O(x, y).
O(x, y) = FT−1{FT [R(x, y)·I(x, y)]·w(u, v)·H(u, v)},
The merits of the proposed method can be concluded as the following: First of all, the recording configuration is comparatively simple than the setup used before [16] and only one CCD is employed during the recording process. Secondly, the off-axis parameter and the interference information are carried by only one single hologram which decreases the computer storage load and of course is easy to transfer. Thirdly, the TARW information is concealed in the hologram so that the data are much safer than keeping it separately since this storage manner can avoid data loss and theft. Lastly, the multiplexing method proposed here can make the whole process of hologram recording and display automated and intelligent. The whole process can complete without human intervention.
To illustrate the method of OADHM more clearly, the whole process for the holography display can be summarized as the steps below:
Step 1: Perform FT operations on the hologram I in Equation (5) and detect the spatial frequency points corresponding to the fourth term on the right side of Equation (6) by searching for the brightest points in the Fourier frequency plane (exclude the direct current point at the coordinate origin).
Step 2: Locate and store the coordinates of the points (−up, −vp) or (up, vp).
Step 3: Calculate the value of the TARWs by Equation (7) and the coordinates (up, vp) stored in step 2.
Step 4: Construct the reference wave R by Equation (8) and the TARWs achieved in step 3 and then do FT operation on RI.
Step 5: Set up the window function in Equation (9) to select the objective spectra around the origin and filter out the spectrum at the origin point.
Step 6: Recover the object wave by Equation (9) and the frequency window function in step 5.
Step 7: Recover the original object image by performing the inverse Fresnel transform at displace z.
3. Computer Simulations
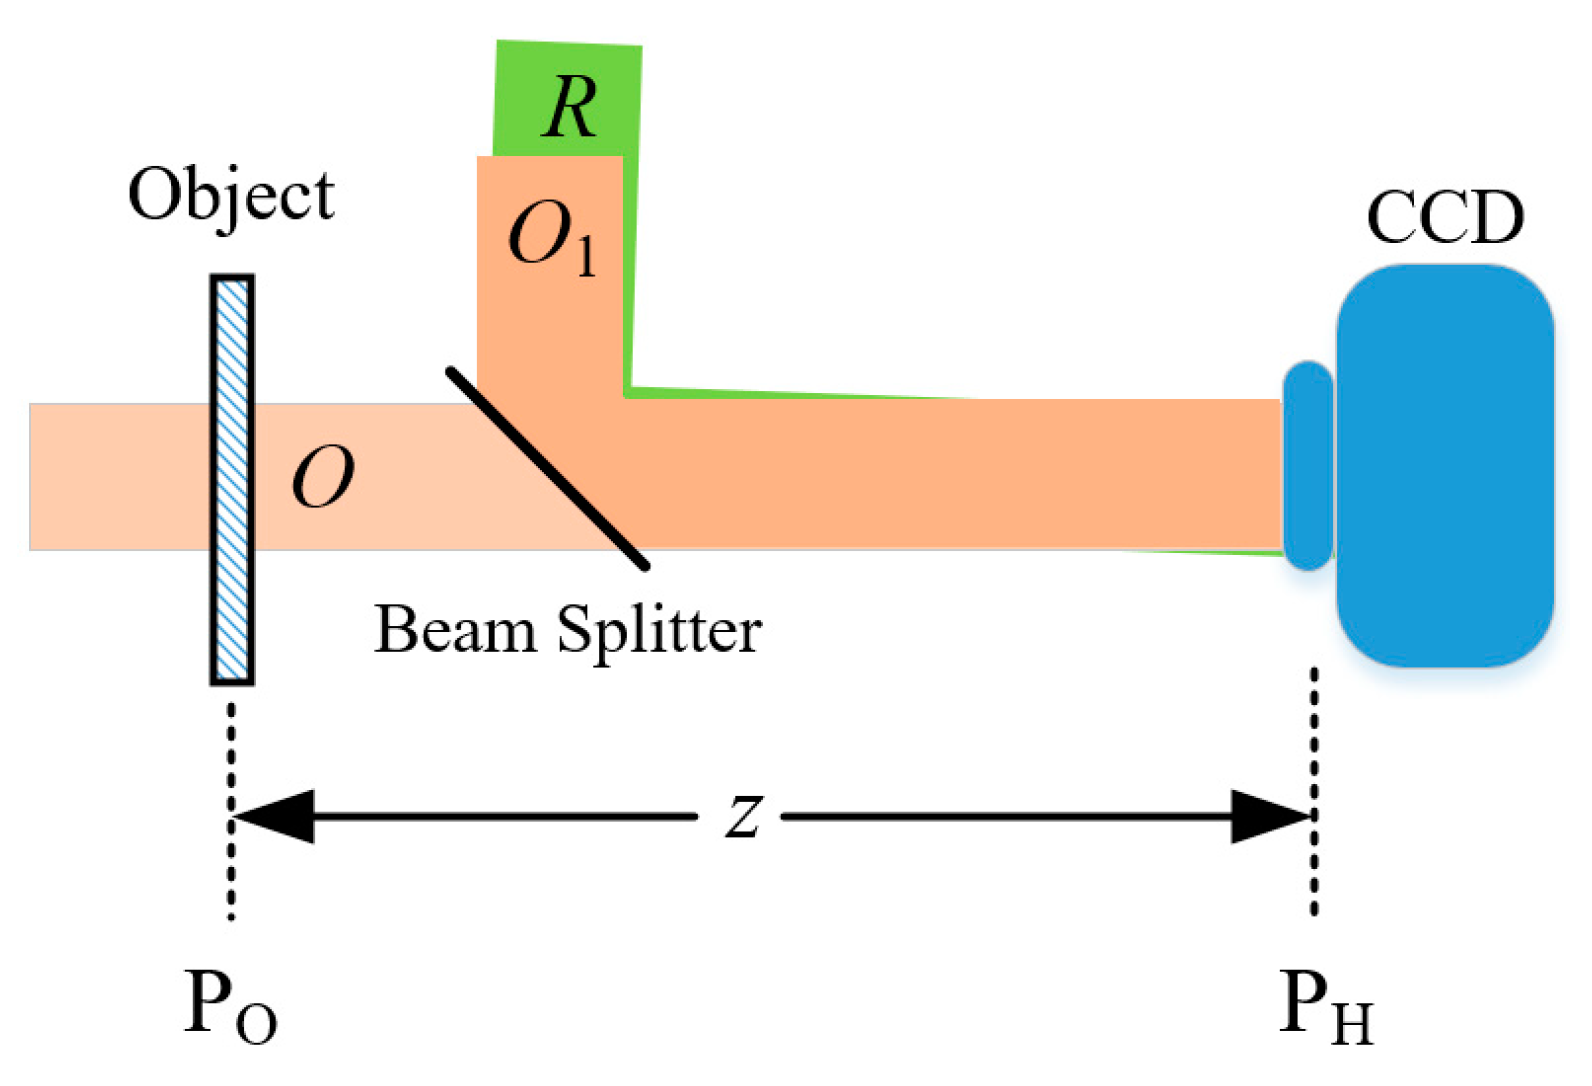
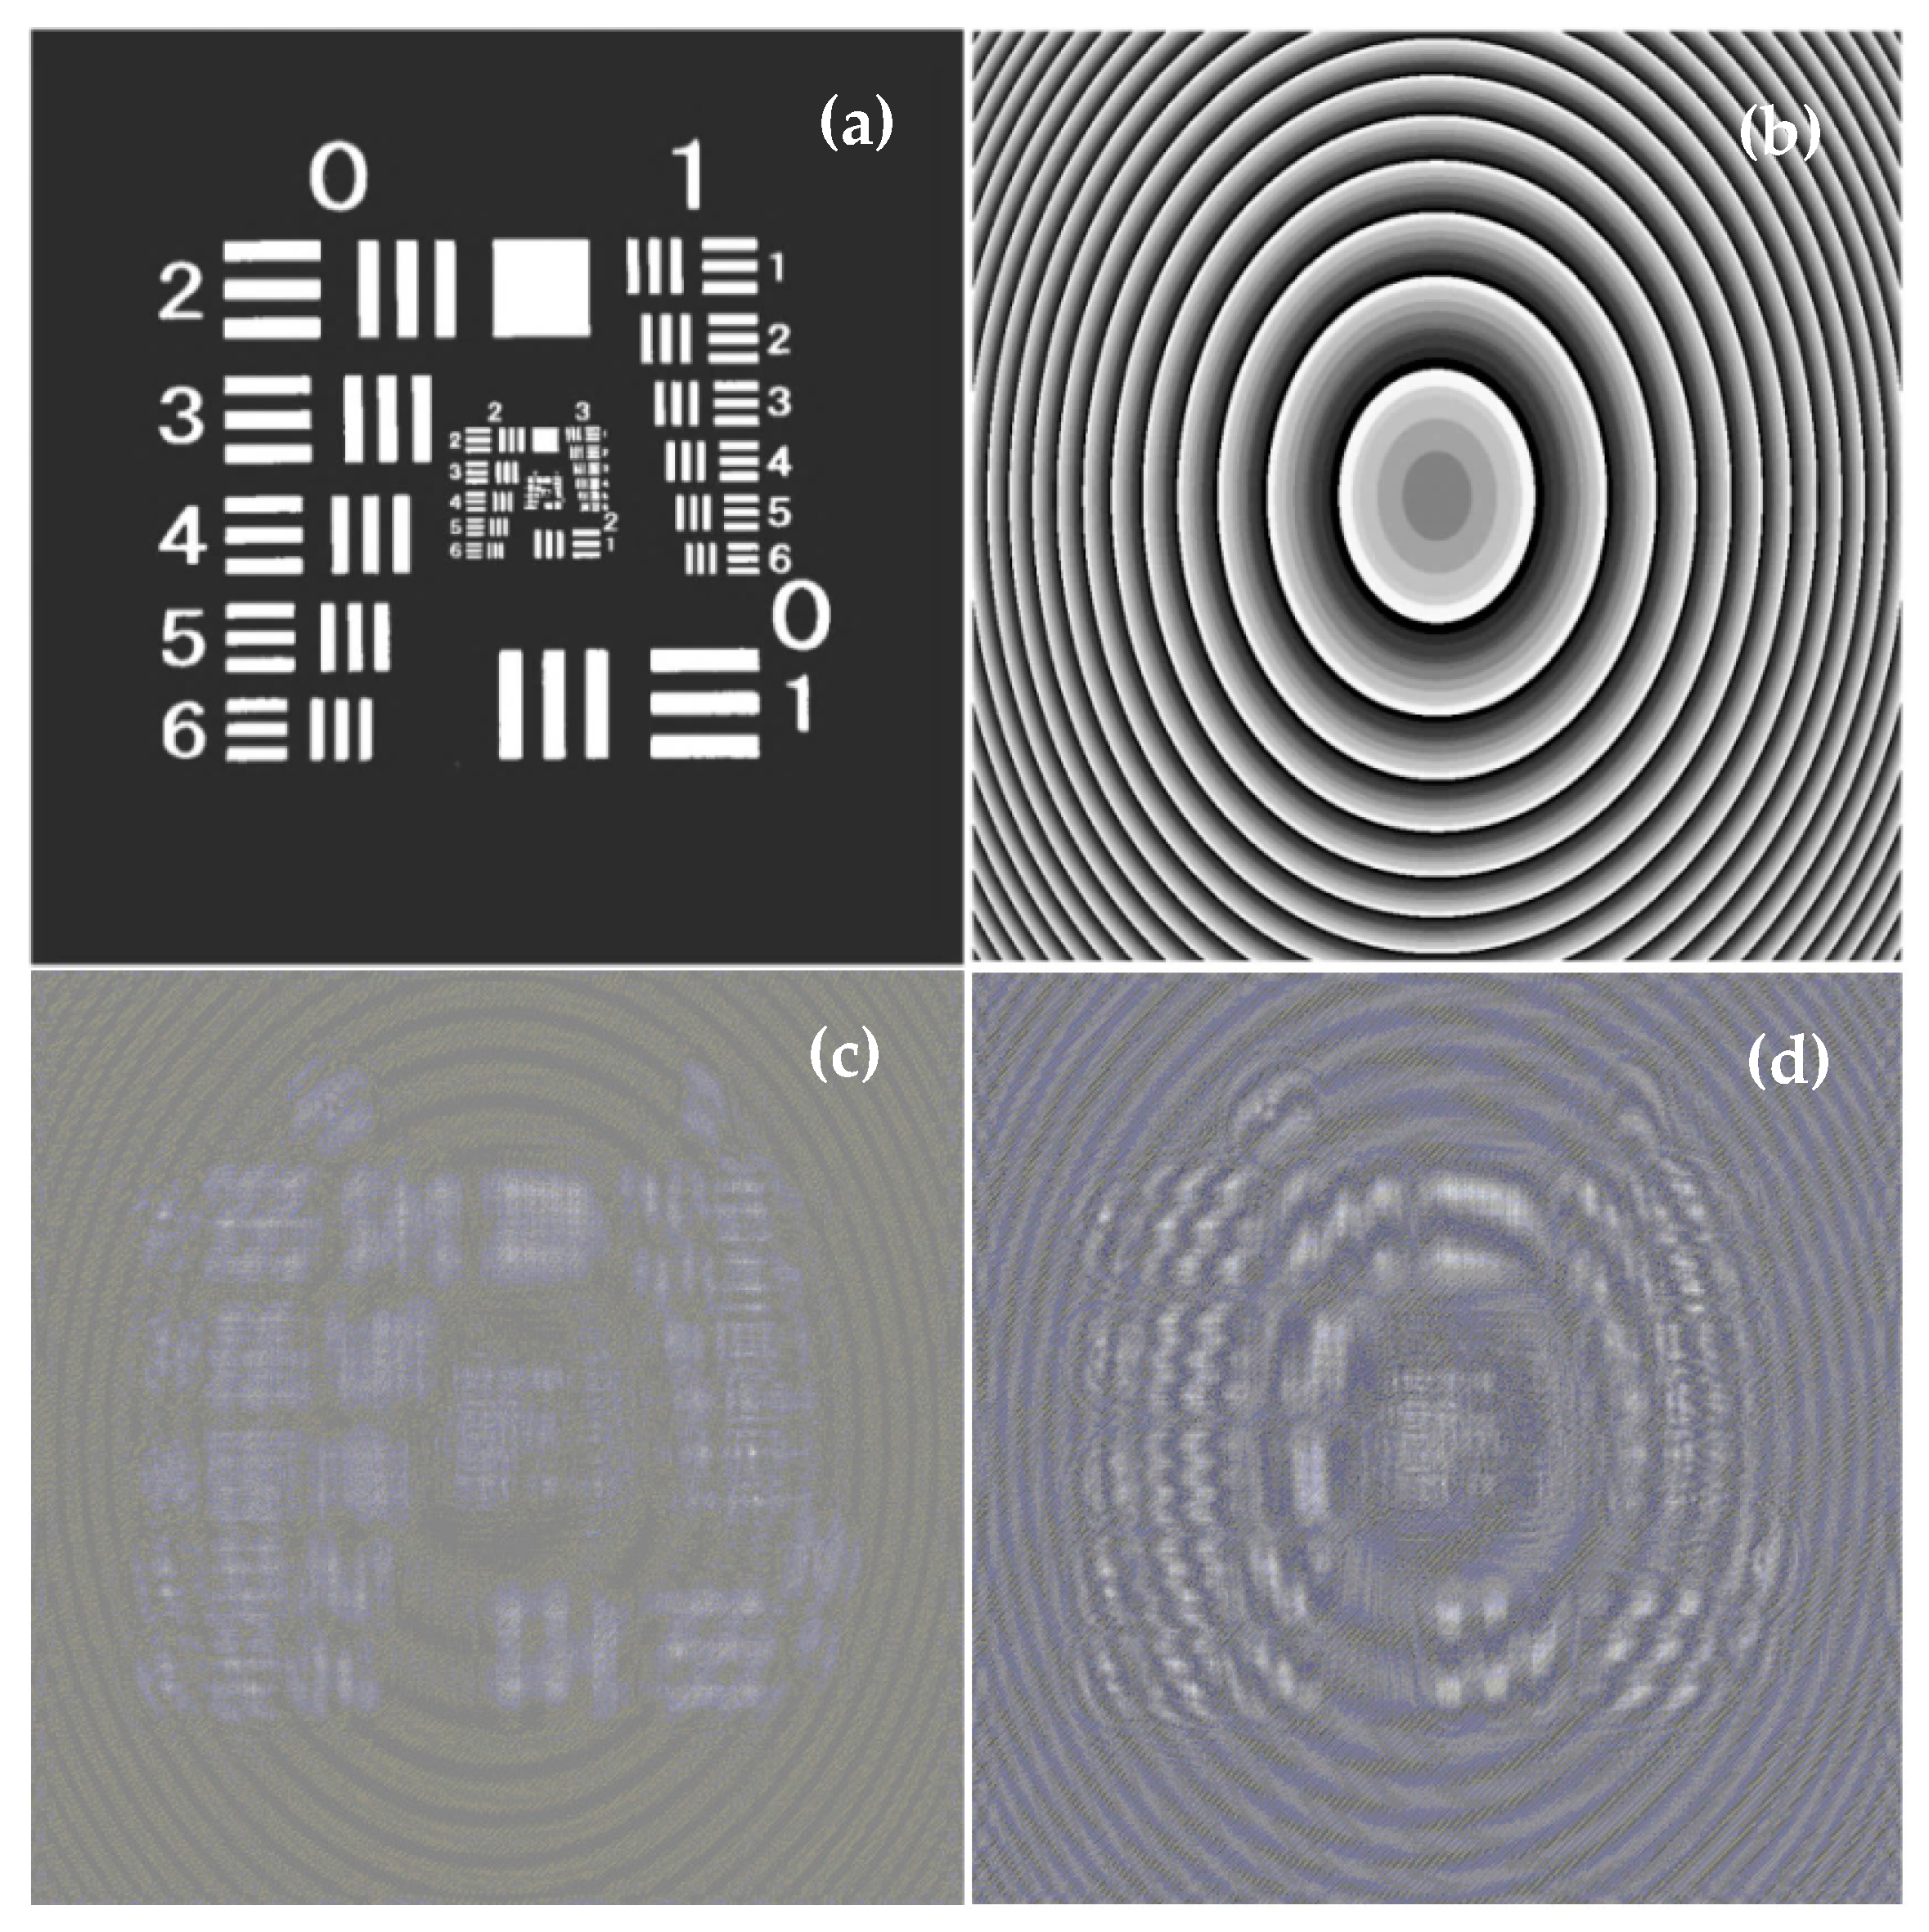
Several sets of numerical simulations are carried out by the software Matlab on a personal computer to investigate the applicability of the proposed method. The recording setup is illustrated in Figure 2. The three illuminating beams are all plane wave filtered and expanded from a laser source with 532 nm wavelength. In the original object plane Po, the picture of a resolution target in Figure 3a is used as the intensity of the object wave. To simulate a transparent sample, the dark area of the resolution target figure has a transmittance of 20%. In these numerical simulations, different elliptical equations controlled by two parameters R1 and R2 were employed as the phase of the transmitting objects (Figure 3b). We set the phase distribution on the original object plane Po, as
The object wave O(x, y) in the recording plane PH is generated by the two-dimensional Fresnel diffraction on the complex amplitude in plane Po. The plane wave O1(x, y) is an on-axis plane wave with the amplitude of AO1 and the reference wave R is a tilt plane wave along both the x-axis and the y-axis with reference tilt angle of θx and θy correspondently. Mostly, the intensity of AO1 is set smaller than that of the reference wave of Ar. The hologram is generated by three wave interference in computer. In these simulations, we set two TARW values as θx = 0.023 rad and θy = 0.023 rad, respectively, and we give only a few results with R1 = 1.5 m and R2 = 2.5 m as an example. It should be noted that the object in plane PO can be a resolution target with a PCM membrane attached or a spatial light modulator with the intensity and phase signals modulated by computers so that the object wave in plane PO has a complex value.
In the simulation setup in Figure 2, there are 1690 × 1690 pixels with 5 µm × 5 µm size on the CCD working chip and the recording distance is set as z = 79.4173 mm (all the parameters used satisfy the requirement of the sampling theory to avoid aliasing problem [4]). The holograms are computer generated by interference of three waves as Equation (4). Holograms from the three waves interference with AO1 = 0.1 Ar and AO1 = 0.5 Ar are shown in Figure 3c,d, respectively, where we can see that there are not only the hologram but also the fringes of the two plane wave interference. The straight fine stripes in Figure 3d are more obvious than that in Figure 3c because of the strong interference between the two plane waves. In fact, there are two sets of holograms in either Figure 3c or Figure 3d—on-axis hologram and off-axis hologram. The off-axis hologram contributes the information to the object wave; however, the on-axis part contributes only to zero order term and can be removed by spatial frequency filtering.
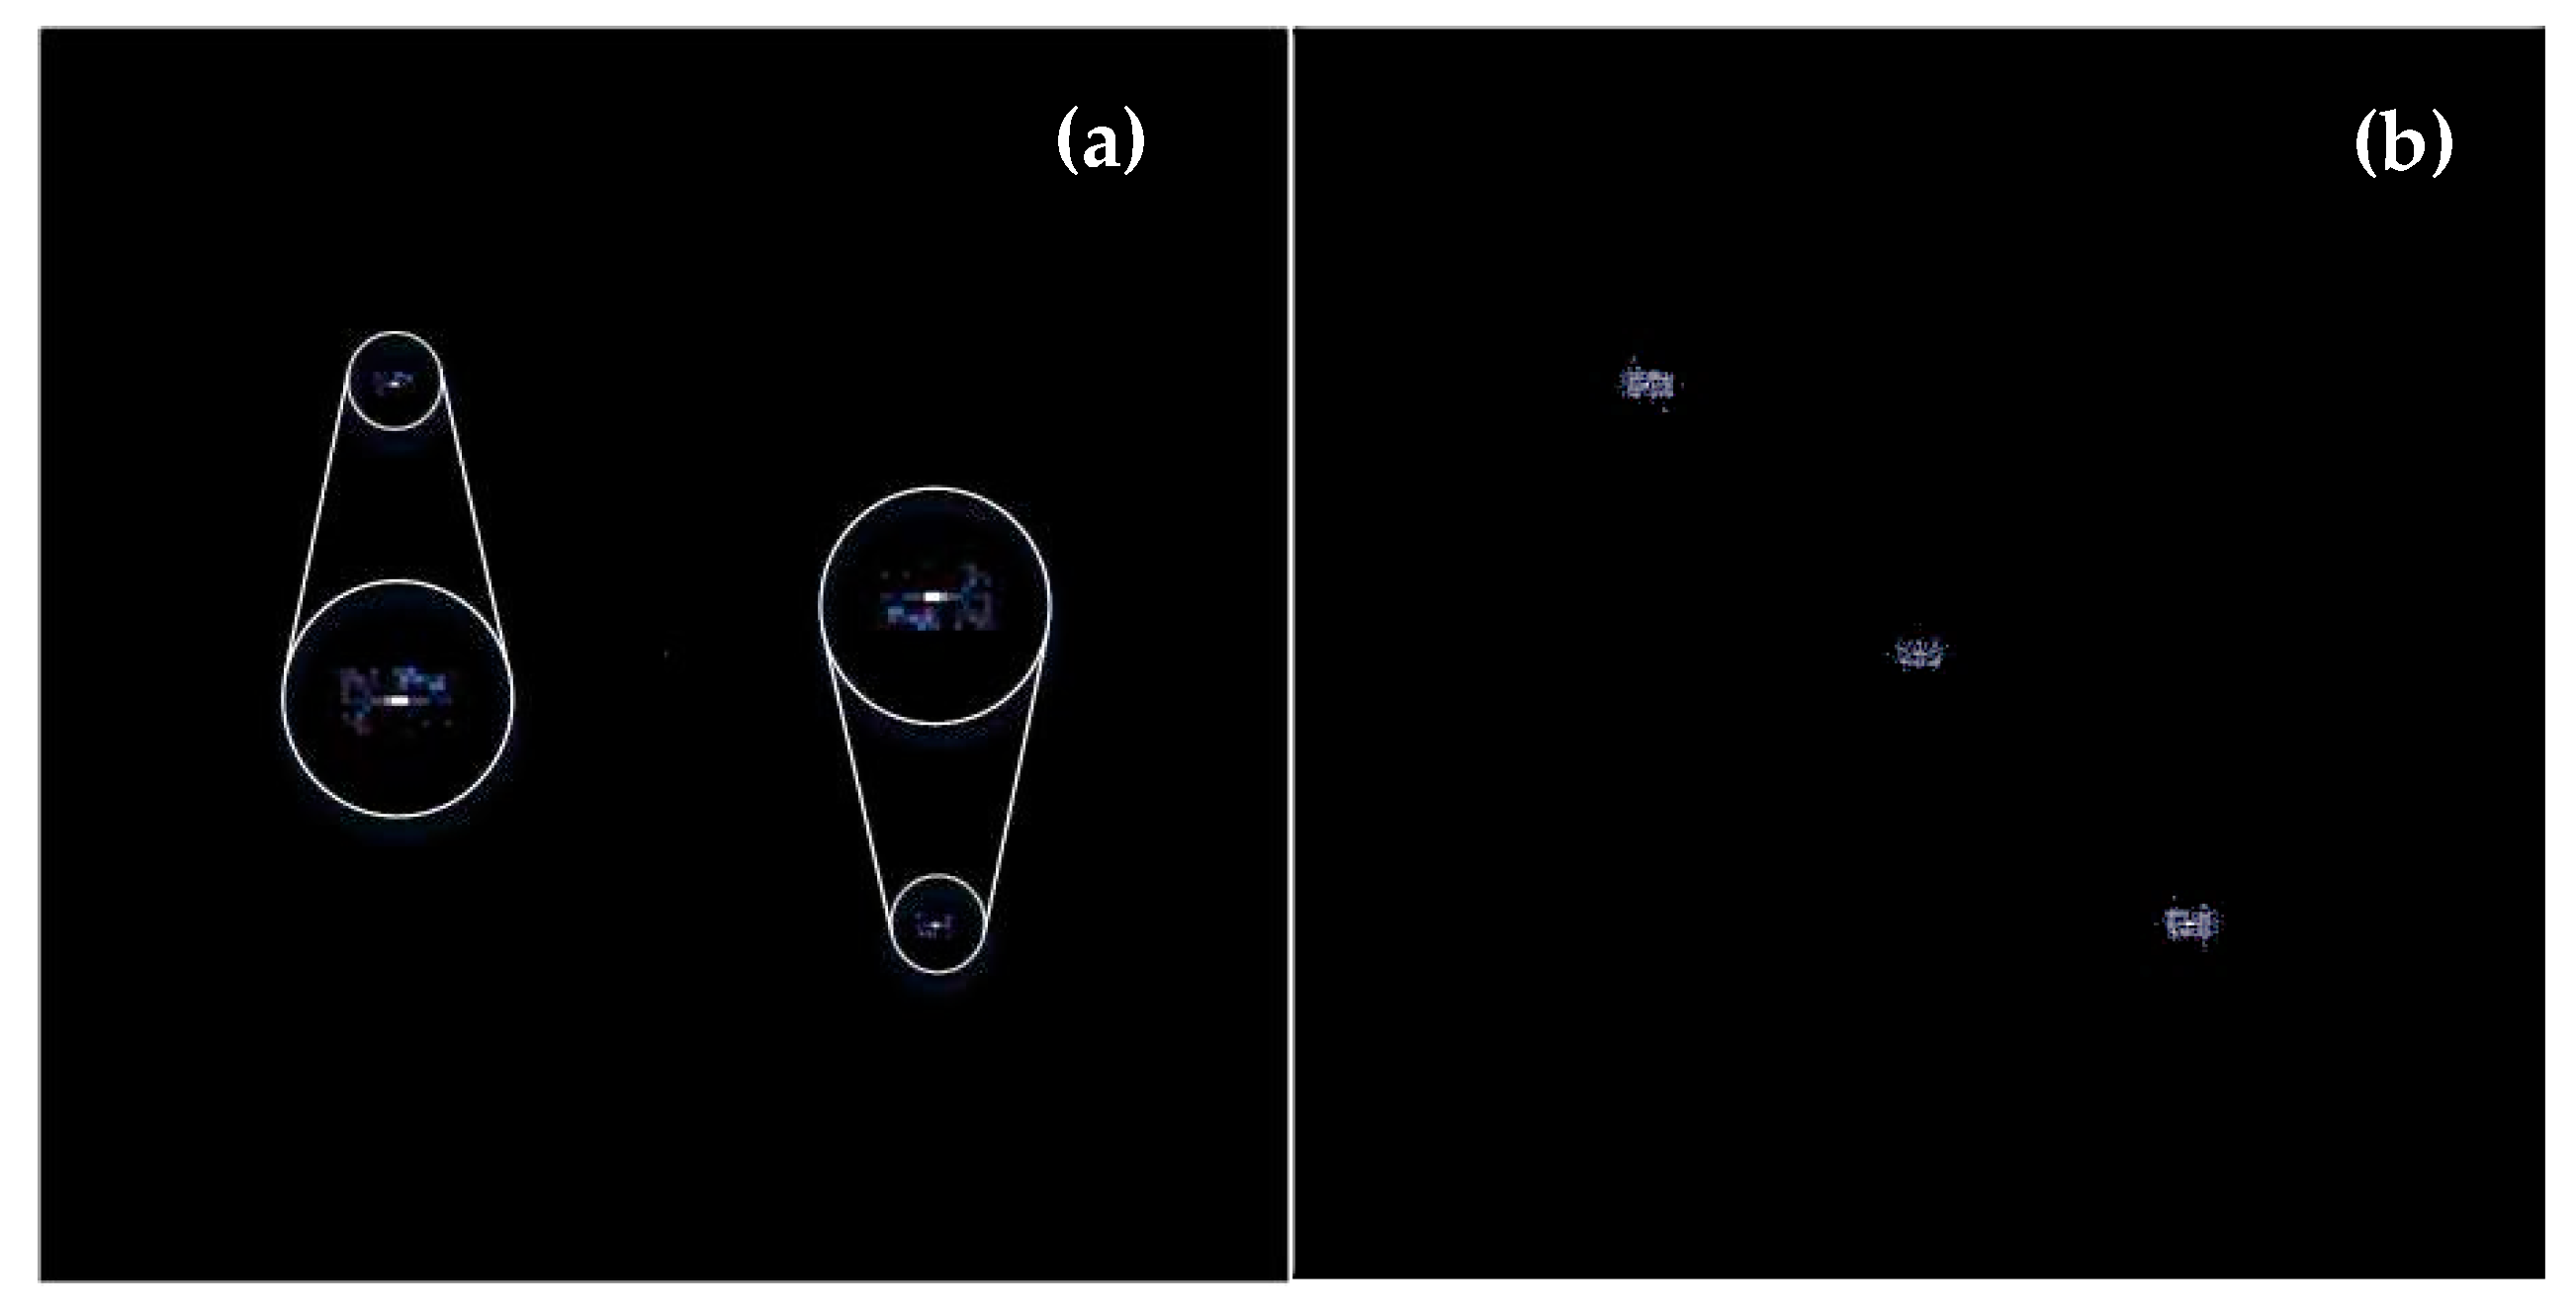
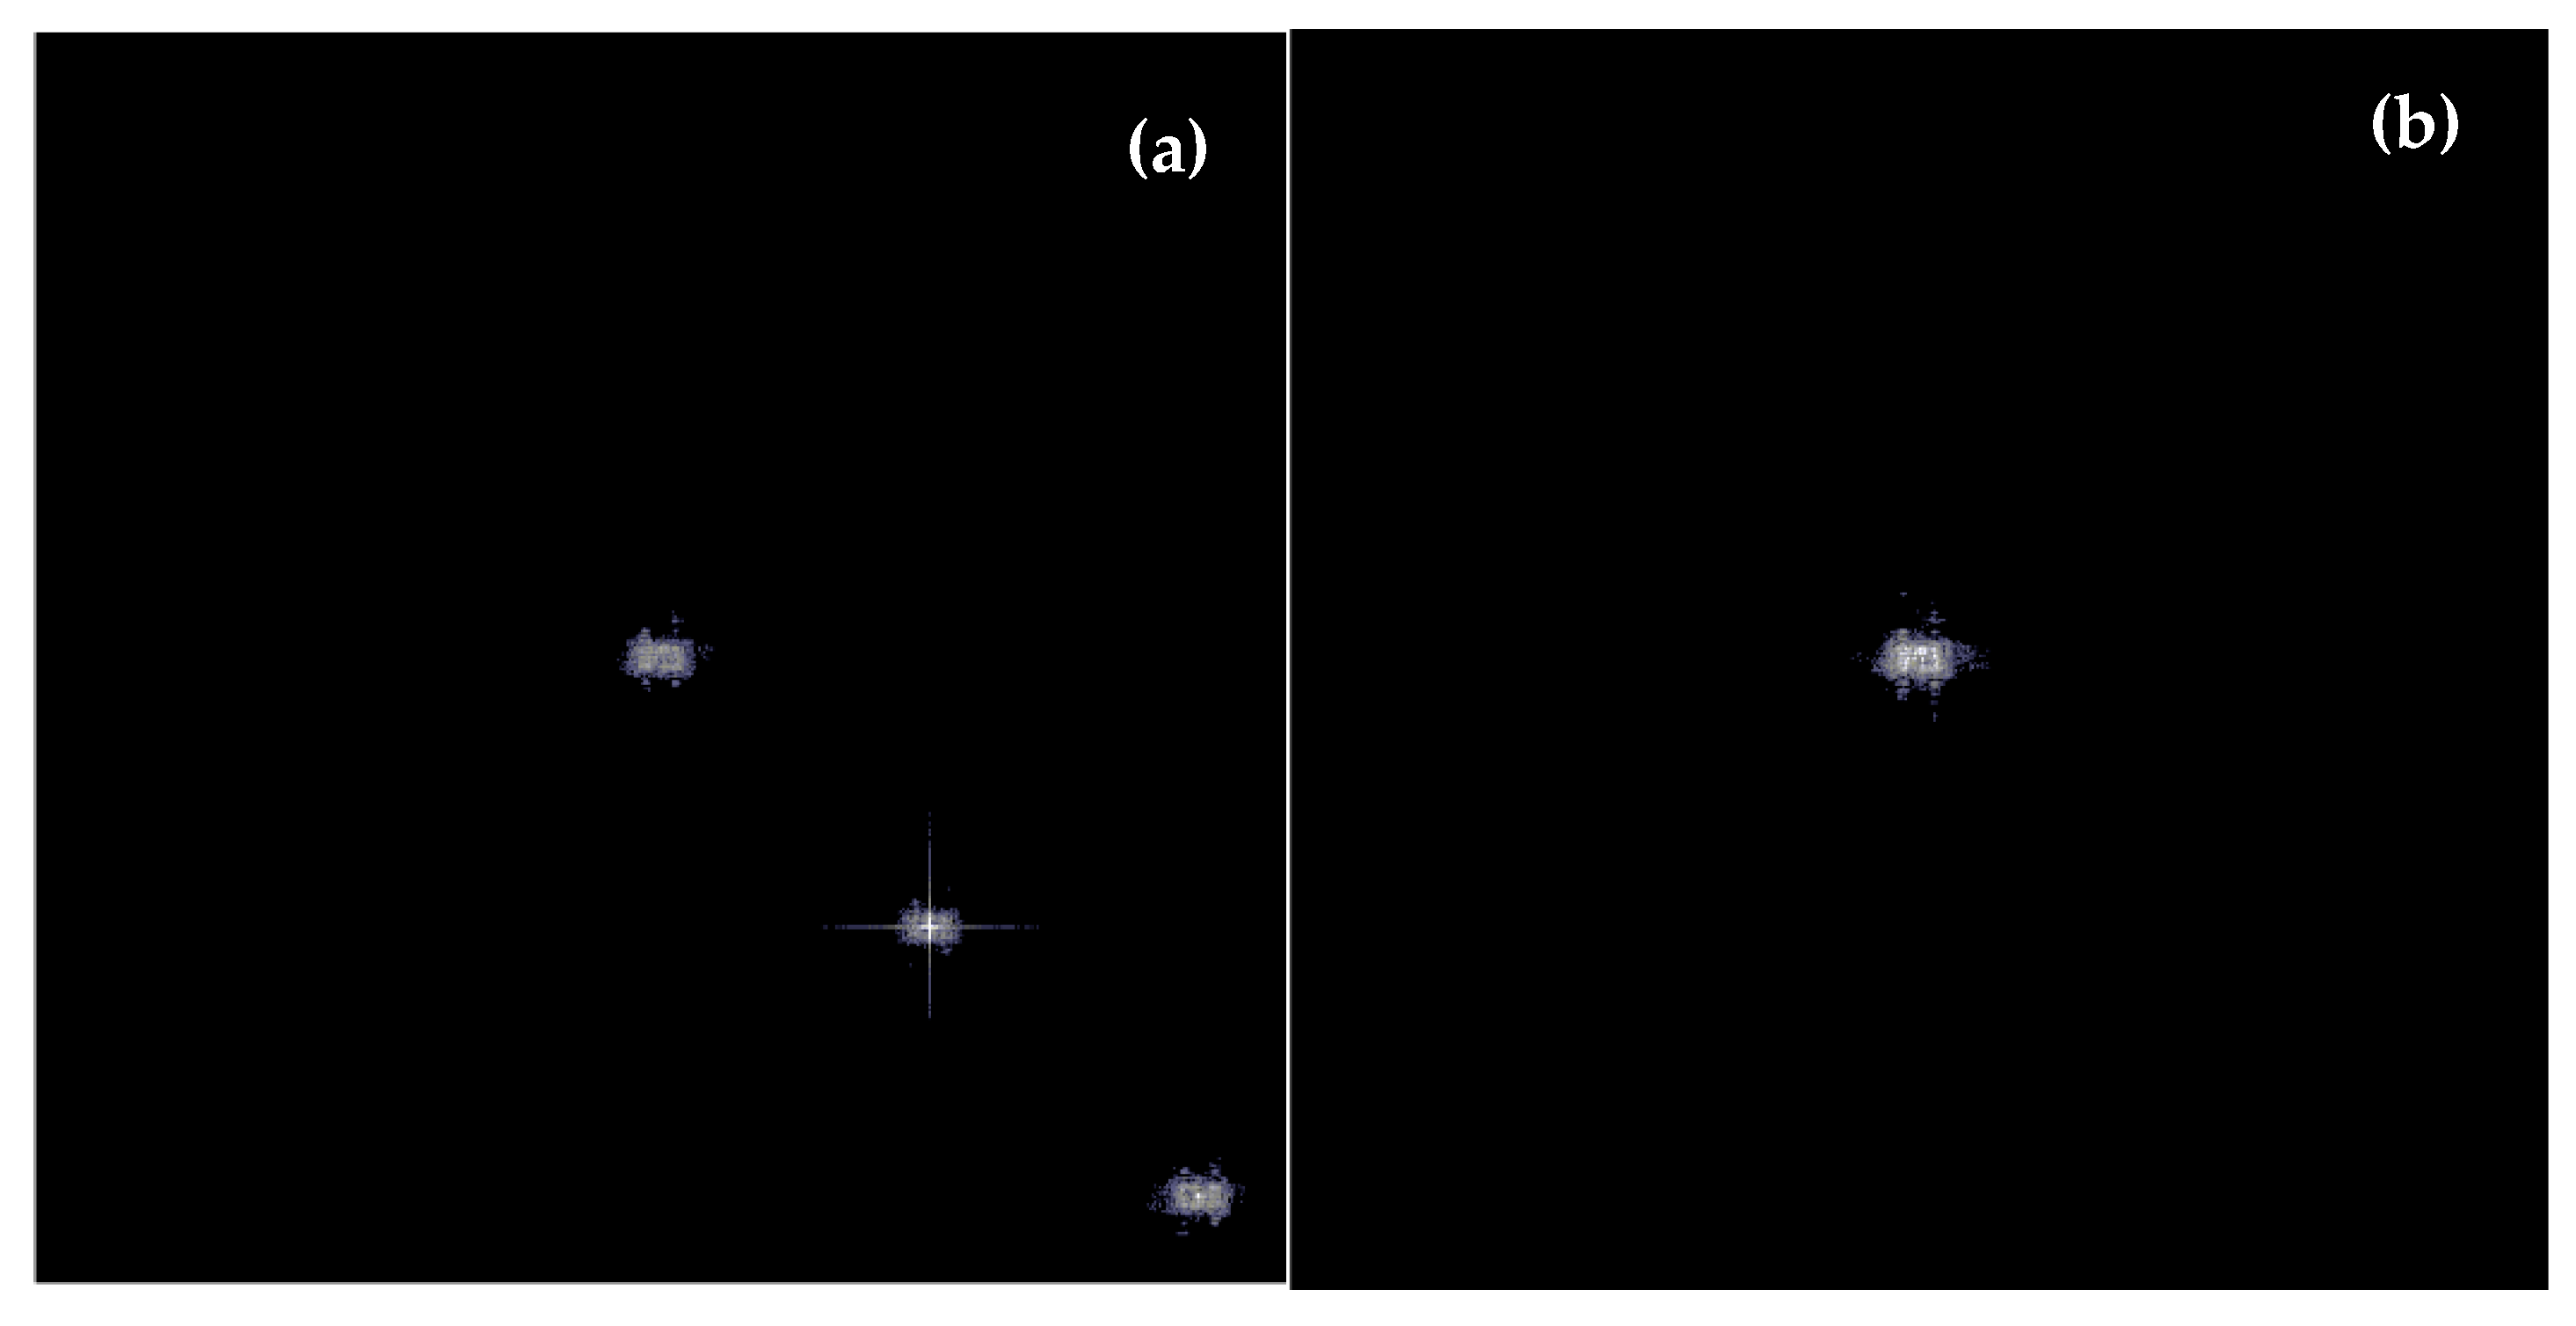
Fast Fourier Transform (FFT) operations on the interferogram I in Figure 3d are performed in computer and the intensity distributions of the Fourier domain spectra from this hologram are shown in Figure 4a. The values in the areas of zero frequency have been decreased for display purpose and the two points corresponding to the fourth term of Equation (6) are zoomed into the two circles, respectively, for the convenience of observation. In Figure 4a, because the two points collect all the energy of the periodic distribution in Figure 3d, they are so bright that other spectra cannot appear correctly. To display other spectra, the two points are depressed in Figure 4b. The spectra from the on-axis part of the hologram are weaker than that from the off-axis hologram because AO1 is relatively small compared with Ar. The spectra from the object wave do not locate at the center area, but a place deviates symmetrically to the spectra area of its conjugate wave about the original point of the frequency plane because of the off-axis recording. The extreme values of the two point δ(u ± up. v ± vp) make it possible for us to find the exact coordinate of the spectra center by searching for the maximum absolute value of the spectrum in Fourier domain plane.
Searching for the maximum value of the spectrum intensity in Figure 4a, we gained the coordinates up = 362.5 and vp = 362.5. Substituting the coordinates up = 362.5, vp = 362.5, λ = 0.532 μm, the pixel size dx = dy = 5 μm, and the total pixel number M = N = 1690 into Equation (7), the TARWs of the reference wave in the x and y directions can be calculated, and the results are both approximately 1.3 degrees. The reference wave can be recovered by Equation (8) and the calculation results of sinθx and sinθy.
Another FT operation is carried out on the production RI and the intensity distribution of the spectra is shown in Figure 5a. The whole spectra group is shifted accordingly to the TARW because of the linear phase distribution of the recovered reference wave R. One lobe of the frequency spectra (corresponding to the object wave) is shifted to the center of the spatial frequency plane, which makes it possible to select this lobe and filter out other spectra. The intensity distribution of the spectra of the selected lobe is shown in Figure 5b.
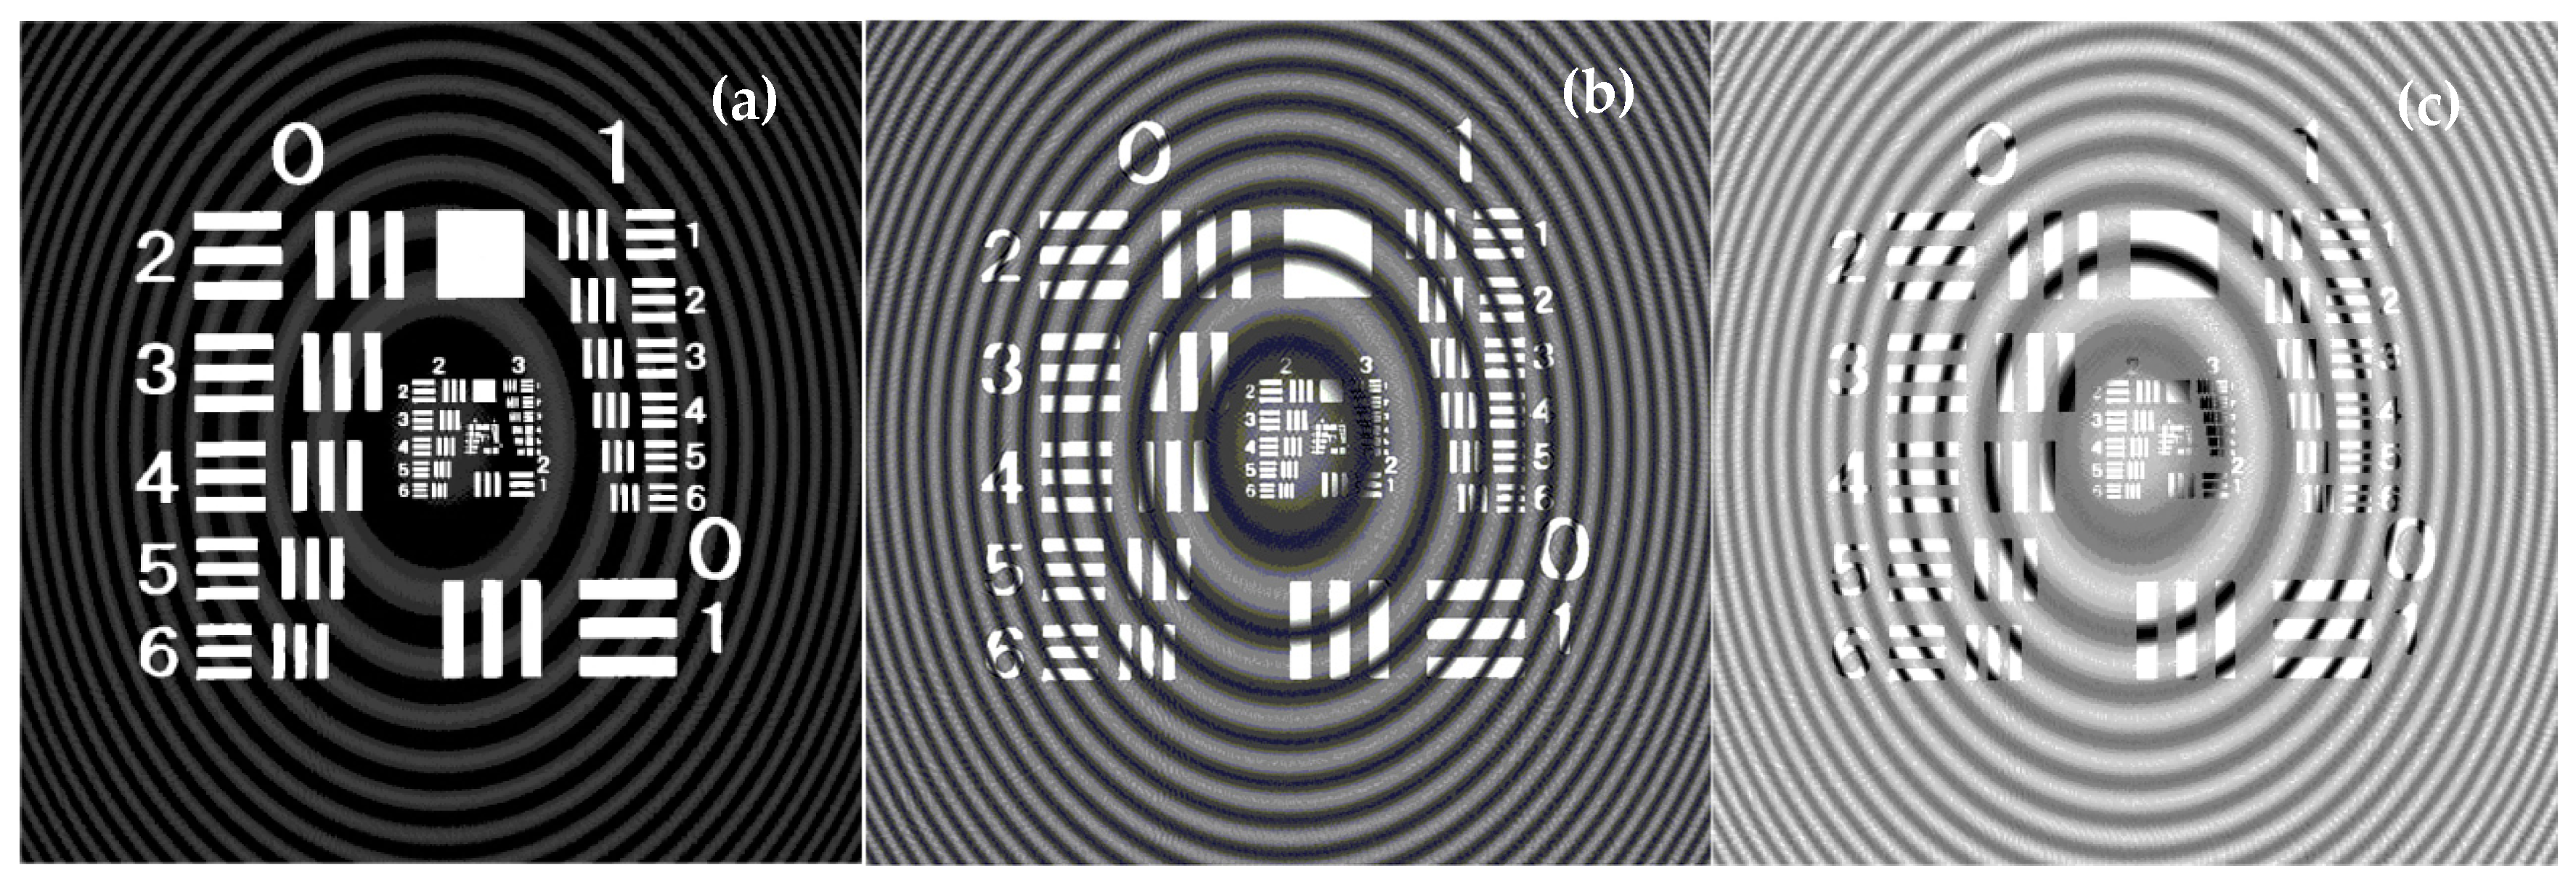
Wave front O is retrieved by using Equation (9) and the reference R with the tilt angles of about θx = 0.023 rad and θy = 0.023 rad. Then, the object image can be displayed after the inverse Fresnel diffraction is performed. It should be noted that, in the spectrum lobe kept at the center of the frequency plane, there still exists one delta function of δ(u, v) in Figure 5b. These spectra come from the fourth term of Equation (6) and always add unwanted effects on the hologram display. The larger the AO1, there is the more serious bad effect on the image display. To investigate the bad effect of them, three cases with AO1 = 0.1 Ar, AO1 = 0.3 Ar, and AO1 = 0.5 Ar are introduced in our investigation. The display results are described in Figure 6a–c, respectively. Naturally, when AO1 = 0.1Ar is used in Figure 6a, the impact of the δ(u, v) spectra is little and the transparent area in resolution target image is acceptable. However, for the cases of AO1 = 0.3 Ar, AO1 = 0.5 Ar, and other cases with even larger AO1, the bad impacts are serious and the displayed image in Figure 6b,c are unacceptable. To eliminate the negative impact, these spectra of δ(u, v) in Figure 5b are filtered out by improving the window function.
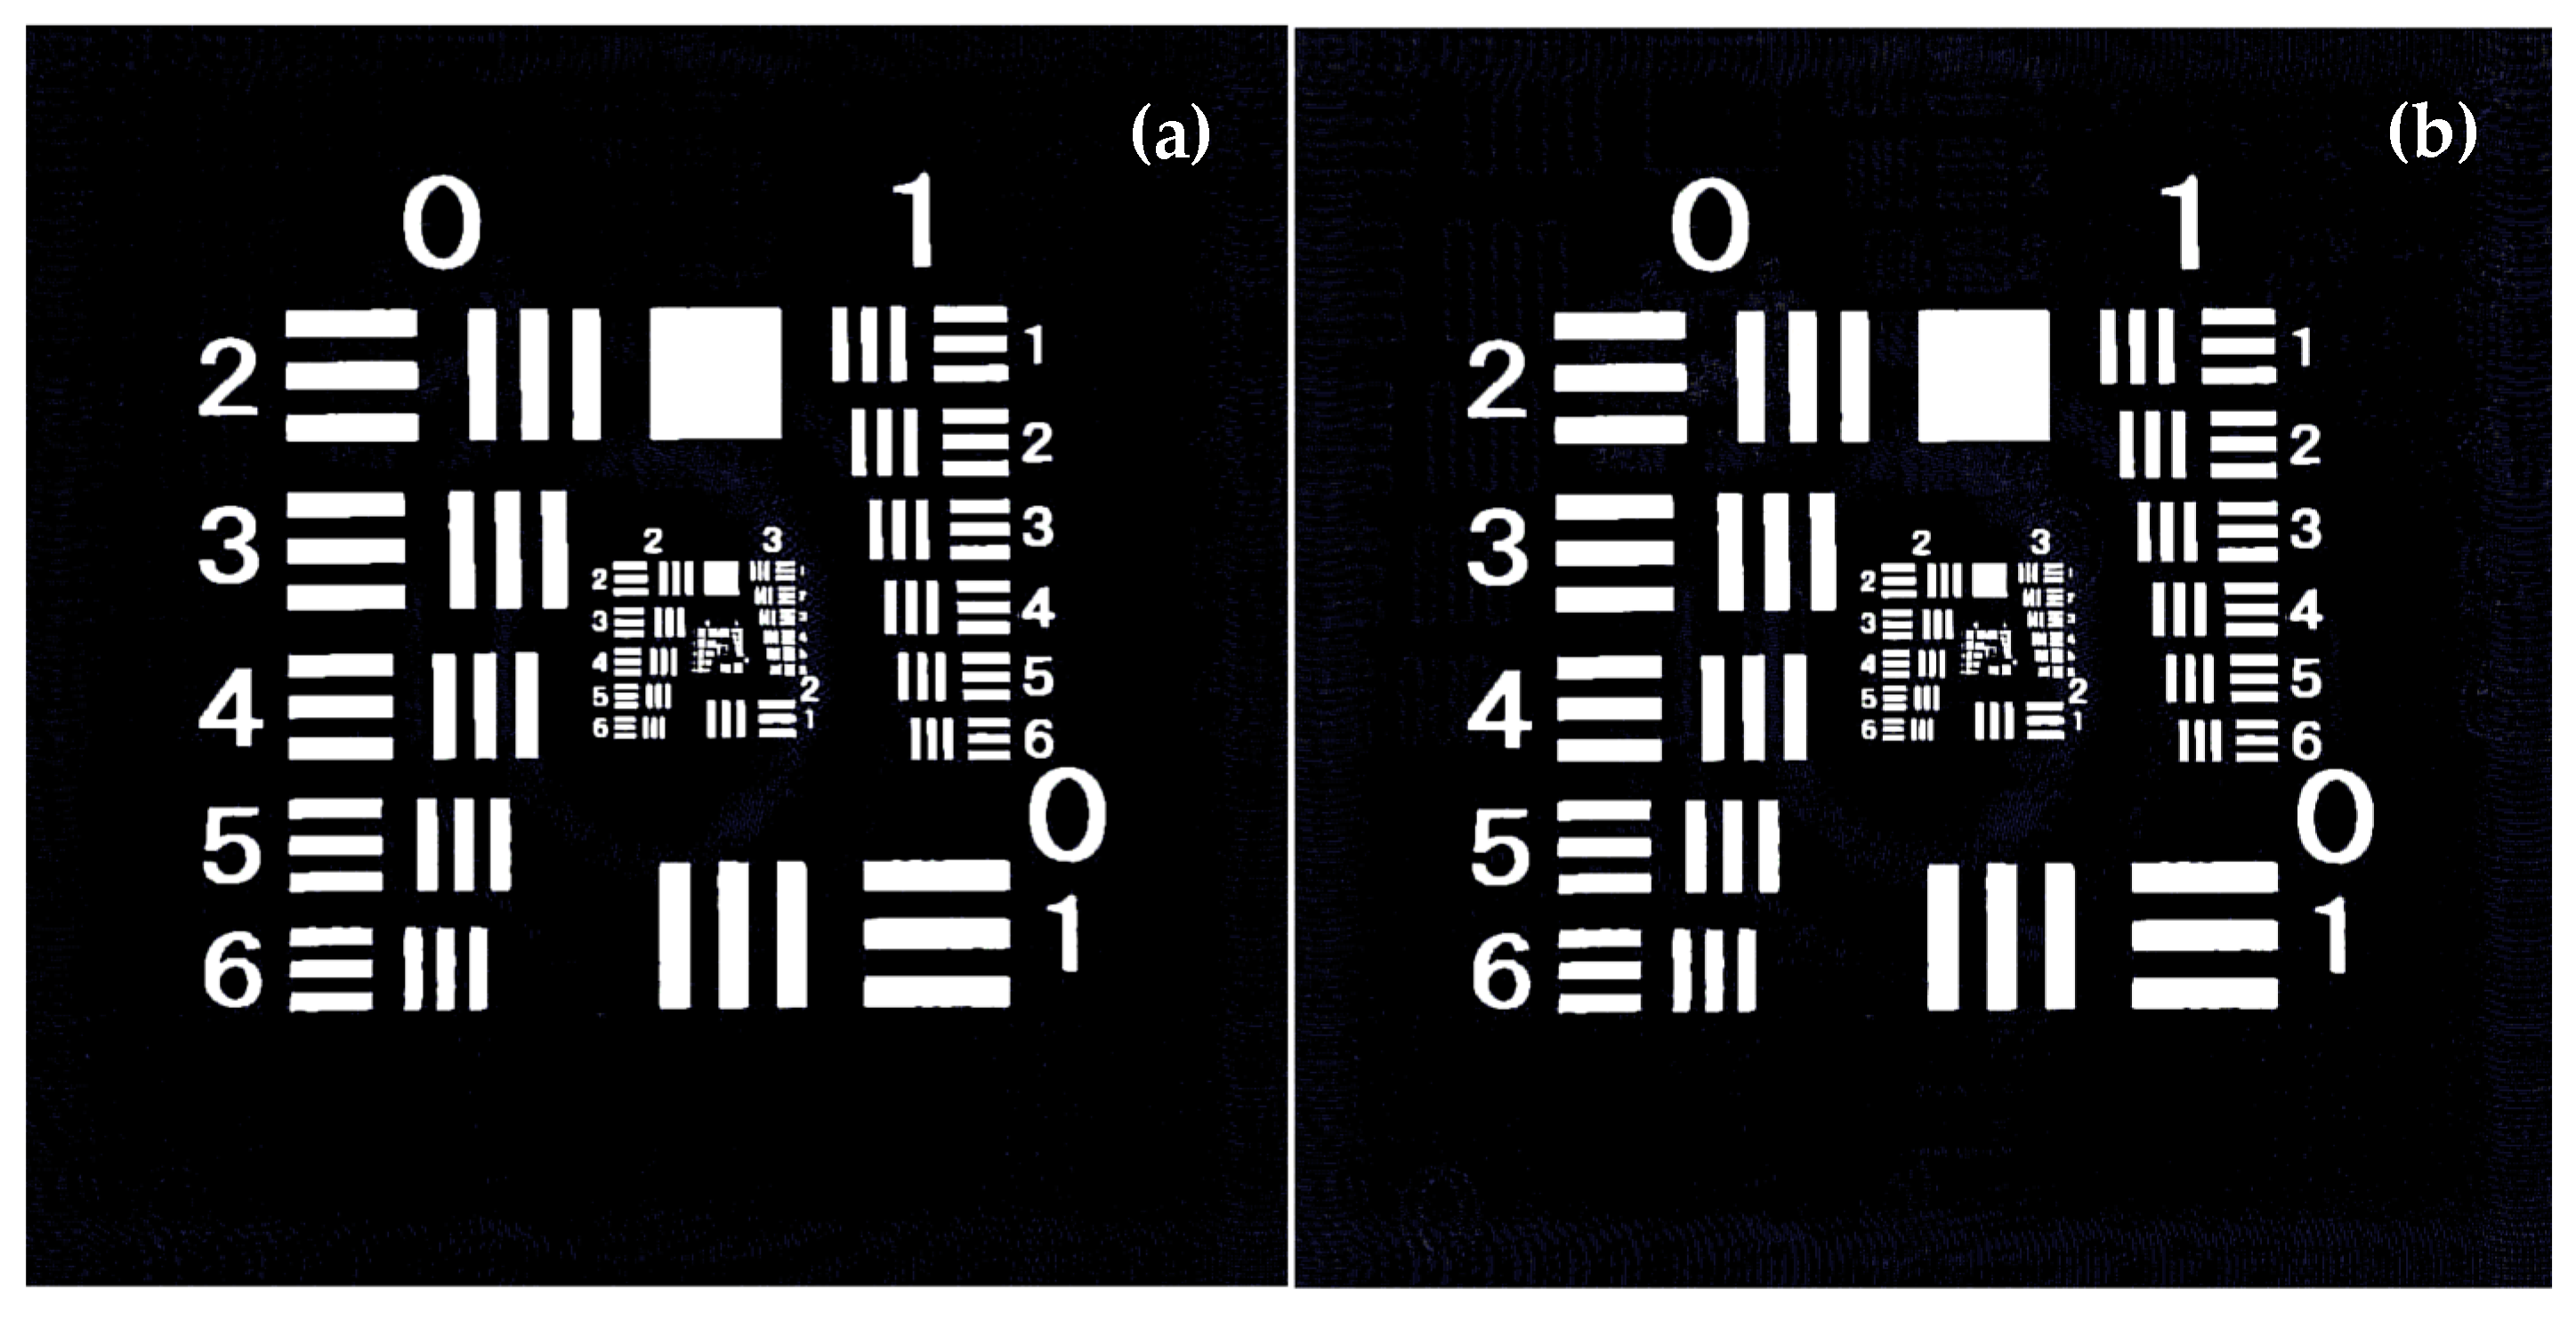
Another problem should be mentioned too. With the enlarging of AO1, the on-axis hologram takes a large proportion of energy, which incurs the disturbance on the hologram display accordingly. The test results from four different cases with AO1 = 0.5 Ar, AO1 = 1 Ar, AO1 = 2 Ar, and AO1 = 3 Ar are listed in the figures from Figure 7a–d, respectively. There is almost no defect in Figure 7a, but when AO1 becomes larger as 0.5 Ar, the disturbance of the on-axis hologram grows. Especially when AO1 = 3 Ar, the quality of the displayed image degrades. Thus, during the recording process of this method, the amplitude of AO1 should be adjusted below Ar to ensure the quality of the displayed image.
A non-binary figure in Figure 8a is also employed as the object to test the performance of the method. Another phase distribution is used to make the object wave a complex value. Using a similar procedure as the first simulation case, the image is recovered and shown in Figure 8b. The brightness of the reconstructed image is lower than the original image of Figure 8a because of the energy loss in the process of spectra filtering. The two images of Figure 8a,b have almost no difference on the whole.
4. Optical Experiments
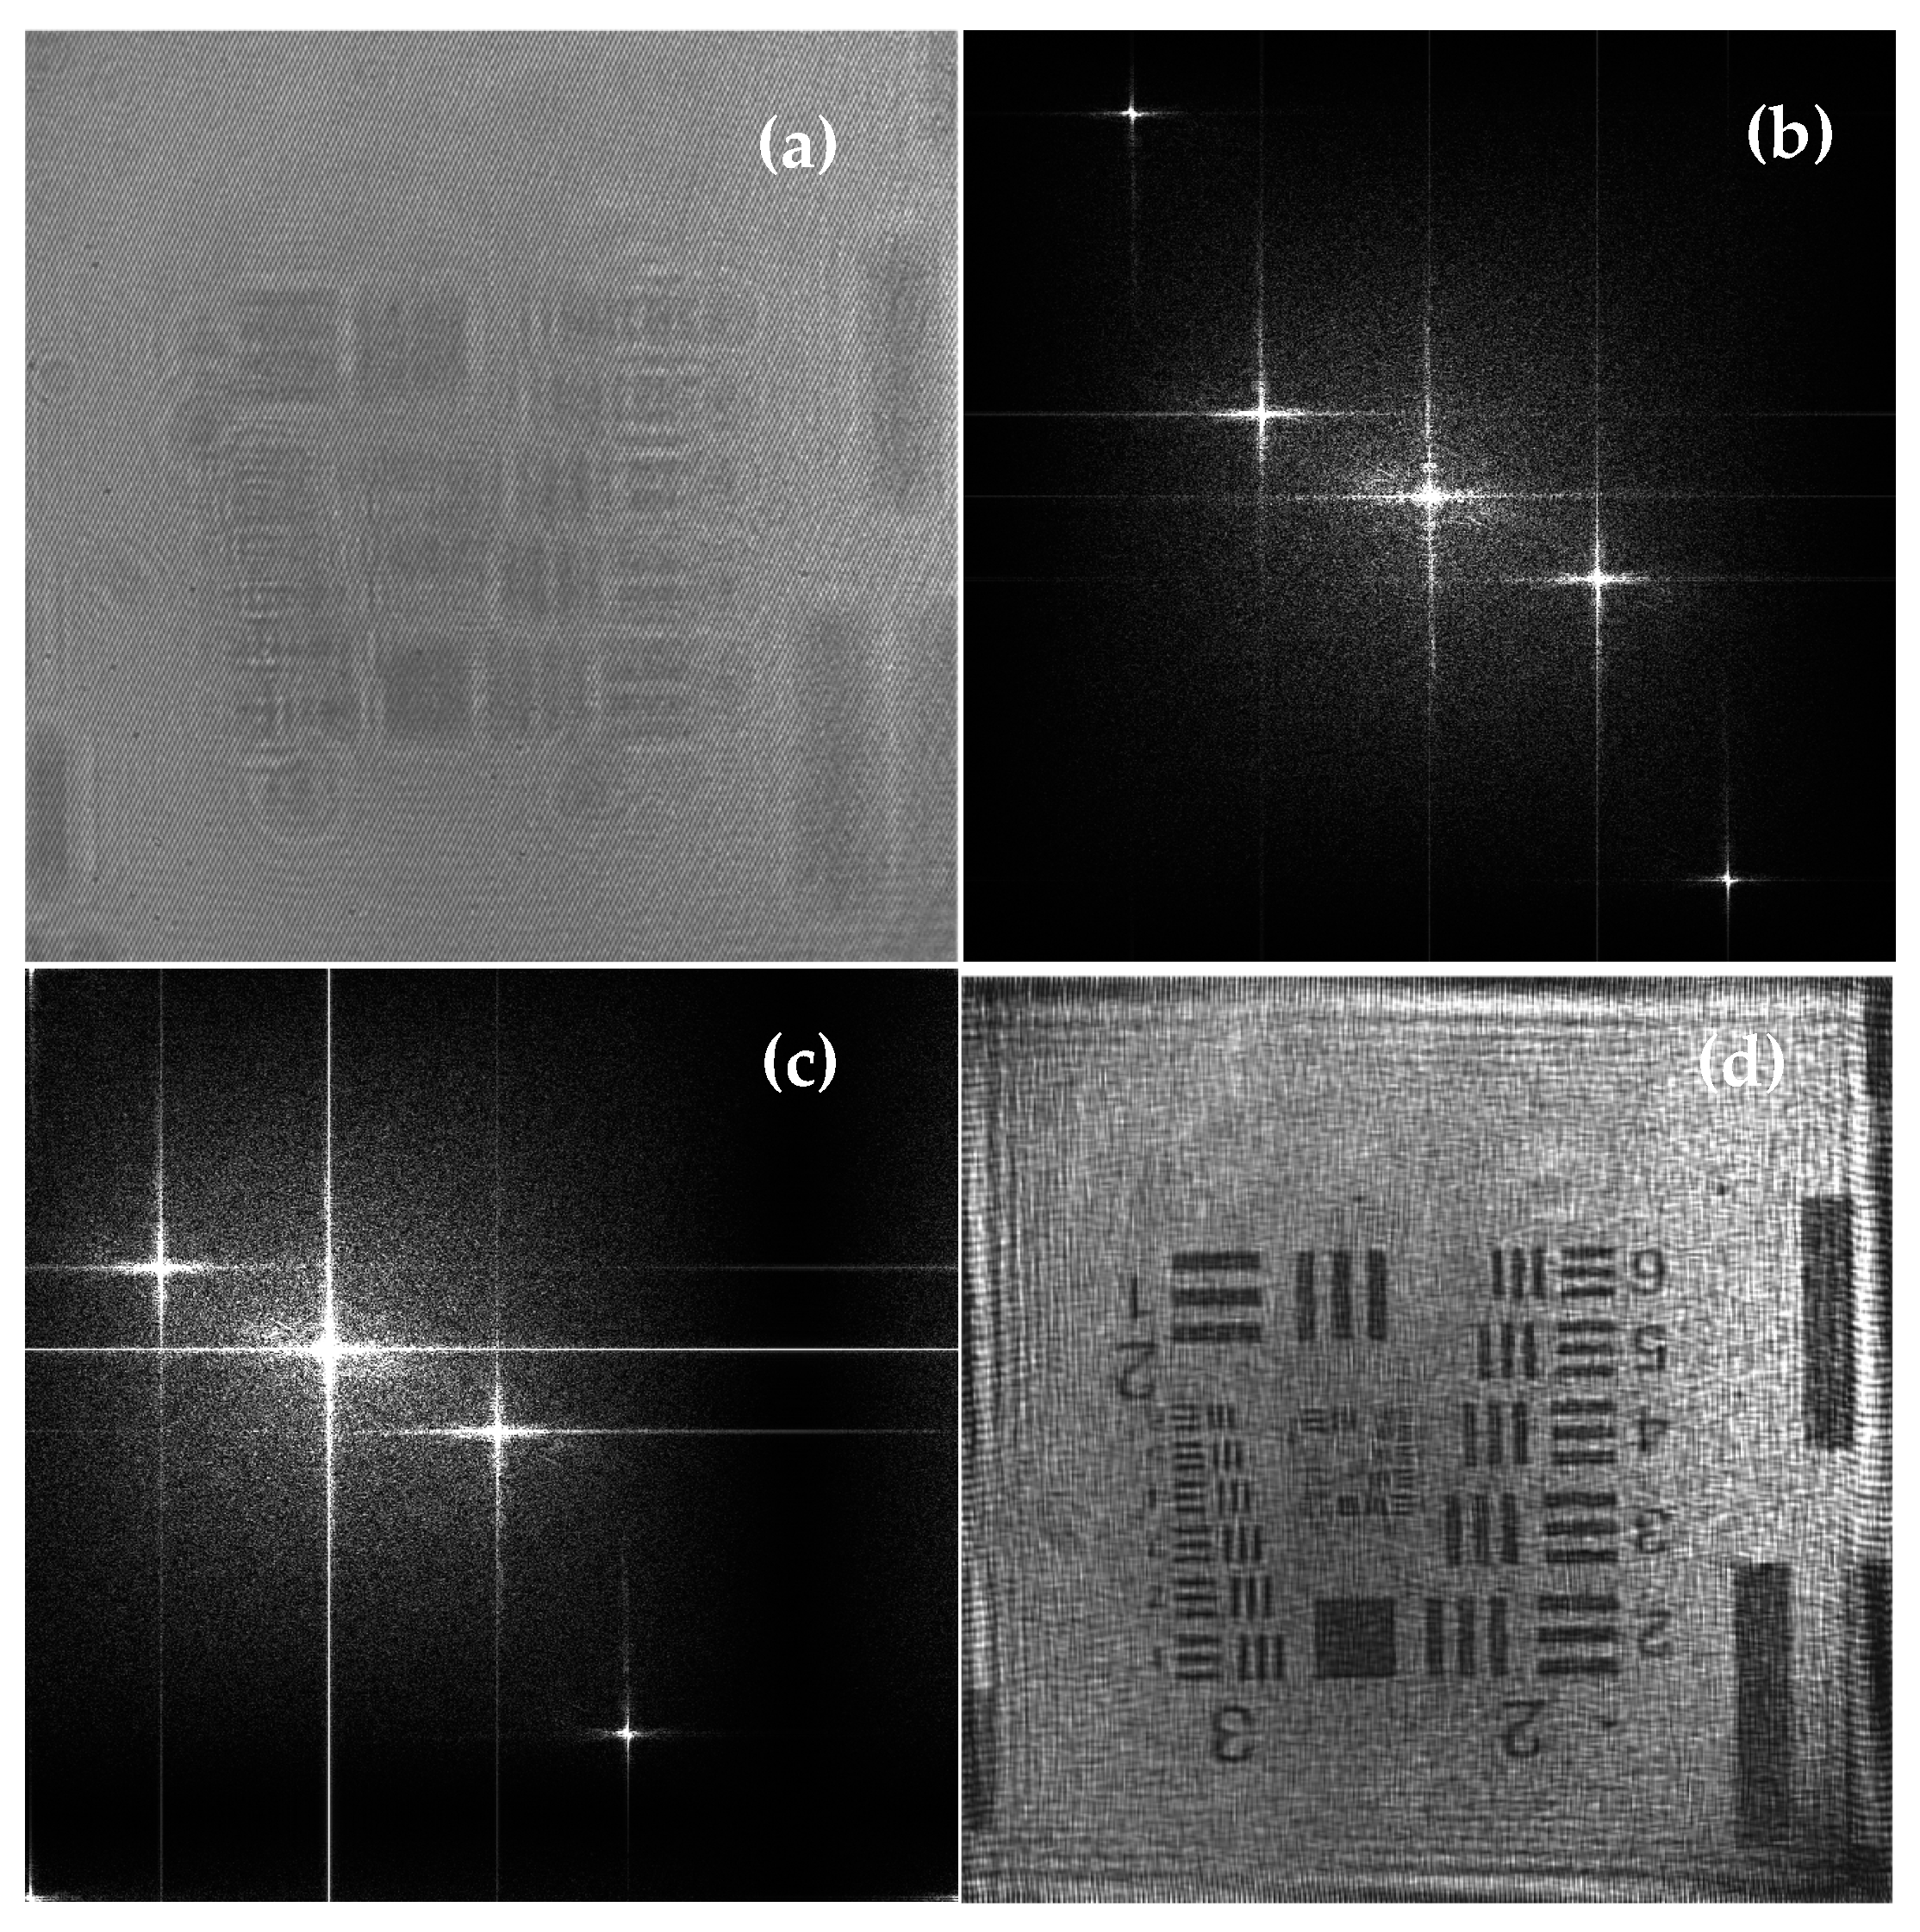
A series of optical experiments are carried out to investigate the proposed method further. The optical configuration has been represented in Figure 1. A resolution target (positive version) is used as the object and a laser source provide the illuminating wave of 532 nm wavelength. The recording chip of CCD has a 1536 × 1040 array with each pixel size of 6.45 μm × 6.45 μm. Only the central area of 1024 × 1024 pixels is used for recording.
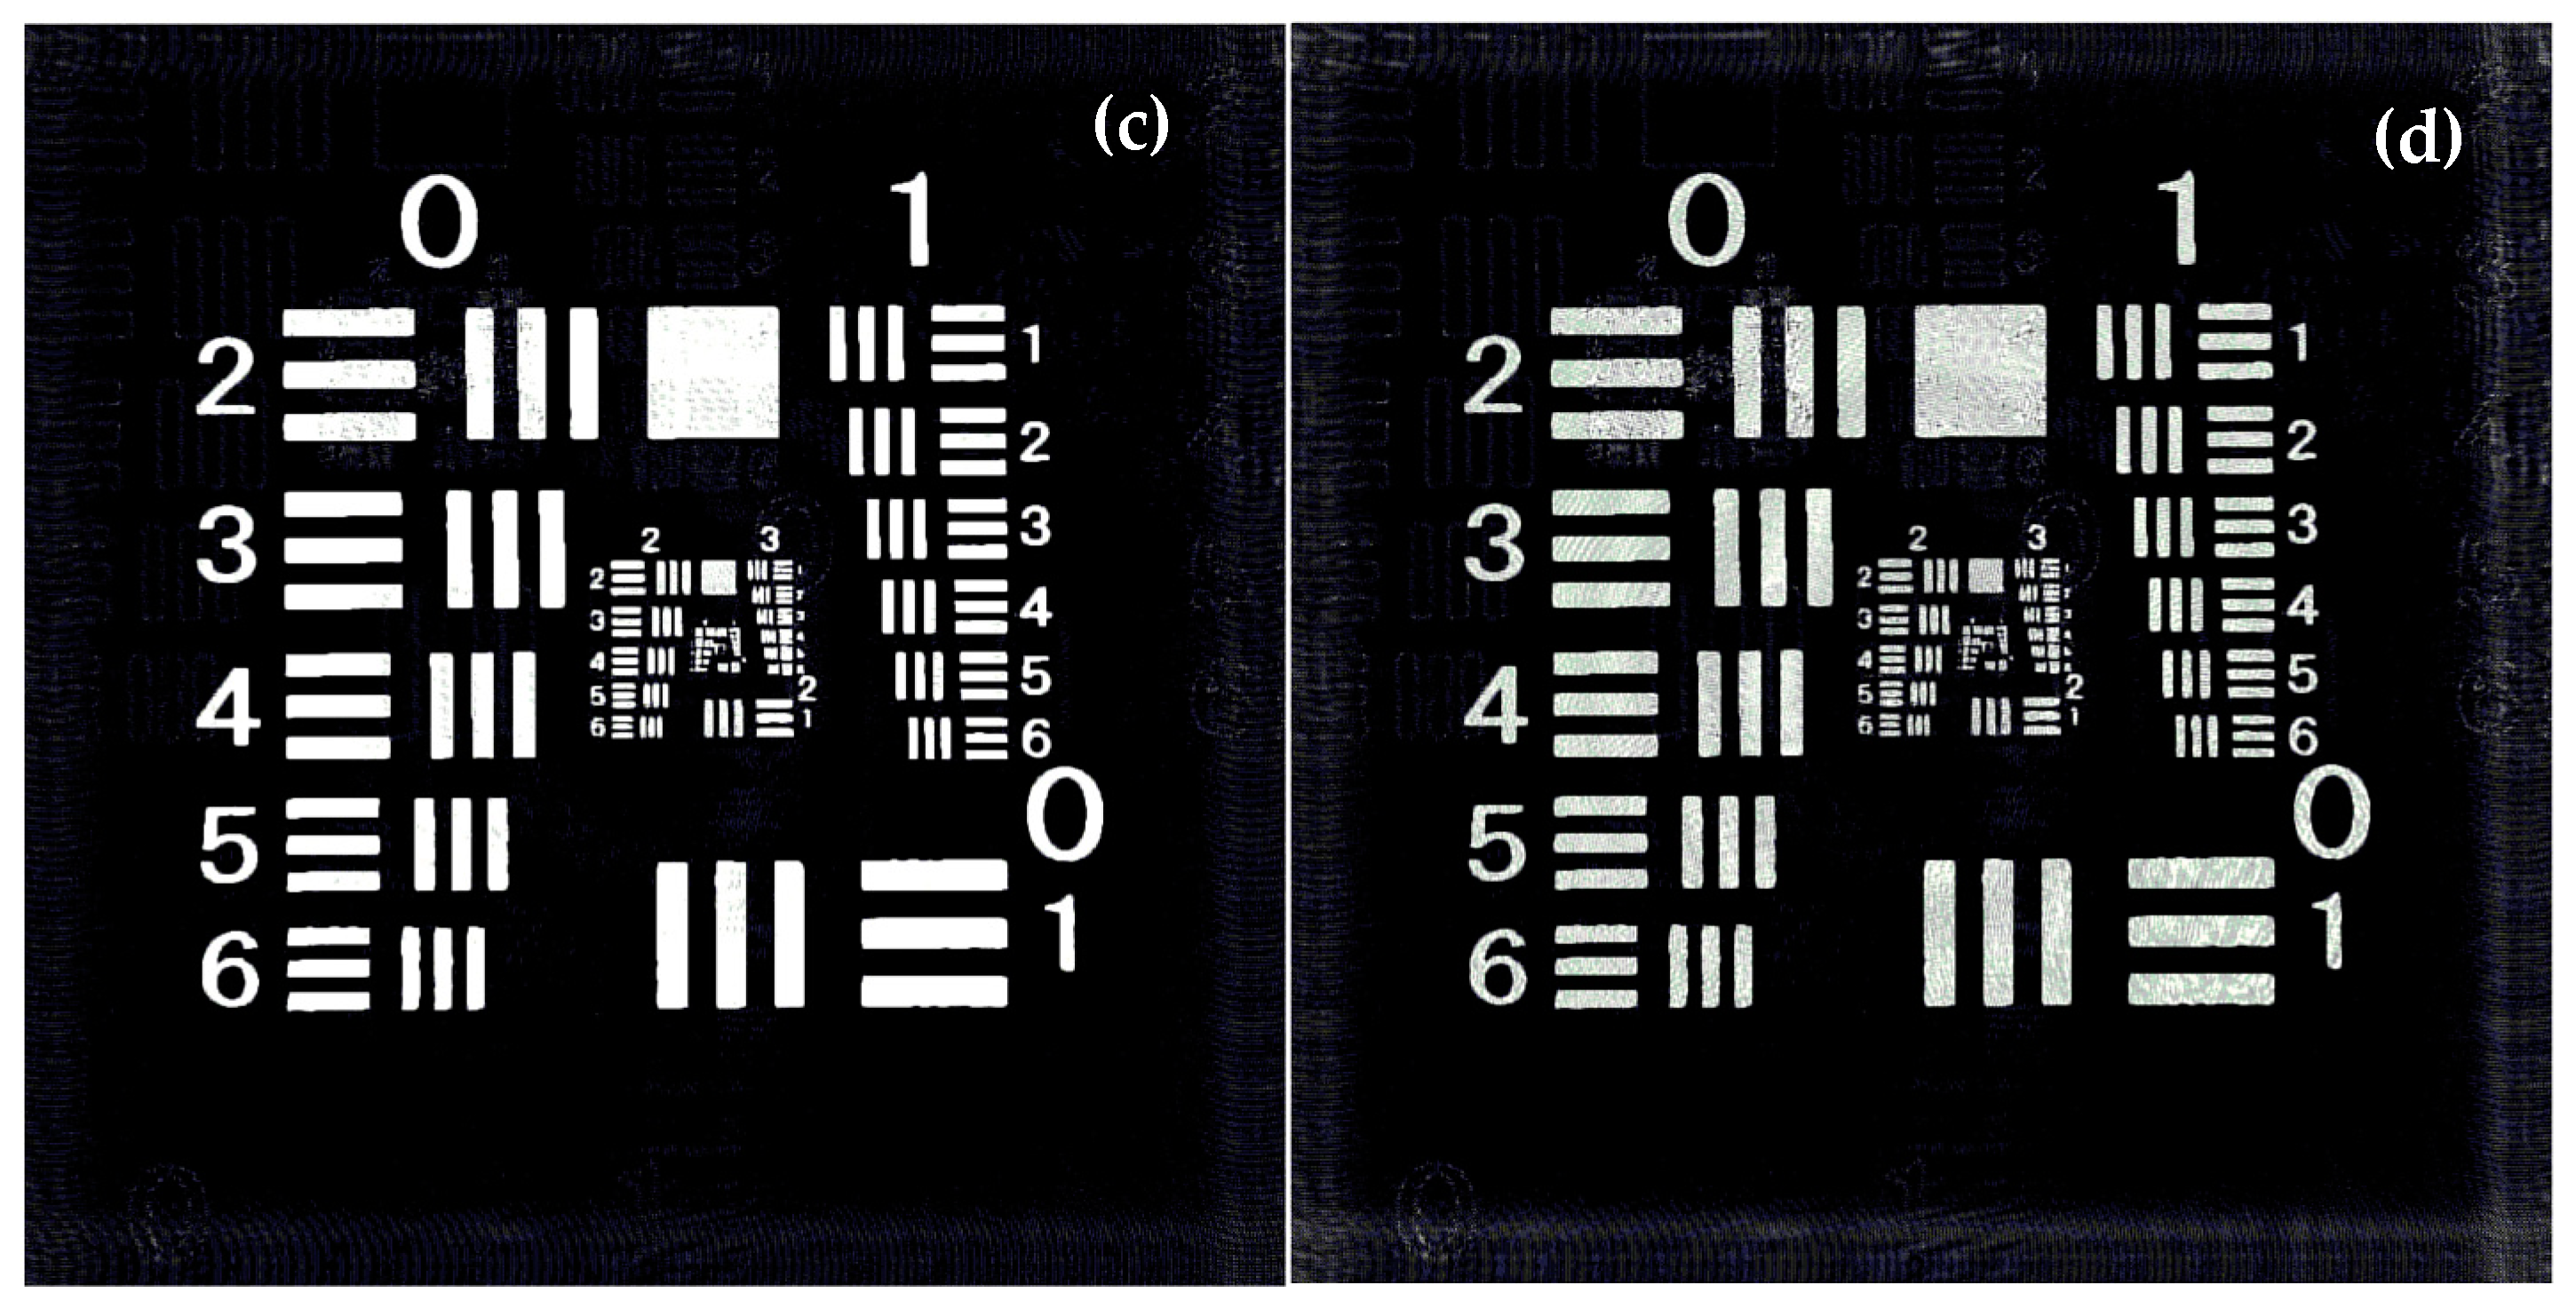
One of the recorded holograms is shown in Figure 9a where there are many regular fine stripes. FT operation is carried out in Figure 9a, and the spectra distribution is given in Figure 9b. Five bright areas in Figure 9b are negative second order spectra, negative first order spectra, zero order spectra, positive first order spectra, and positive second order spectra from the top corner left to lower right corner consequently. The coordinates of the center of the positive first order spectra are found as up = 184 pixel and vp = 89 pixel. Then, the reference tilt angles are calculated by using Equation (7), and the results are about θx = 0.015 rad and θy = 0.007 rad. Reference wave is reconstructed by Equation (8), and another FT operation is carried out by Equation (9) with the spectra distribution in Figure 9c. The whole spectra are shifted in Figure 9c after using the tilt reference wave so that the positive first order spectra are moved to the center of the spectrum plane. After choosing the positive first order spectra, the recovered image is achieved and shown in Figure 9d. The reconstructed image occupied the full field of view without the disturbances of the twin image and zero order term. The fact that the image recovered is displayed at the center of Figure 9d without any human operation shows the locating accuracy of the method here.
5. Conclusions
We have proposed a method of hologram multiplexing for the recording and reconstruction of the off-axis hologram. It is difficult to locate the object image exactly at the original place during the holography display without the TARW. This TARW is also especially important when this off-axis holography is used for the precise measurement. Storing this off-axis data is inconvenient in practice because this information is easy to lose or mismatch with the corresponding hologram. The major merit of this OADHM method is that the whole process of the hologram recording and display can be both done automatically without any human intervention so that it is suitable for continuous recording and display, even for hologram video recording and displaying. Compared to the previous work [16] using another CCD to record the TARW, only one hologram is needed to carry and extract the TARW and then realize the hologram display exactly by locating the image at the right place without using the other CCD or corresponding recording steps. The method needs only one single hologram to complete the recording and object image display without using other parameters, which improves the efficiency and accuracy of the off-axis holography. Especially, the location of the recovered image can be controlled by setting the phase of the reference R in Equation (9). This advantage may indicate the probable application in the prosperous technique of augmented reality since the image can be moved dynamically to the expected spatial positions. Series simulations and optical experiments have demonstrated the feasibility and efficiency of the proposed method. This method is also expected to be a possible approach for the coming of the prosperous dynamic true three-dimensional image recording and display.
Author Contributions
Conceptualization, X.X.; methodology, X.X.; software, X.X. and X.W.; validation, H.W.; formal analysis, X.X.; investigation, X.X.; resources, X.X.; data curation, X.W.; writing—original draft preparation, X.X. and X.W.; writing—review and editing, X.X. and X.W. All authors have read and agreed to the published version of the manuscript.
Funding
Natural Science Foundation of Shandong Province, China (ZR2019MD023) and Fundamental Research Funds for the Central Universities of China (15CX05033A).
Institutional Review Board Statement
Not applicable.
Informed Consent Statement
Not applicable.
Data Availability Statement
Not applicable.
Conflicts of Interest
The authors declare no conflict of interest.
References
- Leith, E.N.; Upatnieks, J. Reconstruction wavefront and communcation theory. J. Opt. Soc. A 1962, 52, 1123–1130. [Google Scholar] [CrossRef]
- Goodman, J.W.; Lawrence, R.W. Digital image formation from electronically detected holograms. Appl. Phys. Lett. 1967, 11, 77–79. [Google Scholar] [CrossRef]
- Schnars, U.; Jüptner, W. Direct recording of holograms by a CCD target and numerical reconstruction. Appl. Opt. 1994, 33, 179–181. [Google Scholar] [CrossRef] [PubMed]
- Poon, T.-C.; Liu, J.-P. Introduction to Modern Digital Holography with MATLAB; Cambridge University Press: Cambridge, MA, USA, 2014. [Google Scholar]
- Bruning, J.H.; Herriott, D.R.; Gallagher, J.E.; Rosenfeld, D.P.; White, A.D.; Brangaccio, D.J. Digital wavefront measuring interferometer for testing optical surfaces and lenses. Appl. Opt. 1974, 13, 2693–2703. [Google Scholar] [CrossRef] [PubMed]
- Yamaguchi, I.; Zhang, T. Phase-shifting digital holography. Opt. Lett. 1997, 22, 1268–1270. [Google Scholar] [CrossRef] [PubMed]
- Zhang, J.Y.Z.; Ren, Y.J.; Zhu, Q.; Lin, Z.Q. Phase-shifting lensless Fourier-transform holography with a Chinese Taiji lens. Opt. Lett. 2018, 43, 4085–4087. [Google Scholar] [CrossRef]
- Xu, X.F.; Ma, T.Y.; Jiao, Z.Y.; Xu, L.; Dai, D.J.; Qiao, F.L.; Poon, T.-C. Novel Generalized Three-Step Phase-Shifting Interferometry with a Slight-Tilt Reference. Appl. Sci. 2019, 9, 5015. [Google Scholar] [CrossRef] [Green Version]
- Cai, L.Z.; Liu, Q.; Yang, X.L. Generalized phase-shifting interferometry with arbitrary unknown phase steps for diffraction objects. Opt. Lett. 2004, 29, 183–185. [Google Scholar] [CrossRef] [PubMed]
- Xu, X.F.; Cai, L.Z.; Wang, Y.R.; Meng, X.F.; Sun, W.J.; Zhang, H.; Cheng, X.C.; Dong, G.Y.; Shen, X.X. Simple direct extraction of unknown phase shift and wavefront reconstruction in generalized phase-shifting interferometry: Algorithm and experiments. Opt. Lett. 2008, 33, 776–778. [Google Scholar] [CrossRef] [PubMed]
- Chen, L.; Singh, R.K.; Chen, Z.Y.; Pu, J.X. Phase shifting digital holography with the Hanbury Brown—Twiss approach. Opt. Lett. 2020, 45, 212–215. [Google Scholar] [CrossRef]
- Tahara, T.; Endo, Y. Multiwavelength-selective phase-shifting digital holography without mechanical scanning. Appl. Opt. 2019, 58, G218–G225. [Google Scholar] [CrossRef] [PubMed]
- Utsugi, T. Holographic scattering in an angular-multiplexed hologram on a photopolymer. Appl. Opt. 2018, 57, 527–537. [Google Scholar] [CrossRef] [PubMed]
- Rubin, M.; Dardikman, G.; Mirsky, S.K.; Turko, N.A.; Shaked, N.T. Six-pack off-axis holography. Opt. Lett. 2017, 42, 4611–4614. [Google Scholar] [CrossRef] [PubMed]
- Ma, Z.; Yang, Y.; Zhai, H.; Chavel, P. Spatial angular multiplexing for enlarging the detected area in off-axis digital holography. Opt. Lett. 2013, 38, 49–51. [Google Scholar] [CrossRef] [PubMed]
- Xu, X.F.; Zhang, Z.W.; Wang, Z.C.; Wang, J.; Zhan, K.Y.; Jia, Y.L.; Jiao, Z.Y. Robust digital holography design with monitoring setup and reference tilt error elimination. Appl. Opt. 2018, 57, B205–B211. [Google Scholar] [CrossRef]
- Liu, Y.W.; Jiang, Z.Q.; Wang, Y.B.; Sun, Q.Y.; Chen, H. Single-frame reconstruction for improvement of off-axis digital holographic imaging based on image interpolation. Opt. Lett. 2020, 45, 6623–662619. [Google Scholar] [CrossRef]
- Zheng, J.J.; Gao, P.; Yao, B.L.; Ye, T.; Lei, M.; Min, J.W.; Dan, D.; Yang, Y.L.; Yan, S.H. Digital holographic microscopy with phase-shift-free structured illumination. Photonics Res. 2014, 2, 87–91. [Google Scholar] [CrossRef]
- Deng, D.N.; Qu, W.J.; He, W.Q.; Wu, Y.; Liu, X.L.; Peng, X. Off-axis tilt compensation in common-path digital holographic microscopy based on hologram rotation. Opt. Lett. 2017, 42, 5282–5285. [Google Scholar] [CrossRef]
- Min, J.W.; Yao, B.L.; Ketelhut, S.; Engwer, C.; Greve, B.; Kemper, B. Simple and fast spectral domain algorithm for quantitative phase imaging of living cells with digital holographic microscopy. Opt. Lett. 2017, 42, 227–230. [Google Scholar] [CrossRef]
- Gerislioglu, B.; Bakan, G.; Ahuja, R.; Adam, J.; Mishra, Y.K.; Ahmadivand, A. The role of Ge2Sb2Te5 in enhancing the performance of functional plasmonics devices. Mater. Today Phys. 2020, 12, 100178. [Google Scholar] [CrossRef]
Figure 1.
Recording configuration for the OADHM principle.

Figure 2.
Schematic diagrams for simulation.

Figure 3.
Object wave and holograms for simulation. (a) intensity; (b) phase of the object in PO and holograms in PH with (c) AO1 = 0.1 Ar; (d) AO1 = 0.5 Ar.
Figure 3.
Object wave and holograms for simulation. (a) intensity; (b) phase of the object in PO and holograms in PH with (c) AO1 = 0.1 Ar; (d) AO1 = 0.5 Ar.

Figure 4.
The intensity distributions of the spectra from hologram I for simulation. (a) two points δ(u ± up, v ± vp); (b) spectra areas.
Figure 4.
The intensity distributions of the spectra from hologram I for simulation. (a) two points δ(u ± up, v ± vp); (b) spectra areas.

Figure 5.
The intensity distribution of the spectra from the Fourier transform of RI for simulation. (a) before and (b) after spectra filtering.
Figure 5.
The intensity distribution of the spectra from the Fourier transform of RI for simulation. (a) before and (b) after spectra filtering.

Figure 6.
Simulation results without the filtering of δ(u, v) in Figure 5b with (a) AO1 = 0.1 Ar; (b) AO1 = 0.3 Ar; (c) AO1 = 0.5 Ar.
Figure 6.
Simulation results without the filtering of δ(u, v) in Figure 5b with (a) AO1 = 0.1 Ar; (b) AO1 = 0.3 Ar; (c) AO1 = 0.5 Ar.

Figure 7.
Simulation results with δ(u, v) filtered out. When (a) AO1 = 0.5 Ar; (b) AO1 = 1 Ar; (c) AO1 = 2 Ar; and (d) AO1 = 3 Ar.
Figure 7.
Simulation results with δ(u, v) filtered out. When (a) AO1 = 0.5 Ar; (b) AO1 = 1 Ar; (c) AO1 = 2 Ar; and (d) AO1 = 3 Ar.


Figure 8.
Simulation results for a non-binary object. (a) Original image; (b) Recovered image by OADHM method.
Figure 8.
Simulation results for a non-binary object. (a) Original image; (b) Recovered image by OADHM method.

Figure 9.
Optical experimental results. (a) Hologram recorded; (b) Spectra distribution without using R; (c) Spectra distribution shifted by using R; (d) Reconstructed image by OADHM.
Figure 9.
Optical experimental results. (a) Hologram recorded; (b) Spectra distribution without using R; (c) Spectra distribution shifted by using R; (d) Reconstructed image by OADHM.

Publisher’s Note: MDPI stays neutral with regard to jurisdictional claims in published maps and institutional affiliations. |
© 2022 by the authors. Licensee MDPI, Basel, Switzerland. This article is an open access article distributed under the terms and conditions of the Creative Commons Attribution (CC BY) license (https://creativecommons.org/licenses/by/4.0/).
Share and Cite
MDPI and ACS Style
Xu, X.; Wang, X.; Wang, H. Accurate Image Locating by Hologram Multiplexing in Off-Axis Digital Holography Display. Appl. Sci. 2022, 12, 1437. https://0-doi-org.brum.beds.ac.uk/10.3390/app12031437
AMA Style
Xu X, Wang X, Wang H. Accurate Image Locating by Hologram Multiplexing in Off-Axis Digital Holography Display. Applied Sciences. 2022; 12(3):1437. https://0-doi-org.brum.beds.ac.uk/10.3390/app12031437
Chicago/Turabian StyleXu, Xianfeng, Xinwei Wang, and Hao Wang. 2022. "Accurate Image Locating by Hologram Multiplexing in Off-Axis Digital Holography Display" Applied Sciences 12, no. 3: 1437. https://0-doi-org.brum.beds.ac.uk/10.3390/app12031437
Note that from the first issue of 2016, this journal uses article numbers instead of page numbers. See further details here.