
Shot Put: Which Role for Kinematic Analysis?
by
 , and
, and
Simone Ciacci
1,* ,
,
Franco Merni
1,
Gabriele Semprini
1,
Giacomo Drusiani
2,
Matteo Cortesi
2 and
and
Sandro Bartolomei
1 1
Department of Biomedical and Neuromotor Sciences, University of Bologna, 40127 Bologna, Italy
2
Department for Life Quality Studies, University of Bologna, 40100 Bologna, Italy
*
Author to whom correspondence should be addressed.
Appl. Sci. 2022, 12(3), 1699; https://0-doi-org.brum.beds.ac.uk/10.3390/app12031699
Submission received: 10 November 2021
/
Revised: 2 February 2022
/
Accepted: 4 February 2022
/
Published: 7 February 2022
(This article belongs to the Special Issue Performance Analysis in Sport and Exercise)
Abstract
:Background: To understand the technical differences between shot putters of different ages, this study compared biomechanical parameters of the best senior and youth Italian athletes and then to world-class athletes (WC) assessed in previous investigations. Methods: The best throws of 16 shot putters [8 Senior (SG) and 8 Youth (YG)] were recorded by video cameras during the Italian Championships’ final and considered for 3D reconstruction. The following parameters were measured: time of the different throwing phases, shot trajectory, release angle, release velocity, and the force produced in the final phase. Results: Significant differences between SG and YG were detected in second single support time (p = 0.015), support time (p = 0.007), total time (p = 0.028) and in the force produced during the final phase (p < 0.001). A lower level of force, release speed, and a shorter shot trajectory during the double support were detected in SG compared to WC. Conclusions: The present study showed that, although the technical performance of all athletes was similar, some differences exist between YG and SG. The gap between the groups may be partially explained by the difference in force produced in the final phase of the throw and by a different interpretation of the technique.
1. Introduction
Shot put is one of the most popular events of track and field and requires a perfect set of strength, speed, and technical abilities. In particular, shot put performance is based on technical patterns that create a sum of forces generated by the various parts of the body [1]. Thus, a perfect technical sequence of body movements is essential for the specific performance. The aim of several biomechanical investigations is to create a technical model of a specific sport and both elite young [2] and senior [3,4] athletes are frequently assessed for this purpose. Conversely, other studies compared athletes of different sex [5], performance levels [6,7], age, or sport [8,9]. Consistently, studies focused on shot put compared the biomechanical parameters of world-class athletes with the biomechanical model of the discipline [10,11,12]. The technique of shot put includes different movements performed at high speed and in a limited space [10] and represents one of the most complex specialties of athletics. The sequence of these movements can be performed using two different techniques: the glide (GLI) and the rotational (ROT) technique. Previous studies compared these shot techniques and many similarities between them were found [10,11]. The final phase of both techniques indeed is characterized by similar biomechanical parameters [10] while the initial phases of the throw present many differences between the two techniques [10,12,13]. In both GLI and ROT, the goal of the initial phase (from the beginning of the movement to the power position or double support) is to lead the athlete to an optimal position in the double support phase. Trunk inclination and torsion between shoulders and hips indeed, are essentials to obtain an optimal drive in the final phase [10,12,14]. Furthermore, during these phases, the fundamental elements of the performance are developed (i.e., the height, angle, and velocity of release) and release velocity represents the most important parameters of the throw [10,13,15,16]. Jonath et al. [13] reported that also a low increase of release velocity was able to produce great increases in shot performance with the same release angle and height, while, in accordance with Hubbard et al. [17], a significant reduction of release angle produced a limited decrease of performance. Confirming the minor influence on the performance of the release angle, a wide range of release angles have been reported in advanced athletes [10,11,13,14,18,19].
Another parameter that influences the release velocity, and consequently the throwing performance, is the length of the trajectory of the shot from the power position (i.e., when the athlete achieves the double support) to the release [10].
The time of the flight phase before the double support has been reported to be inversely related to the maximal release velocity [12,20,21]. Furthermore, many authors suggested that this time should be minimized to obtain optimal performance in both ROT and GLI techniques. Therefore, in agreement with the previous studies [10,11,12,20,22], the most important variables for the shot put performances in both techniques are the release velocity and the release angle.
To date, key variables of the shot put performance have been widely studied and a technical model has been defined, based on the biomechanical profile of the WC athletes. The main aim of this model was to offer a technical reference for coaches and athletes. To the best of our knowledge, however, only one study analyzed the biomechanical parameters in young shot putters [22], In this study, 12 athletes were assessed, and correlations between dynamic parameters and performance were studied. This study, however, did not investigate the differences between senior and young athletes. Thus, despite several studies comparing athletes of different ages competing in different sporting events [23,24], to the best of our knowledge, no studies investigated the technical parameters of shot put in elite athletes of different ages. Therefore, the main aim of this study was to analyze and compare the best senior (throwing an official shot of 7.26 kg) with the best young Italian shot putters (throwing an official shot of 5 kg). The authors hypothesized that differences in technical parameters between the best senior and young Italian shot putters may exist and may influence the performance. Another aim was to compare the results of Italian senior athletes to the biomechanical data collected from WC athletes and published in international literature.
2. Materials and Methods
2.1. Participants
Data were collected on 16 elite male (national-level) shot putters divided into two groups, eight senior (SG, age 24.3 ± 3.3 y, height 186.7 ± 3.6 cm, mass 108.2 ± 11.7 kg) and eight youth (YG, age 16.8 ± 0.5 y, height 186.1 ± 1.9 cm, mass 90.4 ± 4 kg) during the Italian Senior and Youth Athletics Championships. Athletes analyzed in the present study were the eight best young and senior shot putters that competed in the final phase of the Italian championship after a qualifying round consisting of three throws. The best throw of each athlete during the final was analyzed. All the athletes were right-handed and used the official shot (7.26 kg and 5 kg for senior and youth athletes, respectively) and showed a personal best ranging from 19.78 m to 16.96 m and from 18.50 m to 15.28 m for SG and YG, respectively. The athletes had at least three years of competitive experience and were free of any injury for at least one year. The study protocol was approved by the local review board and by the Italian Athletics Federation. Informed consent was obtained from all subjects involved in the study. For the athletes under 18 years of age, included in the present investigation, parental signed consent was obtained.
2.2. Measures
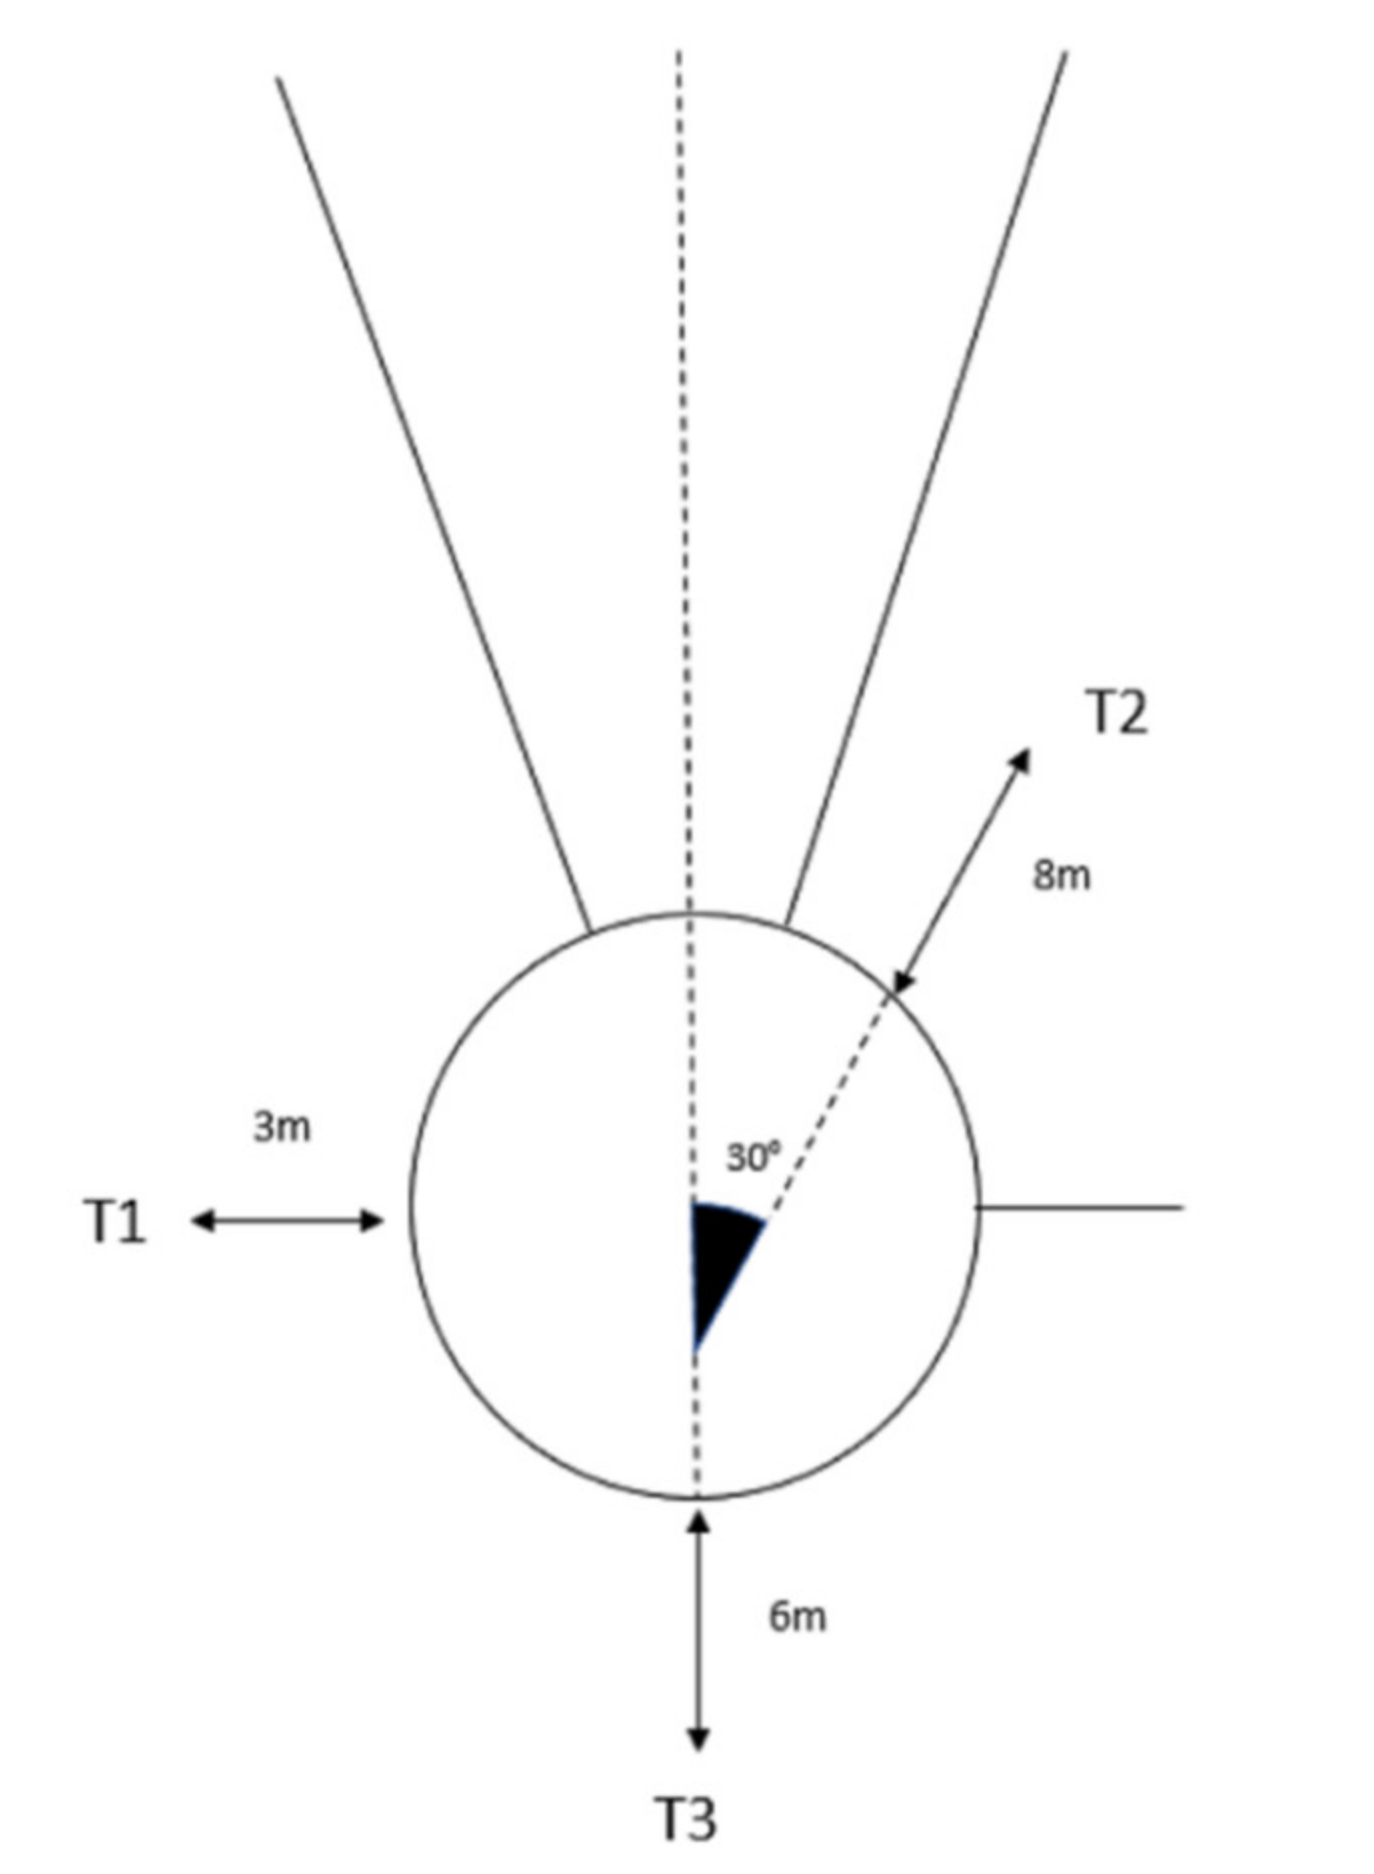
Three video cameras (T1, T2, T3) FULL HD (JVC GC-PX10, JVC GC-PX100, Panasonic HC-X900M, 60 frame/s, 1920 × 1080 pixel) were used to record the athletes during the shot put. The cameras were placed around the circle (Figure 1).
T1 was placed on the left side of the circle, 3 m to the board; T2 was placed 8 m in front of the circle board, with an angle of 30° with respect to the bisector of the throwing sector; and T3 was placed 6 m back of the circle board, in line with the bisector of the throwing sector. The height of the cameras was approximately 1.40 m above the ground. The cameras were synchronized based on the first movement of the athletes at the start of the first throwing phase. Before the beginning of the competition, a 2.08 m side cube made of metal cylinders was used as a calibration object. This cube was positioned over the circle to calibrate the three-dimensional (3D) acquisition volume.
Video recordings were transferred to a computer and analyzed using the SIMI Motion version 7.5.288 Software (Simi Reality Motion Systems GmbH, Unterschleissheim, Germany).
The 3D calibration was performed by means of the direct linear transformation (DLT) algorithm [25], selecting 16 points in the recordings of the cube used as the calibration object. Since the shot put technique develops over the three planes of space, the authors used a third camera to provide an additional useful data set for the DLT method and to improve the accuracy of the 3D reconstructions with the SIMI motion system. For the 3D reconstruction of body segments, 20 anatomical landmarks were visually identified and manually digitized [8]: joint centers of the shoulder, elbow, wrist, hip, knee, ankle; center of the head, hand (third metacarpal) and shot, foot (second metatarsal), midpoint of the line connecting the shoulders, and the midpoint of the line connecting the hips. The center of mass (CM) was calculated using an anatomical model from De Leva [26]. Three-dimensional point trajectories were smoothed using a low-pass second-order Butterworth filter with a cut-off frequency of 10 Hz [27]. The average standard deviations calculated over the athletes and body segment was 1.15 cm; this value, of about 95% of the length measurements, did not differ by more than 2.3 cm from the respective mean length, indicating satisfactory reliability.
According to Gutierrez-Davila et al. [10], each throw was divided into six phases. Among these phases, the following components were recognized as the most important temporal parameters for the performance in both techniques: the flight time, the second single support and the following double support phase (power position), total support phase (second single support + double support time), the final phase and the total time (total duration of the six phases). For right-handed throwers, the flight time was defined as the first frame in which the first single support leaves the ground until the last frame before the contact of the right foot on the ground. The second single support was the time between the first contact frame of the right foot after the flight time and the last frame of the left foot flight phase. The double support was the time between the first and last frame of the contact with the ground of both feet; the final phase was started when after double support, one foot was lifted from the ground and ended at the shot release. In addition to temporal parameters, the right knee angle and the trunk inclination (with respect to the ground) at the beginning of the double support phase were estimated. Moreover, the shot trajectory from the first frame of the double support to the release, the release angle and velocity, and the average force during the final phase (calculated using the equation: F = m * a where F = Force, m = mass of the shot and a=acceleration, where the acceleration was the rate of the change of the velocity from the start of the final phase to the shot release) were estimated.
2.3. Design and Procedures
The athletes were filmed during the National Italian Championship. Following the qualifying round, the best eight senior and eight young throwers were considered for biomechanical analysis. Videos of the best throws performed by each senior and young shot putter were analyzed.
2.4. Statistical Analysis
The statistical analyses were performed with the software SPSS version 26 (SPSS Inc., Chicago, IL, USA). A Shapiro–Wilk test was used to assess the normal distribution of the data. Data of the two groups were statistically analyzed using an independent sample t-test. All data are reported as mean ± SD. A significant level of p < 0.05 was used. Cohen’s d effect size (ES) was calculated for all variables and was interpreted as trivial (0–0.19), small (0.2–0.59), moderate (0.6–1.19), large (1.2–1.9), or very large (>2.0) [28]. Moreover, the correlation (r of Pearson) between release angles and velocity was estimated in both SG and YG.
3. Result
Biomechanical data of Senior (SG) and Youth (YG) groups are reported in Table 1. Significant group differences were detected in second single support time (p = 0.015; ES = 1.21), support time (p = 0.007; ES = 1.43), and total time (p = 0.028; ES = 1.19). Significant differences were also detected between the groups for the average force during the final phase (p < 0.001; ES = 2.73).
A significant positive correlation (r = 0.859; p = 0.006) was detected between the release velocity and the release angle in SG. On the contrary, a significant negative correlation (r = −0.811; p = 0.015) between the release velocity and the release angle was detected in YG.
4. Discussions
The present study indicated that significant differences in temporal phases of shot put exist between SG and YG. Longer support phases and higher force production during the final phase indeed characterized the throw in SG compared to YG. In accordance with Abdullah et al. [23] and Little [24] between youth and adults, there were differences in both technical and conditional skills. Despite these differences, technical components, such as temporal and kinematic parameters (e.g., joint angles, speed, and release angle), are similar in senior and young throwers. Temporal differences mainly involve the second single support time (0.209 s and 0.123 s in SG and YG, respectively) and this parameter may influence the other two temporal variables: support time (0.374 s and 0.276 s in SG and YG, respectively) and total time (0.571 s and 0.486 s in SG and YG, respectively). A longer single support phase in SG may be related to the need for a longer acceleration time of the body in these athletes, similar to what happens in the acceleration phase of the sprint [8]. The duration of the single support phase in SG indeed was similar to what has been previously measured in WC athletes (0.190 ± 0.04 s). Conversely, the duration of this phase was shorter in YG (0.123 ± 0.08 s) compared to world-class athletes. Similar final phase times, release velocities, and release angles were detected in both SG and YG. The different mass of the shot in the two groups, however, indicated a different force production in the final phase between the two groups (813N and 515N in SG and YG, respectively). Thus, the different shot masses in SG and YG have a major influence on the force produced in the final phase; this parameter, however, may not significantly affect the angular and kinematic parameters of the throw. A 5 kg shot indeed seems appropriate for athletes of 15–16 years old to obtain a throwing technique similar to senior athletes. In addition, similarities between the technical parameters in YG and SG may indicate that a proper technique was used even by young shot putters. Several authors [15,17,20] indicated the release velocity and the release angle as the most important parameters for shot put performance. Jonath et al. [13] reported that an increase of 0.1 ms−1 in release velocity was able to increase the shot performance by 25–30 cm with the same release angle and height. On the contrary, the same authors [13] reported a decrease in performance by 18 cm only, when the release angle was reduced to five degrees. This is consistent with Hubbard et al. [17], who reported a decrease in release velocity with increased release angles (about 1.76 ms−1 per rad) and release height (about 0.8 ms−1 per m). Release velocity and release angle were similar in YG and SG, however, the relationship between these parameters was the opposite in the two groups. When release velocity increases, release angle tends to decrease in YG, while this parameter tends to raise in SG. Hubbard et al. [17] suggested that an inverse relationship between release velocity and release angle, as detected in YG, may be optimal. However, release angles in SG appear closer to the values that have been considered optimal for elite athletes in previous investigations (i.e., between 31° and 37° [10,11,14,15,19,29,30]).
The major difference between SG and WC consists of throwing speed, respectively 11.8 ± 1.03 ms−1 and 13.7 ± 0.3 ms−1 [6,9,15,19]. This value explains the difference in performance between SG (average of 18.17 ± 1.4 m) and WC athletes (>20 m).
The difference in release velocity between SG and WC could be explained by the difference in the force produced during the acceleration of the shot. These differences may be related to the maximal strength and power of the athletes, but also technical discrepancies between SG and WC. During the double support phases, WC shows a shot trajectory longer than SG (1.61 ± 0.15 m and 1.32 ± 0.17 m in WC and SG, respectively). As suggested by Gutierrez-Davila [10], shot trajectory represents an important parameter for the final performance. In addition, the inverse relationship between the release velocity and the release angle detected in YG is not consistent with what has been previously measured in WC athletes [16].
The present study shows some limitations. From a methodological point of view, the comparison between SG and YG, and WC may have been more precise if the sampling frequencies would be the same in the different investigations. In the present study, indeed, a sampling frequency of 60 Hz was used, while a 100 Hz frequency is prevalent in the literature. In addition, the use of accelerometers may have provided more complete data on speeds and accelerations. In addition, the presence of three athletes only, using the glide technique, did not allow for a comparison with the spin technique.
5. Conclusions
Several studies have shown that comparing the technical skills and conditional abilities of athletes of different ages may be important to identify the factors contributing to success in a specific sport [23,24]. This study was the first to compare a group of seniors with a group of youth elite shot putters. The results of the present study showed that the throwing technique was similar in young and senior athletes. Significant differences between the two groups, however, were detected in the duration of the different phases that precede the shot release. The longer duration of these phases, characterized by the SG, may facilitate the transfer of force from the lower body to the shot. Despite these differences between YG and SG, the 5 kg shot seems appropriate in relation to the age and technical characteristics of young athletes. Furthermore, this research compared the best Italian throwers with world-class athletes. The differences in performance detected may be due to a different interpretation of the technical components in WC and to a presumed lower level of force in SG. Significant differences in strength and speed between SG and WC may partially explain lower performances in SG. In addition, the differences in some parameters in the final throwing phases may suggest that some technical suggestions may be beneficial for both YG and SG. Coaches interested in maximizing throwing performances should be aware that longer shot trajectories may enhance the shot speed in the final phase. Technical improvement, together with a greater strength expression, may have an impact on final throwing performance. More research is needed to better understand the influence of strength and power on the throwing technique at the different performance levels.
Author Contributions
Conceptualization, S.C.; data curation, F.M.; investigation, G.D.; methodology, M.C.; writing—review and editing, G.S. and S.B. All authors have read and agreed to the published version of the manuscript.
Funding
This research received no external funding.
Institutional Review Board Statement
The study was conducted according to the guidelines of the Declaration of Helsinki, and approved by the Ethics Committee (authorized on 5 May 2016).
Informed Consent Statement
Informed consent was obtained from all subjects involved in the study. Written informed consent has been obtained from the patient(s) to publish this paper if applicable.
Acknowledgments
The authors acknowledge the Italian Athletics Federation (FIDAL) for the support in the realization of this study.
Conflicts of Interest
The authors declare no conflict of interest.
References
- Judge, L.W.Z.; Bellar, D.; Thrasher, A.B.; Simon, L.; Hindawi, O.S.; Wanless, E. A pilot study exploring the quadratic nature of the relationship of strength to performance among shot putters. Int. J. Exerc. Sci. 2013, 6, 171–179. [Google Scholar]
- Saratlija, P.; Zagorac, N.; Babić, V. Influence of kinematic parameters on result efficiency in javelin throw. Coll. Antropol. 2013, 37 (Suppl. 2), 31–36. [Google Scholar] [PubMed]
- Graham-Smith, P.; Lees, A. A three-dimensional kinematic analysis of the long jump take-off. J. Sport Sci. 2005, 23, 891–903. [Google Scholar] [CrossRef] [PubMed]
- Guex, K. Kinematic Analysis of the Women’s 400m Hurdles. New Stud. Athlet. 2012, 27, 41–51. [Google Scholar]
- Ciacci, S.; Bartolomei, S. The effects of two different explosive of strength training programs on vertical jump performance in basketball. J. Sport Med. Phys. Fit. 2017, 58, 1375–1382. [Google Scholar] [CrossRef] [PubMed]
- Babić, V.; Côh, M.; Dizdar, D. Differences in kinematic parameters of athletes of different running quality. Biol. Sport 2011, 28, 115–121. [Google Scholar] [CrossRef]
- Bartolomei, S.; Nigro, F.; Gubellini, L.; Ciacci, S.; Merni, F.; Treno, F.; Cortesi, M.; Semprini, G. Physiological and sport-specific comparison between division I and division II italian male field hockey players. J. Strength Cond. Res. 2019, 33, 3123–3128. [Google Scholar] [CrossRef] [PubMed]
- Ciacci, S.; Merni, F.; Bartolomei, S.; Di Michele, R. Sprint start kinematics during competition in elite and world-class male and female sprinters. J. Sport Sci. 2017, 35, 1270–1278. [Google Scholar] [CrossRef]
- Rodriguez-Rosell, D.; Mora-Custodio, R.; Franco-Marquez, F.; Yanez-Garcia, J.M.; Gonzalez-Badillo, J.J. Traditional vs. sport-specific vertical jump tests: Reliability, validity, and relationship with the legs strength and sprint performance in adult and teen soccer and basketball players. J. Strength Cond. Res. 2017, 31, 196–206. [Google Scholar] [CrossRef]
- Gutierrez-Davila, M.; Rojas, J.; Campos, J.; Gamez, J.; Encarnacion, A. Biomechanical Analysis of the shot put at the 12th IAAF World Indoor Championships. New Stud. Athlet. 2009, 24, 45–61. [Google Scholar]
- Schaa, W. Biomechanical Analysis of the shot put at the 2009 IAAF World Championships in Athletics. New Stud. Athlet. 2010, 25, 9–21. [Google Scholar]
- Côh, M.; Štuhec, S. 3D kinematics analysis of the rotational shot put technique. New Stud. Athlet. 2005, 20, 57–66. [Google Scholar]
- Jonath, U.; Krempel, R.; Haag, E.; Muller, H. Leichtathletik 3. Werfen und Mehrkampf; Rowohlt: Hamburg, Germany, 1995; pp. 132–157. [Google Scholar]
- Young, M. Critical factors for the shot put. Track Coach 2004, 166, 5299–5304. [Google Scholar]
- Bartonietz, K.E. Rotational shot put technique: Biomechanic findings and recommendations for training. Track Field Q. Rev. 1994, 93, 18–29. [Google Scholar]
- Zatsiorsky, V.M.; Lanka, G.E.; Shalmanov, A.A. Biomechanical analysis of shot putting technique. Exerc. Sport Sci. Rev. 1981, 9, 353–389. [Google Scholar] [CrossRef]
- Hubbard, M.; de Mestre, N.J.; Scott, J. Dependence of release variables in the shot put. J. Biomech. 2001, 34, 449–456. [Google Scholar] [CrossRef]
- Linthorne, N.P. Optimum release angle in the shot put. J. Sport Sci. 2001, 19, 359–372. [Google Scholar] [CrossRef]
- Côh, M.; Stuhec, S.; Supej, M. Comparative biomechanical analysis of the rotational shot put technique. Coll. Antropol. 2008, 32, 249–256. [Google Scholar]
- Byun, K.O.; Fujii, H.; Murakami, M.; Endo, T.; Takesako, H.; Gomi, K.; Tauchi, K. A biomechanical analysis of the men’s shot put at the 2007 World Championships in Athletics. New Stud. Athlet. 2008, 23, 53–62. [Google Scholar]
- Goss-Sampson, M.A.; Chapman, M. Temporal and kinematic analysis of the rotational shot put technique. J. Sport Sci. 2003, 21, 237–238. [Google Scholar]
- Landolsi, M.; Labiadh, L.; Zarrouk, F.; Maaref, K.; Ghannouchi, S.; Tabka, Z.; Lacouture, P. Kinematic analysis of the shot-put: A method of assessing the mechanical work of the hand action force. Eur. J. Sport Sci. 2018, 18, 1208–1216. [Google Scholar] [CrossRef]
- Abdullah, M.R.A.; Musa, M.R.; Kosni, N.A.; Maliki, A.B.H.M.; Haque, M. Profiling and Distinction of Specific Skills Related Performance and Fitness Level between Senior and Junior Malaysian Youth Soccer Players. Int. J. Pharm. Res. 2016, 8, 64–71. [Google Scholar]
- Little, N.G. Physical performance attributes of junior and senior women, juvenile, junior, and senior men judokas. J. Sport Med. Phys. Fit. 1991, 31, 510–520. [Google Scholar]
- Abdel-Aziz, Y.I.; Karara, H.M. Direct linear transformation from comparator coordinates into object space coordinates in close-range photogrammetry. Photogram. Eng. Remote Sens. 2015, 81, 103–107. [Google Scholar] [CrossRef]
- De Leva, P. Joint center longitudinal position computed from a selected subset of Chandler’s data. J. Biomech. 1996, 29, 1231–1233. [Google Scholar] [CrossRef]
- Robertson, D.G.E.; Dowlin, J.J. Design and responses of Butterworth and critically damped digital filters. J. Electromyogr. Kinesiol. 2003, 13, 569–573. [Google Scholar] [CrossRef]
- Hopkins, W.G.; Marshall, S.W.; Batterham, A.M.; Hanin, J. Progressive statistics for studies in sports medicine and exercise science. Med. Sci. Sports Exerc. 2009, 41, 3–13. [Google Scholar] [CrossRef] [Green Version]
- Oesterreich, R.; Bartonietz, K.; Goldmann, W. The rotational shot put technique: A development model for young athletes. New Stud. Athlet. 1997, 12, 35–40. [Google Scholar]
- Lipovšek, S.; Škof, B.; Štuhec, S.; Čoh, M. Biomechanical Factors of Competitive Success with the Rotational Shot Put Technique. New Stud. Athlet. 2011, 26, 101–109. [Google Scholar]
Figure 1.
Camera placement around the shot put circle: T1 = camera 1, T2 = camera 2, T3 = camera 3.


Table 1.
Differences (* p < 0.05) in biomechanical parameters (mean ± SD) between SG and YG.
| Parameters | SG | YG | p | ES |
|---|---|---|---|---|
| Flight phase time (s) | 0.091 ± 0.05 | 0.085 ± 0.04 | 0.54 | 0.14 |
| Second single support time (s) | 0.209 ± 0.06 | 0.123 ± 0.08 | 0.015 * | 1.21 |
| Double support time (s) | 0.165 ± 0.02 | 0.164 ± 0.03 | 0.47 | 0.04 |
| Support time (s) | 0.374 ± 0.05 | 0.276 ± 0.08 | 0.007 * | 1.43 |
| Final phase time (s) | 0.106 ± 0.01 | 0.115 ± 0.02 | 0.16 | −0.57 |
| Total time (s) | 0.571 ± 0.03 | 0.486 ± 0.11 | 0.028 * | 1.19 |
| Trunk inclination (angle between the line from middle point of shoulder to middle point of hip and the ground) at the beginning of double support phase (°) | 59 ± 5 | 57 ± 10 | 0.373 | 0.17 |
| Right knee angle at the beginning of double support (°) | 120 ± 8 | 112 ± 14 | 0.10 | 0.70 |
| Shot Trajectory from double support to release (m) | 1.32 ± 0.17 | 1.47 ± 0.21 | 0.07 | −0.79 |
| Release angle (°) | 39 ± 8 | 43 ± 7 | 0.109 | −0.15 |
| Release velocity (ms−1) | 11.8 ± 1.03 | 11.4 ± 0.62 | 0.172 | 0.50 |
| Average force during the final phase (N) | 813 ± 106 | 515 ± 113 | <0.001 * | 2.73 |
p = level of significance; SG = Senior Group; YG = Youth Group; ES = Effect Size; s = second; m = meter; ° = Degrees; N = Newton.
Publisher’s Note: MDPI stays neutral with regard to jurisdictional claims in published maps and institutional affiliations. |
© 2022 by the authors. Licensee MDPI, Basel, Switzerland. This article is an open access article distributed under the terms and conditions of the Creative Commons Attribution (CC BY) license (https://creativecommons.org/licenses/by/4.0/).
Share and Cite
MDPI and ACS Style
Ciacci, S.; Merni, F.; Semprini, G.; Drusiani, G.; Cortesi, M.; Bartolomei, S. Shot Put: Which Role for Kinematic Analysis? Appl. Sci. 2022, 12, 1699. https://0-doi-org.brum.beds.ac.uk/10.3390/app12031699
AMA Style
Ciacci S, Merni F, Semprini G, Drusiani G, Cortesi M, Bartolomei S. Shot Put: Which Role for Kinematic Analysis? Applied Sciences. 2022; 12(3):1699. https://0-doi-org.brum.beds.ac.uk/10.3390/app12031699
Chicago/Turabian StyleCiacci, Simone, Franco Merni, Gabriele Semprini, Giacomo Drusiani, Matteo Cortesi, and Sandro Bartolomei. 2022. "Shot Put: Which Role for Kinematic Analysis?" Applied Sciences 12, no. 3: 1699. https://0-doi-org.brum.beds.ac.uk/10.3390/app12031699
Note that from the first issue of 2016, this journal uses article numbers instead of page numbers. See further details here.