Article

Reaction Center of Rhodobacter Sphaeroides, a Photoactive Protein for pH Sensing: A Theoretical Investigation of Charge Transport Properties

Dipartimento di Matematica e Fisica, “Ennio De Giorgi”, Università del Salento, I-73100 Lecce, Italy
*
Author to whom correspondence should be addressed.
Submission received: 24 December 2021 / Revised: 26 January 2022 / Accepted: 6 February 2022 / Published: 8 February 2022
(This article belongs to the Special Issue Frontiers in Optical Materials)

Abstract

:

Featured Application

Bio-electronic devices take advantages of some specific duties of biological matter. The specific ability of some proteins to use sunlight is considered for the realization of photo-electronic devices. Here the focus is on the role of the pH, whose variations seem to affect the protein conductance.

Abstract

In the perspective of an increasing attention to ecological aspects of science and technology, it is of interest to design devices based on architectures of modular, low cost, and low-pollutant elements, each of them able to perform simple duties. Elemental devices may be themselves green as, for example, proteins able to make simple actions, like sensing. To this aim, photosensitive proteins are often considered because of the possibility of transferring their specific reaction to visible light into electronic signals. Here, we investigate the expected electrical response of the photoactive protein Reaction Center (bRC) of Rhodobacter Sphaeroides within the proteotronics, a recent branch of molecular electronics that evaluates the electrical properties of a protein by using an impedance network protein analog based on the protein tertiary structure and the degree of electrical connectivity between neighboring amino acids. To this purpose, the linear and nonlinear regimes of the electrical response to an applied bias are studied when the protein is in its native state or in an active state. In the linear response regime, results evidence a significant difference in the electrical properties of bRC when the pH value of the solution in which the protein is embedded changes from acid to basic. In the non-linear response regime, the current-voltage characteristics experimentally reported in the recent literature are interpreted in terms of a sequential tunneling mechanism of charge transfer. The qualitative agreement of present findings with available experiments strongly suggests the use of this protein as a bio-rheostat or a pH sensor.

1. Introduction

In the last few years, bioelectronics, i.e., the branch of electronics which conjugates biological and inorganic matter, is assuming a relevant role in green technology. Besides the speculative interest of investigating with electronic/electrochemical methods how biological matter interacts with the environment, a major interest in bioelectronics is to suit some peculiar abilities of living matter (for example, to identify some specific molecules, to detect and use light, and so on) for practical applications, from energy harvesting to sensing action. In this framework, an increasing number of biomolecules, mainly proteins and aptamers, have been selected, produced, and analyzed with different experimental and theoretical techniques to be part of electronic devices [1,2,3,4].
Photosensitive proteins can convert electromagnetic energy into different forms of energy useful for their surviving. After illumination, proteins involved in photosynthesis inside the cell activate an electron transfer that, in turns, activates the ATP-ADP cycle transformations, also producing a proton pumping across the cell membrane [4]. Due to their specific abilities in charge transfer, these proteins are expected to exhibit a higher conductivity with respect to other photosensitive proteins. This is the case of type I opsins, which do not transfer electrons after illumination, but simply implement an ion pumping. Consequently, proteins involved in photosynthesis are among the most studied proteins for electrical/electronic applications [5,6,7,8].
Both experimental and theoretical investigations are in progress to shed light on the intriguing mechanisms behind biomolecule activation. Among the different theoretical modelling, proteotronics aims to mimic the set of microscopic mechanisms which, inside the biomolecule, regulate its behavior [9]. Within this framework, charge transport in bacterial Reaction Center (bRC) of Rhodobacter Sphaeroides is here investigated with the purposes of interpreting available data and suggesting new fields of applications. Specifically, the analysis is concerned with some structures of bRC deposited in the protein data bank [10] and obtained in different conditions of pH [11].
All proteins, and in general living matter, continuously interact with their environment, i.e., they are open systems. Consequently, the task of providing a comprehensive model is still far from present possibilities. As an example, temperature, hydration, and of course, the presence of specific ligands, sensitively affect the protein stability and activity, producing a very complex framework of energy landscapes. Indeed, the protein structure is the result of an amino acids sequence (primary structure) which arranges to reach a minimum of the free energy, thus competing with entropy [12]. This means that thousands of equivalent structures should be explored before a shortlist of the most reliable could be obtained. From one side, the landscape of protein energy states is quite complex and not still complete; it assumes that after folding the protein lives in the ground state of an energy funnel, in which it assumes the most stable configuration. From another side, it is not clear to what extent the configuration is stable with respect to the variation of different environmental conditions, or if a degeneracy in energy exists with different proteins living in different equivalent auto-states [13]. The activation (due to energy/ligand binding) should shift the protein toward a different, inequivalent, energy funnel [14]. Waiting for a conclusive description we can only argue in terms of the statistically most relevant structure as given, for example, by the crystallographic investigation (which produces the output after many crystals analysis) and that strictly refers to specific environmental conditions. When these conditions also change the output changes, often in a way that is poorly appreciable to the naked eye but that can induce severe transformation in the protein functioning. Photosensitive proteins are quite interesting in this respect, because the topological transformation they undergo after they have absorbed light energy can appear quite small but produces an indisputable change in their functioning, which has been detected, for example, as an increase of their conductivity [15,16,17]. Due to the difficulty in performing protein crystallization and analysis, available data refer often to a specific combination of environmental conditions and a comparative analysis of the effects of tuning these conditions is quite difficult to be found.
Anyway, reduced, coarse grained models could capture the system dynamics in at least selected sets of environmental conditions. It is reasonable to suppose that an analysis of the protein around a minimum of the free energy, performed by producing small perturbations of only one significant variable, should drive the protein in a sub-manifold of energy states mainly ruled by that variable. Accordingly, in the present analysis, we focus on the role of pH on proteins in the native state (without illumination) and in the same temperature conditions, 100 K, which is well below the physiological temperature. Results are influenced by these conditions and the possibility that at increasing temperatures thermal fluctuations play a significant role cannot be excluded, and thus become the subject of desirable future investigations.
Proteins are influenced by hydration, from the very initial stages of folding to the establishment of the native configuration and eventually of the active configuration [18,19]. Therefore, it is not surprising that a relevant change in the amount of H+ cations in the solution in which bRC is present could suffice to arise the electrostatic field around the protein thus inducing a rearrangement of the electrically exposed surfaces. This phenomenon is of great practical interest since the conformational change of the protein structure induces a change of its electrical properties. Therefore, it becomes of relevant interest to investigate these conformational changes and evaluate their electrical effects in the perspective of developing new electronic devices. To this purpose, the role of pH is here investigated with the objective to find a correlation with an electrical response that, at this stage, can also serve to explore the protein structure. As previously mentioned, the energy state of the protein, and therefore of its conformation, depends on the environmental conditions. While it is easy to understand that, at least in the physiological range, the lowering of the temperature pushes a protein toward its minimum of energy, an analogue trend of the pH value is not a priori established. It is even not clear to what extent temperature and pH may influence each other. Starting from a set of data coming from crystallographic investigations performed on bRC at different values of pH at the same temperature of 100 K [11], the present investigation allows a clear separation of the effects of temperature and pH, thus avoiding possible effects of correlated influences.
Investigations on the electrical performances of biomolecules have a long tradition and cover different methodologies. Results of particular interest come from the electrochemical impedance spectroscopy (EIS), and the Conductive Atomic Force Microscopy (CAFM). The former one mainly performs analysis on macroscopic samples (typically with active surfaces of some cm2) in strong coupling with a buffer/electrolytic solution and in the presence of a sufficiently weak AC applied voltage. Results account for both the sample and solution response and it is in general not easy to discriminate the contributes to the total impedance. Electronic models are continuously updated to give a microscopic interpretation of the very complex physico-chemical processes [20,21]. As a matter of fact, many devices, for example sensors, are characterized by the EIS technique, therefore the modelling of results is relevant for both the speculative and applicative aspect [22]. Experiments performed with the EIS technique detect a sensitive enhancement of the cell conductance in light [17,21]. Specifically, it was observed that the charge transfer involves the protein, the quinones in solution and depends on the electrode. Furthermore, a sensitive magnification of conductance is observed in light.
CAFM can measure currents from a few to a single biomolecule appropriately bound on a conductive substrate in the presence of significant strong and DC applied electric fields. In this case as well, the experimental setup plays an important role in the result, for example, the specific protein anchoring [12], or the measurement mode (for example, contact or tapping mode) [15,16,23]. Photosensitive proteins sandwiched between an electrode and the CAFM tip have been studied under different conditions of illumination showing, in dark, an unexpectedly high conductance [12,23], which can be further enhanced in the presence of light [15].
Concerning the theoretical interpretation of experimental results, we refer to the proteotronics, a recent branch of molecular electronics developed inside our research group since 2014, that evaluates the electrical properties of a protein by using an impedance network analog based on the protein tertiary structure [9,24]. By using this approach, we succeeded to reproduce and interpret experimental data performed in neutral or quasi-neutral pH condition and foresee the results in alkaline conditions. In particular, the results of the investigation predict an increase of conductance in analogy to that given by illumination, and that can be useful for applications in sensor devices.

2. Materials and Methods

2.1. Reaction Center from Rhodobacter Sphaeroides

Proteins arrange their amino acids in a primary, secondary, tertiary, and quaternary structure, where: primary indicates the sequence of amino acids, from an N terminus to a C terminus, secondary indicates the organization in helices, sheets or bonds, tertiary indicates the space organization and, finally, when more than one identical protein concur to the functioning, quaternary indicates the organization among different proteins. Hereinafter, we use the term structure to refer to the tertiary structure of the protein which, being sensitive to environmental transformations, is the object of the present investigation.
The bRC structures of concern are obtained from crystallographic studies performed in different conditions of illumination and pH (see Table 1). By using these structures, our objective is to determine the electrical response of the single macromolecule as representative of the specific experimental arrangements of the macroscopic device.
bRC, a 307-amino acid protein, is part of the photosynthetic unit, a set of pigments, proteins, and inorganic molecules which harvest and transform energy from light. Specifically, bRC mediates a charge separation and transfer inside the cell, involving a couple of quinones (primary and secondary) to which electrons are transferred. Finally, protons are pumped outside the cell membrane. In performing this activity, the protein adapts its structure to the new function, this reshaping being called conformational change.
In performing experiments with proteins that have a well-defined structure, the outcome depends on the orientation they take on the layer on which they were deposited [7,12]. As a matter of fact, the orientation of bRC in the host cell maximizes its performance by arranging its three chains, say H, L, M, in a cylindrical symmetry, elongating from the Periplasm to the Cytoplasm [11,12]. Chains L and M extend across the cell membrane while chain H mainly faces the cytoplasmic side and only one helix parallels the other two chains.
When this symmetry is accounted for in experiments that try to reproduce the natural functioning of this protein, the results are amplified [7]. Indeed, the protein arrangement fulfills a transmembrane electron transfer which goes with a proton pumping and proceeds along the protein axes.
In Reference [11] the role of pH on the structure conformation has been analyzed, mainly with respect to the relative orientation of the secondary quinone, and a large set of structures were deposited in the Protein Data Bank (PDB) [10]; some of them are accounted for in the present study.

2.2. Theory

The electrical properties of the bRC are investigated making use of the 3D structures listed in Table 1, describing the single protein crystallized in different values of pH, both in dark and in light.
To this purpose, firstly we analyze the linear impedance response as a function of the frequency under a small, applied voltage, typically of a few mV, and represented by Nyquist and Bode plots that can be measured through a standard EIS technique. Secondly, we analyze the steady-state current-voltage (I-V) characteristics of a typical nanostructure at increasing values of applied voltages, up to 1 Volt, where deviations from-linear regimes can be achieved by means of a standard CAFM technique.
In brief, the single protein is represented by a set of nodes, one for each considered amino acid, identified by its Cα atom, and a set of links, each connecting a couple of nodes when their distance, l j , k , is below an appropriate cut-off value, D [9,14,24,25]. In this way, the complete graph representing the single protein is described by a Boolean matrix, B j , k = {1,0} corresponding to the presence or absence of a link between j and k nodes. The choice of the cut-off value, which is a parameter of the model to be determined from experiments, describes the degree of electrical connection of the graph.
For the calculations of the electrical properties, each link is interpreted as a channel for charge transfer whose impedance Z j , k is taken to be a function of the geometry, of the link resistivity, ρ , and of the intrinsic polarizability ε j , k of j, k amino acids as in [24,25]
Z j , k = l j , k A j , k ρ 1 + i ε j , k ε 0 ω  
where
A j , k = π D 2 l j , k 2 4  
is the cross-sectional area shared by the labeled amino acids, ε 0 the vacuum dielectric constant, ω the angular frequency and i the imaginary unit. By adopting the simplest parameter model, the value of   ρ is taken to be the same for all the links, unless differently specified in the following. In this way, the tertiary structure and the interaction radius are the only relevant input parameters of the theory.
The resulting impedance network preserves the features of the protein that are relevant for calculations, i.e., the amino acid positions and their electrical properties. By using Kirchhoff laws, the charge transfer inside the network is described by a set of linear equations that are solved by a standard numerical procedure. The solution so obtained provides the electrical response of the network in terms of its local currents and voltage drops, its global impedance and/or its steady-state I-V characteristics. We remark that different 3D structures produce different electrical outputs which can be compared with what was found in experiments performed in dark and in light on some opsins i.e., bacteriorhodopsin, bR, or proteorhodopsin, pR [15,16,23]. There, a marked difference of the electrical characteristics was observed because of the conformational change induced by the presence of light or other specific ligands [14,25,26,27,28,29].

3. Results

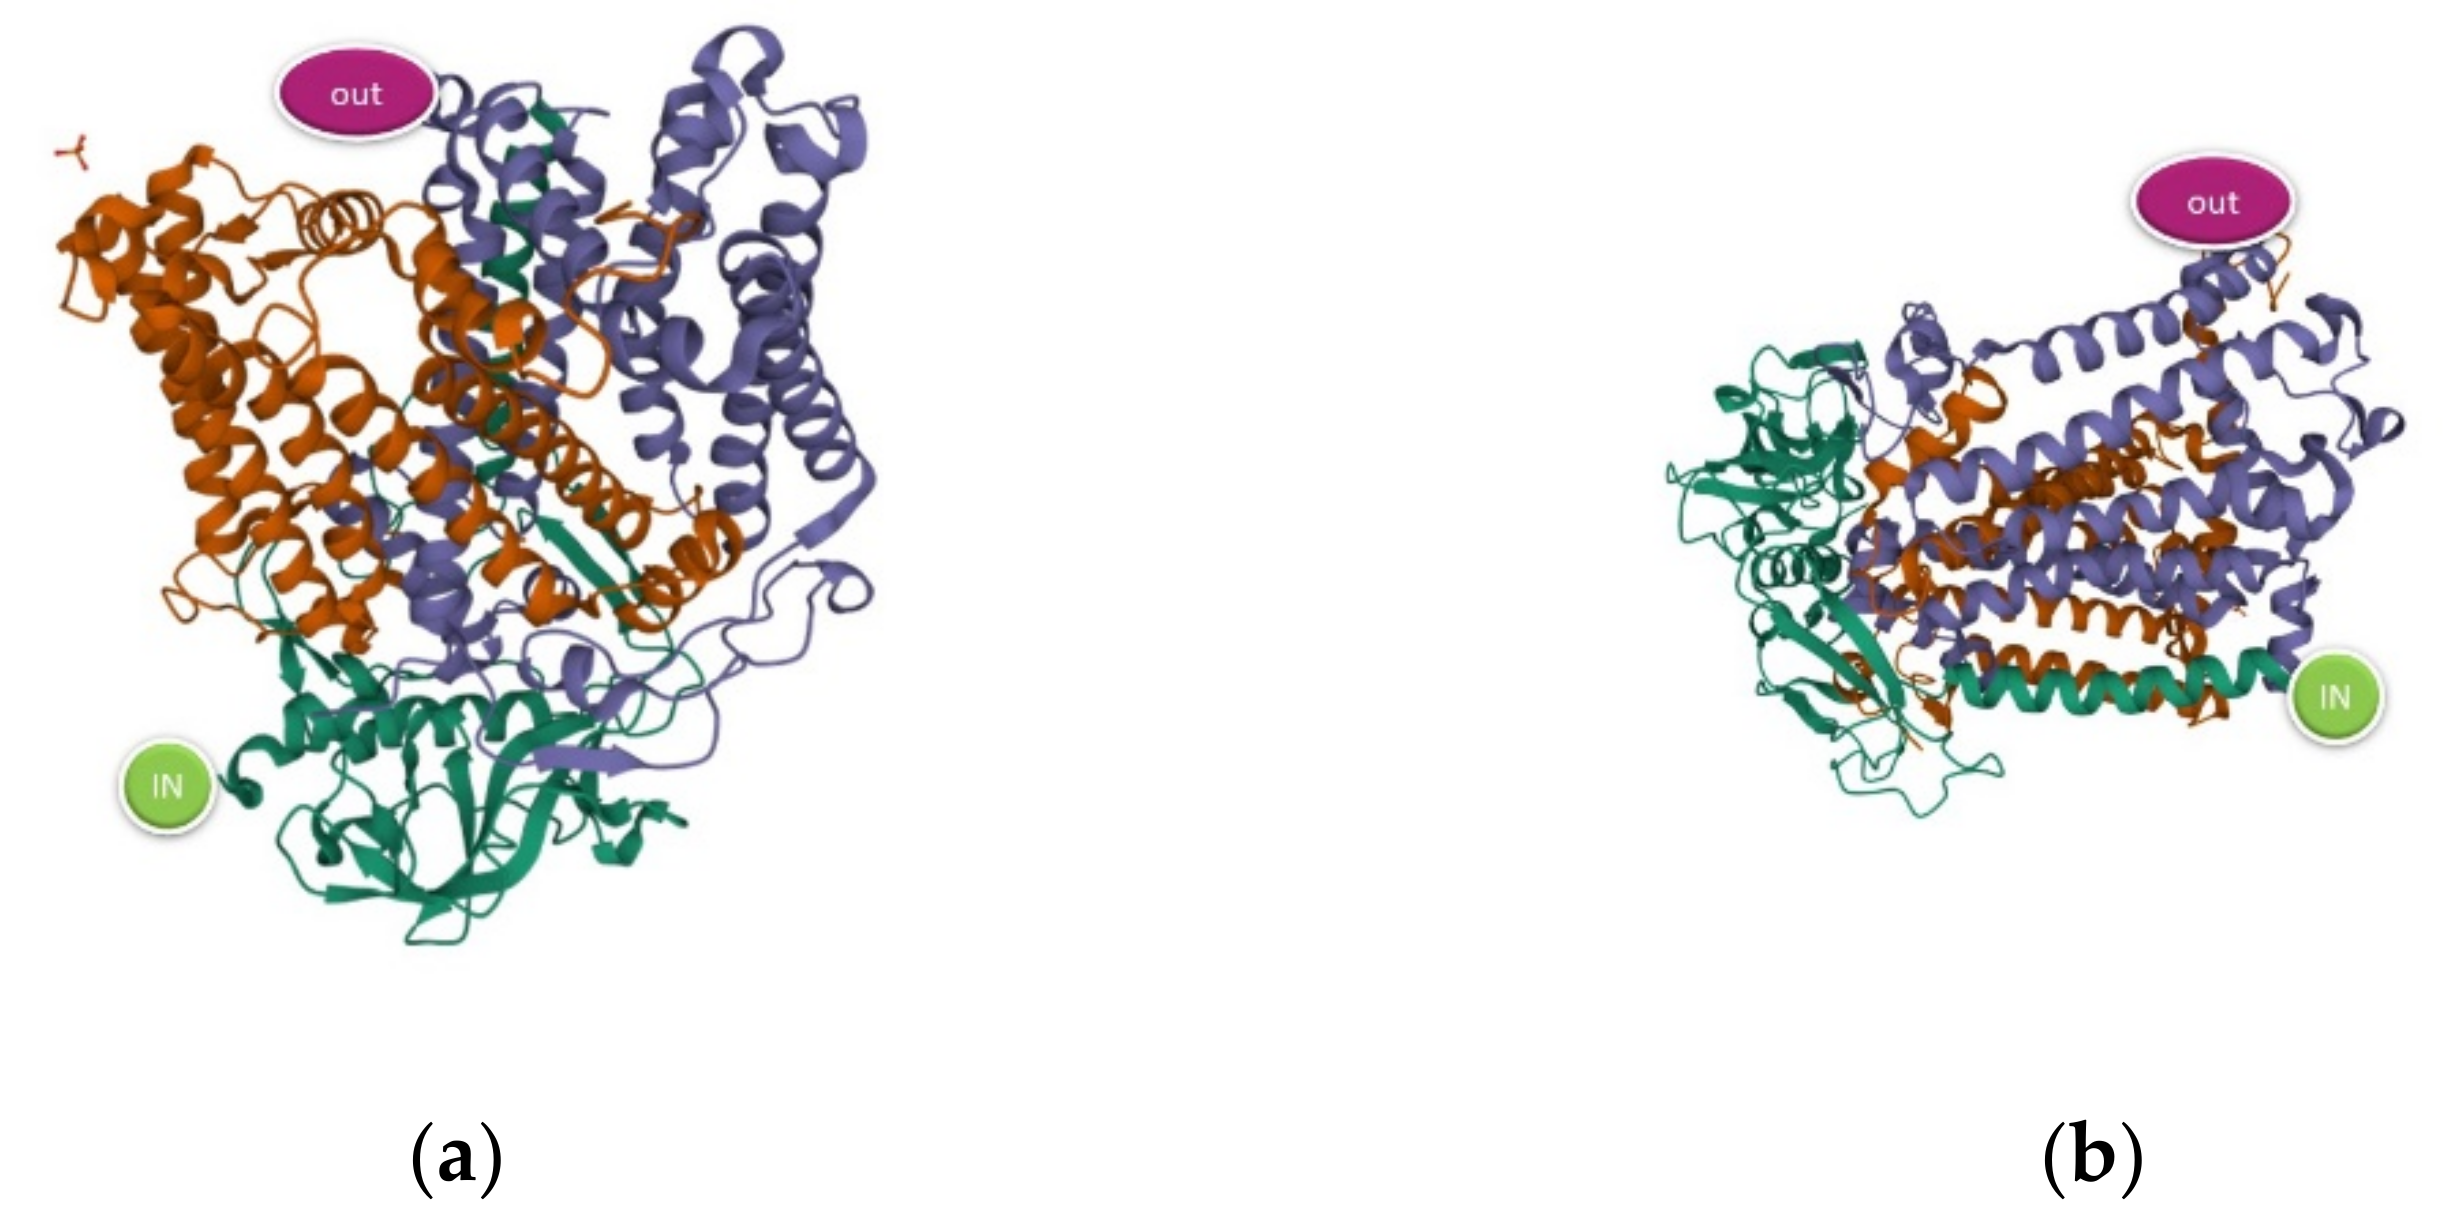
The theoretical model refers to a single protein taken as representative of the macroscopic electrical response. The role played by the position of the contacts can be of relevance for the results of both experiment and theory. Therefore, within a first estimate, we will consider two possible contact geometries, a first up-down as in the cell arrangement, and a second tilted of π/2, as it can happen in a nonhomogeneous sample and is visualized in Figure 1.
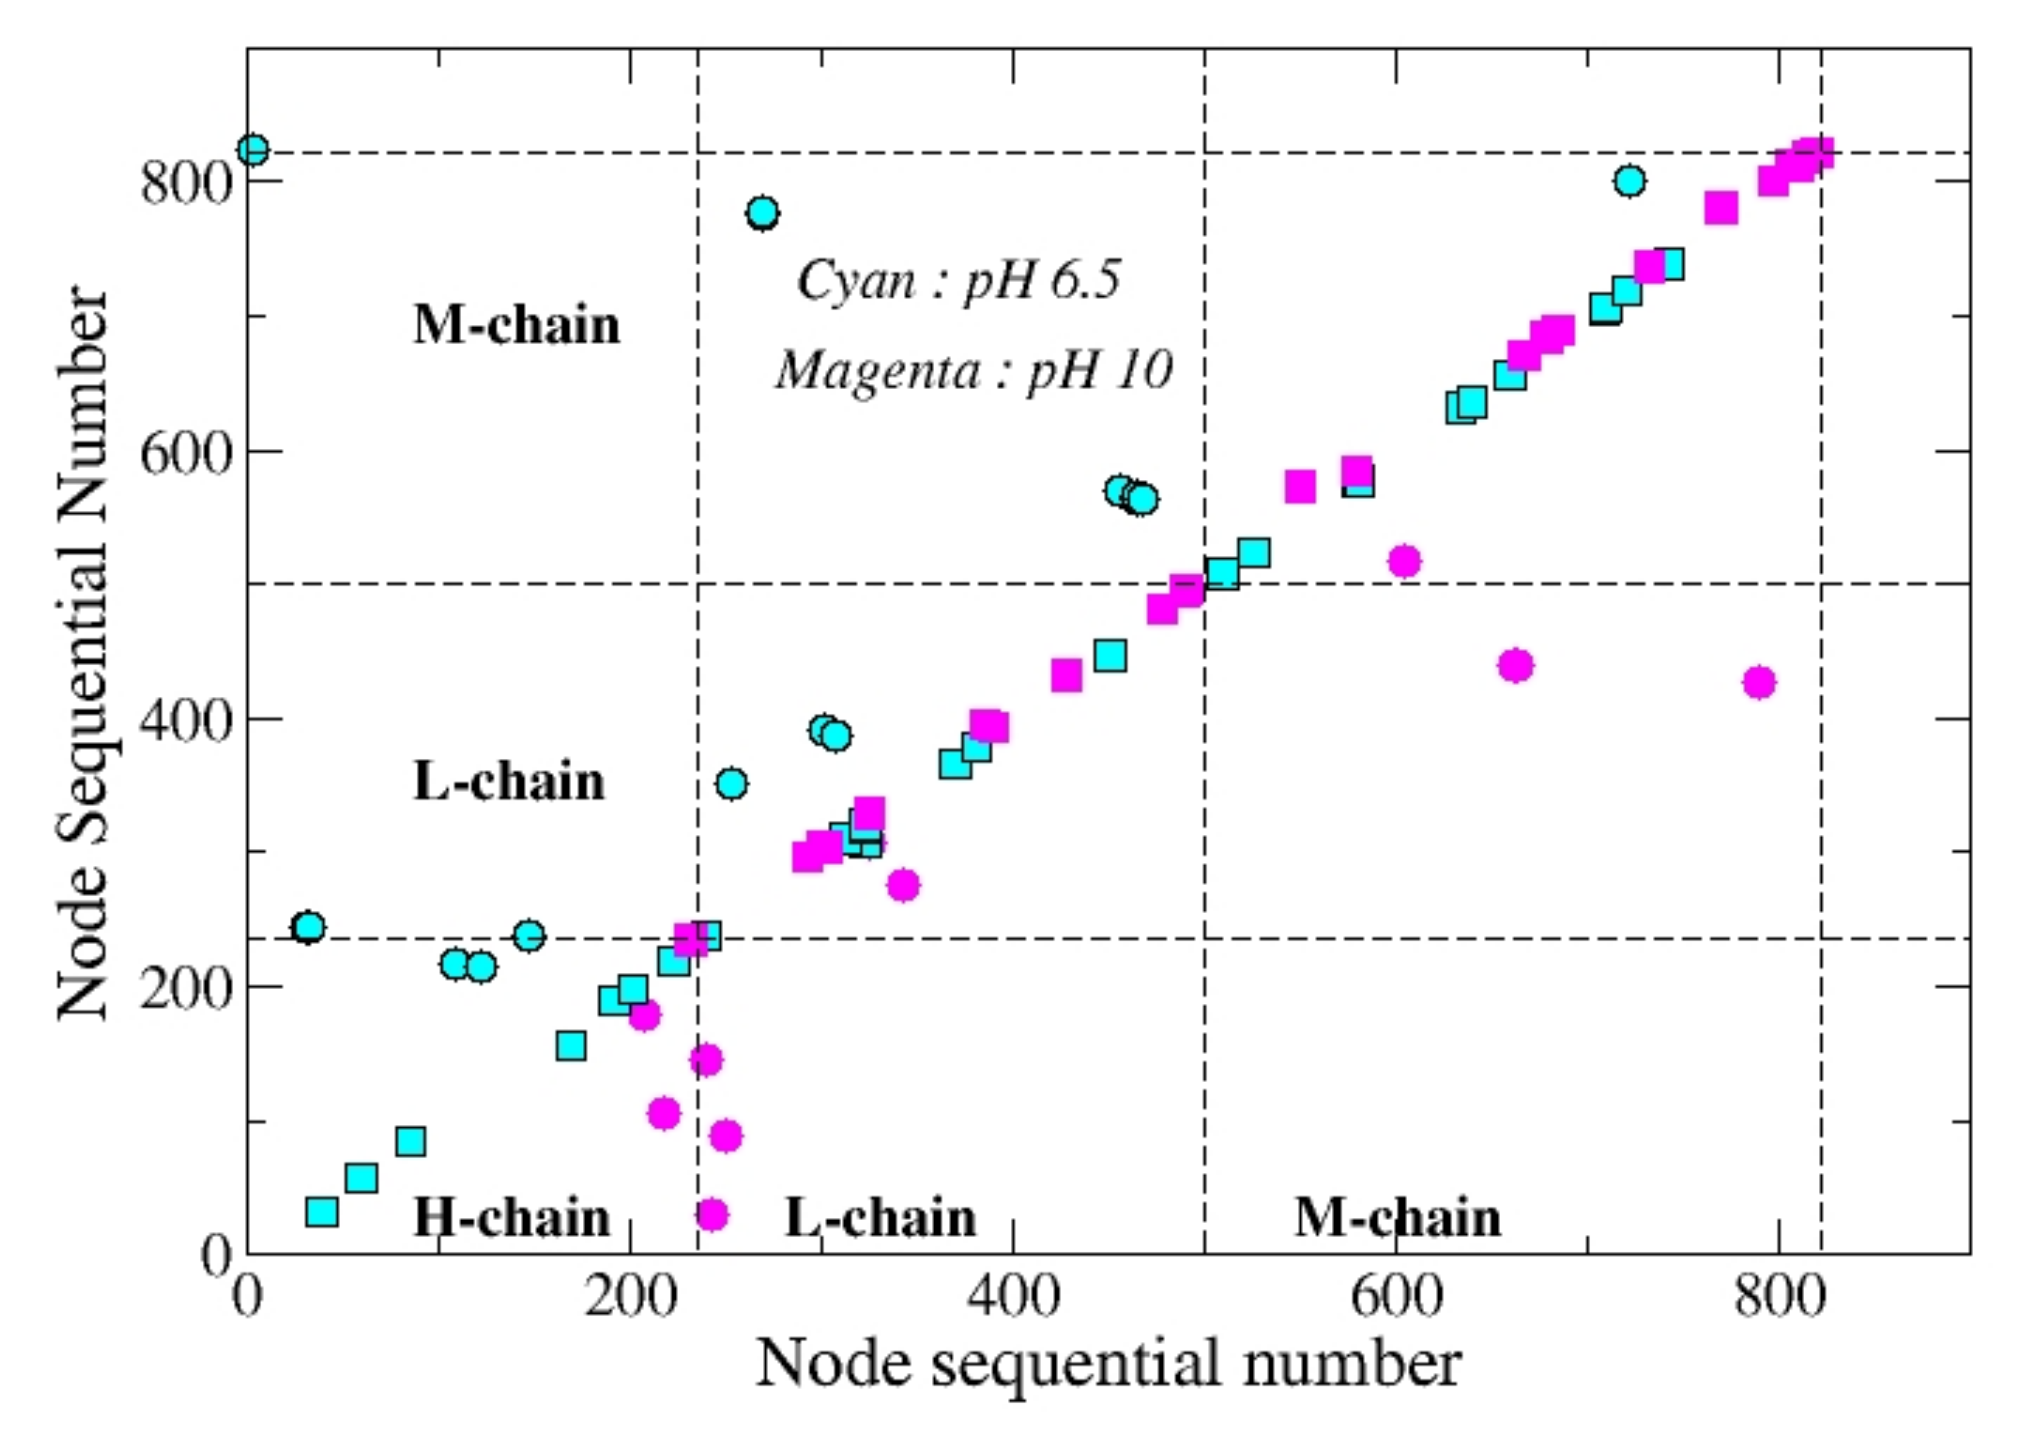
While sensitive structural differences are not impressive to the naked eye, they appear more clearly when the network analysis is performed. As an example, in Figure 2 we report the set of contacts which characterize the structure in dark at two different pH values. Elements on the diagonal correspond to sequential amino acids. This figure shows that the main differences between the pH = 6.5 structure and the pH = 10 structure are mainly due to the position of sequential amino acids. As a matter of fact, at pH = 6.5 more contacts appear on chain H while at pH = 10 more contacts are on chains L and M. In other terms, by increasing the pH the protein deforms from bottom to top, thus becoming tighter toward the periplasmic side.
In the following we investigate two charge-transport regimes that are usually considered by experiments. To this purpose, a first subsection is devoted to the linear response regime, typically adopted within the EIS technique, and a second subsection is devoted to the non-linear transport regime, typically adopted within the CAFM technique. We assume as a benchmark the bRC structure in dark at pH = 6.5 (PDB code 2uww), as well as its impedance value.

3.1. Linear Response Regime

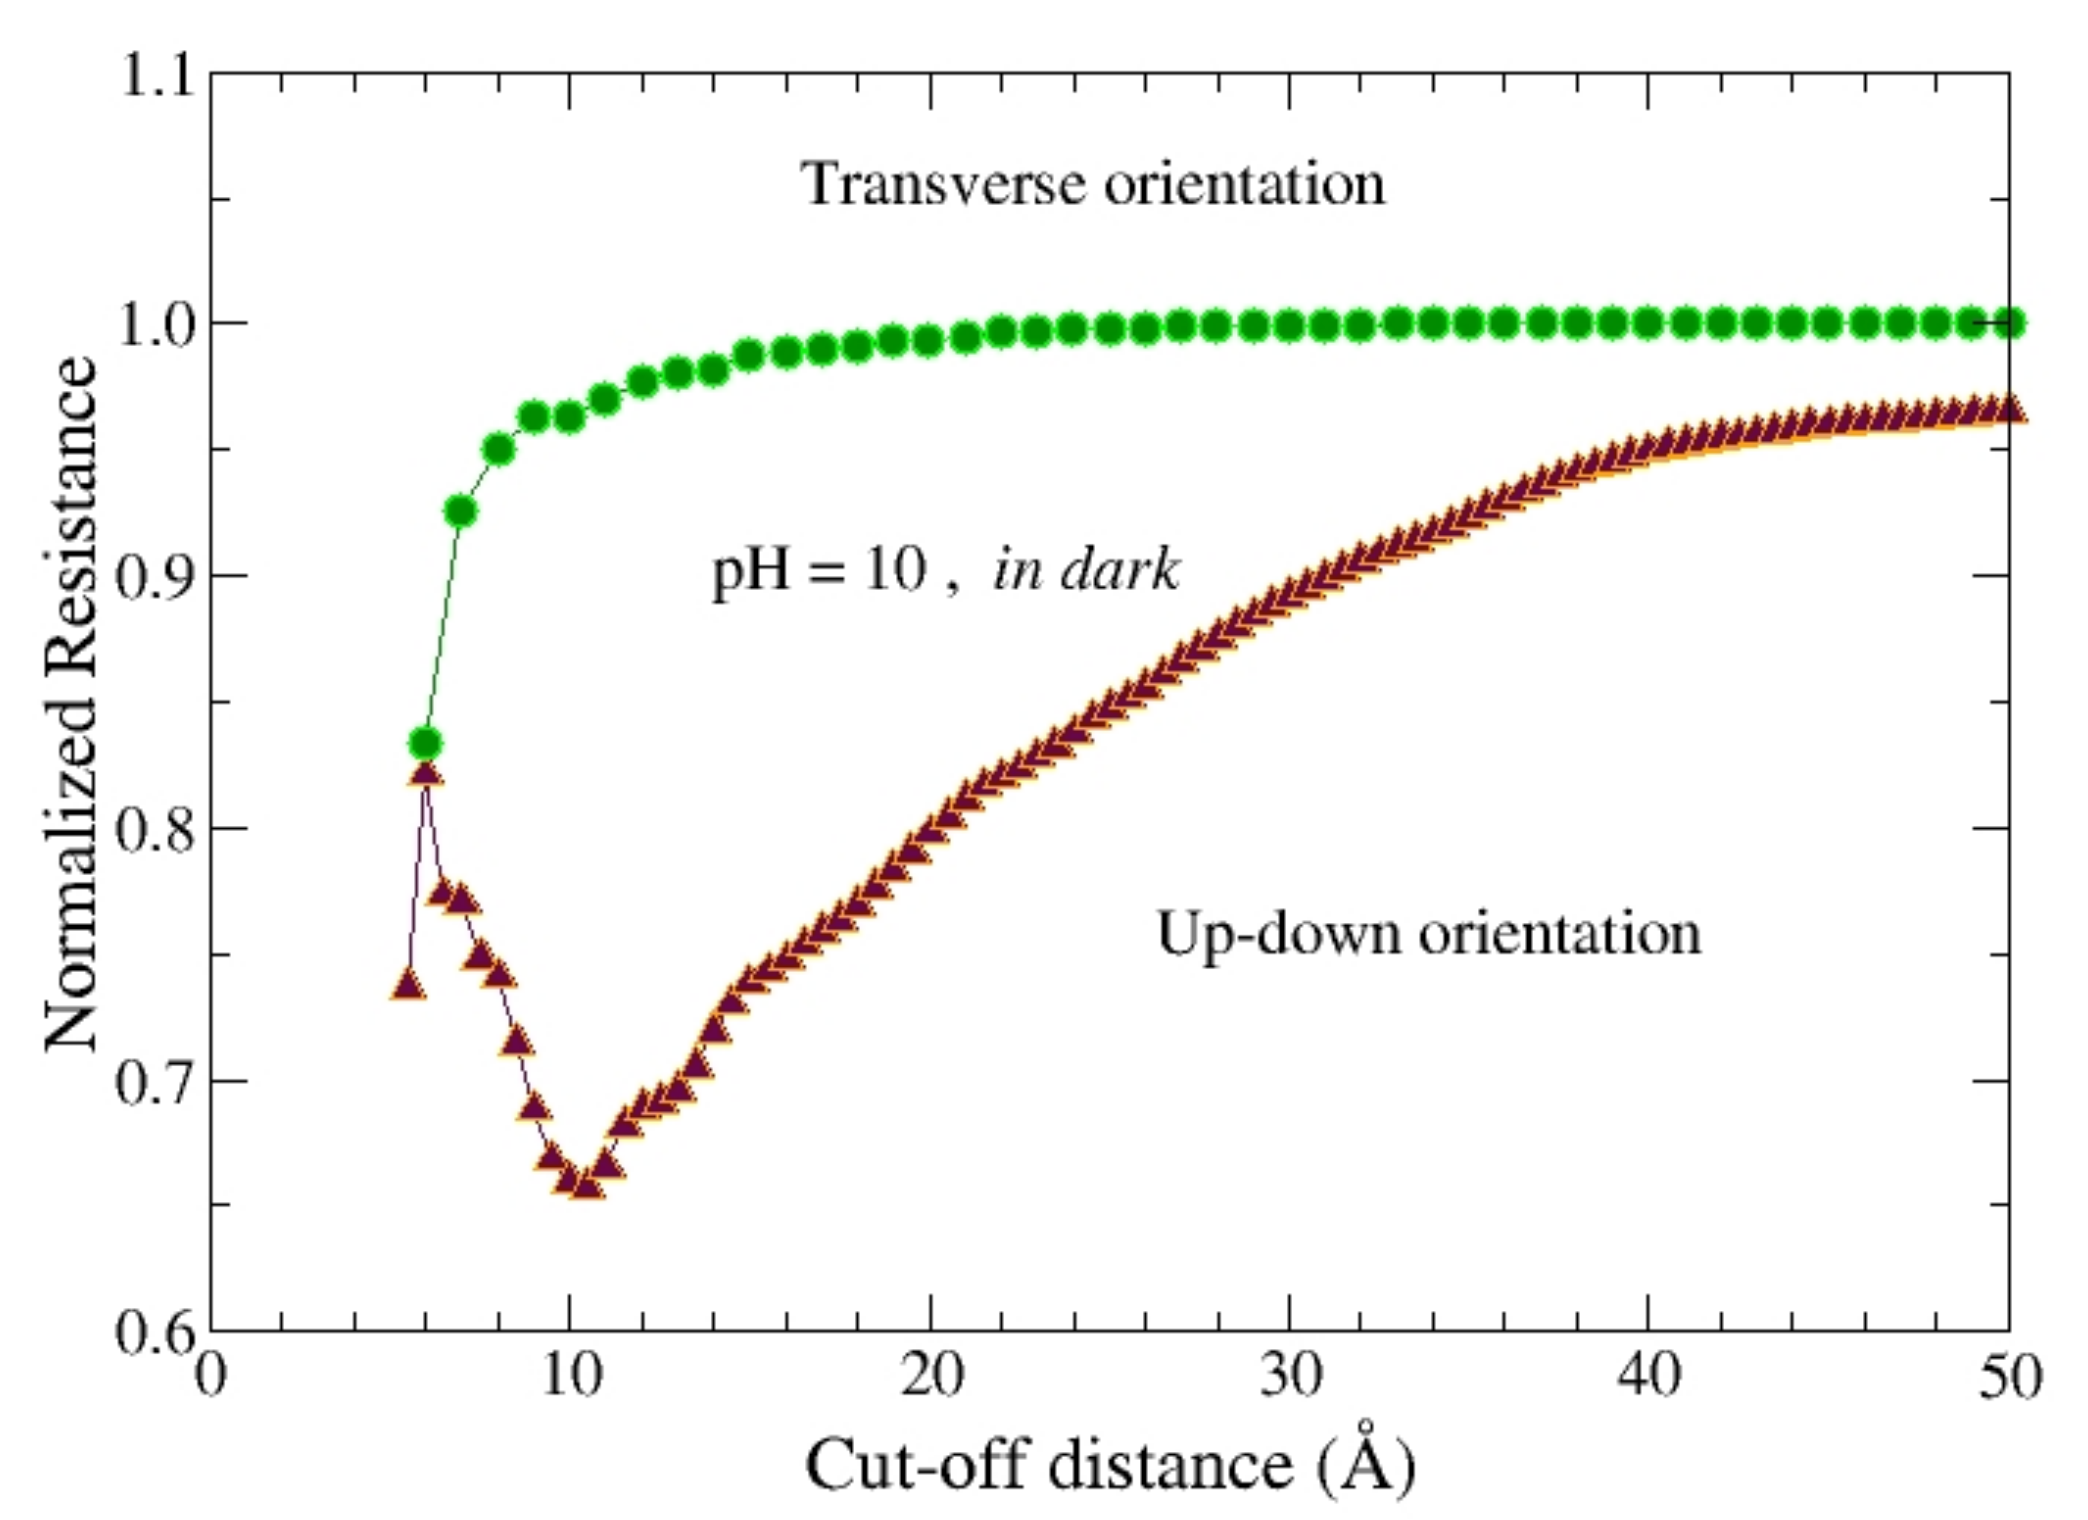
Under linear response regime all the parameters entering the local impedance in Equation (1) do not depend on the applied bias. Accordingly, Figure 3 reports the normalized resistance of the single protein in dark, R (#)/R, i.e., the static (DC, i.e., ω = 0) global resistance R (#) of the protein, normalized to the benchmark value R, in dark, as a function of the cut-off distance between neighborhood nodes, D. In particular, the protein at pH = 10 (PDB code 2uxj) is compared with the protein at pH = 6.5 (PDB code 2uww). Calculations have been performed by using two different contact configurations as reported in Figure 1.
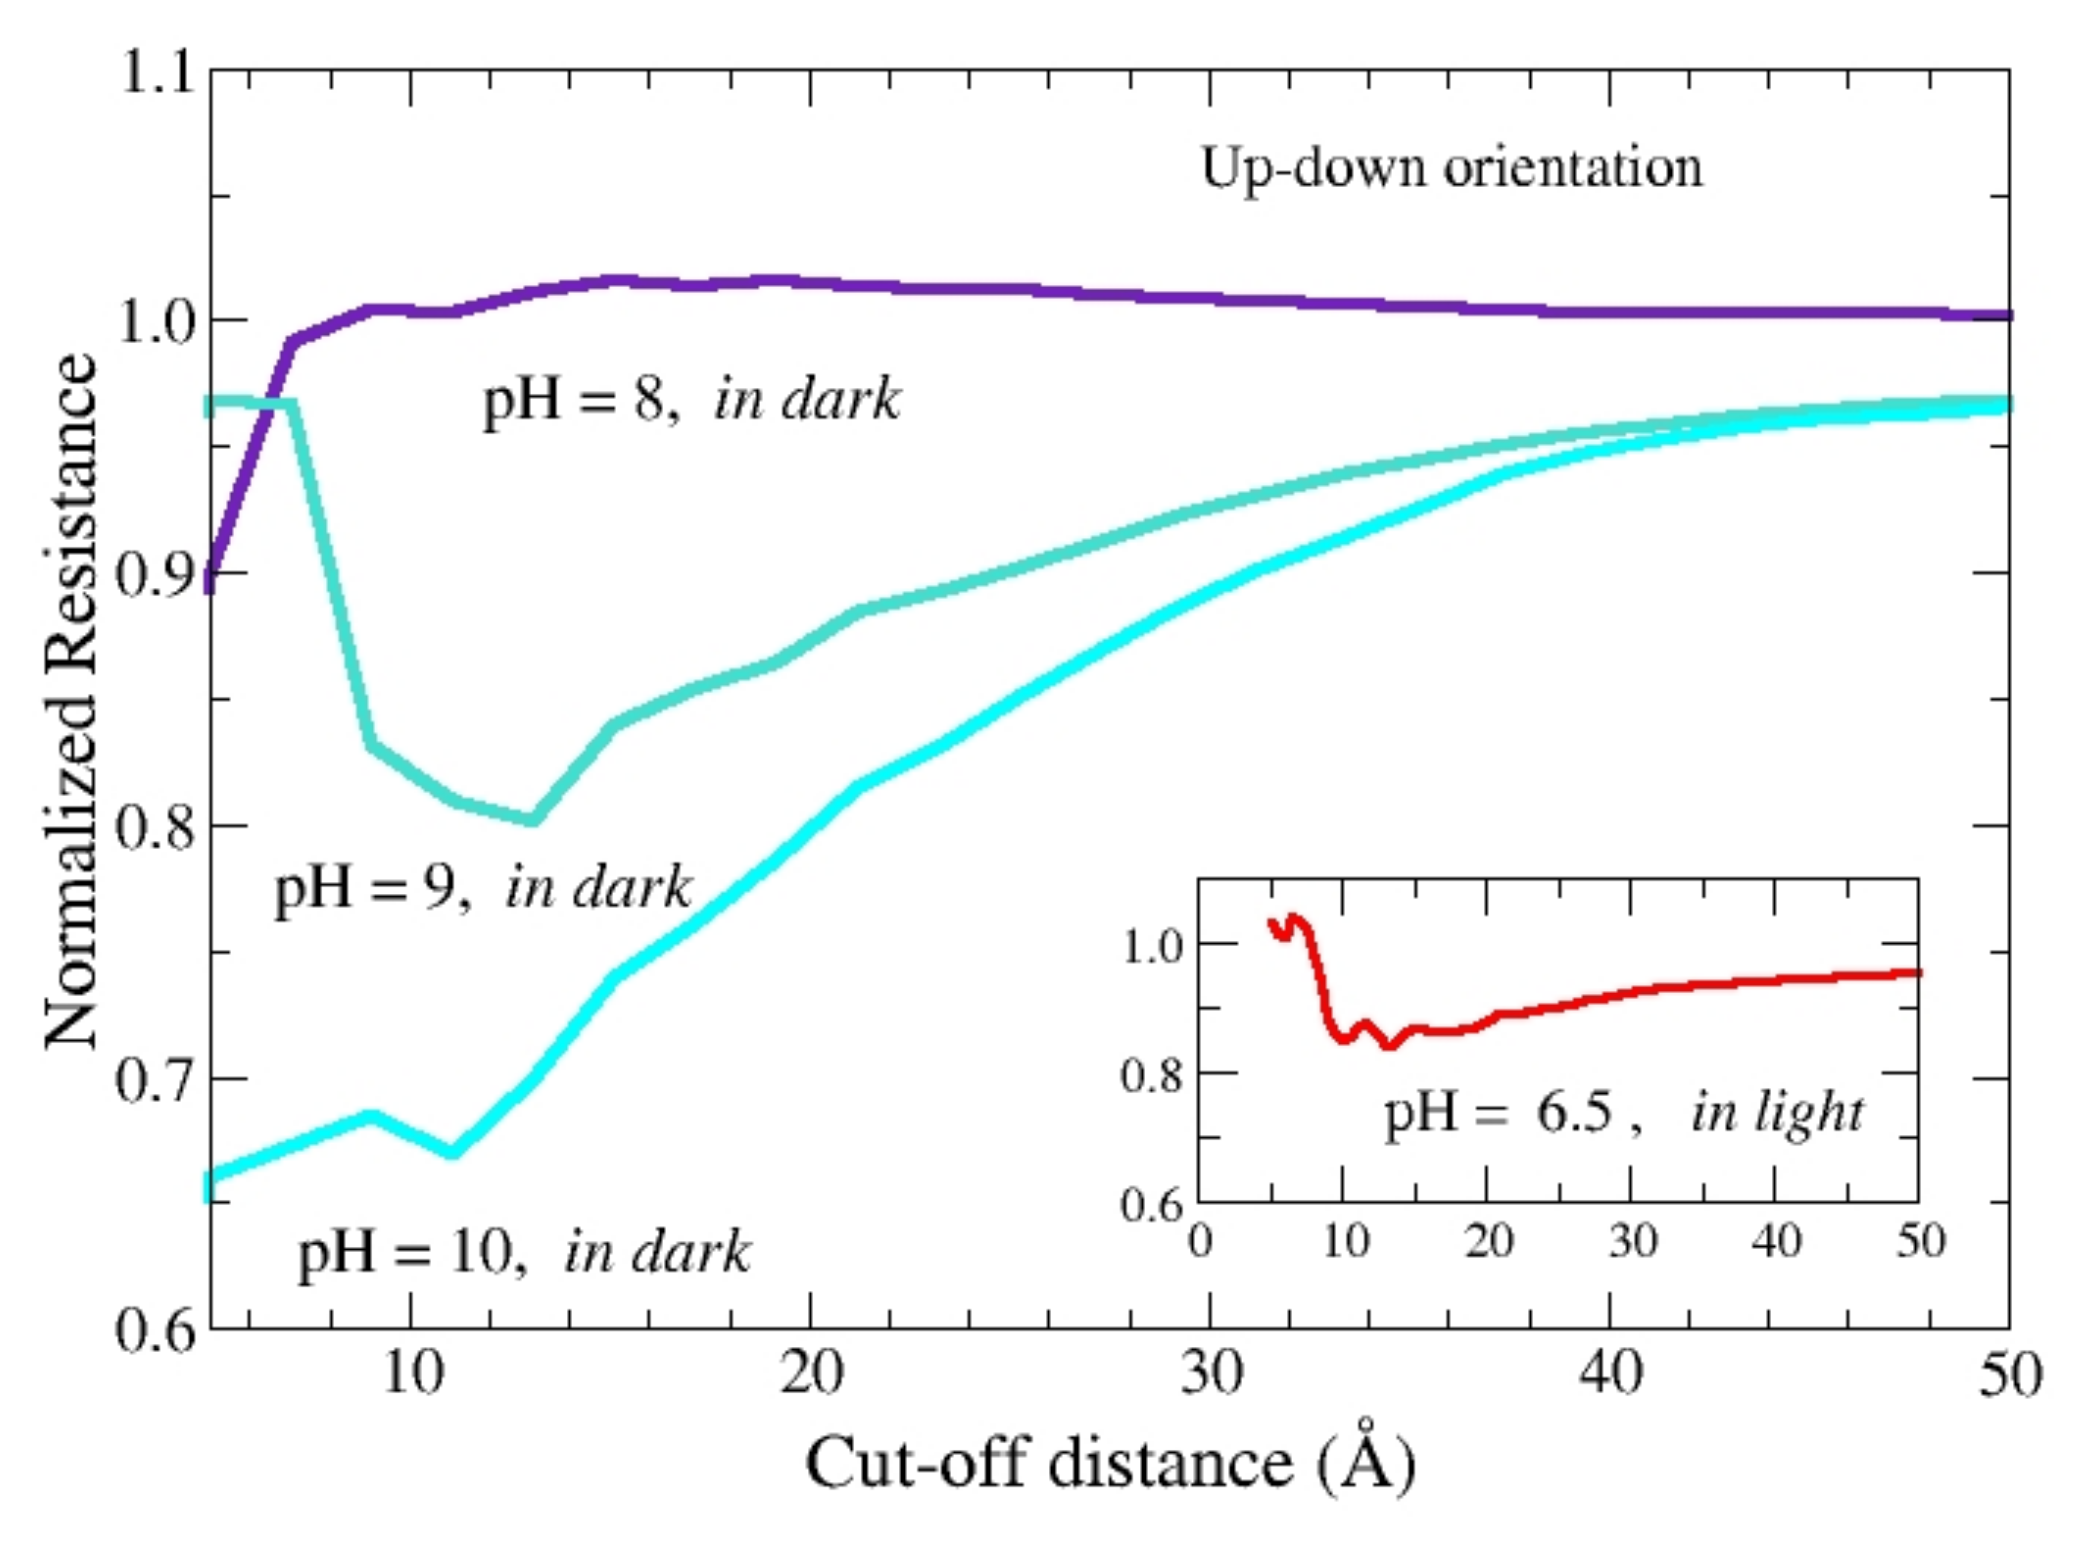
From the above comparison we conclude that the value of the pH plays a significant role only in the up-down orientation, where the value of the resistance stays well below that of the benchmark. By using the up-down orientation, Figure 4 reports the normalized resistance of the single protein, R (#)/R, calculated at different values of pH. A higher sensitivity is observed at increasing values of pH. In particular, the best resolution is observed for the value D = 10.5 Å of the cut-off distance, that compares well with the value D = 6 Å found for the case of bacteriorhodopsin (bR), a protein like bRC but with a smaller number of amino acids for about a factor of 4 [14]. In the inset of Figure 4 the resistance of the protein in light at pH 6.5 is compared with the benchmark resistance. In this case, the maximal resolution also shows up for a cut-off value D = 10.5 Å, with a reduction of resistance in fair agreement with experiments [12].
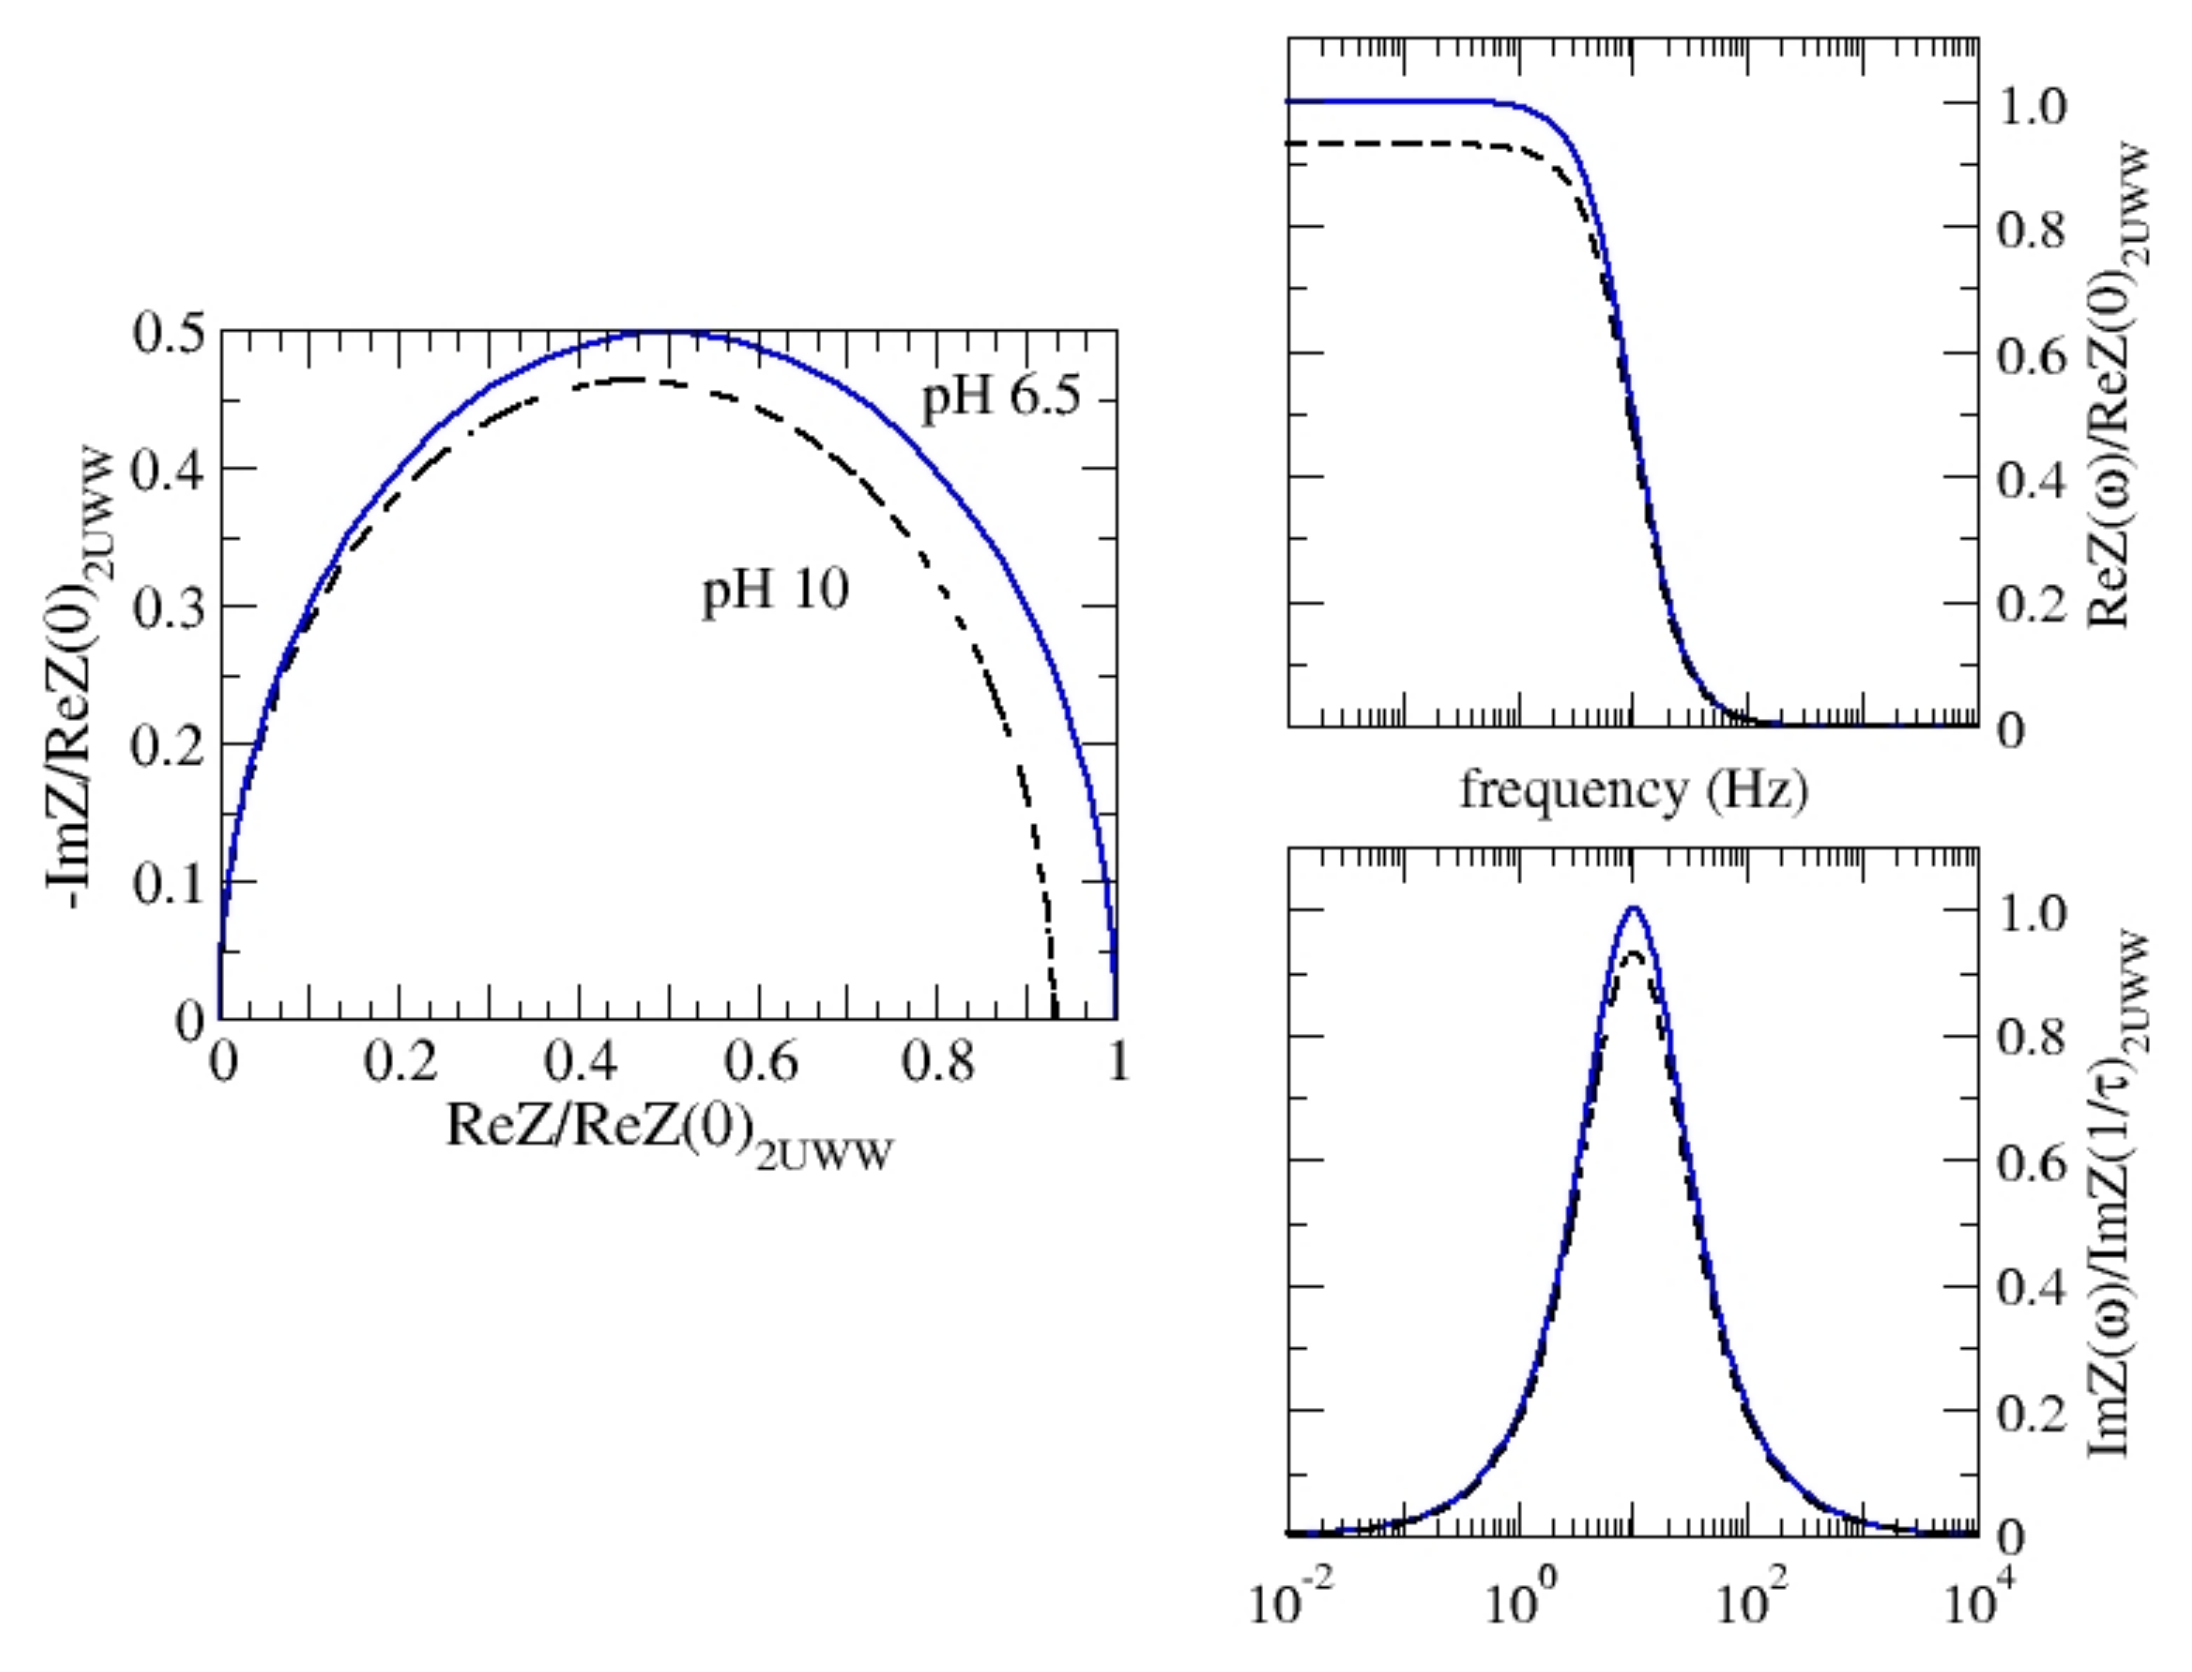
Finally, making use of the up-down orientation in dark, and taking ρ = 2.7 × 10¹² Ω Å we evaluate the complete impedance spectra for pH = 6.5 and 10 respectively, in the frequency range (10−2–104 Hz) which covers the full experimental range. In this range, experiments detect the solution effects, mainly at the highest frequencies, and the electrode resistance, at the lowest frequencies. Otherwise, all the cell elements contribute to the global impedance response in the full frequency range [20,21]. The impedance model may be complex to account for several effects that could be detected by experiments. Anyway, the main contribution is given by Equation (1) and accounts for both the polarization and some leakage currents which are usually present in real dielectrics [9,14,21,25]. In an electrochemical cell conduction there is both an electronic and ionic origin, i.e., charge may travel through both organic/inorganic matter and the electrolytic solution. Furthermore, charge may accumulate between different solid/liquid or solid/solid interfaces [21]. Equation (1) describes an elemental circuit consisting of a resistance (R) and a capacitor (C) in parallel, R//C, and its graphical representations in terms of frequency are called Bode plots. The imaginary vs. the real part of impedance is represented by the so-called Nyquist plot. Calculated Nyquist and Bode plots could be attributed to an ideal single R//C circuit (see Figure 5), which means that the elemental R//C circuits in the protein (each of them representing a single link) exhibit a synchronous response. In other terms, a single relaxation time is detected, the same for both configurations, τ = 0.015 s. This value is compatible with the experimental data reported in the literature [21]. With different configurations of geometries, their elemental capacitances exhibit different values that are larger for the case of a pH = 10, in fair agreement with the observation of a tighter shape with respect to the pH = 6.5 configuration.

3.2. Super-Linear Response Regime

To reproduce the super-linear behavior exhibited by the current-voltage (I-V) experiments obtained with a CAFM technique, at increasing values of an applied positive-voltage [12], the microscopic model makes use of a sequential tunneling mechanism of charge transfer between different nodes that are assumed to be separated by an energy barrier Φ. Accordingly, the link resistivity, ρ j , k is chosen to depend on the local voltage drop V j , k between the couple of j,k amino acids involved in the link, as:
ρ j , k = ρ m a x   ,   i f   e V j , k   Φ ρ m a x   Φ e V j , k + ρ m i n   1 Φ e V j , k ,   i f   e V j , k   Φ
Specifically, the current response is simulated by using a stochastic Monte Carlo procedure to allow the charge transfer channels to reduce their initial resistivity from a ρ m a x value to a ρ m i n value at increasing of the potential drop between nodes [14,25,26,27,28,29]. This is on the wake of the well-known Simmons model for the charge injection in an electronic junction [30]. Indeed, the model describes two different tunneling regimes: at low bias it envisages a direct tunneling mechanism, at high bias overtaken by an injection tunneling mechanism. At low bias, the condition e V j , k   Φ holds for most of the channels that take the same ρ m a x value, thus the global response of the protein is like that of a high resistance Ohmic conductor. At increasing bias, e V j , k   Φ , an abrupt drop of the resistivity to the minimal value, ρ m i n , occurs for the given channel and the global resistance of the protein will decrease accordingly. At further increasing of the bias, most of the channels will take the ρ m i n value and the global response of the protein will be like that of a low resistance Ohmic conductor. The tunneling transition probabilities including direct, P j , k D ,   and injection, or Fowler Nordheim (FN), mechanisms, P j , k F N , reads:
P j , k D = exp 2 l j , k 2 m Φ e V j , k 2   i f   e V j , k   Φ ,  
P j , k F N = exp 2 l j , k 2 m Φ 3 / 2 2 e V j , k   i f   e V j , k   Φ ,  
where is the reduced Planck constant, e is the unit charge, and m is the electron effective mass, here taken the same of the bare value.
Some more details about the procedure can be found in the Appendix A (Figure A1).
Current-voltage characteristics under different conditions are reported in the following Figure 6, Figure 7 and Figure 8.
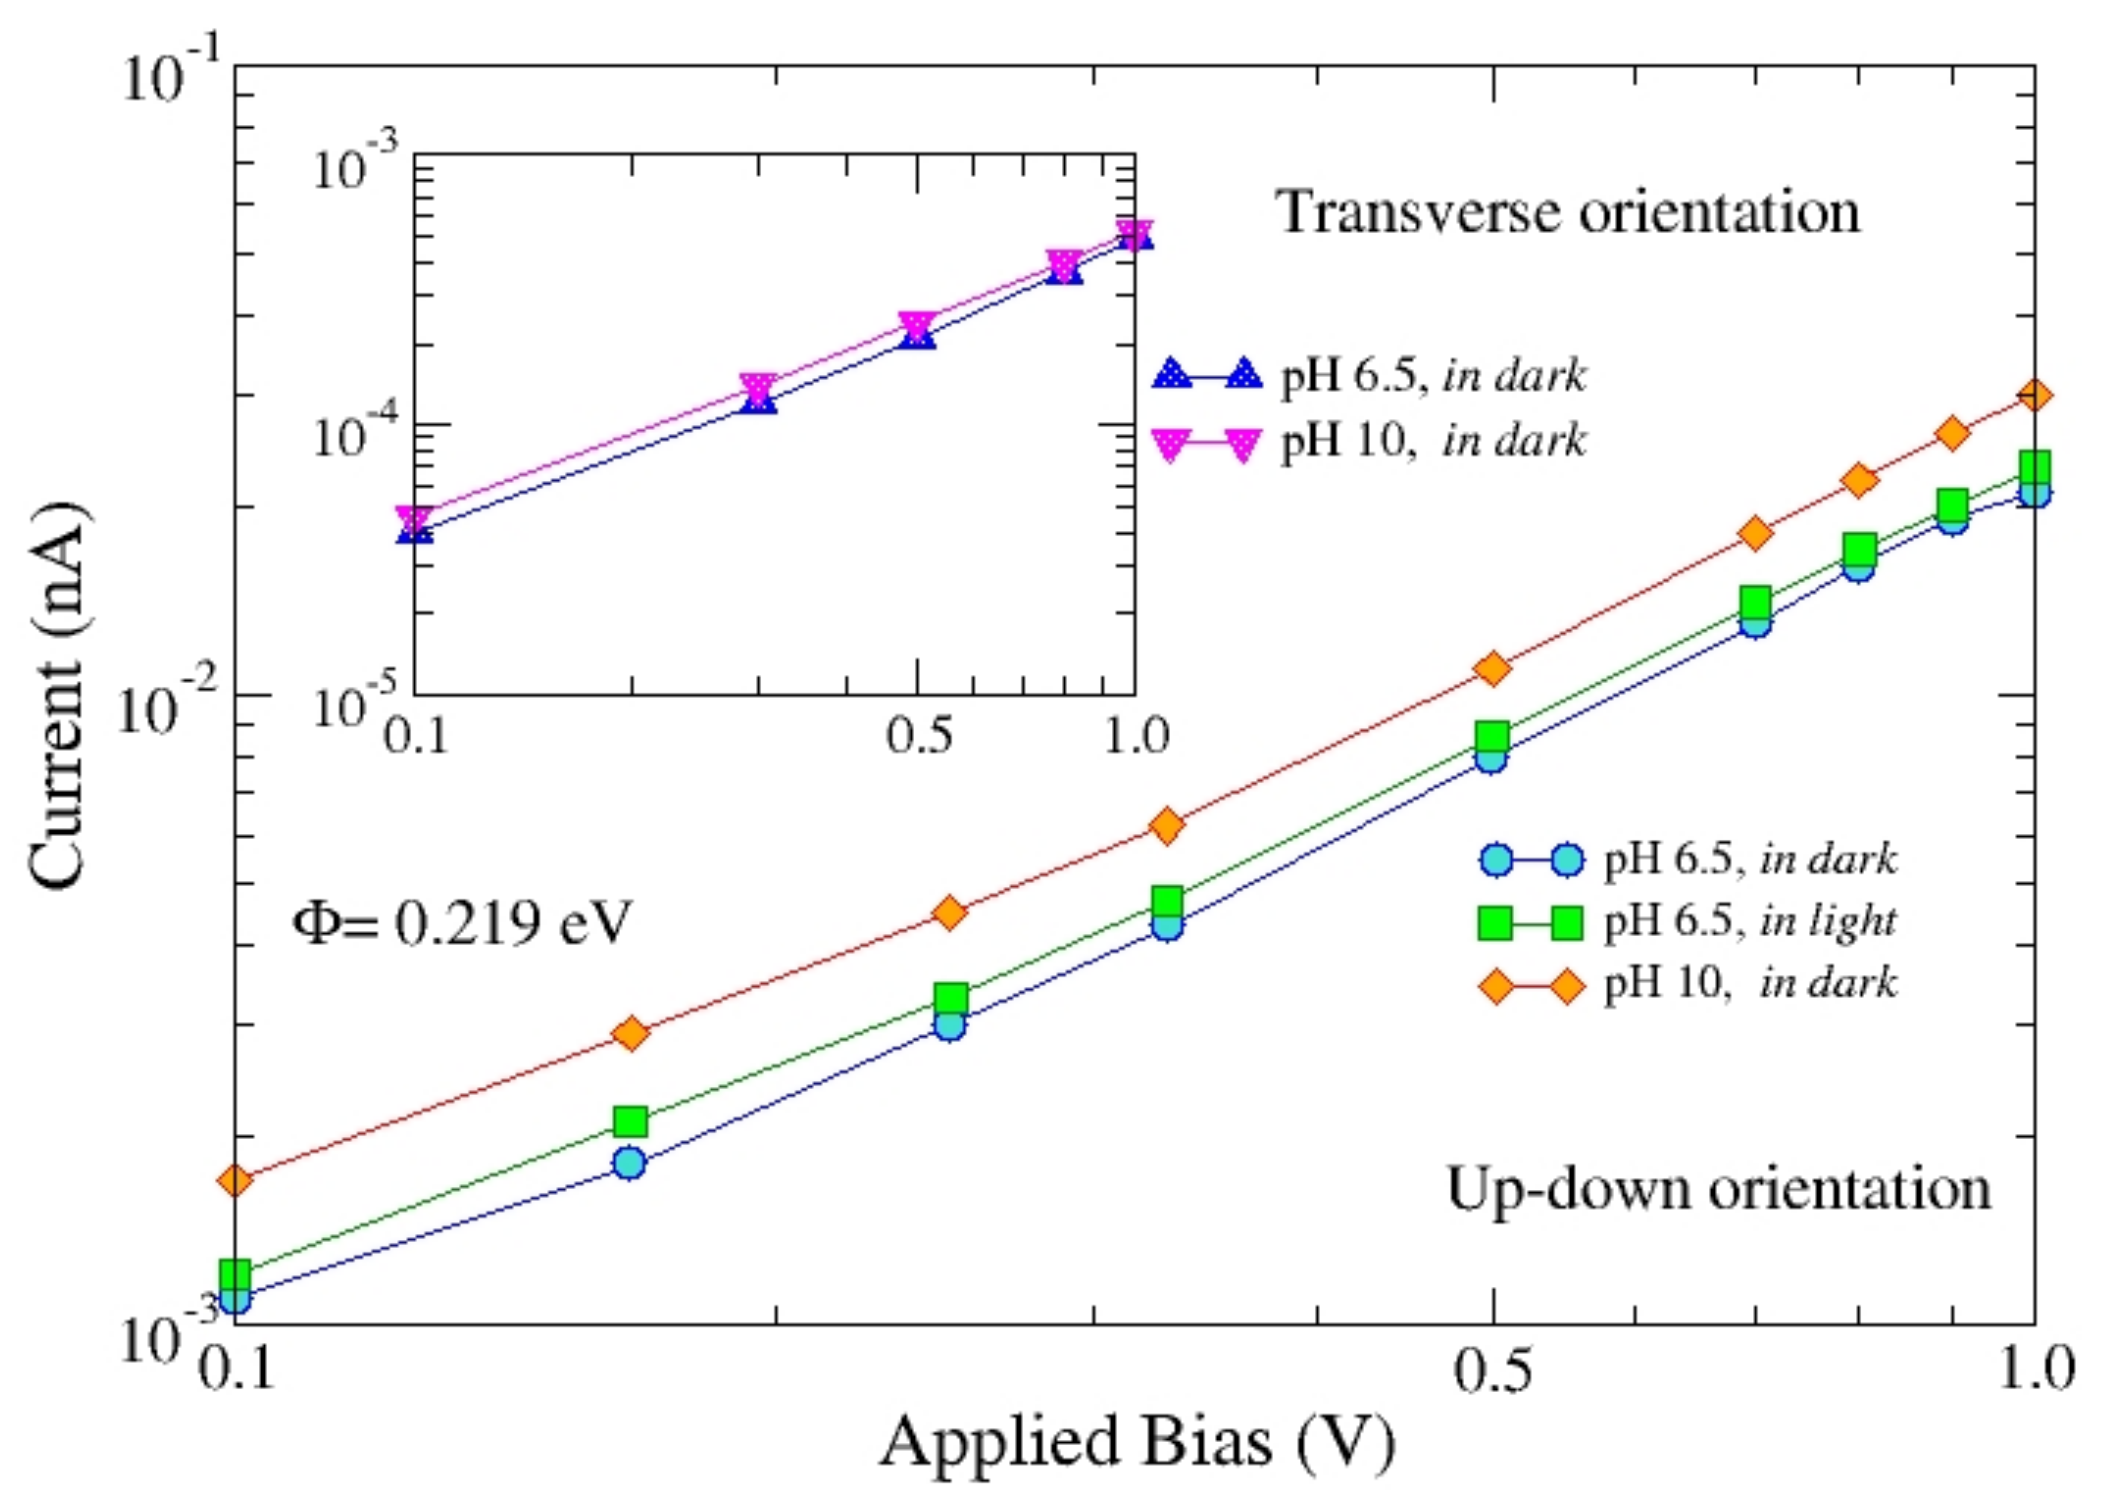
By using up-down and transverse orientations, Figure 6 compares the I-V characteristics of bRC in dark, at pH = 6.5 and 10. Furthermore, in the up-down orientation, the I-V characteristics of bRC in dark and light at pH = 6.5 are compared. The current response of the up-down orientation is found to be of about 2 orders of magnitude higher than that of the transverse orientation. The sensitivity to the increase of pH is small for the transverse orientation, while it goes up to about 50% for the case of the up-down orientation (at 1 Volt). Calculations use the following parameters: ρ m a x = 2.7 × 10¹² Ω Å, ρ m i n = 2.7 × 10⁴ Ω Å and Φ = 0.219 eV. These data confirm that the primary role of contact position does not disappear in the super-ohmic regime. On the other hand, they emphasize the small effect of illumination on the protein 3D arrangement.
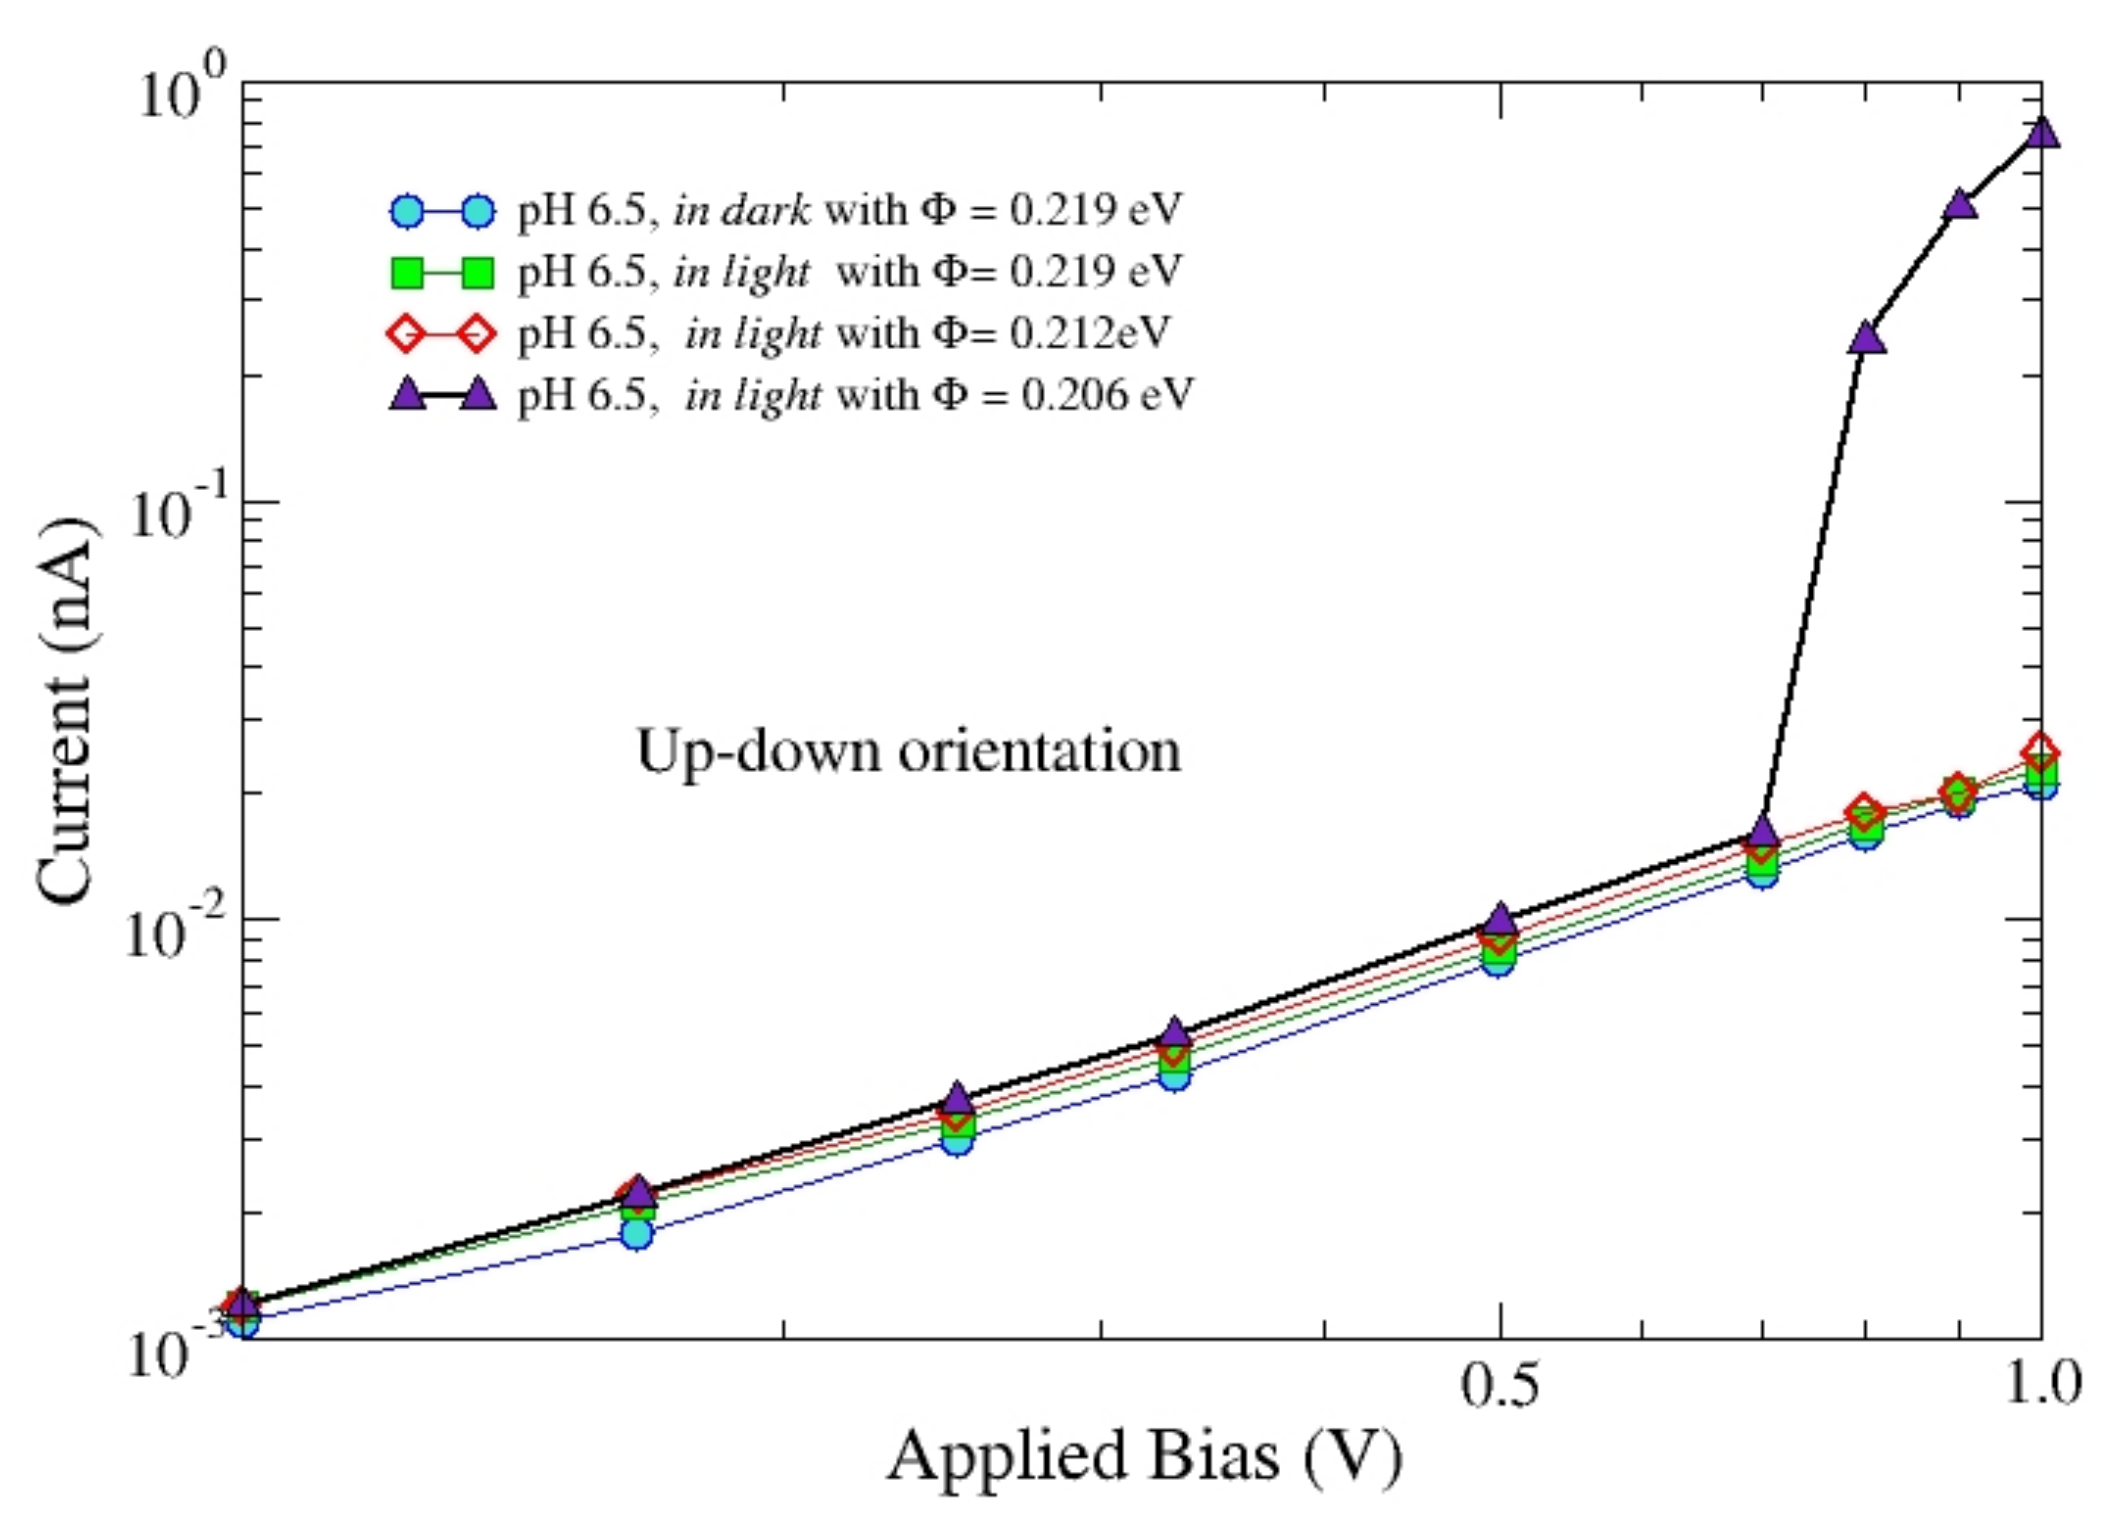
Figure 7 reports the I-V characteristics of bRC in the up-down in dark orientation and in light at pH = 6.5 for a range of applied bias of interest for experiments.
Calculations make use of three values for the barrier height, Φ = 0.219 eV (squares), Φ = 0.212 eV (diamonds), and Φ = 0.206 eV (triangles). Even a small decrease of the barrier height is found to be responsible for a significant increase of the current in light for applied voltages above about 0.7 V, due to the anticipated onset of tunneling in the FN regime. By contrast, for the same value of the barrier height the results in light and in dark are practically the same apart from a small increase of the current of about 6%. These results suggest that in bRC, part of the light energy could be transferred to the electrons injected in the protein thus leading to a further increase of the current.
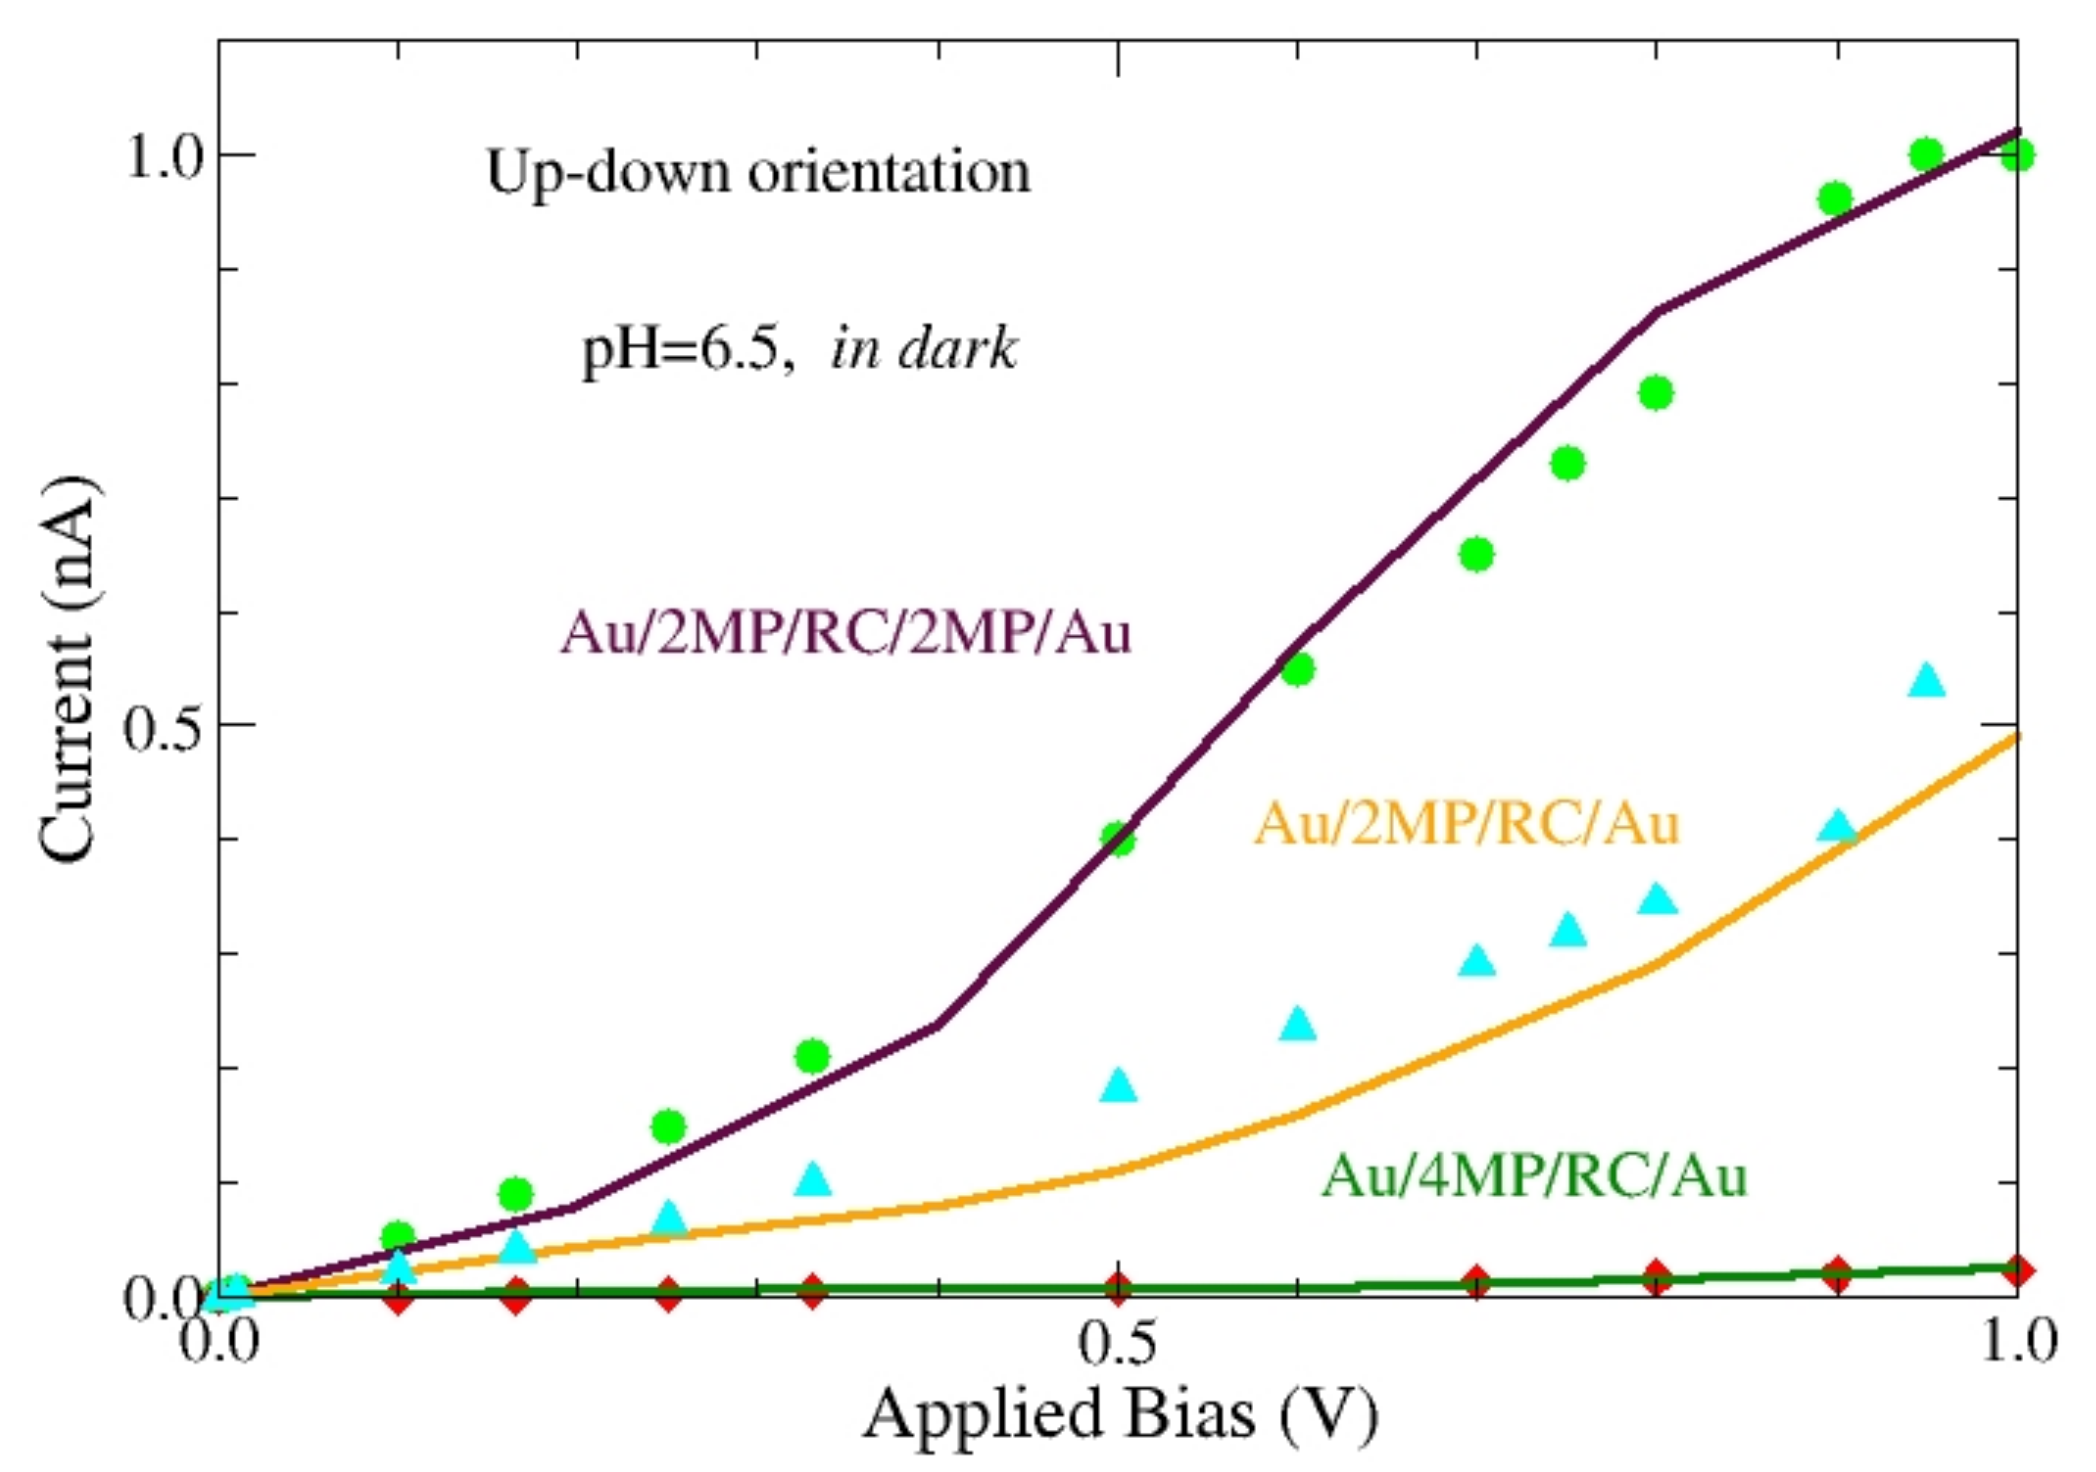
Figure 8 reports the I-V characteristics calculated in dark at pH = 6.5 for the protein in the up-down orientation (symbols) and are compared with experiments [12], (continuous lines). In these experiments, performed with the CAFM, the protein was immobilized on an Au-electrode and contacted with the CAFM tip. Both the electrode and the tip have been coated with different chemicals. Here we focused on three different assemblies, say, Au/4MP/protein/Au, Au/2MP/protein/Au and Au/2MP/protein/2MP/Au, where 2MP indicates 2-mercaptopyridine and 4MP 4-mercaptopyridine [12].
The satisfactory agreement between theory and experiments is obtained by using different values for ρ m a x to account for the different chemical modifiers used to anchor the protein, while keeping the same values for the other parameters. Three different values of ρ m a x have been used, namely: 2.7 × 10¹² Ω Å, 1.2 × 10¹¹ Ω Å and 5.4 × 10¹² Ω Å, to fit experiments performed by using, respectively, the Au/4MP/protein/Au, Au/2MP/protein/Au, and Au/2MP/protein/2MP/Au, assembly. This result suggests that the role played by the chemical modifiers of the electrode and/or the CAFM tip is to increase the effective conductivity of the protein and it is not due to the change of the potential barrier height. As a matter of fact, the shape of the I-V curve is practically the same for the three cases, while the absolute value is changed. Therefore, the reduced effective conductivity should be due to a better match of the Fermi level of the electrode with the LUMO/HOMO molecular orbitals of the protein, as suggested in Reference [12]. As a matter of fact, having carried out the theoretical analysis with the same orientation (up-down), a realignment due to the chemical modifiers seems to be less relevant.

4. Discussion and Conclusions

By using the tertiary structure of the bRC protein, its electrical characteristics are investigated under dark and light conditions and at different values of the pH of the crystallized solution, ranging from weak acid up to strong alkaline values. Theoretical calculations are carried out in the framework of the proteotronics, a structure-minded approach to the recent field of protein-based electronics. Analysis explores the macromolecule electrical response in both linear and non-linear regime.
The procedure starts by mapping the macromolecule onto a graph which accounts for the protein structure. The graph is used to describe the electrical response of the protein in the philosophy of the lumped-element model, thus becoming an electrical network. A percolative-like process allows the analysis of the structure by using an ideal flow of charge that goes through the protein. The resistance that the network opposes to the charge flow measures its degree of connectivity and is a powerful tool to discriminate among different (although, sometimes, very similar) structures. In the present case, different pH values or different illumination conditions produce different networks, thus different electrical responses.
Specifically, in the linear regime, i.e., at sufficiently low values of an applied bias, calculations of the electro-chemical impedance spectroscopy suggest that bRC is significantly sensitive to the pH value of the solution in which it is crystallized. The protein undergoes a resistance reduction when the pH changes from weak acid (pH = 6.5) to alkaline conditions with pH values up to 10, where this change appears even more evident. In the non-linear regime, i.e., at applied voltage values up to few Volts, theory makes use of a stochastic Monte Carlo approach to mimic a charge transport based on a sequential-tunneling mechanism including direct and injected tunneling regimes. Current voltage characteristics evidence a super-linear behavior with an increase of the current above the Ohmic value up to about a factor of two, and to keep the sensitivity to the value of the pH and the presence of the light. The current-voltage characteristics compare qualitatively well with available experiments performed in quasi-neutral conditions and in dark.
These kinds of analysis should be of relevance for both basic and applied research. In the former case, the microscopic characterizations of proteins are still in their infancy when compared with simple inorganic materials, thus justifying the phenomenological approach used for the theoretical model. In the latter case, future application of these proteins in several branches of technology, medicine, solar energy harvesters, etc. are found to be very promising. From one side, they highlight the primary role of environment (here limited to the amount of cations on solution) in the physical-chemical (here electrical) response of biomaterial and how its effects are recognizable in the structure. Similar investigations concerning, for example, the role of temperature on structure and function of bRC, which should complement present data are at present not available, although desirable. From another side, they can be used, for example, to regulate resistance in such devices. Finally, the present investigation can be thought to provide a valuable hint for designing pH-sensors.

Author Contributions

Conceptualization, methodology, validation, writing and editing E.A. and L.R.; software, E.A. All authors have read and agreed to the published version of the manuscript.

Funding

This research was funded by EEC, grant number 228685-2.

Data Availability Statement

The data that support the findings of this study are available from the corresponding author upon reasonable request.

Conflicts of Interest

The authors declare no conflict of interest.

Appendix A

Equations (1) and (2) are numerically implemented by using a standard numerical method for the solution of linear equations which could account for a stochastic evolution (3) and (4). The method is illustrated by the following flow chart [9,24,25].
Figure A1. Flow chart of numerical calculations. The input data (protein structure, bias, cut-off distance, voltage resistivity for the stochastic procedure-blue, and protein structure, bias, cut-off distance, voltage resistivity, dielectric constants and frequency, for the deterministic procedure-red) are used to build-up the graph and the elementary impedances. Global quantities (capital letters, impedance/resistance, current) are calculated solving a set of linear equations for: a. for zero frequency, at increasing values of applied potential, V, stochastically assigning a tunneling probability and calculating resistance and current over an assigned set of iterations (blue plot, left side); or b. for different values of frequency, at near zero bias value, calculating the complex impedance (red plot, right side).
Applsci 12 01738 g0a1

References

  1. Dunn, M.R.; Jimenez, R.M.; Chaput, J.C. Analysis of aptamer discovery and technology. Nat. Rev. Chem. 2017, 1, 1–16. [Google Scholar] [CrossRef]
  2. Alfinito, E.; Reggiani, L.; Cataldo, R.; De Nunzio, G.; Giotta, L.; Guascito, M.R. Modeling the microscopic electrical properties of thrombin binding aptamer (TBA) for label-free biosensors. Nanotechnology 2017, 28, 065502. [Google Scholar] [CrossRef] [Green Version]
  3. Tokita, Y.; Tamada, S.; Luo, W.; Goto, Y.; Bouley-Ford, N.; Nakajima, H.; Watanabe, Y. Protein photoconductors and photodiodes. Angew. Chem. Int. Ed. 2011, 50, 11663. [Google Scholar] [CrossRef]
  4. Zhang, L.; Lu, J.R.; Waigh, T.A. Electronics of peptide-and protein-based biomaterials. Adv. Colloid Interface Sci. 2021, 287, 102319. [Google Scholar] [CrossRef]
  5. Allen, J.P.; Feher, G.; Yeates, T.O.; Komiya, H.; Rees, D.C. Structure of the reaction center from Rhodobacter sphaeroides R-26: The protein subunits. Proc. Natl. Acad. Sci. USA 1987, 84, 6162–6616. [Google Scholar] [CrossRef] [Green Version]
  6. Das, R.; Kiley, P.J.; Segal, M.; Norville, J.; Yu, A.A.; Wang, L.; Trammell, S.A.; Reddick, L.E.; Kumar, R.; Stellacci, F.; et al. Integration of photosynthetic protein molecular complexes in solid-state electronic devices. Nano Lett. 2004, 4, 1079–1083. [Google Scholar] [CrossRef]
  7. Altamura, E.; Milano, F.; Tangorra, R.R.; Trotta, M.; Omar, O.H.; Stano, P.; Mavelli, F. Highly oriented photosynthetic reaction centers generate a proton gradient in synthetic protocells. Proc. Natl. Acad. Sci. USA 2017, 114, 3837–3842. [Google Scholar] [CrossRef] [Green Version]
  8. Sun, J.; Yang, P.; Li, N.; Zhao, M.; Zhang, X.; Zhang, Y.; Yuan, Y.; Lu, X.; Lu, X. Extraction of photosynthetic electron from mixed photosynthetic consortium of bacteria and algae towards sustainable bioelectrical energy harvesting. Electrochim. Acta 2020, 336, 135710. [Google Scholar] [CrossRef]
  9. Alfinito, E.; Pousset, J.; Reggiani, L. Proteotronics: Development of Protein-Based Electronics; Pan Stanford: Boca Raton, FL, USA, 2015; ISBN 978-9814613637. [Google Scholar]
  10. Berman, H.M.; Westbrook, J.; Feng, Z.; Gilliland, G.; Bhat, T.N.; Weissig, H.; Shindyalov, I.N.; Bourne, P.E. The protein data bank. Nucl. Acids Res. 2000, 28, 235–242. [Google Scholar] [CrossRef] [Green Version]
  11. Koepke, J.; Krammer, E.M.; Klingen, A.R.; Sebban, P.; Ullmann, G.M.; Fritzsch, G. pH modulates the quinone position in the photosynthetic reaction center from Rhodobacter sphaeroides in the neutral and charge separated states. J. Mol. Bio. 2007, 371, 396–409. [Google Scholar] [CrossRef]
  12. Mikayama, T.; Iida, K.; Suemori, Y.; Dewa, T.; Miyashita, T.; Nango, M.; Gardiner, A.T.; Cogdell, R.J. The electronic behavior of a photosynthetic reaction center monitored by conductive atomic force microscopy. J. Nanosci. Nanotechnol. 2009, 9, 97–107. [Google Scholar] [CrossRef] [PubMed]
  13. Onuchic, J.N.; Luthey-Schulten, Z.; Wolynes, P.G. Theory of protein folding: The energy landscape perspective. Annu. Rev. Phys. Chem. 1997, 48, 545–600. [Google Scholar] [CrossRef] [PubMed] [Green Version]
  14. Alfinito, E.; Reggiani, L. Mechanisms responsible for the photocurrent in bacteriorhodopsin. Phys. Rev. E 2015, 91, 032702. [Google Scholar] [CrossRef] [PubMed]
  15. Jin, Y.; Friedman, N.; Sheves, M.; He, T.; Cahen, D. Bacteriorhodopsin (bR) as an electronic conduction medium: Current transport through bR-containing monolayers. Proc. Natl. Acad. Sci. USA 2006, 103, 8601–8606. [Google Scholar] [CrossRef] [Green Version]
  16. Melikyan, H.; Khishigbadrakh, B.E.; Babajanyan, A.; Lee, K.; Choi, A.R.; Lee, J.H.; Jung, K.-H.; Friedman, B. Proteorhodopsin characterization based on metalinsulatormetal structure technique. Thin Solid Films 2011, 519, 3425–3429. [Google Scholar] [CrossRef]
  17. Białek, R.; Swainsbury, D.J.; Wiesner, M.; Jones, M.R.; Gibasiewicz, K. Modelling of the cathodic and anodic photocurrents from Rhodobacter sphaeroides reaction centres immobilized on titanium dioxide. Photosynth. Res. 2018, 138, 103–114. [Google Scholar] [CrossRef] [Green Version]
  18. Srivastava, J.; Barber, D.L.; Jacobson, M.P. Intracellular pH sensors: Design principles and functional significance. Physiology 2007, 22, 30–39. [Google Scholar] [CrossRef]
  19. Hou, C.; Zhang, F.; Chen, C.; Zhang, Y.; Wu, R.; Ma, L.; Lin, C.; Guo, W.; Liu, X.Y. Wearable hydration and pH sensor based on protein film for healthcare monitoring. Chem. Pap. 2021, 75, 4927–4934. [Google Scholar] [CrossRef]
  20. Sacco, A. Electrochemical impedance spectroscopy: Fundamentals and application in dye-sensitized solar cells. Renew. Sustain. Energy Rev. 2017, 79, 814–829. [Google Scholar] [CrossRef]
  21. Alfinito, E.; Milano, F.; Beccaria, M.; Cataldo, R.; Giotta, L.; Trotta, M.; Guascito, M.R. A biological-based photovoltaic electrochemical cell: Modelling the impedance spectra. Chemosensors 2020, 8, 20. [Google Scholar] [CrossRef] [Green Version]
  22. Bonanos, N.; Steele, B.C.H.; Butler, E.P.; Macdonald, J.R.; Johnson, W.B.; Worrell, W.L.; Niklasson, G.A.; Malmgren, S.; Strømme, M.; Sundaram, S.K.; et al. Applications of impedance spectroscopy. In Impedance Spectroscopy: Theory, Experiment, and Applications; Wiley: Hoboken, NJ, USA, 2018; pp. 175–478. [Google Scholar]
  23. Casuso, I.; Fumagalli, L.; Samitier, J.; Padrós, E.; Reggiani, L.; Akimov, V.; Gomila, G. Nanoscale electrical conductivity of the purple membrane monolayer. Phys. Rev. E 2007, 76, 041919. [Google Scholar] [CrossRef] [PubMed] [Green Version]
  24. Alfinito, E.; Reggiani, L.; Pousset, J. Proteotronics: Electronic devices based on proteins. In Sensors 2015; Compagnone, D., Baldini, F., Di Natale, C., Betta, G., Siciliano, P., Eds.; Springer: Cham, Switzerland, 2015; pp. 3–7. ISBN 978-3-319-09617-9. Available online: https://0-link-springer-com.brum.beds.ac.uk/book/10.1007/978-3-319-09617-9 (accessed on 23 December 2021).
  25. Alfinito, E.; Pennetta, C.; Reggiani, L. A network model to correlate conformational change and the impedance spectrum of single proteins. Nanotechnology 2008, 19, 065202. [Google Scholar] [CrossRef]
  26. Alfinito, E.; Millithaler, J.F.; Reggiani, L. Charge transport in purple membrane monolayers: A sequential tunneling approach. Phys. Rev. 2011, 83, 042902. [Google Scholar] [CrossRef] [Green Version]
  27. Alfinito, E.; Pousset, J.; Reggiani, L.; Lee, K. Photoreceptors for a light biotransducer: A comparative study of the electrical responses of two (type-1) opsins. Nanotechnology 2013, 24, 395501. [Google Scholar] [CrossRef] [Green Version]
  28. Alfinito, E.; Reggiani, L. Modeling current-voltage characteristics of proteorhodopsin and bacteriorhodopsin: Towards an optoelectronics based on proteins. IEEE Trans. Nanobiosci. 2016, 15, 775–780. [Google Scholar] [CrossRef]
  29. Alfinito, E.; Reggiani, L. Opsin vs opsin: New materials for biotechnological applications. JAP 2014, 116, 064901. [Google Scholar] [CrossRef] [Green Version]
  30. Simmons, J.G. Generalized formula for the electric tunnel effect between similar electrodes separated by a thin insulating film. JAP 1963, 34, 1793–1803. [Google Scholar] [CrossRef] [Green Version]
Figure 1. Cartoon of bRC with different positions of the electrical contacts. On the left, (a) the up-down configuration with the “IN” contact on the cytoplasmic side and the “out” contact on the periplasmic side. On the right, (b), the transverse configuration, with both contacts on the periplasmic side. In both cases, the “IN” contact is on the H chain, but on different helices.
Applsci 12 01738 g001
Figure 2. Differential contact maps of the bRC in dark with two different values of pH. Circles (squares) describe the contacts which are specific for the configuration. Data are calculated using D = 6 Å.
Applsci 12 01738 g002
Figure 3. The normalized -resistance R (#)/R of bRC at pH = 10, as a function of the cut-off distance D. Data are obtained using different contact orientations: the up-down in which the protein is assumed to be with the chain H (but helix 1) on the electrode (see Figure 1a), and the transverse one in which the protein lays on its back on the electrode (see Figure 1b). Data refer to structures in dark.
Applsci 12 01738 g003
Figure 4. The normalized resistance R (#)/R of bRC in dark, as a function of the cut-off distance between neighborhood nodes, D, at different values of pH. Calculations refer to up-down orientation and three different pH values. The inset reports the normalized resistance R (#)/R in light for pH = 6.5.
Applsci 12 01738 g004
Figure 5. Nyquist (on the left) and Bode (on the right) plots of the bRC normalized impedance. Calculations refer to the single protein in the up-down orientation in dark, with pH = 6.5 (continuous line) and pH = 10 (dashed line). Calculations have been performed using ρ = 2.7 × 10¹² Ω Å and D = 10.5 Å.
Applsci 12 01738 g005
Figure 6. I-V characteristics of bRC in dark and in light within a range of applied bias of interest for experiments. The contacts are in the up-down orientation. Circles refer to results with the protein in dark at pH = 6.5, squares refer to the protein in light at pH = 6.5, diamonds refer to the protein in dark at pH = 10. In the inset the I-V I-V characteristics are for the protein in dark at pH = 6.5 (triangle up) and at pH = 10 (triangle down) using contacts in the transverse orientation. Lines are guides for the eye. Calculations make use of the following parameters: D = 10.5 Å, ρ m a x = 2.7 × 10¹² Ω Å, ρ m i n = 2.7 × 10⁴ Ω Å, Φ = 0.219 eV.
Applsci 12 01738 g006
Figure 7. I-V characteristics of bRC in dark and in light within a range of applied bias of interest for experiments. The contacts are in the up-down orientation. Calculations are performed by using three different value of the barrier height, Φ = 0.219 eV (squares), Φ = 0.212 eV (diamonds), and Φ = 0.206 eV (triangles). Circles refer to the protein in dark, with data calculated assuming Φ = 0.219 eV. Lines are guides for the eye.
Applsci 12 01738 g007
Figure 8. I-V characteristics of bRC in dark and in light for a range of applied bias of interest for experiments, Φ = 0.219eV. The contacts are in the up-down orientation. Calculations are performed by using three different values of ρ m a x   = 2.7 × 10¹² Ω Å, (red diamonds), ρ m a x   = 2.7 × 10¹¹ Ω Å (cyan triangles), and ρ m a x   = 5.4 × 10¹⁰ Ω Å (green circles). All the calculations assume ρ m i n   = 2.7 × 10⁴ Ω Å and Φ = 0.219 eV. Continuous lines refer to experimental data from [12] obtained by using samples in which the protein was sandwiched between differently modified electrodes as reported in the figure.
Applsci 12 01738 g008
Table 1. List of the analyzed bRC structures. Each structure is identified by a code in the Protein Data Bank [10,11]; illumination conditions and the pH value of the solution in which they were crystallized are reported. The values of the barrier height, Φ, used for the I-V calculations, as well as of the link resistivity, ρ , used in the impedance calculations are reported.
PDB CodeIlluminationpHΦ (meV) ρ (ΩÅ)
2uwwno6.50.2192.7 × 1012–5.4 × 10¹⁰
2uwsyes6.50.206–0.2192.7 × 1012
2j8cno8.00.2192.7 × 1012
2ux3no9.00.2192.7 × 1012
2uxjno100.2192.7 × 1012
Publisher’s Note: MDPI stays neutral with regard to jurisdictional claims in published maps and institutional affiliations.

