Article

Slope Stability Classification under Seismic Conditions Using Several Tree-Based Intelligent Techniques

by
Panagiotis G. Asteris
1,*,
Fariz Iskandar Mohd Rizal
2,
Mohammadreza Koopialipoor
3,
Panayiotis C. Roussis
4,
Maria Ferentinou
5,
Danial Jahed Armaghani
6,* and
Behrouz Gordan
7
1
Computational Mechanics Laboratory, School of Pedagogical and Technological Equation, 15122 Maroussi, Greece
2
Department of Civil Engineering, Faculty of Engineering, University of Malaya, Kuala Lumpur 50603, Malaysia
3
Faculty of Civil and Environmental Engineering, Amirkabir University of Technology, Tehran 15914, Iran
4
Department of Civil and Environmental Engineering, University of Cyprus, Nicosia 1678, Cyprus
5
School of Civil Engineering and Built Environment, Liverpool John Moores University, Liverpool L3 3AF, UK
6
Department of Urban Planning, Engineering Networks and Systems, Institute of Architecture and Construction, South Ural State University, 76, Lenin Prospect, 454080 Chelyabinsk, Russia
7
Department of Civil Engineering, Islamic Azad University, Varamin Pishva Branch, Tehran 15914, Iran
*
Authors to whom correspondence should be addressed.
Submission received: 16 December 2021 / Revised: 1 February 2022 / Accepted: 7 February 2022 / Published: 8 February 2022
(This article belongs to the Special Issue Novel Hybrid Intelligence Techniques in Engineering)

Abstract

:
Slope stability analysis allows engineers to pinpoint risky areas, study trigger mechanisms for slope failures, and design slopes with optimal safety and reliability. Before the widespread usage of computers, slope stability analysis was conducted through semi analytical methods, or stability charts. Presently, engineers have developed many computational tools to perform slope stability analysis more efficiently. The challenge associated with furthering slope stability methods is to create a reliable design solution to perform reliable estimations involving a number of geometric and mechanical variables. The objective of this study was to investigate the application of tree-based models, including decision tree (DT), random forest (RF), and AdaBoost, in slope stability classification under seismic loading conditions. The input variables used in the modelling were slope height, slope inclination, cohesion, friction angle, and peak ground acceleration to classify safe slopes and unsafe slopes. The training data for the developed computational intelligence models resulted from a series of slope stability analyses performed using a standard geotechnical engineering software commonly used in geotechnical engineering practice. Upon construction of the tree-based models, the model assessment was performed through the use and calculation of accuracy, F1-score, recall, and precision indices. All tree-based models could efficiently classify the slope stability status, with the AdaBoost model providing the highest performance for the classification of slope stability for both model development and model assessment parts. The proposed AdaBoost model can be used as a screening tool during the stage of feasibility studies of related infrastructure projects, to classify slopes according to their expected status of stability under seismic loading conditions.

1. Introduction

Geotechnical engineers often employ analytical and empirical methods in order to estimate the safety factor, based on design parameters and engineering properties, of soil or rock material. It is a challenging task to develop an adequate model to efficiently simulate site specific engineering geological conditions and follow the appropriate design approach in order to eliminate the possibility of failure and propose the most cost-effective design. Slope stability analysis is a standard practice in geotechnical engineering employed for the estimation of the stability of natural or man-made slopes such as embankments of highways, railways, earth dams, tailings, etc. The analysis of slope stability mainly involves the calculation of the factor of safety (FOS), which is defined as the ratio between shear strength and the acting shear stress. The key parameters that define the geometry of the slope (i.e., height and slope inclination) and the material properties (i.e., angle of internal friction, cohesion, and pore water pressure) influence the evaluation of stability of slopes [1,2,3]. Many sources of uncertainties, such as soil properties and loading, contribute to the stability of a slope [4,5,6]. The slopes can be classified as stable slopes (SS) or unstable slopes (US), depending on whether their FOS is greater or less than one [7]. The assessment of slope stability is usually performed using analytical techniques, such as the limit equilibrium method (LEM) and finite element methods.
The challenge associated with further development of slope stability analysis methods is to create a reliable generic design tool in order to perform precise evaluations of slope performance. Before the advent of computers, slope stability analysis was conducted using semi-graphical solutions, using manual calculations, or using stability charts [8]. Presently, engineers have developed many computational tools to perform slope stability analysis more efficiently. Geotechnical software based on analytical methods such as the limit equilibrium method (LEM) are widely used by engineers although this method is known to be inadequate when analysing complex slope conditions, requiring more efficient designs, where more sophisticated tools like finite element methods are used [9].
Statistical methods for slope stability classification are based on mathematical formulas that are used in the statistical analysis of research. Multiple regression is a statistical analysis method that can predict the nature of relationship among independent variables and dependent variables. Multiple regression is able to predict the relationship of multiple independent variables against an output variable. This technique is widely used in analysing slope stability problems [10]. For instance, Erzin and Cetin [11] used multiple regression to predict the FOS of homogeneous slopes. The cohesion of soil (c), angle of internal friction (ϕ), unit weight of soil (γ), and seismic coefficient (k) were used as input parameters, and the output parameter was FOS. It was concluded that the predictions made by the multiple regression model were acceptable. In a similar study, Chakraborty and Goswami [12] used the height of cut or slope height H, material properties, cohesion (c), friction (ϕ), slope inclination (β), unit weight (γ), and dimensionless parameter (m) as input parameters to predict the status of stability. They also reported a very similar conclusion to the study by Erzin and Cetin [11]. However, the analyses performed by statistical models are only statistical-based, and they are not able to provide a clear view to researchers and designers [13].
Artificial intelligence (AI) and machine learning (ML) techniques have been successfully implemented in the area of engineering and sciences [14,15,16,17,18,19,20,21,22,23,24,25,26,27,28,29,30,31,32] for the last 25 years. The same models were used to solve the slope stability problems [3,11,33,34,35,36,37]. Algorithms like ANFIS, (Adaptive Neuro-Fuzzy Inference System), were applied by Mohamed and Kasa [38] to predict the FOS of slopes and they compared their results from the LEM method. The predictions made by the ANFIS model were acceptable for applications in slope stability prediction. In another study, Kalatehjari et al. [39] utilized particle swarm optimization (PSO) to estimate the FOS of 3D slopes in comparison with a 3D finite element method (FEM) model using material properties (cohesion (c) and friction (ϕ) and unit weight (γ) as input variables. They confirmed a successful application of PSO for 3D slope stability conditions but lower performance for 2D slope stability analysis. Artificial neural network (ANN) as a basic and benchmark AI model was used by Sakellariou and Ferentinou [36], Ferentinou and Sakellariou [37], and Lu and Rosenbaum [40], and its performance was studied to estimate slope stability compared to the LEM slope stability analysis. The results produced by the ANN model were found to concur with the results obtained by the LEM and allowed for the classification of sample observations according to the anticipated failure mechanism. In another study, Samui [41] proposed a support vector machine (SVM) technique for the prediction of FOS and compared it with the ANN results. He found that the SVM was able to receive a slightly higher accuracy in comparison with the ANN technique. In addition, the same SVM model with different kernels, including polynomial, radial basis and spline, was proposed by Samui [35] to classify the FOS of slopes. The accuracy of the model was proven to be very high as it showed 100% similarity when compared to the expected slope stability classification results. It was concluded that the classifications made by the SVM model were acceptable for applications in slope stability predictions; however, when the size of the dataset and/or the dimension of the input vector were high, the performance of the developed models was poor. In a study carried out by Tien Bui et al. [42], decision tree (DT) was used to predict the FOS of slopes and was compared with the results obtained by some other ML/AI techniques such as SVM. The accuracy of the DT model was proven to be acceptable, but it was lower than the SVM model. It is clear that the AI/ML models have enough potential in classifying/predicting slope failure or FOS. Table 1 presents some of the classifications/prediction studies in the areas of slope stability using AI/ML models. In these studies, FOS was set as model output where the model performance was assessed using the coefficient of determination (R2) and accuracy.
In the light of the above discussion, it is clear that ANN and ANN-based models are the main body for the previous investigations. On the other hand, some other techniques, namely, tree-based, performed well in the areas of geotechnics and civil engineering [51,52,53,54]. In this study, different classification systems are proposed for slope stability using decision trees (DT), random forest (RF), and AdaBoost tree-based techniques. As presented in Table 1, many researchers used key parameters (i.e., height (H), cohesion (c), friction (ϕ), and unit weight (γ)) for the classification of slope FOS under static conditions. According to our review, there is a limited number of studies aimed at FOS estimation or status of stability classification under dynamic conditions. In the current study, the horizontal component of peak ground acceleration (PGA) is included in the input parameters. Therefore, the contribution of this study concerns, firstly, the use of tree-based models in slope stability classification, and secondly, the inclusion of a component related to dynamic conditions in slope stability. This allows for a more reliable slope stability classification under dynamic loading conditions. The rest of this paper is outlined as follows:
Concepts of earthquake on soil slopes will be discussed in Section 2. Then, Section 3 describes the used models’ concepts and fundamental facts. In addition, the same section will provide the needed information about data preparation used for modelling to the readers. Tree-based model developments for slope stability classifications will be provided in Section 4. The results of the study are evaluated and discussed in Section 5. In addition, the best tree-based model to classify slope stability will be discussed in the same section. Future work directions and the conclusion will offer some valuable input to the readers in Section 6.

2. Effect of Earthquake on Soil Slopes

If a slope is situated in a region subject to earthquakes, the design must satisfy these adverse conditions. The effect of the shaking depends on whether the shear strength of the soil material remains adequate during cyclic loading or shaking results in a significant loss of strength. Since deformation is the result of shearing or sliding movement, slope stability analysis is necessary to ensure that the factor of safety is adequate to satisfy dynamic loading and minimize the resulting deformation. In the case of loose, saturated, cohesionless material, the total lack of strength due to cyclic loading might induce liquefaction, which is when a cohesionless saturated or partially saturated soil loses structural strength as a result of an applied stress (such as trembling during an earthquake or another abrupt change in stress condition), and a material that is normally a solid acts as a liquid. Liquefaction assessment requires a more complex analysis and additional data, such as pore water pressure measurements, and is beyond the scope of this paper.
The susceptibility of a slope to failing due to a seismic event is also determined through the critical acceleration coefficient ky. The coefficient of critical acceleration ky is an appropriate measure of a soil or rock mass’ resistance to earthquake induced sliding. The value of the coefficient depends on the slope inclination β. Essentially, ky is as important for the sliding block model method [55], as the static safety factor is for the limit equilibrium method; these two variables are linearly related [56]. According to Sarma and Bhave [57], ky is a measure of safety factor, and is the yield acceleration of the slope. Sarma and Bhave [57] proposed a method to relate these two coefficients which is independent of the assumed failure mechanism and the material properties. The coefficient of critical acceleration ky is unique for each slope and is calculated when the safety factor is equal to one.

3. Material and Methods

3.1. Data Preparation

During the training process of developing a mathematical model to predict a parameter value as a function of a number of other variables, most researchers tend to focus on computational aspects, while at the same time paying less attention to the database being used for the training and development of the mathematical model.
However, we firmly believe that the main emphasis should be on the database to be used, as it is the database itself that describes the behaviour of the problem being modelled. The database, whether based on experimental or analytical data, is the available knowledge which must be properly utilized during the training process of the development of the mathematical model. In this regard, the database must be reliable with a sufficient amount of data to adequately describe the problem under study.
It should be noted that the phrase “sufficient amount of data” does not necessarily imply a high amount of data, but rather datasets that cover a wide range of combinations of input parameter values, thus assisting in the model’s capability to simulate the problem. The demand for a reliable database is particularly crucial in the case of experimental databases, which are databases compiled using experimental results. In this case, significant deviations between experimental values are frequently noticed, not only between experiments conducted by different research teams and laboratories, but even between datasets derived from experiments conducted on specimens of the same synthesis, produced by the same technicians, cured under the same conditions, and tested implementing the same standards and testing instruments.
In light of the above discussion, in this study, in order to develop a comprehensive database for FOS classification under dynamic conditions, a series of models were constructed to calculate FOS using a standard geotechnical software. 
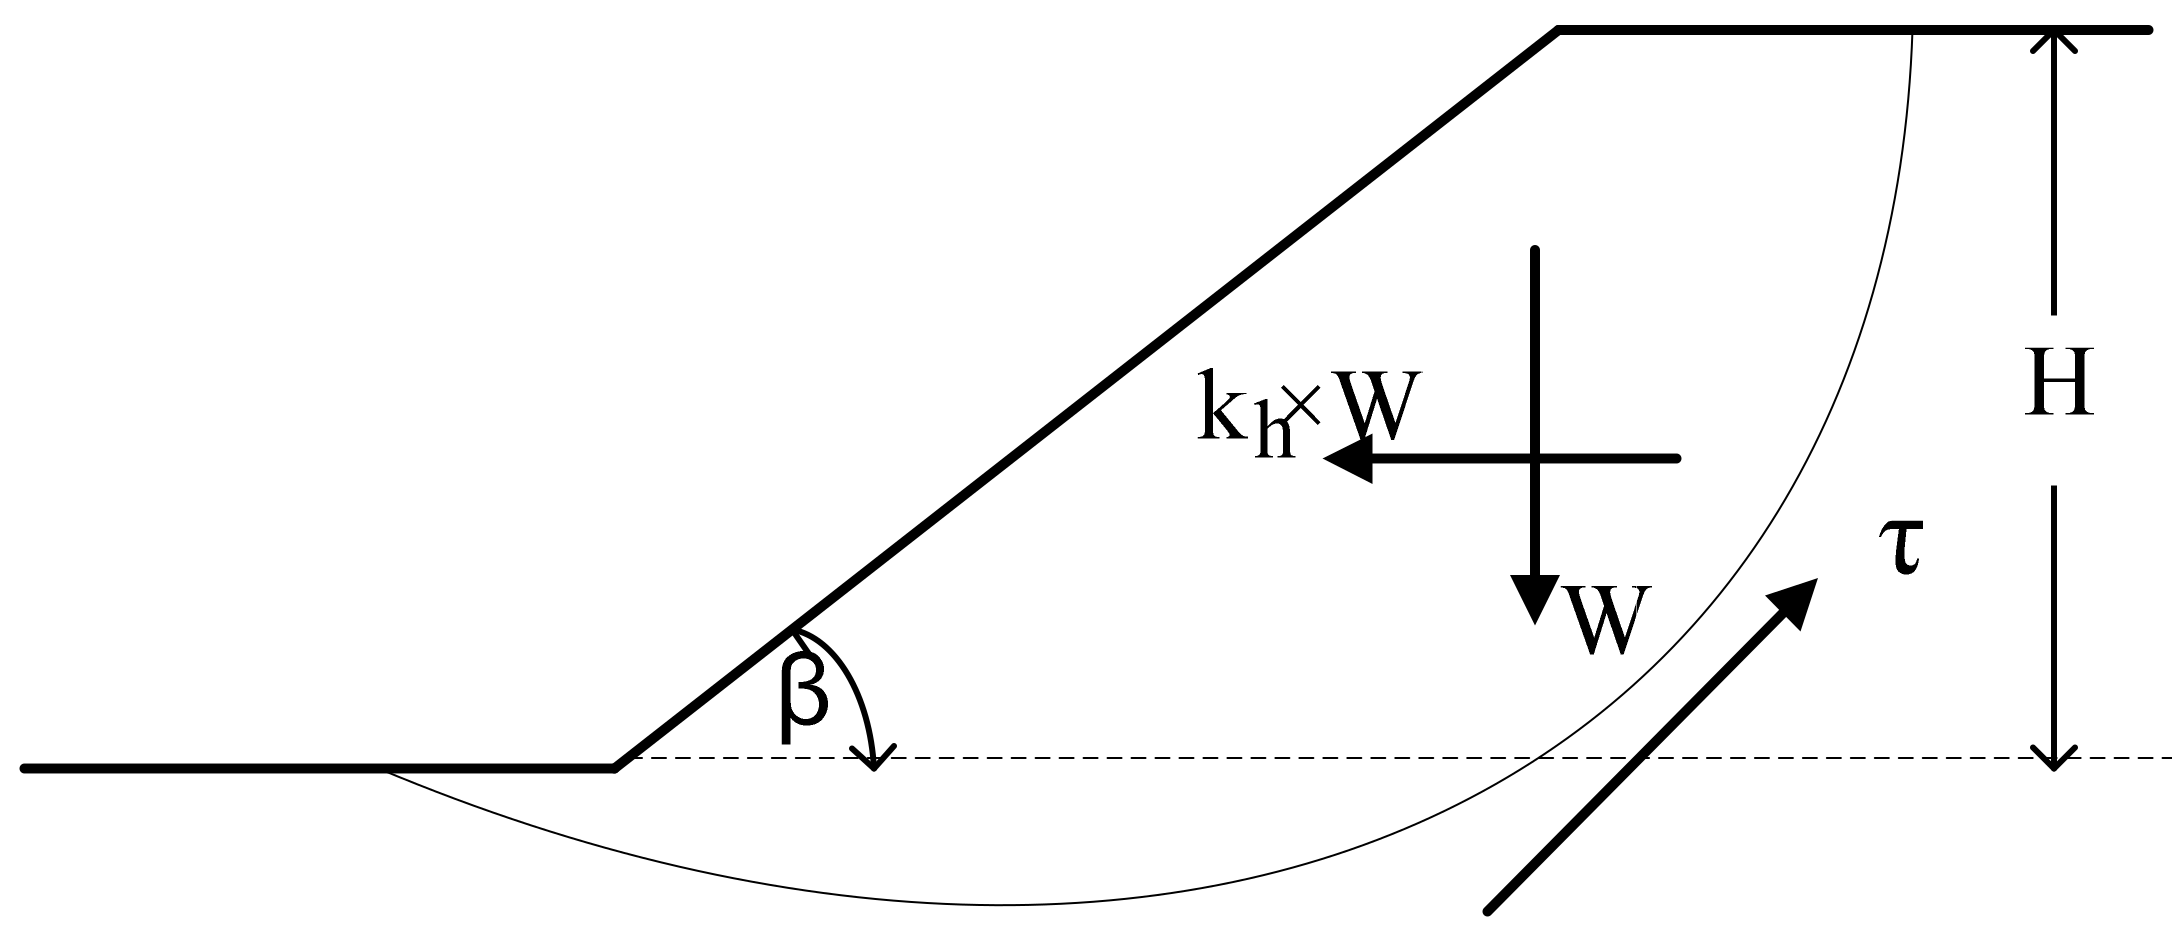
Figure 1 illustrates a generic limit equilibrium model for the simulated slope. In fact, many slope stability analysis tools use various versions of the methods of slices, such as Bishop simplified. The simplified Bishop method uses the method of slices to discretize the soil mass and determine the FOS. These methods were used in this research, the ordinary method of slices (Swedish circle method/Petterson/Fellenius), Spencer, Sarma, etc. Sarma and Spencer are called “rigorous methods” because they satisfy all three conditions of equilibrium: force equilibrium in both horizontal and vertical directions and moment equilibrium condition. Rigorous methods can provide more accurate results than non-rigorous methods. Bishop simplified or Fellenius are non-rigorous methods, satisfying only some of the equilibrium conditions and making some simplifying assumptions [58,59]. Some of these approaches are discussed below. Finally, slope stability analysis using Bishop simplified is a static or dynamic, analytical, or empirical method to evaluate the stability of earth and rock-fill dams, embankments, excavated slopes, and natural slopes in soil and rock. Slope stability refers to the ability of inclined soil or rock slopes to withstand or undergo movement.
The contribution of seismic loading is considered in the current slope stability analysis through the application of a horizontal force component of peak ground acceleration (PGA), that characterizes the amplitude of shaking within the sliding mass. Namely, the slope is assumed to be subjected to a force defined by
F h = k h W
where W is the weight of the sliding mass and kh is a dimensionless coefficient defined by
k h = P G A / g
The process was carried out in several phases to achieve a representative database. Boundary conditions, model dimensions, material properties, and seismic motion were the parameters considered in modelling. To do this, multiple homogeneous slopes with different conditions were modelled. Slopes with heights of 15, 20, 25, and 30 metres and inclinations of 20°, 25°, 30°, and 35° were produced. In terms of rigid behaviour, all of the models were placed on top of bedrock.
The failure criterion used in this method was the Mohr–Coulomb failure criterion
τ = c + σ t a n φ
where c: cohesion, φ: friction angle, σ: normal stress for slopes with soils with cohesion and internal friction, for a slope subjected to circular failure. The parametric values used were cohesion of 20, 30, 40, and 50 kPa and internal friction angle of 20°, 25°, 30°, 35°, and 40°. The effect of earthquake motion on slope behaviour was considered in the current analysis. For the purposes of this analysis, the soil unit weight was assumed to be 18 (kN/m3). The amplitudes were defined as 0.1, 0.2, 0.3, and 0.4 g. On all of the slope models, thirty slices were used as slip surfaces. To achieve FOS values in this analysis, a grid and radius slip surface were used. The calculated FOS should be almost in the centre of the grid by using the grid and radius method. The FOS from the dataset was then separated manually into groups of safe slope or SS and unsafe slope or US in order to meet the objective of analysing and classifying all the slope stability cases in the dataset. Table 2 shows the input and output parameters used in the database development.
In this study, 700 homogeneous slopes were simulated using GeoStudio which utilizes the LEM method shown in Figure 1, along with the most critical FOS parameters. In these 700 slopes, different values of the mentioned parameters in Table 2 were used and their FOS values were recorded. Based on a literature review conducted, the parameters presented in Figure 1 are considered to be the most important. The best relationships between these input parameters and the output (i.e., FOS) were calculated. In this way, simple regression analysis (one to one relationship) was employed. The highest R2 value was achieved by the PGA parameter through a polynomial trend-line (as the best trend-line among applied linear, exponential, logarithmic, and power) as follows:
FOS = 0.0612(PGA)2 − 0.3512(PGA) + 1.4545
A value of R2 equal to 0.305 was reported for the above equation. Besides PGA, the parameter ϕ showed the best relationship with FOS values with R2 = 0.122 through an exponential trend-line.
To determine the relative effect of each input parameter on the output parameter, a sensitivity analysis was performed. The following equation was used to perform the same analysis:
r i j = k = 1 m x i k x j k k = 1 m x 2 i k k = 1 m x 2 j k
where, rij is the strength of relation between each input and output, x i k is the ith sample of input k, j is the number of each sample in the output set, and m is the total number of data samples. Table 3 shows the strengths of the relations (rij values) between the inputs and output (FOS). The sensitivity analysis results showed that the input parameters have a great influence on the FOS. Parameter ϕ had the highest impact on FOS values followed by H, β, C, and PGA. The results obtained were in line with previous studies [60,61].

3.2. Overview of Research Methodology

A review of past related studies that utilize AI in slope stability methods was first conducted in order to choose the parameters to be used in the dataset required for training and testing the DT, RF, and AdaBoost models. The review revealed an absence of studies considering the PGA as a parameter in the performance of slope stability analysis. Subsequently, the FOS values were estimated using intelligent techniques. For this purpose, DT, RF, and AdaBoost were utilized based on the most influential parameters for slope stability performance as mentioned before for the input parameters. The results of the DT, RF, and AdaBoost model were compared to the results from the GeoStudio software to observe the performance of the DT, RF, and AdaBoost methods. Results of both methods were evaluated using performance indicators and the best model was selected and introduced for the problem of this study. Figure 2 presents a flowchart of the research methodology followed in this study.

3.3. Decision Tree (DT)

DT is an AI technique that uses conditional judgement rules to divide predictor variables into homogeneous categories. The aim of DT specification is to find a set of decision rules for predicting an outcome from a set of input boundaries [62]. The DT is referred to as a predictive data mining tree depending on whether the target variables are objective or subjective [63]. Classifying the FOS of slopes from multiple input parameters is possible because modelling complex relationships between multiple input variables with an output variable is possible with a DT model as it will have both categorical and continuous variables without making any conclusions about the distribution of the provided data [64]. Furthermore, DT models are simple to implement, and the prediction results are simple to understand. The findings of the DT model revealed the relative significance of input parameters to the output parameter [65].
A root node, internal nodes, and leaf nodes make up a DT structure. All of the input variables are stored in the root node. A decision function is connected with an internal node, which may have two or three branches. The output of a given input vector is represented by a leaf node [42]. 
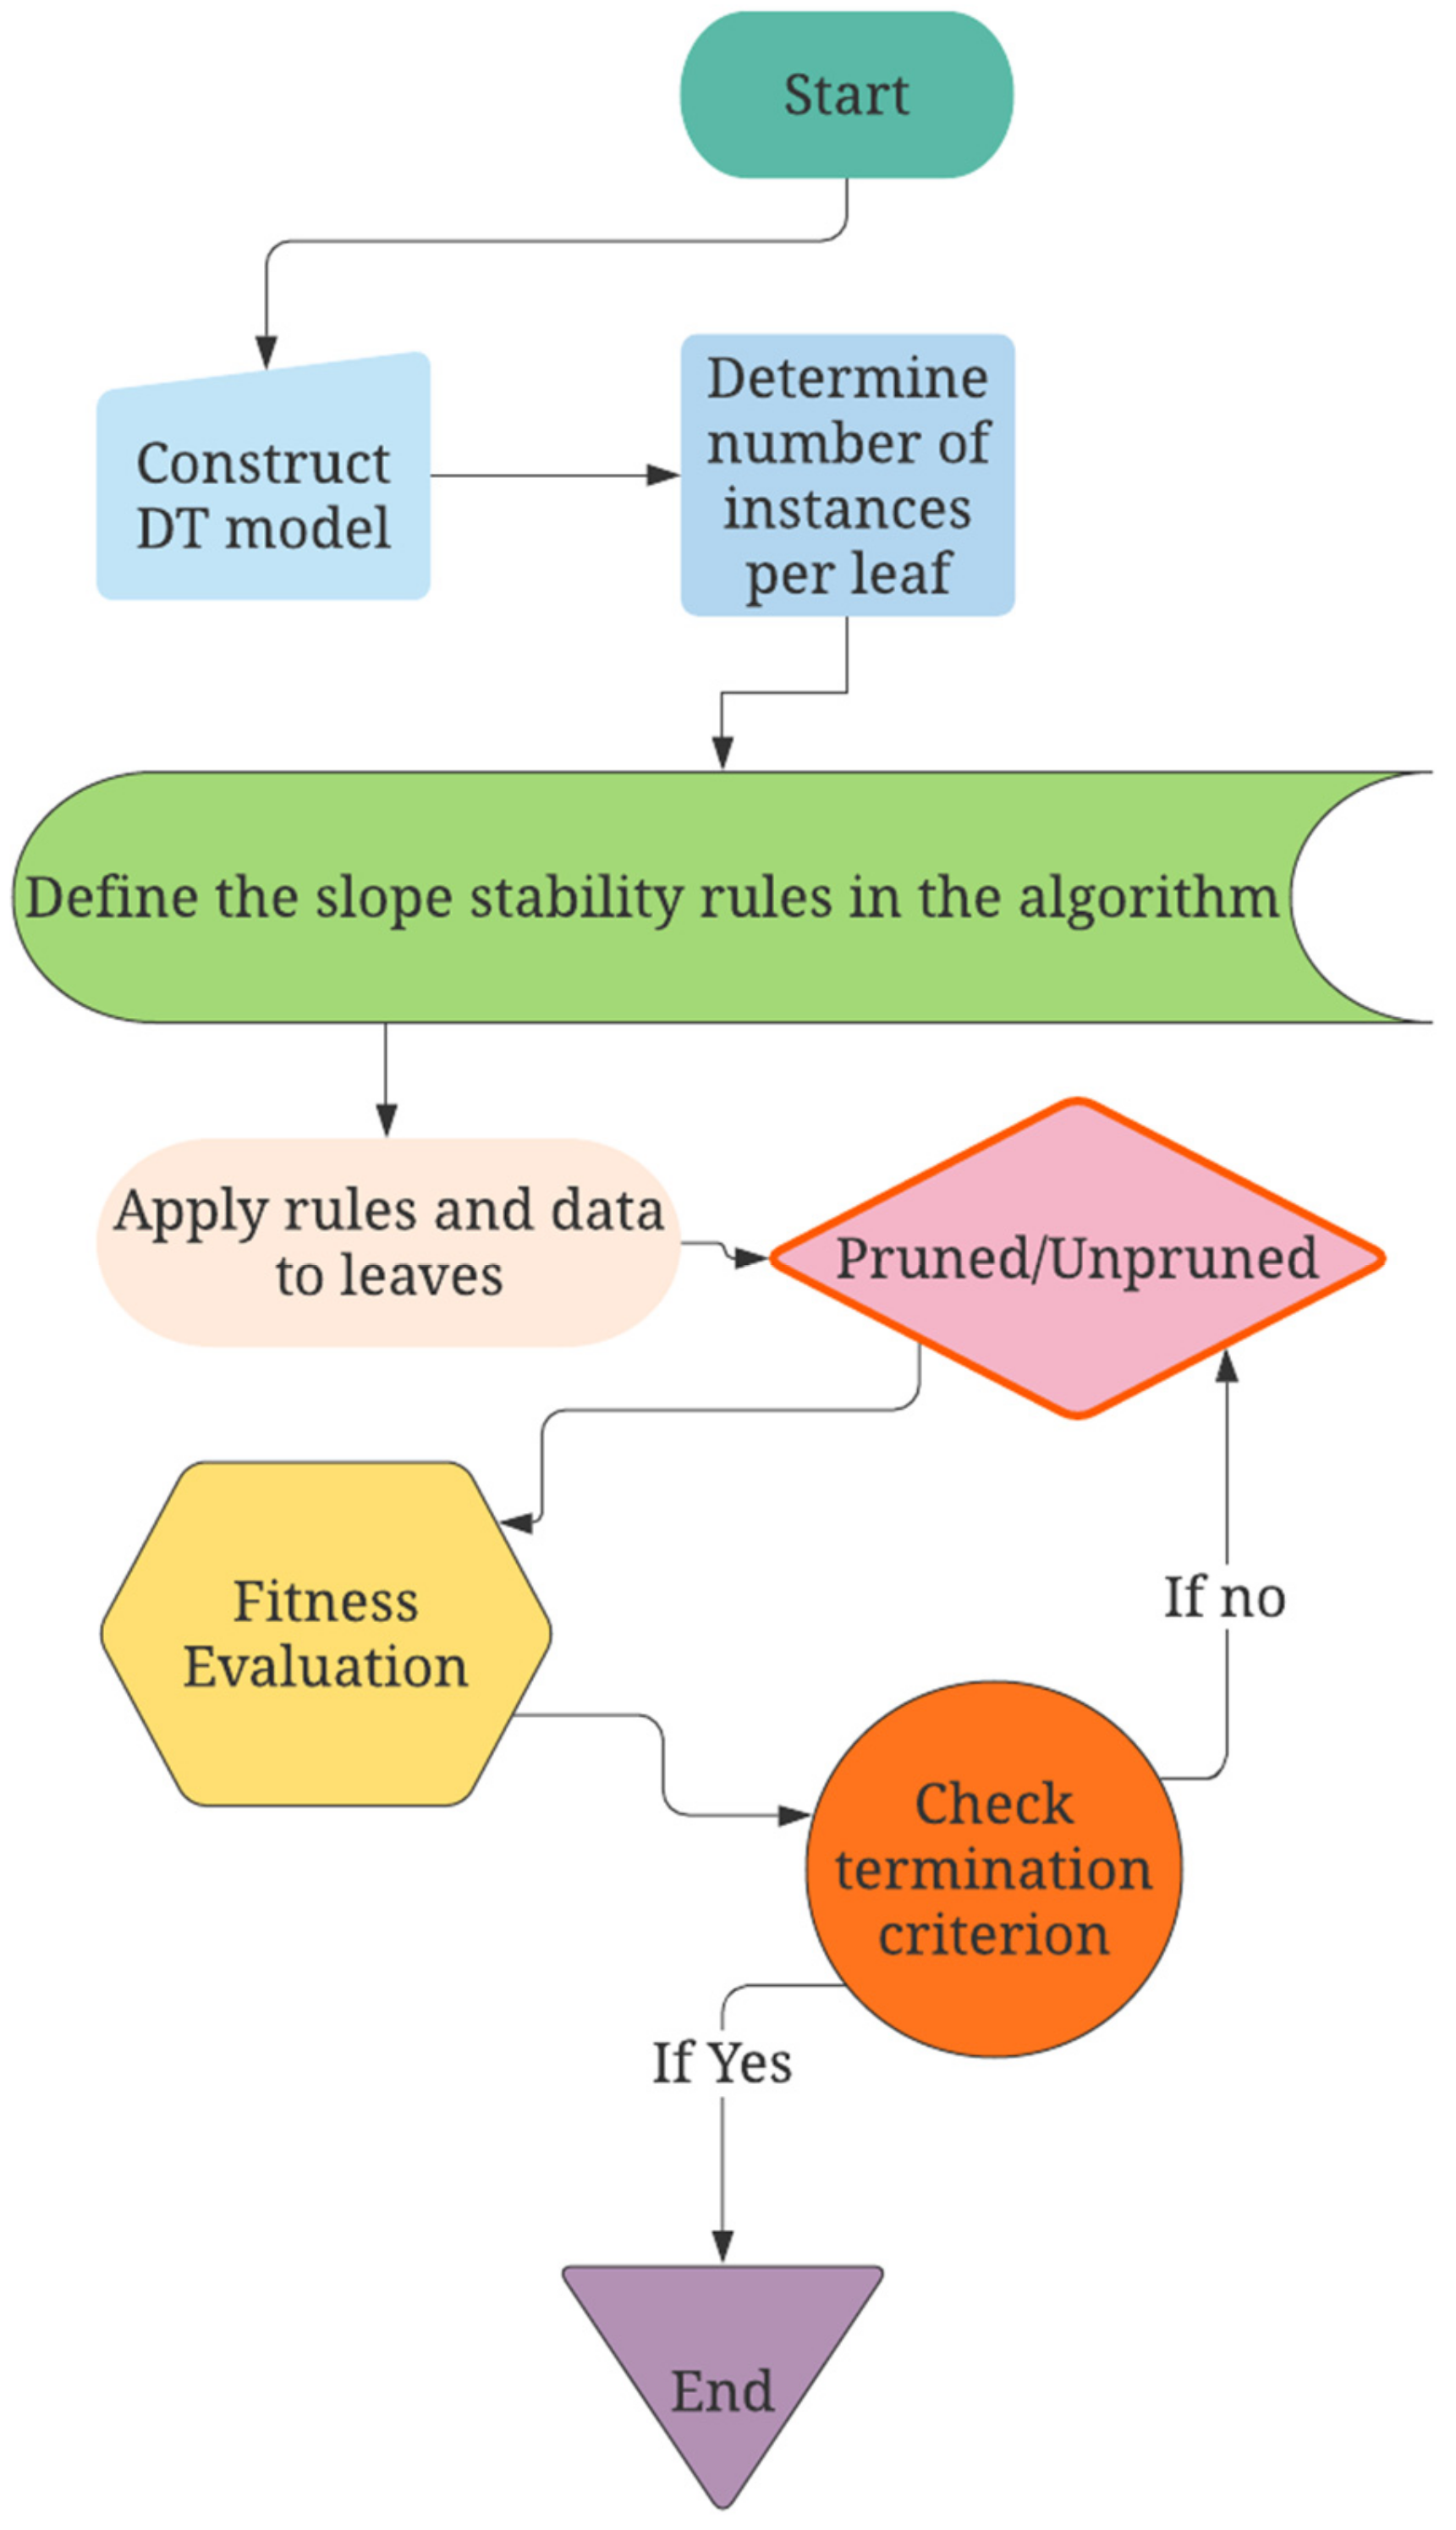
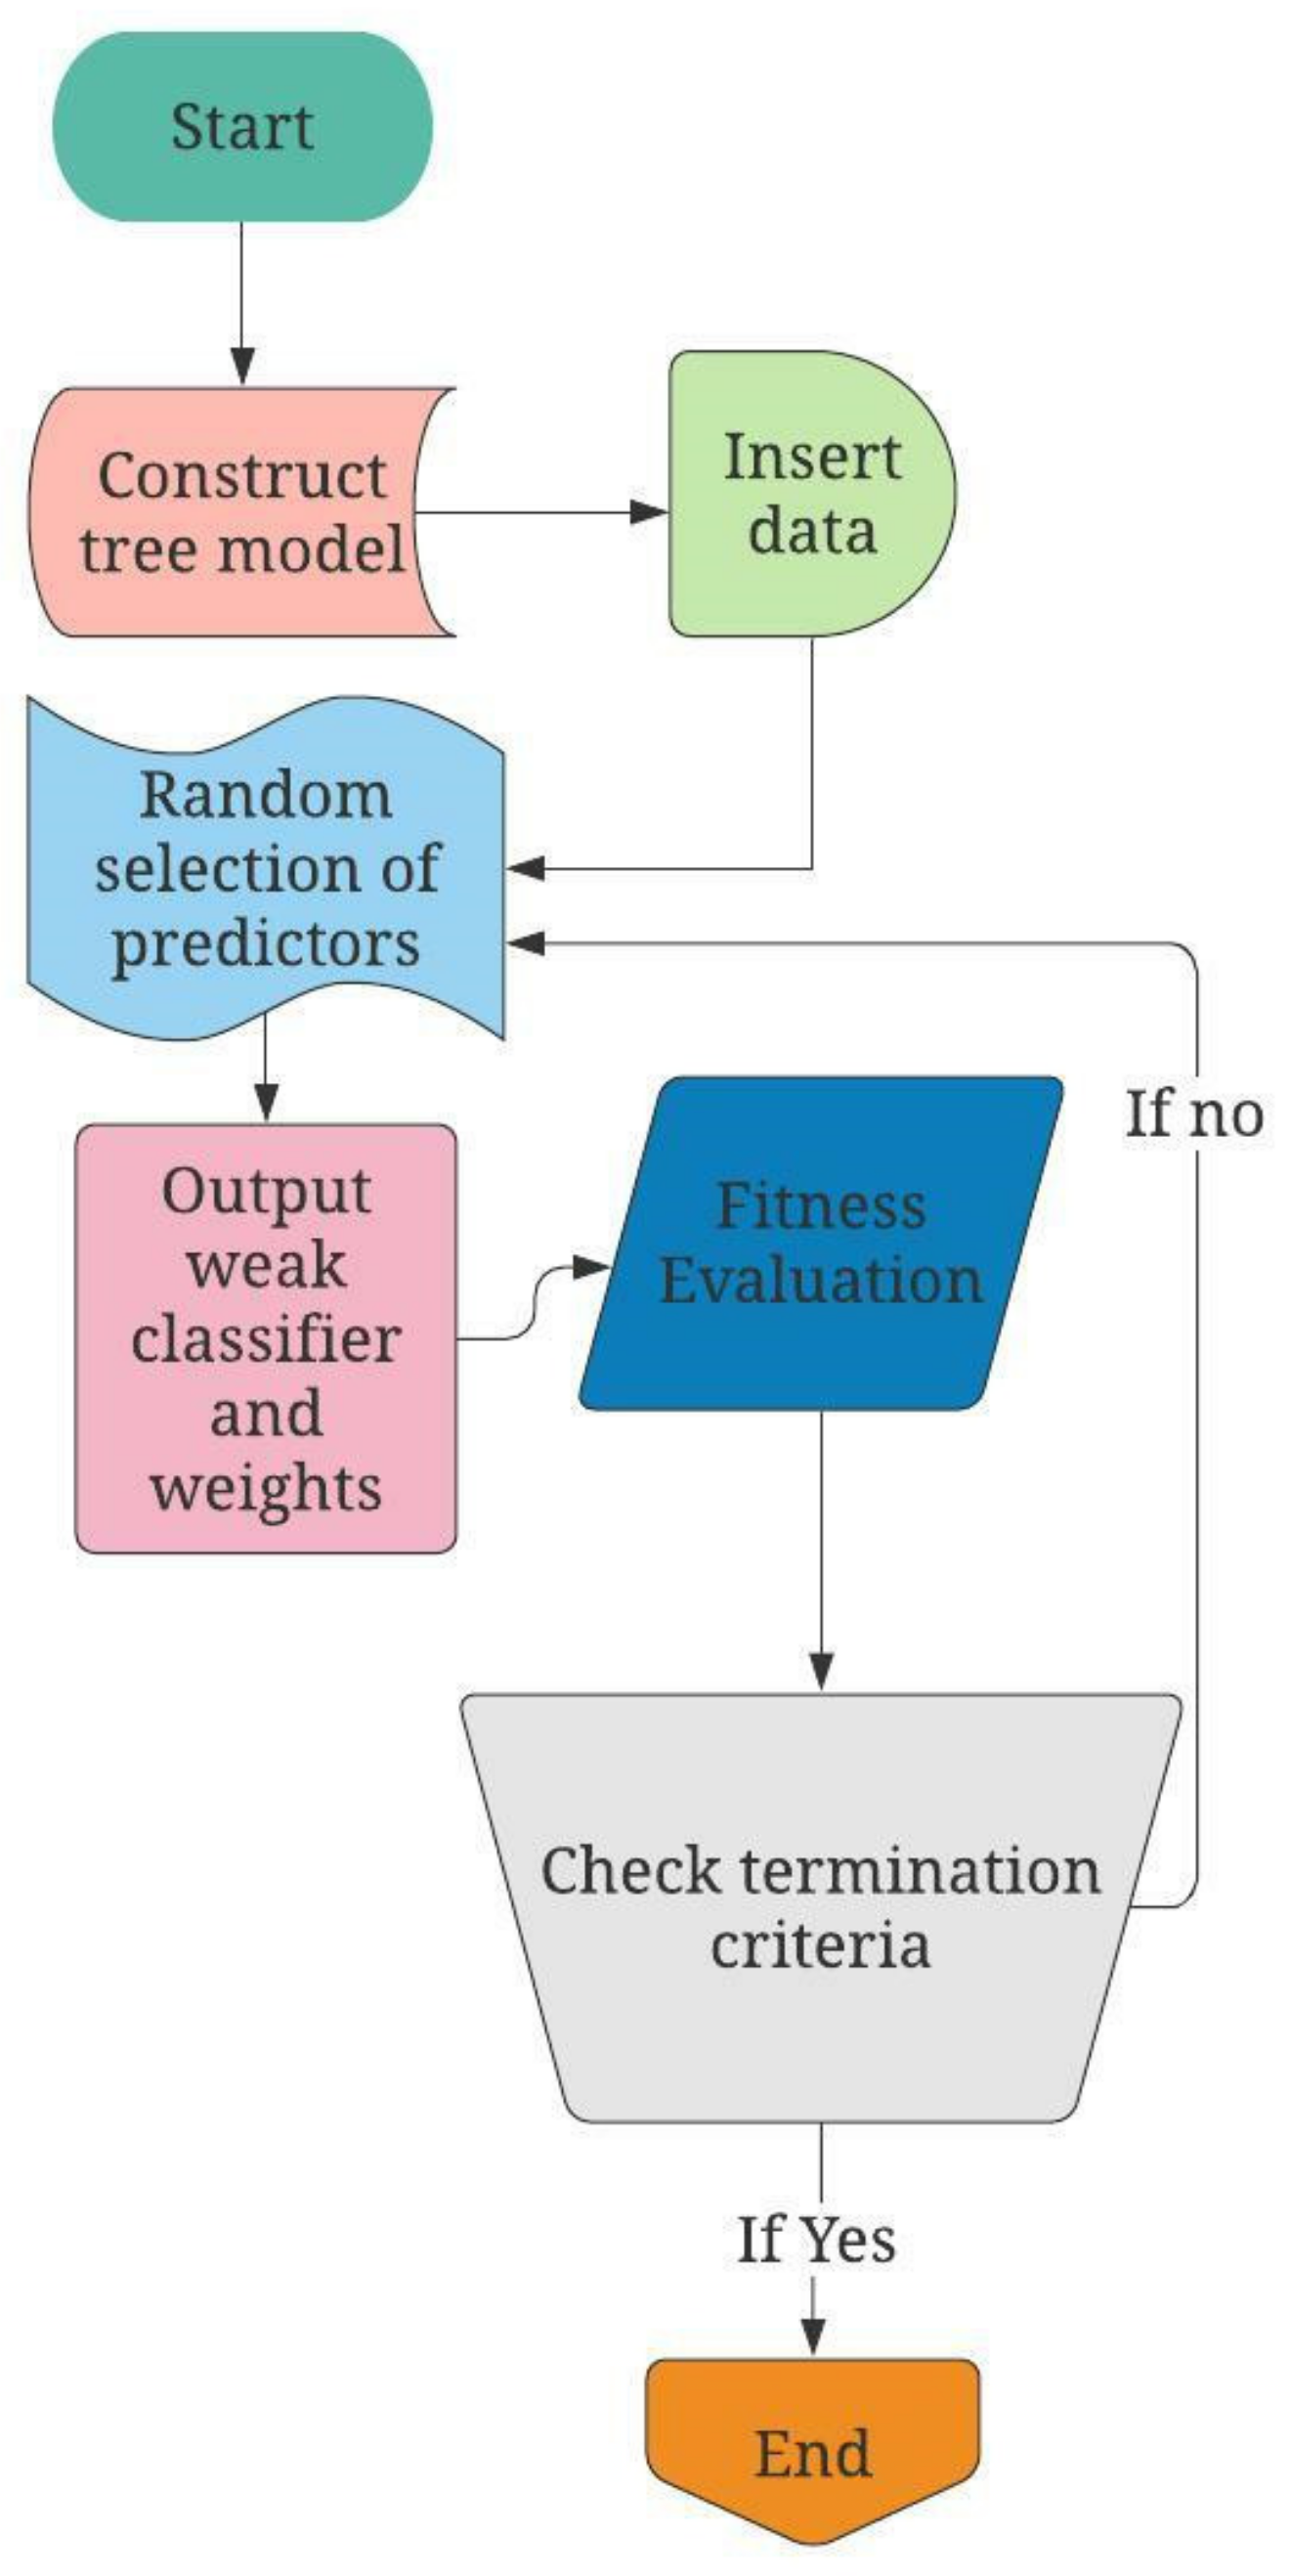
Figure 3 shows the flowchart of procedures conducted for the modelling of a DT model. The procedure of modelling a DT model is governed by two steps: tree building and pruning.
In the first step, the root node of the DT is defined by determining the input vector with the maximum gain ratio. The dataset is then divided into sub-nodes depending on the root values. For discrete input variables, each potential value is represented by a sub-node of the tree [66]. The gain ratio is then calculated for each of the sub-nodes separately in the second process, and the process is replicated until all of the instances in a node are classified the same way. Leaf nodes are such nodes, and their names are the class values. Since the tree produced during the design process will have a large number of branches, it will be vulnerable to over-fitting [67], it must be pruned in order to improve the prediction performance for new data. Tree pruning can be divided into two categories: pre-pruning and post-pruning. In the case of pre-pruning, the tree’s development will be halted before another criterion is true; in the case of post-pruning, the whole tree will be grown first, and then the finished subtrees will be replaced by leaves based on the tree’s flaw relation before and after eliminating sub-trees. More explanations regarding DT models can be found in [54].

3.4. Random Forest (RF)

RF, also known as random decision forest, is an ensemble modelling technique for grouping, regression, and other tasks that works by training a vast group of DTs and then outputting the category that is the average approximation (regression) of the individual trees [68]. The values of an independent random variable are used to develop the individual DTs. On the basis of voting, classification models estimate the value yielded by individual trees [69]. The basic RF algorithm utilizes the random subspace method. RFs are often used in industries as “black box” models because they provide accurate estimates over a broad variety of data with no configuration [70].
The DTs in the RF model recognize rules and patterns from the input data. The output parameter (FOS) can be easily measured using these rules and patterns for any new collection of results. The gain ratio formula can be used to rank the most important parameters of slope failures. To solve the issue of over-fitting, mathematical methods such as conservative pruning are used subsequently [71]. Figure 4 shows the flowchart of procedures for RF modelling.

3.5. AdaBoost Algorithm

Adaptive Boosting, also known as AdaBoost, is a boosting algorithm that attempts to use weighted derivatives of the same testing dataset rather than sub-samples [72]. The benefit of this approach is that the algorithm does not need a large amount of data because it uses the same training dataset twice [73]. The algorithm is well-known for producing good results when constructing ensemble classifiers [74]. To get a classification model of the ensemble prediction function H:X → (−1, +1) shown in Equation (6), the AdaBoost machine learns using a series of weak learners or classifiers.
H x = s i g n m = 1 M a m H m x
where H x is the output of the developed ensemble classifier, a 1 . ,   a m , are a set of weights, and H m x is the performance of the weak learners m(1,…,M) that are combined to get H x . In each round of the algorithm, the weights allocated to the training dataset are determined by how previous classifiers behaved. The algorithm then works on the specimens or data sets that have already been mistakenly classified in this case. Figure 5 shows the flowchart of procedures for AdaBoost modelling. More information on the AdaBoost concept can be found in the other studies ([75,76]).

3.6. Performance Indicators

To measure the performance of the results obtained from the DT, RF, and AdaBoost models against each other and the expected results obtained from the GeoStudio software, a few performance indicators were used. These performance indicators were accuracy, precision, recall, F1-score, and ROC curve. All the models were subjected to the performance indicators to observe their effectiveness. Accuracy is the ratio of the number of correctly classified predictions divided by the total number of projections. It ranges from 0 to 1. Equation (7) shows the calculation of accuracy where True Positive and True Negative are correct predictions made by the model.
Accuracy = TruePositive + TrueNegative Total   number   of   samples
Precision is the measurement of positive class predictions that actually belong to the positive class, which in turn calculates the accuracy of the minority class. This calculation is expressed in Equation (8) where the False Positive represents the false positive prediction made by the model.
Precision = TruePositive TruePositive + FalsePositive
Recall is a statistic index that measures how many accurate positive assumptions were made out of all possible positive expectations. Unlike precision, which only considers true positive predictions out of all predictions, considering the positive predictions that were wrong. This calculation is expressed in Equation (9) where the False Negative represents the false negative prediction made by the model.
Recall = TruePositive TruePositive + FalseNegative
F1-score is a method for combining precision and recall into a single measure that encompasses both. Neither precision nor recall can provide the full picture on their own. We may have excellent precision but poor recall, or vice versa, poor precision but good recall. With the F1-score, all issues with a single score can be expressed (Equation (10)).
F 1 s c o r e = 2 × P r e c i s i o n × R e c a l l P r e c i s i o n + R e c a l l
ROC curve or receiver operating characteristic curve is a graph of the false positive rate (x-axis) vs. the precision (y-axis) with a variety of candidate thresholds ranging from 0.0 to 1.0. The false positive rate is determined by dividing the total number of false positives by the total number of false positives and true negatives. With all the performance indicators mentioned above, the area under the ROC curve could be obtained for each model. This value will represent the effectiveness of each model.

4. Development of Tree-Based Techniques

In order to develop the models implemented in this study, the hyperparameters of each model were optimized. A parametric analysis was performed on the parameters of each model because the models needed to be adjusted for each problem and dataset. Here, three types of DT, RF, and AdaBoost models were implemented, each of which had specific parameters related to its structure. In each section, these parameters were defined, and various values of their parameters were analysed in order to find the optimal structure. The details of each model are presented in the following.

4.1. DT Model

To obtain the most effective DT model, several models were developed using different numbers of parameters. Table 4 reports the parameters used for modelling in this study. Upon experimenting with the values of the number of instances in leaves, minimum limit of the split subset, and maximal tree depth, the most effective DT model with the optimal value of these parameters was obtained. In addition, Figure 6 shows the tree flowchart of the proposed DT model for classifying slope stability.
In the training phase, 75% of the dataset was used (525 slope cases), which is similar to a study conducted by Piryonesi and El-Diraby [70]. The data was selected randomly, and the input parameters were inserted into the model. In the testing phase, 25% of the dataset was used, which corresponds to 175 slope cases. Figure 7 shows the results of the DT model in the classification of the FOS for training and testing sets. According to the training set, the DT model classified 300 safe slopes and 162 unsafe slopes accurately, while classifying 12 safe slopes and 21 unsafe slopes, wrongly. In addition, in the case of the testing set, the DT model classified 109 safe slopes and 47 unsafe slopes accurately, while classifying 3 safe slopes and 16 unsafe slopes, wrongly. Later, the results of the DT from both phases were observed using the performance indicators accuracy, precision, recall, F1-score, and ROC curve.

4.2. RF Model

A similar modelling process was completed for the RF technique aiming at classification of slope stability considering FOS values of more than one as safe (SS) and less than one as unsafe (US). After experimenting with different numbers of trees and the minimum limit of split subsets, the most effective RF model with optimal values was obtained (Table 5). The same portions of DT model were used for the training and testing phases. Figure 8 displays the results obtained by the RF technique for the classification of slope stability for the training and testing phases. Considering the training phase, the RF technique classified 344 safe slopes and 169 unsafe slopes accurately, while classifying 5 safe slopes and 7 unsafe slopes, wrongly. In the case of the testing phase, the RF model was able to classify 116 safe slopes and 44 unsafe slopes accurately, while wrong classification of 9 safe slopes and 6 unsafe slopes, was reported. As with the DT model, the results obtained by the RF model are assessed and discussed later.

4.3. AdaBoost Model

The same data with five input parameters under seismic condition was used to classify slopes as safe and unsafe. As with the previous parts, it was important to obtain the optimal parameters of the model, which was AdaBoost in this sub-section. Several parametric studies were conducted to get the most accurate AdaBoost model. The optimal AdaBoost parameters for the expressed aim are presented in Table 6. It should be mentioned that a different base model could be selected for the modelling of AdaBoost where DT was the best among them for solving the defined problem. As a result, the proposed AdaBoost model was able to classify 351 safe slopes and 174 unsafe slopes accurately, with no wrong classification results by AdaBoost in the training or model development phase (Figure 9). However, during the testing or model evaluation part, there were several wrong cases. An accurate value of 120 safe slopes and 43 unsafe slopes were reported for the testing part, while 7 safe cases and 5 unsafe cases were obtained wrongly (Figure 9). It seems that the classification results obtained by the AdaBoost model are slightly better than those obtained by the RF and DT techniques. It is important to mention that the evaluation of the proposed models was not the aim of this section and this will be reported in the following section.

5. Results and Discussion

This section presents the comparison of results obtained from the DT, RF, and AdaBoost models. The results obtained from these models were subjected to several performance indicators: namely, accuracy, precision, recall, F1-score, and the area under ROC curve or AUC (area under curve) to determine which method was the most accurate and effective for slope stability classification. Here, the testing phase of the datasets was considered for the validation of each tree-based model. This is a common method of evaluation or model assessment to understand the level of accuracy during training/model development. On the other hand, the training stage results showed that the proposed AdaBoost model could be considered as perfect, and therefore, there is no need to discuss further about this stage and have any comparison between models. Table 7 shows the comparison of the testing stage results obtained by the indicators: i.e., accuracy, precision, recall, F1-score, and AUC of ROC. In addition, the ranking procedure proposed by Zorlu et al. [77] was applied in this table. The ranking system is very easy to understand. In this system, the most accurate performance index receives the highest rank. According to Table 7, the model that showed the highest accuracy was AdaBoost as it obtained the highest rank value, which was 13. The second most accurate model was the RF, which obtained a total rank value of 10. The lowest accurate model was the DT model, with a total rank value of 7. Except for the AUC, AdaBoost achieved better accuracy and performance compared to the RF and DT models. It is important to note that the RF also received a high degree of accuracy, and it can be used for slope stability classification by the other researchers or engineers. For a better comparison, Figure 10 shows the classification results of the DT, RF, and AdaBoost models from the testing phase compared to the FOS results obtained with the GeoStudio software. As stated earlier, 175 data samples, which constituted 25% of the whole data, were used for each model in the testing phase. It is clear from Figure 10 that the AdaBoost technique was able to record an outstanding performance with the lowest number of unmatched answers (i.e., 11). The number of matched and unmatched for RF and DT were 160 and 15, and 156 and 19, respectively, confirming the RF model’s superiority over the DT in slope stability classification. Overall, the error rate during the testing phase was very low, which reflected the high-performance level of the model development during the training phase. It was concluded that the best performing model for slope stability classification was the AdaBoost, and that it could be used in this field for the same purpose to minimize the associated risk.

6. Conclusions and Future Works

To achieve the aim of this study, tree-based models including DT, RF, and AdaBoost were developed to classify the stability of 700 slopes (464 safe slopes and 236 unsafe slopes) under seismic condition, which were modelled and analysed in GeoStudio software. The variables of H, β, C, ϕ, and PGA were set as model inputs for the classification of slopes where FOS ≥ 1 and FOS < 1 was considered for safe and unsafe slopes, respectively. To measure the performance of the DT, RF, and AdaBoost models, accuracy, precision, recall, F1-score, and AUC as performance indices were calculated for both stages of training and testing. After conducting modelling procedures of classification, the best technique was selected based on the performance indices’ results. From the training part, it was found that the AdaBoost was a perfect technique capable of achieving the highest possible performance compared to the other employed models. Additionally, a higher degree of classification performance for the testing phase was reported for all calculated indices except AUC. Values of 0.910, 0.931, 0.931, 0.931, and 0.931; 0.961, 0.914, 0.915, 0.916 and 0.914; and 0.968, 0.891, 0.895, 0.908 and 0.891 were obtained for AUC, Accuracy, F1, Precision, and Recall of AdaBoost, RF, and DT models, respectively. These values confirmed the successful use of tree-based models in classifying slope stability. However, the better performance and higher capability for classification purpose goes to the proposed AdaBoost technique. Therefore, it can be introduced as a new technique for slope stability classification with the largest number of matched cases.
It is well established that to propose a new method for classifying slope stability cases using AI techniques, extensive investigation is required. Therefore, in order to develop a model for classifying slope stability, a comprehensive database comprising real cases must be gathered and utilized. Yet, collecting such database is very difficult and time consuming. By providing the mentioned data, slope stability classifications can be conducted using new (hybrid) AI techniques, such as RF or AdaBoost, combined with metaheuristic algorithms.
Moreover, the use of real slope stability data based on different types of soils considering other properties, such as unit weight, permeability, and ground water table, would be of interest and importance to geotechnical engineers. In this regard, model generalization as an important issue in classification and prediction problems can be considered, with the developed models covering a wider range of input parameters, as well as a larger number of effective problem variables.

Author Contributions

Conceptualization, D.J.A., B.G. and P.G.A.; methodology, D.J.A., F.I.M.R., M.K. and P.G.A.; software, D.J.A., F.I.M.R., M.K. and P.G.A.; formal analysis, D.J.A., F.I.M.R., M.K. and P.G.A.; writing—original draft preparation, D.J.A., F.I.M.R., M.K., P.G.A., B.G., P.C.R. and M.F.; writing—review and editing, D.J.A., F.I.M.R., M.K., P.G.A., B.G., P.C.R. and M.F.; supervision, D.J.A., B.G. and P.G.A.; Data curation, B.G. All authors have read and agreed to the published version of the manuscript.

Funding

This research received no external funding.

Institutional Review Board Statement

Not applicable.

Informed Consent Statement

Not applicable.

Data Availability Statement

The data are available upon request.

Acknowledgments

Authors of this study wish to express their appreciation to the University of Malaya for supporting this study and making it possible.

Conflicts of Interest

The authors declare no conflict of interest.

References

  1. Gordan, B.; Raja, M.A.; Armaghani, D.J.; Adnan, A. Review on Dynamic Behaviour of Earth Dam and Embankment During an Earthquake. Geotech. Geol. Eng. 2021, 40, 3–33. [Google Scholar] [CrossRef]
  2. Hajihassani, M.; Jahed Armaghani, D.; Kalatehjari, R. Applications of Particle Swarm Optimization in Geotechnical Engineering: A Comprehensive Review. Geotech. Geol. Eng. 2018, 36, 705–722. [Google Scholar] [CrossRef]
  3. Bui, X.N.; Nguyen, H.; Choi, Y.; Nguyen-Thoi, T.; Zhou, J.; Dou, J. Prediction of slope failure in open-pit mines using a novel hybrid artificial intelligence model based on decision tree and evolution algorithm. Sci. Rep. 2020, 10, 9939. [Google Scholar] [CrossRef]
  4. Koopialipoor, M.; Jahed Armaghani, D.; Hedayat, A.; Marto, A.; Gordan, B. Applying various hybrid intelligent systems to evaluate and predict slope stability under static and dynamic conditions. Soft Comput. 2019, 23, 5913–5929. [Google Scholar] [CrossRef]
  5. Cai, M.; Koopialipoor, M.; Armaghani, D.J.; Thai Pham, B. Evaluating Slope Deformation of Earth Dams due to Earthquake Shaking using MARS and GMDH Techniques. Appl. Sci. 2020, 10, 1486. [Google Scholar] [CrossRef] [Green Version]
  6. Gordan, B.; Armaghani, D.J.; Adnan, A.B.; Rashid, A.S.A. A New Model for Determining Slope Stability Based on Seismic Motion Performance. Soil Mech. Found. Eng. 2016, 53, 344–351. [Google Scholar] [CrossRef]
  7. Das, S.K.; Biswal, R.K.; Sivakugan, N.; Das, B. Classification of slopes and prediction of factor of safety using differential evolution neural networks. Environ. Earth Sci. 2011, 64, 201–210. [Google Scholar] [CrossRef]
  8. Hoek, E.; Bray, J.D. Rock Slope Engineering; CRC Press: Boca Raton, FL, USA, 1981; ISBN 1482267098. [Google Scholar]
  9. Hammah, R. A Comparison of Finite Element Slope Stability Analysis With Conventional Limit-Equilibrium Investigation. Proceedings of the 58th Canadian Geotechnical and 6th Joint IAH-CNC and CGS Groundwater Specialty Conferences–GeoSask 2005, 2005. [Google Scholar]
  10. Ray, A.; Kumar, V.; Kumar, A.; Rai, R.; Khandelwal, M.; Singh, T.N. Stability prediction of Himalayan residual soil slope using artificial neural network. Nat. Hazards 2020, 103, 3523–3540. [Google Scholar] [CrossRef]
  11. Erzin, Y.; Cetin, T. The use of neural networks for the prediction of the critical factor of safety of an artificial slope subjected to earthquake forces. Sci. Iran. 2012, 19, 188–194. [Google Scholar] [CrossRef] [Green Version]
  12. Chakraborty, A.; Goswami, D. Prediction of critical safety factor of slopes using multiple regression and neural network. J. Geo-Eng. Sci. 2018, 1–10. [Google Scholar] [CrossRef]
  13. Mahdiyar, A.; Hasanipanah, M.; Armaghani, D.J.; Gordan, B.; Abdullah, A.; Arab, H.; Majid, M.Z.A.; Danial, J.A.; Armaghani, J.; Gordan, B.; et al. A Monte Carlo technique in safety assessment of slope under seismic condition. Eng. Comput. 2017, 33, 807–817. [Google Scholar] [CrossRef]
  14. Asteris, P.G.; Koopialipoor, M.; Armaghani, D.J.; Kotsonis, E.A.; Lourenço, P.B. Prediction of cement-based mortars compressive strength using machine learning techniques. Neural Comput. Appl. 2021, 33, 13089–13121. [Google Scholar] [CrossRef]
  15. Harandizadeh, H.; Armaghani, D.; Asteris, P.G.; Gandomi, A. TBM performance prediction developing a hybrid ANFIS-PNN predictive model optimized by imperialism competitive algorithm. Neural Comput. Appl. 2021, 33, 16149–16179. [Google Scholar] [CrossRef]
  16. Zhao, J.; Nguyen, H.; Nguyen-Thoi, T.; Asteris, P.G.; Zhou, J. Improved Levenberg–Marquardt backpropagation neural network by particle swarm and whale optimization algorithms to predict the deflection of RC beams. Eng. Comput. 2021. [Google Scholar] [CrossRef]
  17. Zhang, H.; Nguyen, H.; Bui, X.-N.; Pradhan, B.; Asteris, P.G.; Costache, R.; Aryal, J. A generalized artificial intelligence model for estimating the friction angle of clays in evaluating slope stability using a deep neural network and Harris Hawks optimization algorithm. Eng. Comput. 2021, 1–14. [Google Scholar] [CrossRef]
  18. Asteris, P.G.; Skentou, A.D.; Bardhan, A.; Samui, P.; Pilakoutas, K. Predicting concrete compressive strength using hybrid ensembling of surrogate machine learning models. Cem. Concr. Res. 2021, 145, 106449. [Google Scholar] [CrossRef]
  19. Asteris, P.G.; Cavaleri, L.; Ly, H.-B.; Pham, B.T. Surrogate models for the compressive strength mapping of cement mortar materials. Soft Comput. 2021, 25, 6347–6372. [Google Scholar] [CrossRef]
  20. Armaghani, D.J.; Mamou, A.; Maraveas, C.; Roussis, P.C.; Siorikis, V.G.; Skentou, A.D.; Asteris, P.G. Predicting the unconfined compressive strength of granite using only two non-destructive test indexes. Geomech. Eng. 2021, 25, 317–330. [Google Scholar]
  21. Zhou, J.; Shen, X.; Qiu, Y.; Li, E.; Rao, D.; Shi, X. Improving the efficiency of microseismic source locating using a heuristic algorithm-based virtual field optimization method. Geomech. Geophys. Geo-Energy Geo-Resour. 2021, 7, 89. [Google Scholar] [CrossRef]
  22. Zhou, J.; Qiu, Y.; Khandelwal, M.; Zhu, S.; Zhang, X. Developing a hybrid model of Jaya algorithm-based extreme gradient boosting machine to estimate blast-induced ground vibrations. Int. J. Rock Mech. Min. Sci. 2021, 145, 104856. [Google Scholar] [CrossRef]
  23. Zhou, J.; Li, X.; Mitri, H.S. Classification of rockburst in underground projects: Comparison of ten supervised learning methods. J. Comput. Civ. Eng. 2016, 30, 4016003. [Google Scholar] [CrossRef]
  24. Zhou, J.; Chen, C.; Wang, M.; Khandelwal, M. Proposing a novel comprehensive evaluation model for the coal burst liability in underground coal mines considering uncertainty factors. Int. J. Min. Sci. Technol. 2021, 31, 799–812. [Google Scholar] [CrossRef]
  25. Yang, H.Q.; Li, Z.; Jie, T.Q.; Zhang, Z.Q. Effects of joints on the cutting behavior of disc cutter running on the jointed rock mass. Tunn. Undergr. Sp. Technol. 2018, 81, 112–120. [Google Scholar] [CrossRef]
  26. Yang, H.; Wang, H.; Zhou, X. Analysis on the damage behavior of mixed ground during TBM cutting process. Tunn. Undergr. Sp. Technol. 2016, 57, 55–65. [Google Scholar] [CrossRef]
  27. Liu, B.; Yang, H.; Karekal, S. Effect of Water Content on Argillization of Mudstone During the Tunnelling process. Rock Mech. Rock Eng. 2019, 53, 799–813. [Google Scholar] [CrossRef]
  28. Yang, H.; Wang, Z.; Song, K. A new hybrid grey wolf optimizer-feature weighted-multiple kernel-support vector regression technique to predict TBM performance. Eng. Comput. 2020, 1–17. [Google Scholar] [CrossRef]
  29. Kardani, N.; Bardhan, A.; Samui, P.; Nazem, M.; Zhou, A.; Armaghani, D.J. A novel technique based on the improved firefly algorithm coupled with extreme learning machine (ELM-IFF) for predicting the thermal conductivity of soil. Eng. Comput. 2021, 1–20. [Google Scholar] [CrossRef]
  30. Parsajoo, M.; Armaghani, D.J.; Mohammed, A.S.; Khari, M.; Jahandari, S. Tensile strength prediction of rock material using non-destructive tests: A comparative intelligent study. Transp. Geotech. 2021, 31, 100652. [Google Scholar] [CrossRef]
  31. Mahmood, W.; Mohammed, A.S.; Asteris, P.G.; Kurda, R.; Armaghani, D.J. Modeling Flexural and Compressive Strengths Behaviour of Cement-Grouted Sands Modified with Water Reducer Polymer. Appl. Sci. 2022, 12, 1016. [Google Scholar] [CrossRef]
  32. Asteris, P.G.; Lourenço, P.B.; Roussis, P.C.; Adami, C.E.; Armaghani, D.J.; Cavaleri, L.; Chalioris, C.E.; Hajihassani, M.; Lemonis, M.E.; Mohammed, A.S. Revealing the nature of metakaolin-based concrete materials using artificial intelligence techniques. Constr. Build. Mater. 2022, 322, 126500. [Google Scholar] [CrossRef]
  33. Abdalla, J.A.; Attom, M.F.; Hawileh, R. Prediction of minimum factor of safety against slope failure in clayey soils using artificial neural network. Environ. Earth Sci. 2015, 73, 5463–5477. [Google Scholar] [CrossRef]
  34. Verma, A.K.; Singh, T.N.; Chauhan, N.K.; Sarkar, K. A hybrid FEM–ANN approach for slope instability prediction. J. Inst. Eng. Ser. A 2016, 97, 171–180. [Google Scholar] [CrossRef]
  35. Samui, P. Support vector classifier analysis of slope. Geomat. Nat. Hazards Risk 2013, 4, 1–12. [Google Scholar] [CrossRef] [Green Version]
  36. Sakellariou, M.G.; Ferentinou, M.D. A study of slope stability prediction using neural networks. Geotech. Geol. Eng. 2005, 23, 419. [Google Scholar] [CrossRef]
  37. Ferentinou, M.D.; Sakellariou, M.G. Computational intelligence tools for the prediction of slope performance. Comput. Geotech. 2007, 34, 362–384. [Google Scholar] [CrossRef]
  38. Mohamed, T.; Kasa, A. Application of fuzzy set theory to evaluate the stability of slopes. Appl. Mech. Mater. 2014, 580–583, 566–571. [Google Scholar] [CrossRef]
  39. Kalatehjari, R.; Rashid, A.S.A.; Ali, N.; Hajihassani, M. The contribution of particle swarm optimization to three-dimensional slope stability analysis. Sci. World J. 2014, 2014, 973093. [Google Scholar] [CrossRef] [PubMed] [Green Version]
  40. Lu, P.; Rosenbaum, M.S. Artificial neural networks and grey systems for the prediction of slope stability. Nat. Hazards 2003, 30, 383–398. [Google Scholar] [CrossRef]
  41. Samui, P. Slope stability analysis: A support vector machine approach. Environ. Geol. 2008, 56, 255. [Google Scholar] [CrossRef]
  42. Tien Bui, D.; Pradhan, B.; Lofman, O.; Revhaug, I. Landslide susceptibility assessment in vietnam using support vector machines, decision tree, and Naive Bayes Models. Math. Probl. Eng. 2012, 2012, 974638. [Google Scholar] [CrossRef] [Green Version]
  43. Amit, Y.; Geman, D. Shape Quantization and Recognition with Randomized Trees. Neural Comput. 1997, 9, 1545–1588. [Google Scholar] [CrossRef] [Green Version]
  44. Hwang, S.G.; Guevarra, I.F.; Yu, B.O. Slope failure prediction using a decision tree: A case of engineered slopes in South Korea. Eng. Geol. 2009, 104, 126–134. [Google Scholar] [CrossRef]
  45. Gelisli, K.; Kaya, T.; Babacan, A.E. Assessing the factor of safety using an artificial neural network: Case studies on landslides in Giresun, Turkey. Environ. Earth Sci. 2015, 73, 8639–8646. [Google Scholar] [CrossRef]
  46. Tao, G.L.; Yao, Z.S.; Tan, B.Z.; Gao, C.C.; Yao, Y.W. Application of Support Vector Machine for Prediction of Slope Stability Coefficient Considering the Influence of Rainfall and Water Level. Appl. Mech. Mater. 2016, 851, 840–845. [Google Scholar] [CrossRef]
  47. Fattahi, H. Prediction of slope stability using adaptive neuro-fuzzy inference system based on clustering methods. J. Min. Environ. 2017, 8, 163–177. [Google Scholar]
  48. Qi, C.; Tang, X. Slope stability prediction using integrated metaheuristic and machine learning approaches: A comparative study. Comput. Ind. Eng. 2018, 118, 112–122. [Google Scholar] [CrossRef]
  49. Hidayat, S.; Alpiana; Rahmawati, D. Application of adaptive neuro-fuzzy inference system (ANFIS) for slope and pillar stability assessment. IOP Conf. Ser. Earth Environ. Sci. 2020, 413, 012003. [Google Scholar] [CrossRef]
  50. Sari, P.A.; Suhatril, M.; Osman, N.; Mu’azu, M.A.; Katebi, J.; Abavisani, A.; Ghaffari, N.; Sadeghi Chahnasir, E.; Wakil, K.; Khorami, M.; et al. Developing a hybrid adoptive neuro-fuzzy inference system in predicting safety of factors of slopes subjected to surface eco-protection techniques. Eng. Comput. 2020, 36, 1347–1354. [Google Scholar] [CrossRef]
  51. Han, H.; Armaghani, D.J.; Tarinejad, R.; Zhou, J.; Tahir, M.M. Random Forest and Bayesian Network Techniques for Probabilistic Prediction of Flyrock Induced by Blasting in Quarry Sites. Nat. Resour. Res. 2020, 29, 655–667. [Google Scholar] [CrossRef]
  52. Zhou, J.; Asteris, P.G.; Armaghani, D.J.; Pham, B.T. Prediction of ground vibration induced by blasting operations through the use of the Bayesian Network and random forest models. Soil Dyn. Earthq. Eng. 2020, 139, 106390. [Google Scholar] [CrossRef]
  53. Li, D.; Moghaddam, M.R.; Monjezi, M.; Jahed Armaghani, D.; Mehrdanesh, A. Development of a Group Method of Data Handling Technique to Forecast Iron Ore Price. Appl. Sci. 2020, 10, 2364. [Google Scholar] [CrossRef] [Green Version]
  54. Liang, M.; Mohamad, E.T.; Faradonbeh, R.S.; Jahed Armaghani, D.; Ghoraba, S. Rock strength assessment based on regression tree technique. Eng. Comput. 2016, 32, 343–354. [Google Scholar] [CrossRef]
  55. Newmark, N.M. Effects of earthquakes on dams and embankments. Geotechnique 1965, 15, 139–160. [Google Scholar] [CrossRef] [Green Version]
  56. Ambraseys, N.N.; Menu, J.M. Earthquake-induced ground displacements. Earthq. Eng. Struct. Dyn. 1988, 16, 985–1006. [Google Scholar] [CrossRef]
  57. Sarma, S.K.; Bhave, M.V. Critical acceleration versus static factor of safety in stability analysis of earth dams and embankments. Geotechnique 1974, 24, 661–665. [Google Scholar] [CrossRef]
  58. Abramson, L.W.; Lee, T.S.; Sharma, S.; Boyce, G.M. Slope Stability and Stabilization Methods; John Wiley & Sons: Hoboken, NJ, USA, 2001; ISBN 0471384933. [Google Scholar]
  59. Zhu, D.Y.; Lee, C.F.; Jiang, H.D. Generalised framework of limit equilibrium methods for slope stability analysis. Geotechnique 2003, 53, 377–395. [Google Scholar] [CrossRef]
  60. Samui, P.; Kothari, D.P. Utilization of a least square support vector machine (LSSVM) for slope stability analysis. Sci. Iran. 2011, 18, 53–58. [Google Scholar] [CrossRef] [Green Version]
  61. Erzin, Y.; Cetin, T. The prediction of the critical factor of safety of homogeneous finite slopes using neural networks and multiple regressions. Comput. Geosci. 2013, 51, 305–313. [Google Scholar] [CrossRef]
  62. Myles, A.J.; Feudale, R.N.; Liu, Y.; Woody, N.A.; Brown, S.D. An introduction to decision tree modeling. J. Chemom. A J. Chemom. Soc. 2004, 18, 275–285. [Google Scholar] [CrossRef]
  63. Jopp, F.; Reuter, H.; Breckling, B. Modelling Complex Ecological Dynamics: An Introduction into Ecological Modelling for Students, Teachers & Scientists; Springer: Berlin/Heidelberg, Germany, 2011; pp. 1–387. [Google Scholar]
  64. Murthy, S.K. Automatic construction of decision trees from data: A multi-disciplinary survey. Data Min. Knowl. Discov. 1998, 2, 345–389. [Google Scholar] [CrossRef]
  65. Kheir, R.B.; Greve, M.H.; Abdallah, C.; Dalgaard, T. Spatial soil zinc content distribution from terrain parameters: A GIS-based decision-tree model in Lebanon. Environ. Pollut. 2010, 158, 520–528. [Google Scholar] [CrossRef] [PubMed]
  66. Tso, G.K.F.; Yau, K.K.W. Predicting electricity energy consumption: A comparison of regression analysis, decision tree and neural networks. Energy 2007, 32, 1761–1768. [Google Scholar] [CrossRef]
  67. Zhao, Y.; Zhang, Y. Comparison of decision tree methods for finding active objects. Adv. Sp. Res. 2008, 41, 1955–1959. [Google Scholar] [CrossRef] [Green Version]
  68. Ho, T.K. Random decision forests. Proc. Int. Conf. Doc. Anal. Recognit. ICDAR 1995, 1, 278–282. [Google Scholar]
  69. Kainthura, P.; Sharma, N. Machine Learning Techniques to Predict Slope Failures in Uttarkashi, Uttarakhand (India). J. Sci. Ind. Res. 2021, 80, 66–74. [Google Scholar]
  70. Piryonesi, S.M.; El-Diraby, T.E. Role of data analytics in infrastructure asset management: Overcoming data size and quality problems. J. Transp. Eng. Part B Pavements 2020, 146, 4020022. [Google Scholar] [CrossRef]
  71. Boulesteix, A.L.; Janitza, S.; Kruppa, J.; König, I.R. Overview of random forest methodology and practical guidance with emphasis on computational biology and bioinformatics. Wiley Interdiscip. Rev. Data Min. Knowl. Discov. 2012, 2, 493–507. [Google Scholar] [CrossRef] [Green Version]
  72. Kégl, B. The return of ADABOOST.MH: Multi-class Hamming trees. arXiv 2014, arXiv:1312.6086. [Google Scholar]
  73. Saadaari, F.; Olaleye, B.M. Development of a Stope Stability Prediction Model Using Ensemble Learning Techniques—A Case Study. Ghana Min. J. 2020, 20, 18–26. [Google Scholar] [CrossRef]
  74. Wang, H.; Zhang, L.; Yin, K.; Luo, H.; Li, J. Landslide identification using machine learning. Geosci. Front. 2020, 12, 351–364. [Google Scholar] [CrossRef]
  75. Pham, B.T.; Nguyen, M.D.; Nguyen-Thoi, T.; Ho, L.S.; Koopialipoor, M.; Quoc, N.K.; Armaghani, D.J.; Van Le, H. A novel approach for classification of soils based on laboratory tests using Adaboost, Tree and ANN modeling. Transp. Geotech. 2020, 27, 100508. [Google Scholar] [CrossRef]
  76. Rojas, R. AdaBoost and the Super Bowl of Classifiers a Tutorial Introduction to Adaptive Boosting. Writing, Computer Science Department, Freie Universitat, Berlin, Germany. 2009. Available online: http://www.inf.fu-berlin.de/inst/ag-ki/adaboost4.pdf (accessed on 11 April 2016).
  77. Zorlu, K.; Gokceoglu, C.; Ocakoglu, F.; Nefeslioglu, H.A.; Acikalin, S. Prediction of uniaxial compressive strength of sandstones using petrography-based models. Eng. Geol. 2008, 96, 141–158. [Google Scholar] [CrossRef]
Figure 1. Limit equilibrium model for the stability analysis, (W: weight, τ: shear strength, kh: seismic coefficient, g: acceleration due to gravity, β: is slope inclination, H: slope height).
Applsci 12 01753 g001
Figure 2. Procedure flowchart for FOS classification.
Applsci 12 01753 g002
Figure 3. Methodology flowchart for DT modelling.
Applsci 12 01753 g003
Figure 4. Methodology flowchart for RF modelling.
Applsci 12 01753 g004
Figure 5. Methodology flowchart for AdaBoost modelling.
Applsci 12 01753 g005
Figure 6. The optimal DT model for FOS classification.
Applsci 12 01753 g006
Figure 7. The DT model results for FOS classification: (A) Training and (B) Testing.
Applsci 12 01753 g007
Figure 8. The RF model results for FOS classification: (A) Training and (B) Testing.
Applsci 12 01753 g008
Figure 9. The AdaBoost model results for FOS classification: (A) Training and (B) Testing.
Applsci 12 01753 g009
Figure 10. Chart of results obtained from the models compared to expected results.
Applsci 12 01753 g010
Table 1. Some of the classifications/prediction studies in the areas of slope stability using AI/ML models.
Reference ModelInputData SizeR2 Accuracy
(%)
Amit and Geman [43]DTH, C, ϕ, β, rainfall and water level data118 -80
Sakellariou and Ferentinou [36]ANN, SOMH, c, φ, β, ru and γ, kmax450.94
Ferentinou and Sakellariou [37]ANNH, c, φ, β, ru and γ460.95
Lu and Rosenbaum [40]ANNH, c, ϕ,ru and γ30 datasets-99
Samui [41]SVMH, c, ϕ, ru and γ46 datasets0.875-
Hwang et al. [44]DTH, c, ϕ, β and γ6828 datasets -72
Das et al. [7]ANNH, c, ϕ and γ46 datasets0.982-
Samui [35]SVMH, c, ϕ, ru and γ32 datasets1.0-
Mohamed and Kasa [38]ANFISH, c, ϕ and γ300 datasets0.980-
Gelisli et al. [45]ANNH, c, ϕ and γ100 datasets0.99-
Tao et al. [46]SVMH, c, ϕ, γ, rainfall data20 datasets-88
Fattahi [47]ANFISH, c, ϕ, β and γ67 datasets0.952-
Qi and Tang [48]ANNH, β, γ,c168 datasets-96
Hidayat et al. [49]ANFISH, c, ϕ, γ, and γ53 datasets0.96-
Ray et al. [10]ANNH, c, ϕ and γ-0.958-
Sari et al. [50]ANFISH, c, ϕ and γ30 datasets0.954-
H: Height of cut, c: Cohesion of soil, ϕ: Angle of internal friction, β: Slope inclination, ru: Pore water pressure ratio, kmax: seismic coefficient.
Table 2. Input and output variables for slope stability classification.
PropertyVariable
Slope Height (m)Angle of Inclination (°)Cohesion (kPa)Friction Angle (°)Peak Ground AccelerationFactor of Safety
SymbolHβcϕPGA (m/s2)FOS
CategoryInputInputInputInputInputOutput
Min1520202000.78
Max303550403.922.46
Average22.3325.1835.334.071.181.20
Std. Deviation5.6511.185.881.070.35
Variance31.3726124.9634.591.150.12
Table 3. Sensitivity analysis of input and output variables.
Input Parameter HβCϕPGA
rij0.9300.9240.9150.9620.616
Table 4. The optimal parameters obtained by the DT model.
DT ParameterValue
Minimum number of instances in leaves7
Minimum limit of the split subset5
Maximal tree depth7
Table 5. The optimal parameters obtained by the RF model.
RF ParameterValue
Number of trees7
Minimum limit of the split subset5
Table 6. The optimal parameters obtained by the AdaBoost model.
AdaBoost ParameterValue
Base Parameter DT
Number of estimators6
Table 7. Modelling results for the testing datasets of DT, RF, and AdaBoost for slope stability classification.
ModelPerformance IndicatorsRank
AUCAccuracyF1PrecisionRecallAUCAccuracyF1PrecisionRecallTotal
DT0.9680.8910.8950.9080.891311117
RF0.9610.9140.9150.9160.9142222210
AdaBoost0.9100.9310.9310.9310.9311333313
Publisher’s Note: MDPI stays neutral with regard to jurisdictional claims in published maps and institutional affiliations.

