
Quantitative Assessment of Flexibility at the TSO/DSO Interface Subject to the Distribution Grid Limitations †


Abstract
:1. Introduction
- -
- To what extent can the TSO exploit flexibility without causing issues at the distribution level?
- -
- What are the main issues caused by flexibility?
- -
- Are there operational actions that enable flexibility at the distribution level?
- -
- What are the expected costs to enable flexibility?
2. Flexibility Services
- T1.
- Balancing—The TSO uses flexibility for system balancing purposes: frequency containment reserve, automatic frequency restoration reserve and manual frequency restoration reserve.
- T2.
- Reactive Power Management in Transmission Networks—Flexible DERs are used for reactive power management to minimise grid losses or support the voltage on the transmission network.
- D1.
- Local Congestion Management in Distribution Networks—This use case refers to the use of flexibility to relieve one or more congested lines.
- D2.
- Congestion Avoidance at TSO/DSO Interface—For countries where the transformers at the TSO/DSO interface are owned and operated by the DSOs, transformer congestions can be avoided using flexibility from the distribution grid.
- D3.
- Voltage Control in Distribution Network (active power modulation)—In this use case, the DSO uses flexibility to control the voltage via active power management.
- D4.
- Voltage Control in Distribution Network (reactive power support)—In this use case, the DSO activates one or several flexible units connected to its distribution network to perform voltage control in its network via reactive power flows support.
3. Regulatory Framework
- Extended centralised dispatching: all participants, from transmission and distribution, offer system services to the global market. The TSO is the only buyer of flexibility.
- Local Ancillary Service market: DERs may participate in a new local AS market managed by the DSO. In this market, local services for solving distribution network operation issues are directly purchased by the DSO that, in turn, offers system services to the global AS market managed by the TSO by aggregating the remaining bids from the same or other DERs that participate in the local market.
- Shared balancing responsible model: TSOs and DSOs handle the flexibility offered by only the resources connected to the networks that they manage. DERs connected to the distribution system cannot provide system services to the TSOs. Still, the DSOs have the new role of balancing the demand and the production at its voltage level according to a schedule defined in advance with the TSO and based on the day-ahead energy market results or historical data.
- Common TSO–DSO market model: TSOs and DSOs can purchase services from flexible resources connected to the transmission and distribution grid. Both operators buy products from the joint-operated marketplace. There is no priority for the TSO or DSO, but the service is allocated by considering the highest need in terms of increasing social welfare. There are two variants of this market model. In the first, bids for system and local services are cleared in the same session, considering both transmission and distribution constraints. The DSO operates a local market that runs earlier than the common session but with participants’ commitment in the second variant. Then, in the common market, the optimisation of the bid allocation considers the results of the first local market.
- Integrated flexibility market model: This new market for flexibility allows DSOs, TSOs and other non-regulated players to buy flexible products from all resources independently from the connection point. The services are allocated to the party willing to pay more than the others.
4. Proposed Approach: Quantitative Assessment of the Flexibility
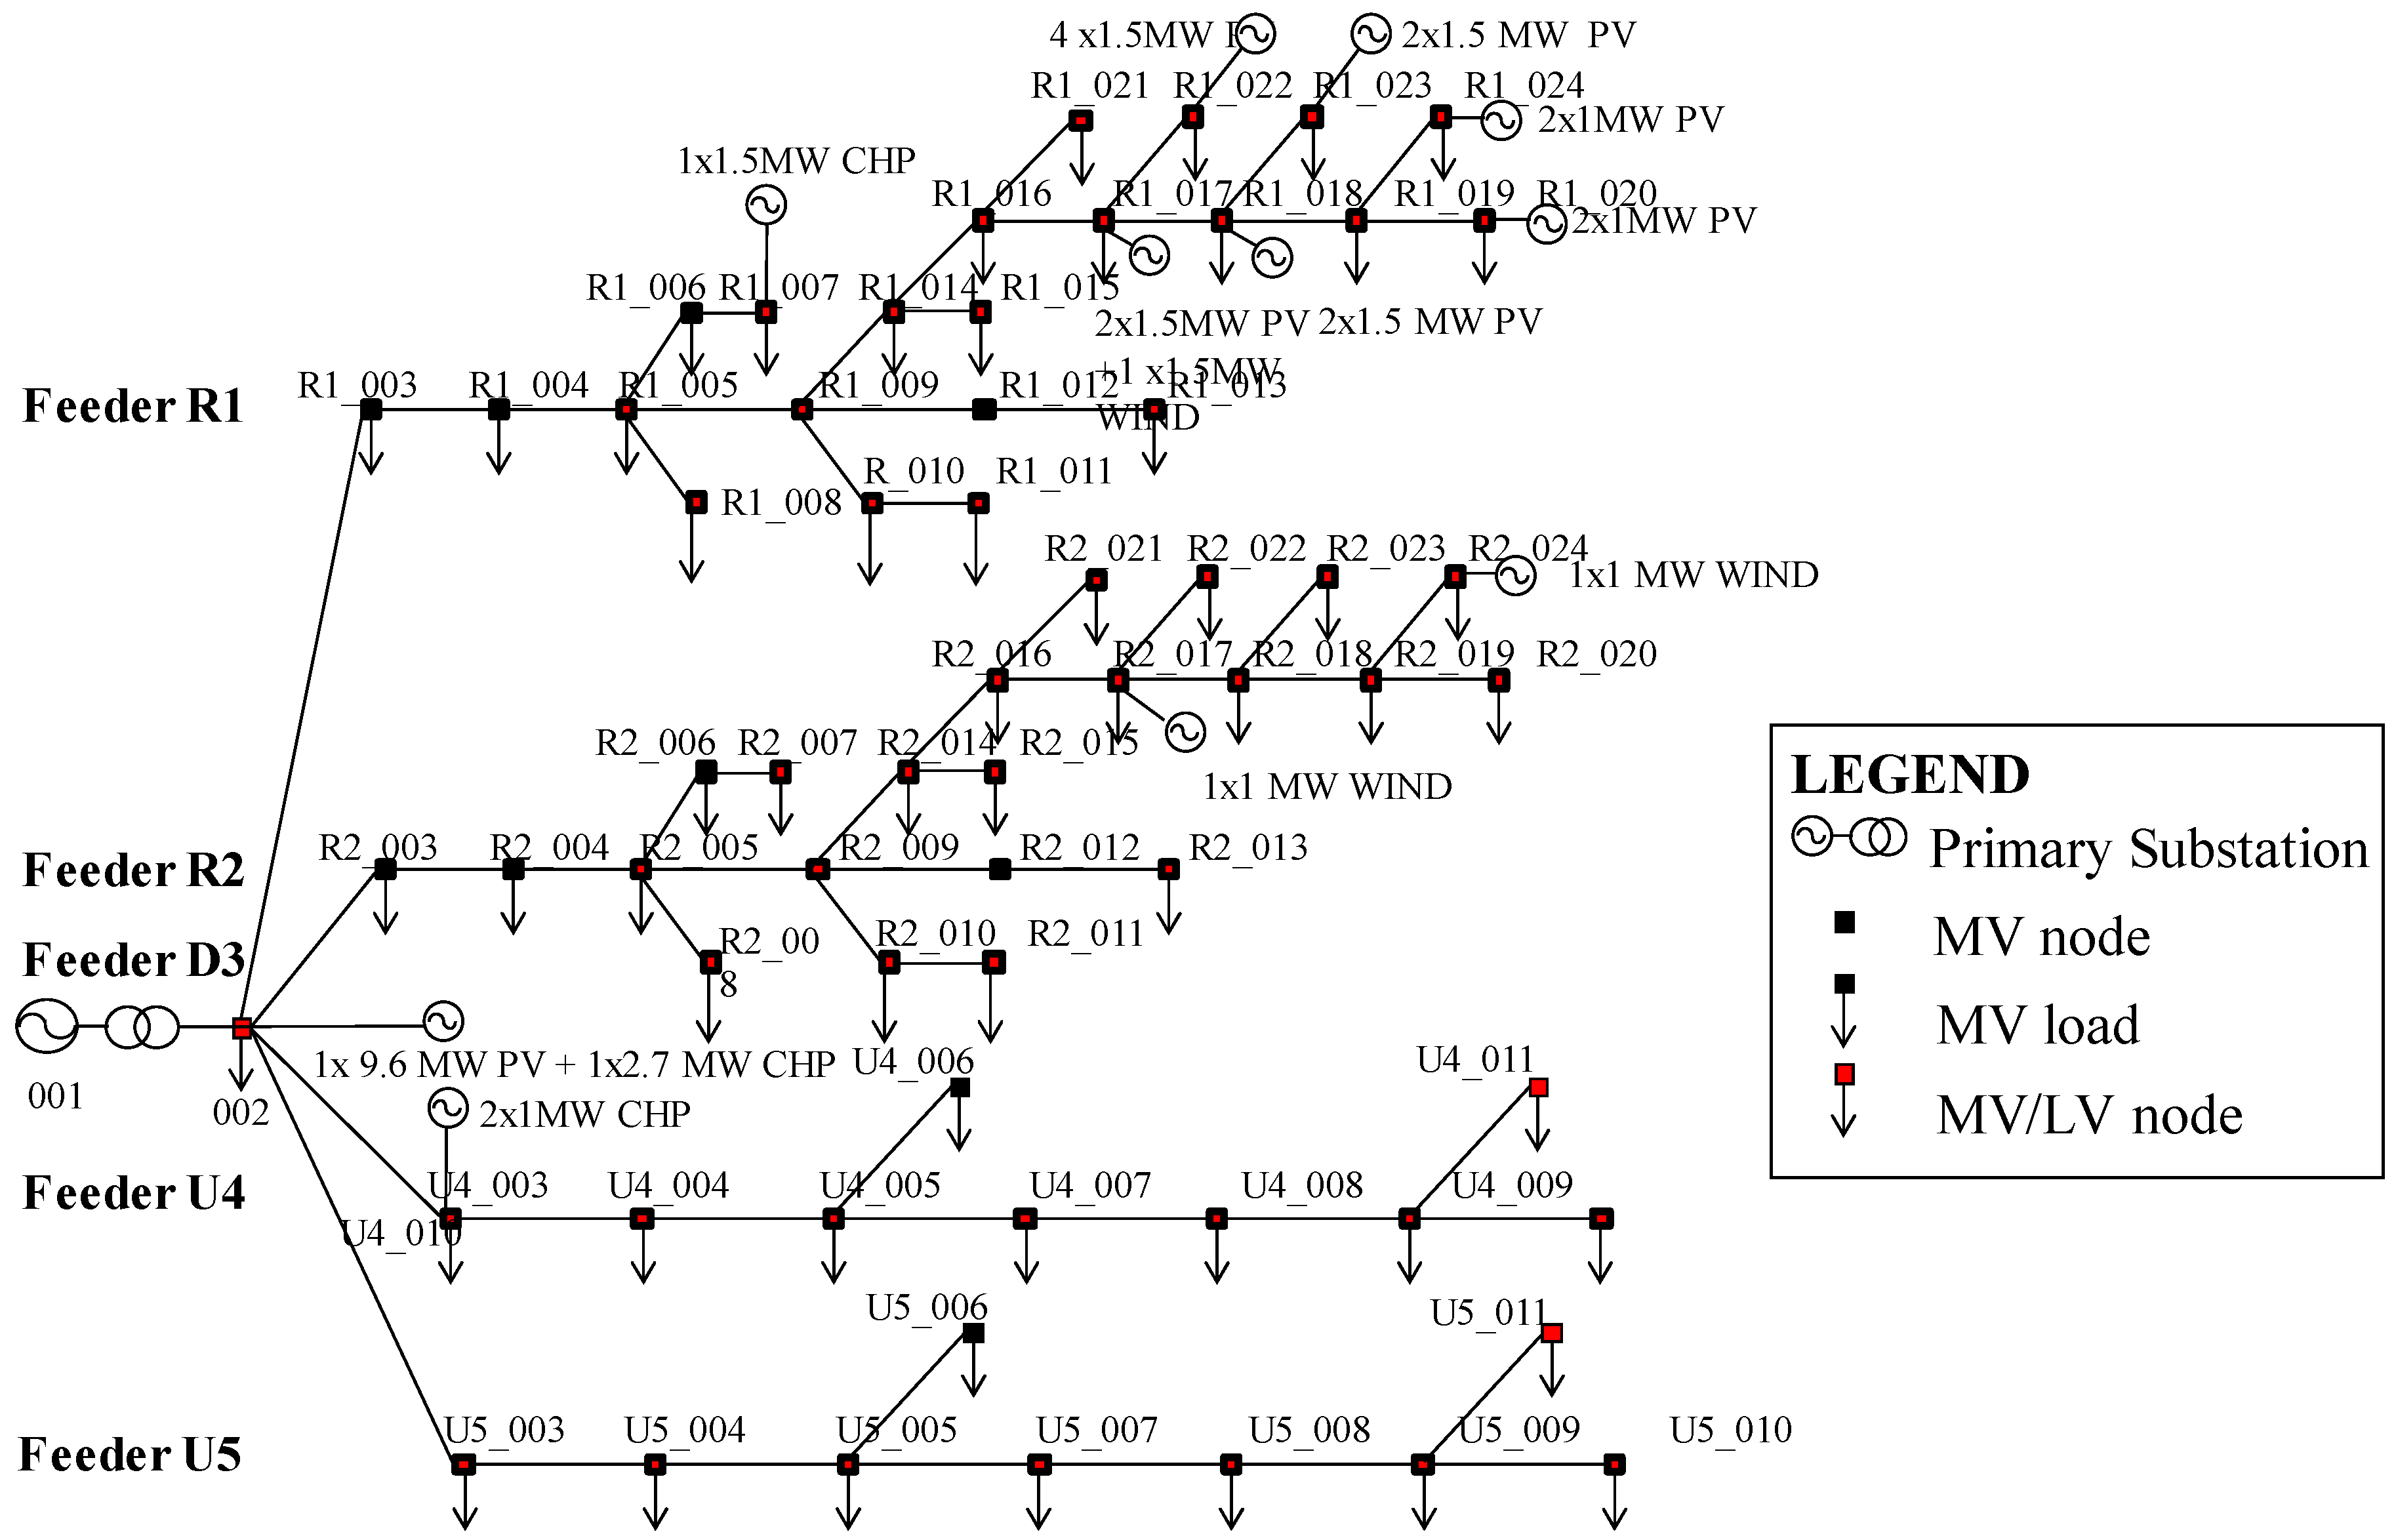
- The first task builds the distribution network model in terms of lines, topology, conductors, demand and production exchanged with the bulk grid using open data only. The results are helpful for the TSO and for the stakeholders that do not know the distribution grid in detail.
- The second task aims at quantifying the availability of flexible products and the relevant costs by using local market models that optimise the DERs dispatching.
4.1. Modelling the Distribution Systems
4.2. Flexibility Providers
4.3. Assessment of Price/Quantity Curves at the TSO/DSO Interfaces
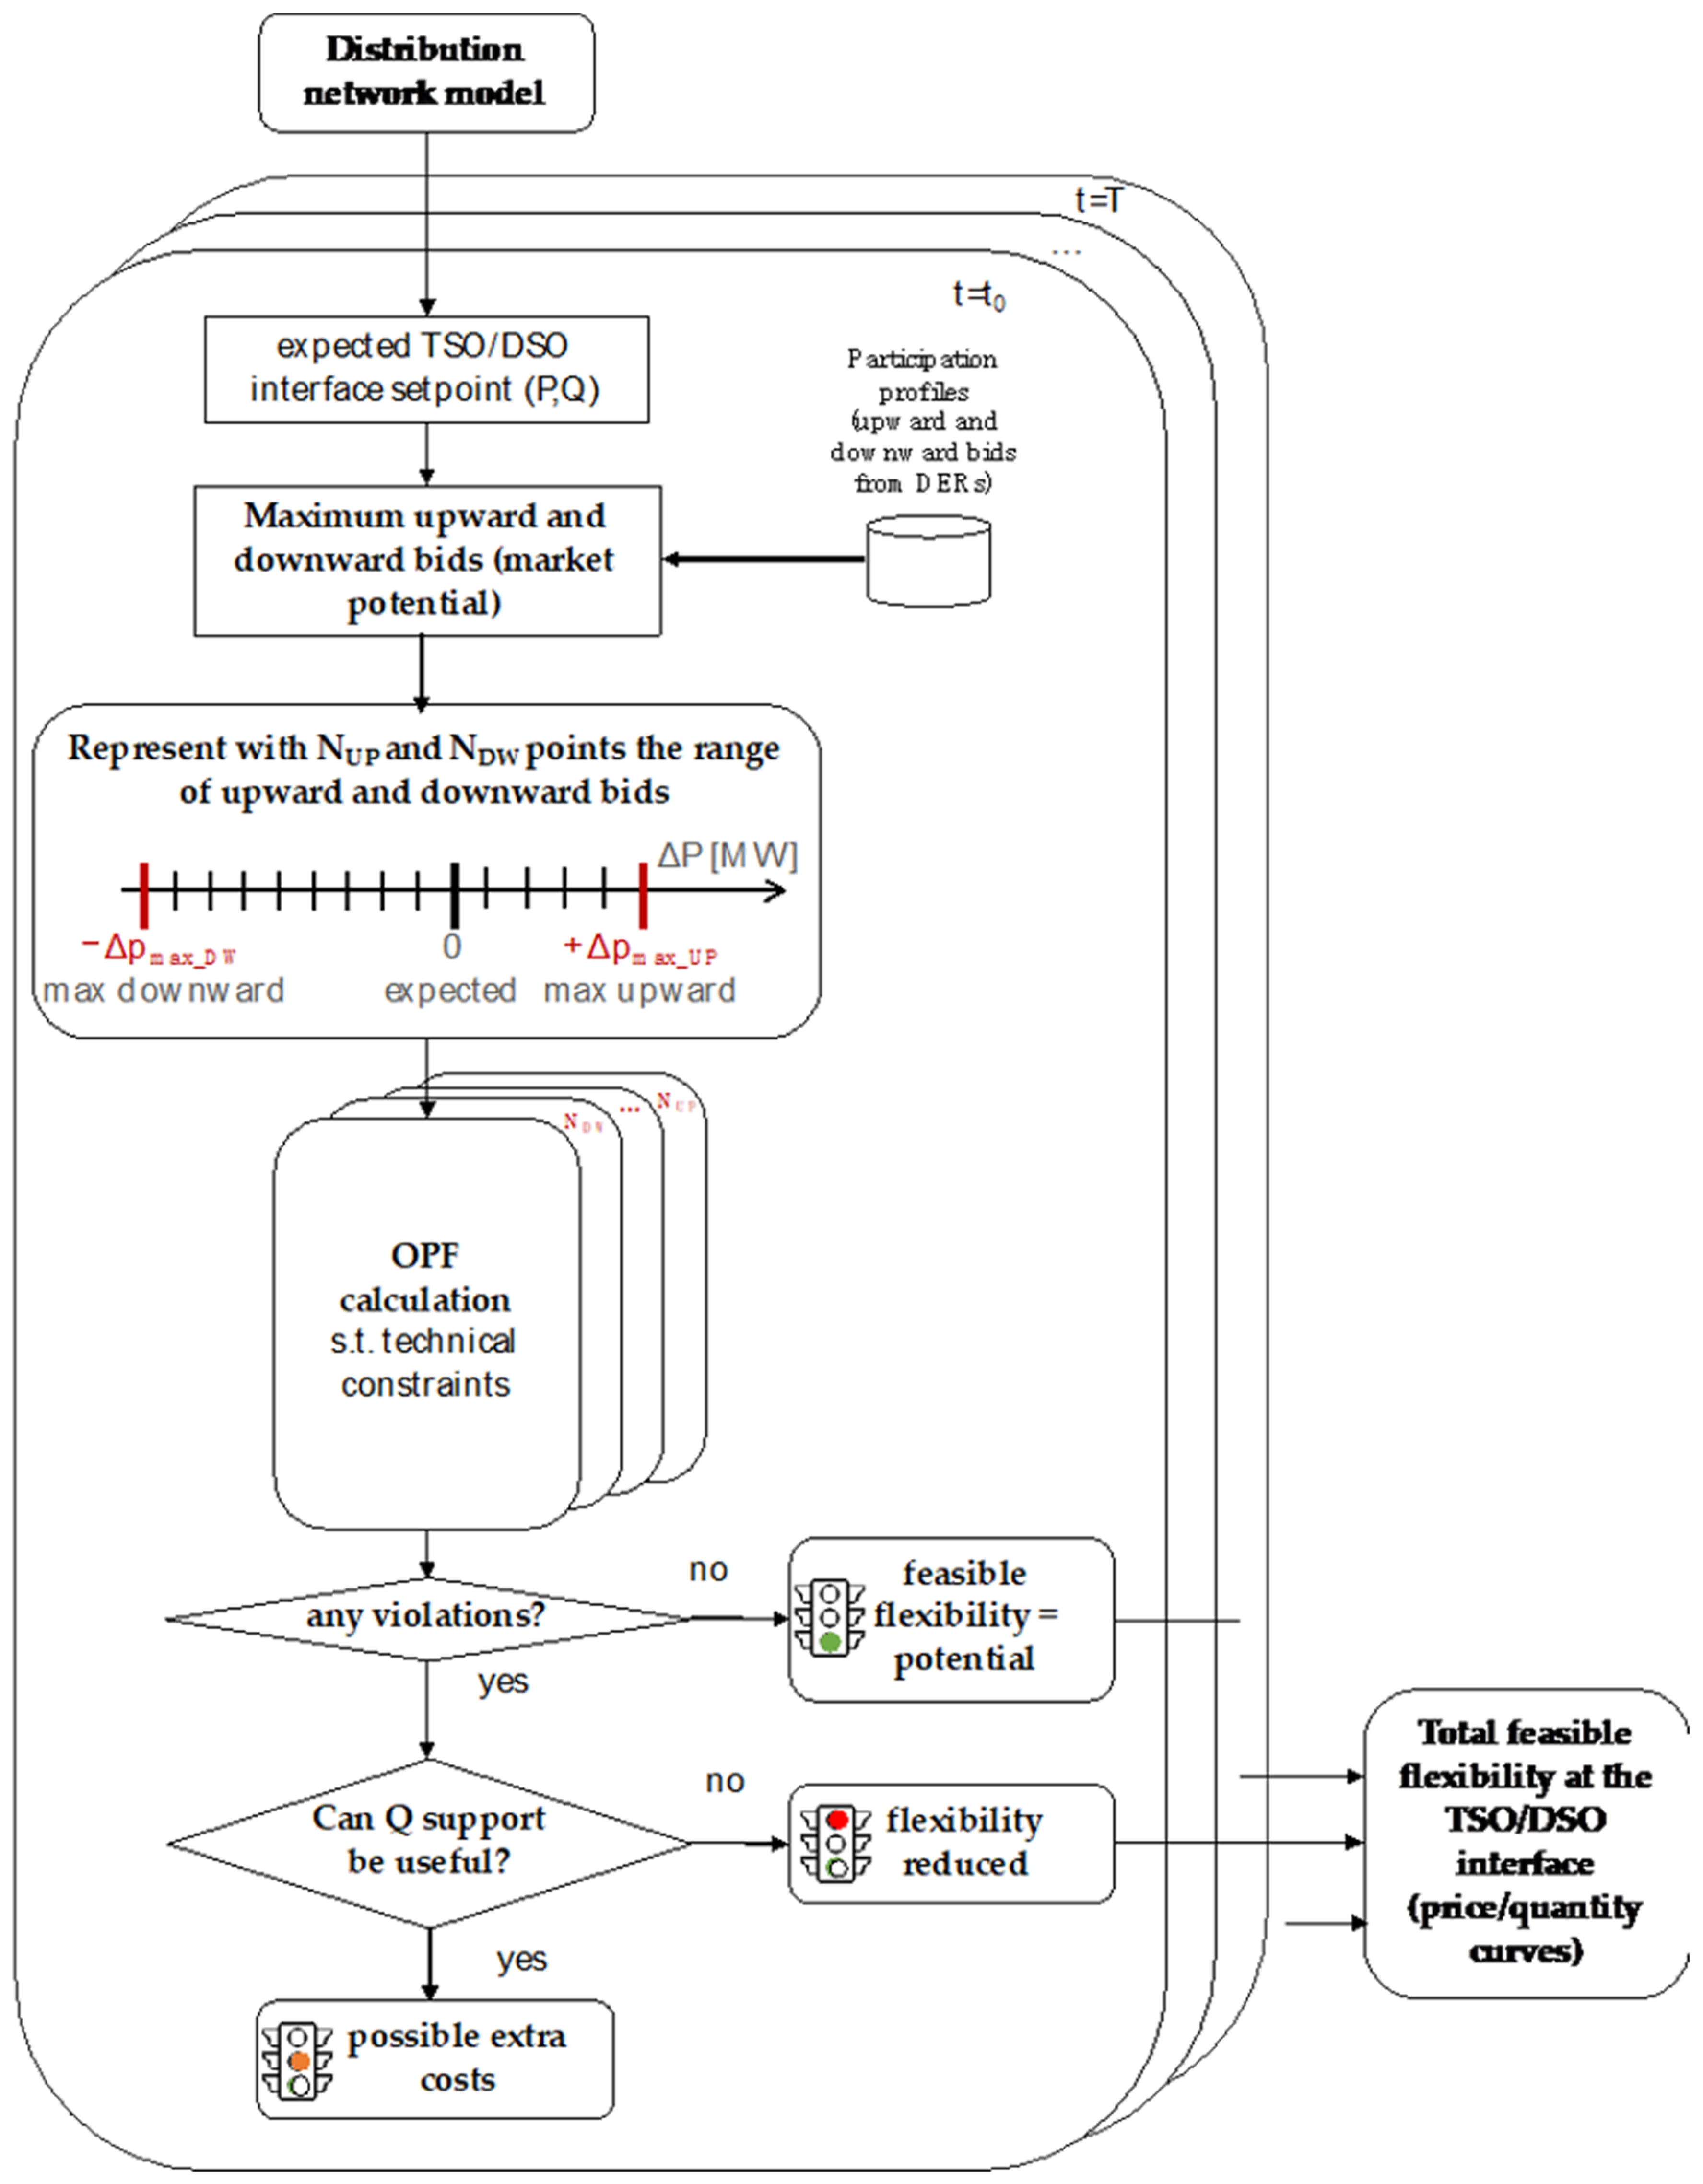
- Calculate the maximum variations in upward and downward offers of the expected working point at the TSO/DSO interface by considering the hypothesised participation profile of each DER (i.e., maximum/minimum local generation and the minimum/maximum demand). Thus, the most extensive range of potential bids of the virtual power plant at the TSO/DSO interface is defined.
- Represent the range of the upward and downward offers with a fair number of points.
- Perform power flow (PF) calculations to verify the compliance of the distribution grid operation with the technical constraints by applying the generation/load conditions corresponding to the points obtained in the previous step 2. The PF calculation is performed on the given real distribution network if the data are known or, otherwise, on its synthetic model.
- If no violations are found, the relevant flexibility can be used by TSO with no adjunctive cost than the one correspondent to the price of the bids times the quantity purchased (i.e., pay as bid, they will receive a green traffic light).
- If operational issues are found (e.g., voltage regulation and power congestions), an OPF calculation is performed to identify the optimal setpoints of local resources required to fix such distribution issues. In the early phase of the local flexibility market, only reactive power support can be used to solve the distribution system operational issues (i.e., the reactive support is used for voltage regulation issues, and it is more effective in networks with a high X/R ratio). The OPF aims at minimising the distribution system operation costs that have to be added to the price of the active power bids that, if awarded, can be accepted with reserve by the DSO (i.e., they will receive an orange traffic light).
- c.
- It may happen that, in particularly critical distribution networks close to their hosting capacity, some operational issues (e.g., overvoltages, power congestions, excessive voltage drops) cannot be solved by resorting to the local resources. In such cases, the flexibility that can be offered to the TSO is limited by the distribution constraints. The difference between the potential bids calculated in step 1 and that resulting from eliminating the critical working points represents the measure of the non-feasible bids. DERs can bid such offers to the service market, but, if awarded, they will be blocked by the DSO (i.e., they will receive a red traffic light).
5. Case Study
6. Results
7. Discussion and Conclusions
- It is necessary to carefully assess to what extent can a TSO exploit flexibility without causing issues at the distribution level. Such extent depends firstly on the number of the DERs intentioned to participate in the market, and secondly on the specific position of the resources in the network. The more DERs participate in the market, more quantity can be managed, but the increasing potential does not necessarily increase the same quantity in the feasible flexibility that can be moved without harmful impact on the network operation. The reported assessment, together with resorting to the methodology used for representing the real network via a realistic model (i.e., the synthetic network), can be a valid option for estimating such extent by players different from the DSOs (i.e., TSO and aggregators).
- The main issues caused by flexibility are voltage regulation problems, as overvoltage conditions caused by upward bids (i.e., extra production or load shedding) or excessive voltage drops in case of uncontrolled downward bids (i.e., curtailment of production or increasing of consumption by the active customers). In some cases, such violations of the technical constraints can be solved, with extra costs, by resorting to the reactive power support from DG. In other cases, the potential bids might be definitely reduced. In any case, resorting to flexibility cannot disregard the distribution grid limitations.
- The operational actions that enable flexibility at the distribution level rely mainly on the interactions between system operators. In the case of uncontrolled participation of DERs in the whole ancillary service market, possible blocks to the bids by the DSO may occur. The assessment in advance of the possible violations of the network constraints may prevent such situations and simplify the use of the flexibility for global services achieving a reduction in the system operation costs.
- The expected costs to enable flexibility depends on the regulatory framework. In the proposed Case Study, a possible rational behaviour in the market of the DERs owner has been proposed. The final costs are quantified according to the hypothesis of remunerating the reactive power support.
Author Contributions
Funding
Informed Consent Statement
Acknowledgments
Conflicts of Interest
References
- CEER Report Distribution Systems Working Group, Flexibility Use at Distribution Level: A CEER Conclusions Paper, Ref: C18-DS-42-04. Available online: https://www.ceer.eu/documents/104400/-/-/e436ca7f-a0df-addb-c1de-5a3a5e4fc22b (accessed on 17 July 2018).
- Italian Regulatory Authority for Energy, Networks and Environment (ARERA), Deliberazione 5 maggio 2017 300/2017/R/EEL. Available online: https://www.arera.it/allegati/docs/17/300-17ti.pdf (accessed on 10 January 2022). (In Italian).
- Marchisio, L. Partecipazione Della Domanda Flessibile al Mercato per il Servizio di Dispacciamento, Terna Spa. 2017. Available online: http://www.energy-home.it/Documents (accessed on 10 January 2022). (In Italian).
- Gulotta, F.; Rossi, A.; Bovera, F.; Falabretti, D.; Galliani, A.; Merlo, M.; Rancilio, G. Opening of the Italian Ancillary Service Market to Distributed Energy Resources: Preliminary Results of UVAM project. In Proceedings of the 2020 IEEE 17th International Conference on Smart Communities: Improving Quality of Life Using ICT, IoT and AI (HONET), Charlotte, NC, USA, 14–16 December 2020. [Google Scholar]
- Italian Regulatory Authority for Energy, Networks and Environment (ARERA), Documento per la Consultazione 322/2019/R/EEL. Available online: https://www.arera.it/it/docs/19/322-19.htm (accessed on 10 January 2022). (In Italian).
- Italian Regulatory Authority for Energy, Networks and Environment (ARERA), Documento per la Consultazione 352/2021/R/EEL. Available online: https://www.arera.it/it/docs/21/352-21.htm (accessed on 10 January 2022). (In Italian).
- Paper on Power Transmission and Distribution Systems, ISGAN Annex 6, Task 5.2, 2017. Available online: http://www.iea-isgan.org/ (accessed on 6 August 2021).
- Gerard, H.; Rivero, E.; Six, D. Basic Schemes for TSO-DSO Coordination and Ancillary Services Provision. SMARTNET Deliv. D 1.3. 2016. Available online: http://smartnet-project.eu (accessed on 6 August 2021).
- Migliavacca, G.; Rossi, M.; Six, D.; Džamarija, M.; Horsmanheimo, S.; Madina, C.; Kockar, I.; Morales, J.M. SmartNet: H2020 project analysing TSO–DSO interaction to enable ancillary services provision from distribution networks. CIRED-Open Access Proc. J. 2017, 2017, 1998–2002. [Google Scholar] [CrossRef] [Green Version]
- Gerard, H.; Puente, E.I.R.; Six, D. Coordination between transmission and distribution system operators in the electricity sector: A conceptual framework. Util. Policy 2018, 50, 40–48. [Google Scholar] [CrossRef]
- Hadush, S.Y.; Meeus, L. DSO-TSO cooperation issues and solutions for distribution grid congestion T management. Energy Policy 2018, 120, 610–621. [Google Scholar] [CrossRef] [Green Version]
- Papavasiliou, A.; Mezghani, I. Coordination schemes for the integration of transmission and distribution system operations. In Proceedings of the 2018 Power Systems Computation Conference (PSCC), Dublin, Ireland, 11–15 June 2018. [Google Scholar]
- Savvopoulos, N.; Konstantinou, T.; Hatziargyriou, N. TSO-DSO coordination in decentralized ancillary services markets. In Proceedings of the International Conference on Smart Energy Systems and Technologies (SEST), Porto, Portugal, 9–11 September 2019. [Google Scholar]
- Tohidi, Y.; Farrokhseresht, M.; Gibescu, M. A review on coordination schemes between local and central electricity markets. In Proceedings of the 2018 15th International Conference on the European Energy Market (EEM), Lodz, Poland, 27–29 June 2018. [Google Scholar]
- Caramanis, M.; Ntakou, E.; Hogan, W.W.; Chakrabortty, A.; Schoene, J. Co-optimization of power and reserves in dynamic T&D power markets with nondispatchable renewable generation and distributed energy resources. Proc. IEEE 2016, 104, 807–836. [Google Scholar]
- Li, Z.; Guo, Q.; Sun, H.; Wang, J. Coordinated transmission and distribution ac optimal power flow. IEEE Trans. Smart Grid 2018, 9, 1228–1240. [Google Scholar] [CrossRef]
- Lin, C.; Wu, W.; Shahidehpour, M. Decentralized ac optimal power flow for integrated transmission and distribution grids. IEEE Trans. Smart Grid 2019, 11, 1–11. [Google Scholar] [CrossRef]
- Hao, H.; Somani, A.; Lian, J.; Carroll, T.E. Generalized aggregation and coordination of residential loads in a smart community. In Proceedings of the 2015 IEEE International Conference on Smart Grid Communications (SmartGridComm), Miami, FL, USA, 2–5 November 2015; pp. 67–72. [Google Scholar]
- Zhao, L.; Zhang, W.; Hao, H.; Kalsi, K. A geometric approach to aggregate flexibility modeling of thermostatically controlled loads. IEEE Trans. Power Syst. 2017, 32, 4721–4731. [Google Scholar] [CrossRef]
- Asimakopoulou, G.E.; Hatziargyriou, N.D. Evaluation of economic benefits of DER aggregation. IEEE Trans. Sustain. Energy 2018, 9, 499–510. [Google Scholar] [CrossRef]
- Agnetis, A.; Dellino, G.; de Pascale, G.; Innocenti, G.; Pranzo, M.; Vicino, A. Optimization models for consumer flexibility aggregation in smart grids: The ADDRESS approach. In Proceedings of the 2011 IEEE First International Workshop on Smart Grid Modeling and Simulation (SGMS), Brussels, Belgium, 17 October 2011; pp. 96–101. [Google Scholar]
- Bessa, R.J.; Matos, M.A. Optimization models for EV aggregator participation in a manual reserve market. IEEE Trans. Power. Syst. 2013, 28, 3085–3095. [Google Scholar] [CrossRef]
- Dietrich, K.; Latorre, L.M.; Olmos, L.; Ramos, A. Modelling and assessing the impacts of self-supply and market-revenue driven Virtual Power Plants. Electr. Power Syst. Res. 2015, 119, 462–470. [Google Scholar] [CrossRef]
- Alrumayh, O.; Bhattacharya, K. Flexibility of residential loads for demand response provisions in smart grid. IEEE Trans. Smart Grid 2019, 10, 6284–6297. [Google Scholar] [CrossRef]
- Zoeller, H.; Reischboeck, M.; Henselmeyer, S. Managing volatility in distribution networks with active network management. In Proceedings of the CIRED Workshop 2016, Helsinki, Finland, 14–15 June 2016; pp. 1–4. [Google Scholar]
- Silva, J.; Sumaili, J.; Bessa, R.J.; Seca, L.; Matos, M.A.; Miranda, V.; Caujolle, M.; Goncer, B.; Sebastian-Viana, M. Estimating the active and reactive power flexibility area at the TSO-DSO interface. IEEE Trans. Power Syst. 2018, 33, 4741–4750. [Google Scholar] [CrossRef]
- Capitanescu, F. TSO–DSO interaction: Active distribution network power chart for tso ancillary services provision. Electr. Power Syst. Res. 2018, 163, 226–230. [Google Scholar] [CrossRef]
- Kalantar-Neyestanaki, M.; Sossan, F.; Bozorg, M.; Cherkaoui, R. Characterizing the reserve provision capability area of active distribution networks: A linear robust optimization method. IEEE Trans. Smart Grid 2020, 11, 2464–2475. [Google Scholar] [CrossRef]
- Silva, J.; Sumaili, J.; Bessa, R.J.; Seca, L.; Matos, M.; Miranda, V. The challenges of estimating the impact of distributed energy resources flexibility on the tso/dso boundary node operating points. Comput. Oper. Res. 2018, 96, 294–304. [Google Scholar] [CrossRef]
- Heleno, M.; Soares, R.; Sumaili, J.; Bessa, R.J.; Seca, L.; Matos, M.A. Estimation of the flexibility range in the transmission-distribution boundary. In Proceedings of the 2015 IEEE Eindhoven PowerTech, Eindhoven, The Netherlands, 29 June–2 July 2015; pp. 1–6. [Google Scholar]
- Piclo Platform. Available online: https://piclo.energy/about (accessed on 23 December 2021).
- ENERA Platform. Available online: https://projekt-enera.de/ (accessed on 23 December 2021).
- GEOPACS Platform. Available online: https://en.gopacs.eu (accessed on 23 December 2021).
- Pisano, G.; Chowdhury, N.; Coppo, M.; Natale, N.; Petretto, G.; Soma, G.G.; Turri, R.; Pilo, F. Synthetic Models of Distribution Networks Based on Open Data and Georeferenced Information. Energies 2019, 12, en122345. [Google Scholar] [CrossRef] [Green Version]
- Villar, J.; Bessa, R.; Matos, M. Flexibility products and markets: Literature review. Electr. Power Syst. Res. 2018, 154, 329–340. [Google Scholar] [CrossRef]
- Jin, X.; Wu, Q.; Jia, H. Local flexibility markets: Literature review on concepts, models and clearing methods. Appl. Energy 2020, 261, 114387. [Google Scholar] [CrossRef] [Green Version]
- ENTSO-E. Roadmap on the Evolution of the Regulatory Framework for Distributed Flexibility—A Joint Report by ENTSO-E and the European Associations Representing DSOs (CEDEC, E.DSO, Eurelectric, GEODE); ENTSO-E: Brussels, Belgium, 2021. [Google Scholar]
- Zegers, A.; Natiesta, T. Single Marketplace for Flexibility, Discussion Paper on Power Transmission an Distribution Systems, ISGAN Annex 6, Task 5.2, 2017. Available online: https://www.iea-isgan.org/wp-content/uploads/2018/02/ISGAN_DiscussionPaper_TSODSOInteractionSingleMarketplaceFlex_2017-1.pdf (accessed on 10 January 2022).
- Natale, N.; Pilo, F.; Pisano, G.; Soma, G.G. Scheduled profile at TSO/DSO interface for reducing balancing cost. In Proceedings of the 2019 1st International Conference on Energy Transition in the Mediterranean Area (SyNERGY MED), Cagliari, Italy, 28–30 May 2019. [Google Scholar]
- European Commission. Clean Energy for All Europeans Package. Available online: https://ec.europa.eu/energy/en/topics/energy-strategy-and-energy-union/clean-energy-all-europeans (accessed on 10 January 2022).
- Celli, G.; Schiavo, L.L.; Pilo, F.; Pisano, G.; Soma, G.G.; Vailati, R. Assessment of Energy Storage Systems Installation in Smart Distribution Networks. In Proceedings of the 2018 AEIT International Annual Conference, Bari, Italy, 3–5 October 2018. [Google Scholar]
- Celli, G.; Pilo, F.; Pisano, G.; Ruggeri, S.; Soma, G.G. Risk-oriented planning for flexibility-based distribution system development. Sustain. Energy Grids Netw. 2022, 30, 100594. [Google Scholar] [CrossRef]
- Italian National Energy Market Manager (GME). Available online: https://www.mercatoelettrico.org/it/ (accessed on 10 January 2022).
- CEI 0-16. Reference Technical Rules for the Connection of Active and Passive Consumers to the HV and MV Electrical Networks of Distribution Company; Comitato Elettrotecnico Italiano: Milan, Italy, 2019. [Google Scholar]
- CENELEC TS 50549-2. Requirements for Generating Plants to be Connected in Parallel with Distribution Networks—Part 2: Connection to a MV Distribution System; CENELEC: Bruxelles, Belgium, 2019. [Google Scholar]
- Natale, N.; Pilo, F.; Pisano, G.; Soma, G.G. Distribution System Participation to the Italian Ancillary Service Market. In Proceedings of the 2016 AEIT International Annual Conference (AEIT) Sustainable Development in the Mediterranean Area Energy and ICT Networks of the Future, Capri, Italy, 5–7 October 2016. [Google Scholar]


| Market Model | Strengths | Barriers and Weaknesses |
|---|---|---|
| Extended centralised dispatching |
|
|
| Local Ancillary Service market |
|
|
| Shared balancing responsible |
|
|
| Common TSO–DSO market (first variant) |
|
|
| Common TSO–DSO market (second variant) |
|
|
| Integrated flexibility market |
|
|
| DER | Participation Level | Downward Reserve | Upward Reserve | ||
|---|---|---|---|---|---|
| Quantity (%) | Price (EUR/MWh) | Quantity (%) | Price (EUR/MWh) | ||
| RES | All | −100% | 0 | +10% | 2 · Ps |
| CHP | All | −20% | 0.9 · Pp | +20% | P(fuel) |
| End-Users | 25% of industrial customers | −5% | 0.9 · Pp | +5% | 1.1 · Pp |
| Case A (“Only DG”) | Case B (“DG + End-Users”) | |||||
|---|---|---|---|---|---|---|
| Feeder | Feasible Points (Green) | Feasible Points with Q Control (Orange) | Unfeasible Points (Red) | Feasible Points (Green) | Feasible Points with Q Control (Orange) | Unfeasible Points (Red) |
| (%) | (%) | (%) | (%) | (%) | (%) | |
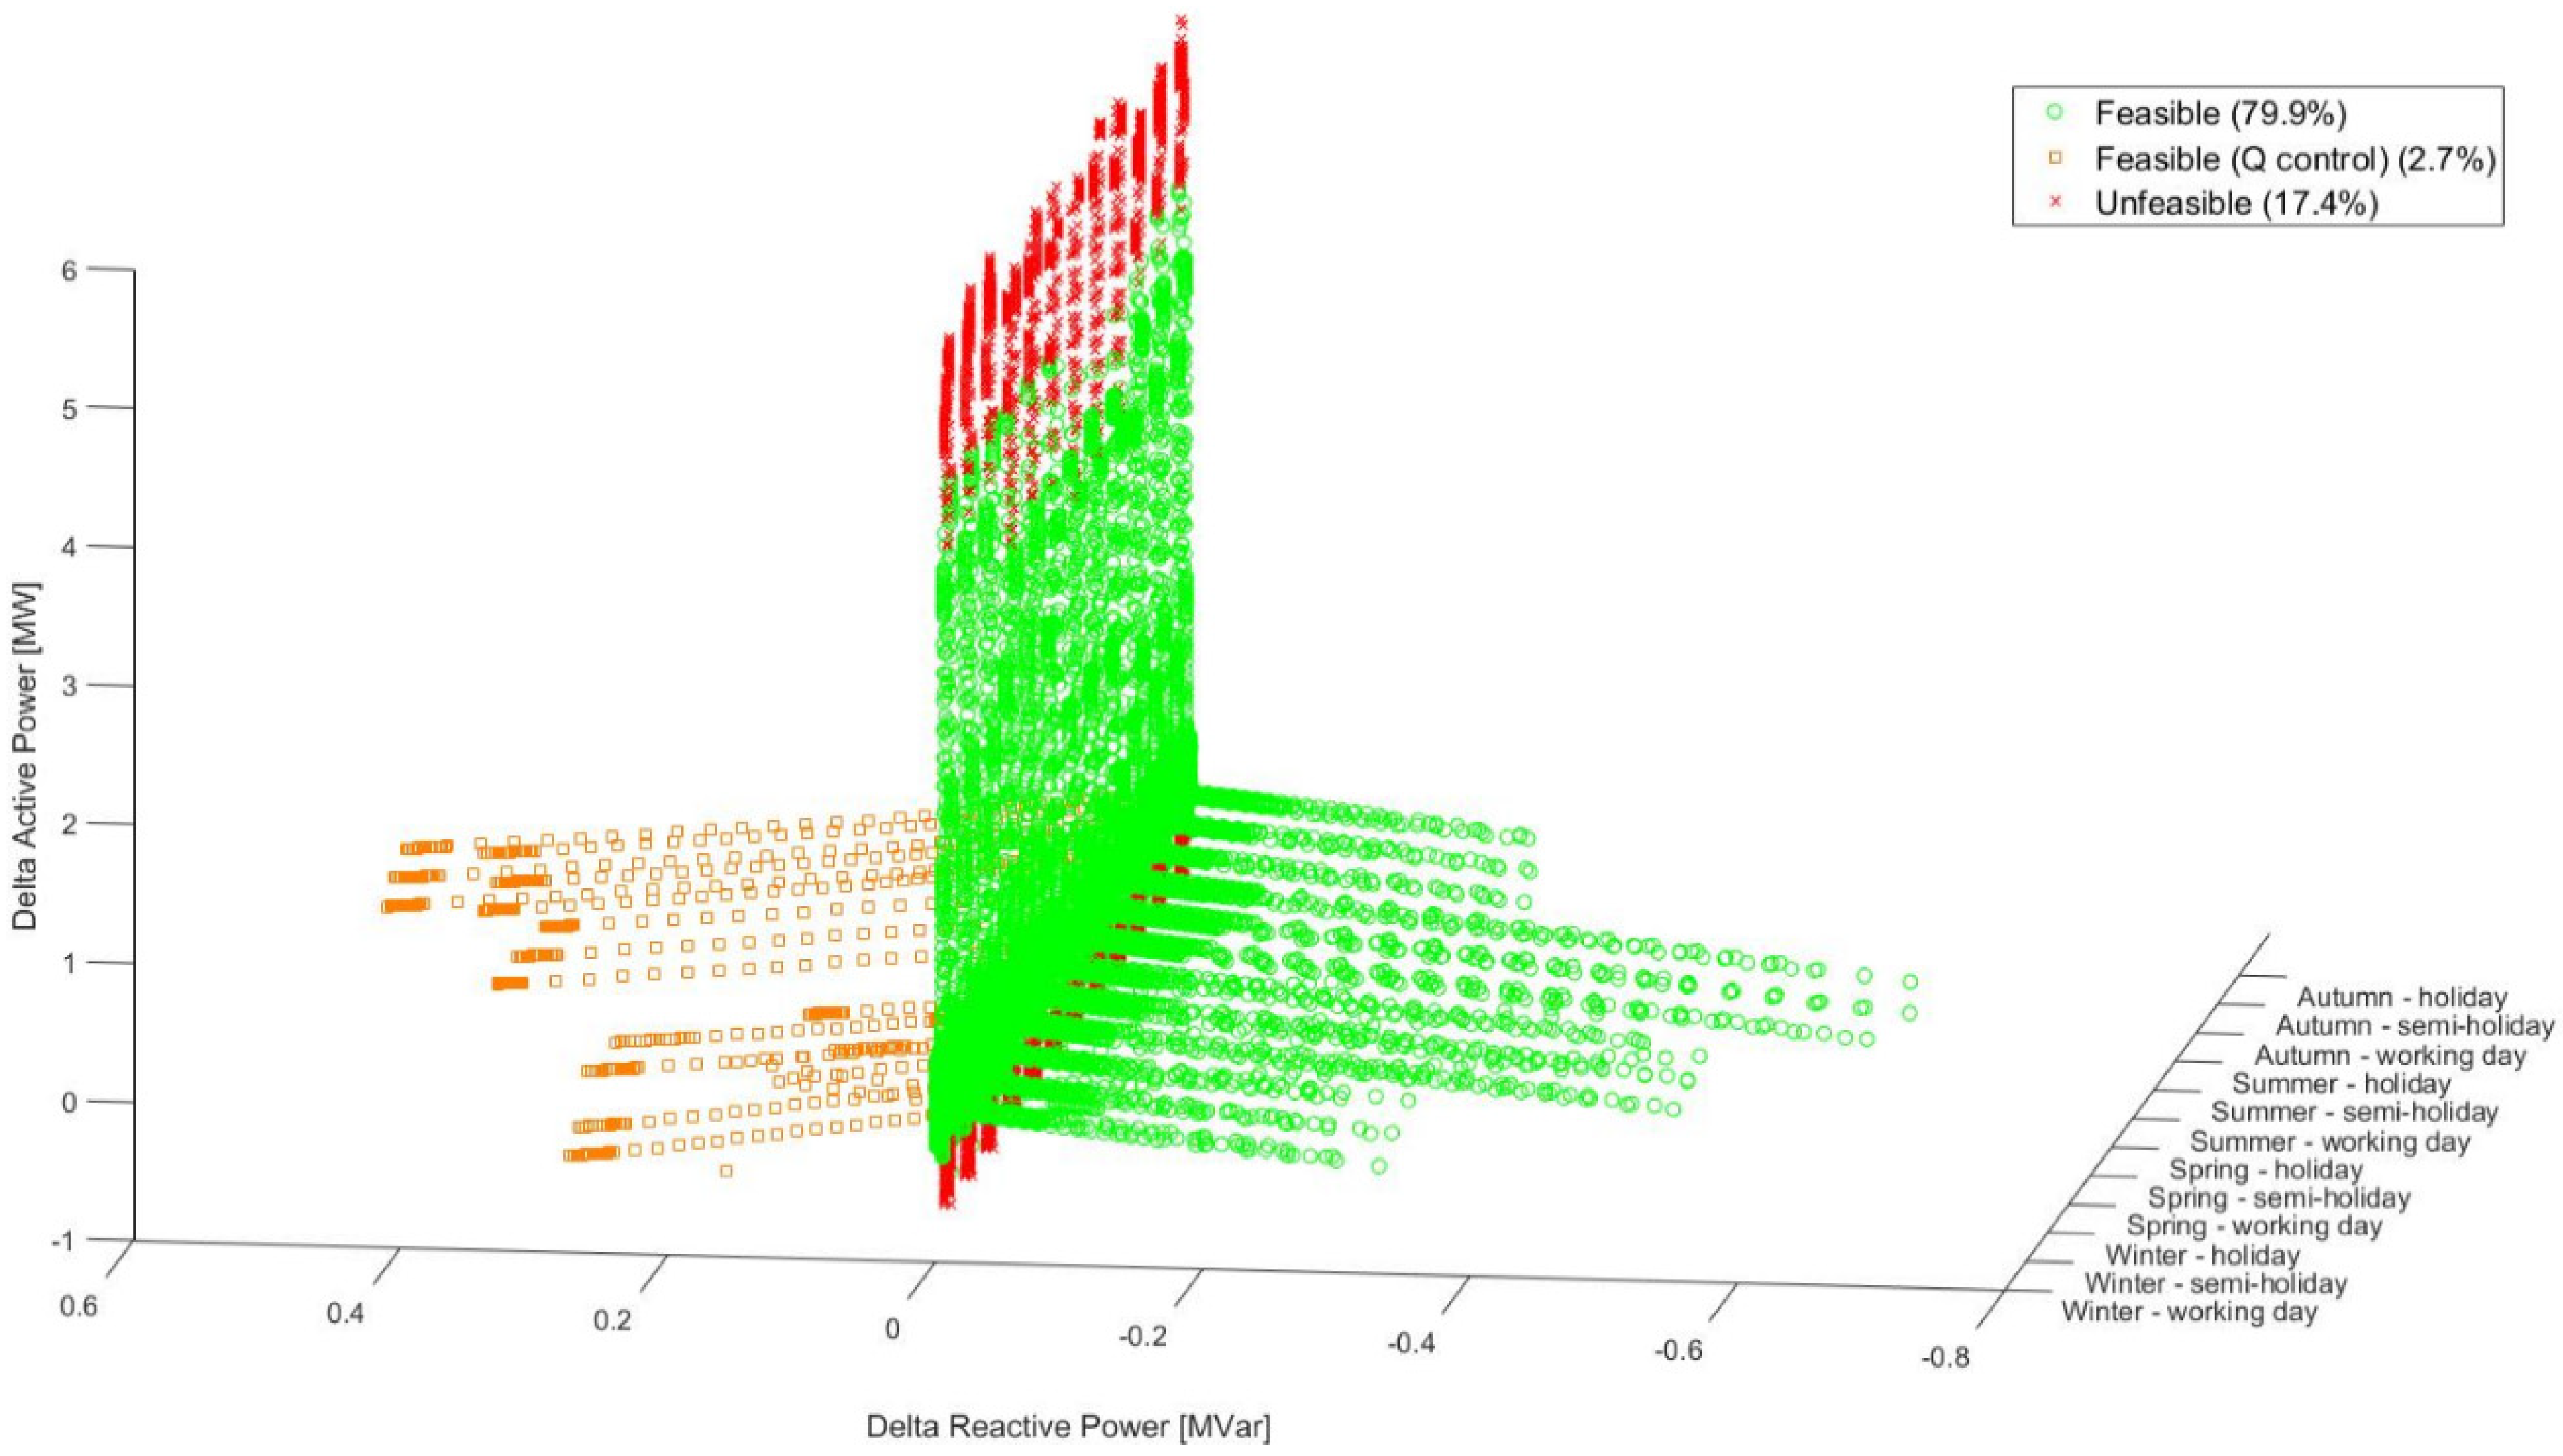
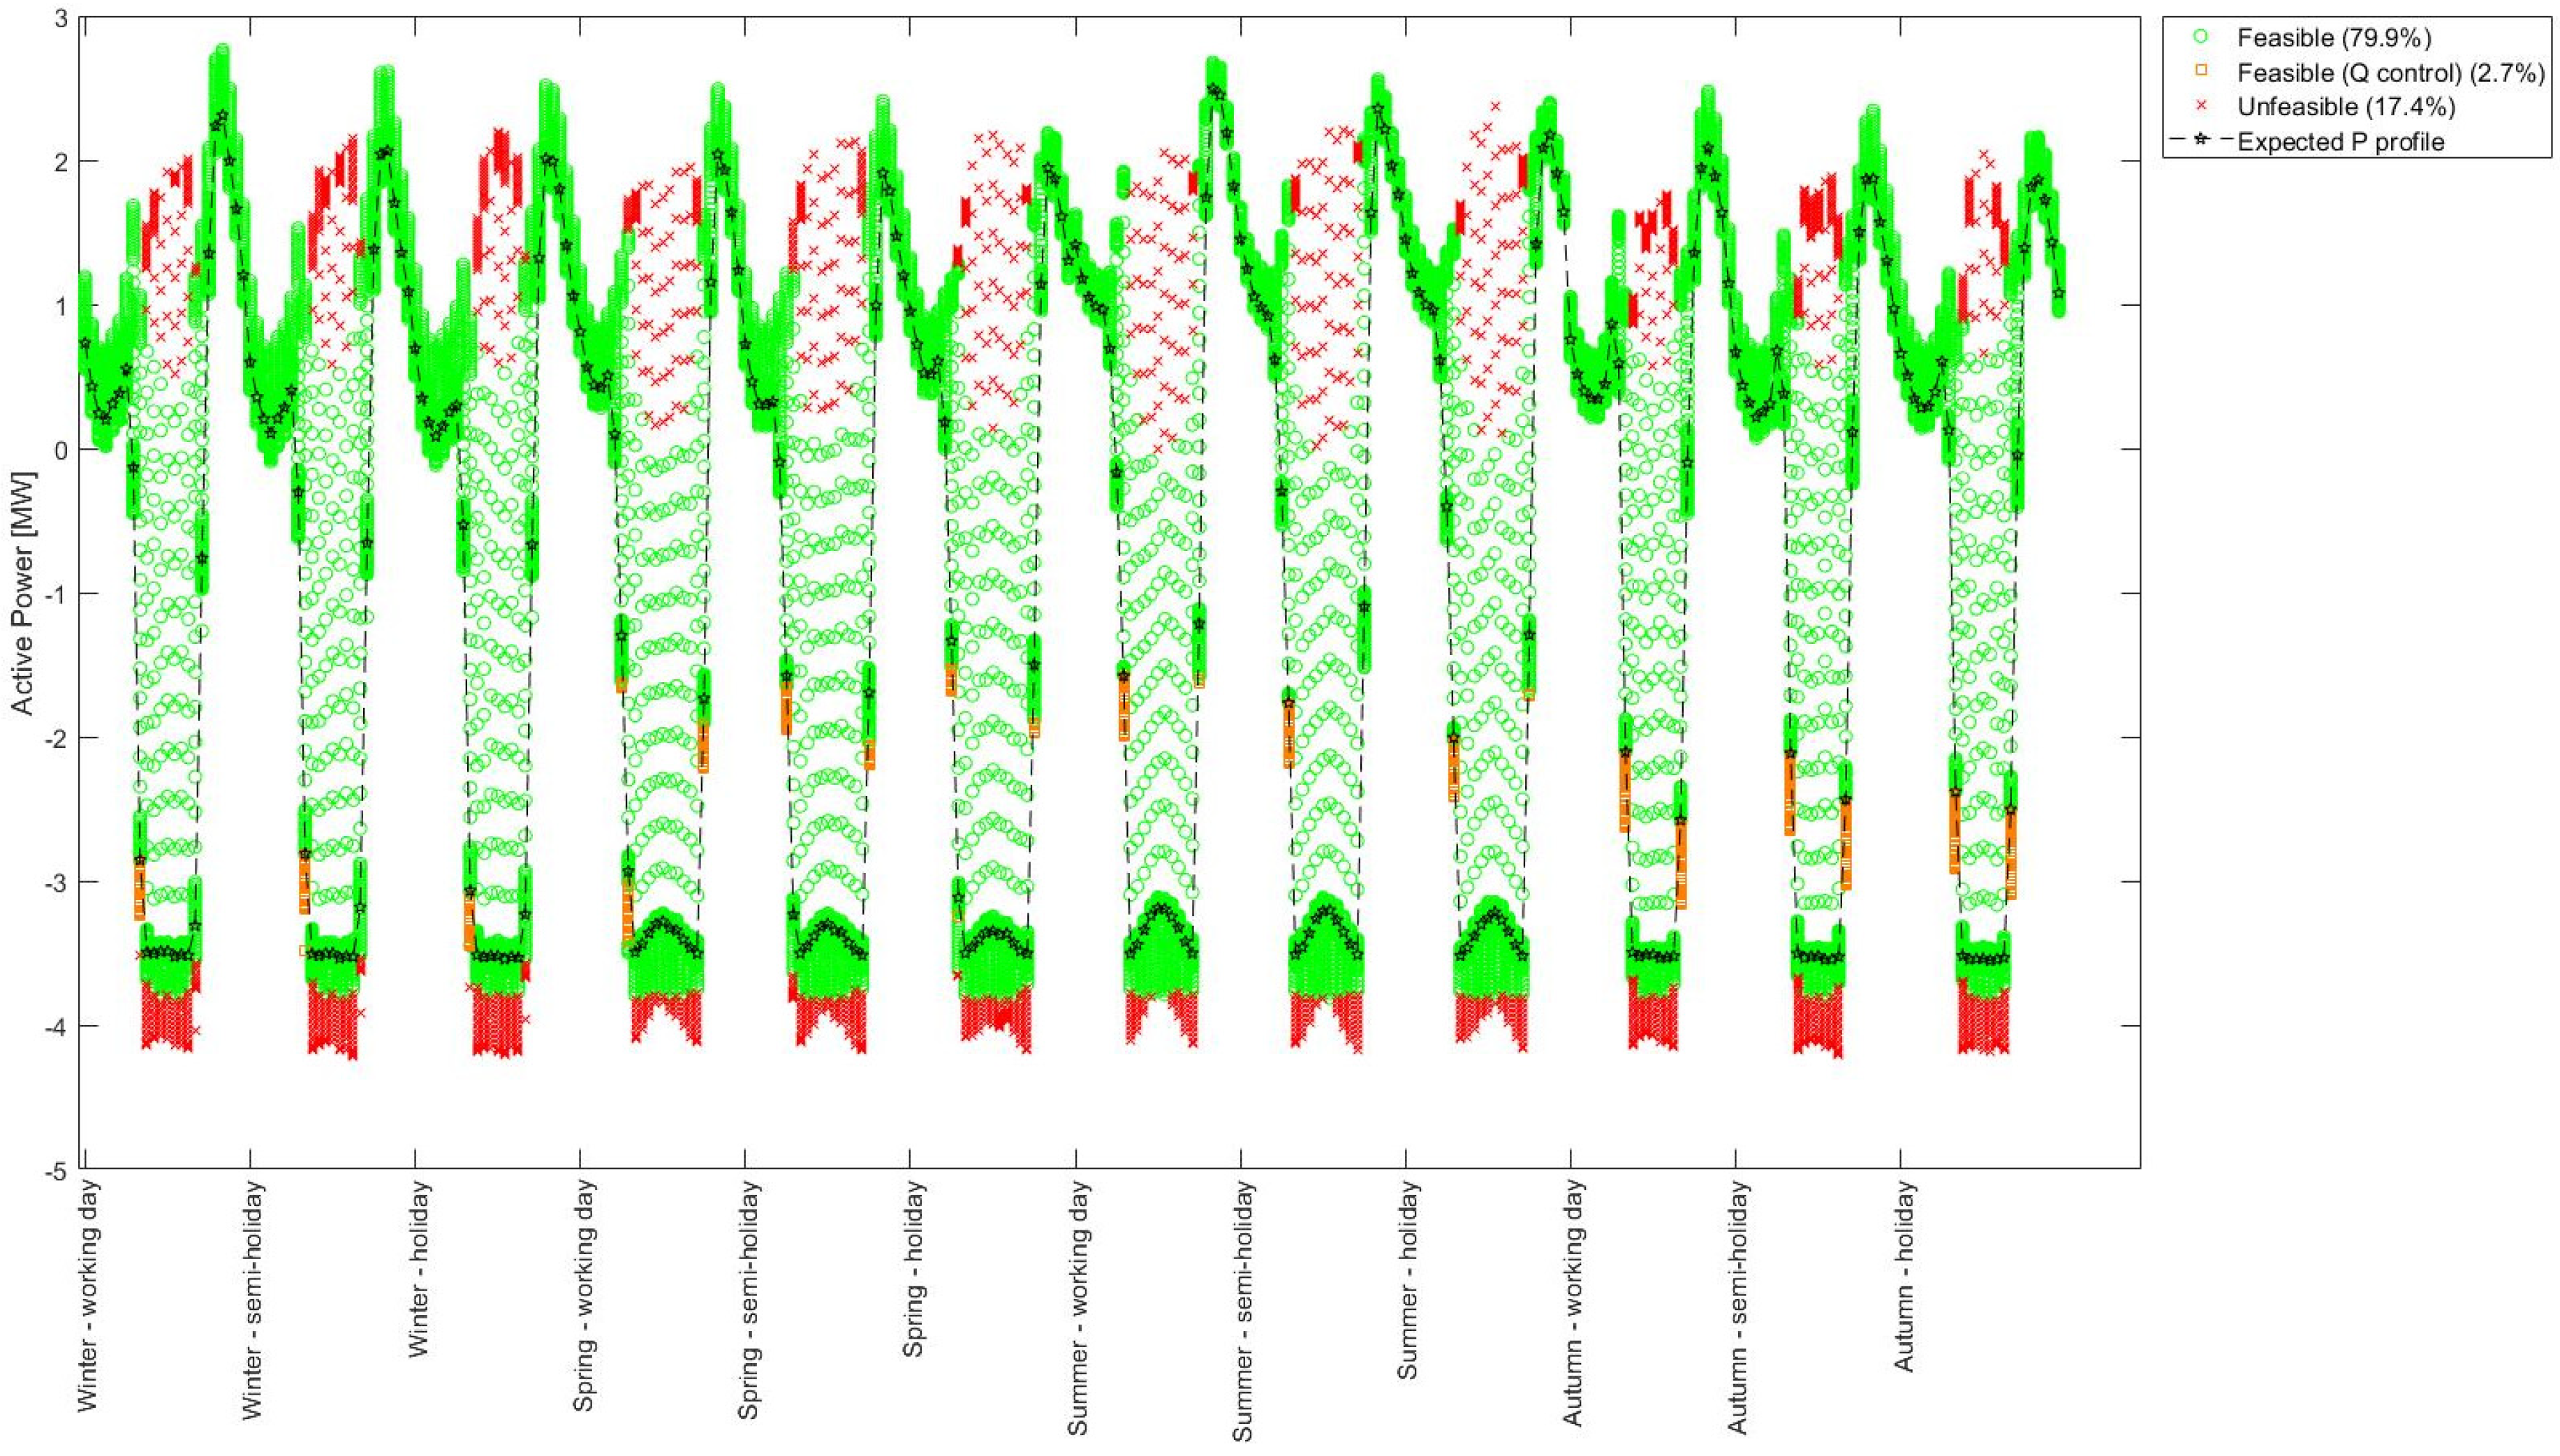
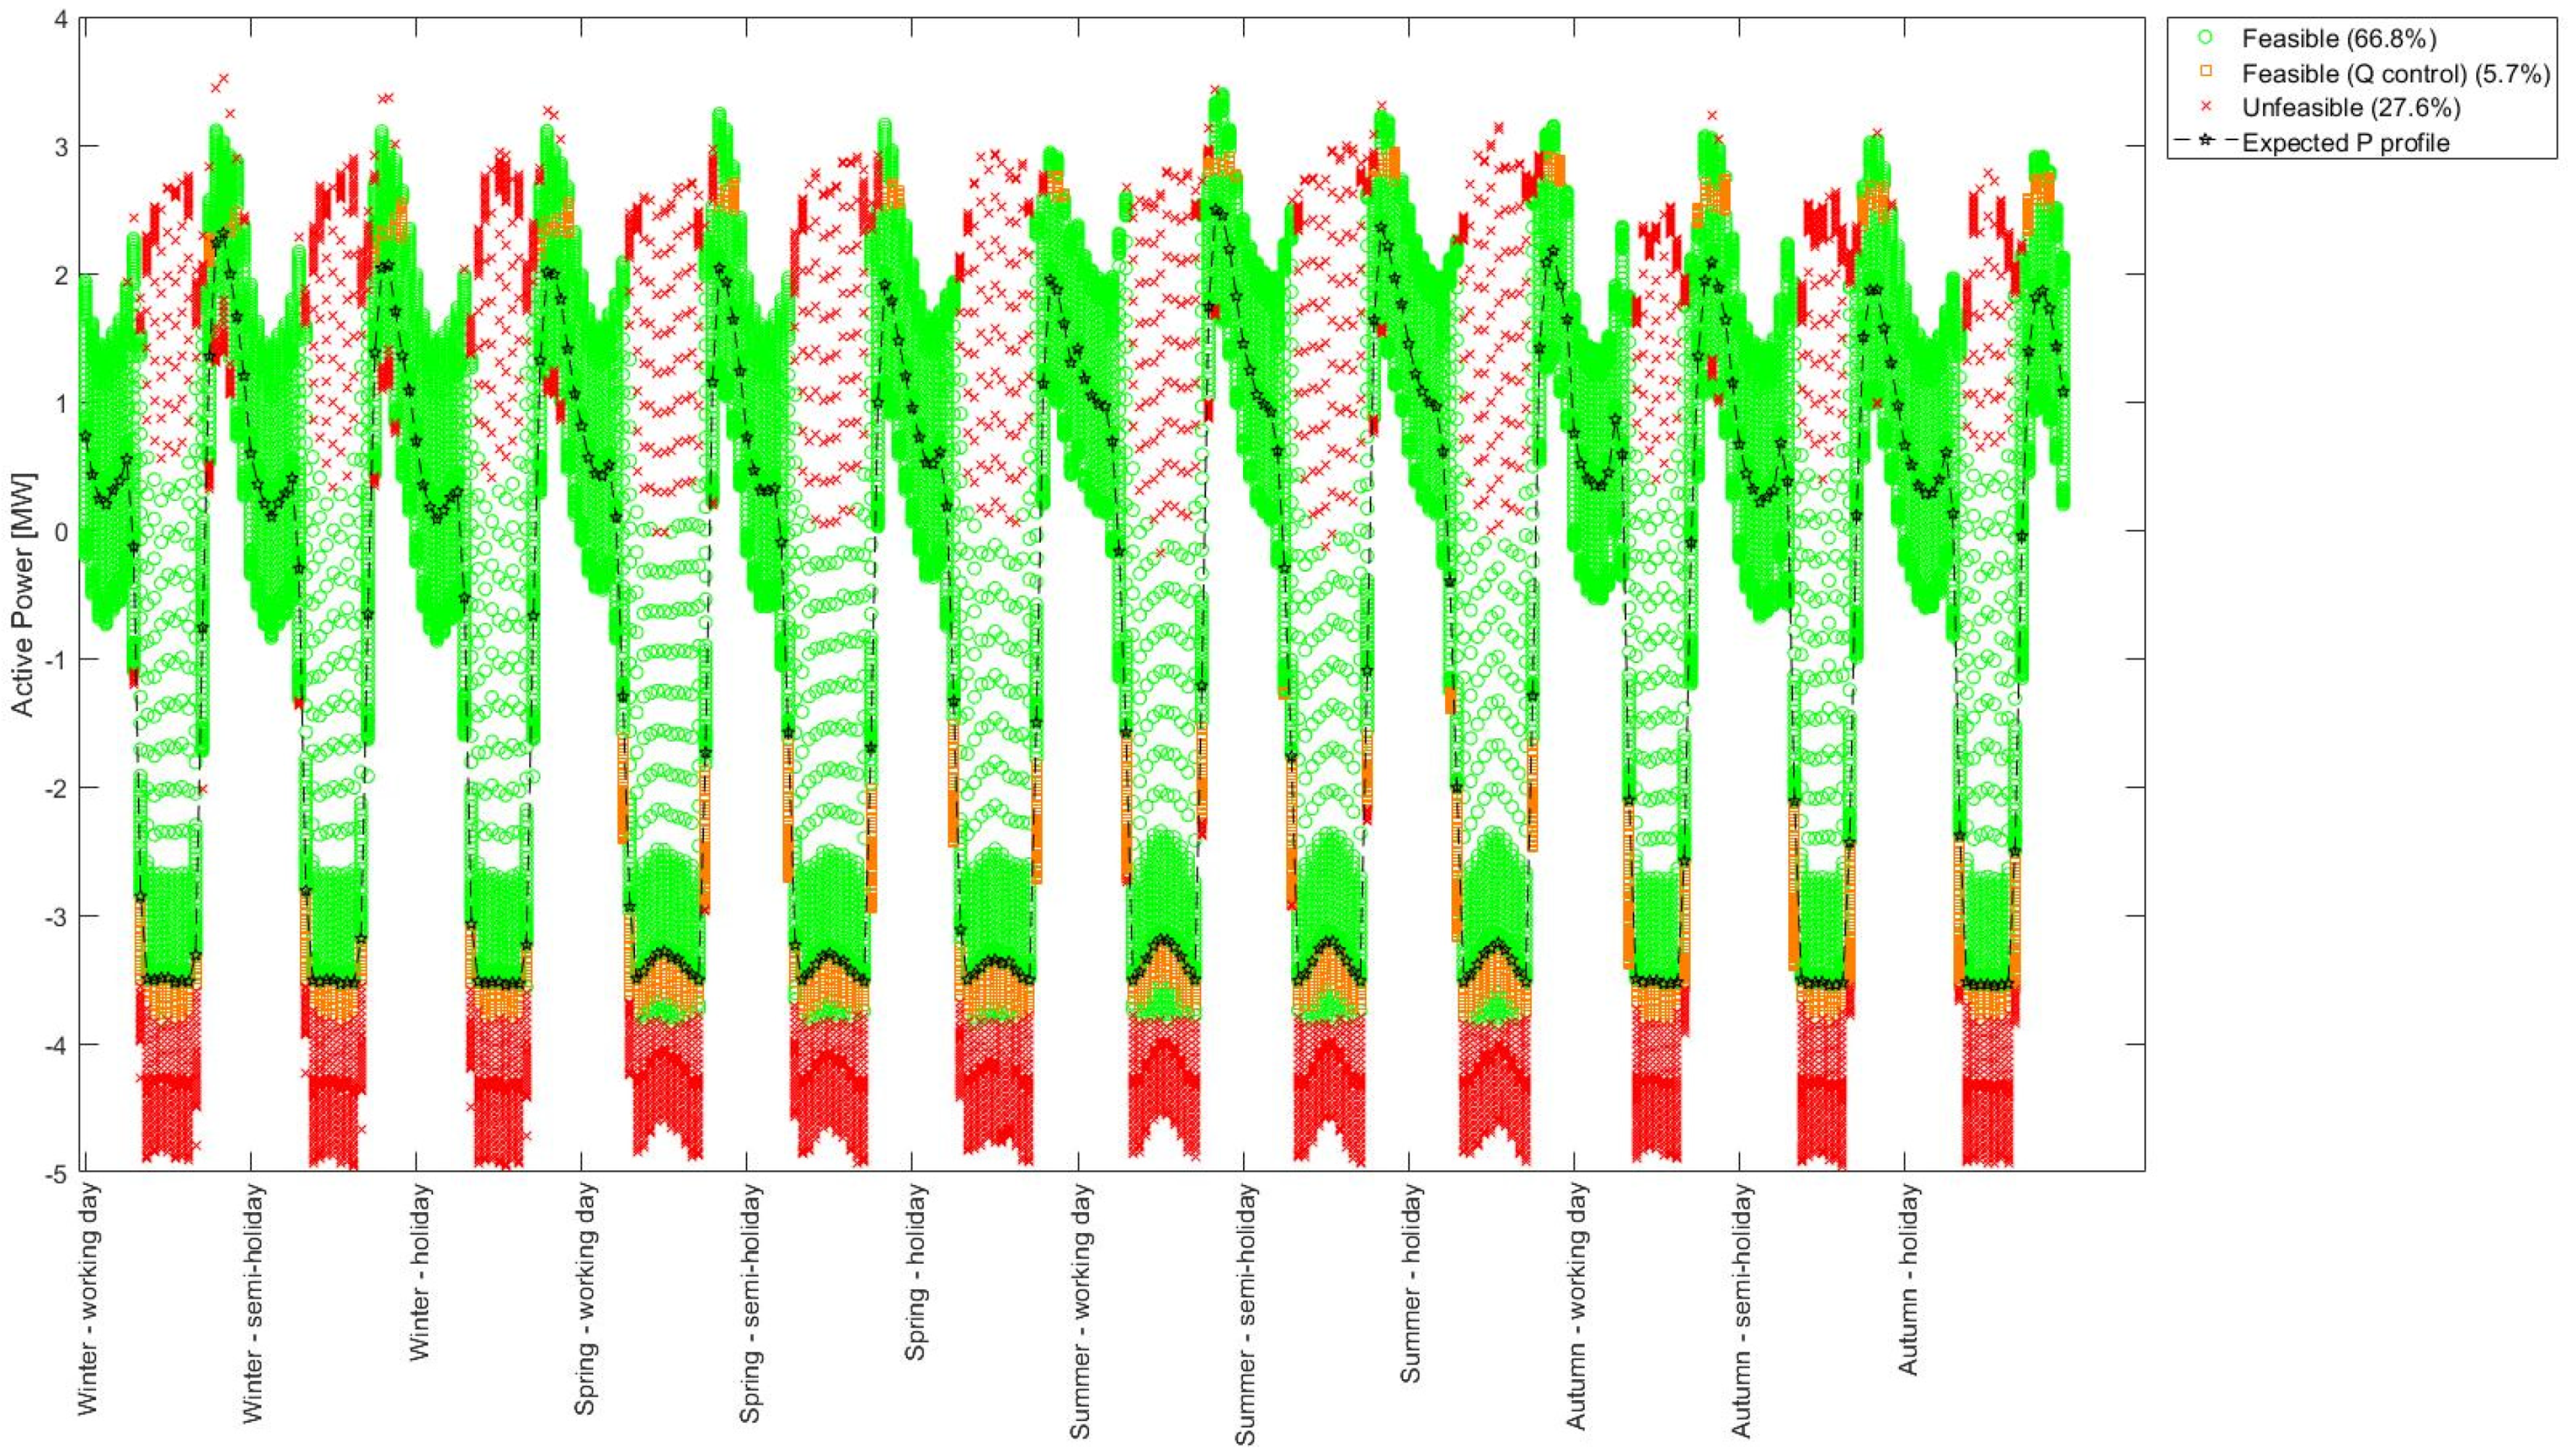
| R1 | 79.9 | 2.7 | 17.4 | 66.8 | 5.7 | 27.5 |
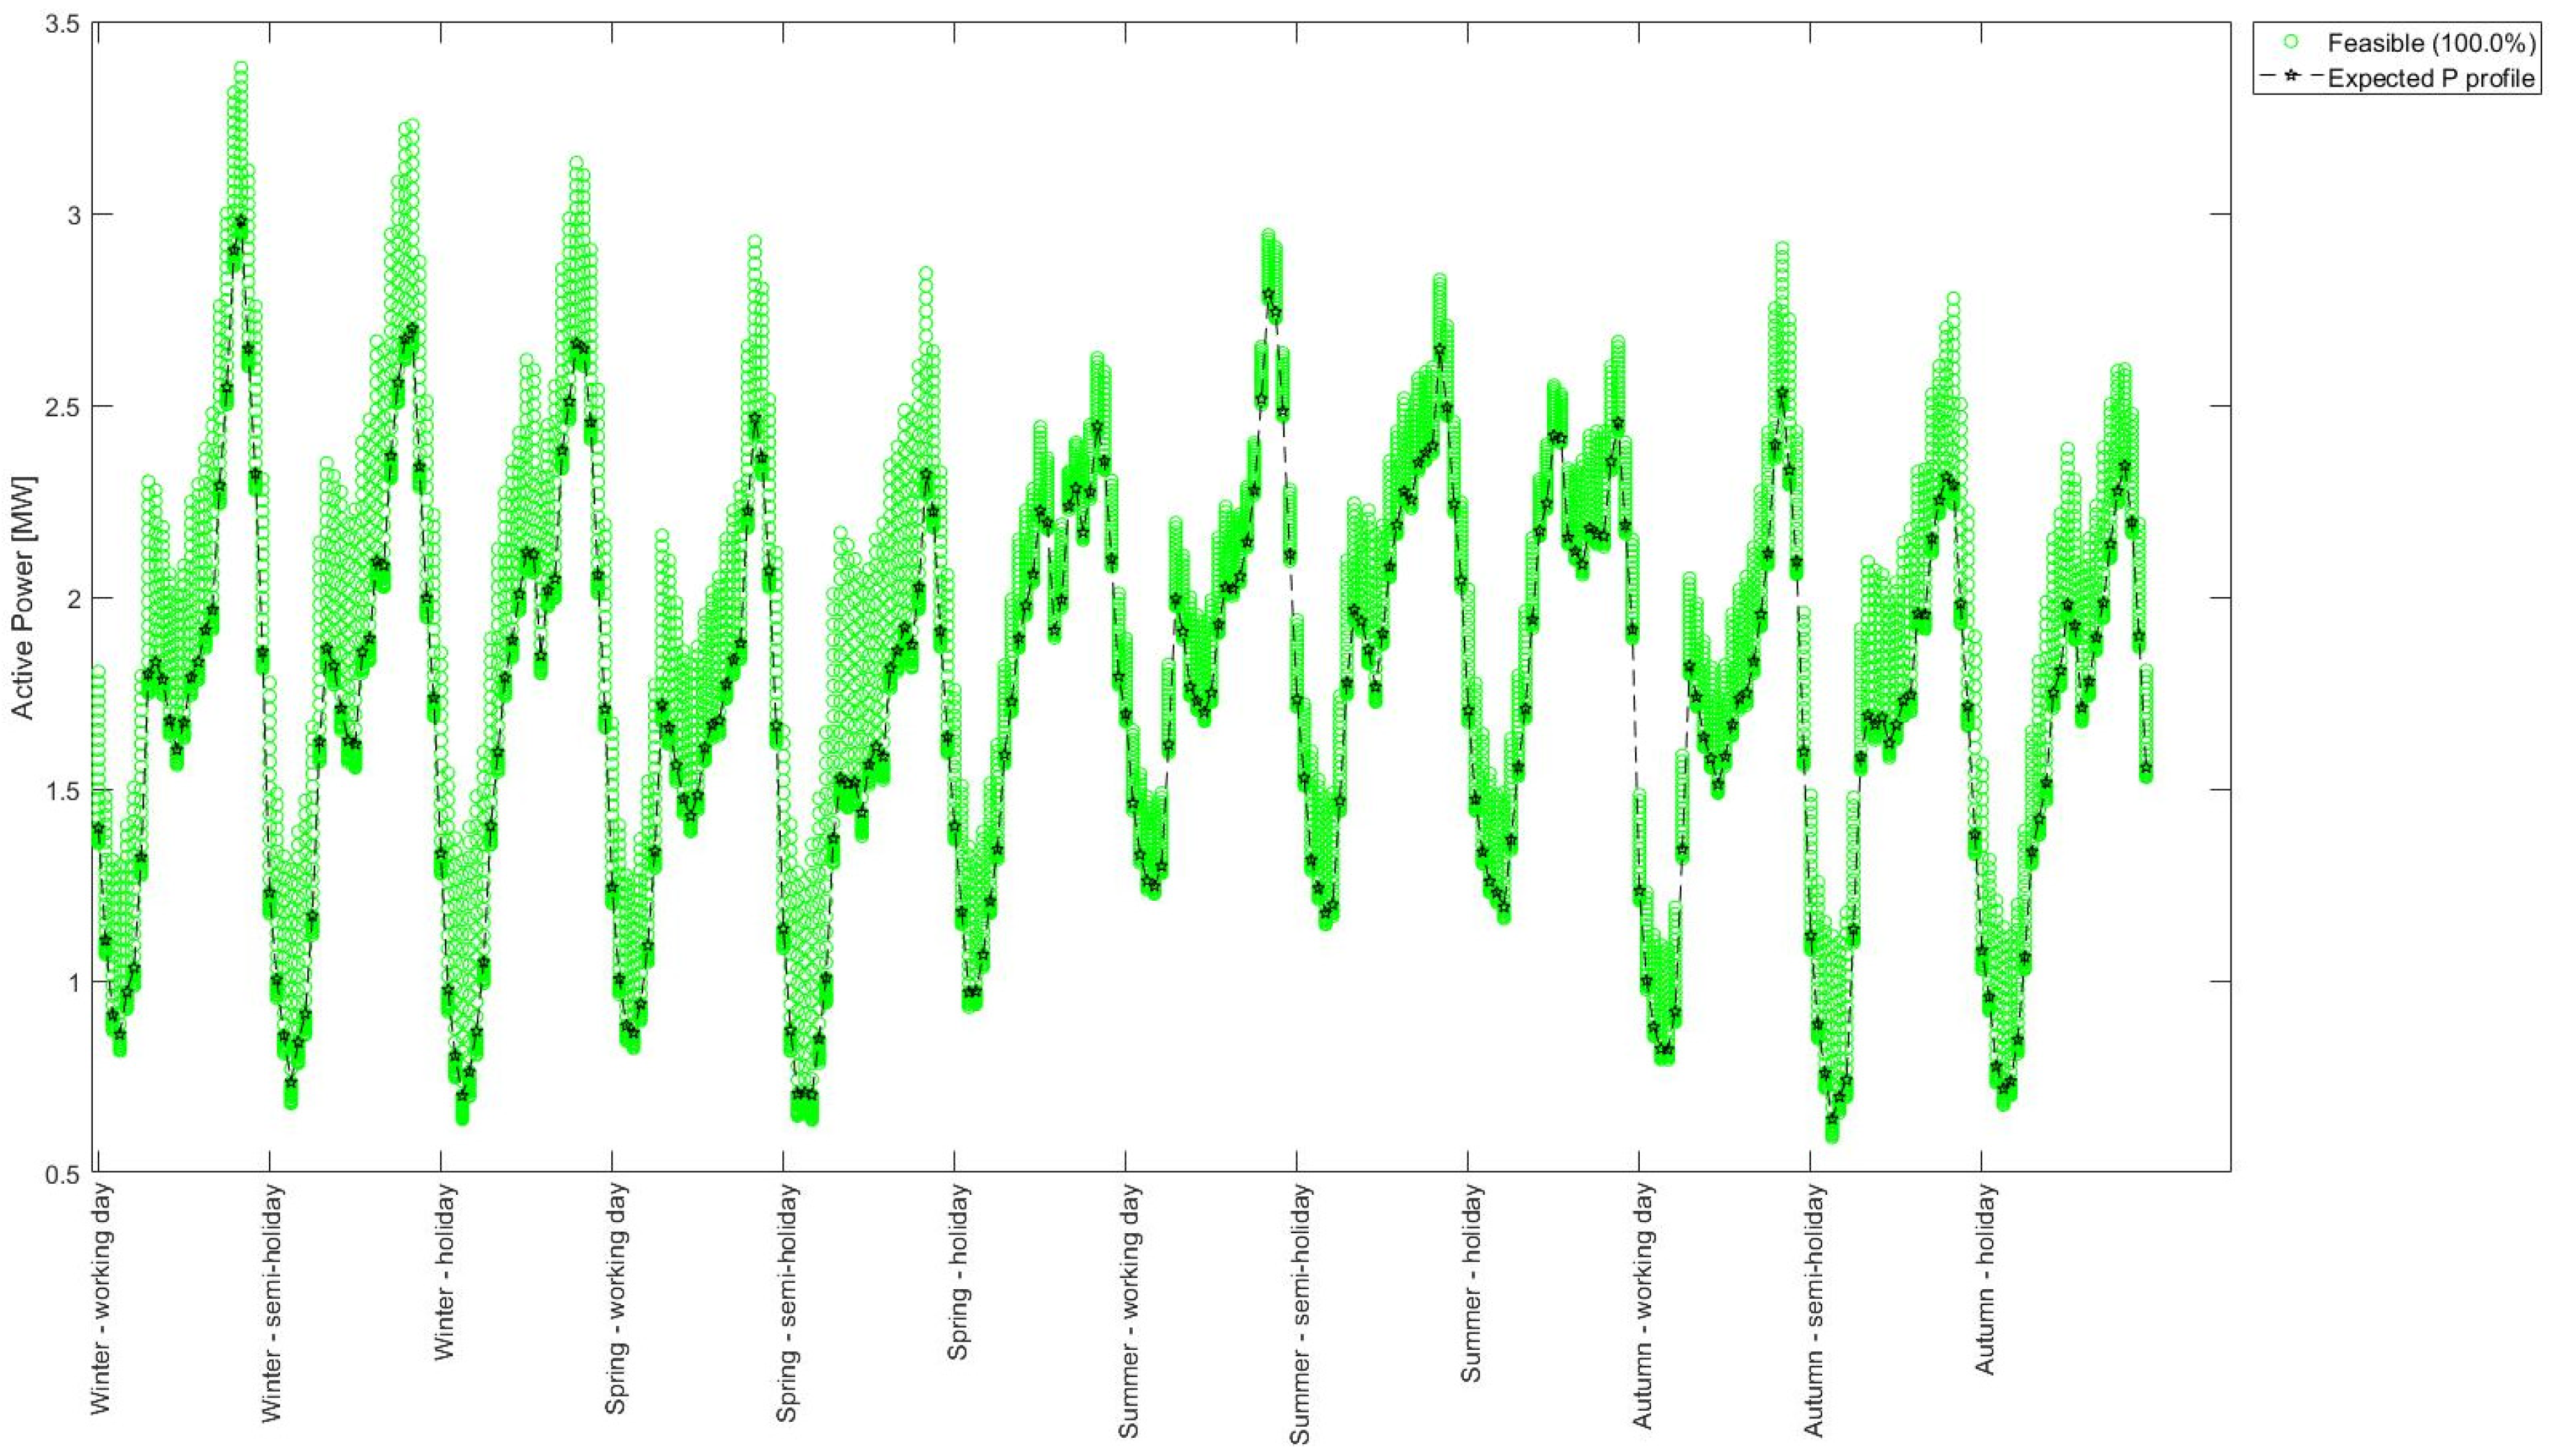
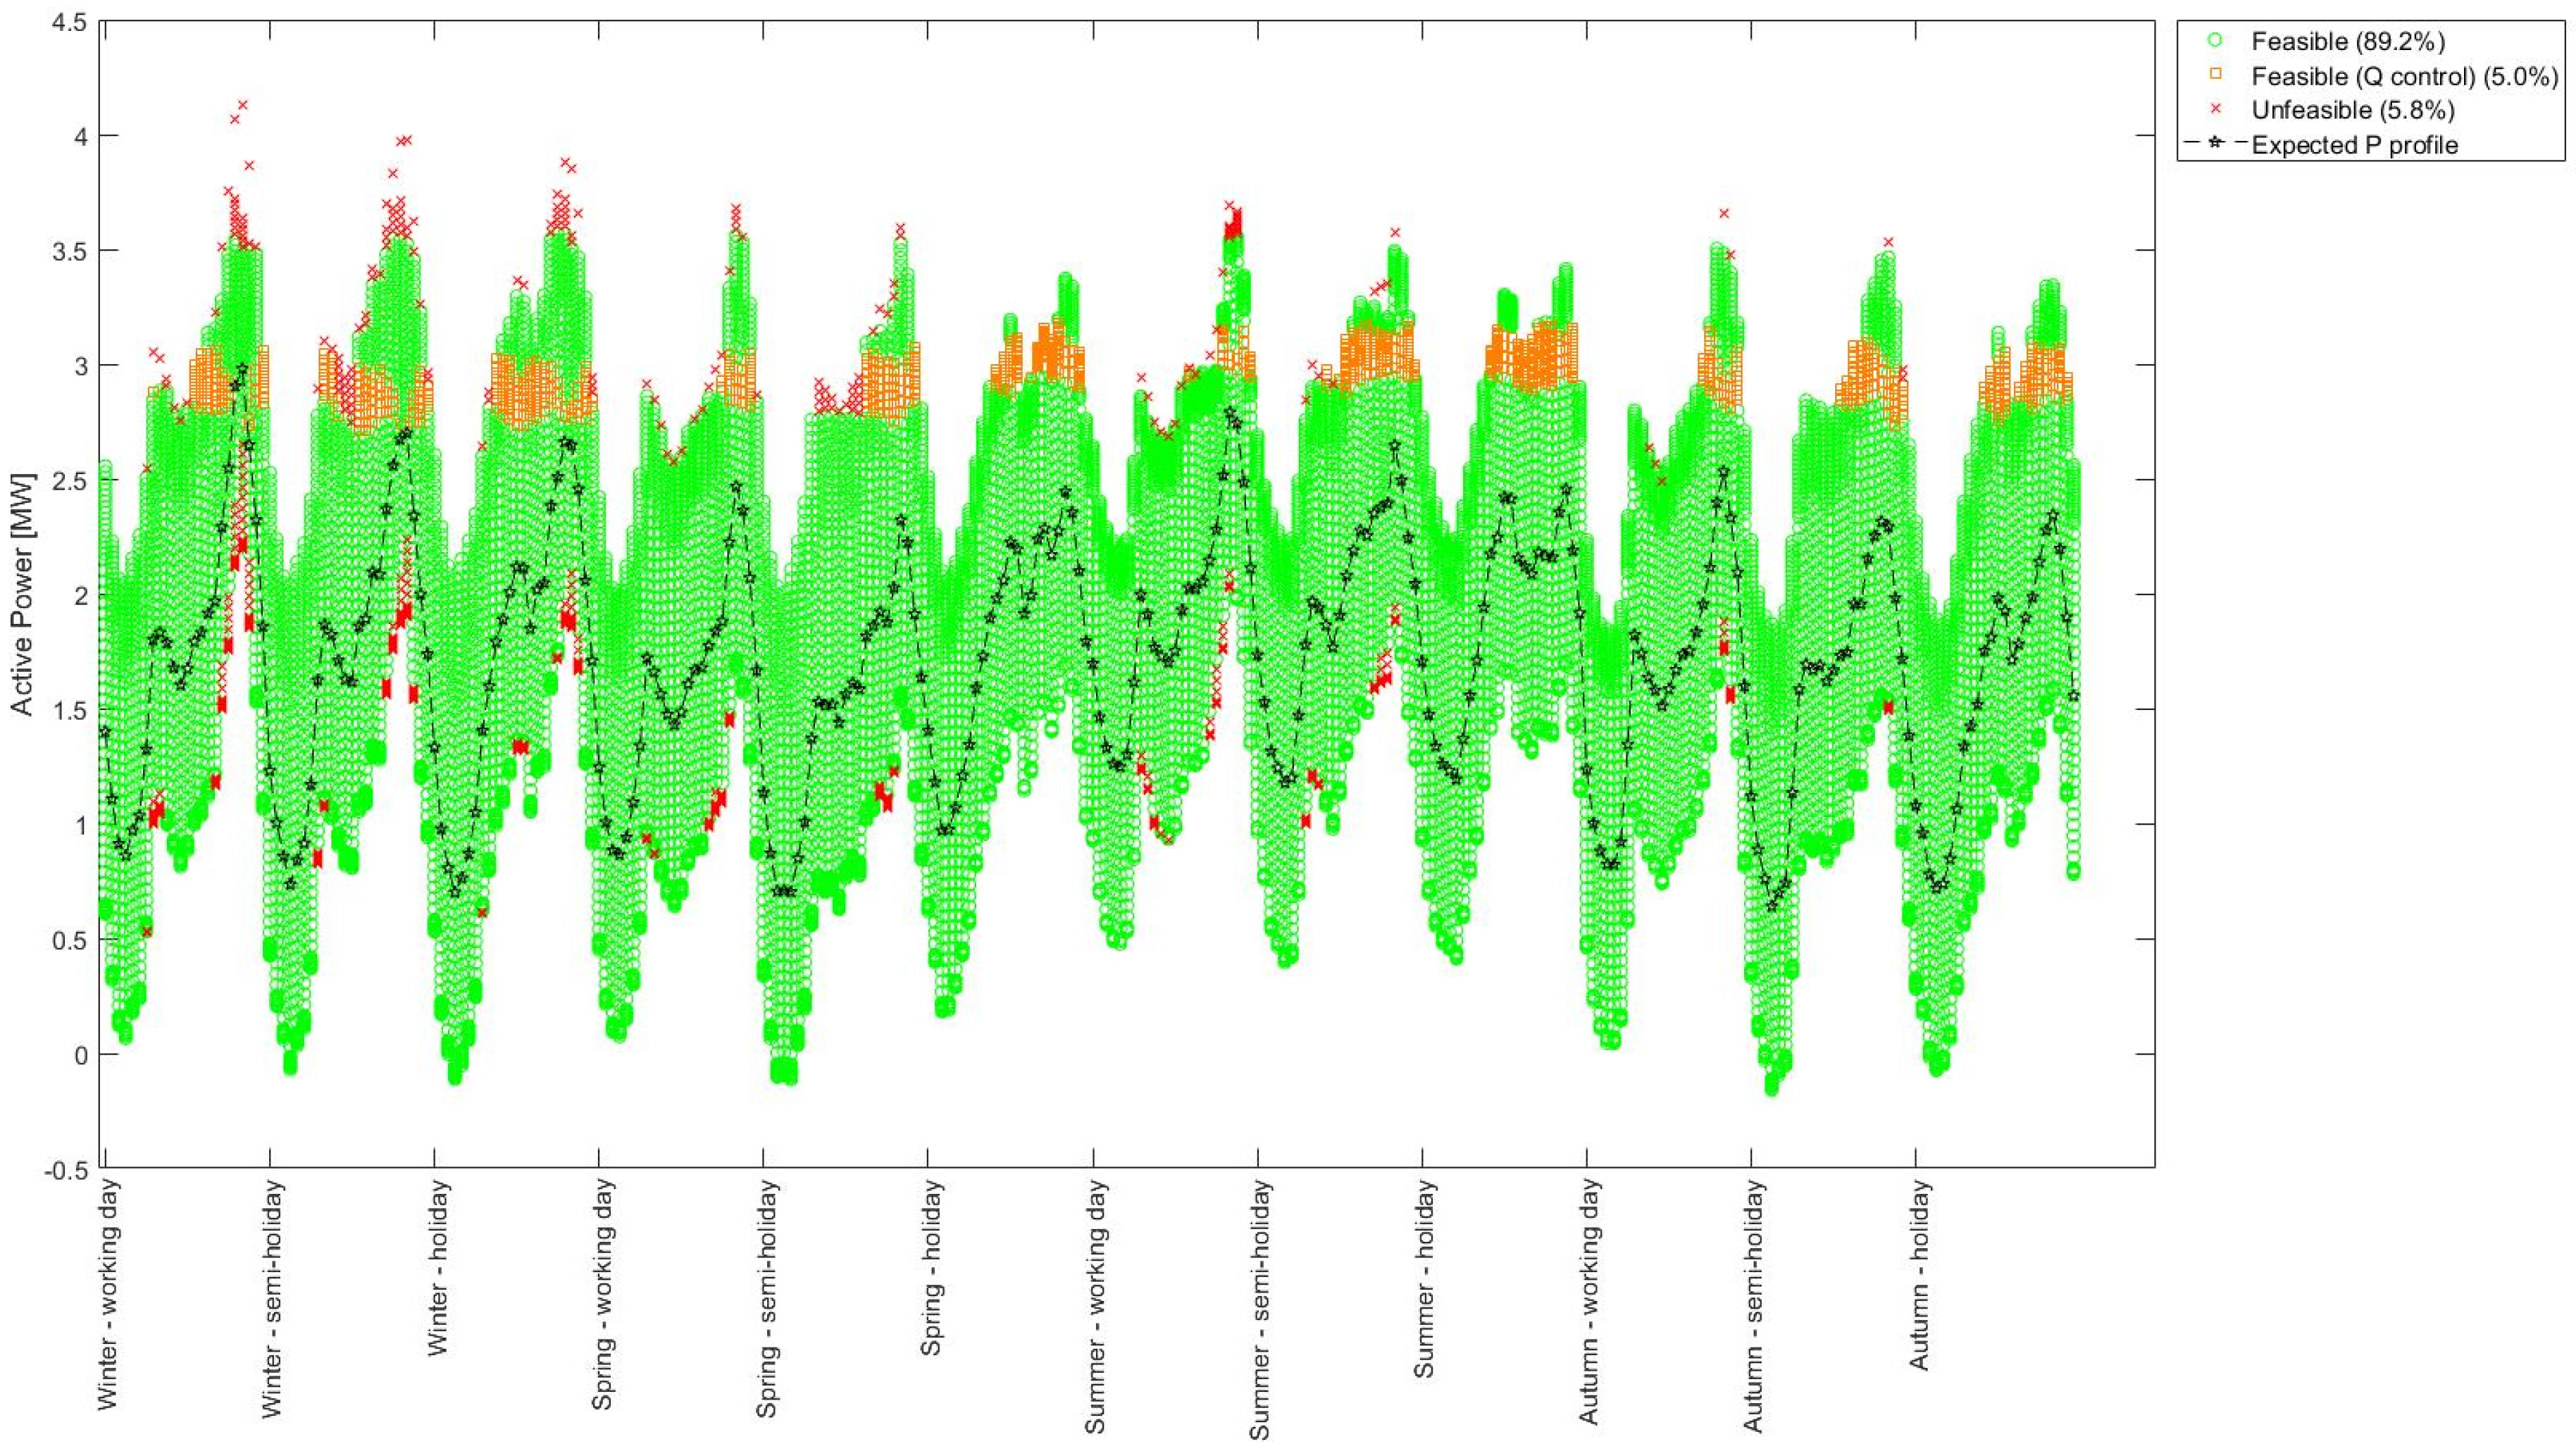
| R2 | 100.0 | 0.0 | 0.0 | 89.2 | 5.0 | 5.8 |
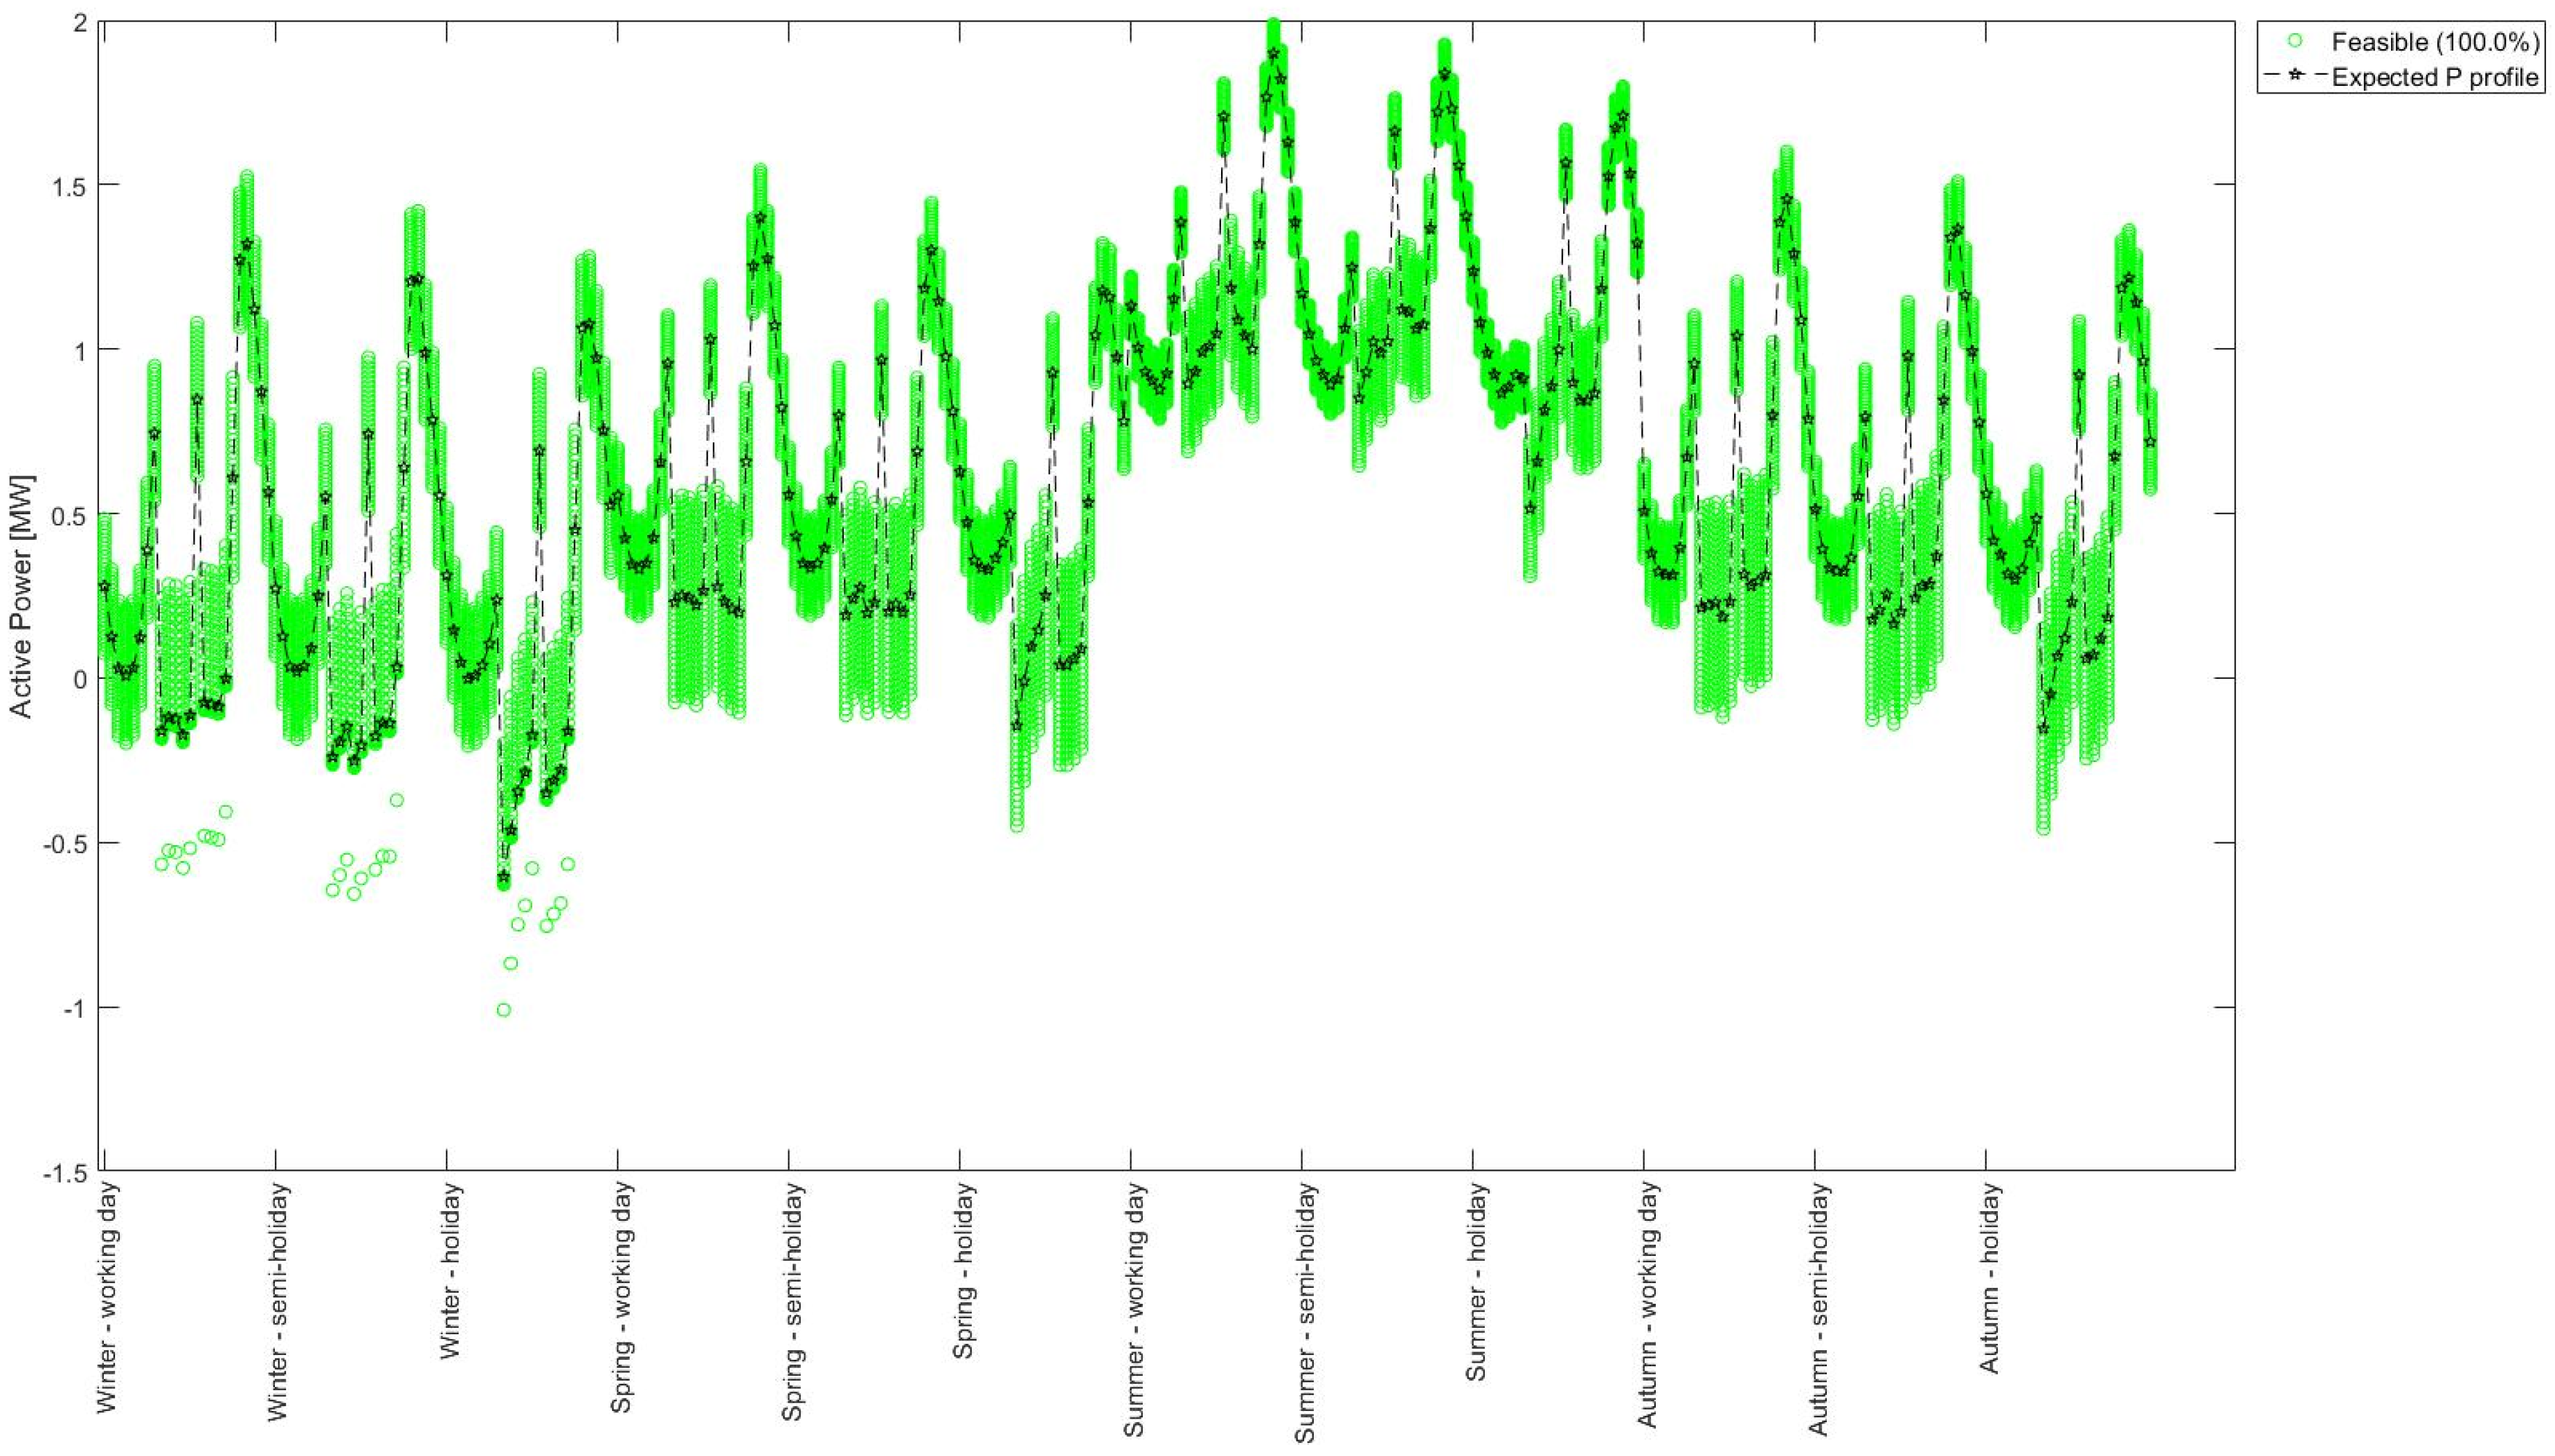
| D3 | 100.0 | 0.0 | 0.0 | 100.0 | 0.0 | 0.0 |
| U4 | 100.0 | 0.0 | 0.0 | 97.0 | 0.0 | 3.0 |
| U5 | 100.0 | 0.0 | 0.0 | 96.1 | 0.0 | 3.9 |
| UPWARD | DOWNWARD | |||
|---|---|---|---|---|
| Case A (DG Only) | Case B (DG + End-Users) | Case A (DG Only) | Case B (DG + End-Users) | |
| Market Potential (GWh/year) | 9.026 | 37.271 | 42.293 | 70.519 |
| Feasible Flexibility (GWh/year) | 8.126 (−10%) (1) | 32.503 (−13%) (1) | 37.254 (−12%) (1) | 60.659 (−14%) (1) |
| Cost of feasible flexibility (MEUR/year) | 0.502 | 1.849 | 0.253 | 1.499 |
| Needed Reactive support (GVarh/year) | 29.344 | 27.900 | 0.298 | 3.026 |
| Total extra cost for Reactive support (kEUR/year) | 73.3 | 70.6 | 0.9 | 9.2 |
| Unitary cost (without extra cost—feasible) (EUR/MWh) | 61.78 | 56.89 (−8%) (2) | 6.79 | 24.71 |
| Unitary cost (with extra cost—feasible) (EUR/MWh) | 70.80 | 59.06 (−17%) (2) | 6.82 | 24.86 |
Publisher’s Note: MDPI stays neutral with regard to jurisdictional claims in published maps and institutional affiliations. |
© 2022 by the authors. Licensee MDPI, Basel, Switzerland. This article is an open access article distributed under the terms and conditions of the Creative Commons Attribution (CC BY) license (https://creativecommons.org/licenses/by/4.0/).
Share and Cite
Natale, N.; Pilo, F.; Pisano, G.; Soma, G.G. Quantitative Assessment of Flexibility at the TSO/DSO Interface Subject to the Distribution Grid Limitations. Appl. Sci. 2022, 12, 1858. https://0-doi-org.brum.beds.ac.uk/10.3390/app12041858
Natale N, Pilo F, Pisano G, Soma GG. Quantitative Assessment of Flexibility at the TSO/DSO Interface Subject to the Distribution Grid Limitations. Applied Sciences. 2022; 12(4):1858. https://0-doi-org.brum.beds.ac.uk/10.3390/app12041858
Chicago/Turabian StyleNatale, Nicola, Fabrizio Pilo, Giuditta Pisano, and Gian Giuseppe Soma. 2022. "Quantitative Assessment of Flexibility at the TSO/DSO Interface Subject to the Distribution Grid Limitations" Applied Sciences 12, no. 4: 1858. https://0-doi-org.brum.beds.ac.uk/10.3390/app12041858