
Revisiting the Cu-Zn Disorder in Kesterite Type Cu2ZnSnSe4 Employing a Novel Approach to Hybrid Functional Calculations


1
Department Structure and Dynamics of Energy Materials, Helmholtz-Zentrum Berlin für Materialien und Energie, Hahn-Meitner-Platz 1, 14109 Berlin, Germany
2
Institute of Physics and Astronomy, University of Potsdam, Karl-Liebknecht-Str. 24/25, 14476 Potsdam, Germany
Appl. Sci. 2022, 12(5), 2576; https://0-doi-org.brum.beds.ac.uk/10.3390/app12052576
Submission received: 12 January 2022
/
Revised: 23 February 2022
/
Accepted: 24 February 2022
/
Published: 2 March 2022
(This article belongs to the Special Issue Next Generation Materials for Thin-Film Solar Cells: Synthesis and Characterization)
Abstract
:In recent years, the search for more efficient and environmentally friendly materials to be employed in the next generation of thin film solar cell devices has seen a shift towards hybrid halide perovskites and chalcogenide materials crystallising in the kesterite crystal structure. Prime examples for the latter are CuZnSnS, CuZnSnSe, and their solid solution CuZnSn(SSe), where actual devices already demonstrated power conversion efficiencies of about 13 %. However, in their naturally occurring kesterite crystal structure, the so-called Cu-Zn disorder plays an important role and impacts the structural, electronic, and optical properties. To understand the influence of Cu-Zn disorder, we perform first-principles calculations based on density functional theory combined with special quasirandom structures to accurately model the cation disorder. Since the electronic band gaps and derived optical properties are severely underestimated by (semi)local exchange and correlation functionals, supplementary hybrid functional calculations have been performed. Concerning the latter, we additionally employ a recently devised technique to speed up structural relaxations for hybrid functional calculations. Our calculations show that the Cu-Zn disorder leads to a slight increase in the unit cell volume compared to the conventional kesterite structure showing full cation order, and that the band gap gets reduced by about 0.2 eV, which is in very good agreement with earlier experimental and theoretical findings. Our detailed results on structural, electronic, and optical properties will be discussed with respect to available experimental data, and will provide further insights into the atomistic origin of the disorder-induced band gap lowering in these promising kesterite type materials.
1. Introduction
The ongoing quest to identify more efficient and environmentally friendly materials to be employed in solar cell devices has shifted the focus in recent years towards quaternary chalcogenides and hybrid halide perovskites. While hybrid halide perovskites face stability issues due to their admixed organic molecules, chalcogenide materials exhibit intrinsic structural properties, which have prevented their large-scale application in solar cell devices so far.
Concerning the latter, CuZnSnS (CZTS) and CuZnSnSe (CZTSe) are prominent examples, and with band gaps of about 1.0 eV (CZTSe) [1,2] and 1.53 eV ⋯ 1.67 eV (CZTS) [3], their solid solution CuZnSn(SSe) (CZTSSe) includes the optimal band gap region of about 1.34 eV for single junction solar cell devices according to the Shockley-Queisser limit [4]. Ultimately, actual devices based on CZTSSe already demonstrated power conversion efficiencies of about 13% [5]. However, there are limitations to the actual device performances, originating from several intrinsic structural properties, e.g., a large defect concentration of Cu-Zn antisite defects [6] and Cu-Zn defect complexes due to Cu-Zn disorder [7]. Ultimately, these defects and Cu-Zn disorder lead to a large deficit in the open-circuit voltage V [8].
The importance of the Cu-Zn disorder in kesterite materials and its implications on the structural, electronic, and optical properties have led to increased research efforts into their atomistic origins. Experimental techniques include solid-state NMR and Raman spectroscopy [9], near-resonant Raman scattering [10], neutron diffraction [11,12], and complementary neutron and anomalous X-ray diffraction [13,14], respectively. The experimental findings are supplemented by theoretical investigations, mostly employing a combination of first-principles calculations based on density functional theory (DFT) and Monte-Carlo calculations based on cluster expansion methods [15,16,17,18].
A recently devised technique to speed up hybrid functional calculations for materials science investigations [19] provided the motivation for the current work, namely the re-evaluation of Cu-Zn disorder in CZTSe employing first-principles calculations based on DFT and special quasirandom structures to model the structural disorder.
The paper is organised as follows. Section 2 shortly presents the necessary theoretical background, introduces the recently devised method to speed up hybrid functional calculations [19], and provides the necessary computational details. In Section 3 the results on the structural (Section 3.1 and Section 3.2), and electronic and optical (Section 3.3) properties are presented and discussed alongside experimental data and other theoretical investigations. Section 4 provides a short summary and outlook.
2. Theoretical Background
2.1. Kesterites and the Cu-Zn Disorder
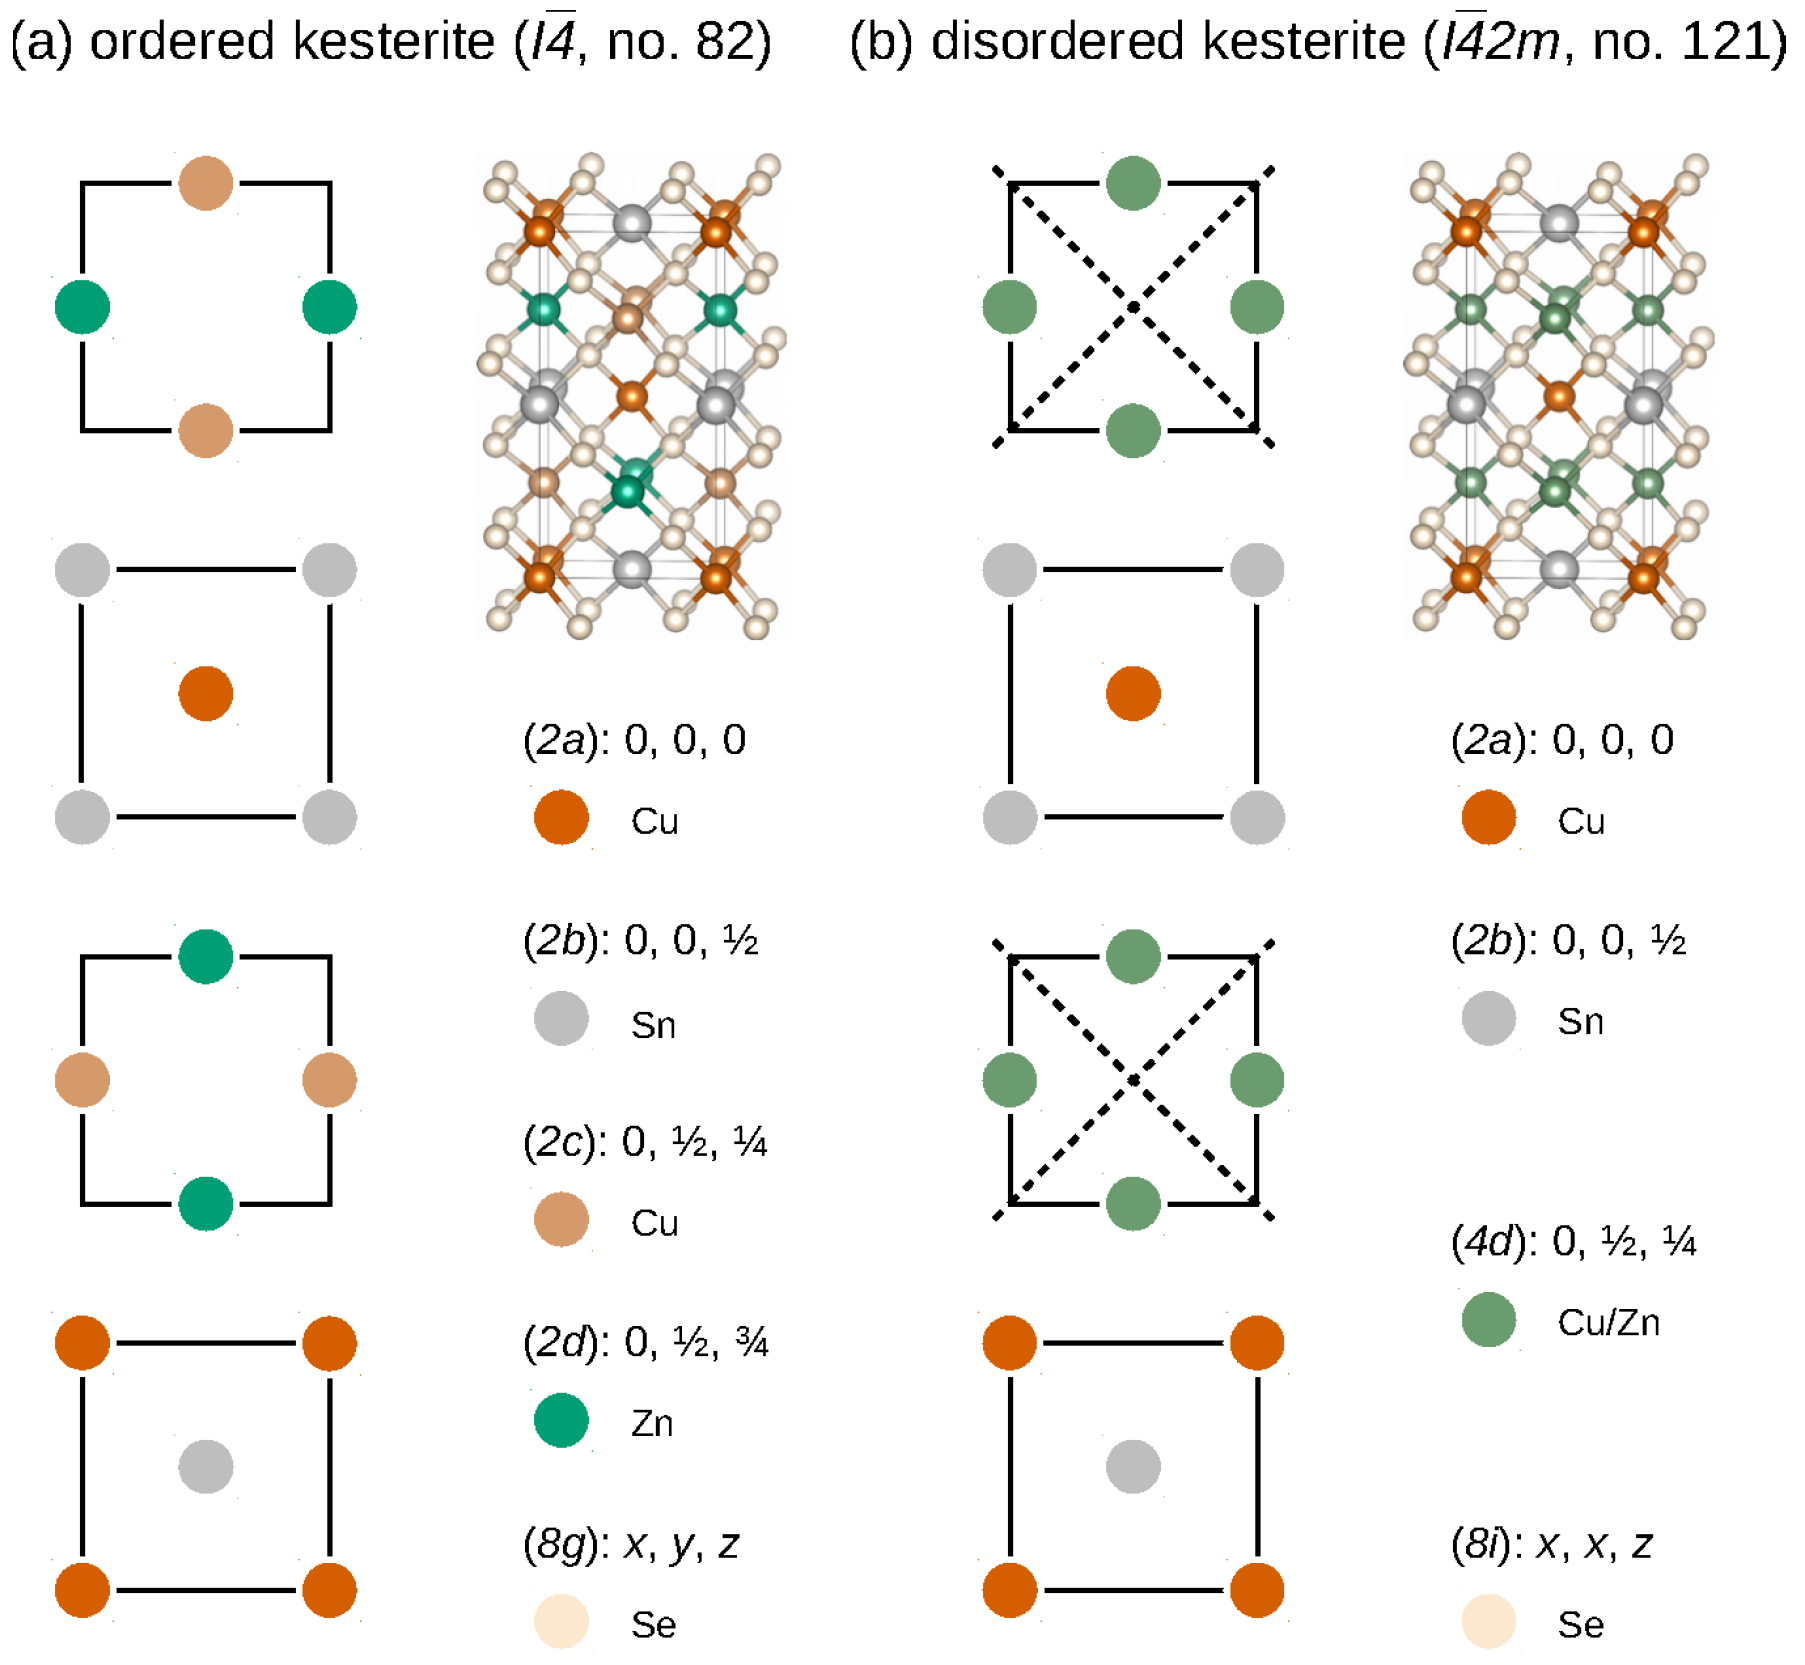
CZTSe crystallises in the kesterite crystal structure (space group , no. 82), which can be derived from a doubled zincblende crystal structure by two particular pairwise cation substitutions [20]. For CZTSe, the cation planes perpendicular to the crystallographic c axis of the conventional ordered kesterite crystal structure are shown in Figure 1a. Therein, the cation positions of Cu, Zn, and Sn are highlighted and located at Wyckoff positions (2a) (0,0,0) and (2c) , (2d) , and (2b) , whereas the Se anions are located at the general Wyckoff position (8 g) (x,y,z), respectively.
However, a further complication in CZTSe originates from the so-called Cu-Zn disorder, present in virtually all grown samples with its extent depending on the particular growth conditions. Originating from a small Cu-Zn defect complex formation energy, this leads to a mixing of Cu and Zn cations within the Cu-Zn planes, introduces additional symmetry elements, as indicated by the dashed lines in Figure 1b, and increases the symmetry of the disordered kesterite to space group (no. 121), respectively. Coincidentally, a structurally similar chalcogenide polymorph, namely the stannite crystal structure [20,22], crystallises in the same space group (). Together with the fact that Cu and Zn cations are isoelectronic and therefore indistinguishable for standard X-ray diffraction, this has hindered the identification of the correct ground state crystal structure of kesterite materials in the past and required alternative experimental investigations, e.g., neutron diffraction [11].
2.2. How to Speed up Hybrid Functional Calculations
First-principles calculations based on DFT have become an indispensable tool for contemporary computational materials science investigations. Recent advances in methods development and the wide-spread availability and efficient use of high-performance computing facilities have paved the way towards predictive computational materials investigations. The achievable accuracy of current investigations is mostly governed by the choice of the exchange and correlation functional. While (semi)local functionals allow for very fast calculations, they mostly fail to accurately determine band gaps and optical properties of semiconducting materials. So-called hybrid functionals, where a particular fraction of Hartree-Fock exact exchange is mixed into an underlying (semi)local functional, capture the electronic and optical properties of semiconducting materials in much better agreement with experimental results, however, this accuracy has to be paid for by an increase in computational resources. While hybrid functional calculations have become standard for the calculation of structural, electronic, and optical properties of bulk materials [22,23,24,25,26,27,28,29], their widespread application for problems that require a large number of calculations has been hindered by the computational demands.
One way to solve this particular problem relies on a two-step process: firstly, the structural relaxations are performed using a computationally cheap (semi)local functional to obtain the ground state structure, and secondly, only for this ground state structure, perform a single-shot hybrid functional calculation to obtain more accurate electronic and optical properties. One obvious flaw with this approach is that the hybrid functional calculations are performed at geometries that are not the ground state for the applied hybrid functional.
A recent investigation dealt with the performance and accuracy of different exchange and correlation functionals for the structural, electronic, and optical properties of CZTSe and AgZnSnSe [22]. Focusing only on CZTSe as of interest for the present work, it has been shown that the structural properties calculated by means of the SCAN functional [30] provided the best agreement with experimental results, however, the electronic and optical properties were severely underestimated. On the other hand, hybrid functional calculations employing the HSE06 functional [31] showed only slightly less good agreement concerning the structural properties, but improved massively for the electronic and optical properties when compared to experimental results. The results for the electronic properties calculated by a single-shot HSE06 calculation for the SCAN optimised ground state structure is slightly less good compared to a full hybrid functional investigation, but still improved over a SCAN functional investigation alone.
Here, we employ a recently devised method to speed up hybrid functional calculations [19]. All the structural relaxations are typically performed by relaxing the internal coordinates of a given unit cell for different fixed unit cell volumes around the experimentally known ground state volume. The resulting total energy curves can then be fitted by an equation of state, e.g., Murnaghan’s [32,33],
that besides the ground state volume provides additional access to the bulk modulus and its pressure derivative for the materials under investigation. The internal coordinates of the identified ground state volume undergo a final structural relaxation, and provide the starting point for subsequent calculations, e.g., electronic band structures or dielectric functions for the optical properties. These would also be the starting point for single-shot hybrid functional calculations to obtain improved results on the electronic and optical properties.
The newly devised method applied here tries to address the earlier mentioned flaw that the hybrid functional calculations for the electronic and optical properties are not performed for their respective ground state geometries. Instead of performing just one single-shot hybrid functional calculation for the final ground state geometry, single-shot hybrid functional calculations are performed at each of the different unit cell volumes around the experimental ground state volume, thereby shifting the whole total energy curve towards the results from a full hybrid functional structural relaxation. With a slight increase in the number of single-shot hybrid functional calculations, we obtain results that are comparable to full hybrid functional investigations, but save on up to two orders of magnitude higher computing times otherwise required for full hybrid functional structural relaxations. This offers to apply hybrid functional calculations to problems that, in terms of computational demands, would have been prohibitively expensive so far.
The problem we address in the present work is the Cu-Zn disorder in CZTSe. In order to model fractional occupancies in DFT calculations, one typically has to resort to the application of supercells. However, the interesting problem of accurately modelling alloys with first-principles methods led to an approach based on special quasirandom structures [34]. This method basically analyses all possible populations over the alloy site, and, with the additional application of crystalline symmetry, identifies only the relevant symmetry inequivalent populations. Over the years, several program packages have been developed for that purpose [35,36,37].
2.3. Other Computational Details
All the calculations of the present work have been performed using the Vienna Ab Initio Simulation Package (VASP 5.4.4) [38,39,40] together with the projector-augmented wave (PAW) formalism [41,42]. Standard PAW potential supplied by VASP have been employed, contributing 17, 12, 14, and 6 valence electrons for the Cu, Zn, Sn, and Se atoms, respectively.
Based on the ground state structural properties, the electronic (band structures) and optical properties (dielectric functions) have been calculated. For the latter, the number of empty bands in the calculations have been increased by a factor of three, in order to allow for a sufficient capture of the influence of higher lying energy bands on the optical properties.
Other numerical parameters include a 500 eV cutoff for the plane wave expansion, convergence criteria of 10 eV and 10 Å for the calculated total energies and forces on the atoms, respectively, and a 6 × 6 × 6 centred k-point grid for the conventional kesterite unit cell, respectively, thus ensuring well-converged results for the structural, electronic, and optical properties.
3. Results and Discussion
3.1. Bulk Structural Properties
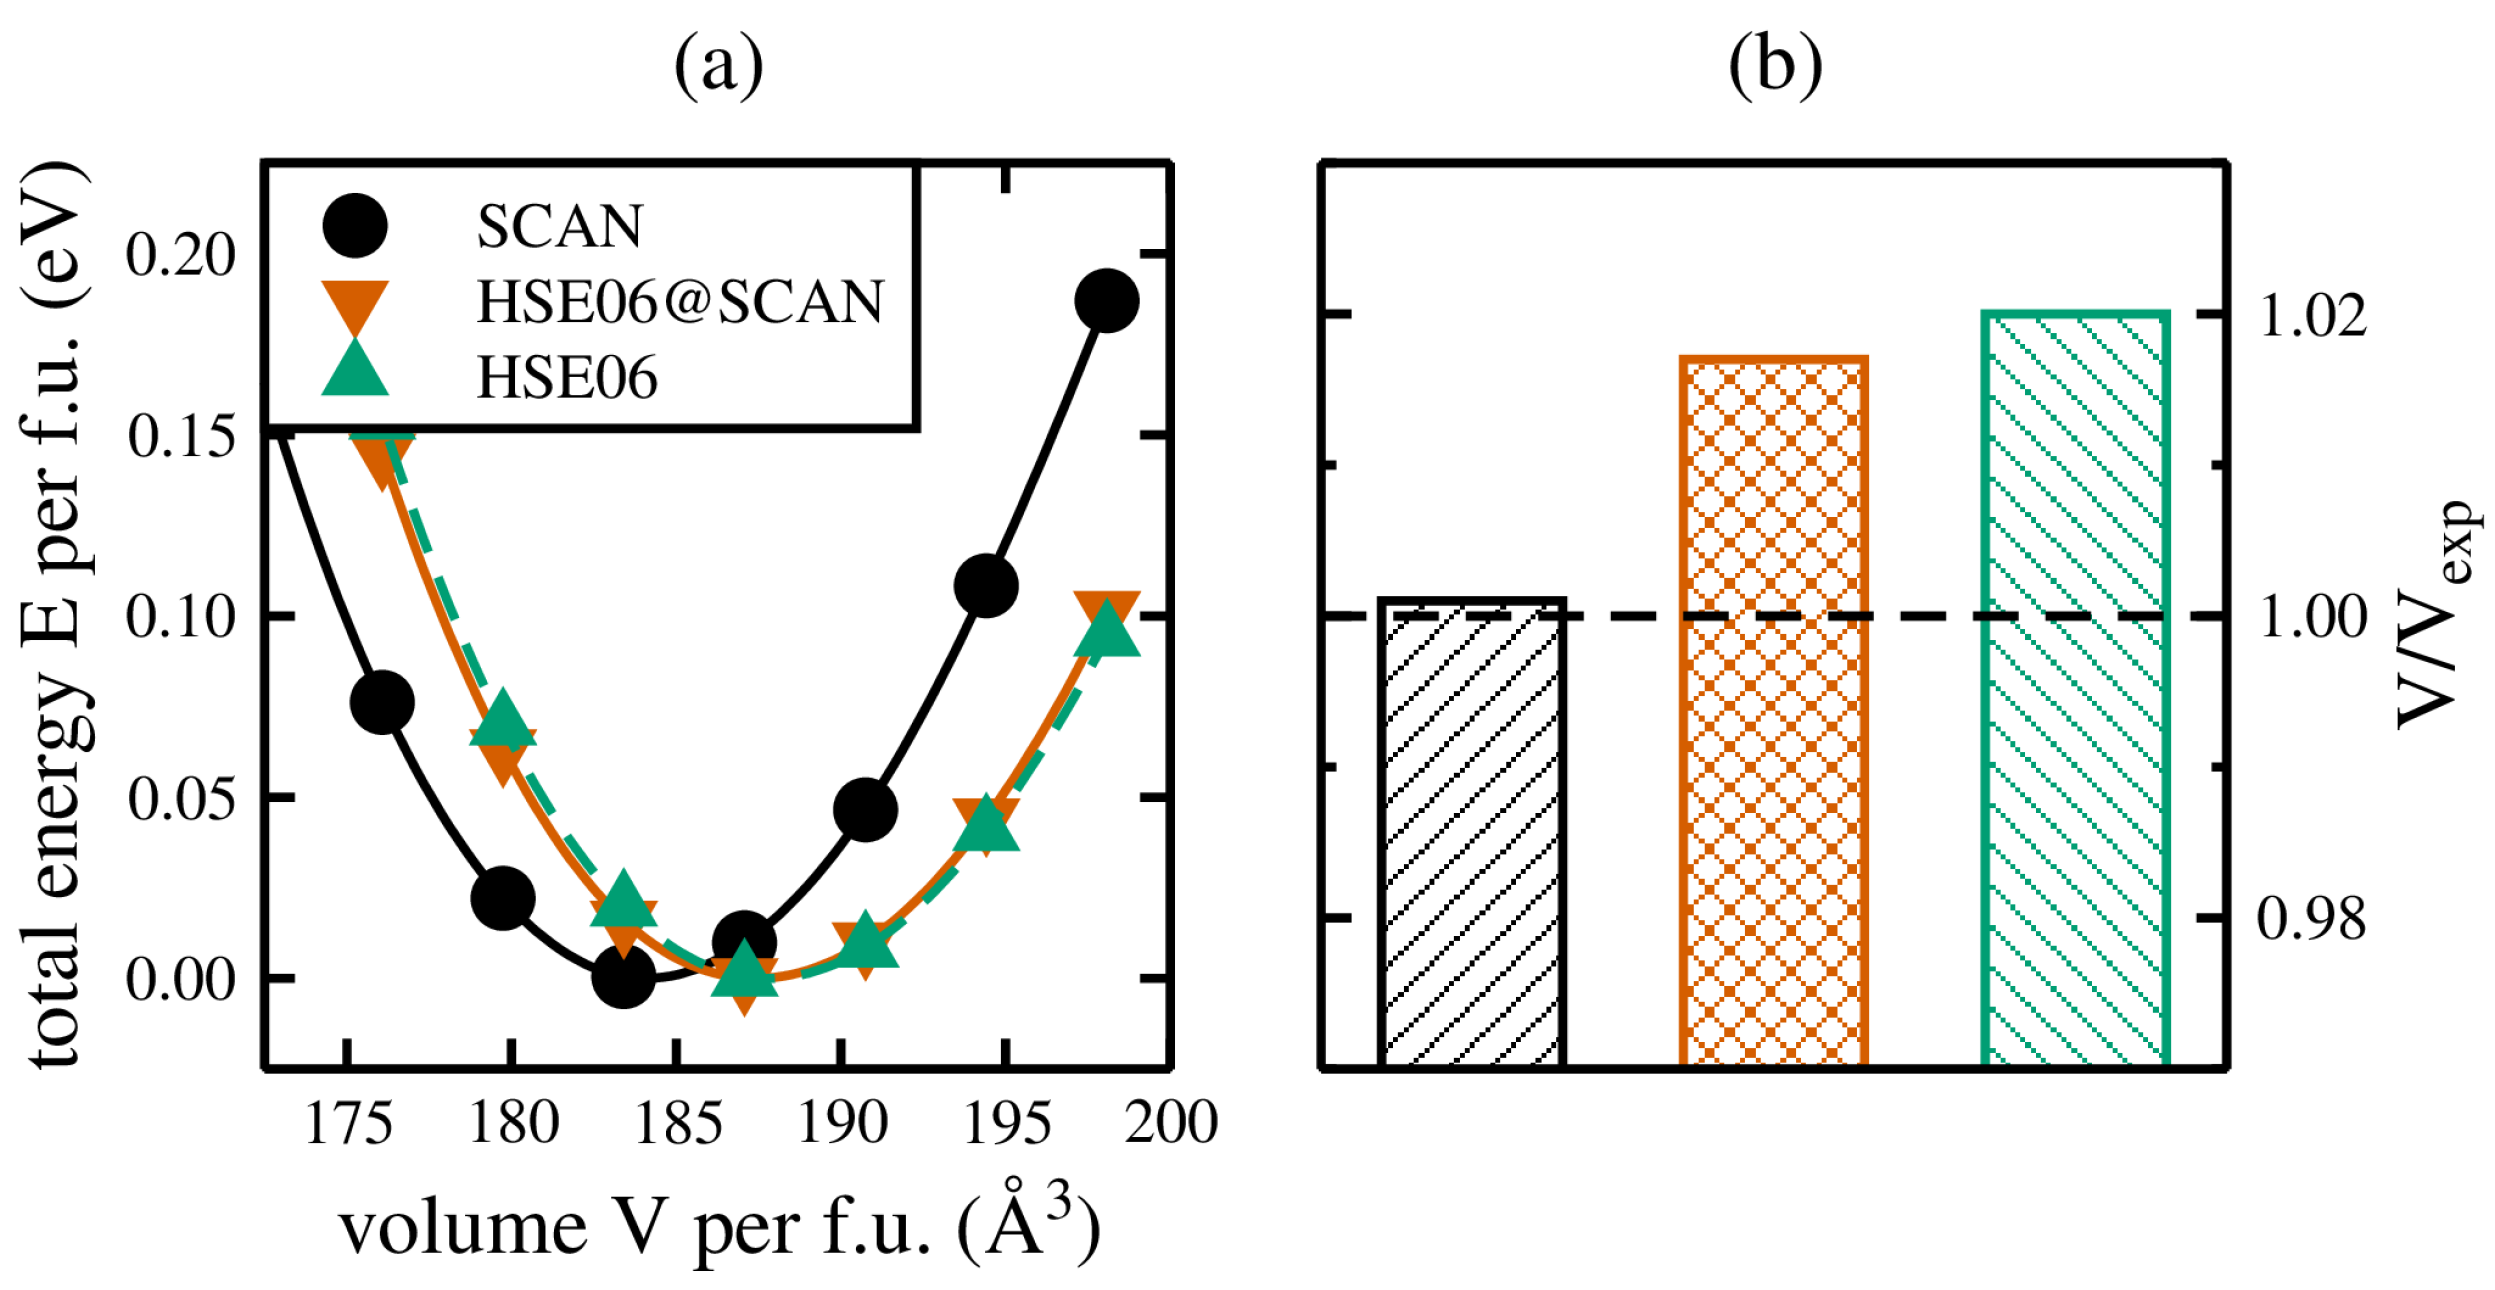
As mentioned in Section 2.2, for the structural relaxations of CZTSe a two-step process has been employed. The starting point is the conventional kesterite unit cell of CZTSe, and for several unit cell volumes around the experimentally known ground state volume a full structural relaxation of the internal coordinates has been performed, thereby keeping the respective unit cell volumes fixed. In that way we obtain the total energy curves, i.e., the dependence of the calculated total energy on the various volumes, shown exemplary as black dots (green triangles) for the SCAN (hybrid HSE06) exchange and correlation functionals in Figure 2a.
A further analysis of the total energy curves by means of Murnaghan’s equation of state (Equation (1)) leads to the ground state volume , and a final relaxation of the internal coordinates for yields the lattice parameters for CZTSe, amounting to Å ( Å) and Å ( Å) for calculations based on the SCAN (hybrid HSE06) exchange and correlation functionals [22], in favourable agreement with experimental values [2], reported as Å and Å, respectively. The agreement with respect to the experimental unit cell volume is shown in Figure 2b, showing very good agreement for the SCAN functional calculation, and an overestimation of up to 2% for the hybrid HSE06 exchange and correlation functional [22].
However, the main focus here is on the performance for the newly devised approach to speed up structural relaxations employing hybrid functionals, and the agreement with experimental results. As mentioned in Section 2.2, for each of the volumes of the SCAN full structural relaxations (black dots in Figure 2a) a single-shot HSE06 calculation has been performed based on the relaxed structural properties of the SCAN functional calculations. The corresponding total energy curve is shown by the red triangles in Figure 2a, and is shifted towards the full hybrid HSE06 results, respectively. A further analysis by Murnaghan’s equation of state (Equation (1)) reveals lattice constants of Å and Å, in favourable agreement with the results obtained for full structural relaxations employing the hybrid HSE06 exchange and correlation functional. In other words, employing the described two-step process of relaxing the structural properties using the computationally much cheaper SCAN exchange and correlation functional, followed by single-shot hybrid HSE06 calculations for each of the different unit cell volumes necessary to sample the total energy curve, yields structural properties in favourable agreement with full structural relaxations based on the hybrid HSE06 functional. This approach can now be applied to problems where a full hybrid functional structural relaxation has not been possible up to now, either due to the size of the unit cell or simply the number of necessary structural relaxations.
3.2. Disordered Structural Properties
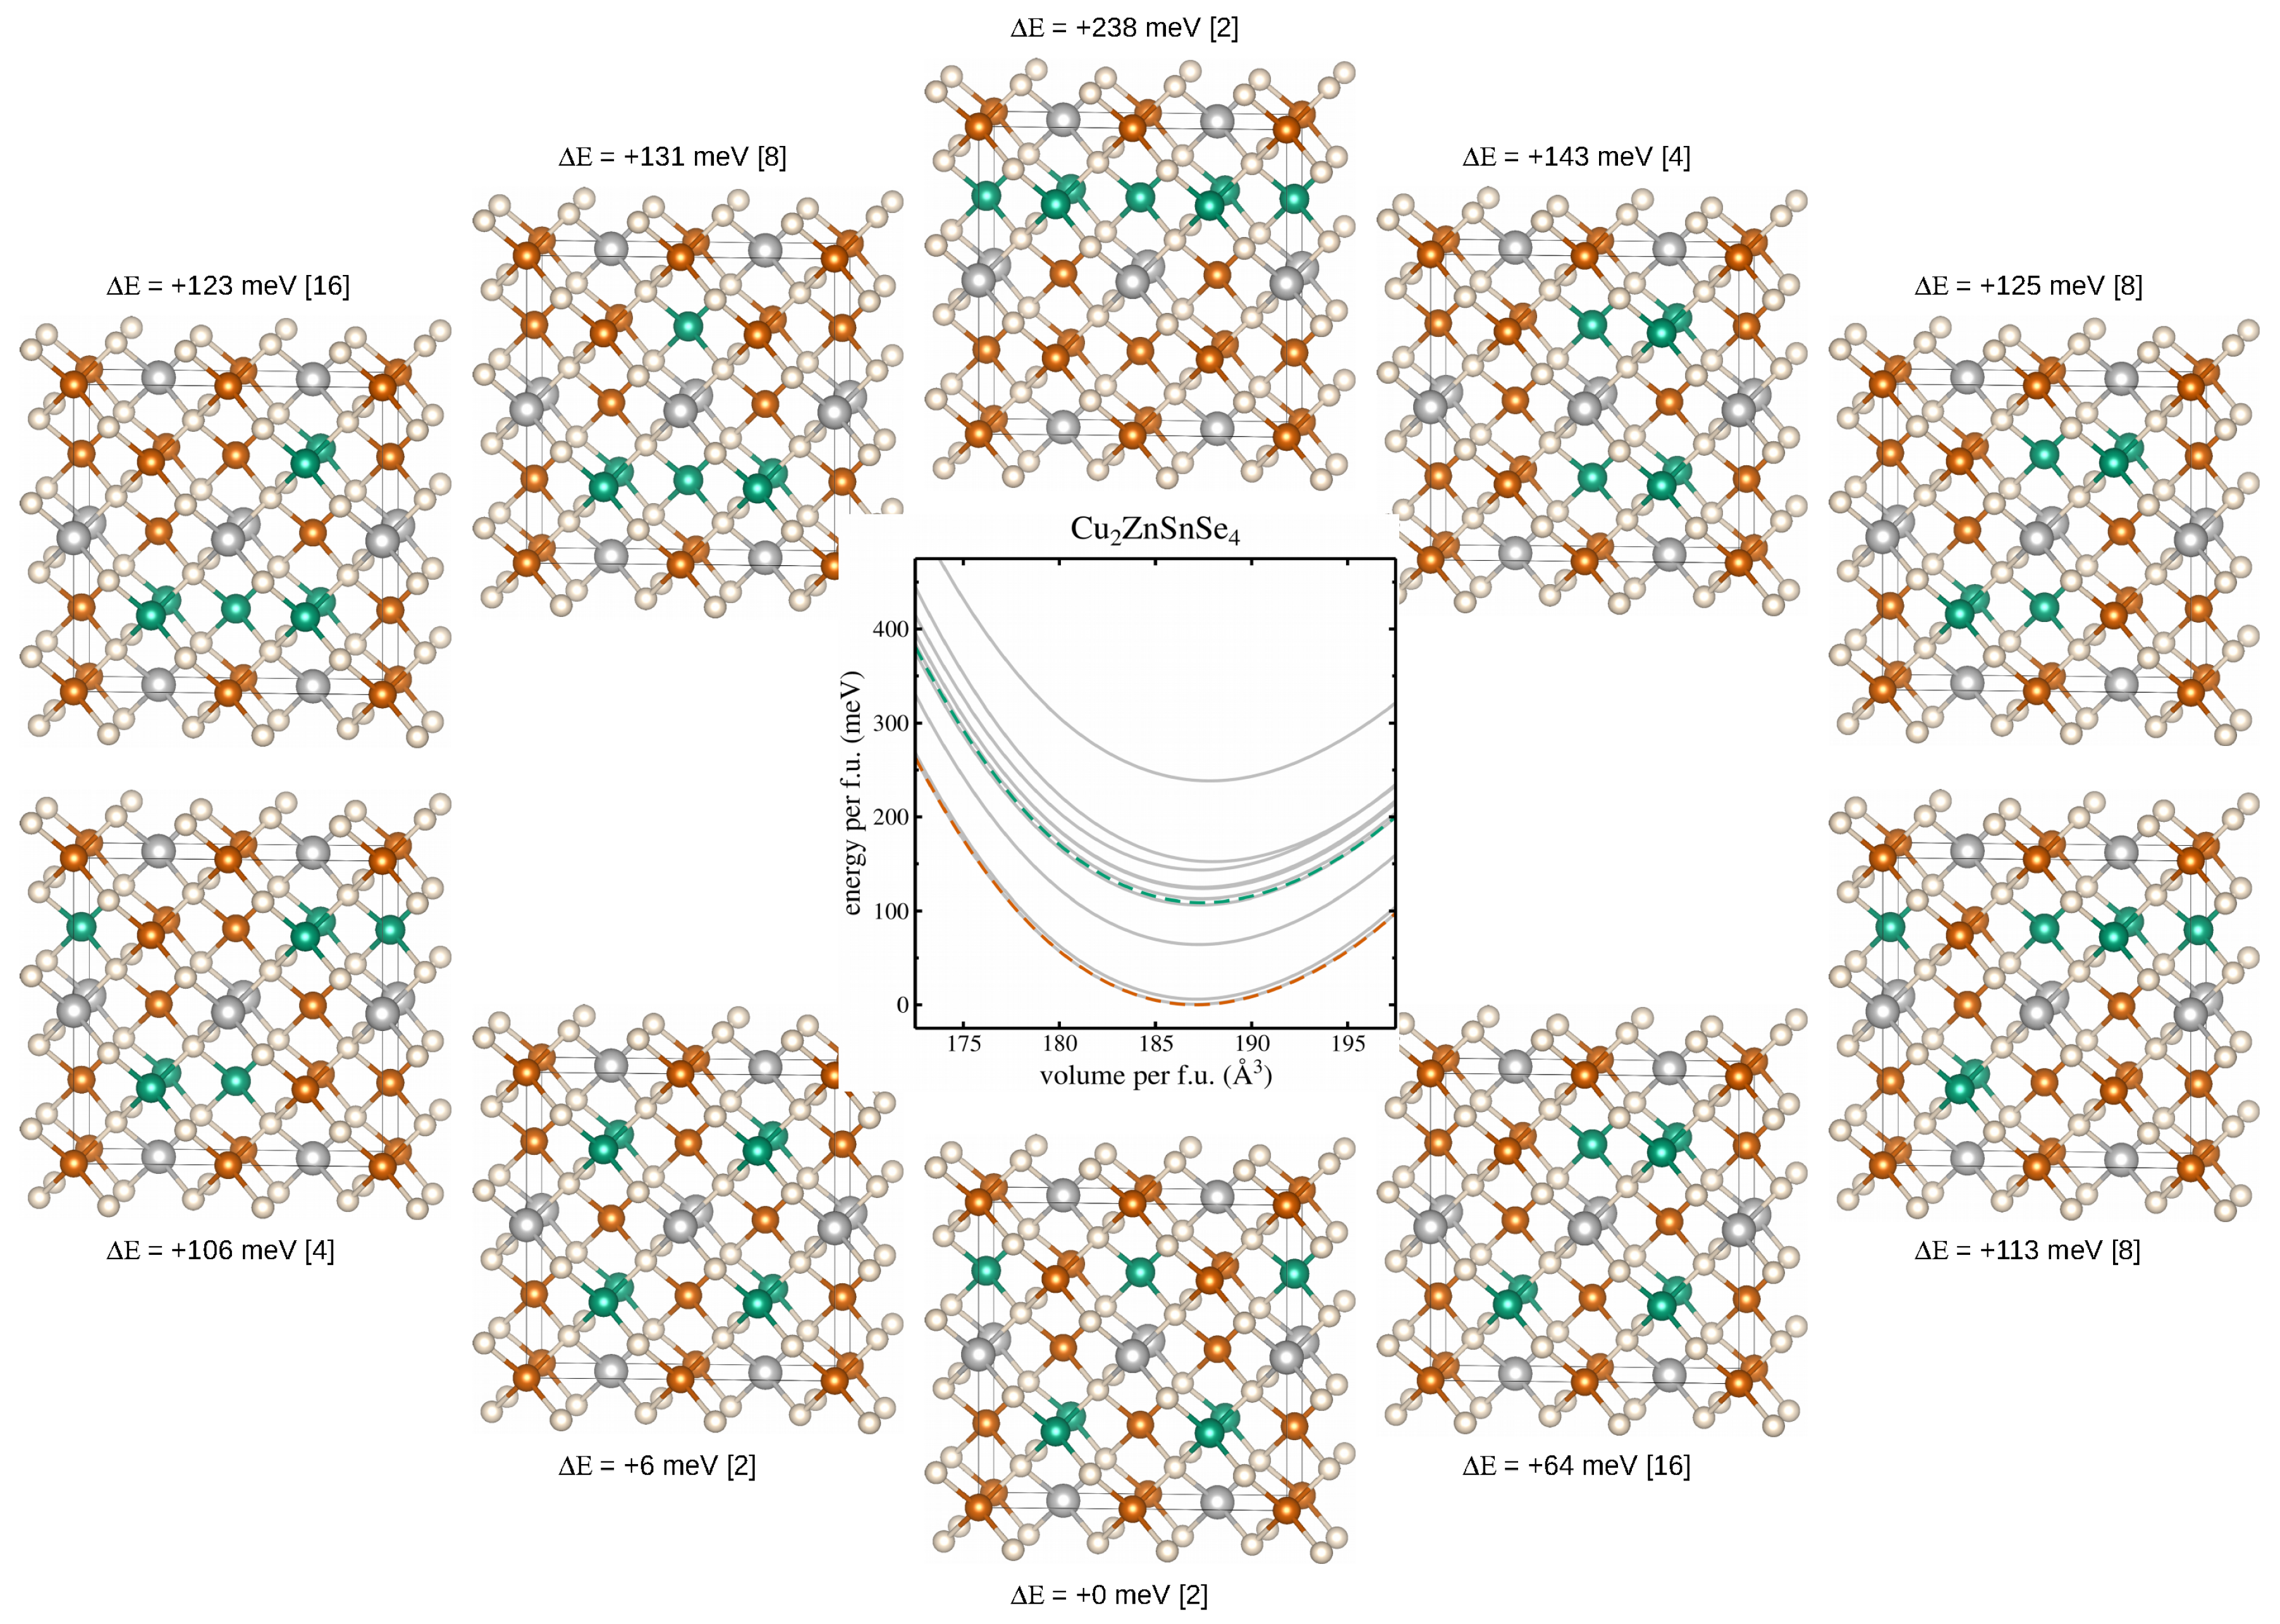
Based on the obtained ground state lattice constants of CZTSe, 2 × 1 × 1 supercells of the conventional kesterite unit cell have been generated, each containing four formula units (32 atoms). Within the Cu-Zn planes in these 2 × 1 × 1 supercells of the ordered kesterite structure we now find four Cu and four Zn cations, occupying the (2c) and (2d) Wyckoff positions (Figure 1a), or equivalently the (4d) Wyckoff position in the disordered kesterite structure (Figure 1b), respectively. The special quasirandom structures have been generated by the supercell program of Okhotnikov et al. [37], reducing the original different possible cation arrangements within the Cu-Zn planes to just 10 symmetry inequivalent cation distributions, shown exemplary in Figure 3.
The middle panel of Figure 3 shows the total energy curves for each of the 10 symmetry inequivalent cation arrangements, calculated by means of the newly devised method to speed up hybrid functional calculations as discussed in Section 2.2. The total energy curves are normalised to one formula unit (f.u.), and the lowest total energy is set to zero energy, respectively. Additionally, the dashed green line in the middle graph shows the weighted average over the 10 different total energy curves, taking into account the degeneracy of the symmetry inequivalent cation distributions, i.e., how often they appear in the total number of 70 possible cation arrangements (also shown for each of the considered cation arrangements in square brackets), while the dashed red line refers to the total energy of the ground state crystal structure of the ordered kesterite, respectively.
Three conclusions can be drawn immediately from Figure 3: (1) there is a large spread in total energies for the 10 symmetry inequivalent cation distributions, reaching 238 meV per f.u. between the lowest and highest energy solutions, thus making the weighted averaging over all total energy curves a necessity to adequately model the total energy curve for the disordered kesterite crystal structure; (2) the energy difference between the total energies of the ordered (dashed red line) and the disordered (dashed green line) kesterite crystal structure amounts to 109 meV, making the ordered kesterite crystal structure the thermodynamically stable crystal structure for zero temperature DFT calculations, putting the origin of the disordered kesterite crystal structure at temperature effects and growth conditions of experimentally investigated samples [10]; (3) there is a slight increase in the unit cell volume of the disordered kesterite structure of about 0.2% compared to the ordered kesterite crystal structure, in line with previous experimental [13] and theoretical [43] results.
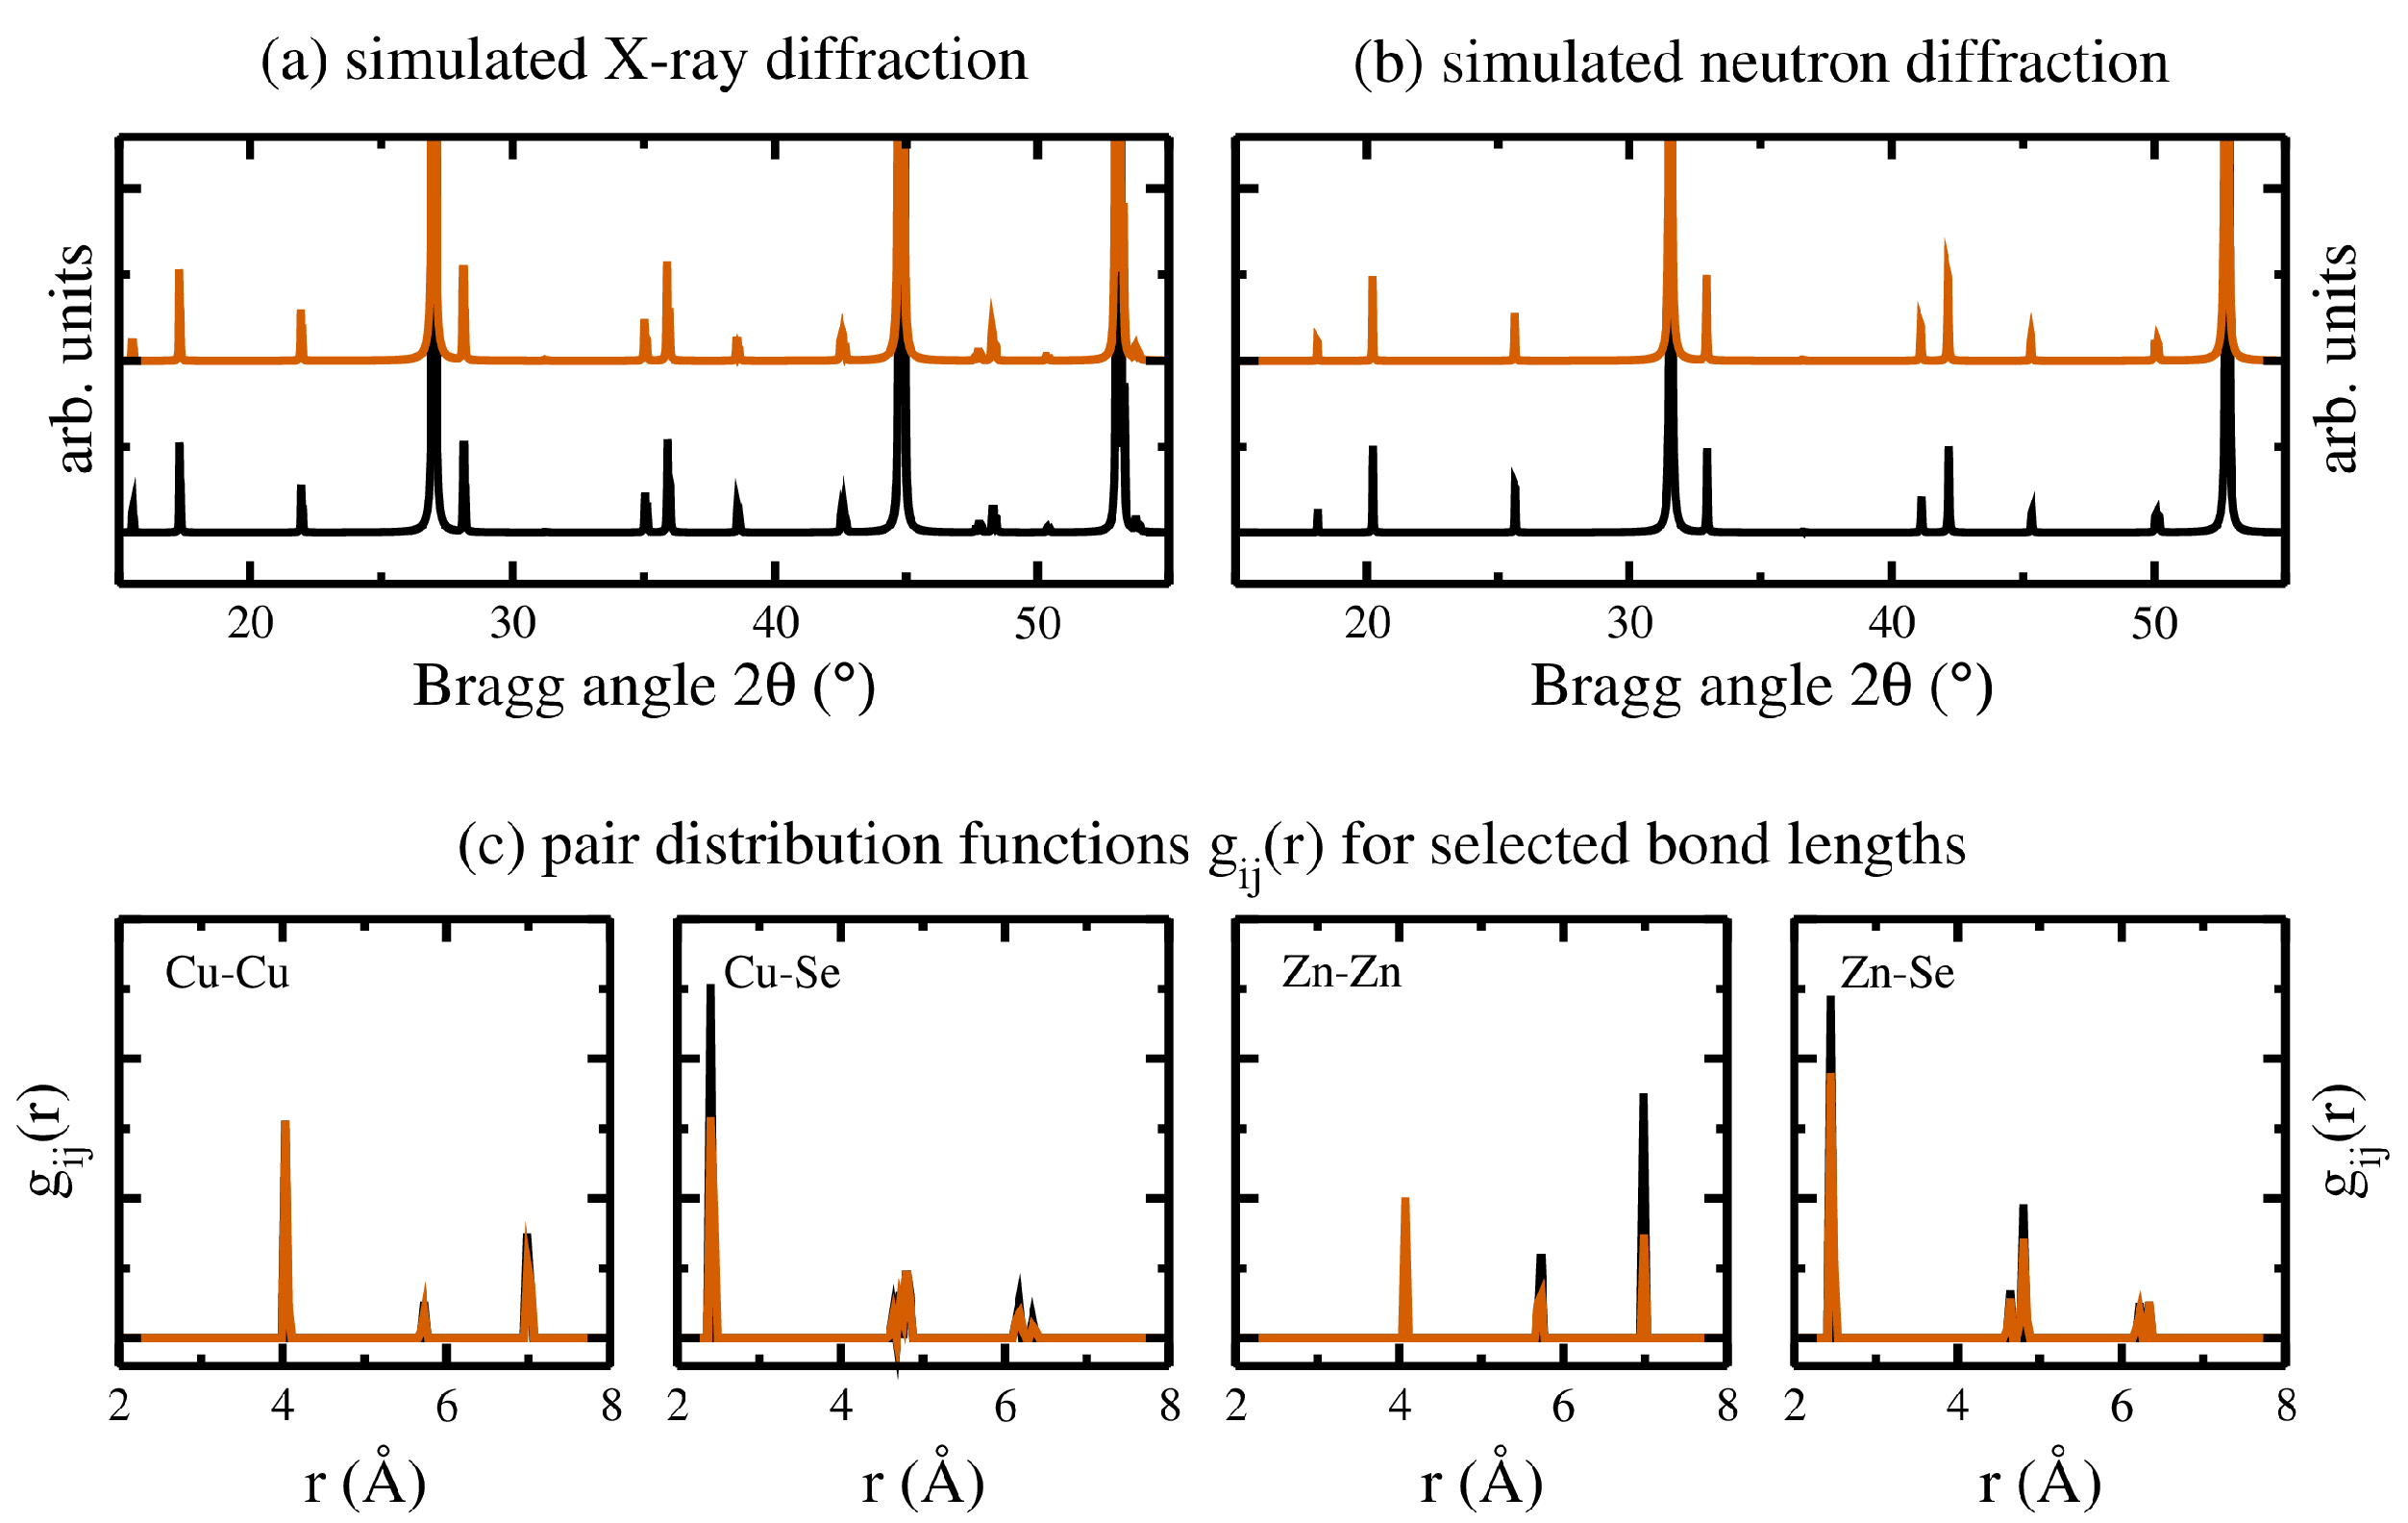
In depth analyses have been performed on the ground state crystal structures of the ordered kesterite and the 10 symmetry inequivalent cation arrangements for the disordered kesterite crystal structures. Averaging again the symmetry inequivalent cation arrangements allowed us to compare the diffraction patterns and the results of a pair distribution function analysis giving access to atom specific bond lengths. Employing VESTA [21] for the diffraction patterns, the results are given in the upper panels of Figure 4, shown for X-ray (a) and neutron (b) diffraction separately.
Thereby, the resulting diffraction patterns of the ordered (disordered) kesterite crystal structures are shown as black (red) lines, respectively. The results of the corresponding bond lengths analyses, obtained by the R.I.N.G.S. code [44], are shown in Figure 4c for the Cu-Cu, Zn-Zn, Cu-Se, and Zn-Se bond lengths. The shown bond distances for the disordered kesterite (red lines) are broadened with respect to the ordered kesterite (black lines), reflecting the slightly larger unit cell volume. In addition, especially the first nearest neighbour cation-Se bonds show a reduction in intensity, highlighting the reduction of the specific cation-Se pairs due to disorder.
3.3. Electronic and Optical Properties
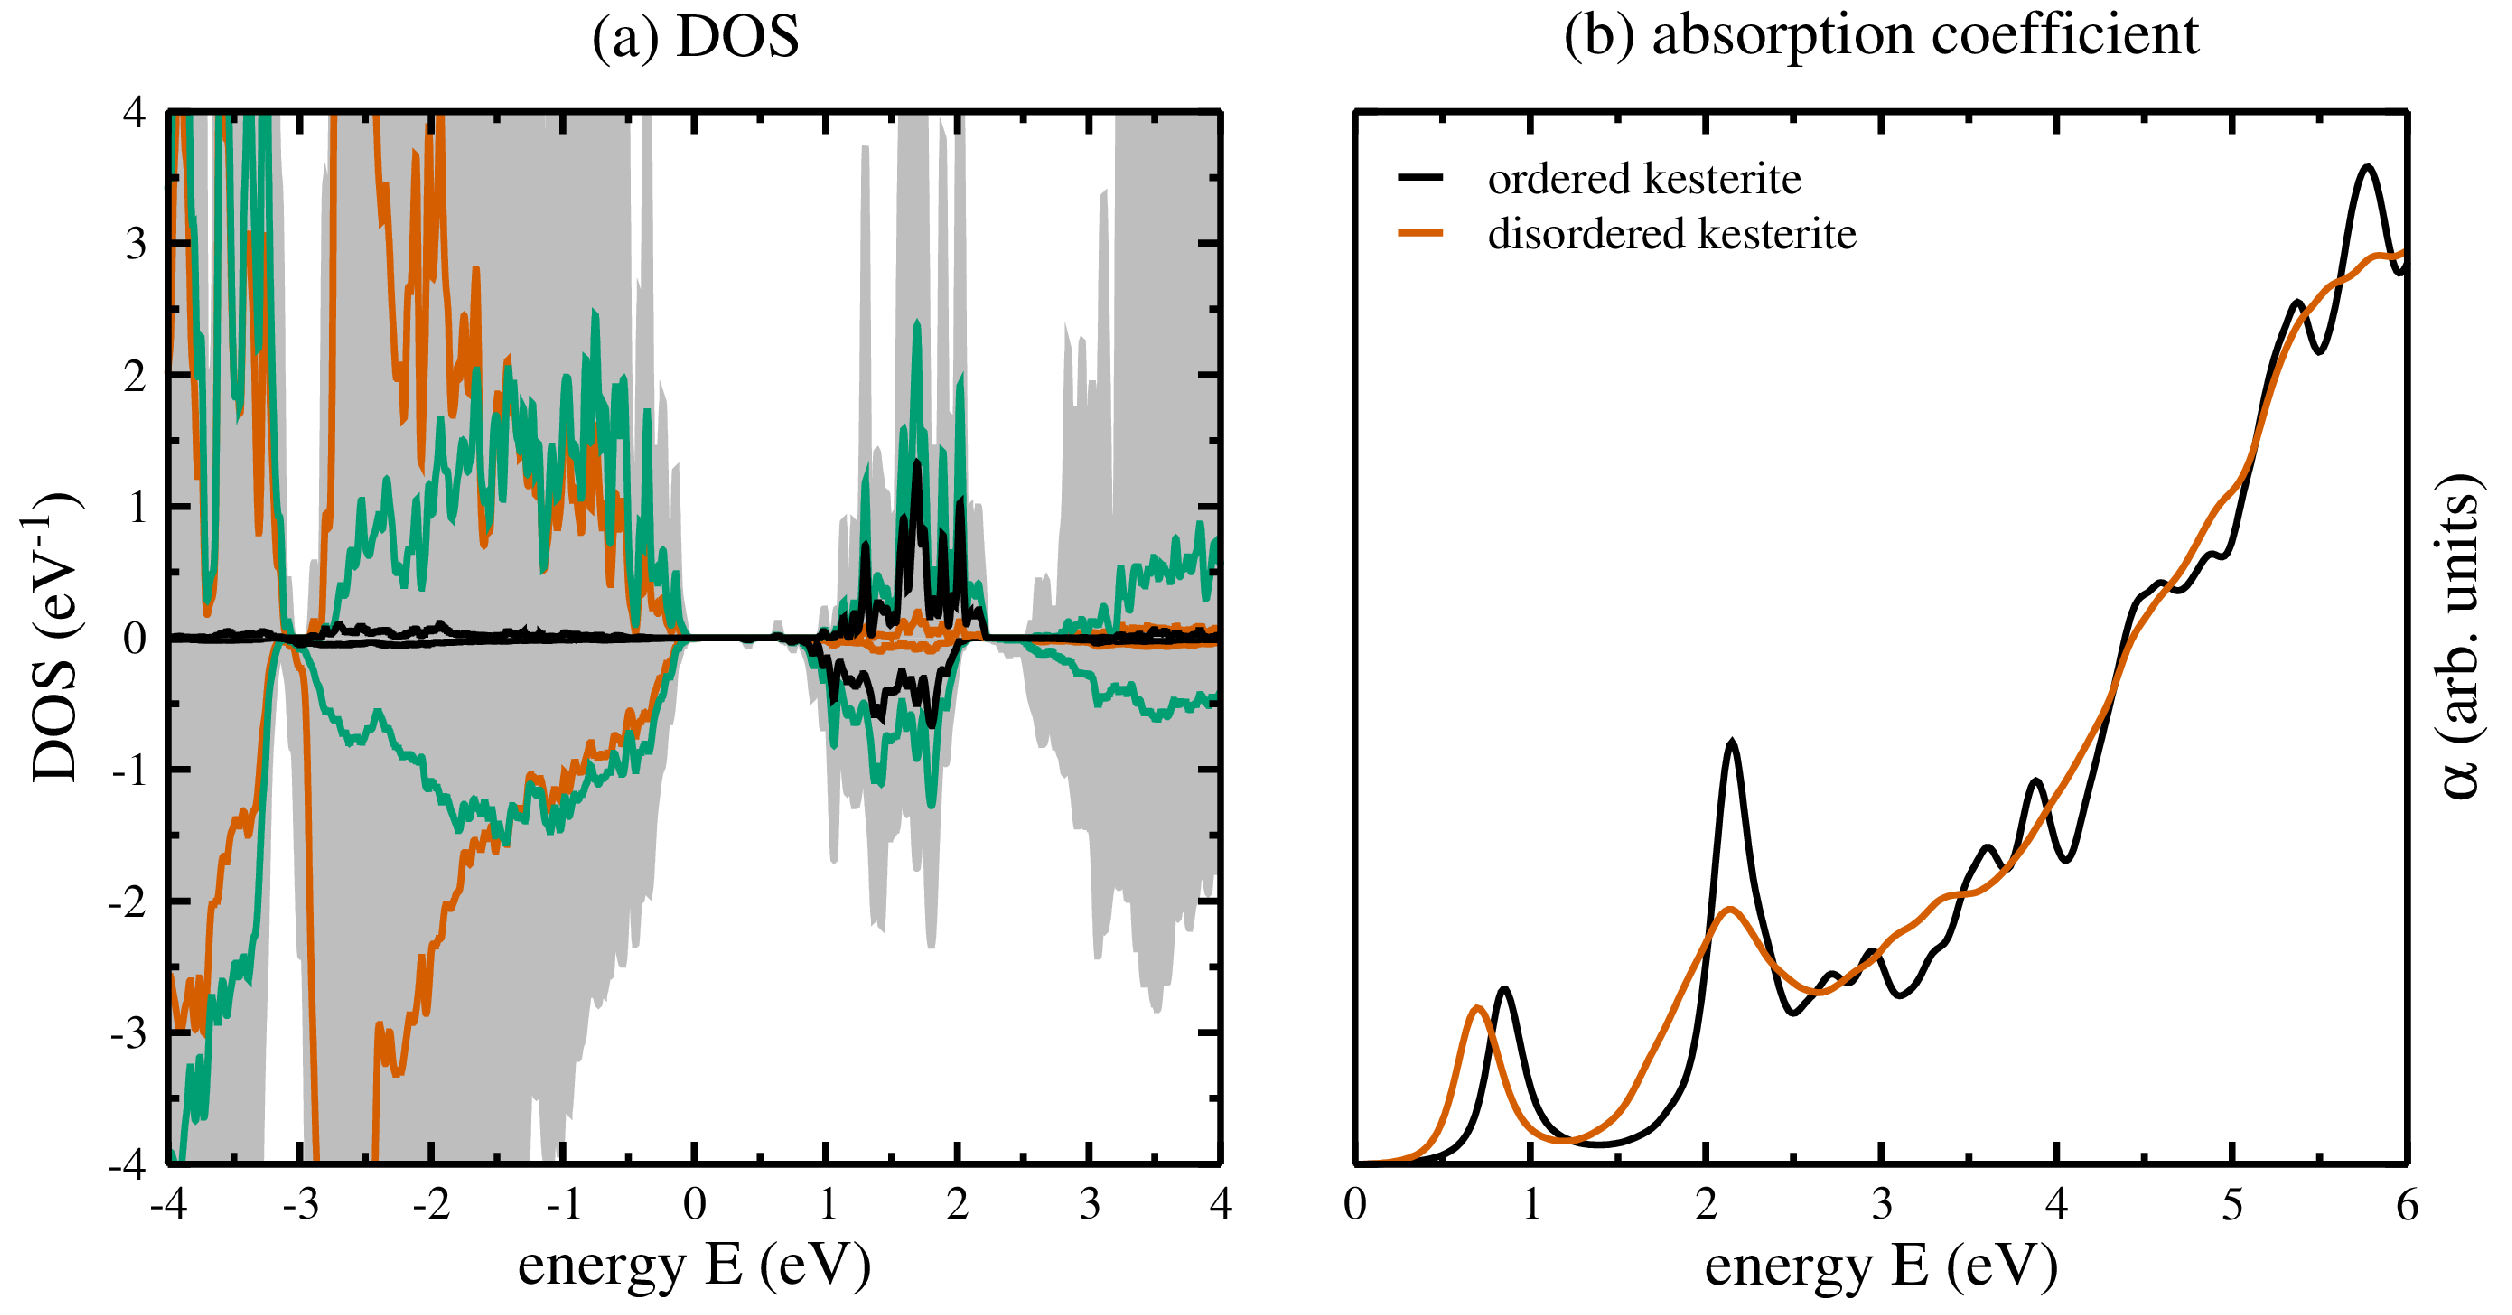
Having analysed in detail the structural properties of the ordered and disordered kesterite crystal structures, here we focus on the electronic and optical properties. Remembering the weighted averages over the 10 symmetry inequivalent cation arrangements to obtain the structural properties of the disordered kesterite crystal structure, the same can be applied to the calculation of the density of states (DOSs) and optical properties. Figure 5a shows the DOSs of the ordered (upper panel) and the disordered (lower panel) kesterite crystal structures, thereby showing the total DOSs as shaded grey backgrounds, and the partial DOSs belonging to Cu (4d), Sn (2b), and Se (8i) as red, black, and green solid lines, respectively.
From the DOSs in Figure 5a three main conclusions can be drawn: (1) the DOSs for the disordered kesterites are smoother compared to the ordered kesterites, which can be traced back to the averaging over 10 supercells with symmetry inequivalent cation distributions and slightly different internal coordinates, but their overall values are quite similar; (2) there is no change in the contributions of partial DOSs at the valence band maximum and conduction band minimum, i.e., the orbital character of the DOSs at the band edges does not change due to disorder effects; (3) the conduction band minimum of the disordered kesterite is shifted towards smaller energies, resulting in a band gap lowering of about 182 meV, which is in line with experimental and theoretical investigations.
Lastly, for each of the 10 symmetry inequivalent cation arrangements we also calculated the optical properties, i.e., the real and imaginary parts of the dielectric functions, as described in some earlier works [25,26]. However, they have been used to calculate the absorption coefficient , which is depicted in Figure 5b for the ordered (black lines) and disordered (red lines) kesterite crystal structures. It can be seen that similarly to the structural properties and DOSs, there is a smoothening of the absorption coefficient for the disordered kesterite due to the already mentioned averaging, and a clearly visible shift of the onset in the absorption towards lower energies, indicating the already observed band gap lowering due to the Cu-Zn disorder, respectively.
4. Summary and Outlook
In summary, we employed special quasirandom structures in combination with suitably sized supercells to accurately model the Cu-Zn disorder in CZTSe, a promising material for the next generation of thin-film solar cell devices. The results presented in this work have been obtained by first-principles calculations based on DFT, utilising the SCAN and hybrid HSE06 exchange and correlation functionals. In order to circumvent some flaws of earlier investigations, we additionally employed a recently devised new method to speed up structural relaxations based on hybrid functional calculations. In that way we were able to investigate the necessary amount of symmetry inequivalent cation arrangements to accurately model the Cu-Zn disorder in CZTSe. Our results show that the Cu-Zn disorder is a temperature effect stemming from experimental growth conditions, and that the Cu-Zn disorder leads to a slight increase in the unit cell volume compared to the conventional kesterite structure showing full cation order. The band gap reduction of about 0.2 eV due to the introduced disorder could be verified from the DOSs and the onsets in the absorption coefficients, thereby confirming earlier experimental and theoretical results. Lastly, the applied method of special quasirandom structures in combination with suitably chosen supercell sizes has been shown to offer atomistic insights into Cu-Zn disorder in CZTSe, thereby supplementing the previously prevalent approaches based on a combination of DFT and Monte-Carlo calculations based on cluster expansion methods. The significant decrease in required computing times of the employed method would also allow for feasible investigations of the whole solid solution series CZTSSe. The CZTSSe mixing parameter could be adjusted in line with the Shockley Queisser limit and verified in future experiments, thereby furthering our knowledge about kesterite-based solar cell materials.
Funding
This research received no external funding.
Institutional Review Board Statement
Not applicable.
Informed Consent Statement
Not applicable.
Data Availability Statement
The data that support the findings of this study are available from the corresponding author upon reasonable request.
Acknowledgments
This work made use of computational resources provided by the North-German Supercomputing Alliance (HLRN, www.hlrn.de, accessed on 12 January 2022), and the ZEDAT [45] and DIRAC high-performance computing facilities of the Freie Universität Berlin and the Helmholtz-Zentrum Berlin, respectively.
Conflicts of Interest
The author declares no conflict of interest.
Abbreviations
The following abbreviations are used in this manuscript:
| CZTS | CuZnSnS |
| CZTSe | CuZnSnSe |
| CZTSSe | CuZnSn(SSe) |
| DFT | Density functional theory |
| DOS | Density of states |
References
- Siebentritt, S.; Schorr, S. Kesterites-a challenging material for solar cells. Prog. Photovolt. Res. Appl. 2012, 20, 512. [Google Scholar] [CrossRef]
- Gurieva, G.; Márquez, J.A.; Franz, A.; Hages, C.J.; Levcenko, S.; Unold, T.; Schorr, S. Effect of Ag incorporation on structure and optoelectronic properties of (Ag1−xCux)2ZnSnSe4 solid solutions. Phys. Rev. Mater. 2020, 4, 054602. [Google Scholar] [CrossRef]
- Levcenko, S.; Hajdeu-Chicarosh, E.; Garcia-Llamas, E.; Caballero, R.; Serna, R.; Bodnar, I.V.; Victorov, I.A.; Guc, M.; Merino, J.M.; Pérez-Rodriguez, A.; et al. Spectroscopic ellipsometry study of Cu2ZnSnS4 bulk poly-crystals. Appl. Phys. Lett. 2018, 112, 161901. [Google Scholar] [CrossRef] [Green Version]
- Rühle, S. Tabulated values of the Shockley-Queisser limit for single junction solar cells. Sol. Energy 2016, 130, 139. [Google Scholar] [CrossRef]
- NIST Best Research-Cell Efficiency Chart. Available online: https://www.nrel.gov/pv/cell-efficiency.html (accessed on 12 January 2022).
- Chen, S.; Walsh, A.; Gong, X.G.; Wei, S.H. Classification of Lattice Defects in the Kesterite Cu2ZnSnS4 and Cu2ZnSnSe4 Earth-Abundant Solar Cell Absorbers. Adv. Mater. 2013, 25, 1522. [Google Scholar] [CrossRef]
- Bourdais, S.; Choné, C.; Delatouche, B.; Jacob, A.; Larramona, G.; Moisan, C.; Lafond, A.; Donatini, F.; Rey, G.; Siebentritt, S.; et al. Is the Cu/Zn Disorder the Main Culprit for the Voltage Deficit in Kesterite Solar Cells? Adv. Energy Mater. 2016, 6, 1502276. [Google Scholar] [CrossRef]
- Yuan, Z.K.; Chen, S.; Xiang, H.; Gong, X.G.; Walsh, A.; Park, J.S.; Repins, I.; Wei, S.H. Engineering Solar Cell Absorbers by Exploring the Band Alignment and Defect Disparity: The Case of Cu- and Ag-Based Kesterite Compounds. Adv. Funct. Mater. 2015, 25, 6733. [Google Scholar] [CrossRef]
- Paris, M.; Choubrac, L.; Lafond, A.; Guillot-Deudon, C.; Jobic, S. Solid-State NMR and Raman Spectroscopy To Address the Local Structure of Defects and the Tricky Issue of the Cu/Zn Disorder in Cu-Poor, Zn-Rich CZTS Materials. Inorg. Chem. 2014, 53, 8646. [Google Scholar] [CrossRef]
- Scragg, J.J.S.; Choubrac, L.; Lafond, A.; Ericson, T.; Platzer-Björkman, C. A low-temperature order-disorder transition in Cu2ZnSnS4 thin films. Appl. Phys. Lett. 2014, 104, 041911. [Google Scholar] [CrossRef] [Green Version]
- Schorr, S.; Hoebler, H.J.; Tovar, M. A neutron diffraction study of the stannite-kesterite solid solution series. Eur. J. Mineral. 2007, 19, 65. [Google Scholar] [CrossRef]
- Bosson, C.J.; Birch, M.T.; Halliday, D.P.; Knight, K.S.; Gibbs, A.S.; Hatton, P.D. Cation disorder and phase transitions in the structurally complex solar cell material Cu2ZnSnS4. J. Mater. Chem. 2017, 5, 16672. [Google Scholar] [CrossRef] [Green Version]
- Többens, D.M.; Gurieva, G.; Levcenko, S.; Unold, T.; Schorr, S. Temperature dependency of Cu/Zn ordering in CZTSe kesterites determined by anomalous diffraction. Phys. Status Solidi B 2016, 253, 1890. [Google Scholar] [CrossRef]
- Gurieva, G.; Többens, D.M.; Levcenco, S.; Unold, T.; Schorr, S. Cu/Zn disorder in stoichiometric Cu2ZnSn(S1−xSex)4 semiconductors: A complementary neutron and anomalous X-ray diffraction study. J. Alloys Comp. 2020, 846, 156304. [Google Scholar] [CrossRef]
- Yu, K.; Carter, E.A. Elucidating Structural Disorder and the Effects of Cu Vacancies on the Electronic Properties of Cu2ZnSnS4. Chem. Mater. 2016, 28, 864. [Google Scholar] [CrossRef]
- Ramkumar, S.P.; Miglio, A.; van Setten, M.J.; Waroquiers, D.; Hautier, G.; Rignanese, G.M. Insights into cation disorder and phase transitions in CZTS from a first-principles approach. Phys. Rev. Mater. 2018, 2, 085403. [Google Scholar] [CrossRef]
- Wallace, S.K.; Frost, J.M.; Walsh, A. Atomistic insights into the order-disorder transition in Cu2ZnSnS4 solar cells from Monte Carlo simulations. J. Mater. Chem. A 2019, 7, 312. [Google Scholar] [CrossRef]
- Zheng, Y.F.; Yang, J.H.; Gong, X.G. Cu-Zn disorder in stoichiometric and non-stoichiometric Cu2ZnSnS4/Cu2ZnSnSe4. AIP Adv. 2019, 9, 035248. [Google Scholar] [CrossRef]
- Fritsch, D. Speedup of structural optimisations using hybrid functionals within first-principles calculations: Case studies for energy materials. 2022; in preparation. [Google Scholar]
- Fritsch, D. Crystallographic diffraction techniques and density functional theory: Two sides of the same coin? In Crystallography in Materials Science; De Gruyter: Berlin, Germany, 2021; p. 317. [Google Scholar] [CrossRef]
- Momma, K.; Izumi, F. VESTA 3 for three-dimensional visualization of crystal, volumetric and morphology data. J. Appl. Crystallogr. 2011, 44, 1272. [Google Scholar] [CrossRef]
- Fritsch, D.; Schorr, S. Climbing Jacob’s ladder: A density functional theory case study for Ag2ZnSnSe4 and Cu2ZnSnSe4. J. Phys. Energy 2021, 3, 015002. [Google Scholar] [CrossRef]
- Fritsch, D.; Morgan, B.J.; Walsh, A. Self-Consistent Hybrid Functional Calculations: Implications for Structural, Electronic, and Optical Properties of Oxide Semiconductors. Nanoscale Res. Lett. 2017, 12, 19. [Google Scholar] [CrossRef] [Green Version]
- Fritsch, D. Electronic and optical properties of spinel zinc ferrite: Ab Initio hybrid functional calculations. J. Phys. Condens. Matter 2018, 30, 095502. [Google Scholar] [CrossRef] [PubMed] [Green Version]
- Fritsch, D. Electronic and Optical Properties of Sodium Niobate: A Density Functional Theory Study. Adv. Mater. Sci. Eng. 2018, 2018, 6416057. [Google Scholar] [CrossRef] [Green Version]
- Fritsch, D. Amorphous Sn-Ti Oxides: A Combined Molecular Dynamics and Density Functional Theory Study. Phys. Status Solidi A 2018, 215, 1800071. [Google Scholar] [CrossRef]
- Fritsch, D.; Schorr, S. On the ground state crystal structure of (Ag0.5Cu0.5)2ZnSnSe4. Thin Solid Films 2021, 738, 138957. [Google Scholar] [CrossRef]
- Breternitz, J.; Fritsch, D.; Franz, A.; Schorr, S. A thorough investigation of the crystal structure of willemite-type Zn2GeO4. Z. Anorg. Allg. Chem. 2021, 647, 2195. [Google Scholar] [CrossRef]
- Fritsch, D. Structural, Electronic, and Optical Properties of p-Type Semiconductors Cu2O and ZnRh2O4: A Self-Consistent Hybrid Functional Investigation. Electron. Mater. 2021, 2, 504–510. [Google Scholar] [CrossRef]
- Sun, J.; Ruzsinszky, A.; Perdew, J. Strongly Constrained and Appropriately Normed Semilocal Density Functional. Phys. Rev. Lett. 2015, 115, 036402. [Google Scholar] [CrossRef] [Green Version]
- Heyd, J.; Scuseria, G.E.; Ernzerhof, M. Hybrid functionals based on a screened Coulomb potential. J. Chem. Phys. 2003, 118, 8207, Erratum in J. Chem. Phys. 2006, 124, 219906. [Google Scholar] [CrossRef] [Green Version]
- Murnaghan, F.D. Finite Deformations of elastic solids. Am. J. Math. 1937, 59, 235. [Google Scholar] [CrossRef]
- Murnaghan, F.D. The compressibility of media under extreme pressure. Proc. Natl. Acad. Sci. USA 1944, 30, 244. [Google Scholar] [CrossRef] [Green Version]
- Zunger, A.; Wei, S.H.; Ferreira, L.G.; Bernard, J.E. Special quasirandom structures. Phys. Rev. Lett. 1990, 65, 353. [Google Scholar] [CrossRef] [PubMed] [Green Version]
- Grau-Crespo, R.; Hamad, S.; Catlow, C.R.A.; de Leeuw, N.H. Symmetry-adapted configurational modelling of fractional site occupancy in solids. J. Phys. Condens. Matter 2007, 19, 256201. [Google Scholar] [CrossRef]
- Mustapha, S.; D’Arco, P.; De La Pierre, M.; Noël, Y.; Ferrabone, M.; Dovesi, R. On the use of symmetry in configurational analysis for the simulation of disordered solids. J. Phys. Condens. Matter 2013, 25, 105401. [Google Scholar] [CrossRef] [PubMed]
- Okhotnikov, K.; Charpentier, T.; Cadars, S. Supercell program: A combinatorial structure-generation approach for the local-level modeling of atomic substitutions and partial occupancies in crystals. J. Cheminform. 2016, 8, 17. [Google Scholar] [CrossRef] [PubMed] [Green Version]
- Kresse, G.; Hafner, J. Ab initio molecular dynamics for liquid metals. Phys. Rev. B 1993, 47, 558. [Google Scholar] [CrossRef]
- Kresse, G.; Hafner, J. Ab initio molecular-dynamics simulation of the liquid-metal–amorphous-semiconductor transition in germanium. Phys. Rev. B 1994, 49, 14251. [Google Scholar] [CrossRef]
- Kresse, G.; Furthmüller, J. Efficiency of ab-initio total energy calculations for metals and semiconductors using a plane-wave basis set. Comput. Mater. Sci. 1996, 6, 15. [Google Scholar] [CrossRef]
- Blöchl, P.E. Projector augmented-wave method. Phys. Rev. B 1994, 50, 17953. [Google Scholar] [CrossRef] [Green Version]
- Kresse, G.; Joubert, D. From ultrasoft pseudopotentials to the projector augmented-wave method. Phys. Rev. B 1999, 59, 1758. [Google Scholar] [CrossRef]
- Chen, S.; Gong, X.G.; Walsh, A.; Wei, S.H. Crystal and electronic band structure of Cu2ZnSnX4 (X = S and Se) photovoltaic absorbers: First-principles insights. Appl. Phys. Lett. 2009, 94, 041903. [Google Scholar] [CrossRef] [Green Version]
- Le Roux, S.; Jund, P. Ring statistics analysis of topological networks: New approach and application to amorphous GeS2 and SiO2 systems. Comp. Mat. Sci. 2010, 49, 70. [Google Scholar] [CrossRef]
- Bennett, L.; Melchers, B.; Proppe, B. Curta: A General-Purpose High-Performance Computer at ZEDAT; Freie Universität Berlin: Berlin, Germany, 2020. [Google Scholar] [CrossRef]
Figure 1.
Cu, Zn, and Sn cation planes with and (bottom to top) in the (a) ordered kesterite (space group , no. 82) and (b) disordered kesterite (space group , no. 121) crystal structures, respectively. The dashed lines in the disordered kesterite structure (b) denote additional symmetry elements due to the total Cu-Zn disorder in the and planes. Also given are the colour-coded Wyckoff positions for each of the structural polymorphs. The crystal structure figures have been prepared using VESTA [21].

Figure 2.
(a) Total energy curves for the kesterite crystal structure of CuZnSnSe calculated by means of the SCAN (black) and the hybrid HSE06 (green) exchange and correlation functionals. In addition, the total energy curve obtained by the newly devised approach to speed up hybrid functional calculations is shown (red). (b) Comparison of the obtained ground state volumes with respect to experiment [2].

Figure 3.
2 × 1 × 1 supercells depicting the 10 symmetry inequivalent cation distributions of Cu (red) and Zn (green) over the (2c) and (2d) Wyckoff positions as generated by the supercell program of Okhotnikov et al. [37]. The lowest supercell depicts the ordered kesterite crystal structure, and the total energy differences are given in meV and per formula unit for CZTSe including the respective degeneracy of the supercell in square brackets. Utilising the newly devised method to speed-up hybrid functional calculations resulted in total energy curves, as shown in the middle figure, where the grey lines correspond to the 10 symmetry inequivalent cation distributions, the dashed green line is their weighted average, and the dashed red line shows the result from the ordered kesterite crystal structure for comparison. The crystal structure figures have been prepared using VESTA [21].

Figure 4.
Diffraction patterns for the ground state crystal structures of the ordered (black) and disordered (red) kesterite crystal structures, simulated using VESTA [21] and employing wavelengths according to (a) X-ray and (b) neutron diffraction. (c) Distribution function analyses for selected bond lengths, again for the ordered (black) and disordered (red) kesterite crystal structures, respectively.

Figure 5.
(a) Density of states for the ordered (upper panel) and disordered (lower panel) kesterite crystal structures, showing the total DOS as a shaded grey background, and the Cu (4d), Sn (2b), and Se (8i) partial DOSs in red, black, and green, respectively. (b) Absorption coefficients for the ordered (black) and disordered (red) kesterite crystal structures. In case of the disordered kesterite, the contributions show the weighted averages of the 10 symmetry inequivalent cation arrangements.

Publisher’s Note: MDPI stays neutral with regard to jurisdictional claims in published maps and institutional affiliations. |
© 2022 by the author. Licensee MDPI, Basel, Switzerland. This article is an open access article distributed under the terms and conditions of the Creative Commons Attribution (CC BY) license (https://creativecommons.org/licenses/by/4.0/).
Share and Cite
MDPI and ACS Style
Fritsch, D. Revisiting the Cu-Zn Disorder in Kesterite Type Cu2ZnSnSe4 Employing a Novel Approach to Hybrid Functional Calculations. Appl. Sci. 2022, 12, 2576. https://0-doi-org.brum.beds.ac.uk/10.3390/app12052576
AMA Style
Fritsch D. Revisiting the Cu-Zn Disorder in Kesterite Type Cu2ZnSnSe4 Employing a Novel Approach to Hybrid Functional Calculations. Applied Sciences. 2022; 12(5):2576. https://0-doi-org.brum.beds.ac.uk/10.3390/app12052576
Chicago/Turabian StyleFritsch, Daniel. 2022. "Revisiting the Cu-Zn Disorder in Kesterite Type Cu2ZnSnSe4 Employing a Novel Approach to Hybrid Functional Calculations" Applied Sciences 12, no. 5: 2576. https://0-doi-org.brum.beds.ac.uk/10.3390/app12052576
Note that from the first issue of 2016, this journal uses article numbers instead of page numbers. See further details here.