
Investigation on the Influencing Factors of K0 of Granular Materials Using Discrete Element Modelling

 ,
,
Abstract
:1. Introduction
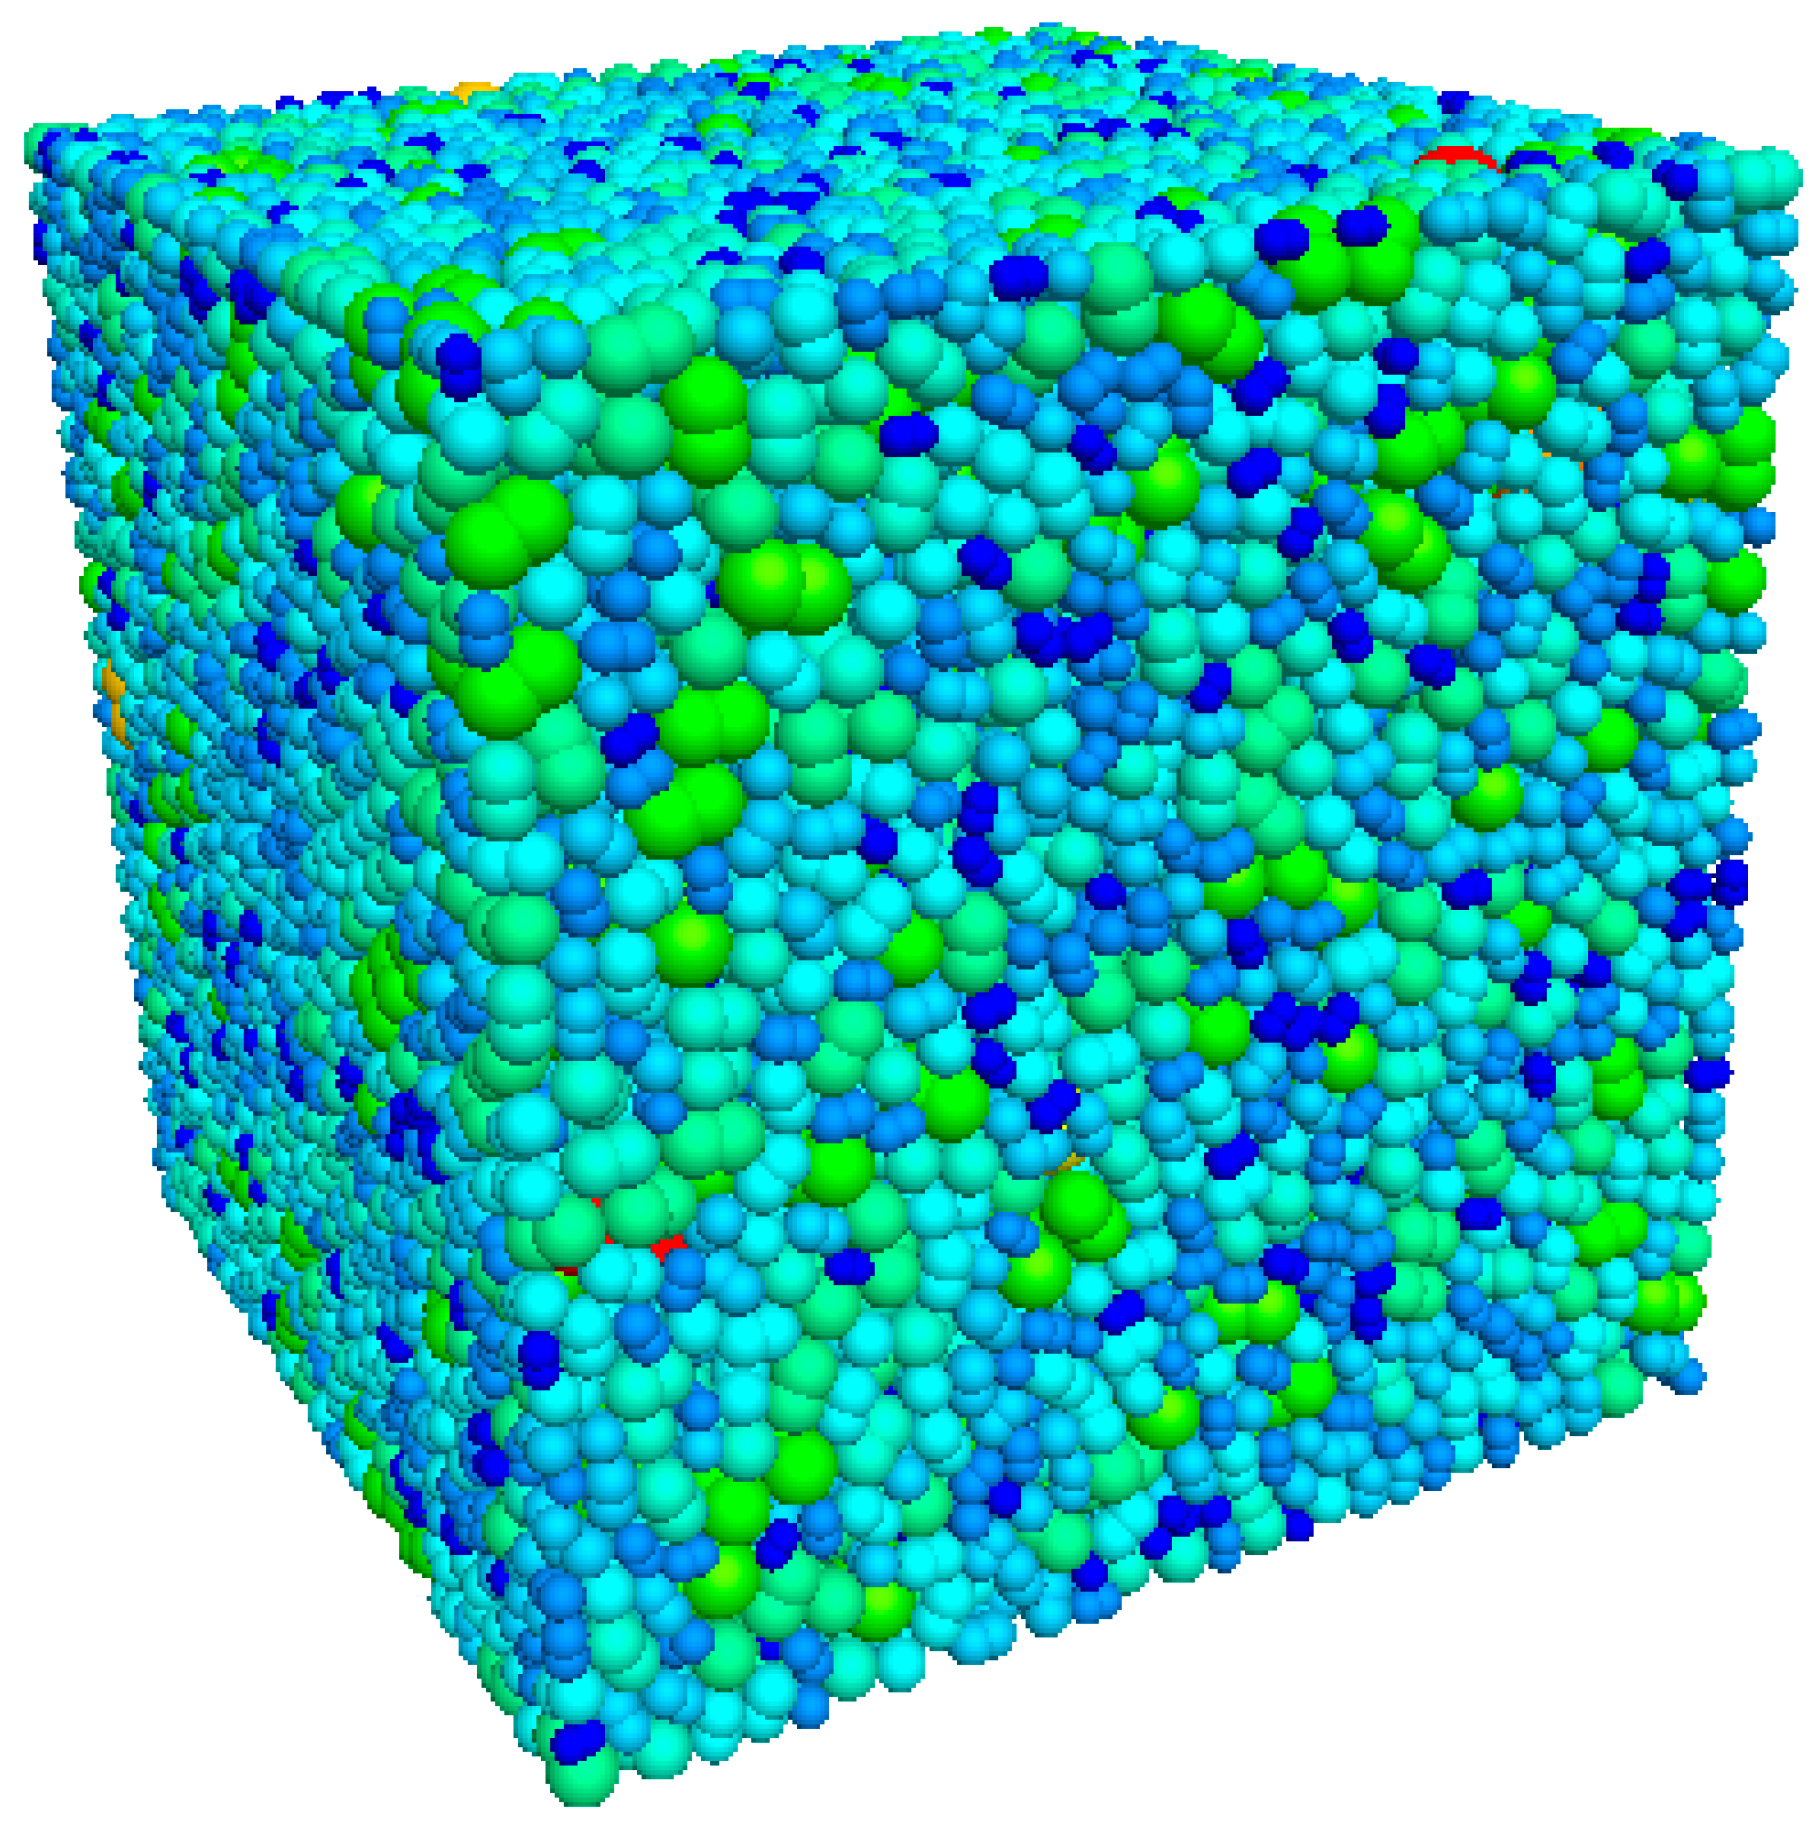
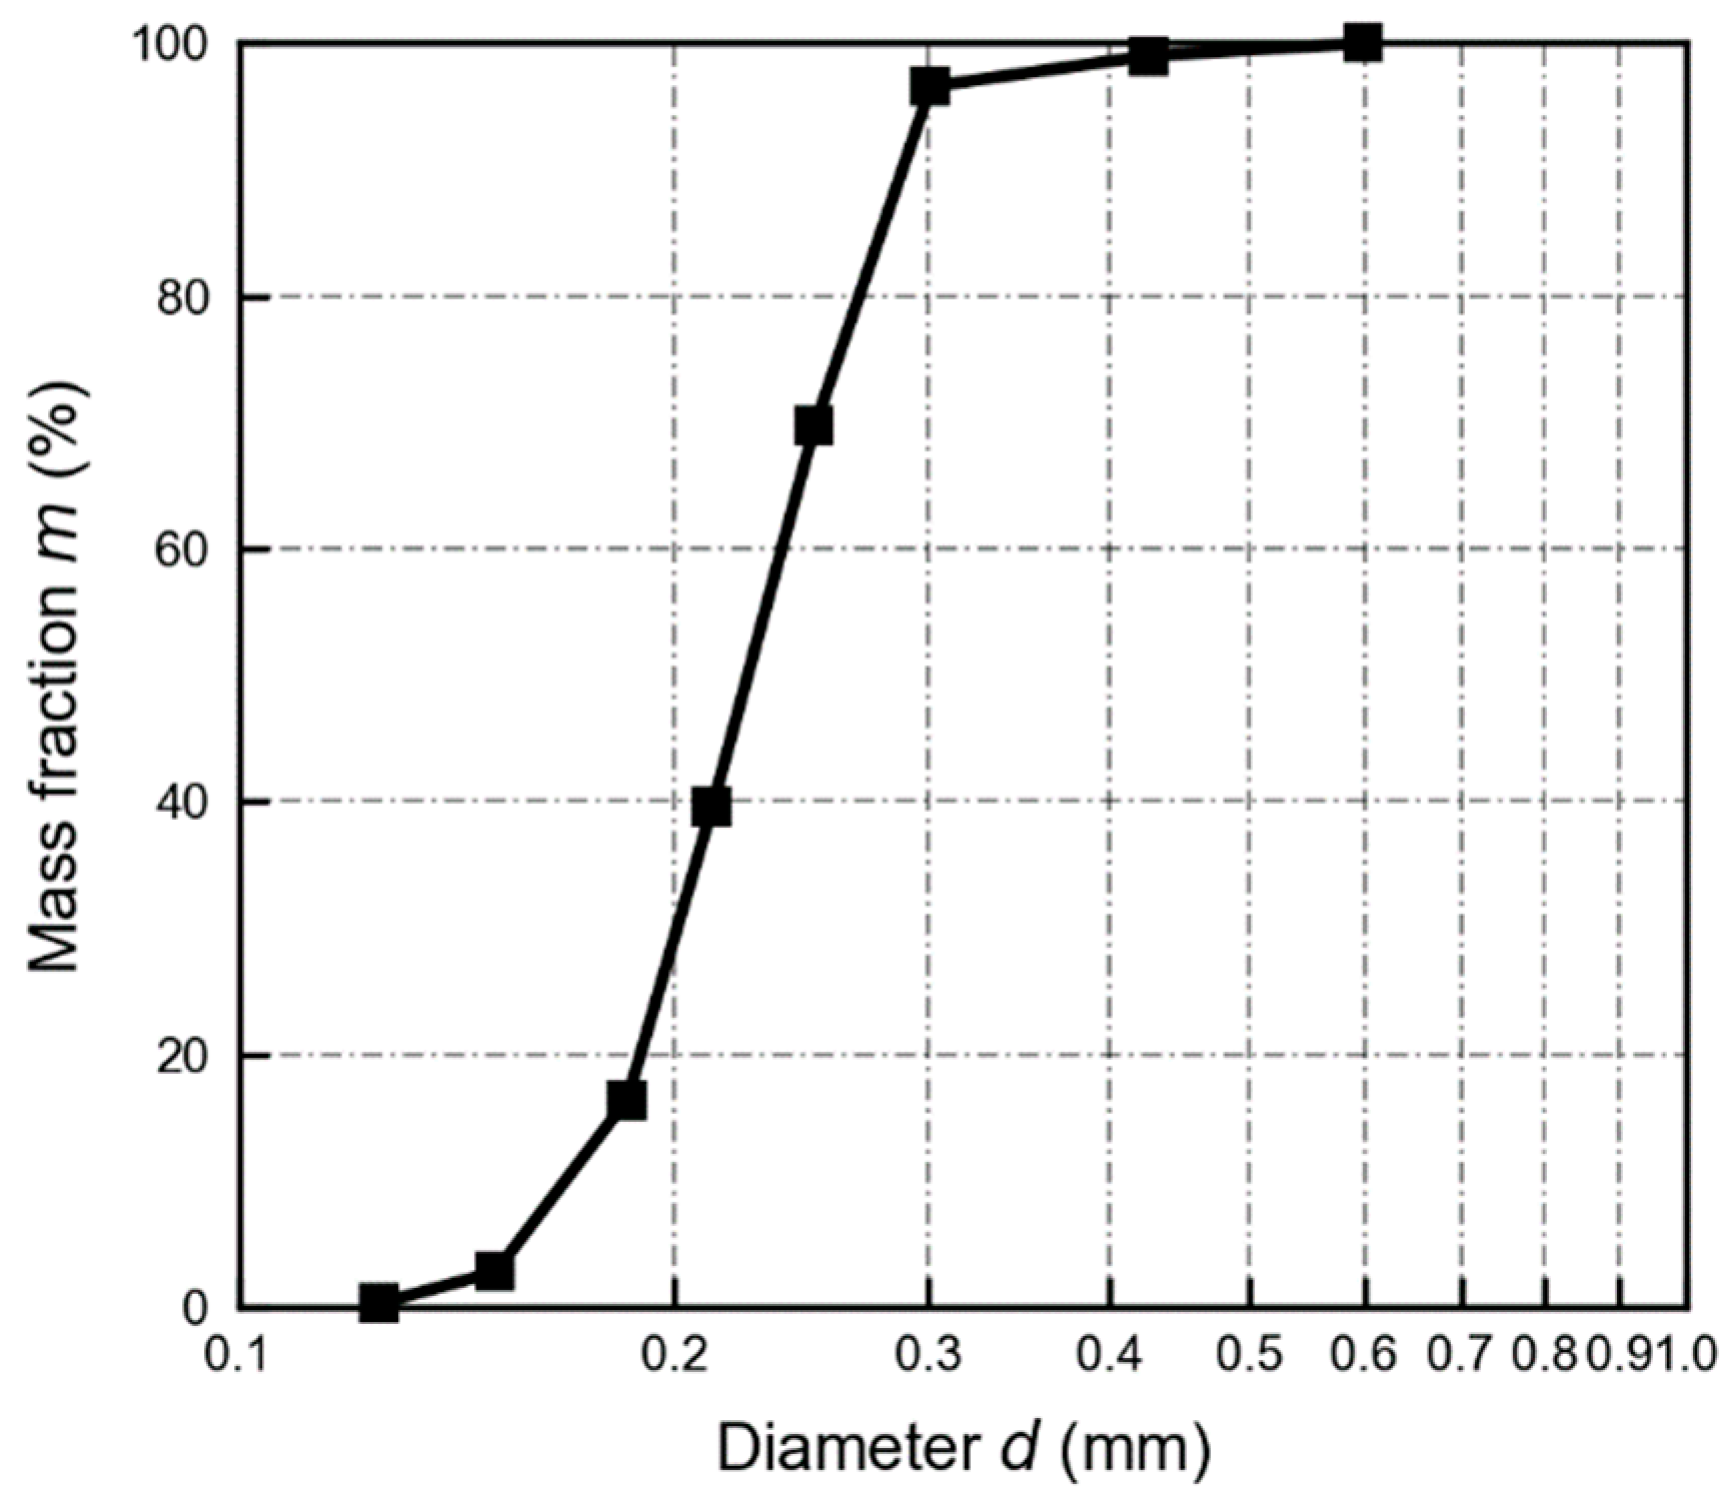
2. DEM Modelling
3. Influence of Inherent Anisotropy
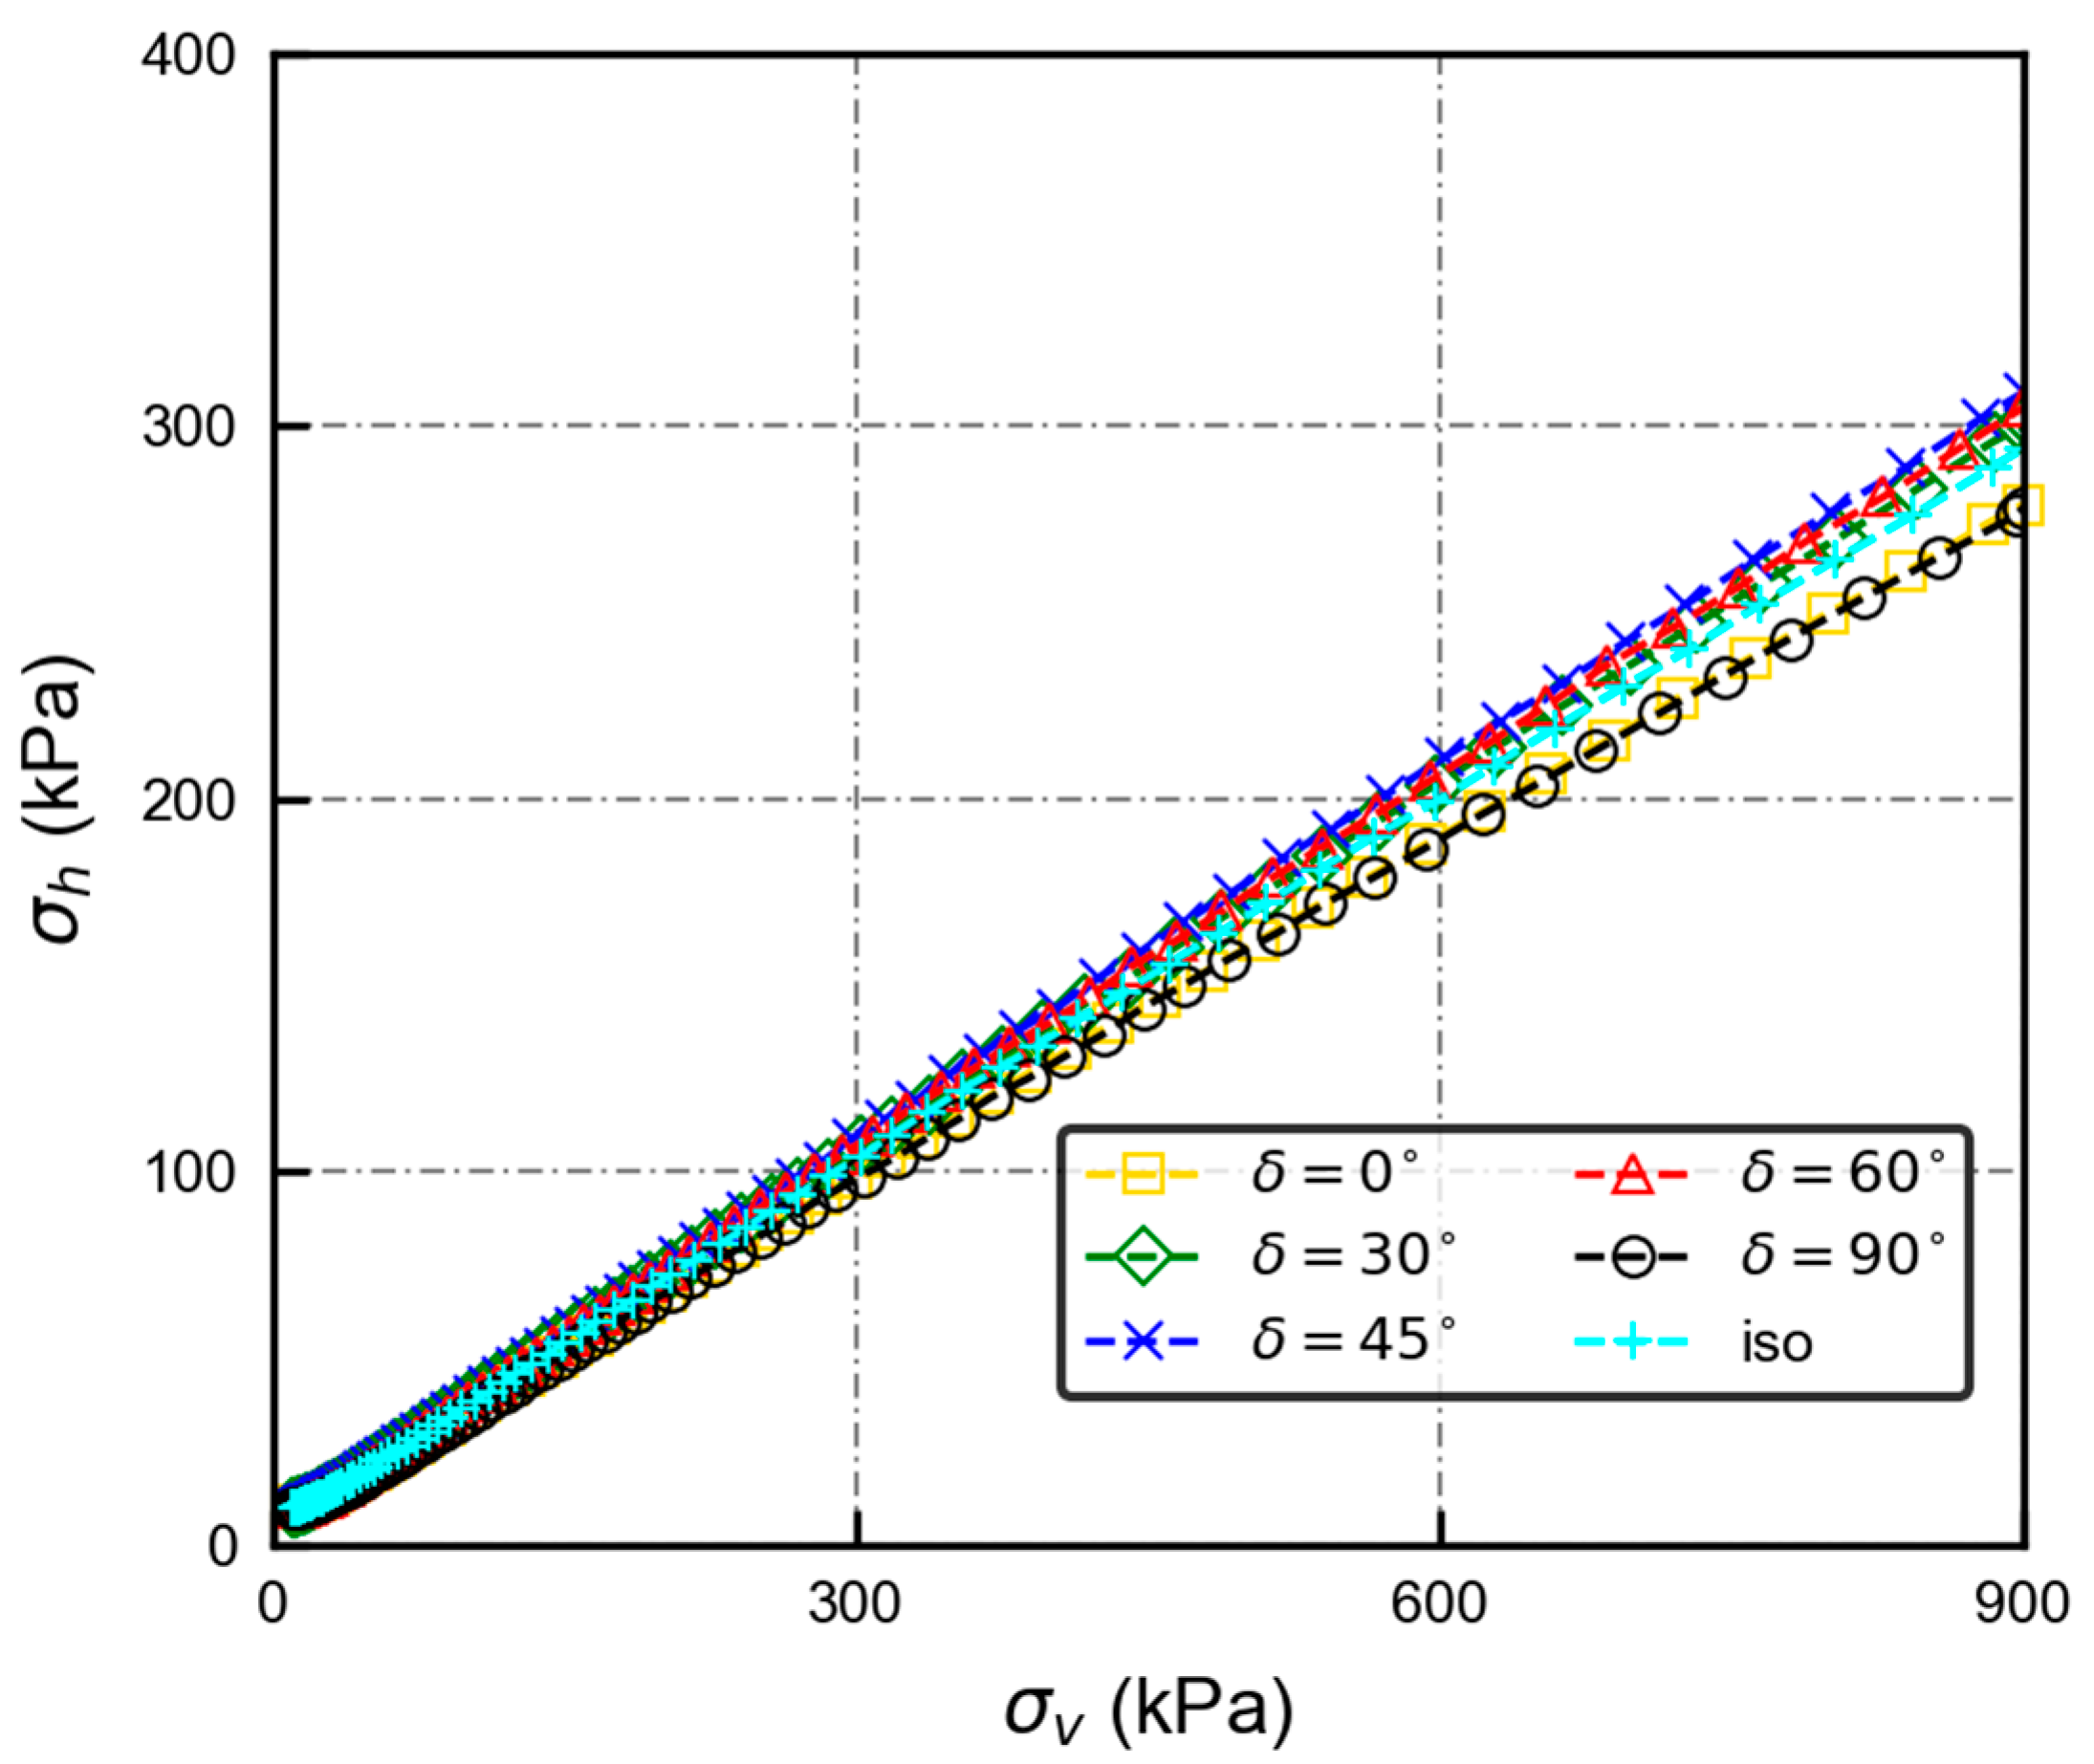
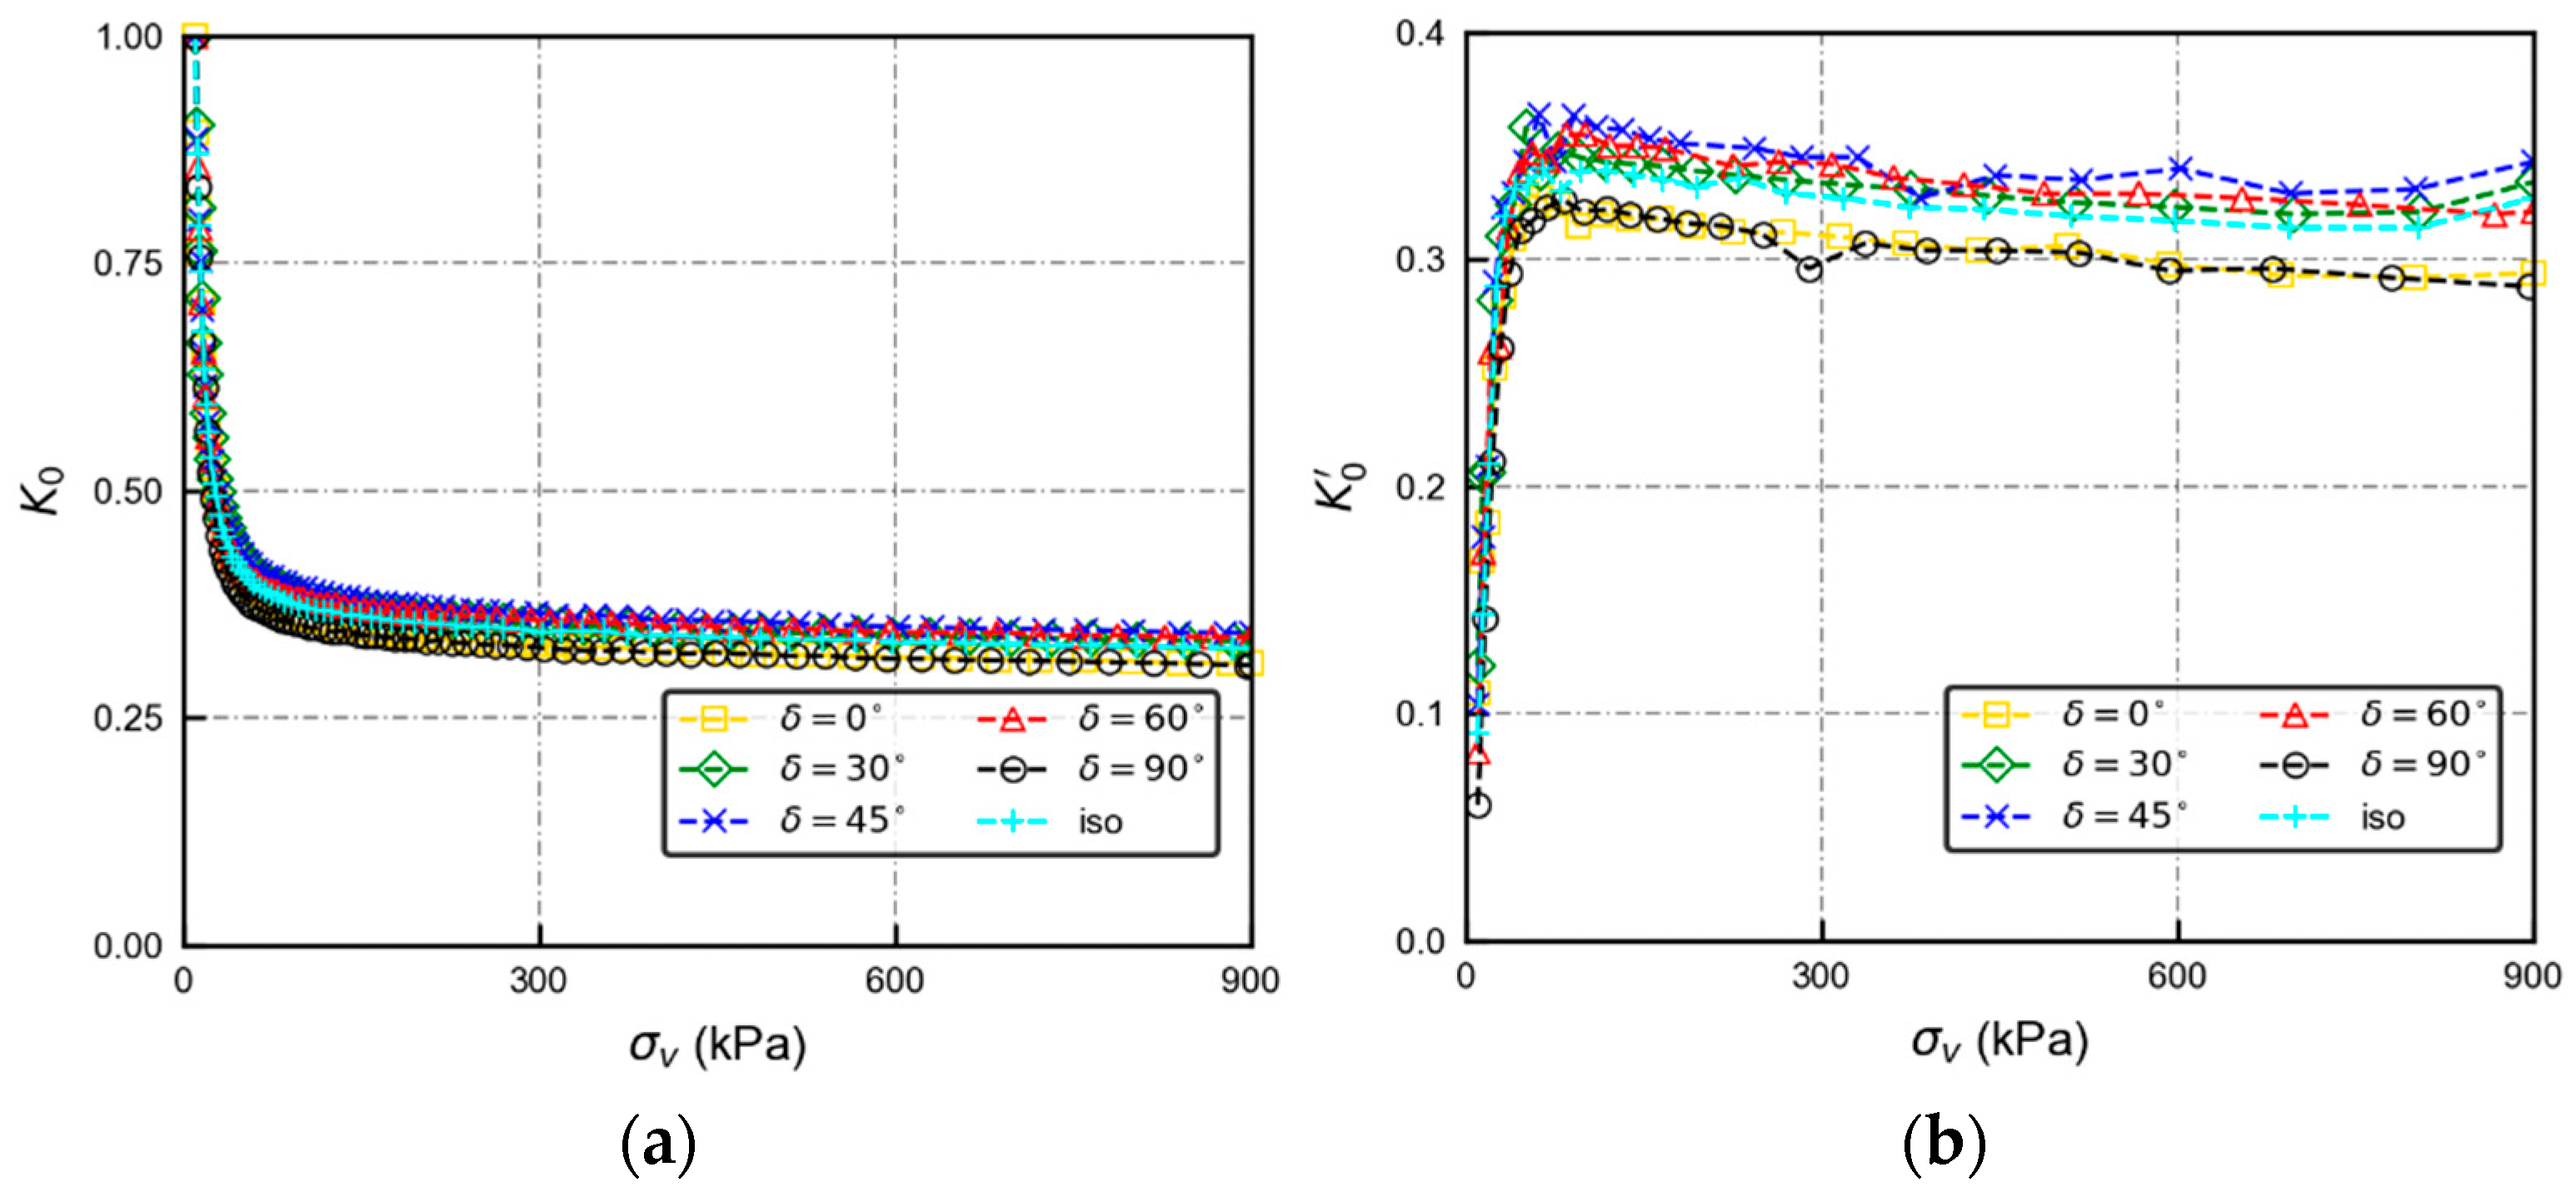
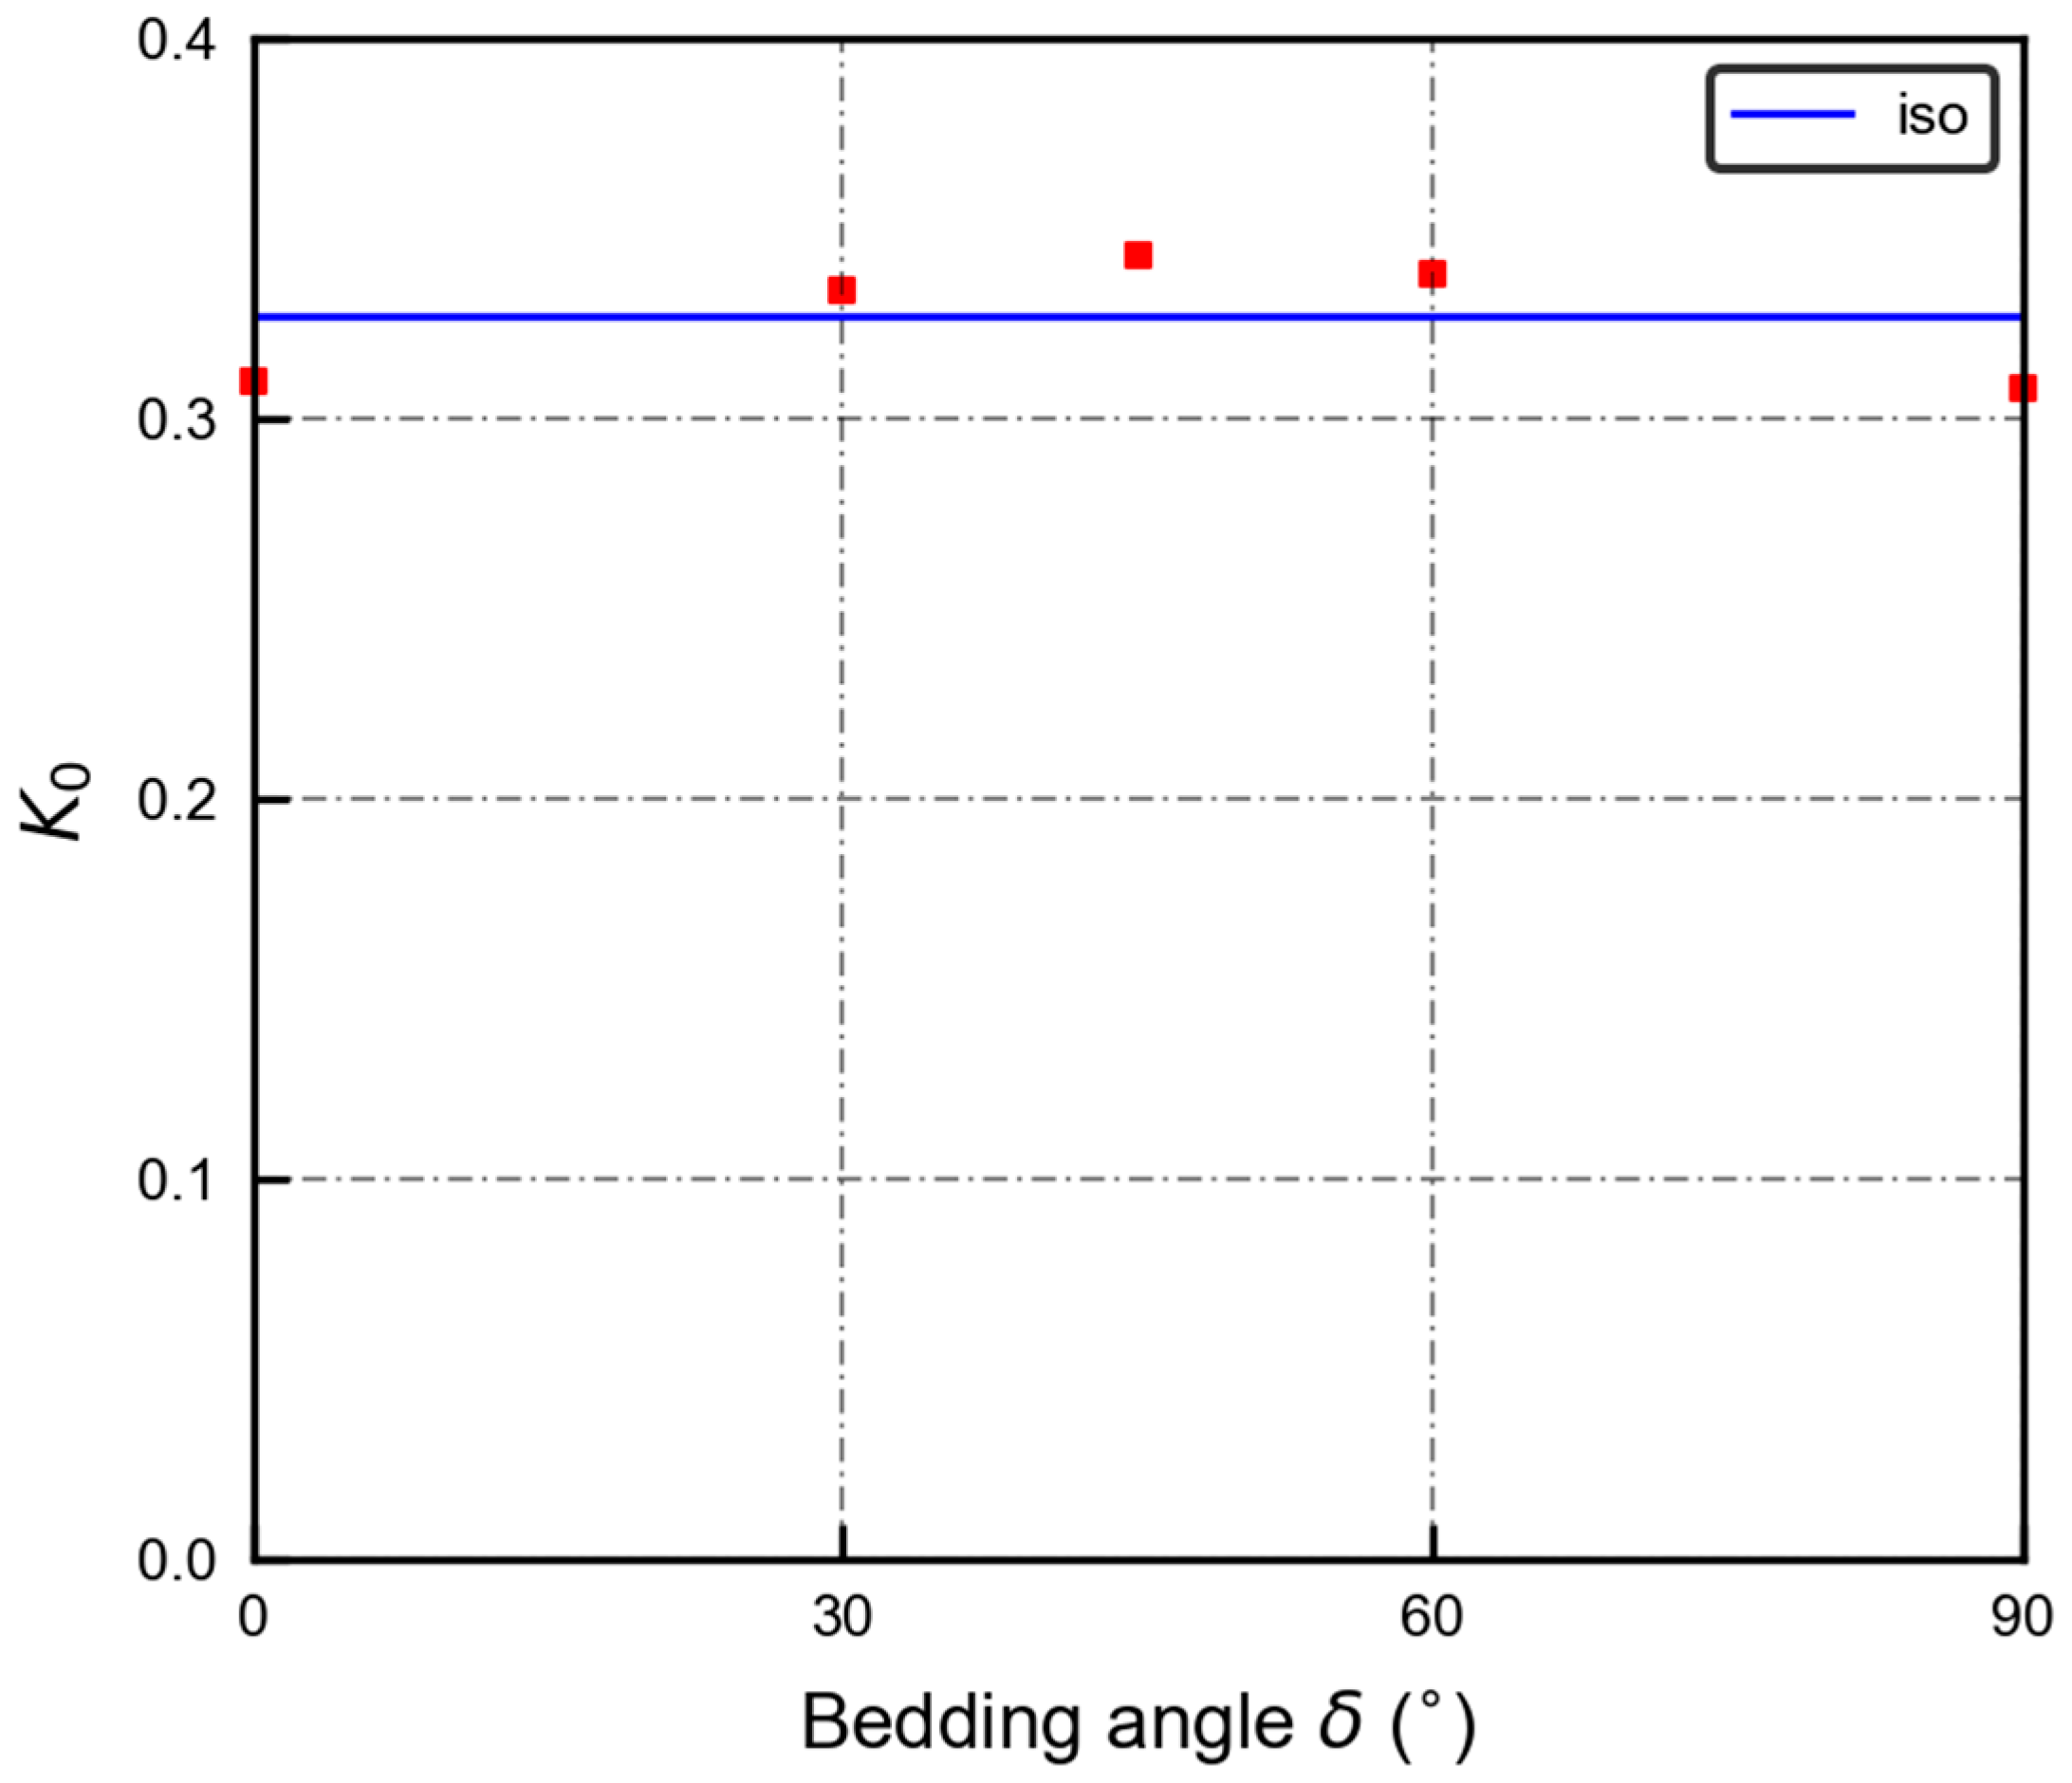
3.1. Macroscopic Results
3.2. Microscopic Results
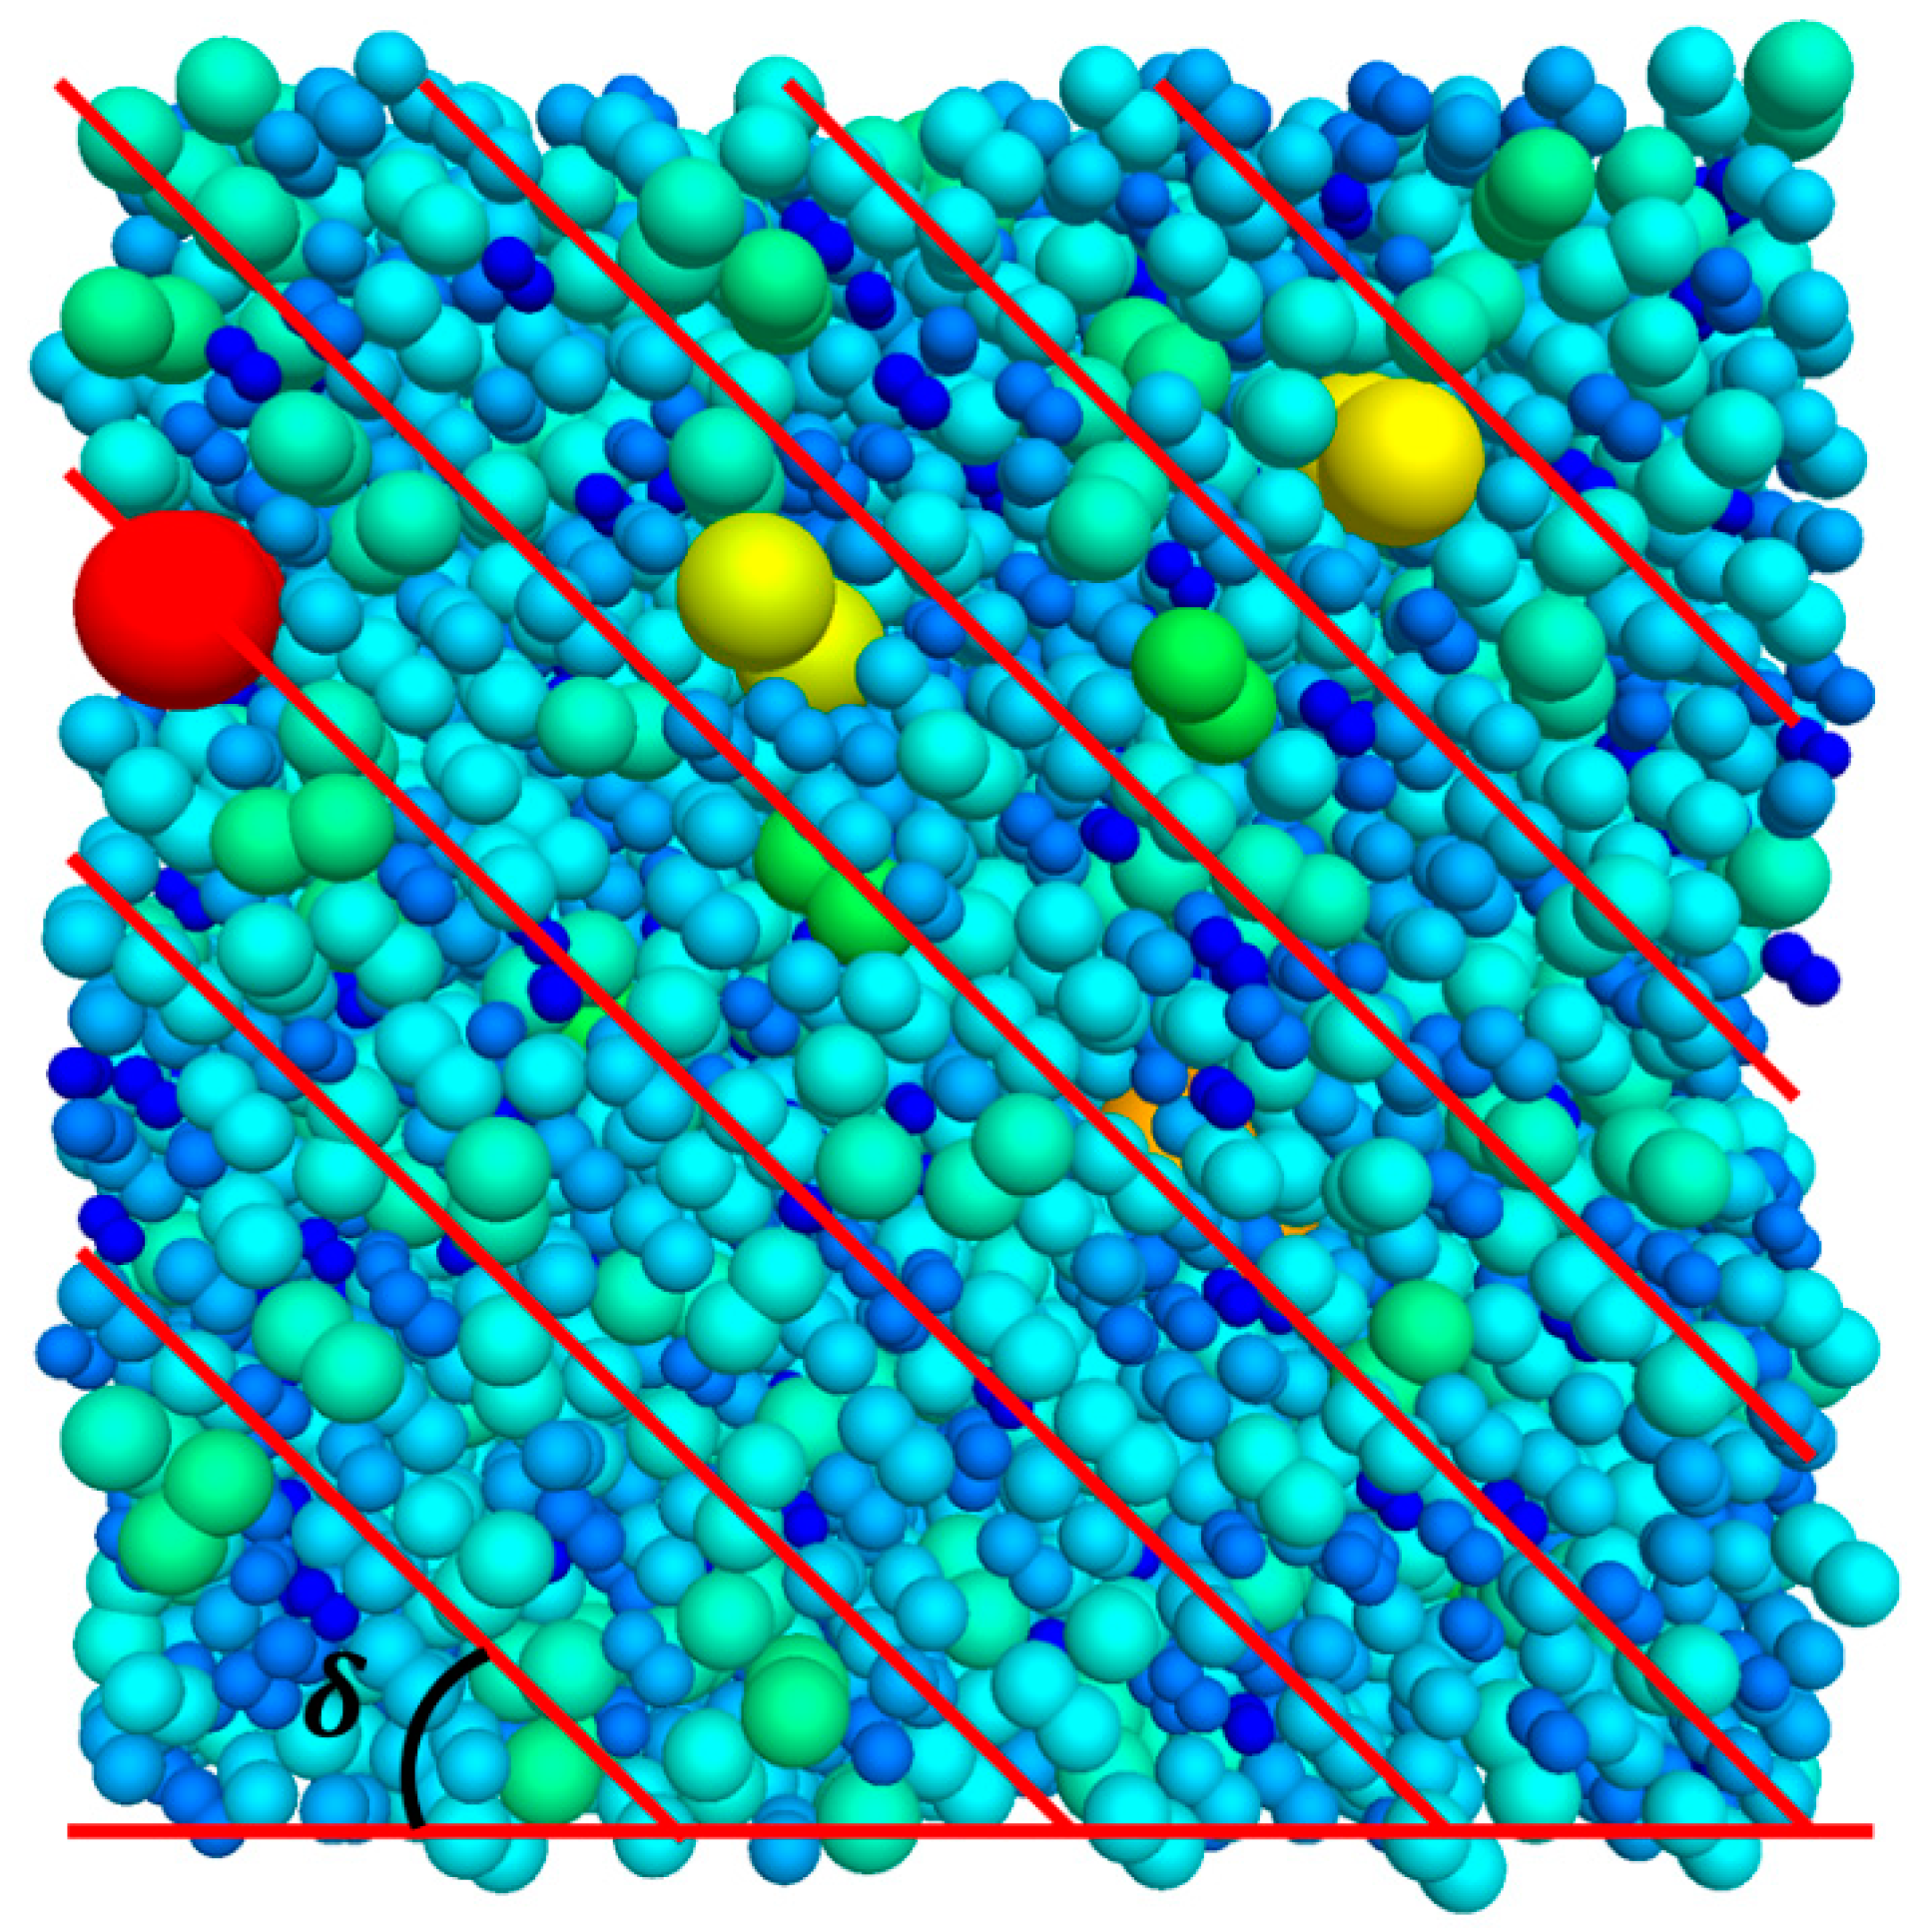
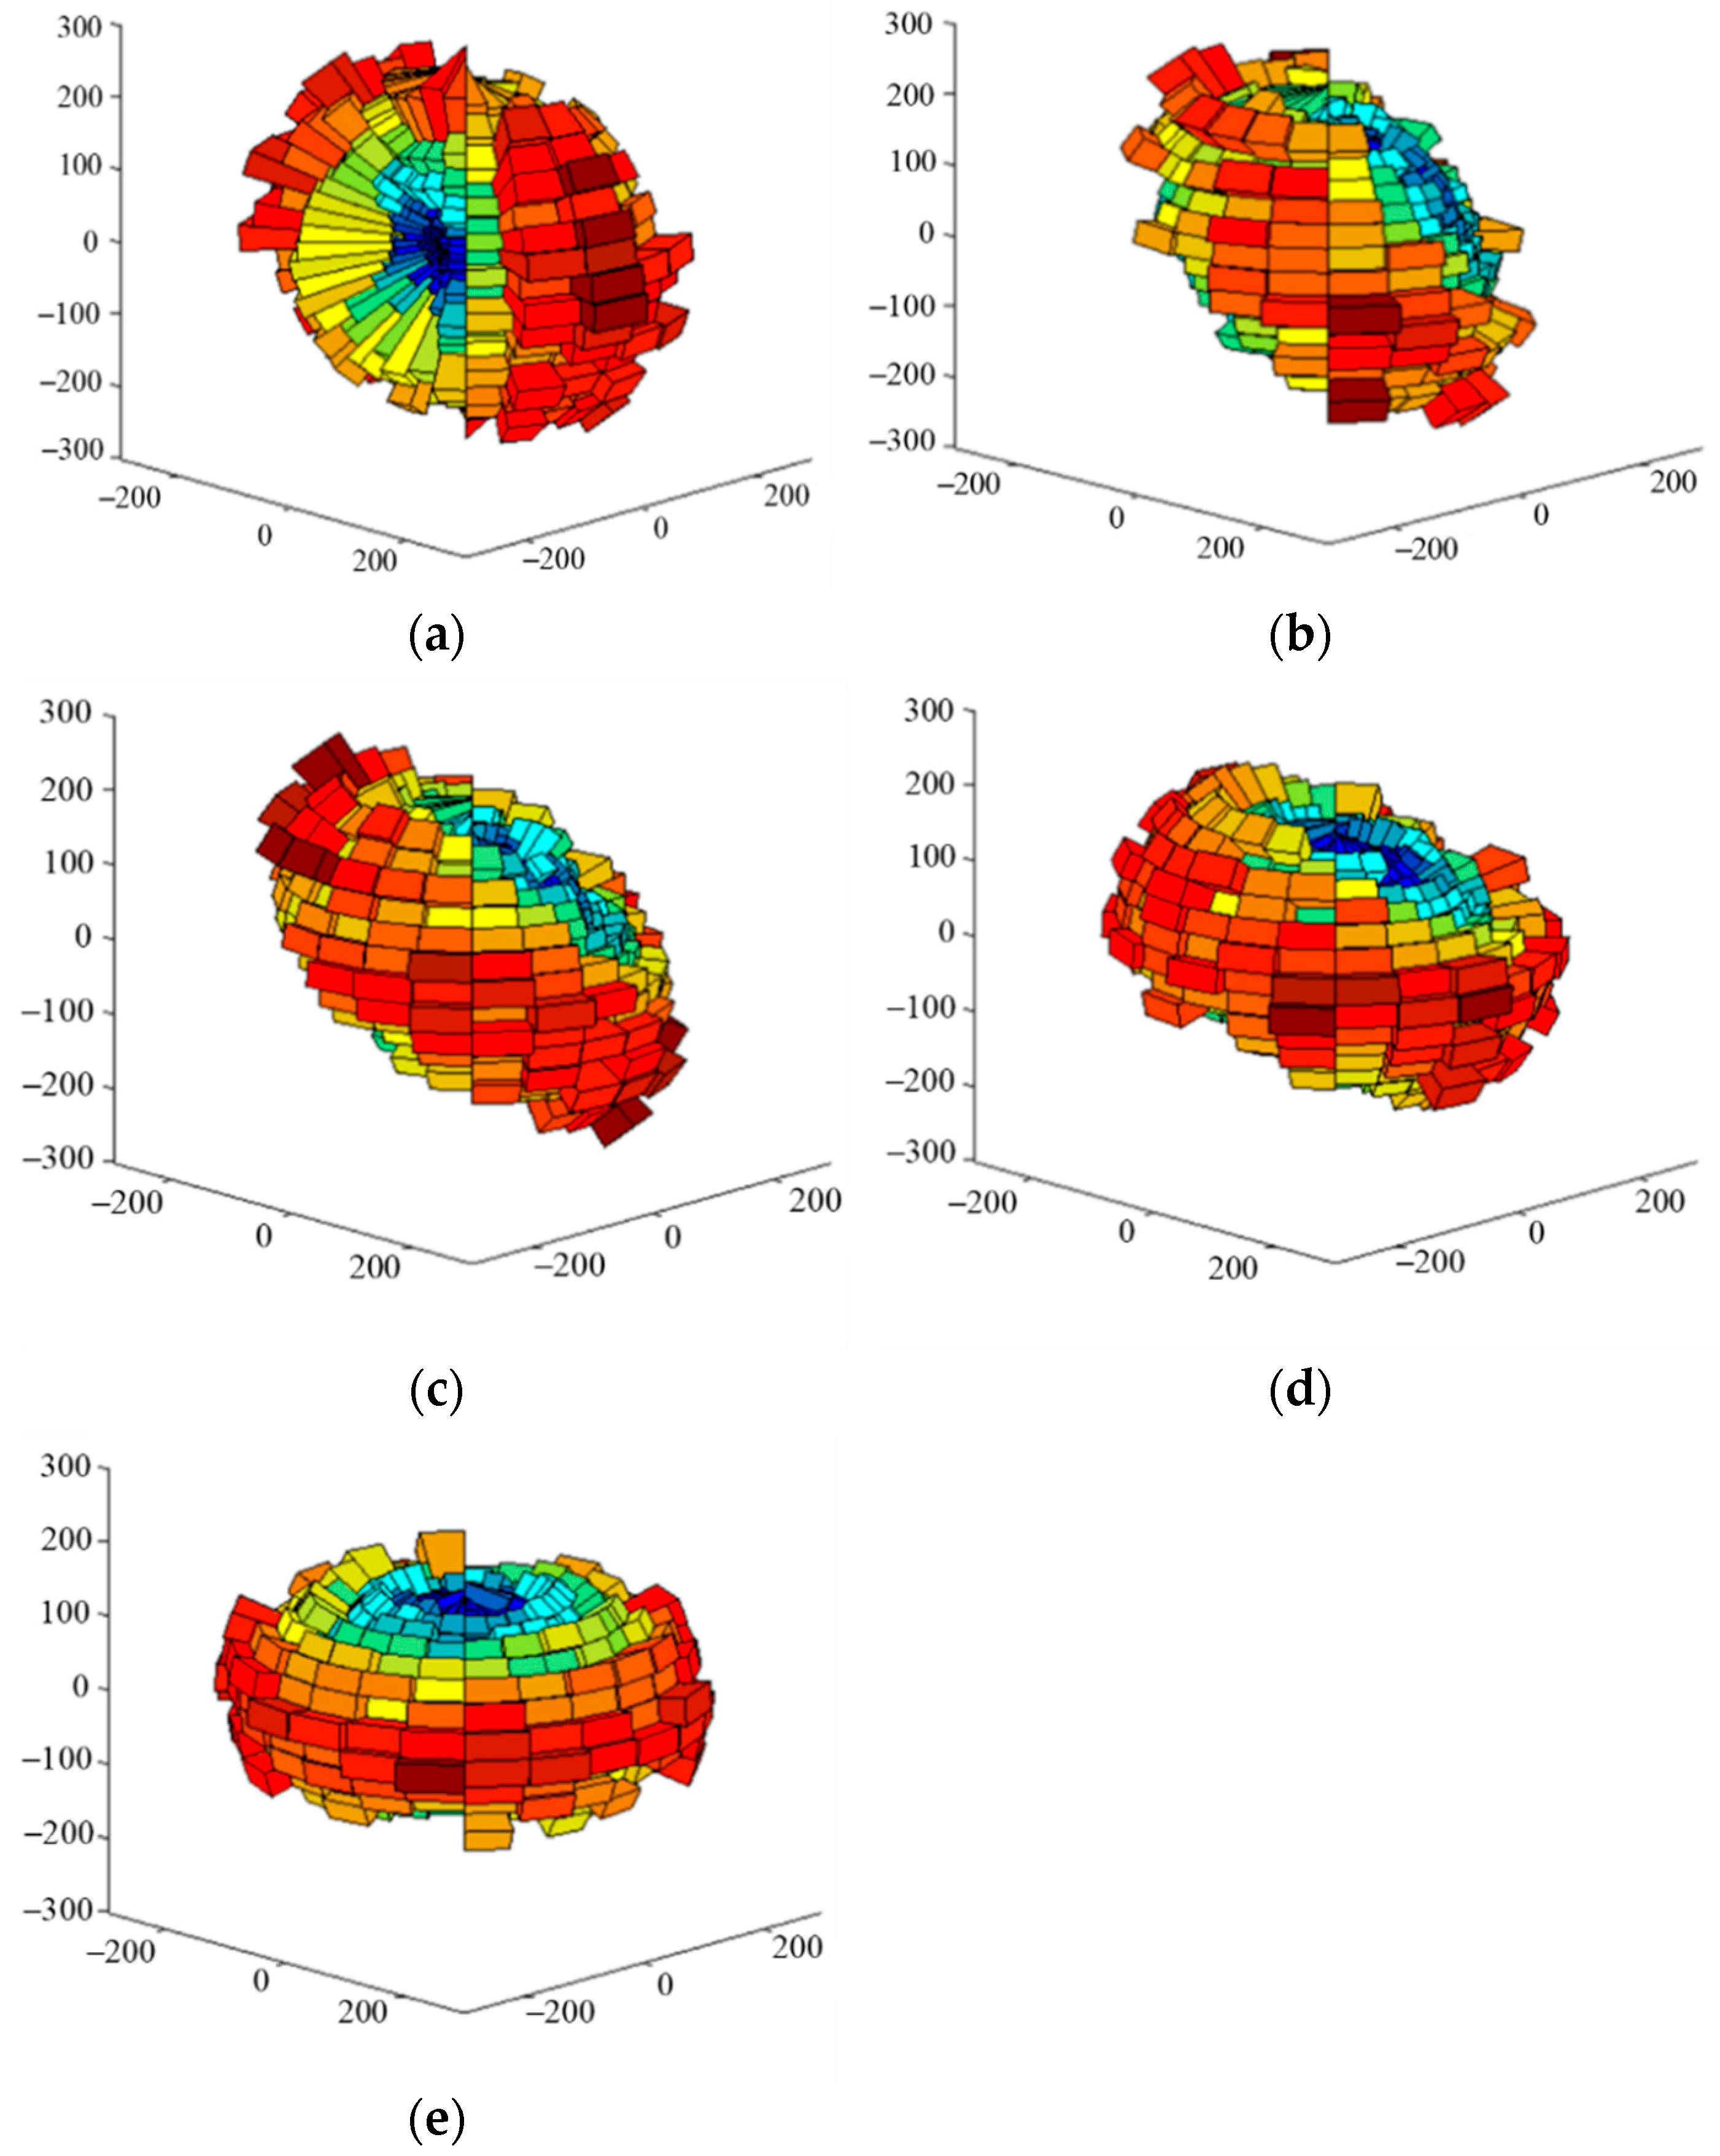
3.2.1. Fabric Anisotropy Description
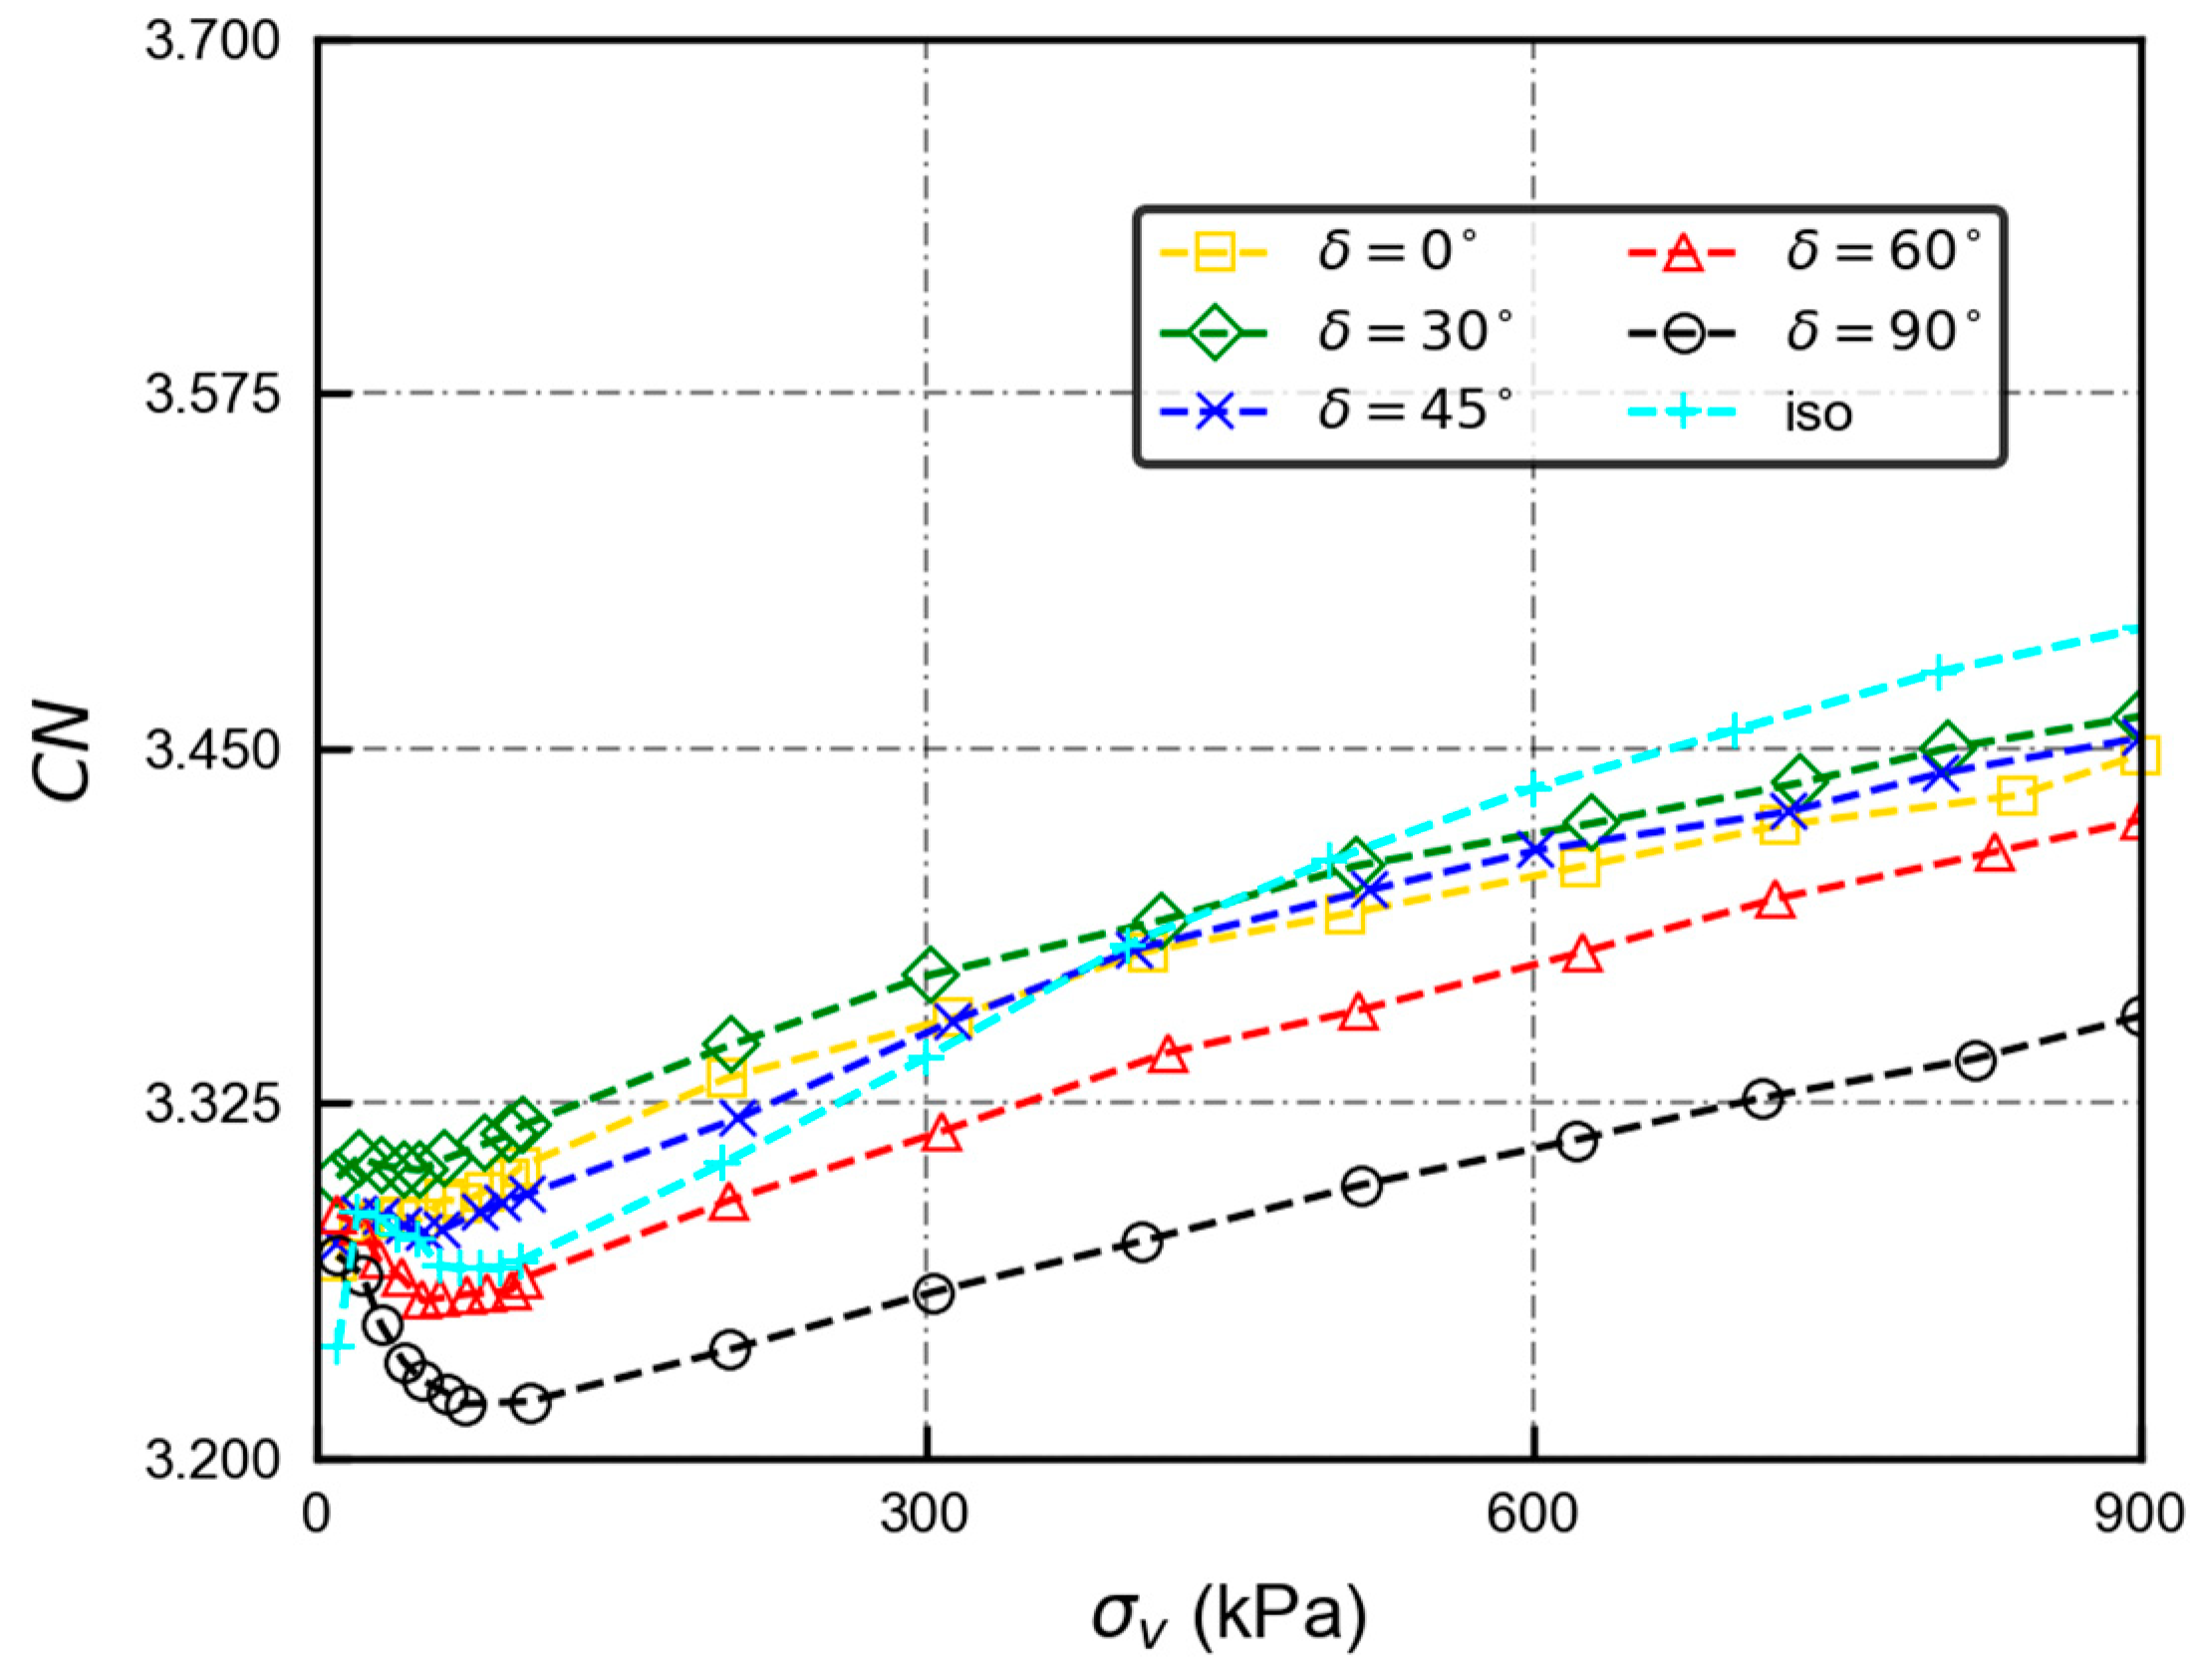
3.2.2. Evolution of Coordination Number
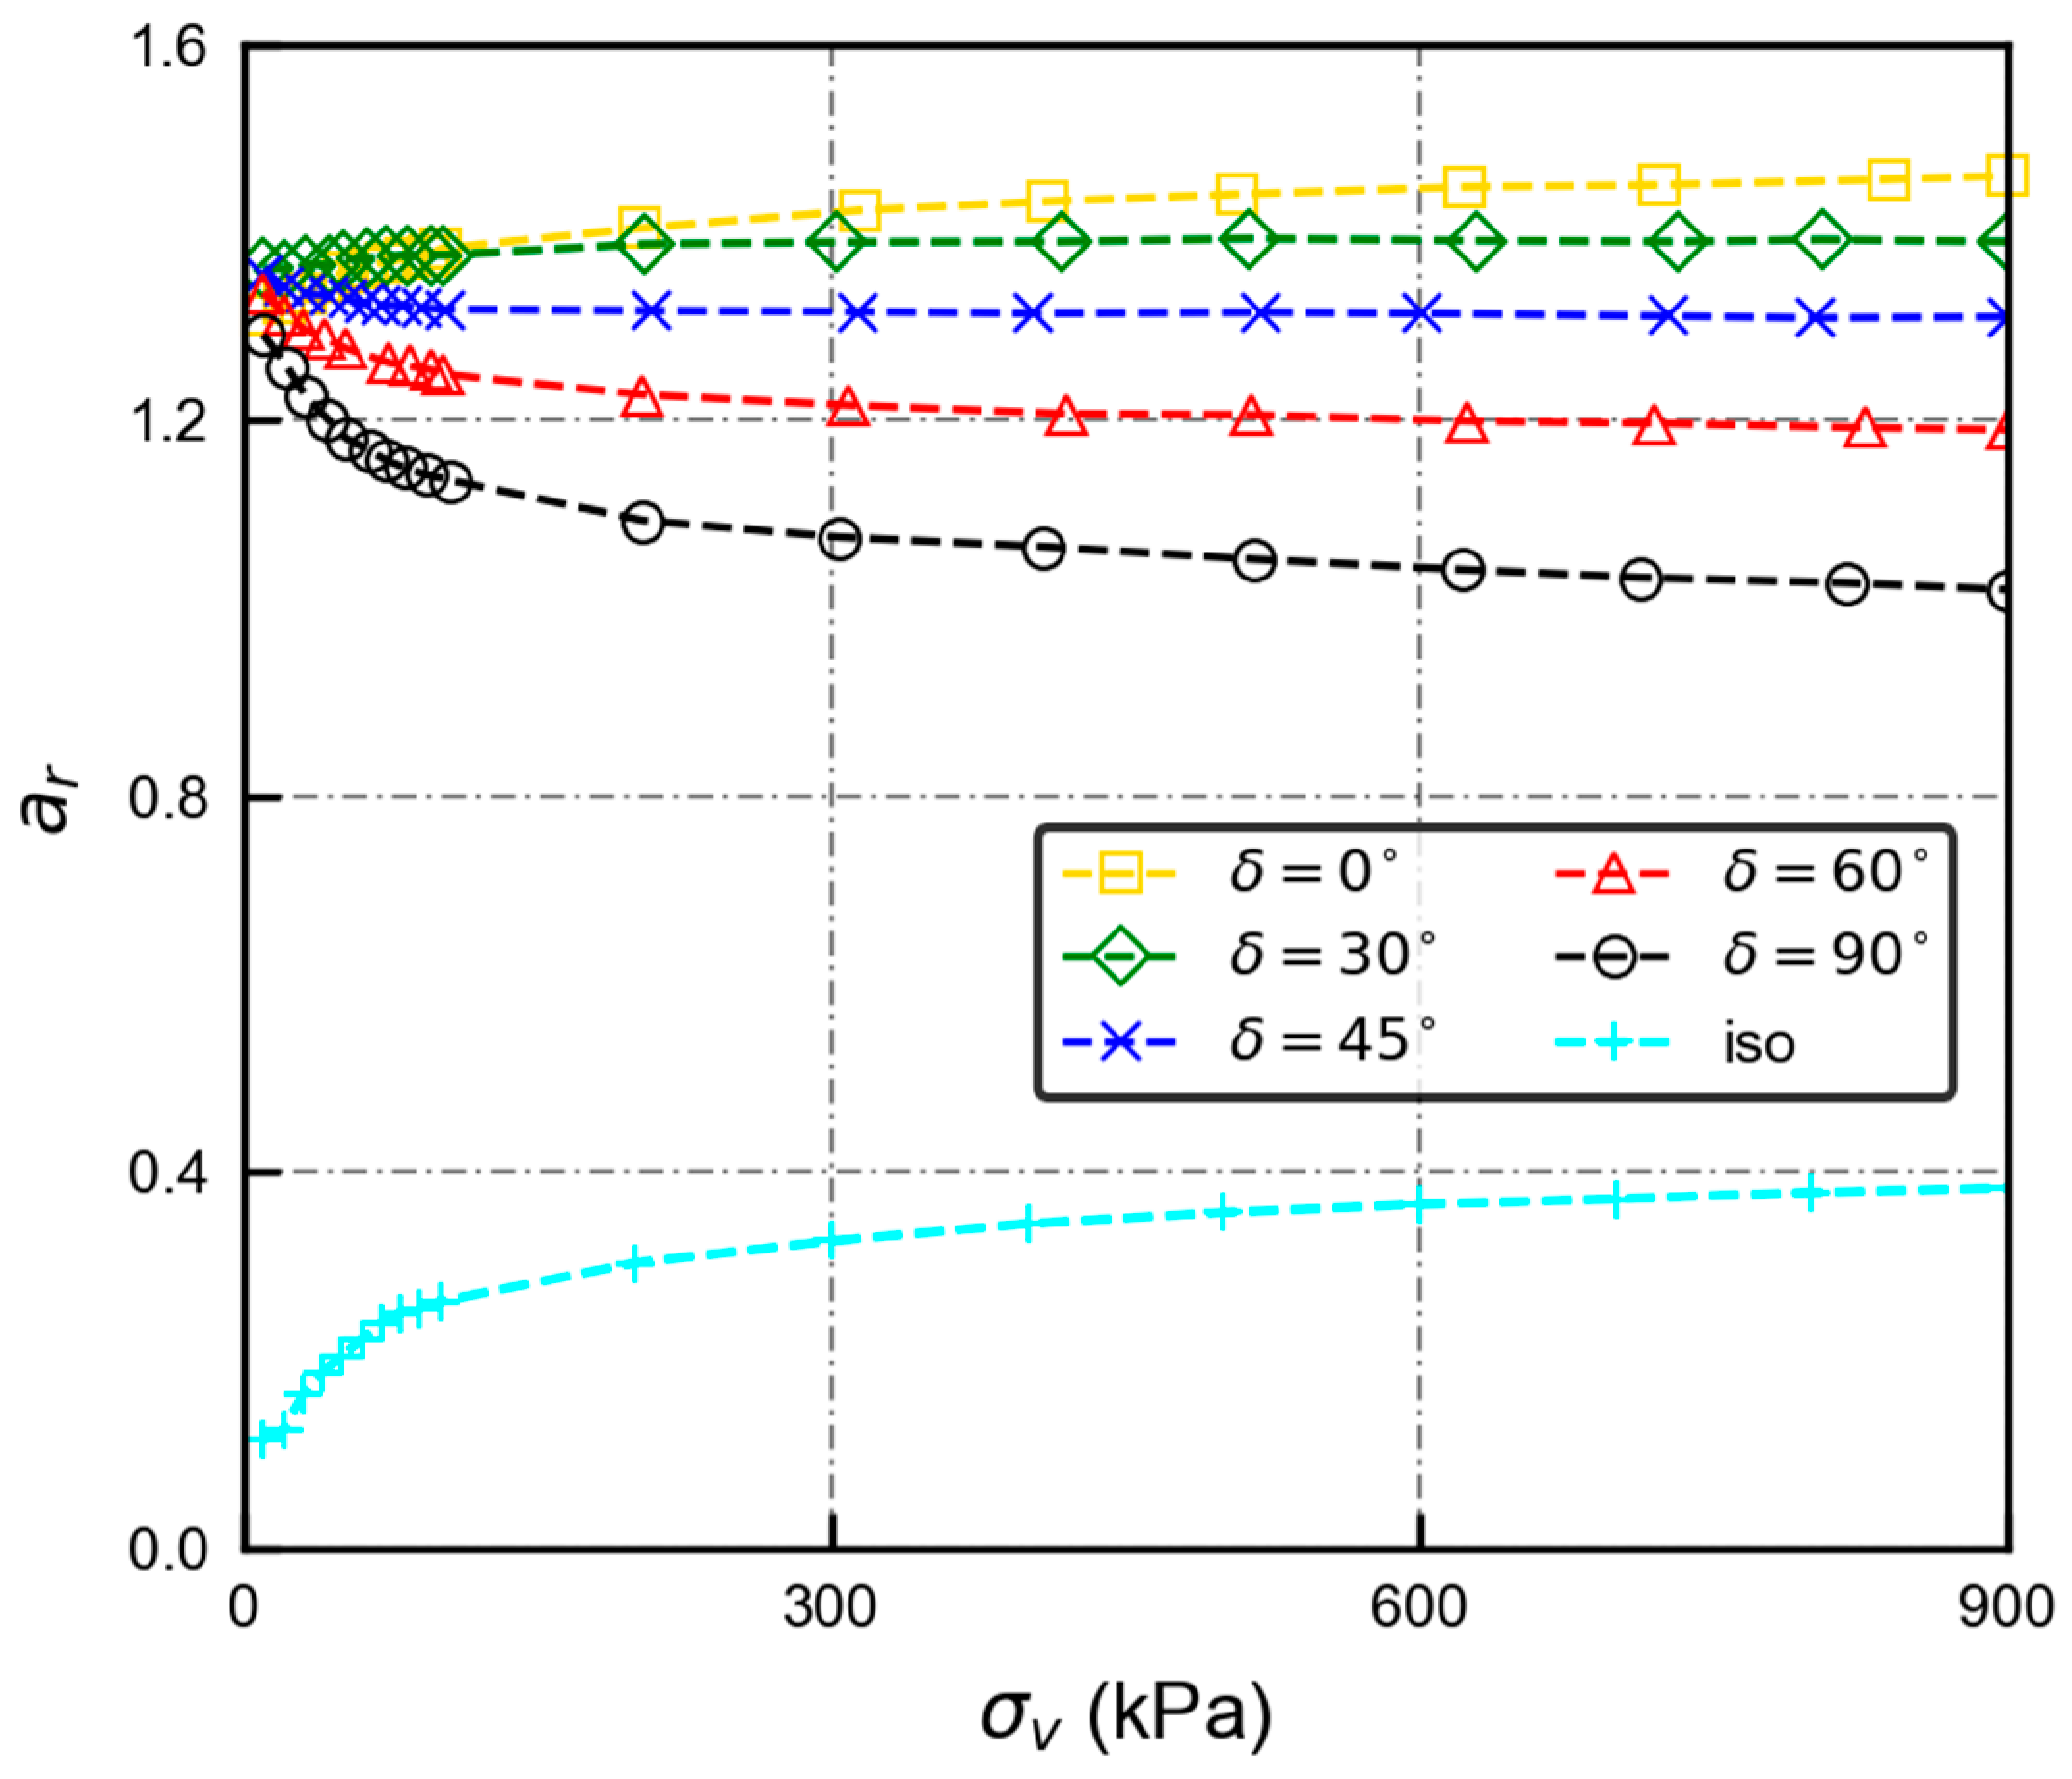
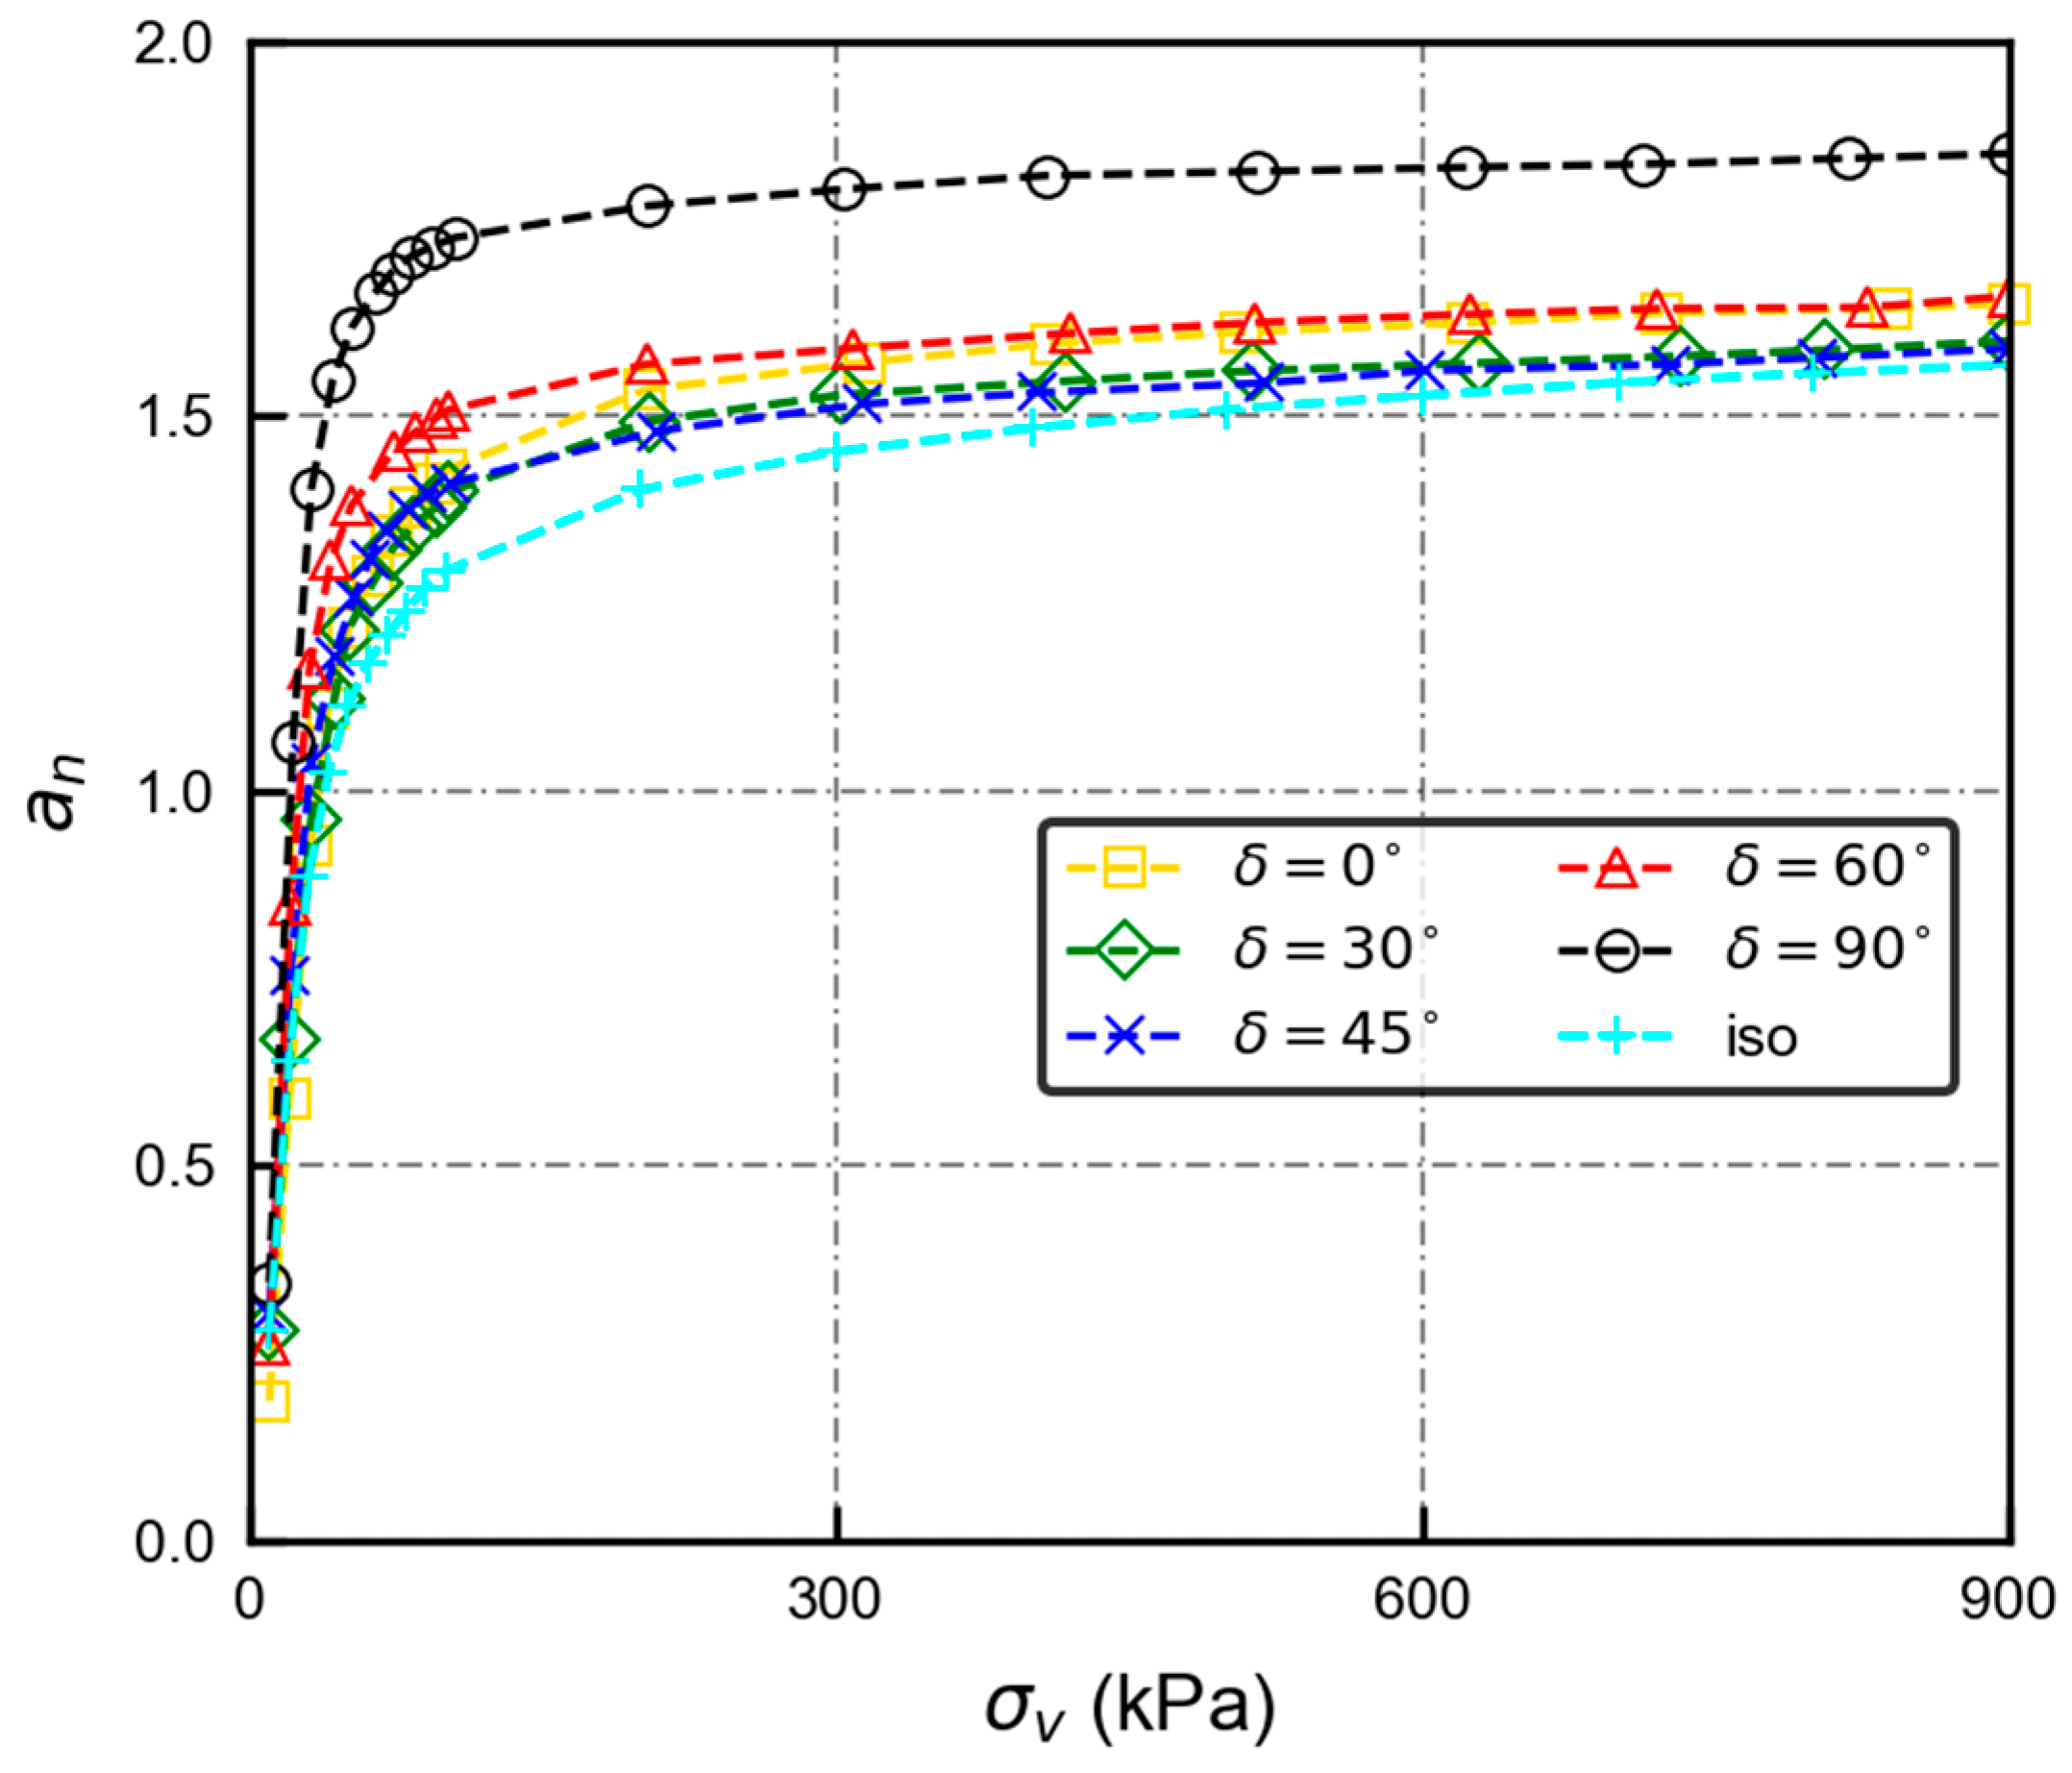
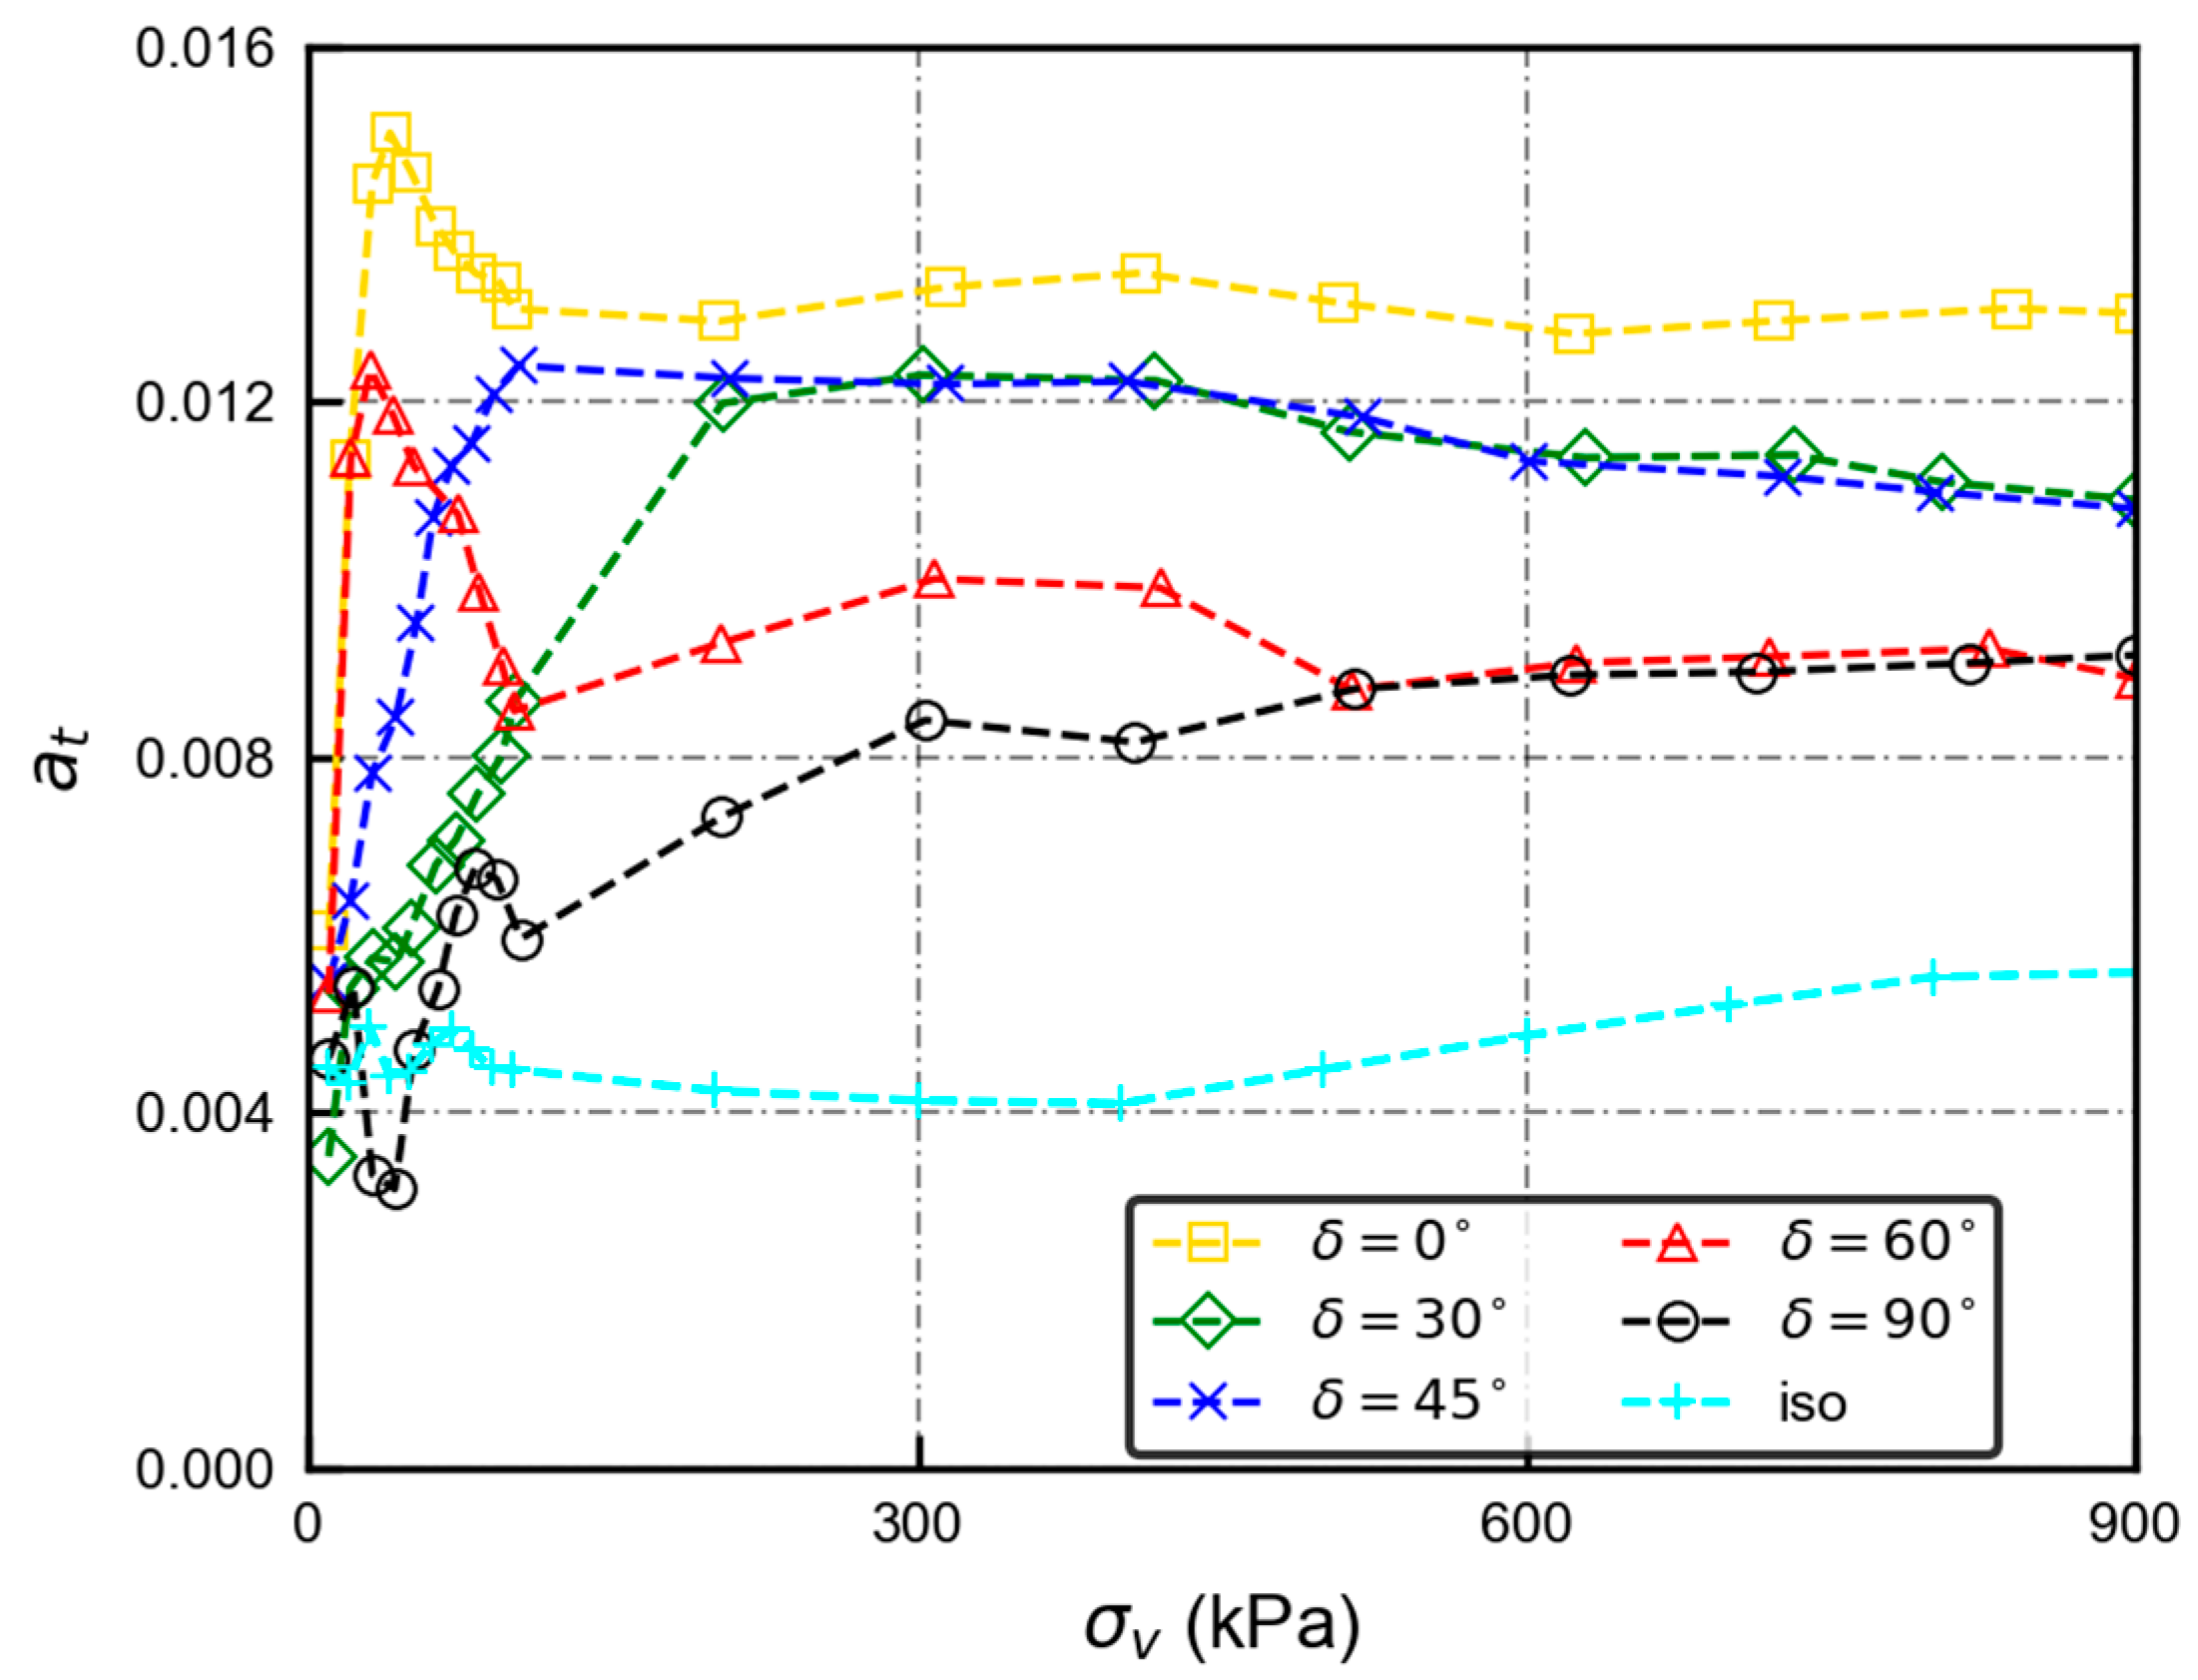
3.2.3. Evolution of Anisotropy
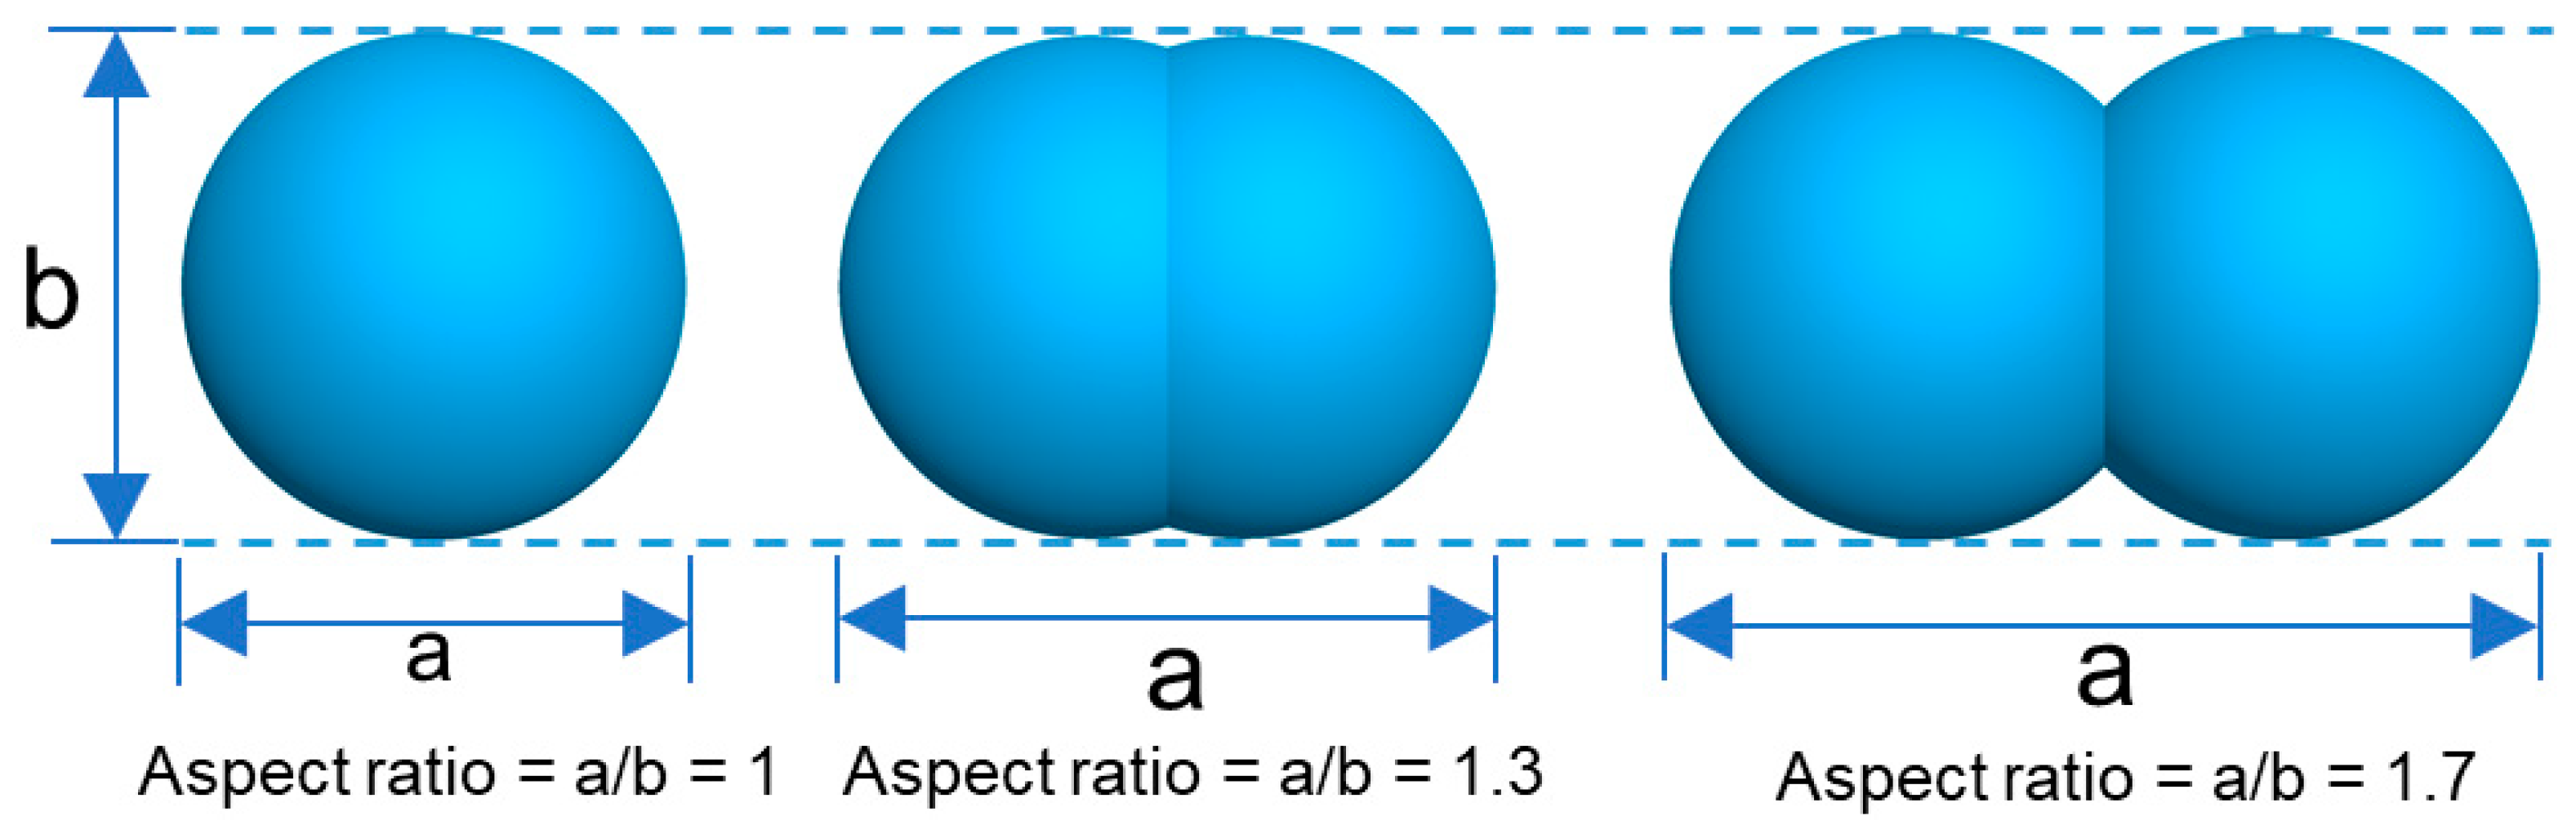
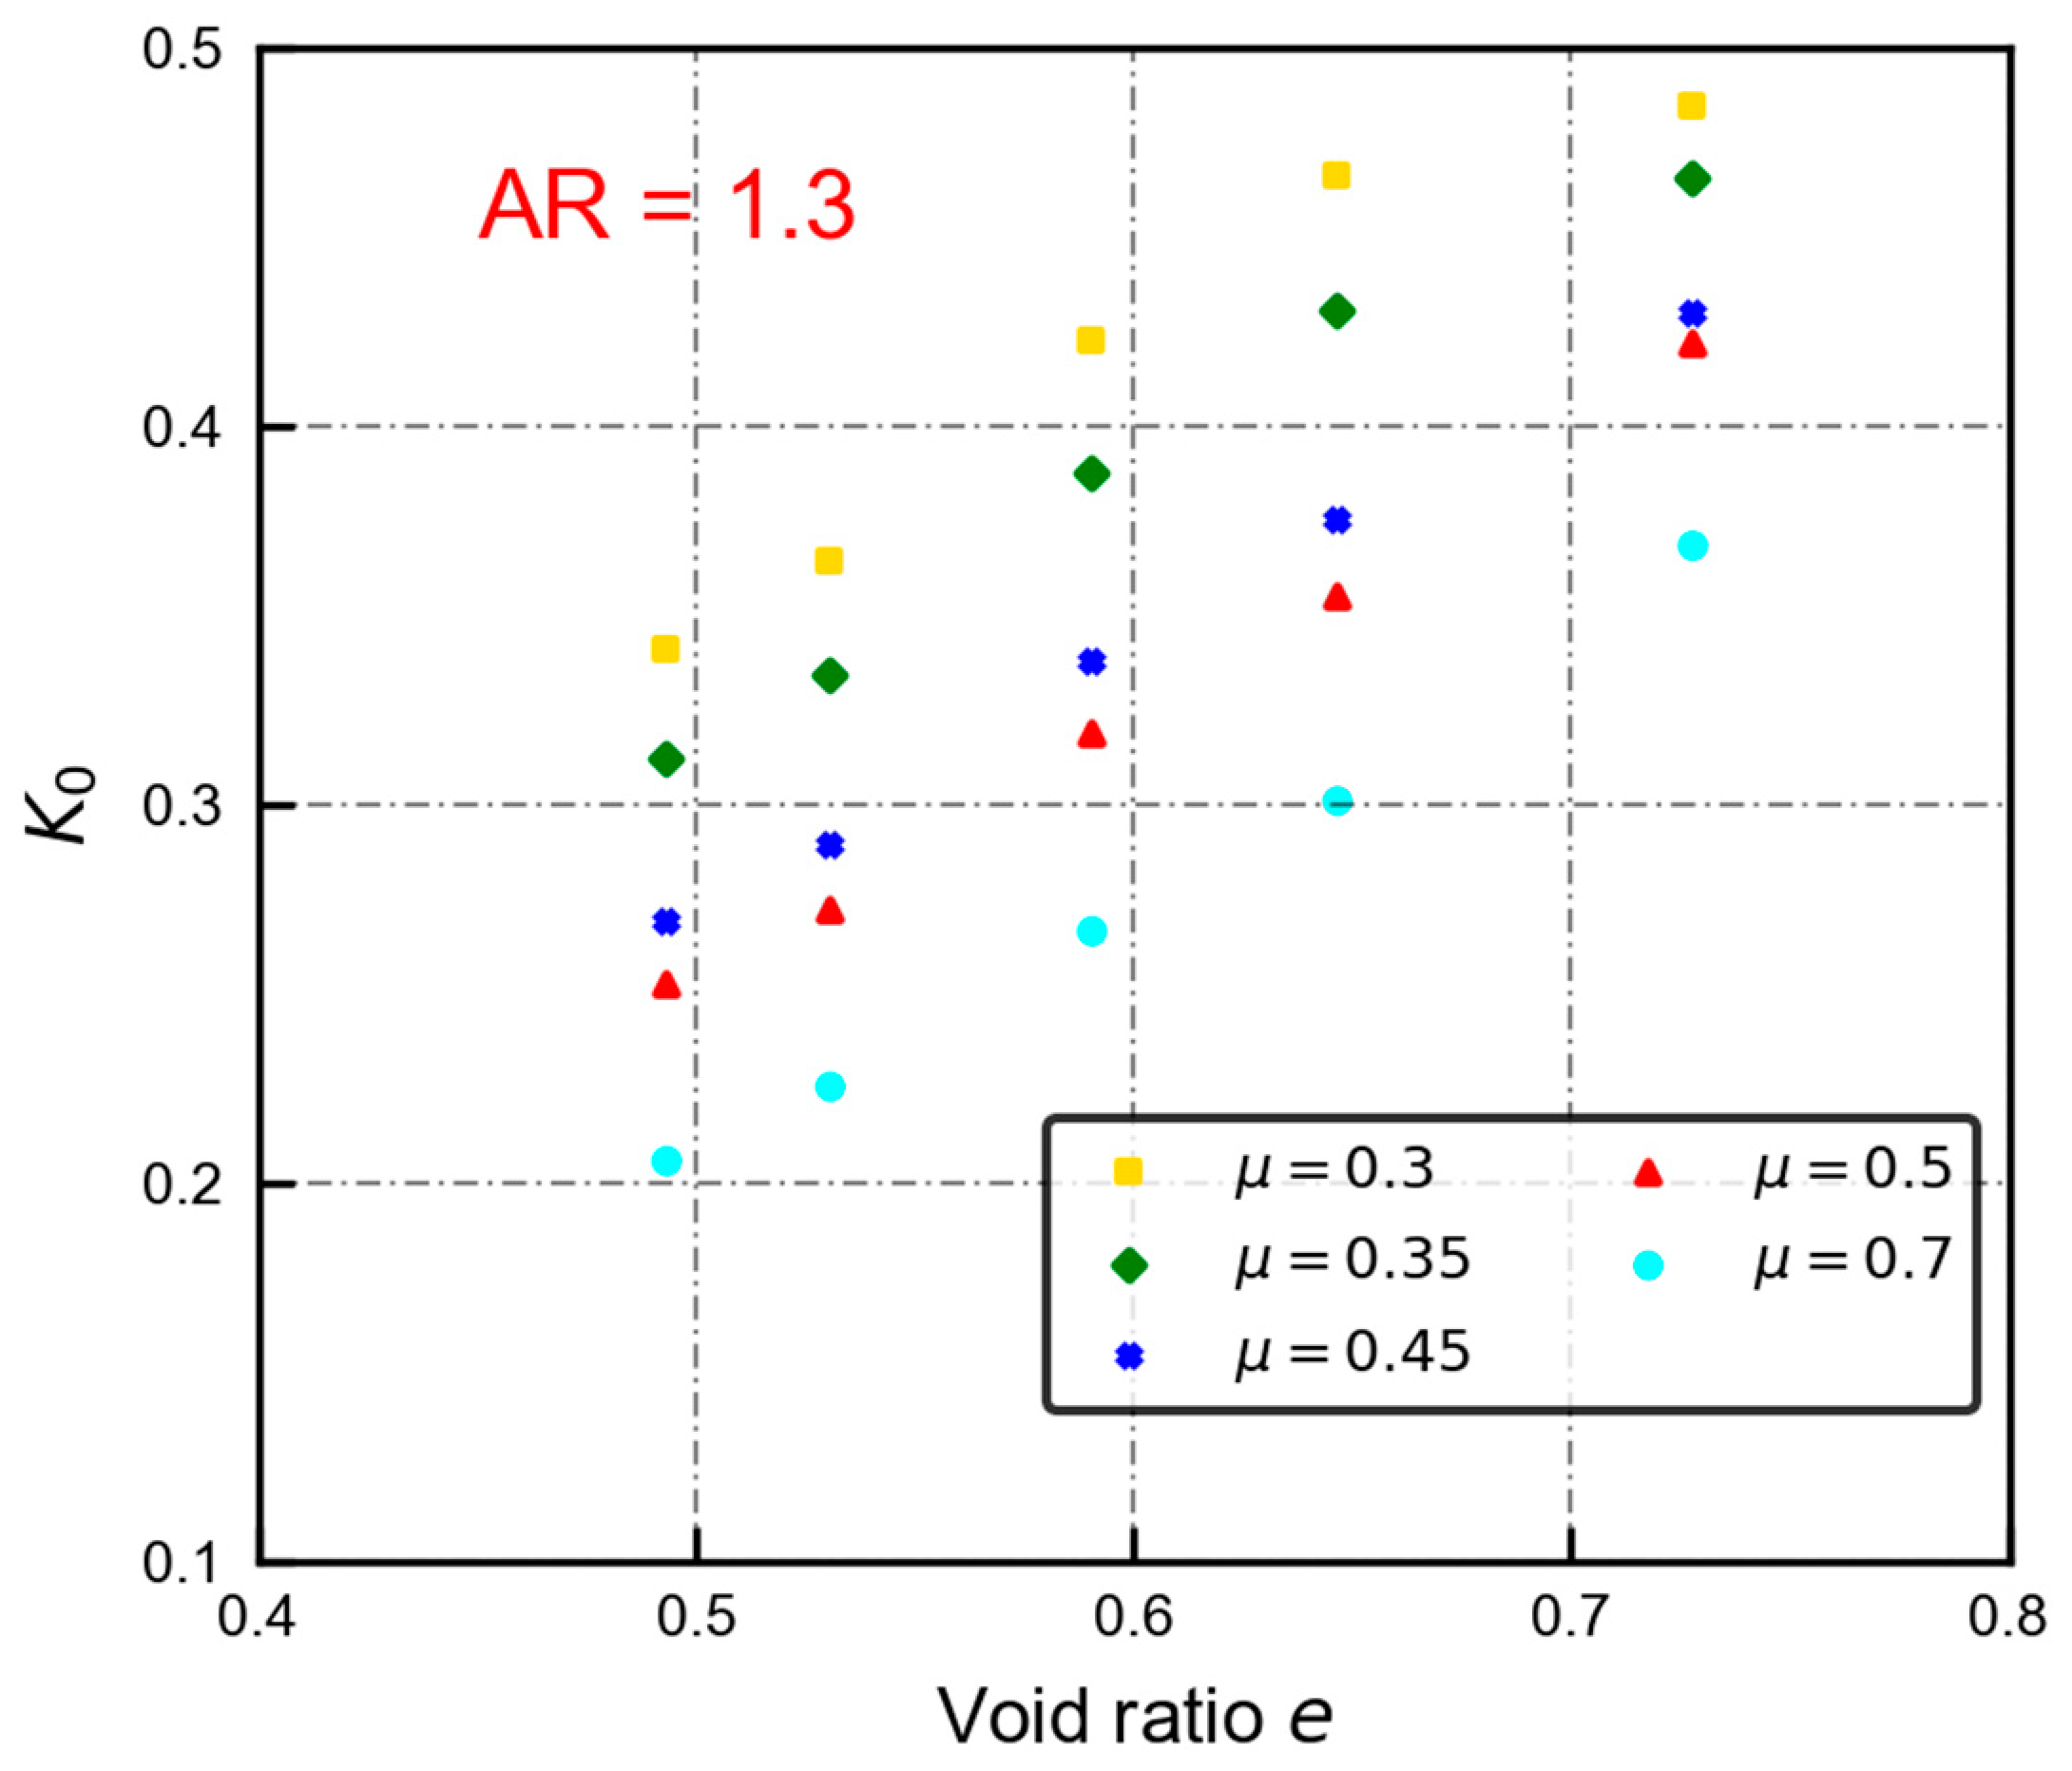
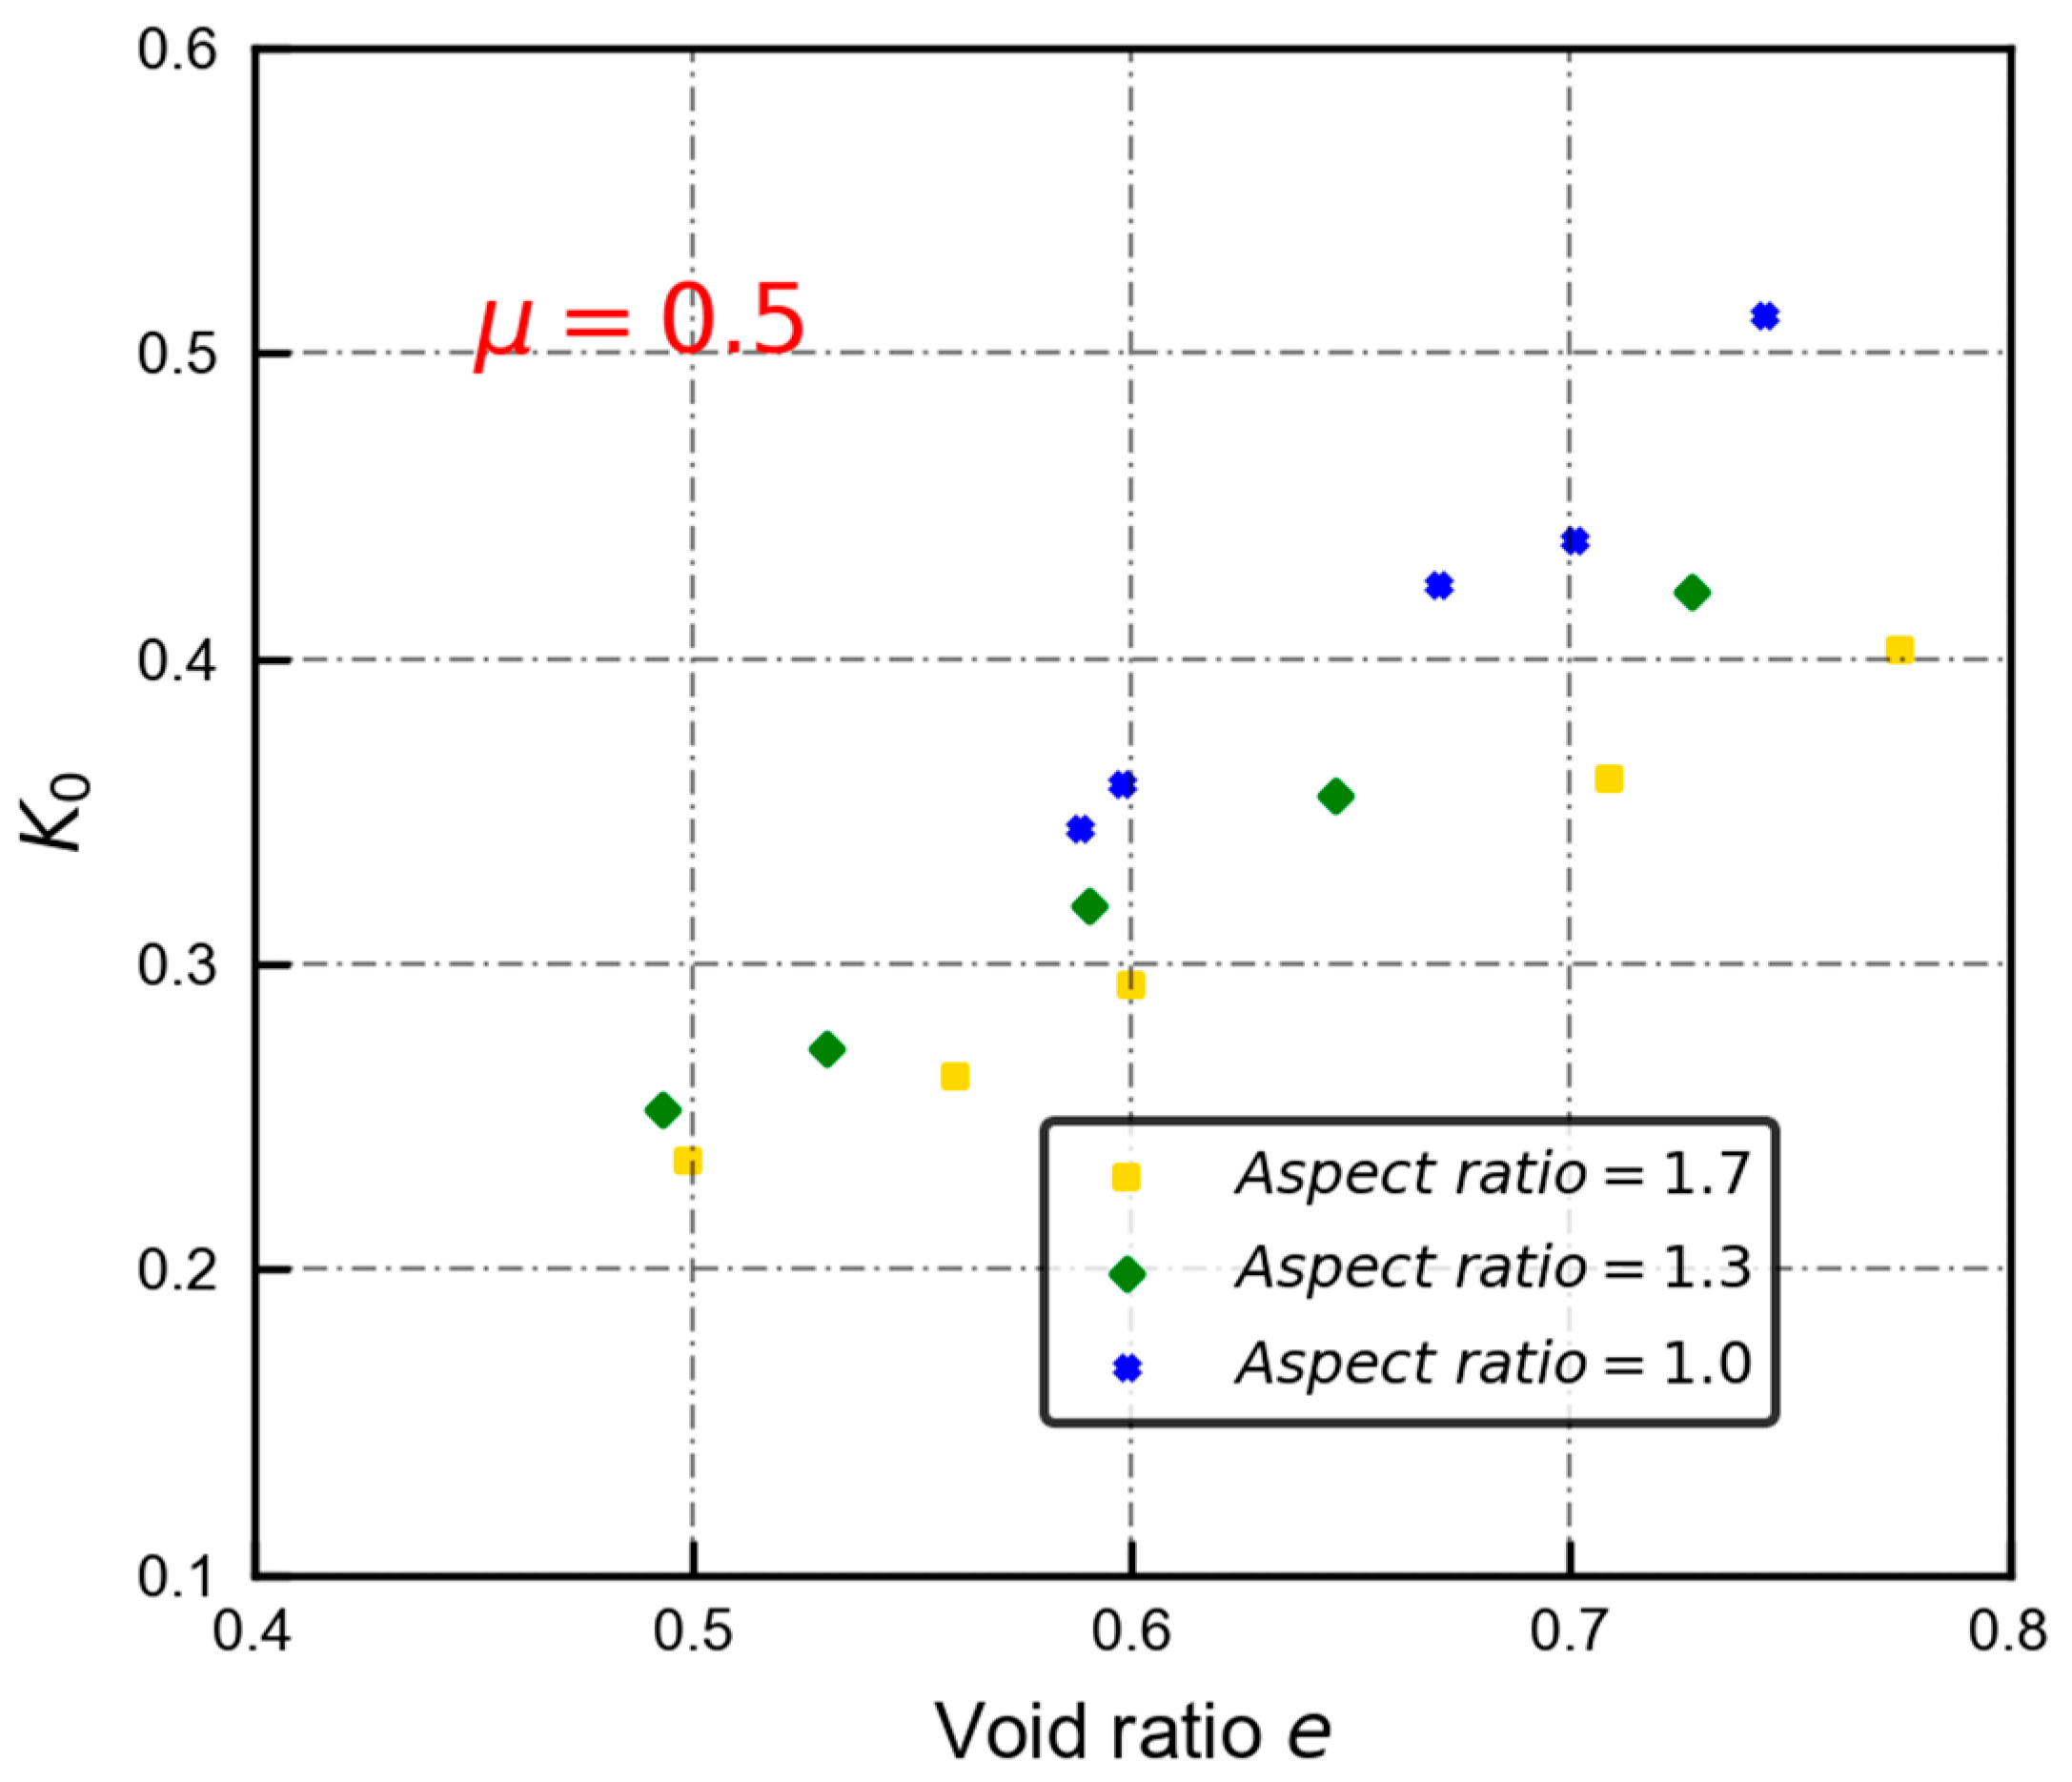
4. Effects of Particle Shape, Initial Void Ratio, and Inter-Particle Friction Angle
5. Conclusions
Author Contributions
Funding
Institutional Review Board Statement
Informed Consent Statement
Data Availability Statement
Conflicts of Interest
References
- Terzaghi, K.V. Old Earth Pressure Theories and New Test Results. Eng. News Rec. 1920, 85, 632–637. [Google Scholar]
- Bishop, A.W. Test Requirements for Measuring the Coefficient of Earth Pressure at Rest; British Library Lending Division [Supplier]: London, UK, 1958. [Google Scholar]
- Jaky, J. The Coefficient of Earth Pressure at Rest. J. Soc. Hung. Archit. Eng. 1944, 78, 355–358. [Google Scholar]
- Michalowski, R.L. Coefficient of Earth Pressure at Rest. J. Geotech. Geoenviron. Eng. 2005, 131, 1429–1433. [Google Scholar] [CrossRef] [Green Version]
- Mayne, P.W.; Kulhawey, F.H. K0-OCR Relationship in Soil. J. Soil Mech. Found. Div. 1982, 108, 851–872. [Google Scholar]
- Guo, P. Effect of Density and Compressibility on K0 of Cohesionless Soils. Acta Geotech. 2010, 5, 225–238. [Google Scholar] [CrossRef]
- Wanatowski, D.; Chu, J. K0 of Sand Measured by a Plane-Strain Apparatus. Can. Geotech. J. 2007, 44, 1006–1012. [Google Scholar] [CrossRef]
- Feda, J. K0 Coefficient of Sand in Triaxial Apparatus. J. Geotech. Eng. 1984, 110, 519–524. [Google Scholar] [CrossRef]
- Chu, J.; Gan, C.L. Effect of Void Ratio on K0 of Loose Sand. Géotechnique 2004, 54, 285–288. [Google Scholar] [CrossRef]
- Gu, X.; Hu, J.; Huang, M. K0 of Granular Soils: A Particulate Approach. Granul. Matter 2015, 17, 703–715. [Google Scholar] [CrossRef]
- Northcutt, S.; Wijewickreme, D. Effect of Particle Fabric on the Coefficient of Lateral Earth Pressure Observed during One-Dimensional Compression of Sand. Can. Geotech. J. 2013, 50, 457–466. [Google Scholar] [CrossRef]
- Gao, Y.; Wang, Y.H. Experimental and DEM Examinations of K0 in Sand under Different Loading Conditions. J. Geotech. Geoenviron. Eng. 2014, 140, 04014012. [Google Scholar] [CrossRef]
- Mesri, G.; Hayat, T.M. The Coefficient of Earth Pressure at Rest. Can. Geotech. J. 1993, 30, 647–666. [Google Scholar] [CrossRef]
- Lirer, S.; Flora, A.; Nicotera, M.V. Some Remarks on the Coefficient of Earth Pressure at Rest in Compacted Sandy Gravel. Acta Geotech. 2011, 6, 1–12. [Google Scholar] [CrossRef]
- Handy, R.L. The Arch in Soil Arching. J. Geotech. Eng. 2008, 111, 302–318. [Google Scholar] [CrossRef]
- Federico, A.; Elia, G.; Germano, V. A Short Note on the Earth Pressure and Mobilized Angle of Internal Friction in One-Dimensional Compression of Soils. J. Geoengin. 2008, 3, 41–47. [Google Scholar]
- Wu, W.; Bauer, E.; Kolymbas, D. Hypoplastic Constitutive Model with Critical State for Granular Materials. Mech. Mater. 1996, 23, 45–69. [Google Scholar] [CrossRef]
- BAUER, E. Calibration of a Comprehensive Hypoplastic Model for Granular Materials. Soils Found. 2011, 36, 13–26. [Google Scholar] [CrossRef] [Green Version]
- Fu, P.; Dafalias, Y.F. Study of Anisotropic Shear Strength of Granular Materials Using DEM Simulation. Int. J. Numer. Anal. Methods Geomech. 2011, 35, 1098–1126. [Google Scholar] [CrossRef]
- Tong, Z.; Fu, P.; Zhou, S.; Dafalias, Y.F. Experimental Investigation of Shear Strength of Sands with Inherent Fabric Anisotropy. Acta Geotech. 2014, 9, 257–275. [Google Scholar] [CrossRef]
- Hosseininia, E.S. Investigating the Micromechanical Evolutions within Inherently Anisotropic Granular Materials Using Discrete Element Method. Granul. Matter 2012, 14, 483–503. [Google Scholar] [CrossRef]
- Okochi, Y.; Tatsuoka, F. Some Factors Affecting K0-Values of Sand Measured in Triaxial Cell. Soils Found. 1984, 24, 52–68. [Google Scholar] [CrossRef] [Green Version]
- Guo, P.; Stolle, D.E. Fabric and Particle Shape Influence on K0 of Granular Materials. Soils Found. 2006, 46, 639–652. [Google Scholar] [CrossRef] [Green Version]
- Shogaki, T.; Nochikawa, Y. Triaxial Strength Properties of Natural Deposits at K0 Consolidation State Using a Precision Triaxial Apparatus with Small Size Specimens. Soils Found. 2004, 44, 41–52. [Google Scholar] [CrossRef] [Green Version]
- Campanella, R.G.; Vaid, Y.P. A Simple K o Triaxial Cell. Can. Geotech. J. 2009, 9, 249–260. [Google Scholar] [CrossRef]
- Yamamuro, J.A.; Bopp, P.A.; Lade, P.V. One-Dimensional Compression of Sands at High Pressures. J. Geotech. Eng. 1996, 122, 147–154. [Google Scholar] [CrossRef]
- Cundall, P.A.; Strack, O.D.L. A Discrete Numerical Model for Granular Assemblies. Geotechnique 1979, 29, 47–65. [Google Scholar] [CrossRef]
- Gu, X.; Lu, L.; Qian, J. Discrete Element Modeling of the Effect of Particle Size Distribution on the Small Strain Stiffness of Granular Soils. Particuology 2017, 32, 21–29. [Google Scholar] [CrossRef]
- Gu, X.; Hu, J.; Huang, M. Anisotropy of Elasticity and Fabric of Granular Soils. Granul. Matter 2017, 19, 1–15. [Google Scholar] [CrossRef]
- Gu, X.; Hu, J.; Huang, M.; Yang, J. Discrete Element Analysis of the K0 of Granular Soil and Its Relation to Small Strain Shear Stiffness. Int. J. Geomech. 2018, 18, 3–7. [Google Scholar] [CrossRef]
- Khalili, M.H.; Roux, J.N.; Pereira, J.M.; Brisard, S.; Bornert, M. Numerical Study of One-Dimensional Compression of Granular Materials. I. Stress-Strain Behavior, Microstructure, and Irreversibility. Phys. Rev. E 2017, 95, 032907. [Google Scholar] [CrossRef] [Green Version]
- Itasca Consulting Group, Inc. PFC 5.0 Documentation; Itasca Consulting Group, Inc.: Minneapolis, MN, USA, 2016. [Google Scholar]
- Mindlin, R.D. Elastic Spheres in Contact under Varying Oblique Forces. J. Appl. Mech. 1953, 20, 327–344. [Google Scholar] [CrossRef]
- Zhao, J.; Guo, N. The Interplay between Anisotropy and Strain Localisation in Granular Soils: A Multiscale Insight. Géotechnique 2015, 65, 642–656. [Google Scholar] [CrossRef] [Green Version]
- Gu, X.; Li, W.; Qian, J.; Xu, K. Discrete Element Modelling of the Influence of Inherent Anisotropy on the Shear Behaviour of Granular Soils. Eur. J. Environ. Civ. Eng. 2018, 22, s1–s18. [Google Scholar] [CrossRef]
- Sitharam, T.G.; Dinesh, S.V.; Shimizu, N. Micromechanical Modelling of Monotonic Drained and Undrained Shear Behaviour of Granular Media Using Three-Dimensional DEM. Int. J. Numer. Anal. Methods Geomech. 2002, 26, 1167–1189. [Google Scholar] [CrossRef]
- Rothenburg, L.; Bathurst, R. Analytical Study of Induced Anisotropy in Idealized Granular Material. Géotechnique 1989, 39, 601–614. [Google Scholar] [CrossRef]
- Gu, X.; Huang, M.; Qian, J. DEM Investigation on the Evolution of Microstructure in Granular Soils under Shearing. Granul. Matter 2014, 16, 91–106. [Google Scholar] [CrossRef]
- Guo, N.; Zhao, J. The Signature of Shear-Induced Anisotropy in Granular Media. Comput. Geotech. 2013, 47, 1–15. [Google Scholar] [CrossRef]
- Thornton, C. Numerical Simulations of Deviatoric Shear Deformation of Granular Media. Geotechnique 2000, 50, 43–53. [Google Scholar] [CrossRef]
- Rothenburg, L.; Kruyt, N.P. Critical State and Evolution of Coordination Number in Simulated Granular Materials. Int. J. Solids Struct. 2004, 41, 5763–5774. [Google Scholar] [CrossRef]
- Lee, J.; Yun, T.S.; Lee, D.; Lee, J. Assessment of K0 Correlation to Strength for Granular Materials. Soils Found. 2013, 53, 584–595. [Google Scholar] [CrossRef] [Green Version]
- Ludewig, F.; Vandewalle, N. Strong Interlocking of Nonconvex Particles in Random Packings. Phys. Rev. E 2012, 85, 051307. [Google Scholar] [CrossRef] [PubMed] [Green Version]
- Jaky, J. Earth Pressure in Soils. In Proceedings of the 2nd International Conference on Soil Mechanics and Foundation Engineering, Rotterdam, The Netherlands, 21–30 June 1948; Volume 1, pp. 103–107. [Google Scholar]
- Wood, D.M.; Maeda, K. Changing Grading of Soil: Effect on Critical States. Acta Geotech. 2008, 3, 3–14. [Google Scholar] [CrossRef]
- Negussey, D.; Wijewckreme, W.K.D.; Vaid, Y.P. Constant-Volume Friction Angle of Granular Materials. Can. Geotech. J. 1988, 25, 50–55. [Google Scholar] [CrossRef]
- Gu, X.; Zhang, J.; Huang, X. DEM Analysis of Monotonic and Cyclic Behaviors of Sand Based on Critical State Soil Mechanics Framework. Comput. Geotech. 2020, 128, 103787. [Google Scholar] [CrossRef]


| Specimen Dimensions (mm) | 4.8 × 4.8 × 4.8 |
|---|---|
| Particle density (kg/m3) | 2650 |
| No. of particles | 27,000 |
| Mean particle diameter (mm) | 0.214 |
| Inter-Particle friction coefficient | 0.5 |
| Wall-particle friction coefficient | 0 |
| Wall stiffness (N/m) | 1 × 10¹⁰ |
| Contact law | Hertz-Mindlin |
| Shear modulus of particles (GPa) | 5.8 |
| Poison’s ratio of particle | 0.15 |
| Aspect Ratio of Particles | Friction Coefficient in Specimen Preparation | Initial Void Ratio |
|---|---|---|
| 1 | 0.001 | 0.588 |
| 0.01 | 0.598 | |
| 0.15 | 0.670 | |
| 0.4 | 0.701 | |
| 0.5 | 0.744 | |
| 1.3 | 0.001 | 0.493 |
| 0.01 | 0.530 | |
| 0.15 | 0.591 | |
| 0.4 | 0.646 | |
| 0.5 | 0.727 | |
| 1.7 | 0.001 | 0.499 |
| 0.01 | 0.560 | |
| 0.15 | 0.600 | |
| 0.4 | 0.709 | |
| 0.5 | 0.775 |
Publisher’s Note: MDPI stays neutral with regard to jurisdictional claims in published maps and institutional affiliations. |
© 2022 by the authors. Licensee MDPI, Basel, Switzerland. This article is an open access article distributed under the terms and conditions of the Creative Commons Attribution (CC BY) license (https://creativecommons.org/licenses/by/4.0/).
Share and Cite
Qian, J.; Zhou, C.; Li, W.; Gu, X.; Qin, Y.; Xie, L. Investigation on the Influencing Factors of K0 of Granular Materials Using Discrete Element Modelling. Appl. Sci. 2022, 12, 2899. https://0-doi-org.brum.beds.ac.uk/10.3390/app12062899
Qian J, Zhou C, Li W, Gu X, Qin Y, Xie L. Investigation on the Influencing Factors of K0 of Granular Materials Using Discrete Element Modelling. Applied Sciences. 2022; 12(6):2899. https://0-doi-org.brum.beds.ac.uk/10.3390/app12062899
Chicago/Turabian StyleQian, Jiangu, Chuang Zhou, Weiyi Li, Xiaoqiang Gu, Yongjun Qin, and Liangfu Xie. 2022. "Investigation on the Influencing Factors of K0 of Granular Materials Using Discrete Element Modelling" Applied Sciences 12, no. 6: 2899. https://0-doi-org.brum.beds.ac.uk/10.3390/app12062899