
Shear Behaviour of Aeolian Sand with Different Density and Confining Pressure


1
School of Physics and Electronic-Electrical Engineering, Ningxia University, Yinchuan 750021, China
2
Solid Mechanics Institute, Ningxia University, Yinchuan 750021, China
3
School of Civil and Hydraulic Engineering, Ningxia University, Yinchuan 750021, China
4
Ningxia Center for Research on Earthquake Protection and Disaster Mitigation in Civil Engineering, Yinchuan 750021, China
5
Shenzhen Houkun Soft Rock Technology Co., Ltd., Shenzhen 518031, China
*
Author to whom correspondence should be addressed.
Appl. Sci. 2022, 12(6), 3020; https://0-doi-org.brum.beds.ac.uk/10.3390/app12063020
Submission received: 24 February 2022
/
Revised: 11 March 2022
/
Accepted: 14 March 2022
/
Published: 16 March 2022
(This article belongs to the Special Issue Recent Progress on Advanced Foundation Engineering)
Abstract
:Different from the other roadbed material, the unique mechanical properties of aeolian sand bring great difficulties to the construction and maintenance of desert highways. However, the main attention was usually paid to the engineering properties of aeolian sand, such as collapsibility, strong permeability, and poor gradation. To investigate the shear behaviour of aeolian sand under different engineering conditions, the drained and undrained tests were performed on aeolian sand with relatively large range of density and confining pressure. Under this condition, both the drained and undrained tests tend to the same critical state line, and the shear behaviour of aeolian sand is directly dependent on its density. Under the undrained condition, the q-ε1 curves and the effective stress paths in triaxial stress space exhibit four types of undrained shear behaviour, such as flow, limited flow, strain hardening, and strain softening. Meanwhile all the specimens exhibit three types of failure, such as flow slip, bulging failure, and shear bands. In the q-p’ plane, the analogous drained and undrained stress paths can be followed by aeolian sand with same initial relative density but different confining pressures, and there are two critical state lines due to the generation of shear bands for dense sand. In addition, the critical state lines in e-lnp’ plane decrease with increasing initial relative density Dr, that is, the material constant eᴦ decreases with increasing Dr, and the λ is also not constant but decreases with the increase in Dr. The results suggest that the strength behaviours of aeolian sand can be fitted by a straight line considering relative density and confining pressure and that two empirical formulas are established to describe this feature.
1. Introduction
With the increase in the construction of people’s livelihood projects, such as highways and high-speed railways crossing the desert, the unique mechanical properties of aeolian sand have attracted the attention of researchers. The Wuhai-Maqin Highway of the Zhongwei section is 122.91 km in length, which passes from the southwest to the southern edge of the Tengger Desert, and there are 18 km in the hinterland of the desert. The sand dunes are undulating and the stratum is dominated by the Quaternary Holocene aeolian sand. Due to its arid climate accompanied by year-round strong winds, the shape of aeolian sand is mainly subangular and subcircular [1,2]. Compared with river sand, the whole grain has less roundness and sharp edges, and is mainly fine grain. As a roadbed material, aeolian sand has engineering characteristics such as collapsibility, strong permeability, and poor gradation. Zeng et al. [3] and Soroush et al. [4] have shown that aeolian sand has strong collapsibility and the collapsibility has an important relationship with its relative density, moisture content, and fine particle content. Mao et al. [5] proposed a dynamic compaction method that can effectively improve the collapsibility of aeolian sand. Considering the compaction characteristics of aeolian sand [6,7,8,9], its compaction curve is “S” type, which is totally different from the other types of sand. Namely, the aeolian sand reaches a higher dry density in both the natural state with low water content and the optimum water content, that is, the aeolian sand has the engineering characteristics of wet compaction and dry compaction. More interestingly, as a kind of high permeability material, the permeability of aeolian sand decreases with the increase in dry density [10].
Most of the current research on the mechanical properties of aeolian sand is based on the engineering constructions, such as geotechnical engineering problems encountered in the exploration and development of oil and gas resources in the Mu Us Desert. Deng et al. [11], Song [12], and Zhang [13] conducted a series of static and dynamic triaxial tests on aeolian sand in the Mu Us Desert, and obtained its strength, stress-strain relationship, and pore water pressure change characteristics. In terms of aeolian sand in the Tengger Desert, only Li et al. [14,15] conducted true triaxial tests under the condition of drained and undrained, and obtained its mechanical response characteristics with different medium principal stress coefficients.
In engineering construction, the bearing capacity of foundation soil is an important property. The bearing capacity of aeolian sand is low and is related to water content [16]. When the bearing capacity of the foundation is insufficient to meet the design requirements, the foundation can be treated by compaction and vibration to improve the bearing capacity and reduce the foundation deformation. After the foundation treatment, the compression modulus of sand increases by 2–18 times [17]. Recently, the jet grouting method for soil mainly containing clean sand is used to decrease liquefaction potential by improving the shear strength of the soil and CPT- and SPT-based analyses confirm the effectiveness of jet grouting [18]. However, the research on the strength and deformation of foundation after the density increases is less, and the effect of foundation treatment is difficult to judge. The research on aeolian sand in this area is almost blank, only the research results on other types of sand. At first, Castro [19] gave the relationship between void ratio and effective principal stress of sand in undrained triaxial tests. Verdugo et al. [20] and Yoshimine et al. [21] conducted a series of undrained triaxial tests with different void ratios to study the strength characteristics of Toyoura sand, and they concluded that the final stable strength of the sand in triaxial compression was only related to the density, independent of the initial stress level. However, Cai et al. [22,23] found through an experimental study that the effective mean principal stress has a greater influence on the stress-strain relationship of sand than the density of sand.
Considering the influence of density on the strength and deformation of sand, Xu et al. [24] and Zhu et al. [25] found that there was an approximately linear relationship between the relative density and the friction angle of specimens. Leib et al. [26] used 3D digital imaging technology to study the deformation behaviour of sand with different relative densities during triaxial tests, and found that the inclination of the failure surface did not in accordance with either the Coulomb or Roscoe criterion. In the past, sand with different densities or subjected to different confining pressures were generally considered to be different materials [27]. In order to understand this complex behaviour, different state parameters have been proposed and incorporated into the stress-dilatancy equation [27,28,29]. Static liquefaction is a common failure mode for loose sand, Song and Sun [30] incorporated it into a state-dependent constitutive model to capture this behaviour. However, the deformation characteristic of aeolian sand is still unclear due to the lack of relevant tests.
In addition, the shear behaviours of aeolian sand are also very unique. According to the particle size distribution curve, the grain size of aeolian sand mainly distributes in the range of 0.1–0.25 mm, which can be classified as a fine sand. However, some of the widely accepted facts about clean quartz sand and silty sand seem to be inapplicable to fine sand [31]. The critical state theory is the basic theoretical of many constitutive models used in engineering design, which has played an increasingly important role in the study of the mechanical behaviours for granular materials [32,33]. Many studies have shown that the critical state line (CSL) in the plane of q-p’ and e-lnp’ are a unique line independent of the initial state of sand, and the critical stress ratio M (=q/p’) is constant, which is also independent of the initial state [34,35,36,37,38]. On the contrary, the experimental results for aeolian sand show that the CSL in the plane of q-p’ and e-lnp’ are not unique but dependent on the initial void ratio, that is, M is not a constant but dependent on the initial void ratio.
The unique physical and mechanical behaviours of aeolian sand have attracted our attention, thus a series of experimental tests have been conducted. At the same time, it takes the construction of the Wuma Highway as the background which is located at the southern edge of the Tengger Desert. With the different relative densities and confining pressure, the research throws emphasis on numerous factors that are capable of influencing the shear behaviour of aeolian sand by the triaxial test. Specifically, the reason why aeolian sand shows special critical state behaviour will be discussed. Two empirical formulas will be established to describe the strength behaviours of aeolian sand considering relative density and confining pressure. This research can not only provide basis parameters for the establishment of a constitutive model for aeolian sand, but also provide a reference for the design of geotechnical construction in desert areas.
2. Materials and Methods
2.1. Basic Parameters of Aeolian Sand
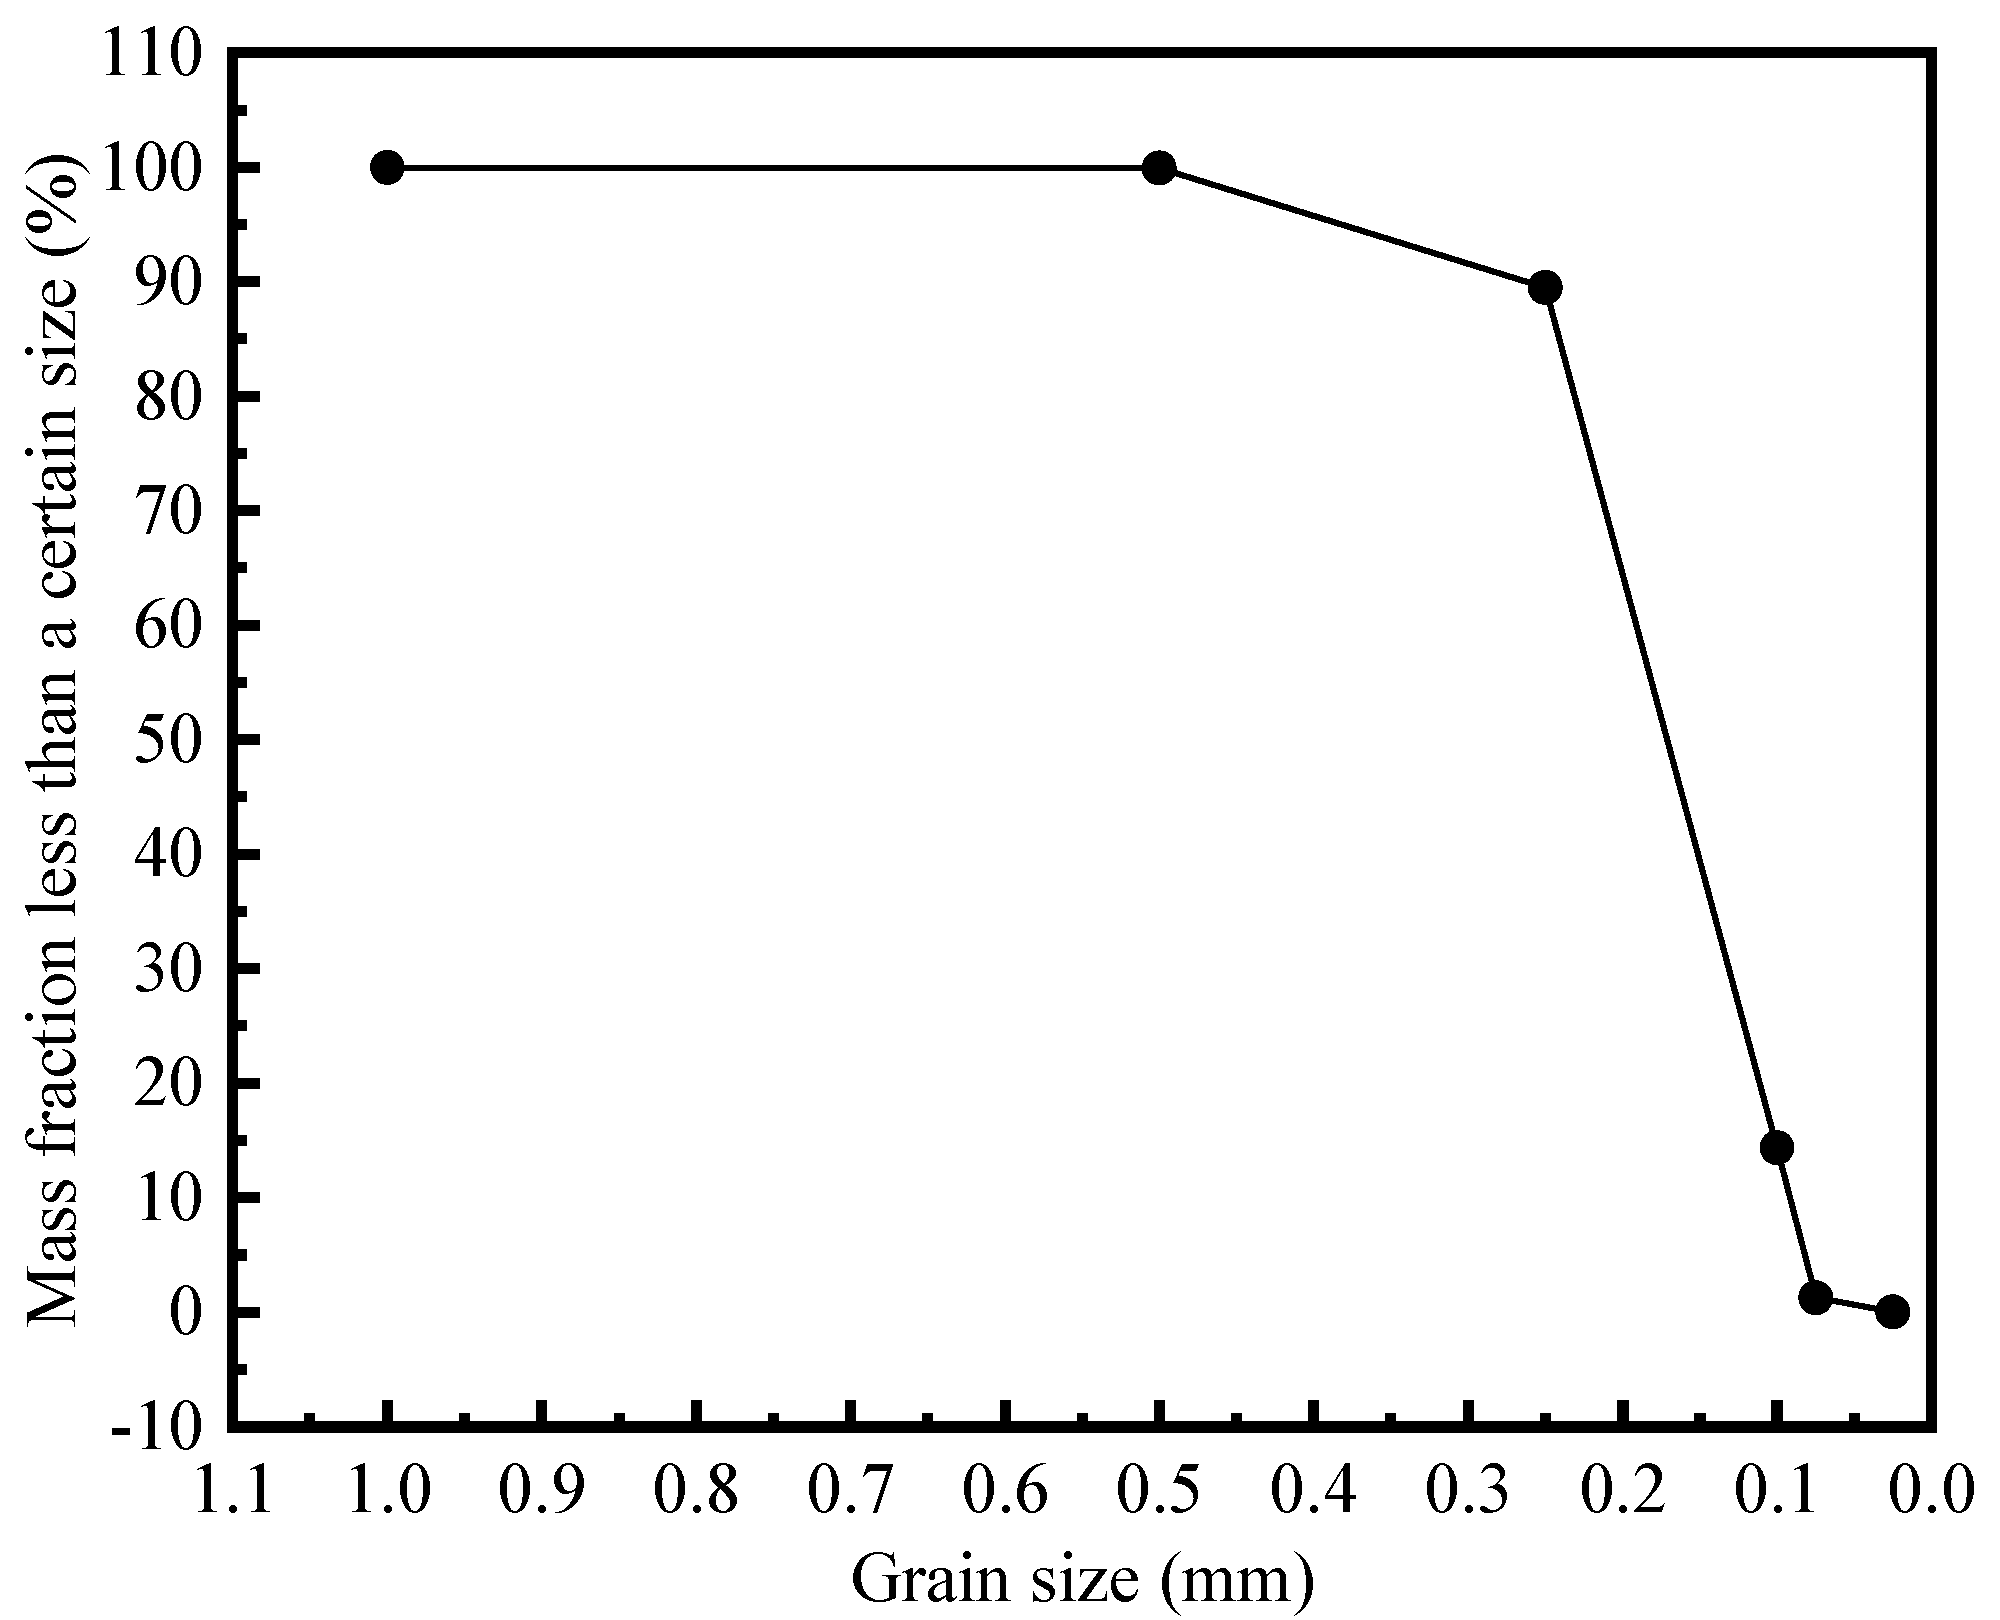
The aeolian sand in this study was taken from about 1m below the southern edge of the Tengger Desert. The dry density in a natural state is 1.53 g/cm3, the void ratio is 0.745, and the water content is 0.4%. The grain size distribution curve of the aeolian sand obtained by sieving method is shown in Figure 1, which belong to fine sand [39]. The minimum void ratio of the aeolian sand is determined by shaking table tests [40], and the maximum void ratio is determined by the funnel method [41], and its basic parameters are shown in Table 1.
2.2. Testing Program
In this test, five different relative densities were designed, such as 10%, 30%, 50%, 70%, and 90%, covering loose sand, medium-dense sand, and dense sand. The drained and undrained tests were carried out, respectively, under effective confining pressures of 100 kPa, 300 kPa, and 600 kPa. Under the condition of high load, the aeolian sand needs to be treated for the subgrade, and the results of the high confining pressure test have a certain reference value for the construction. At the same time, sand shows different characteristics under high confining pressure and low confining pressure [42], which is mainly due to the anisotropic evolution caused by dilatancy, particle fragmentation, and rearrangement of the sand specimens. Therefore, the undrained tests with higher confining pressure (800 kPa and 1200 kPa) and lower confining pressure (50 kPa) are designed for medium-dense sand to fully understand the mechanical properties of aeolian sand.
The control axial strain ε1 = 25% is taken as the test termination standard. The sample mass of the dry sand required for specimens with different relative densities is calculated by Equation (1). The specific test program is shown in Table 2.
where is the mass of sand, and is the volume of specimens.
2.3. Test Method
This study used an automatic triaxial testing system with digital data acquisition capabilities. Axial force was controlled by a servo motor, the maximum was 30 kN, and the measurement accuracy was ±1% FS (Full Scale). The confining pressure and back pressure were all controlled by hydraulic pressure, the maximum confining pressure was 1.99 MPa, the maximum back pressure was 0.99 MPa, and the control accuracy was ±0.5% FS. Tests were performed on the cylindrical specimen of 61.8mm diameter and 125.0mm height. In order to keep the density of the specimen consistent within the height range, it was divided into five layers to prepare, and the method of undercompaction was used, this method was first proposed by Ladd [43] and suggested that the relative density of the upper and lower layers of soil specimens differs by 1%. The specific operation steps were as follows (the test is carried out in a relatively stable environment, such as the temperature is 22~26 °C, the air humidity is 40~44%):
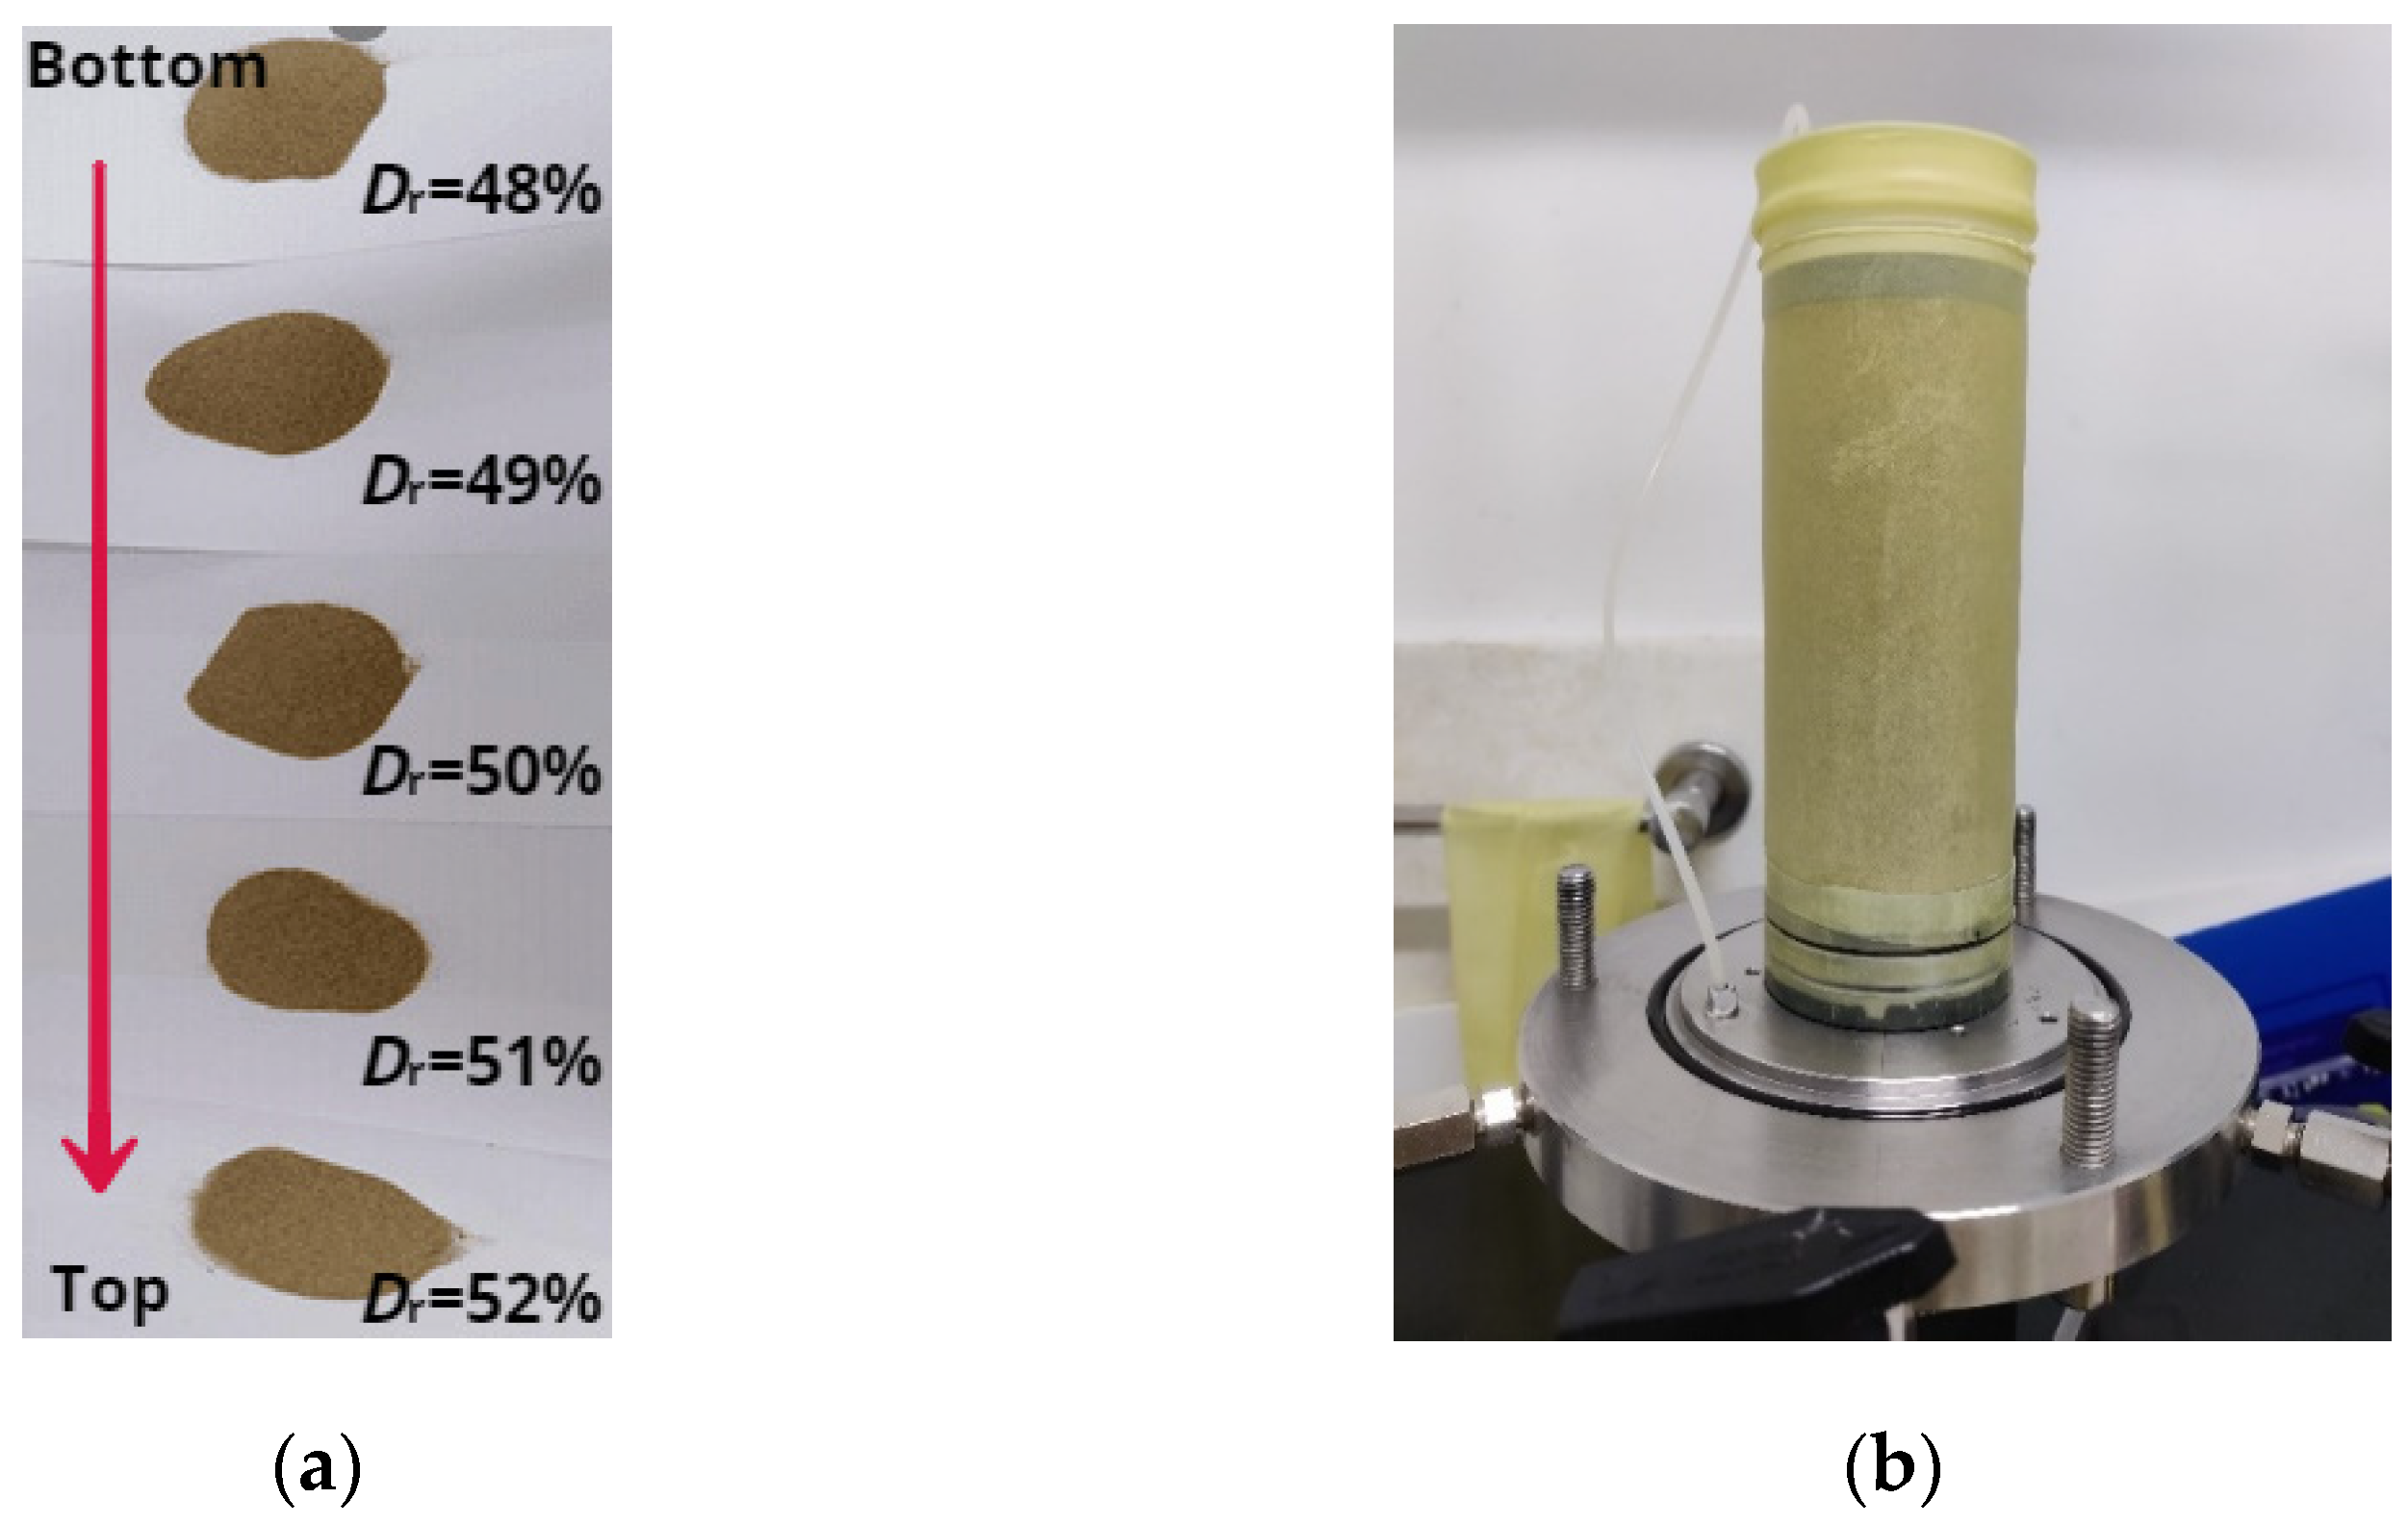
- In the test, the sample mass of the dry sand was divided into five parts and the relative density of the lower layer is 1% lower than that of the upper layer. For example, to prepare a specimen with a relative density of 50%, the relative density of the five layers from bottom to top is 48%, 49%, 50%, 51% and 52%, respectively, as shown in Figure 2a;
- It needs to bind the latex membrane on the base of the triaxial cell, put the porous stone and filter paper into the latex membrane in turn, and then fix the mould on the base. Then, a vacuum pump was used to draw the mould so that the latex membrane was tightly attached to the inner wall of the mould;
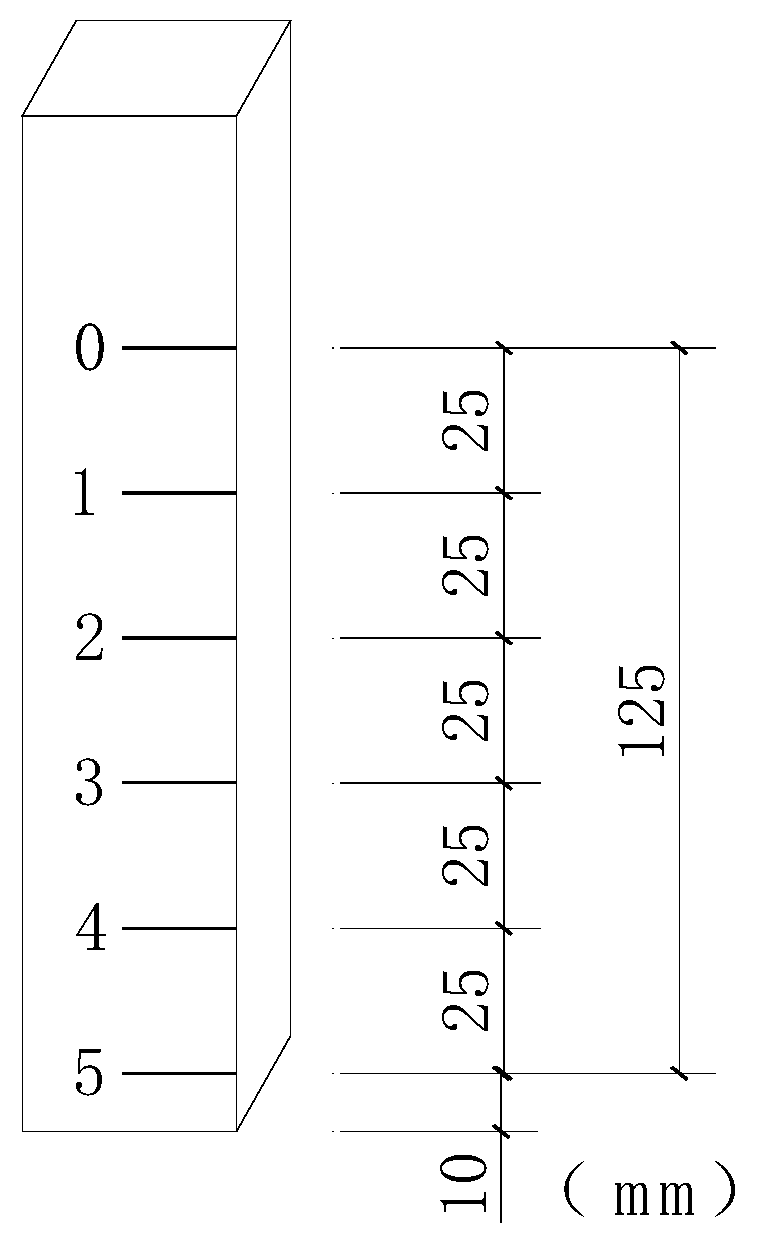
- Next, sprinkle the divided specimen into the latex membrane, and to use a tool (as shown in Figure 3) to accurately control the height of each layer. Then, the filter paper, porous stone, and loading cap were installed in turn;
- After the specimen preparation, a small vacuum was applied to stabilize the specimen and the mould was carefully removed. As shown in Figure 2b.
For specimens with different relative densities, the final volume of all the specimens was the same, so the specimen preparation methods with different relative densities would be different. For the loose sand specimen, de-aired water of about 0.8% of the dry sand should be sprayed on its surface after weighing the dry sand, and then the dry rubbing method should be used to make the water uniformly adhere to the surface of sand particles. After that, the long-neck funnel was used to evenly spread it into the latex membrane in layers. For medium-dense sand, the sand was slowly spread into the latex membrane using a long-neck funnel. For dense sand, the sand was directly spread into the latex membrane with a spoon. In order to make each layer of the specimen reach a predetermined height, the outer wall of the mould was evenly tapped with a rubber hammer. Additionally, the total height of the specimen was strictly controlled to be 125 ± 1 mm.
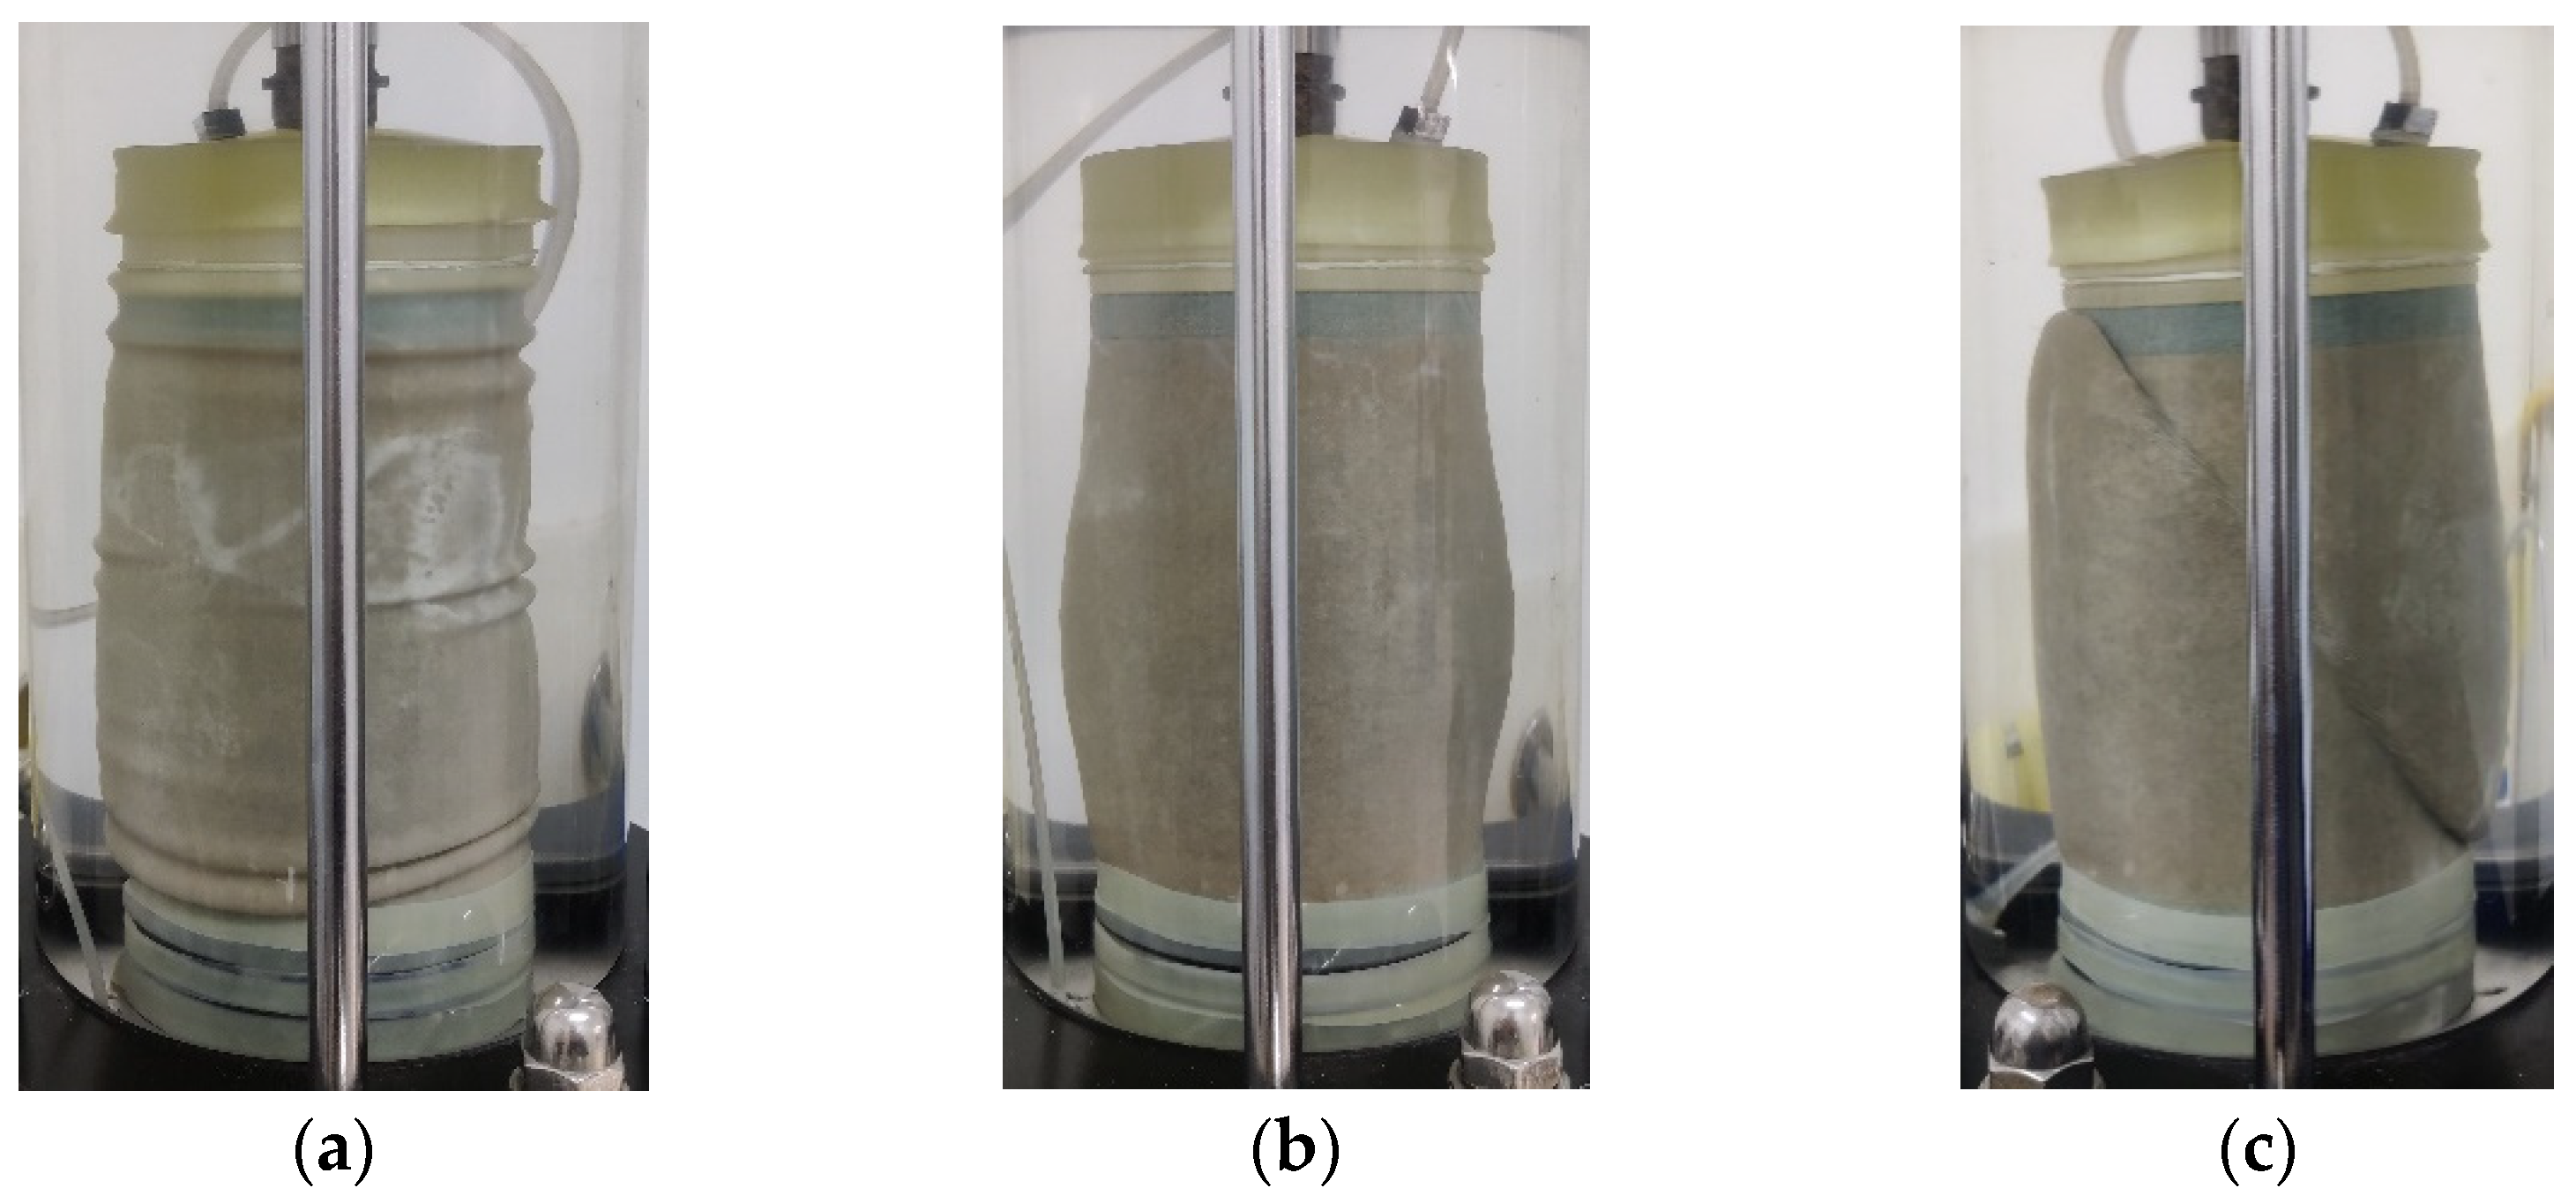
After the specimen preparation was completed, the back-pressure saturation is carried out. The back pressure and confining pressure were applied in increments of 50 kPa to help the residual gas inside the specimen dissolve in water, while the confining pressure was maintained at 20 kPa higher than the back pressure. When the confining pressure reaches about 400 kPa, the B value was assessed. If B was less than 0.95, which means the specimen was not saturated. The confining pressure and back pressure continue to increase until B > 0.95, when the sample was considered to reach the required saturation. Then, the specimen was consolidated isotropically to the target pressure. Once the consolidation step finished, the shearing step commenced. For the aeolian sand, all the specimens under undrained loading condition exhibit three types of failure, such as flow slip, bulging failure, and shear band as illustrated in Figure 4.
3. Results and Discussion
3.1. Stress-Strain Behaviour
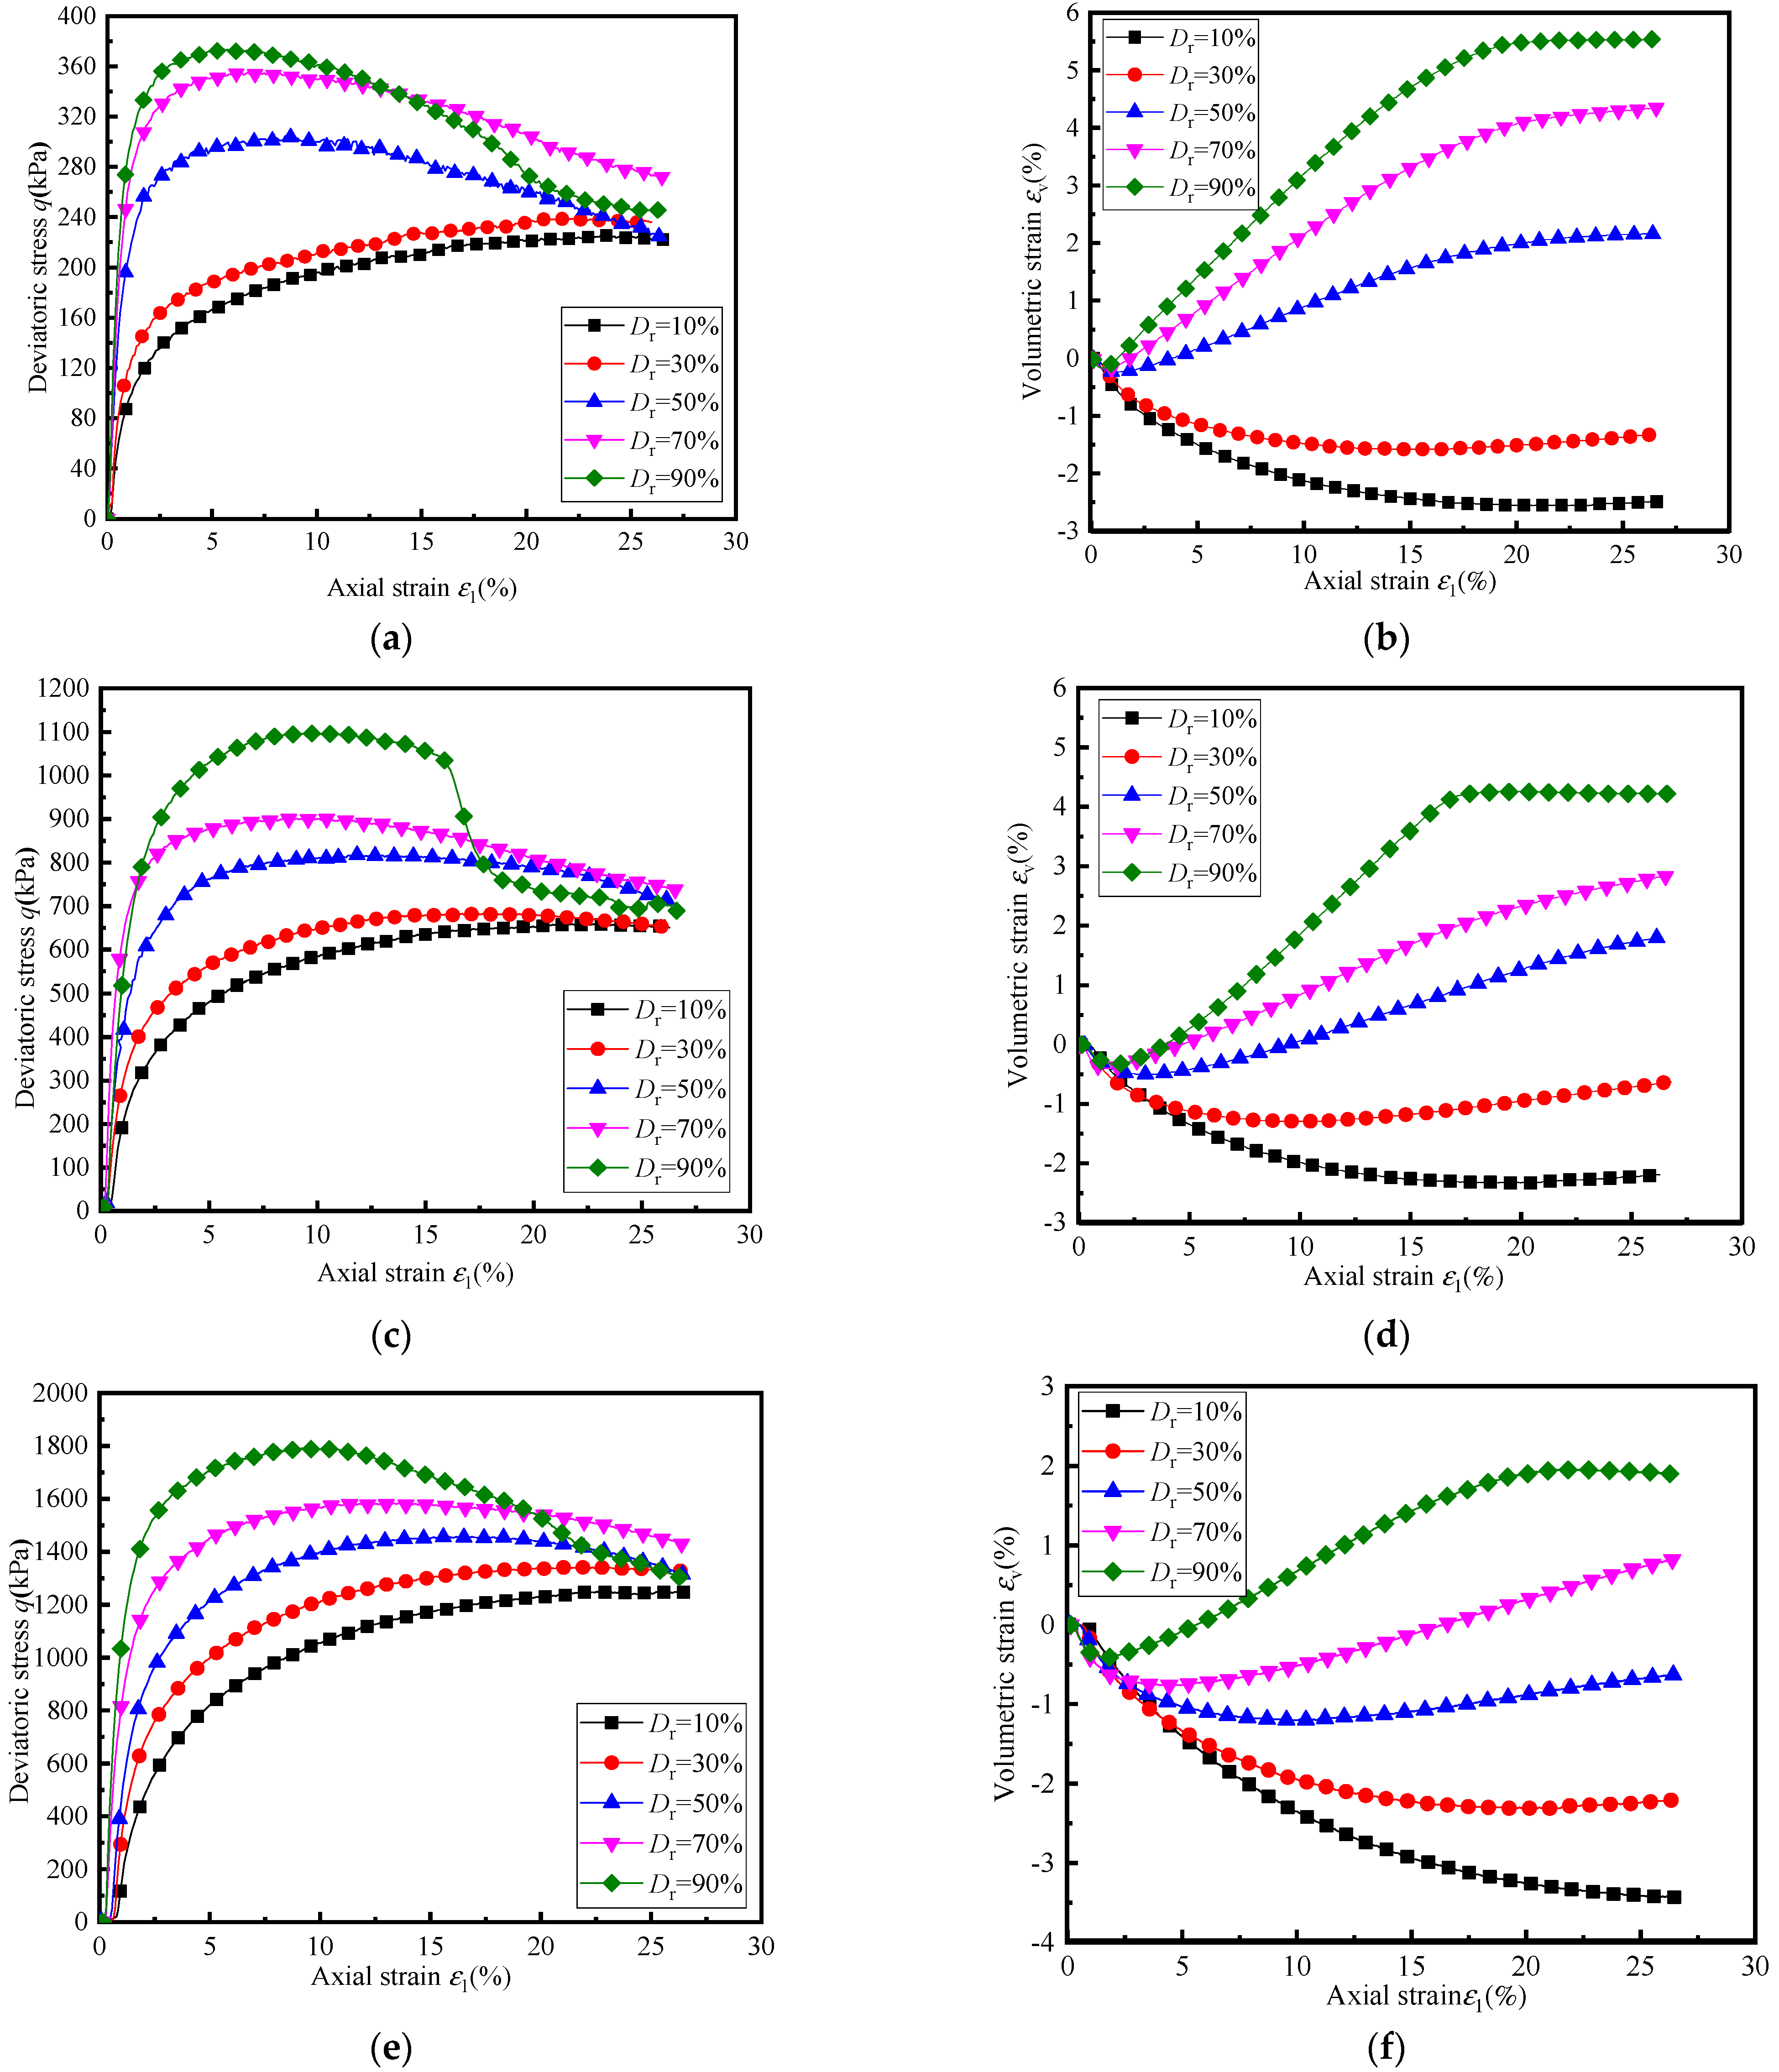
Figure 5 shows the stress-strain volumetric behaviour of aeolian sand under drained condition. The stress of dense sand specimens shows a visible peak followed by strain softening accompanied by dilative volumetric strains. On the other hand, the q-ε1 curves for the tests of loose sand exhibit strain hardening along with overall contractive volumetric strains. As can be seen from Figure 5a,c,e, the peak strength of aeolian sand increases with the increase in density. However, the strength of aeolian sand tends to have the same residual strength at the end of loading. At the same time, greater residual stress is developed at higher confining pressure for aeolian sand. Figure 5b,d, and f show the stress and volumetric strain of aeolian sand. For loose sand, the contraction occurs during the shear process, but for dense sand, the contraction occurs at the initial stage of loading and then dilatancy. The test results for the stress and volumetric strain of all the specimens reached constant values at the end of the tests, indicating that all the specimens reached the critical state. As can be seen from Figure 5b, the volume change of loose sand is larger than that of loose sand, while in Figure 5f, the volume change of loose sand is larger than that of dense sand.
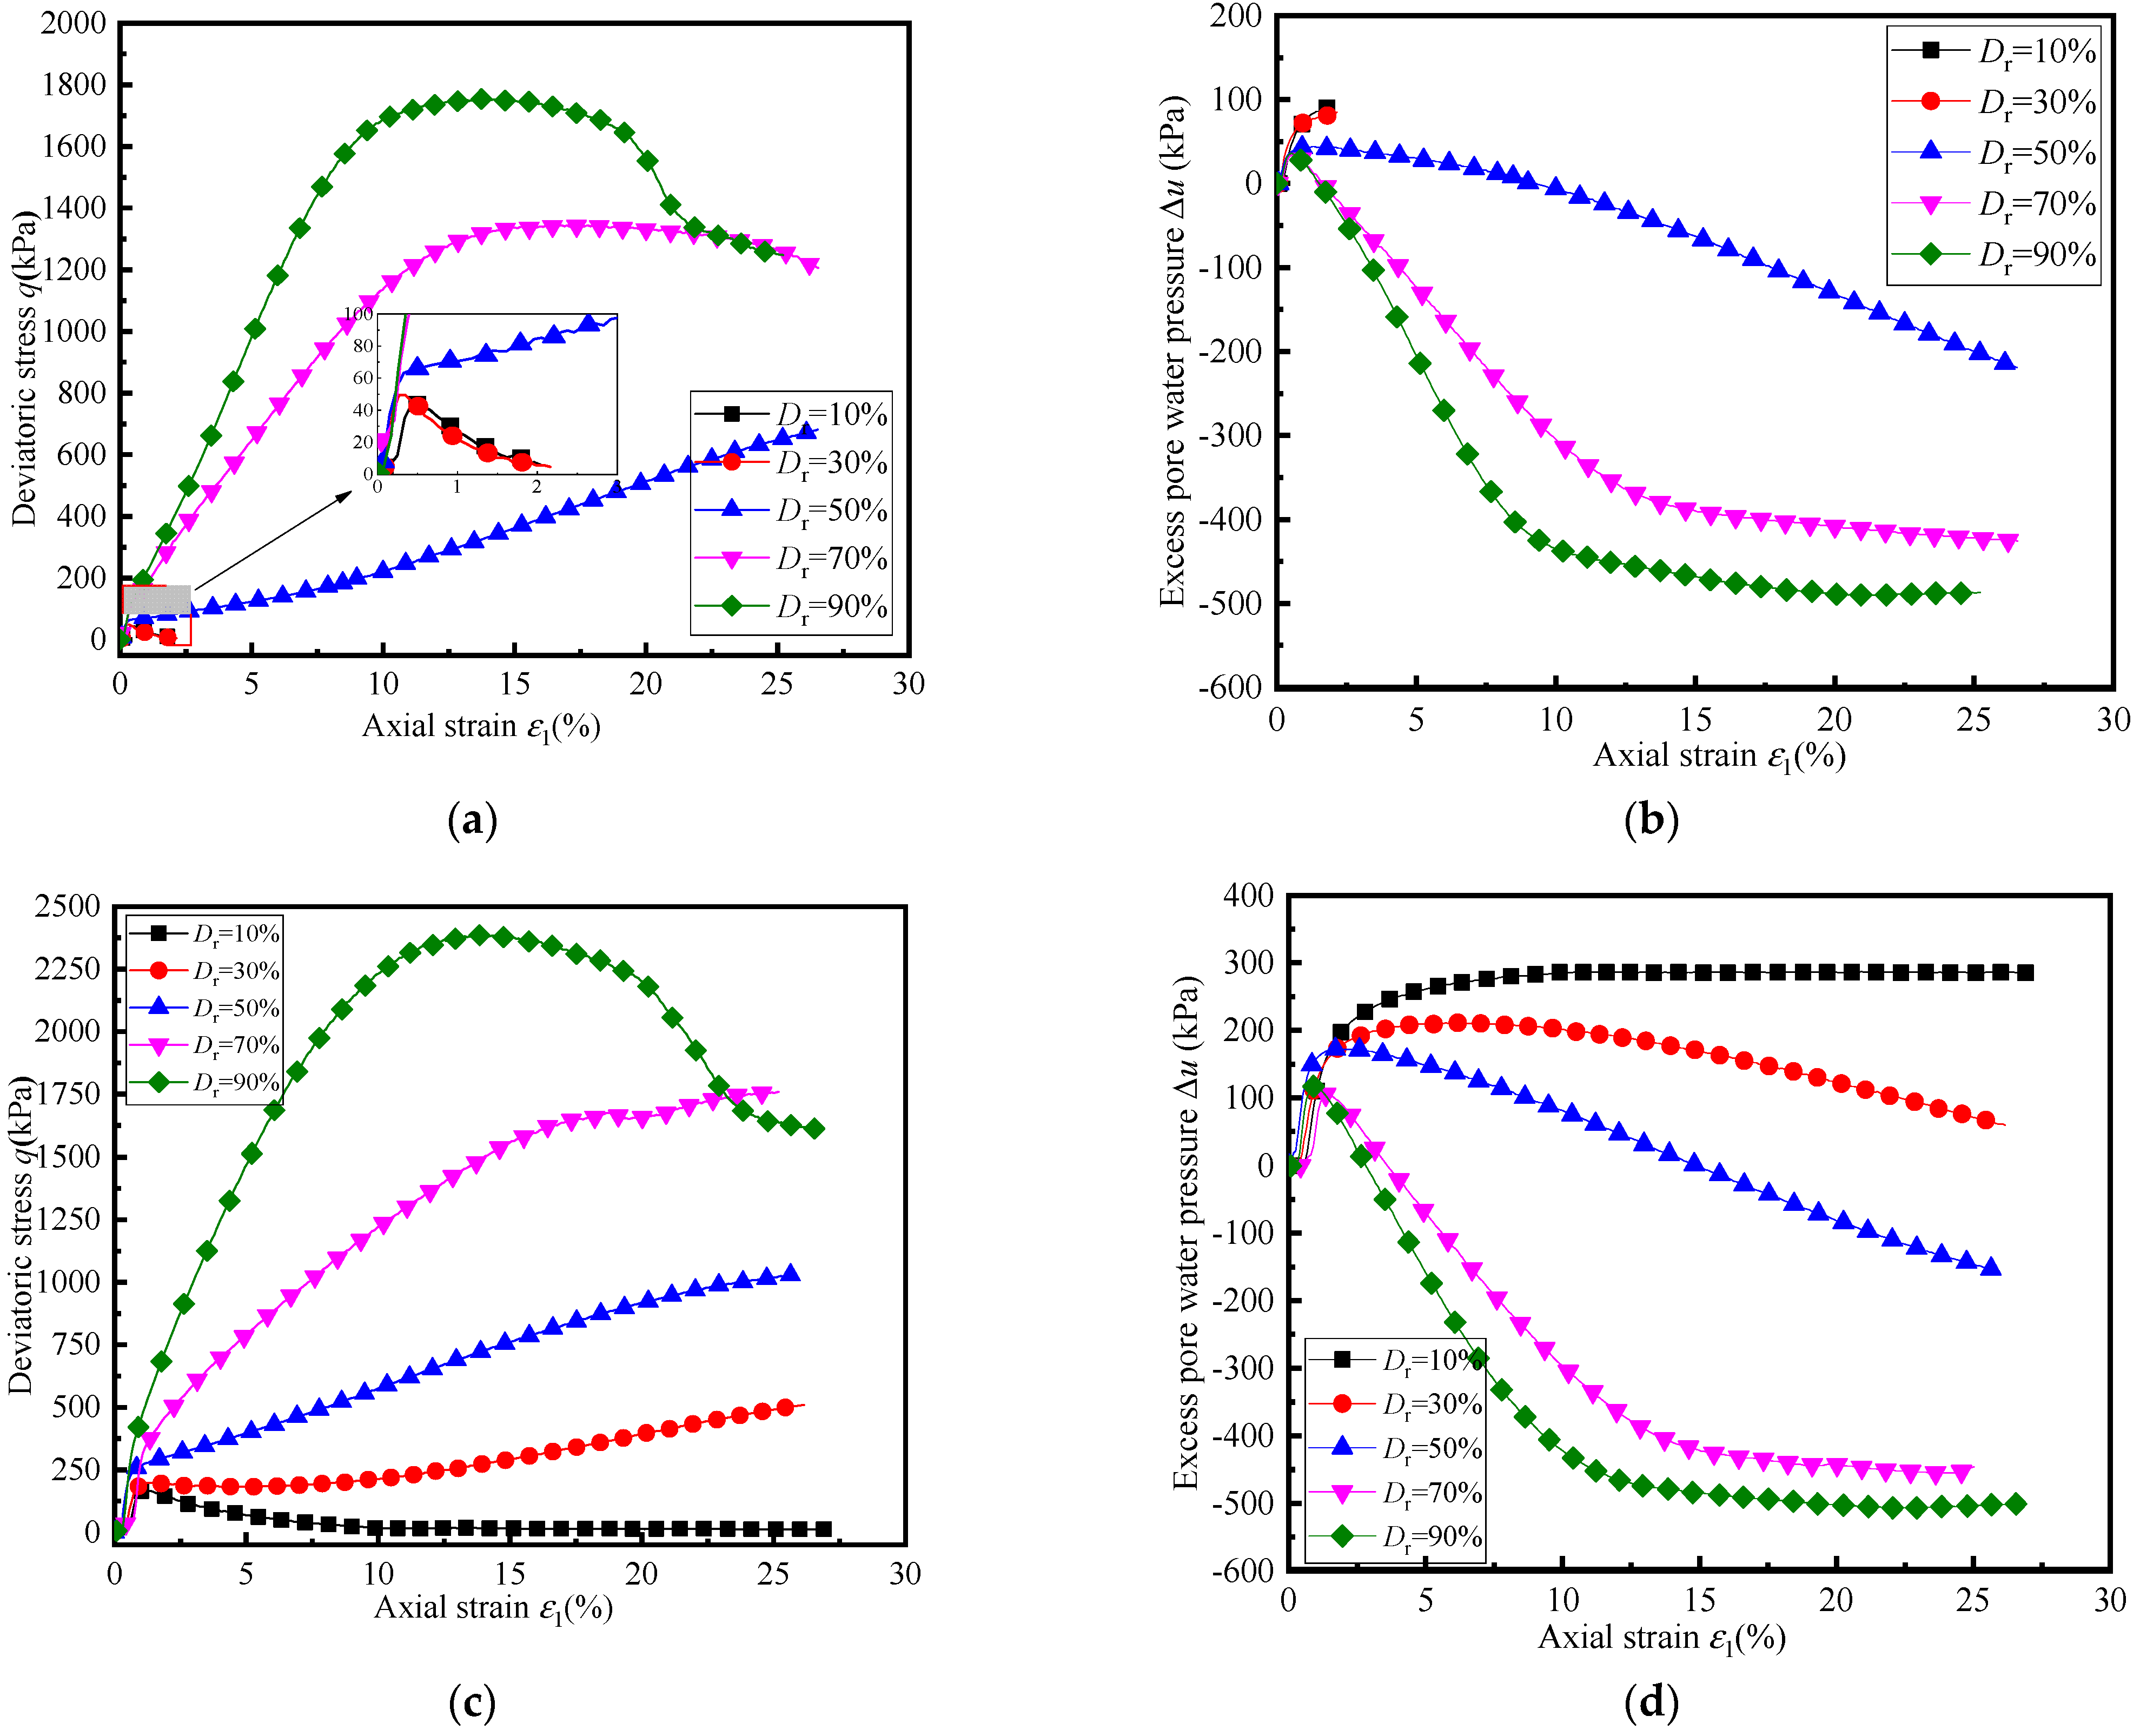
The undrained triaxial shear behaviour of aeolian sand with different densities is shown in Figure 6. The q-ε1 curves indicate that the specimens with a Dr of 90% mobilized the greatest deviatoric stresses while the specimens with a Dr of 10% mobilized the smallest deviatoric stresses. The specimens with the smallest Dr exhibited positive Δu that increased to almost confining pressure, while the specimens with a Dr of 90% exhibited initial positive Δu and decreased to negative values by the end of shearing. As can be seen from Figure 6a, the deviatoric stress of loose sand (Dr = 10% and 30%) reached the peak stress of about 20 kPa at an axial strain ε1 = 1%, and then the stress gradually decreased to the end of shear, which the axial strain was about 2.5%, the specimen collapsed and lost its strength. The trends exhibited by loose sand with σ3′ = 100 kPa was also under high confining pressure, which can be seen from Figure 6c,e. This phenomenon can be regarded as a kind of static liquefaction of sand. With the increase in strain, the excess pore water pressure rises sharply and the effective stress decreases sharply, so the sand is in a flow state, also known as “flow slip”. In this phenomenon, the loose sand (Dr = 10%) generated positive Δu which is close to confining pressure at a small axial strain and its deformation at the end of shear is shown in Figure 4a. The Δu of the dense sand specimens during the tests increased rapidly at axial strains smaller than 1%, after which the magnitudes tended to decrease slowly throughout the end of the tests. These trends are consistent with the rapid rate of contraction observed in the drained tests in Figure 5 at small axial strains followed by the dilation at larger axial strains. The q-ε1 curves for dense sand exhibit a peak followed by strong strain softening accompanied by visible shear band as shown in Figure 4c.
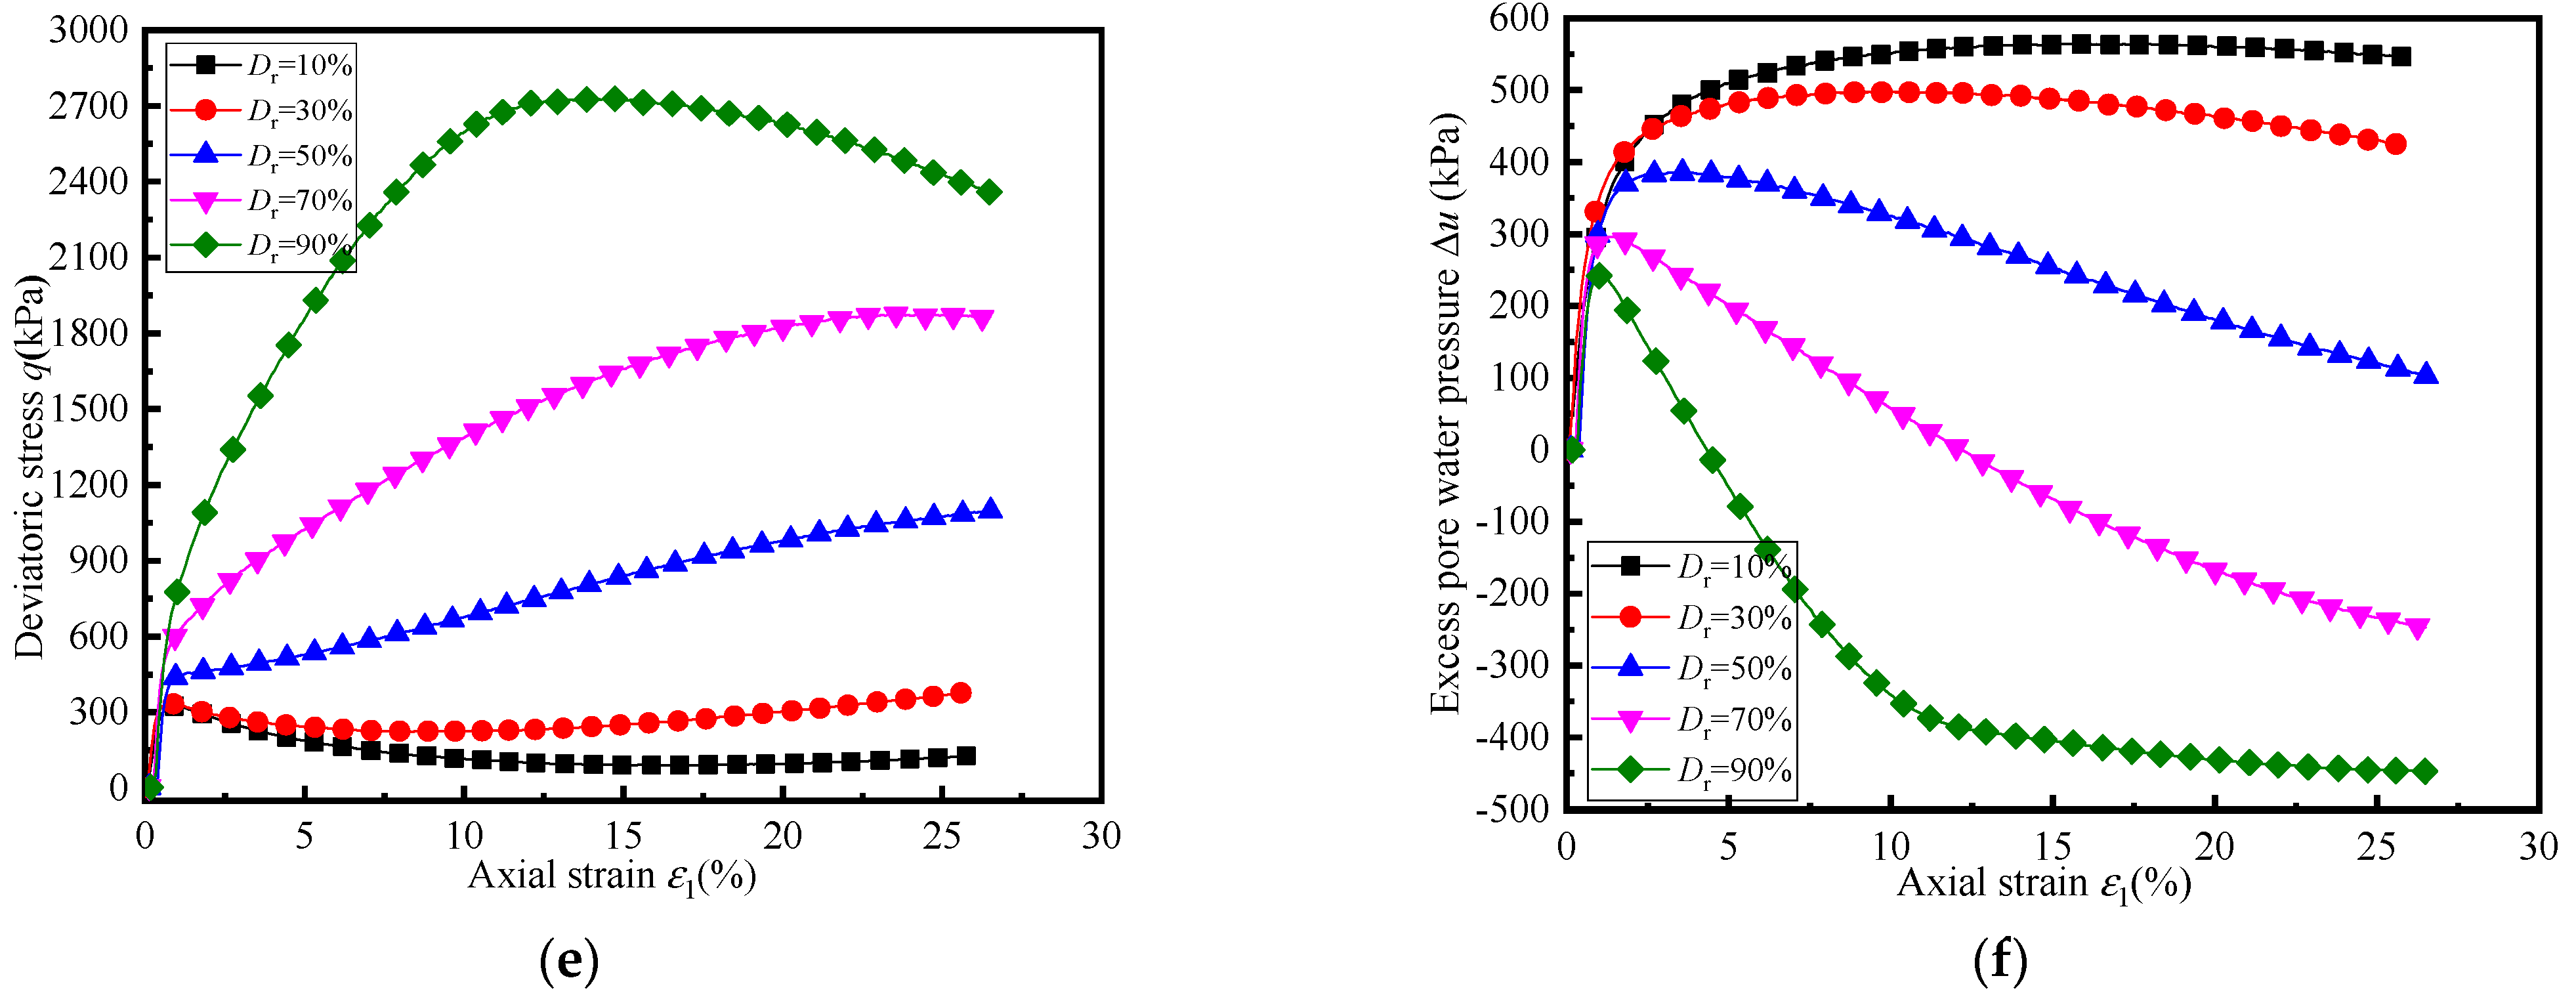
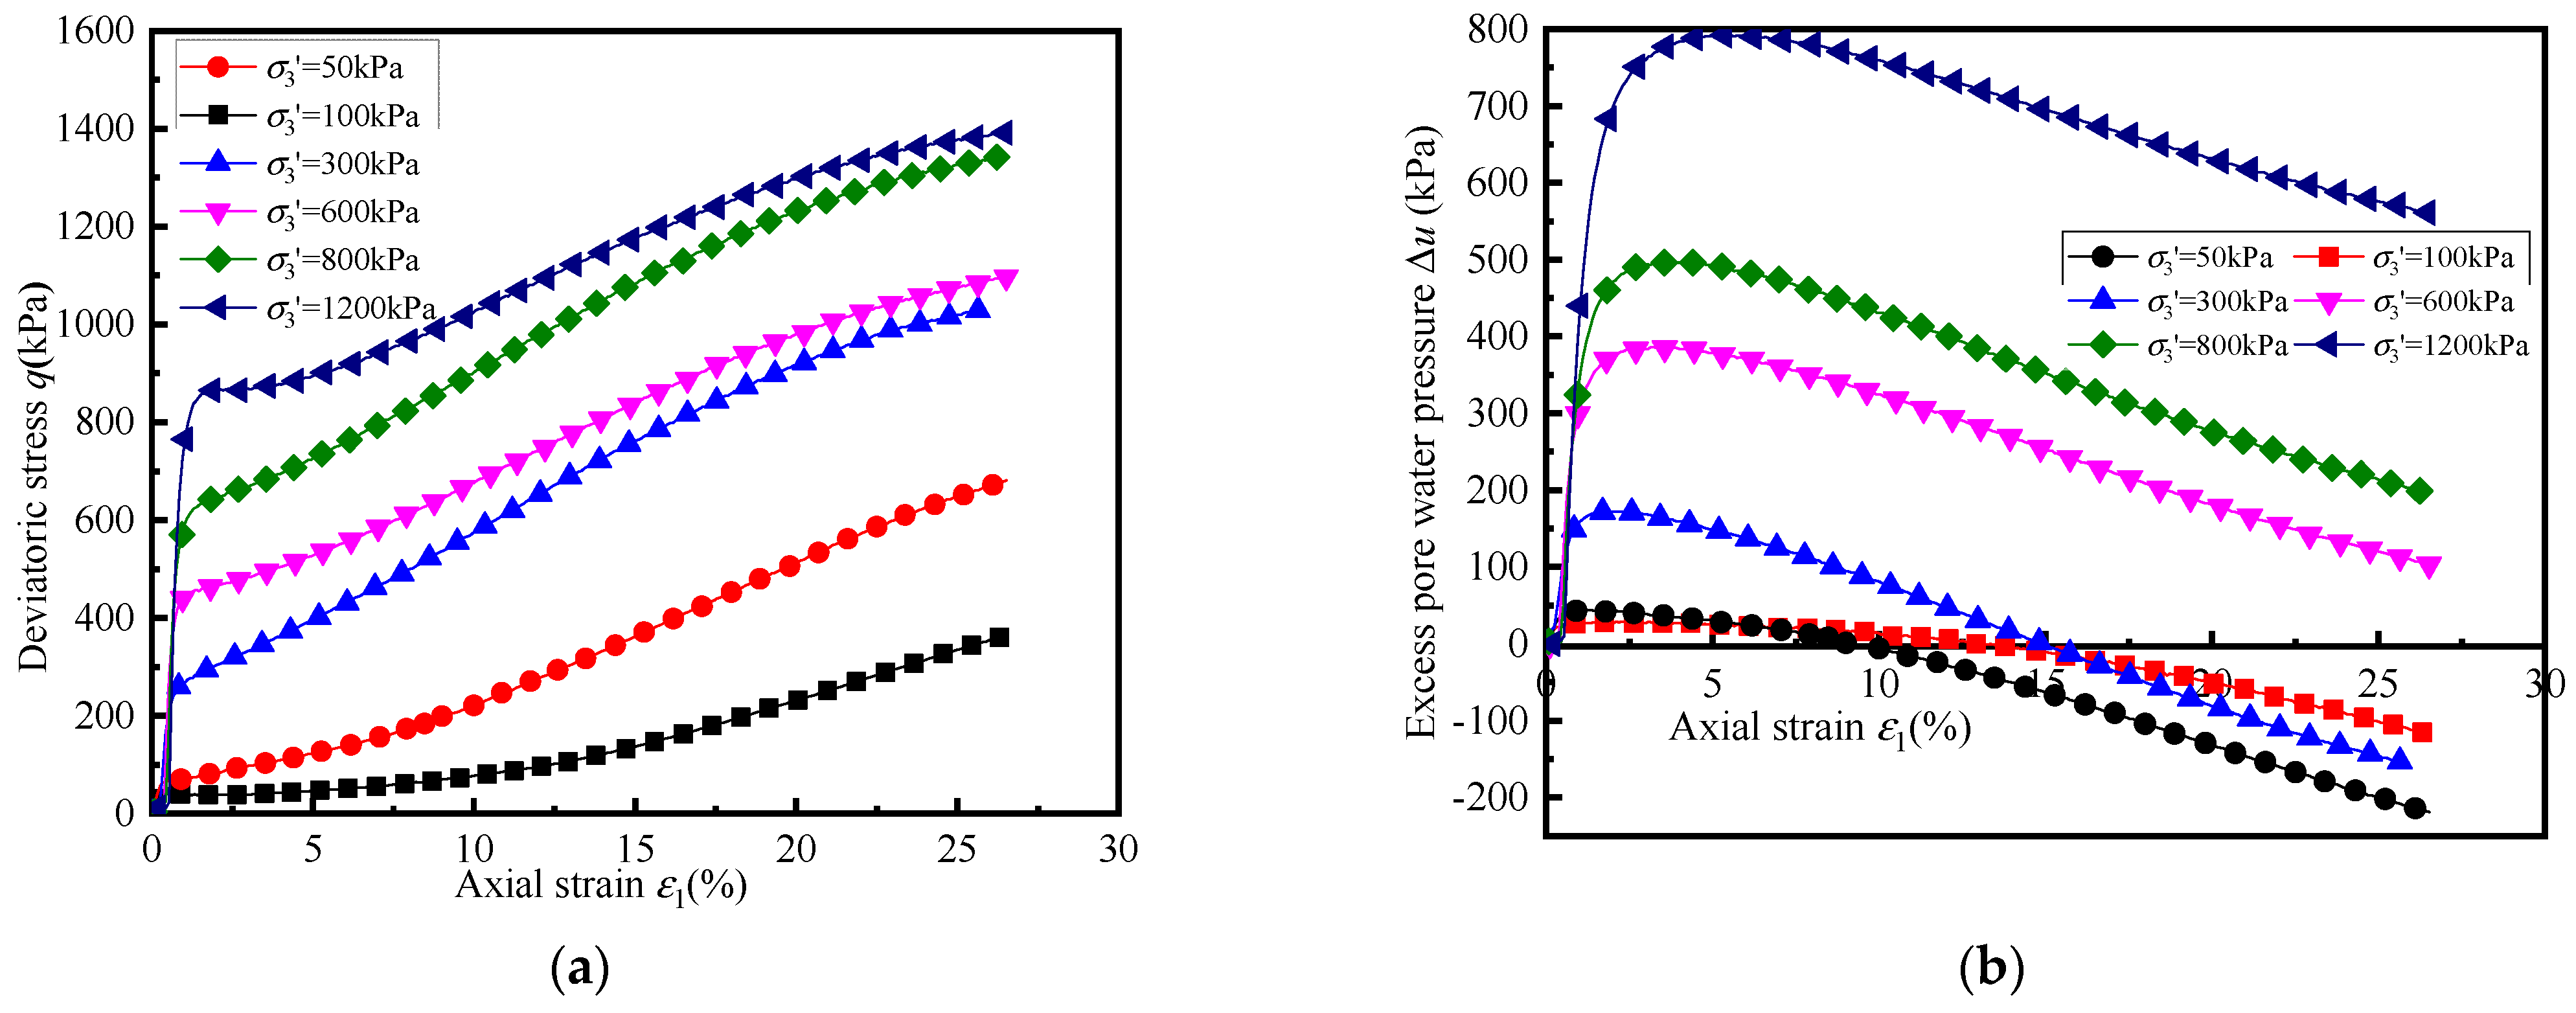
The test results of medium-dense sand under undrained conditions are shown in Figure 7. All the q-ε1 curves of the medium-dense sand specimens during the tests increased rapidly at axial strains smaller than 1%, after which the magnitudes tended to increase slowly throughout the end of the tests, and exhibited bulging failure at the end of the tests as shown in Figure 4b. The trend of the q-ε1 curves of the medium-dense sand specimens are independent of confining pressure, but its residual strength increases with the increase in confining pressure. The undrained test results indicate that medium-dense sand exhibits stress behaviour not in agreement with that of drained test results but the dilatancy behaviour in agreement with that of drained test results.
3.2. Critical State
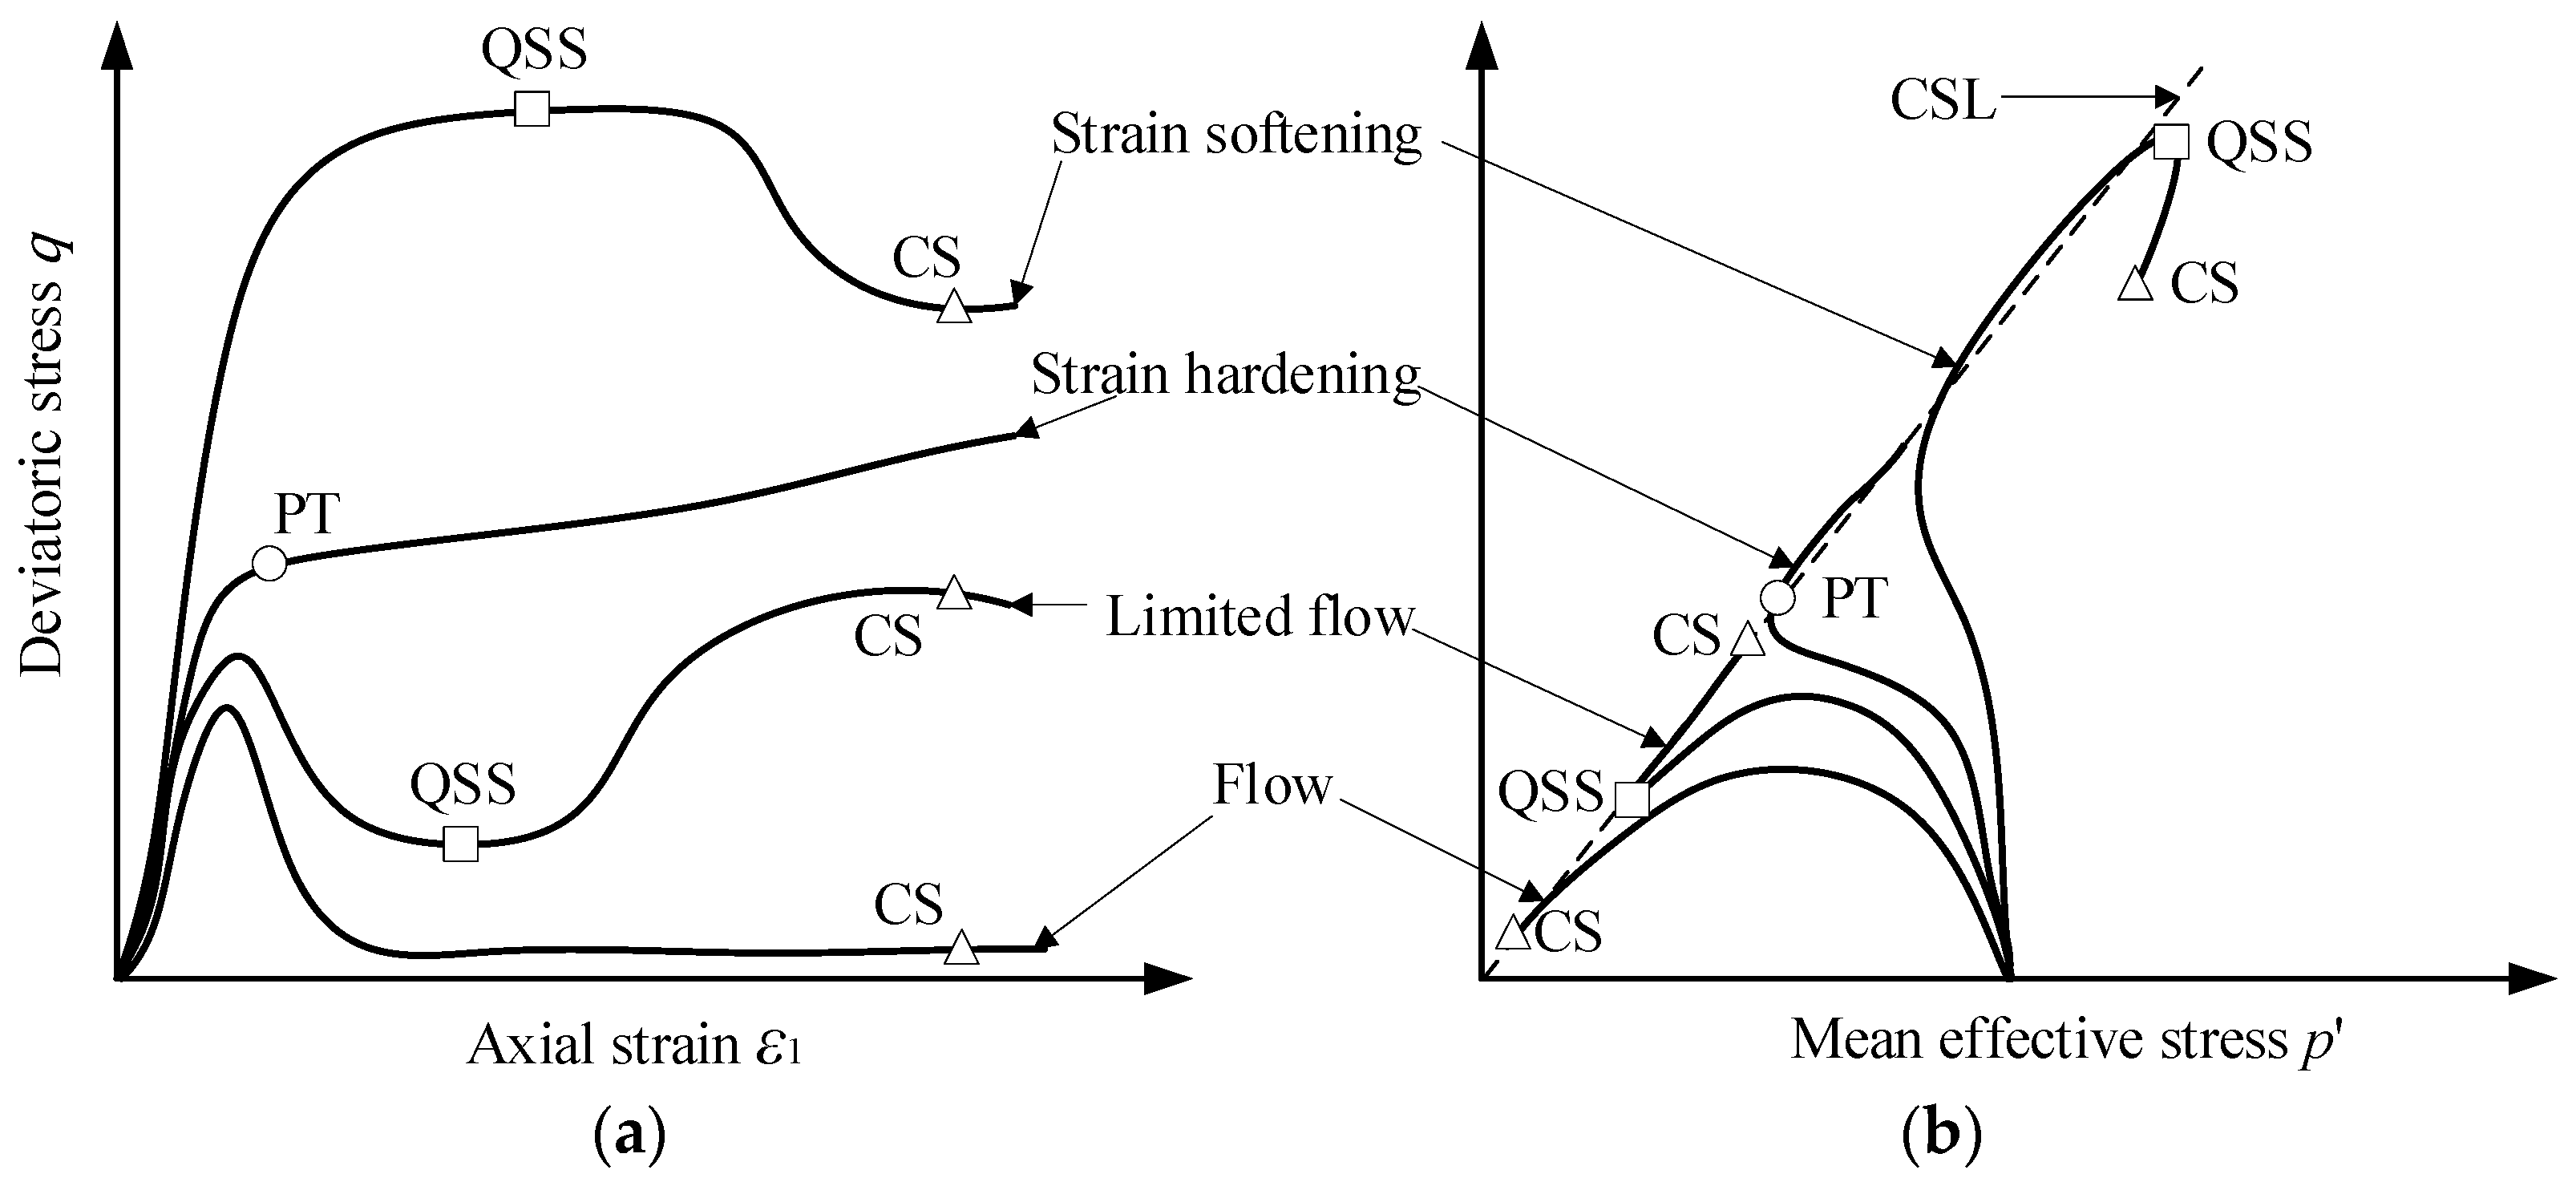
For the aeolian sand, the q-ε1 curves and the effective stress paths under undrained loading conditions in triaxial stress space exhibit four types of undrained behaviour, such as flow, limited flow, strain hardening, and strain softening as illustrated in Figure 8. In flow behaviour, the q reaches a peak value and then strain softens to the critical state (CS) at dq = 0, dp’ = 0, and du = 0; where p’= (σ1′ + 2σ3′)/3. In limited flow, after the initial peak, q drops to a transient stable value at the quasi-steady state (QSS), and the subsequent shear makes q increase again approach to the critical state. For strain hardening behaviour, the dq ≠ 0, dp’ ≠ 0, and du ≠ 0, indicate that critical state has not been reached. However, the effective stress path has reached the critical state line (CSL). The transformation of the specimen from contraction to dilatancy is called phase transformation (PT). In strain hardening behaviour, the effective stress path turns to the right at phase transformation (PT). For the strain softening behaviour, q increases to a high transient stable value at the quasi-steady state (QSS), after which shearing causes q to suddenly decrease to the critical state, which is contrary to limited flow behaviour. In the q-p’ plane, the effective stress path rises from the initial stress point to the original critical state line and moves upward along the original critical state line. After reaching the peak strength, it drops and converges to the new critical state line. The reason for the sudden stress drop is because there should be a shear band during the shearing of the specimen (Figure 4c).
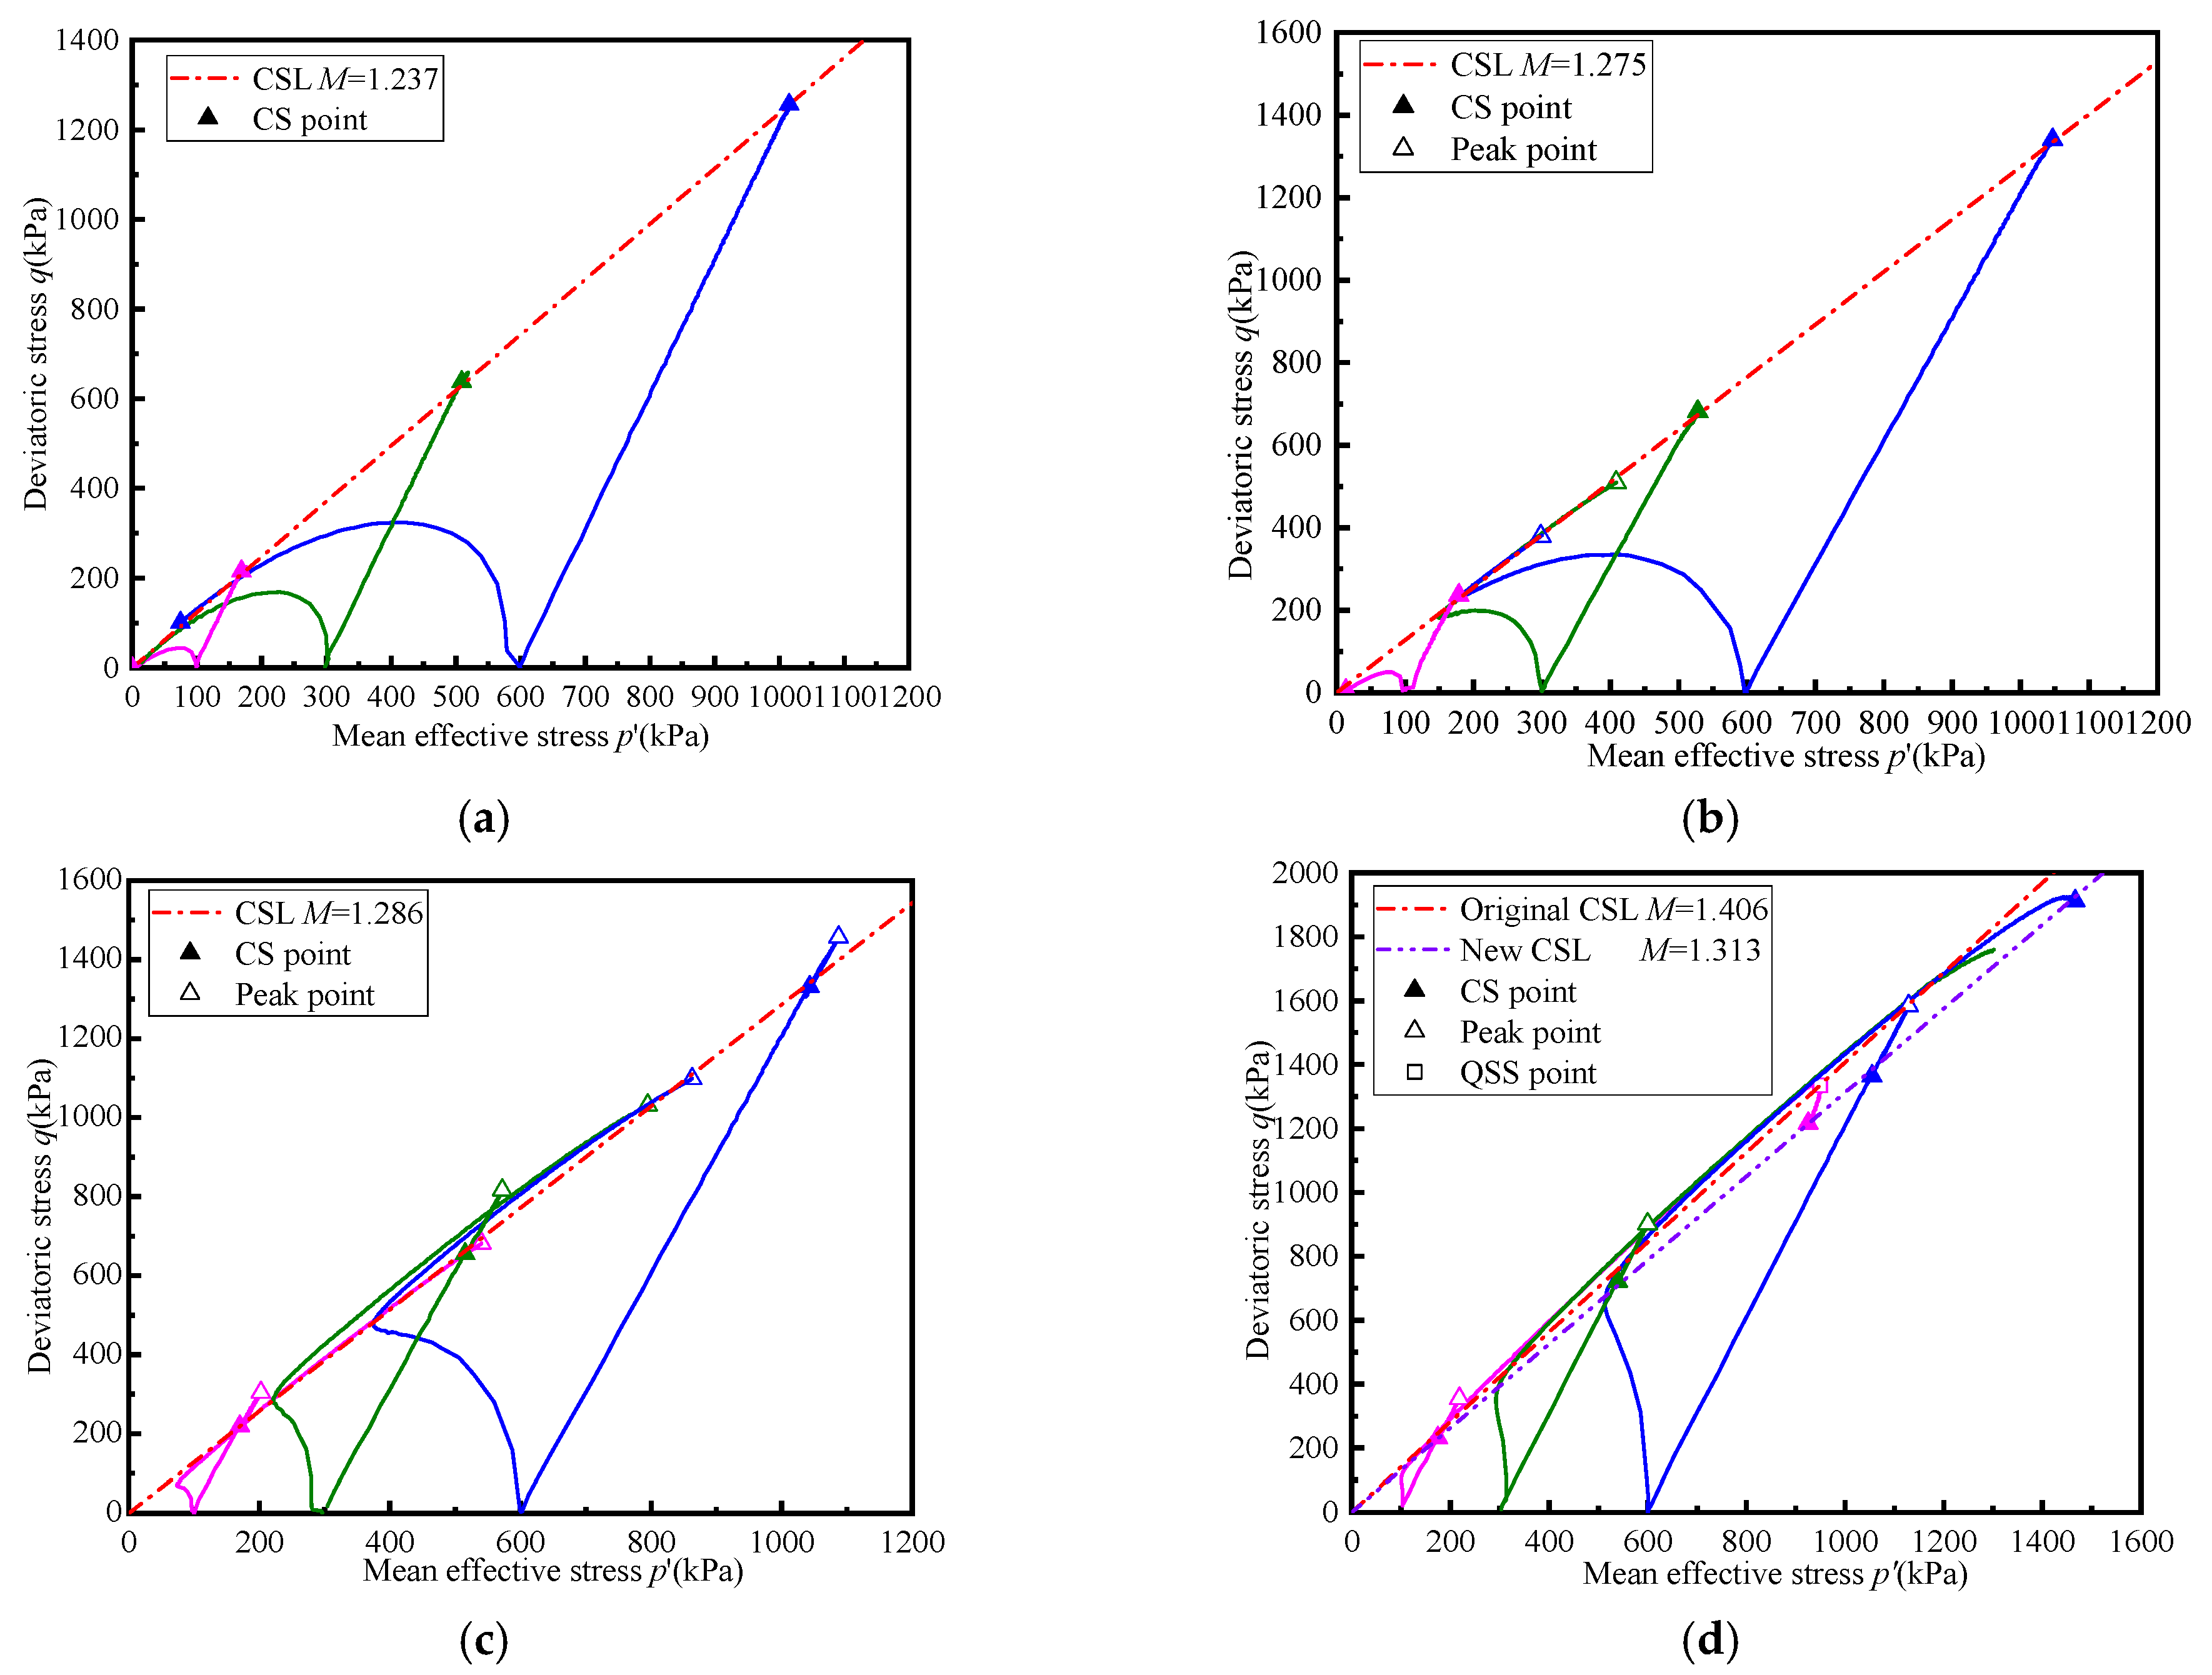
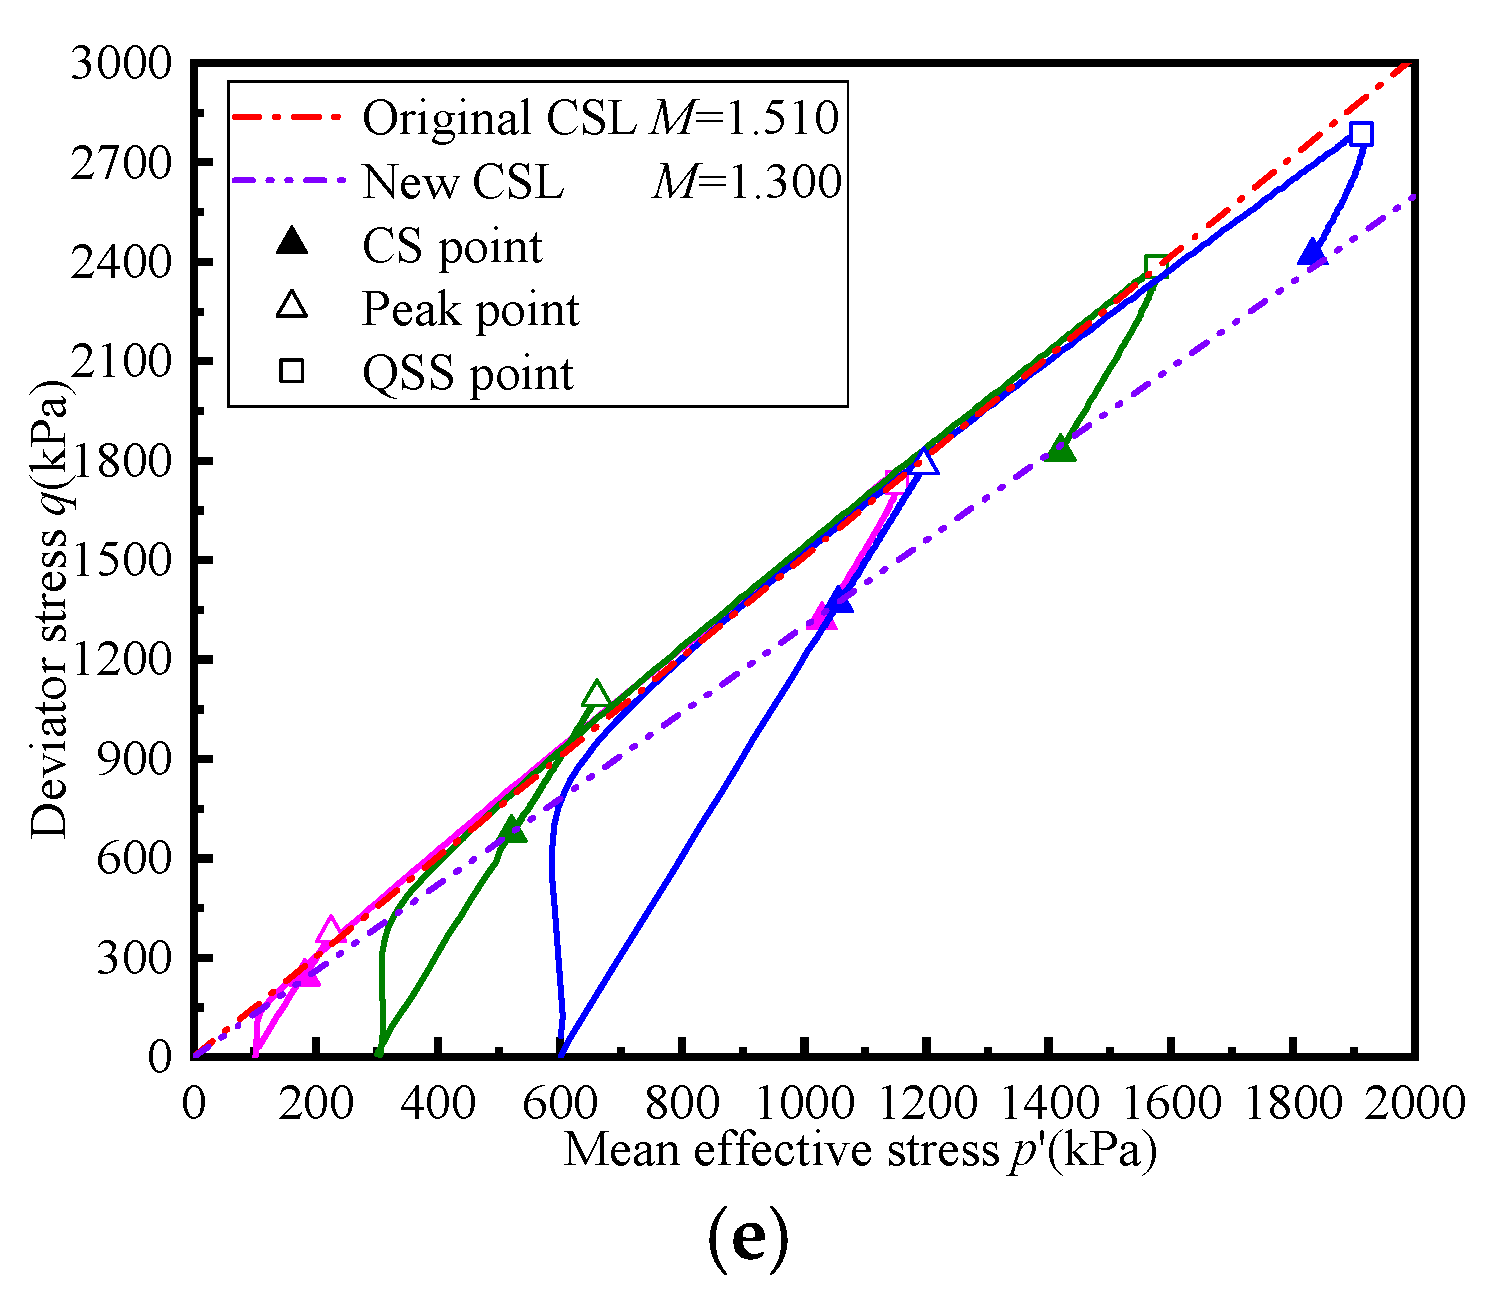
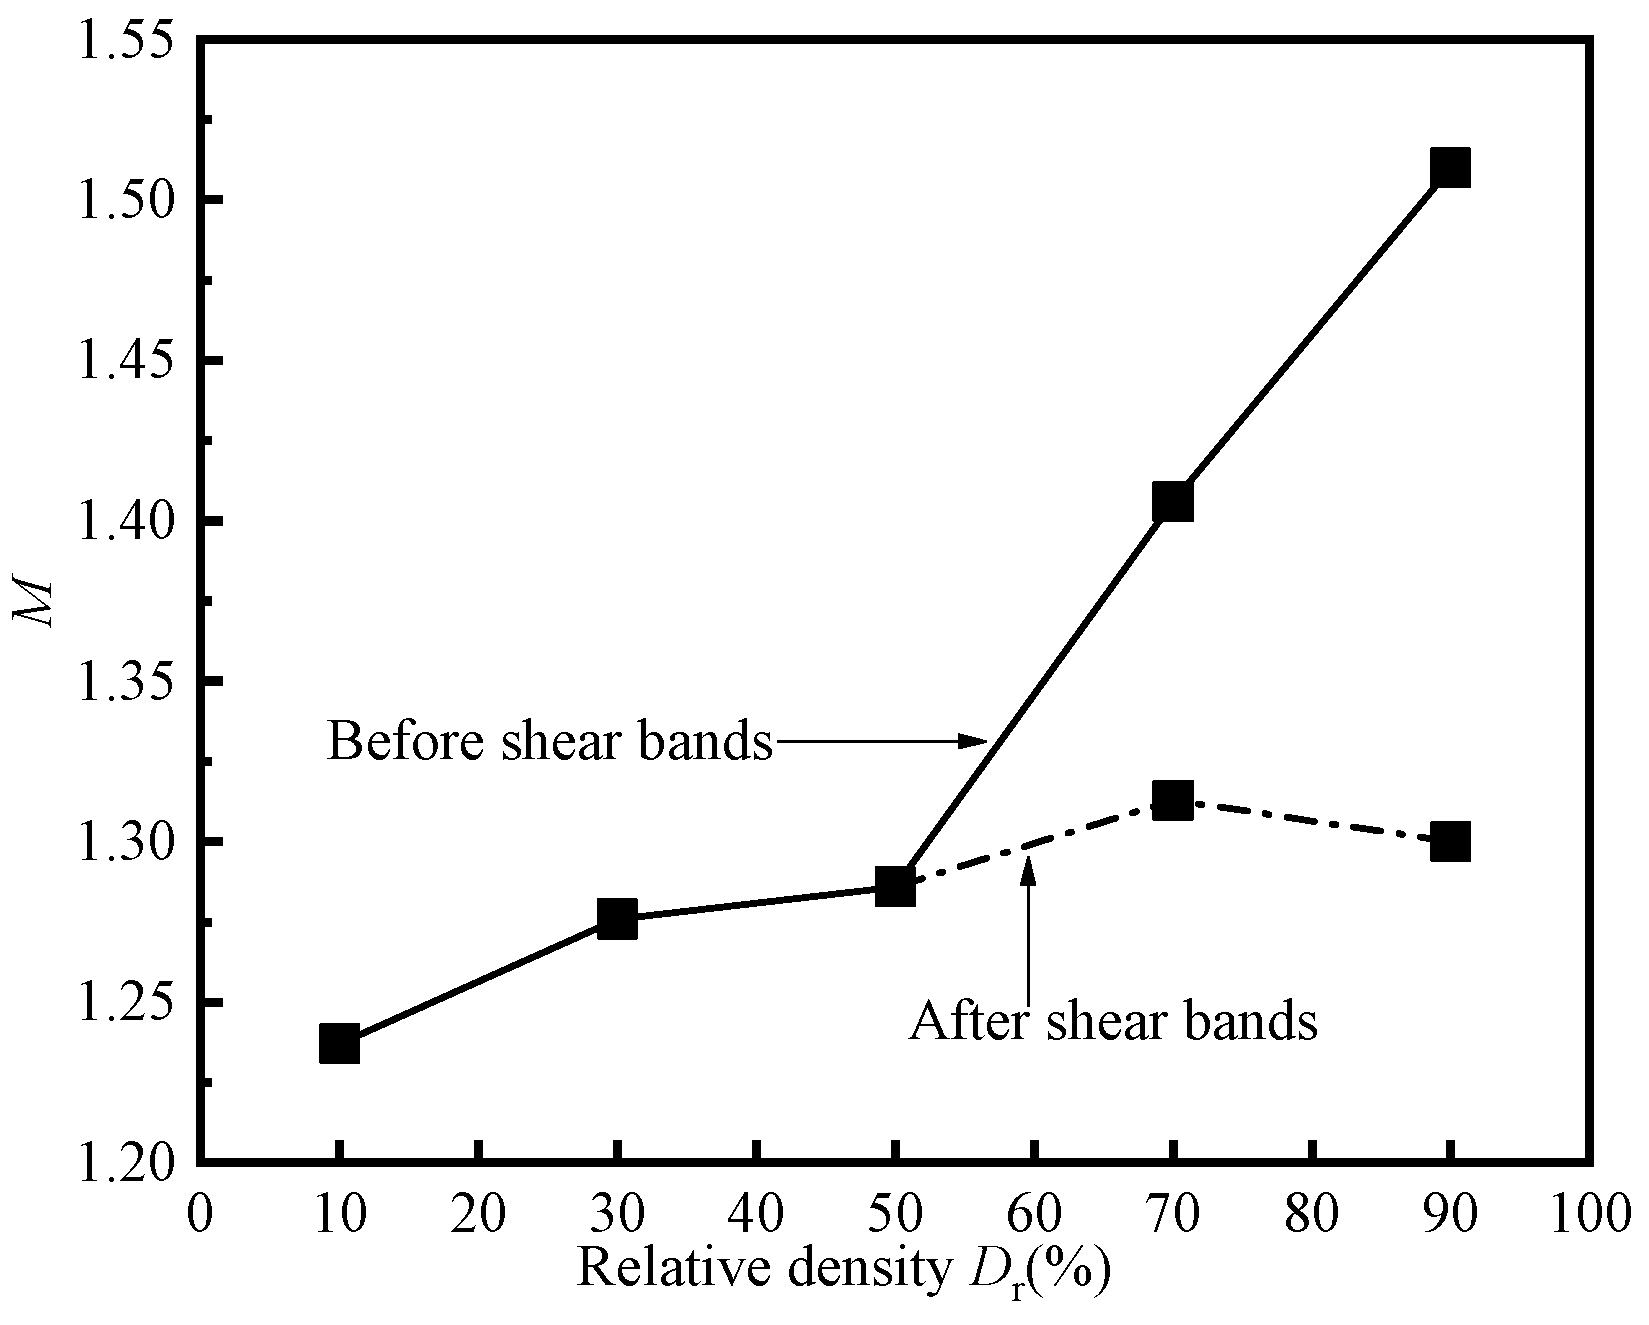
The effective stress path curves of aeolian sand specimens under drained and undrained conditions are shown in Figure 9. The points at the end of shearing for aeolian sand specimens are taken as the critical state points to estimate the critical state line in the q-p’ plane, which is represented by a solid symbol in the figure. Under drained conditions, medium-dense sand and dense sand generate strain softening, the hollow symbol is used to represent the peak stress. Some tests do not arrive at critical state, the hollow symbol is also used to represent the peak stress. All tests on aeolian sand yielded CS points in the q-p’ plane that can be fitted with a straight line passing through the origin with a slope of M. Remarkably, for loose sand as shown in Figure 9a, the peak stress does not reach the critical state line, but a smaller stress when the critical state line is reached. For the dense sand, it can be seen from Figure 9d,e that the effective stress path of the specimens drop away from the critical state line after passing through it, which indicates that the specimen has been destroyed and obvious shear band generate at the same time. So there are two critical state lines for dense sand, which are the original critical state line (Original CSL) before the shear band and the new critical state line (New CSL) after the shear band, as shown in Figure 9d,e. It is worth noting that for the loose sand, the peak strength line, the phase transition line, and the critical state line overlap into one line. However, for the dense sand, the peak strength line coincides with the original critical state line, and the phase transition line coincides with the new critical state line. Figure 10 shows the relationship between the M value and relative density. The figure shows that the M value increases with the increase in relative density, and the generation of shear band has great influence on the strength of aeolian sand.
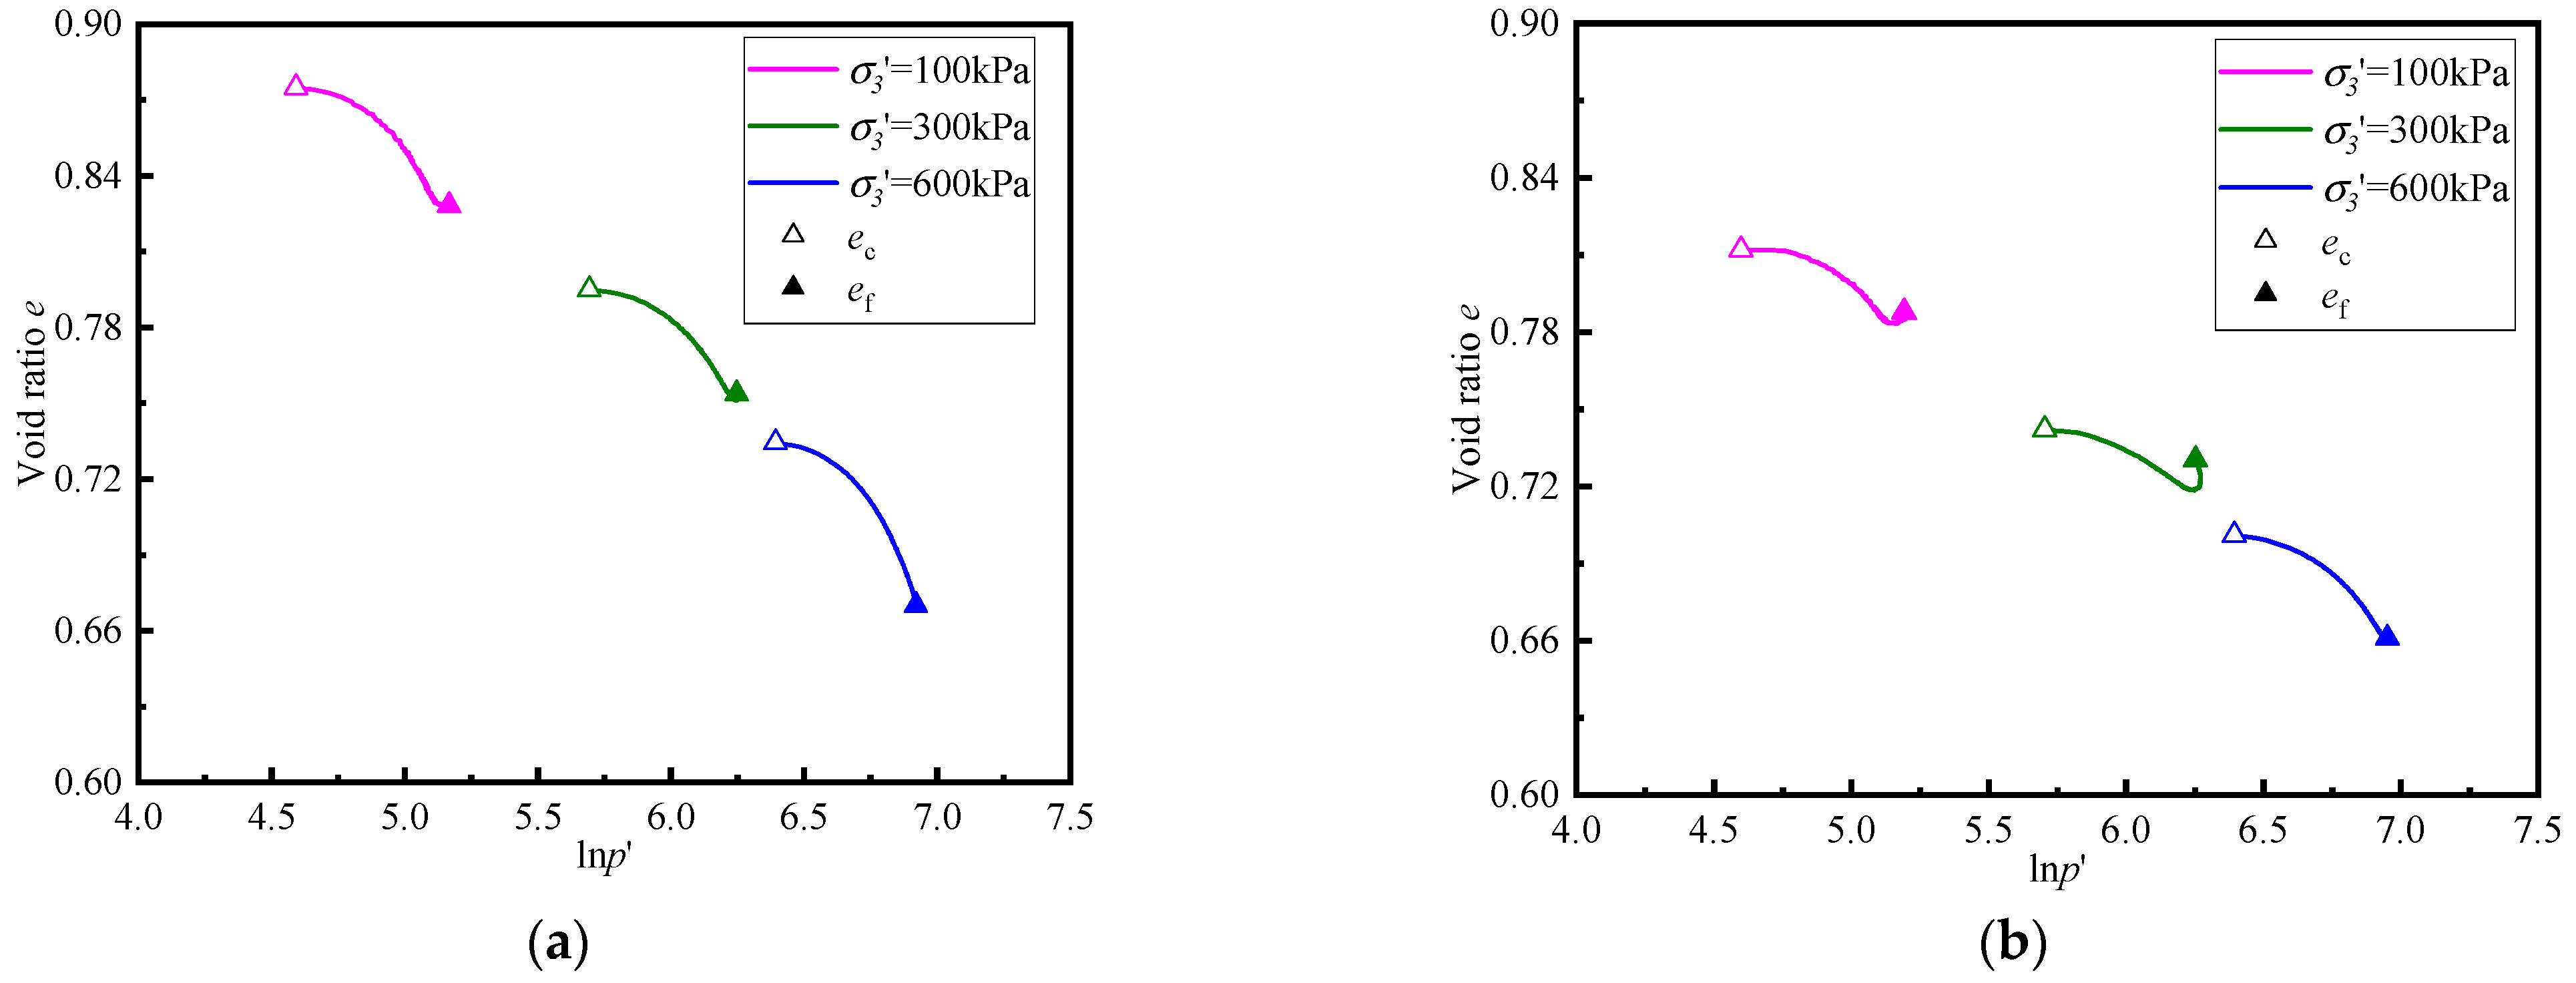
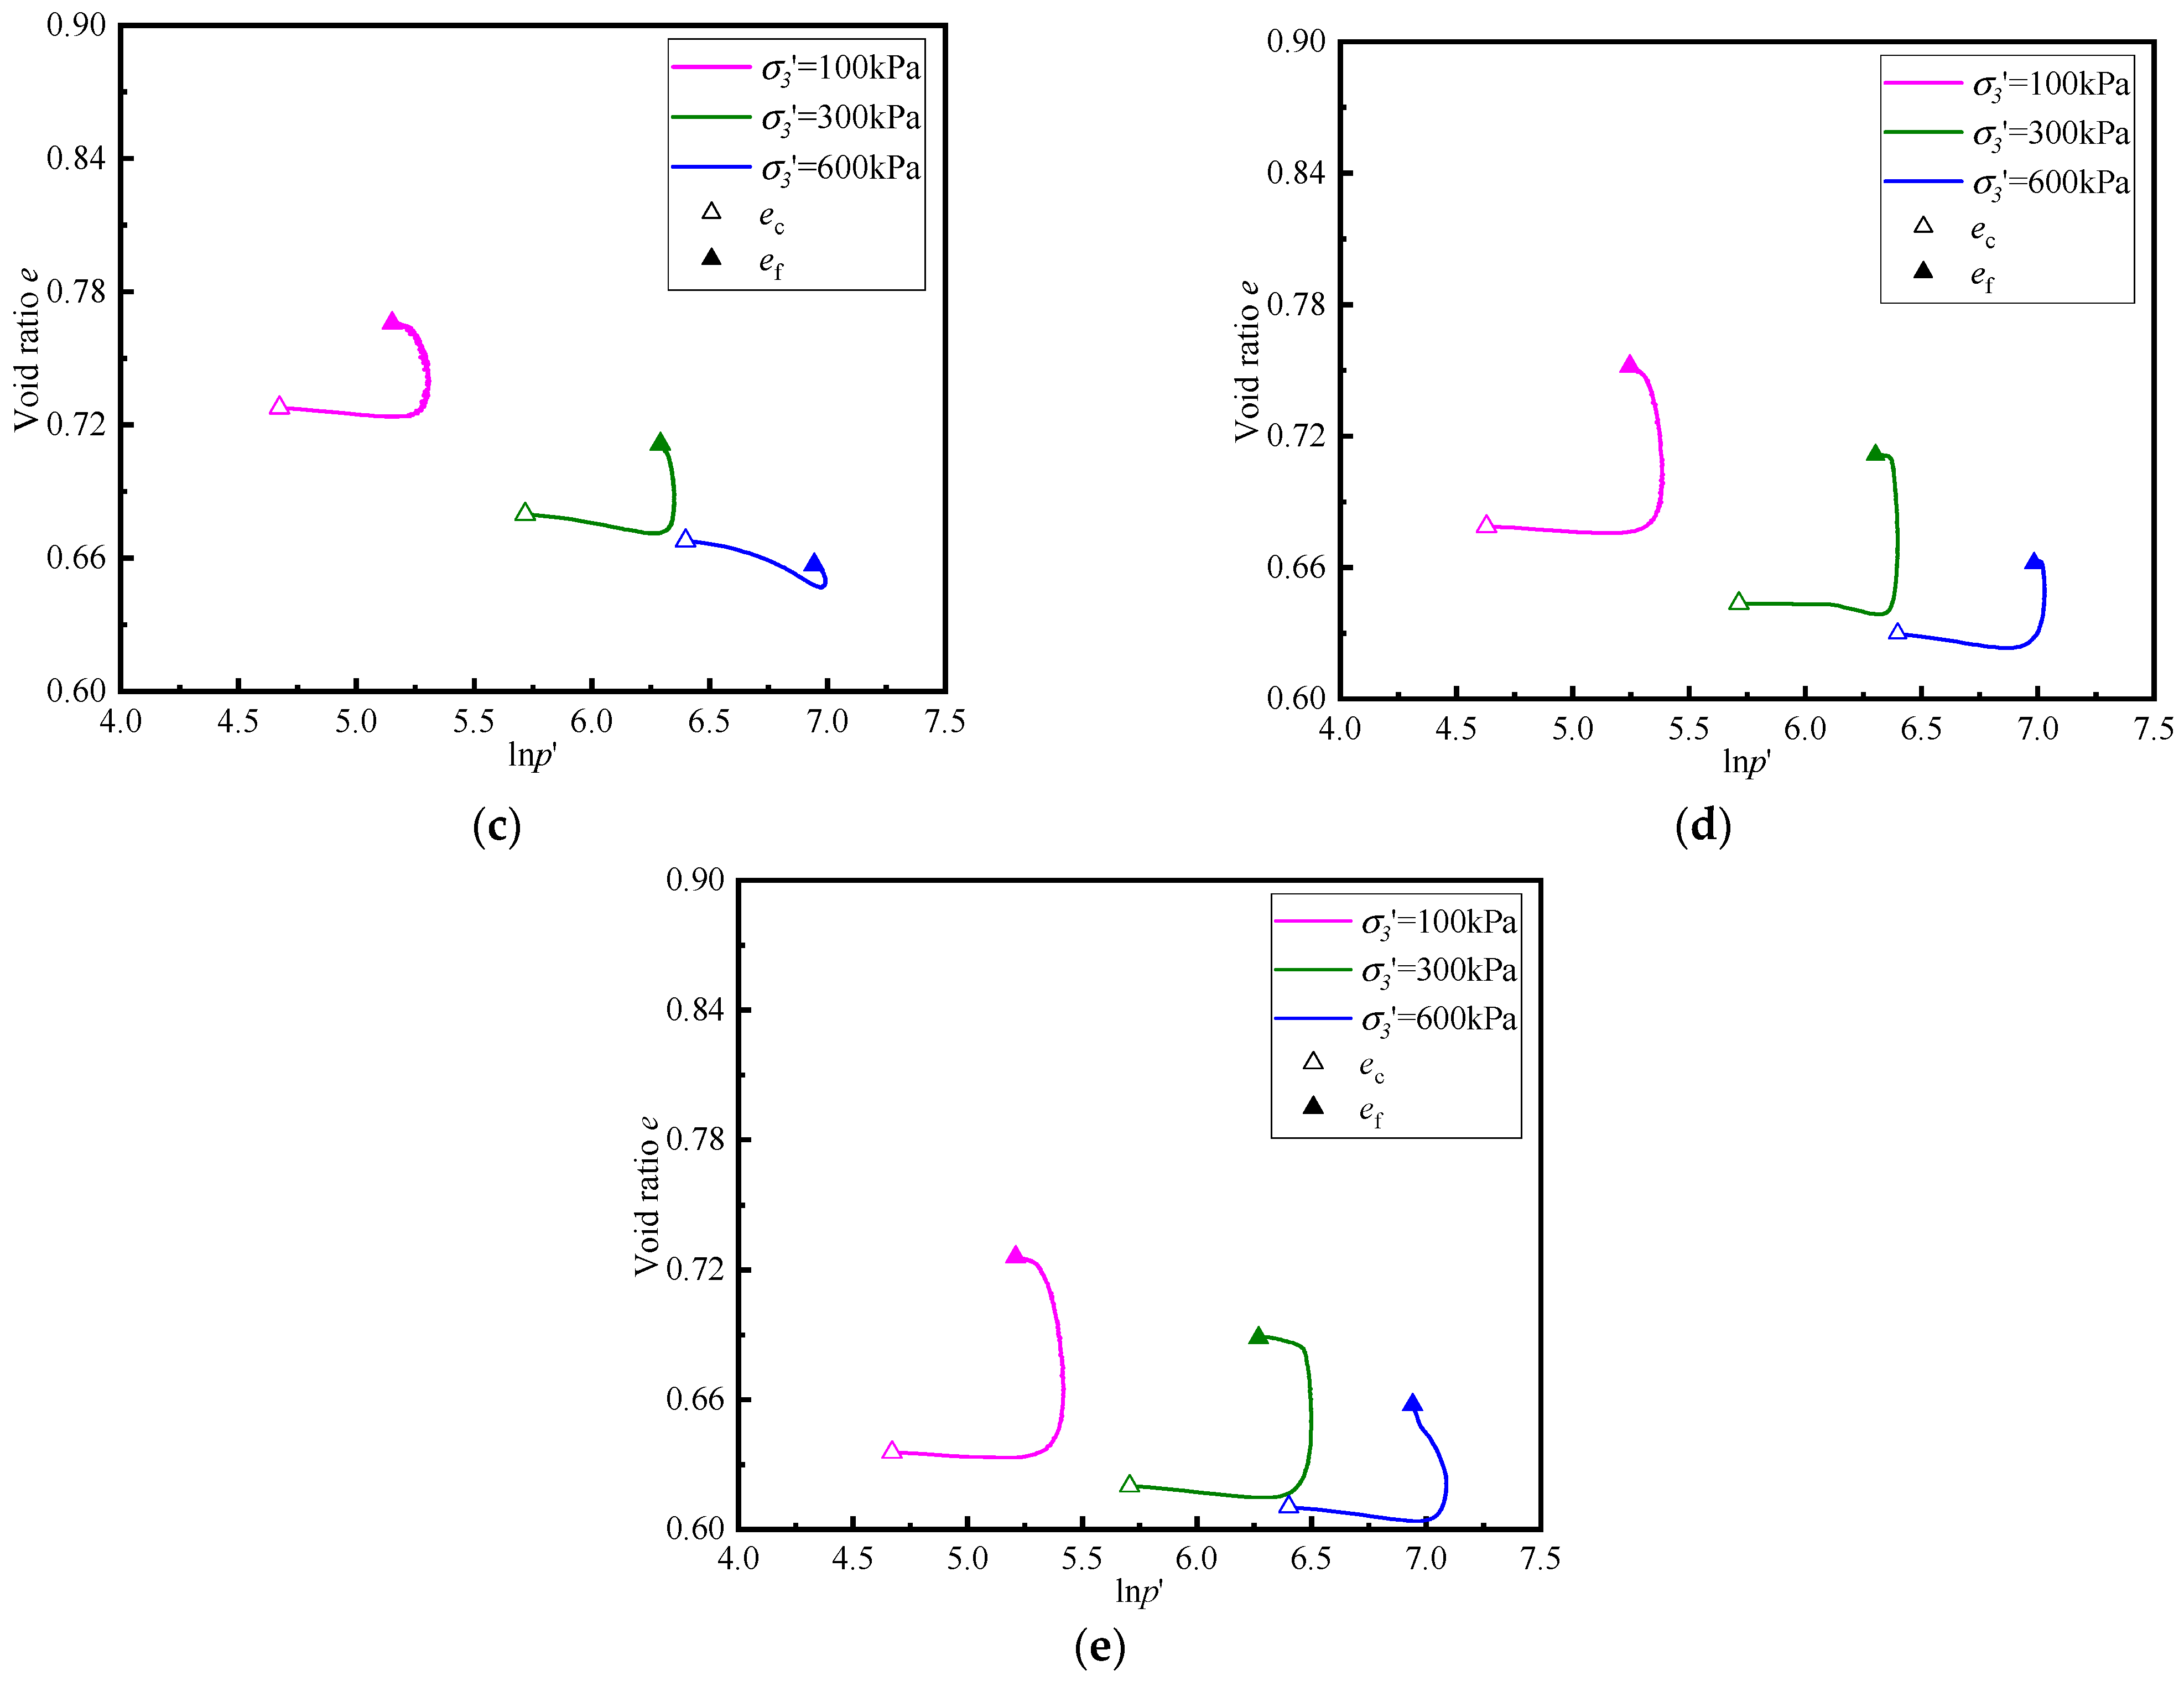
The stress paths in the e-lnp’ plane of aeolian sand specimens under drained conditions are shown in Figure 11. In this figure, ec is the void ratio after consolidation and ef is the void ratio at the end of test. Figure 11 shows the dilation of aeolian sand observed during tests at relative densities of 10% and 30% and the contraction observed during tests at greater relative densities. It is noted that the contraction of the specimen is accompanied by a rapid increase in p’, while the dilation of specimen p’ is almost constant.
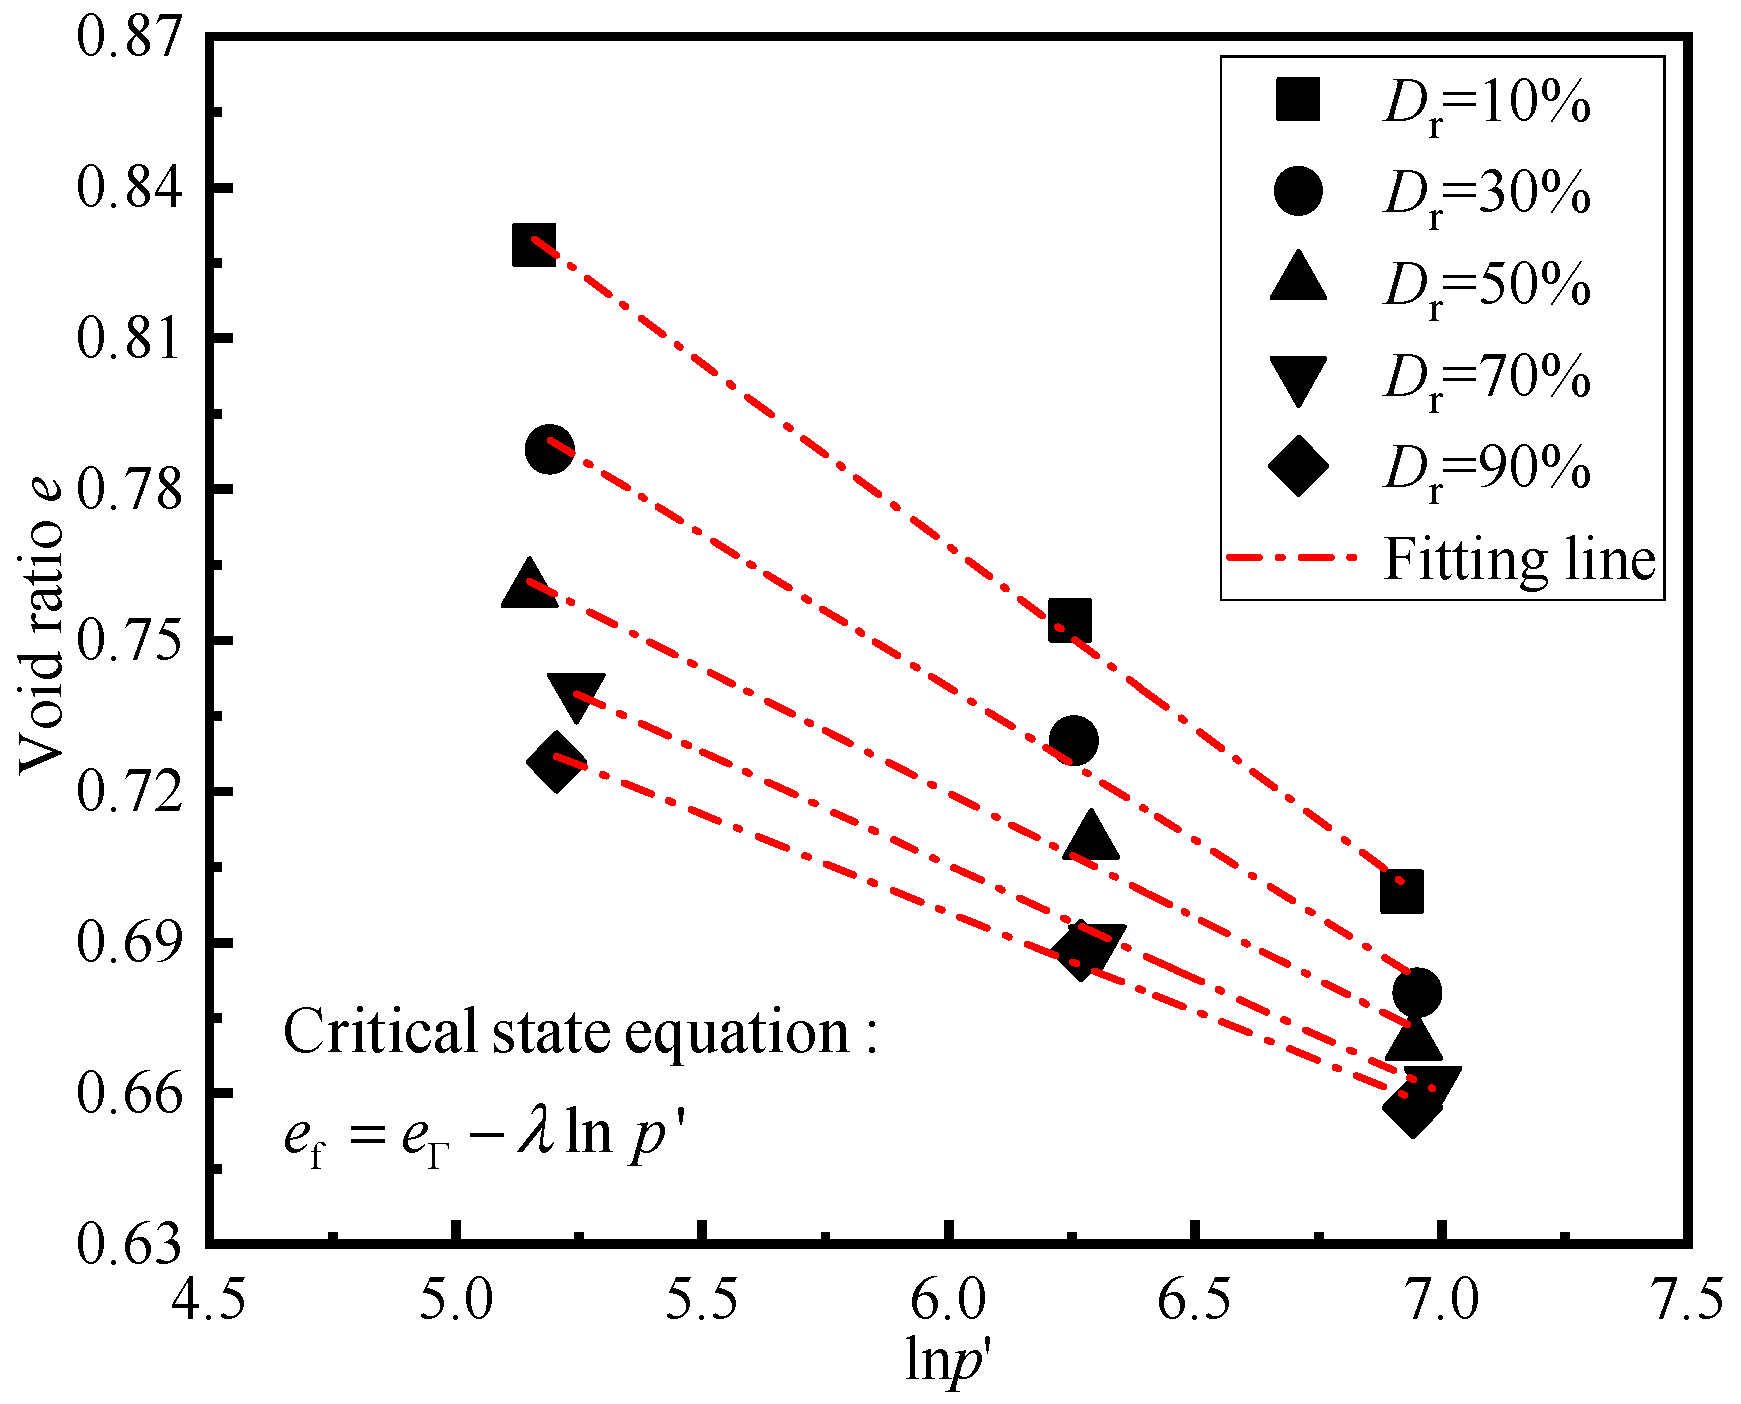
The critical state lines in e-lnp’ plane for aeolian sand specimens are approximated by fitting the critical state points obtained from drained tests, as shown in Figure 12. The linear form of the critical state line (CSL) is considered here to better reflect the aeolian sand specimens in the e-lnp’ plane, which is expressed as:
where ef is the void ratio of critical state, eᴦ is the void ratio of critical state at p’ = 0 kPa, and λ is a material constant describing the material compressibility. In e-lnp’ plane, the aeolian sand specimens with different initial densities have different critical state lines, while for other types of sand, the critical state lines in e-lnp’ plane are thought to be unique lines irrespective of the initial state. It is apparent that the CSLs are not parallel to each other, which means that the material constant λ (the slope of the CSL) is dependent on the initial state, and the λ decreases with the increase in initial relative density Dr. Meanwhile, the CSL descends with increasing initial relative density Dr, that is, the material constant eᴦ (the intercept of the CSL) decreases with increasing Dr. That is quite different from the unique CSL observed from clean sand and silty sand.
3.3. Strength Characteristic
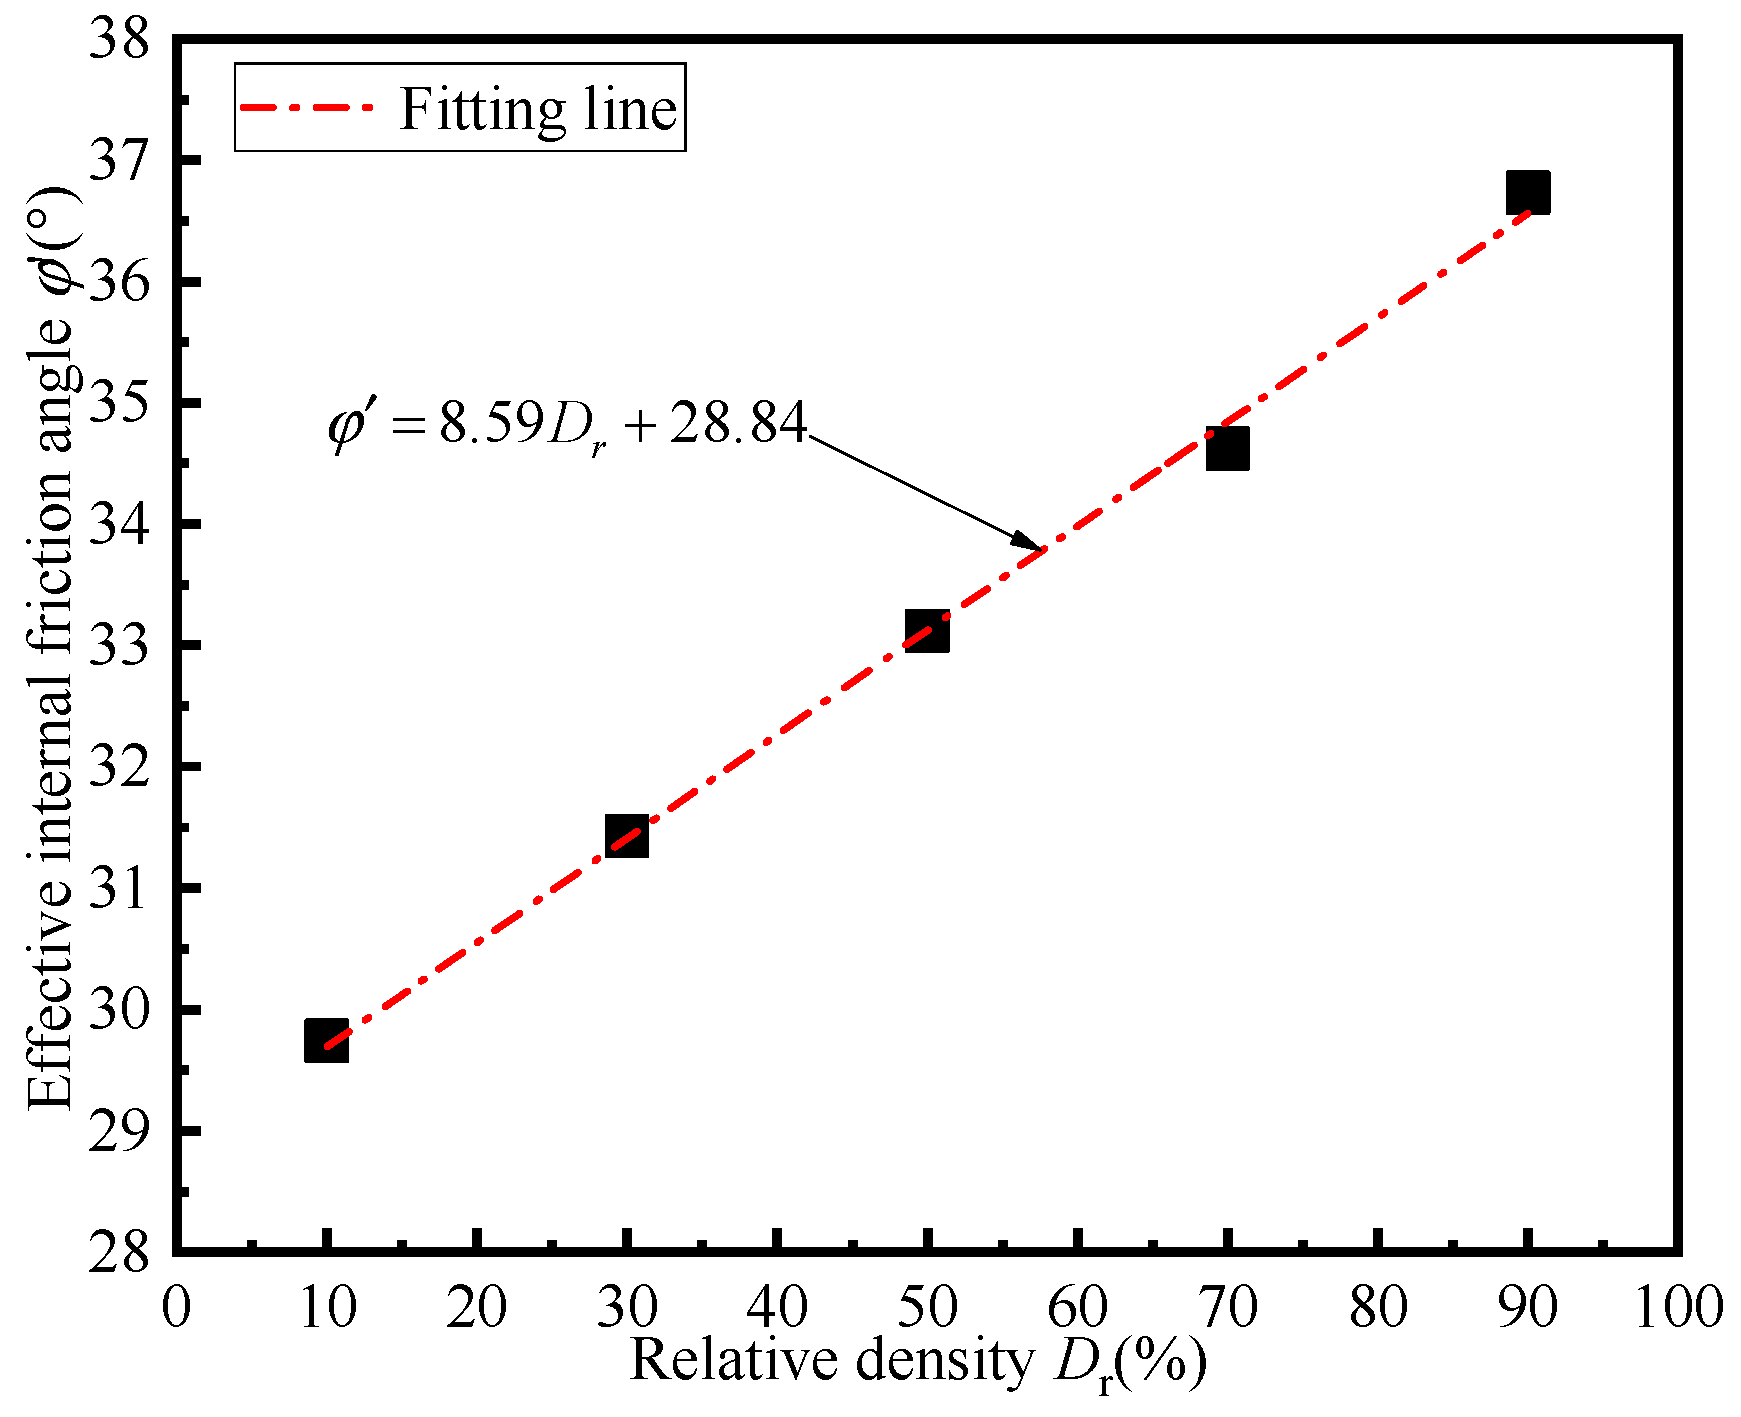
The effective internal friction angle of aeolian sand can be obtained by the Mohr stress circle envelope. Since the stress-strain relationship of aeolian sand has no obvious peak when the relative density Dr = 50%, the deviatoric stress at 15% axial strain is taken as the failure point. Through this method, the effective internal friction angle of aeolian sand with different relative densities can be obtained as shown in Figure 13. It can be seen from Figure 13 that the effective internal friction angle of aeolian sand increases approximately linearly with the increase in relative density of specimens, which can be fitted by a straight line as:
In Equation (3), α1 and β1 are fitting parameters, which are 8.59 and 28.84, respectively. It can be seen that for aeolian sand, the effective internal friction angle increases by 0.859° for every 10% increase in Dr.
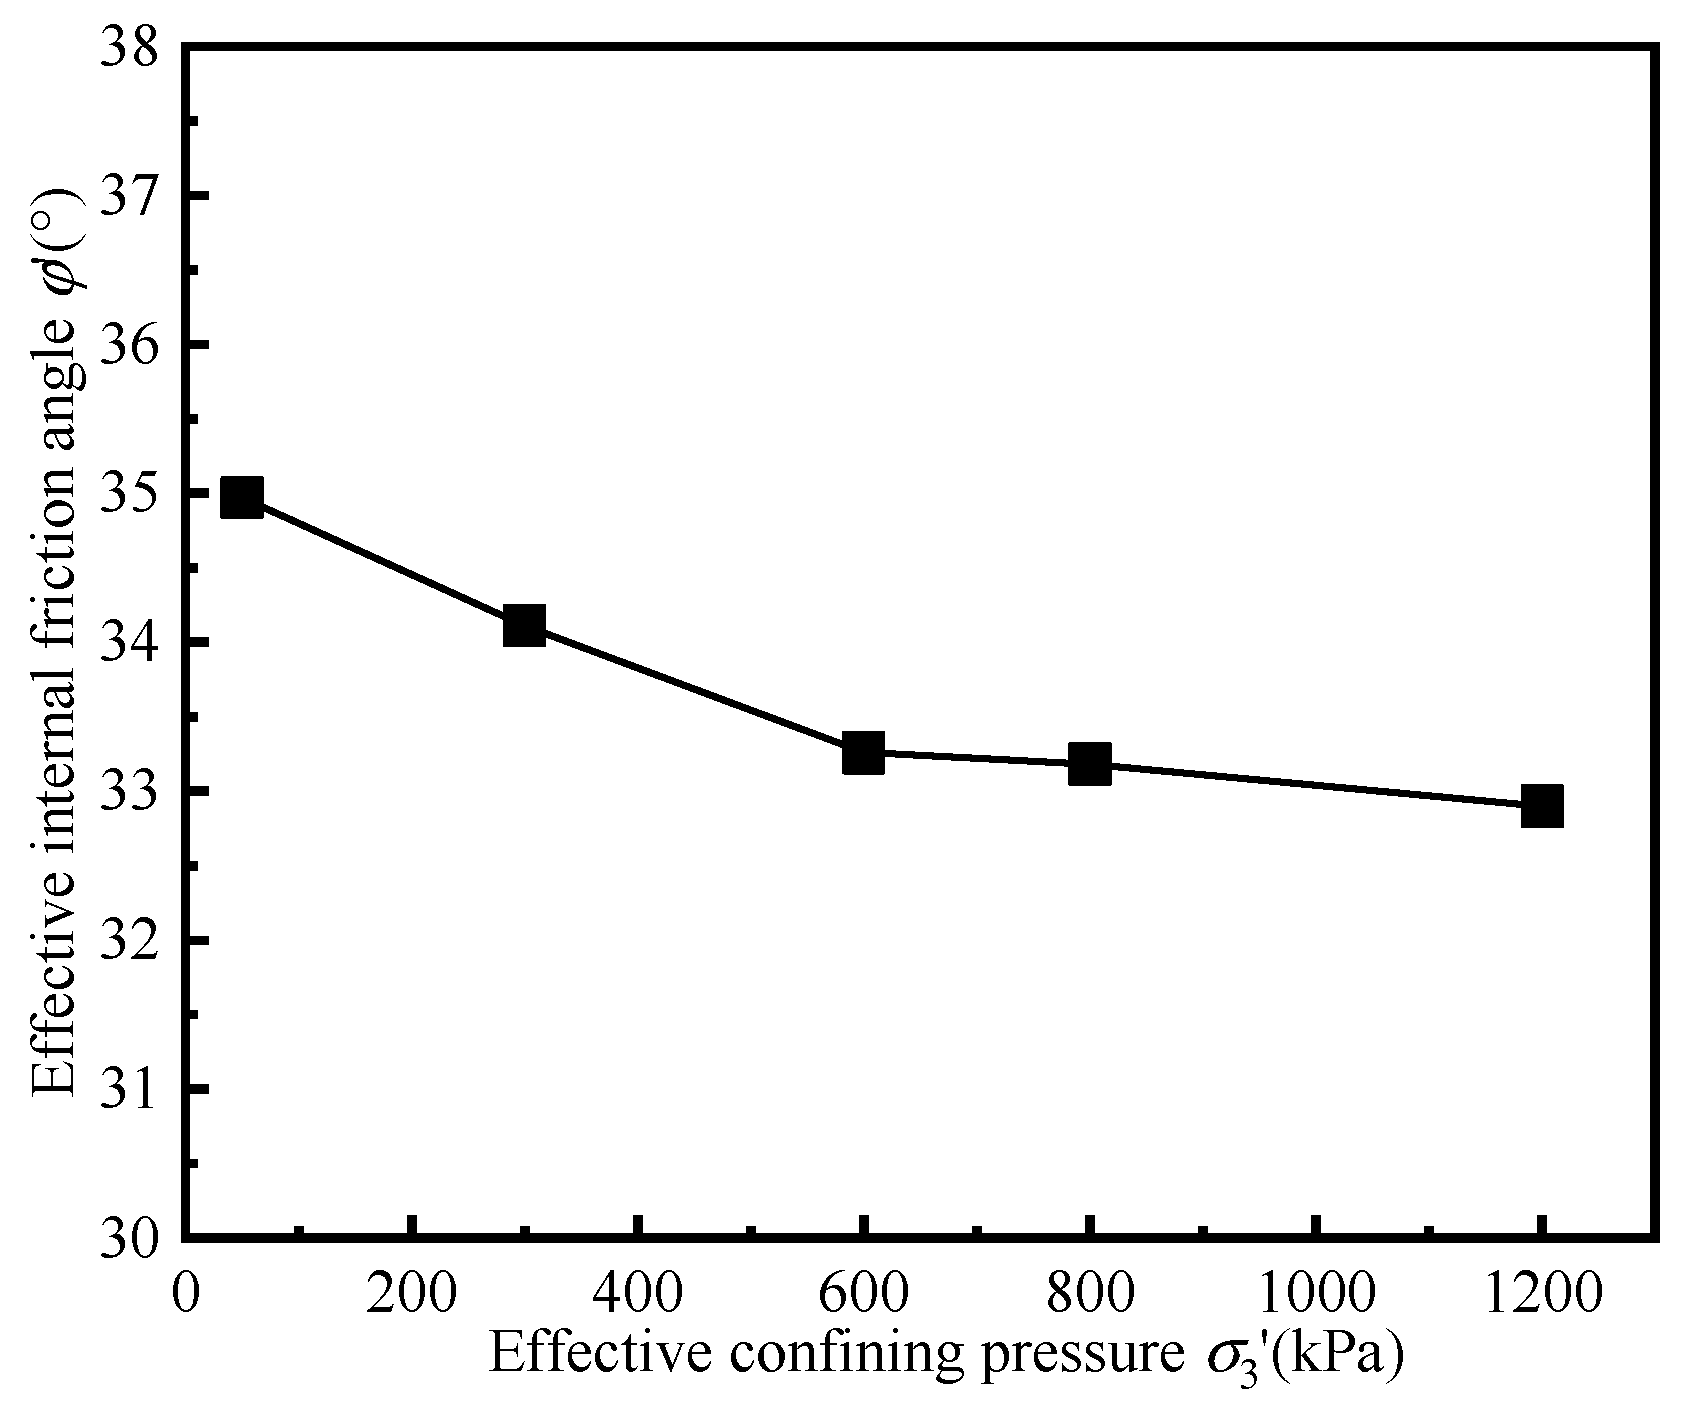
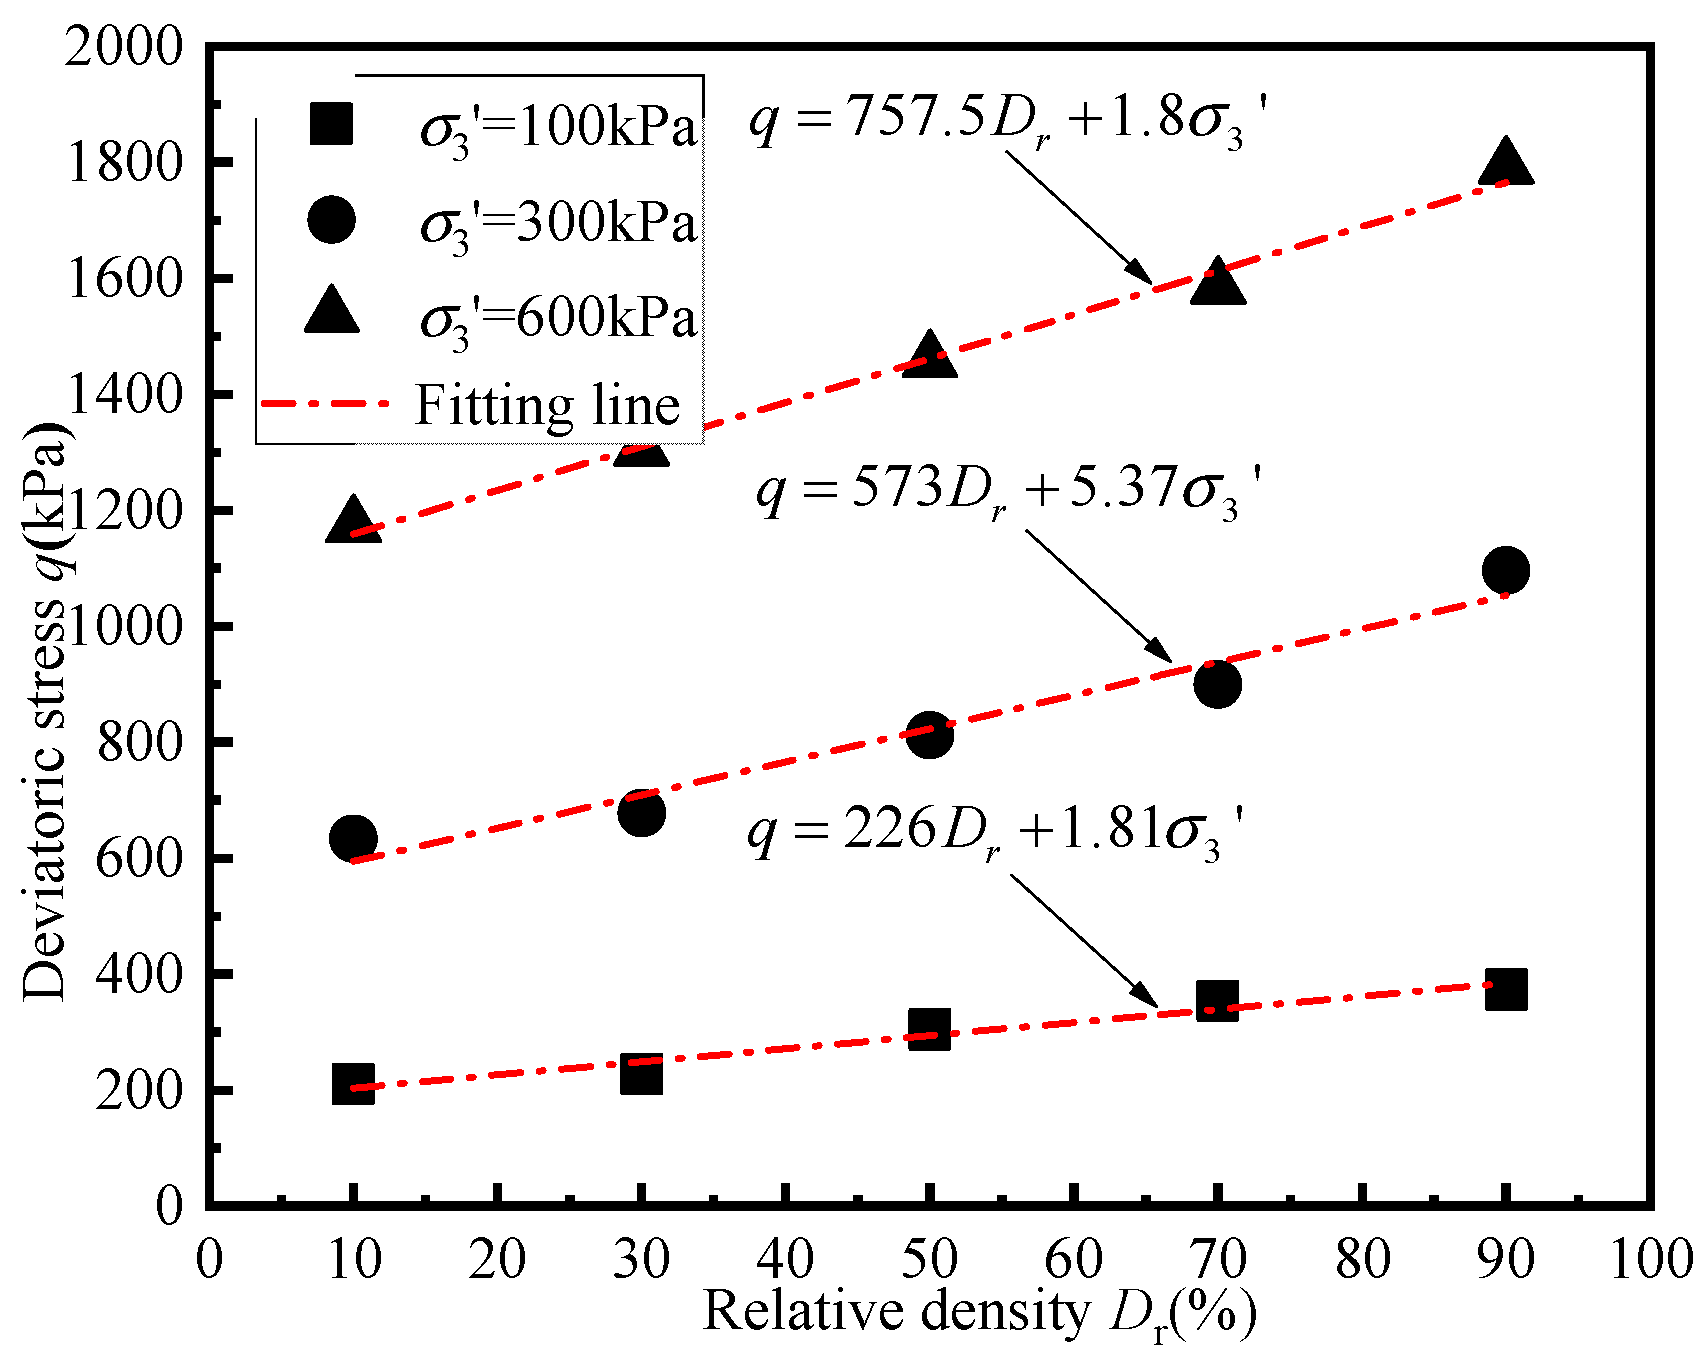
Figure 14 shows the relationship between effective internal friction angle and confining pressure of aeolian sand with relative density Dr = 50% under undrained conditions. It can be seen from Figure 14 that the effective internal friction angle decreases with the increase in confining pressure. A plot of the observed values of peak q and Dr are shown in Figure 15. Similarly, the peak q with Dr can be fitted by a straight line:
In Equation (4), α2 and β2 are the fitting parameters.
4. Conclusions
In this paper, the experiment was performed on aeolian sand, subjected to shear properties with triaxial apparatus. A study of numerous typical influencing factors on aeolian sand was also performed, such as the compactness state, effective confining pressure, and drainage condition. The main findings are as follows:
(1) The results of the drained test show that the stress and volumetric strain of all the specimens reached a constant value at the end of the tests, indicating that all the specimens reached the critical state and the residual stress in the final state tends to be the same. Under undrained conditions, the q-ε1 curves and the effective stress paths show four types of undrained behaviour, such as flow, limited flow, strain hardening, and strain softening. Meanwhile all the specimens exhibit three types of failure, such as flow slip, bulging failure, and shear band.
(2) The results of the same initial relative density but different confining pressures indicate that analogous drained and undrained stress paths are followed by the test pairs in the q-p’ plane. For dense sand (Dr = 70% and 90%), there are two critical state lines, which are the original critical state line before the shear bands and the new critical state line after the shear bands, and the generation of shear band has great influence on its strength.
(3) The critical state line in the e-lnp’ plane can be described with linear function. The critical state lines of the aeolian sand in e-lnp’ plane decrease with increasing initial relative density Dr, that is, the material constant eᴦ decreases with increasing Dr, and the λ is also not constant but decreases with the increase in Dr.
(4) Based on the results, the internal friction angles of aeolian sand are obtained by Mohr stress circle envelope. As the relative density increases, the internal friction angles increase linearly, and the effective internal friction angle increases by 0.859° for every 10% increase in Dr. The results show that the strength of aeolian sand is linearly related to its relative density and confining pressure. An empirical formula for the drained strength considering density and confining pressure is established.
This study only conducts triaxial tests under the condition of limited void ratio and confining pressure, and it is necessary to supplement triaxial static and dynamic tests with more stress paths, so as to make up for the lack of aeolian sand test results. At the same time, the influence of the sample preparation method and the microfabric of aeolian sand on its mechanical properties still needs to be tested.
Author Contributions
Conceptualization, X.L. and W.X.; methodology, W.X.; software, X.L. and W.X.; validation, W.Y.; formal analysis, L.C.; investigation, W.Y.; resources, L.C.; data curation, W.X.; writing—original draft preparation, W.X.; writing—review and editing, X.L. and W.X.; visualization, W.X.; supervision, X.L.; project administration, X.L.; funding acquisition, X.L. All authors have read and agreed to the published version of the manuscript.
Funding
This research was funded by the National Natural Science Foundation of China (No. 12162028), the Projects for Leading Talents of Science and Technology Innovation of Ningxia (No. KJT2019001), the Technology Innovation Team of Ningxia Hui Autonomous Region for multiscale mechanics and its engineering applications (2021) and the Key R&D Program of Ningxia Hui Autonomous Region Projects of International Cooperation and Exchanges (No. 2018DWHZ0084), and these supports are gratefully acknowledged.
Institutional Review Board Statement
Not applicable.
Informed Consent Statement
Not applicable.
Data Availability Statement
The data used to support the findings of this study are available from the corresponding author upon request.
Conflicts of Interest
The authors declare no conflict of interest.
References
- Kok, J.F.; Parteli, E.J.; Michaels, T.I.; Karam, D.B. The physics of wind-blown sand and dust. Rep. Prog. Phys. 2012, 75, 106901. [Google Scholar] [CrossRef] [PubMed] [Green Version]
- Li, F.Y.; Cai, L.N.; Wang, S.G.; Liu, W.; Li, X.J. Application of multi-scale microstructure analysis technique in mineral morphology and particle size distribution of aeolian sand. Land Dev. Eng. Res. 2019, 4, 13–21. [Google Scholar]
- Zeng, Z.Z.; Zhang, M.Q.; Liang, Z.R.; Shan, F.C. Engineering geological features of aeolian deposit sandy soil ground at southern edge of the tenggeli. Northwest Hydropower 2001, 2001, 18–20. [Google Scholar]
- Soroush, A.; Shourijeh, P.T.; Aghajani, H.F.; Mohammadinia, A.; Aminzadeh, A.H. A review of the sand castle test for assessing collapsibility of filters in dams. Geotech. Test. J. 2012, 35, 503–516. [Google Scholar] [CrossRef]
- Mao, H.Y.; Zhu, J.H.; Yu, X.; Bi, J.X.; Li, Z.J. Dynamic compaction study of eliminating the collapsibility of eolian deposit fine sand. J. Eng. Geol. 2019, 27, 745–752. [Google Scholar]
- Yuan, Y.Y.; Wang, X.C. Experimental research on compactness characteristics of aeolian sand. Chin. J. Geotech. Eng. 2007, 29, 360–365. [Google Scholar]
- Li, Z.Y.; Cao, Y.W.; Liang, N.X.; Mei, Y.J. Compactness mechanism of aeolian sand. China J. Highw. Transp. 2006, 19, 6–11. [Google Scholar]
- Yin, Y.Z.; Wang, Y.L. Study of key parameters in the process of aeolian sand compactibility. Appl. Mech. Mater. 2014, 580–583, 278–282. [Google Scholar] [CrossRef]
- Feng, Y. Compactness Technology Study of Tengger Desert Aeolian Sand Subgrade. Master’s Thesis, Chang’an University, Xi’an, China, 2017. [Google Scholar]
- Mao, X.S.; Hou, Z.J.; Kong, L.K. Experimental study on moisture migration of wind-blown sand. J. Hydraul. Eng. 2010, 41, 142–147. [Google Scholar]
- Deng, Y.H.; Li, X.A.; Wang, Z.J.; Song, Y.X.; Peng, J.B. Study on dynamic strength of the aeolian sand in mu us desert area. Eng. Mech. 2012, 29, 281–286. [Google Scholar]
- Song, Y.X. Test Study on the Mechanical Property of the Aeolian Sand and the Bearing Capacity of the Aeolian Sand Ground of Mu Us Desert. Ph.D. Thesis, Chang’an University, Xi’an, China, 2011. [Google Scholar]
- Zhang, D.Y. Study on the Engineering Characteristics of Eolian Sand in Mu Us Desert. Master’s Thesis, Chang’an University, Xi’an, China, 2009. [Google Scholar]
- Li, X.F.; Ma, Z.G.; Lu, W.N.; Wang, J.D. True-triaxial drained test of tengger desert sand. Adv. Civ. Eng. 2020, 2020, 8851165. [Google Scholar] [CrossRef]
- Li, X.F.; Lu, W.N.; Ma, Z.G.; Tuo, N. The undrained characteristics of tengger desert sand from true triaxial testing. Adv. Civ. Eng. 2021, 2021, 6320397. [Google Scholar] [CrossRef]
- Xia, H.; Zhang, J.; Cai, J.; Pan, H.; She, X. Study on the bearing capacity and engineering performance of aeolian sand. Adv. Mater. Sci. Eng. 2020, 2020, 3426280. [Google Scholar] [CrossRef]
- Zhang, L.; Zhang, Q.; Li, Z.; Wang, H. Test on compaction reinforcement effect of sand. Adv. Mater. Sci. Eng. 2020, 2020, 3685619. [Google Scholar] [CrossRef]
- Farhangi, V.; Moses, K.; Marten, G. Effect of micropiles on clean sand liquefaction risk based on CPT and SPT. Appl. Sci. 2020, 10, 3111. [Google Scholar] [CrossRef]
- Castro, G. Liquefaction of Sands. Ph.D. Thesis, Harvard University, Cambridge, MA, USA, 1969. [Google Scholar]
- Verdugo, R.; Ishihara, K. The steady state of sandy soils. Soils Found. 1996, 36, 81–91. [Google Scholar] [CrossRef] [Green Version]
- Yoshimine, M.; Ishihara, K. Flow potential of sand during liquefaction. Soils Found. 1998, 38, 189–198. [Google Scholar] [CrossRef] [Green Version]
- Cai, Z.Y.; Li, X.S. Deformation characteristics and critical state of sand. Chin. J. Geotech. Eng. 2004, 2004, 697–701. [Google Scholar]
- Cai, Z.Y.; Li, X.S. Effects of material state on the small strain behavior of dry sand. Rock Soil Mech. 2004, 2004, 10–14. [Google Scholar]
- Xu, R.Q.; Wang, X.C.; Zhu, J.F.; Zhang, J. Experiment of initial relative density effects on sand strength. J. Jiangsu Univ. (Nat. Sci. Ed.) 2012, 33, 345–349. [Google Scholar]
- Zhu, J.G.; Shi, J.W.; Luo, X.H.; Ren, J.; Chen, F. Experimental study on stress-strain-strength behavior of sand with different densities. Chin. J. Geotech. Eng. 2016, 38, 336–341. [Google Scholar]
- Leib, A.R.; Sharma, A.; Penumadu, D. Visualization of localized deformations of sand in drained triaxial compression using digital image correlation. Geotech. Test. J. 2020, 44, 782–798. [Google Scholar] [CrossRef]
- Sun, Y.; Gao, Y.; Shen, Y. Mathematical aspect of the state-dependent stress–dilatancy of granular soil under triaxial loading. Géotechnique 2019, 69, 158–165. [Google Scholar] [CrossRef]
- Sun, Y.; Wichtmann, T.; Sumelka, W.; Kan, M.E. Karlsruhe fine sand under monotonic and cyclic loads: Modelling and validation. Soil Dyn. Earthq. Eng. 2020, 133, 106119. [Google Scholar] [CrossRef]
- Sun, Y.; Sumelka, W.; Gao, Y.; Nimbakar, S. Phenomenological fractional stress–dilatancy model for granular soil and soil-structure interface under monotonic and cyclic loads. Acta Geotech. 2021, 16, 3115–3132. [Google Scholar] [CrossRef]
- Song, S.; Sun, Y. Flow liquefaction instability and the permissible range of fractional order of sand. Eur. J. Environ. Civ. Eng. 2019, 26, 1182–1197. [Google Scholar] [CrossRef]
- Guo, W.L.; Cai, Z.Y. Study on the critical state of a unique silty sand. Granul. Matter 2022, 24, 19. [Google Scholar]
- Jin, Y.F.; Wu, Z.X.; Yin, Z.Y.; Shen, J.S. Estimation of critical state-related formula in advanced constitutive modeling of granular material. Acta Geotech. 2017, 12, 1329–1351. [Google Scholar] [CrossRef]
- Li, X.S.; Dafalias, Y.F.; Wang, Z.L. State-dependent dilatancy in critical-state constitutive modeling of sand. Can. Geotech. J. 1999, 36, 599–611. [Google Scholar] [CrossRef]
- Carrera, A.; Coop, M.R.; Lancellotta, R. Influence of grading on the mechanical behaviour of Stava tailings. Géotechnique 2011, 61, 935–946. [Google Scholar] [CrossRef]
- Chiu, C.F.; Fu, X.J. Interpreting undrained instability of mixed soils by equivalent intergranular state parameter. Géotechnique 2008, 58, 751–755. [Google Scholar] [CrossRef]
- Murthy, T.G.; Loukidis, D.; Carraro, J.A.H.; Prezzi, M. Undrained monotonic response of clean and silty sands. Géotechnique 2007, 57, 273–288. [Google Scholar] [CrossRef]
- Yang, J.; Wei, L.M. Collapse of loose sand with the addition of fines: The role of particle shape. Géotechnique 2012, 62, 1111–1125. [Google Scholar] [CrossRef] [Green Version]
- Ahmed, S.S.; Martinez, A. Triaxial compression behavior of 3d printed and natural sands. Granul. Matter 2021, 23, 1–21. [Google Scholar] [CrossRef]
- ASTM International. Standard Practice for Classification of Soils for Engineering Purposes (Unified Soil Classification System); ASTM International: West Conshohocken, PA, USA, 2017. [Google Scholar]
- ASTM International. Standard Test Methods for Maximum Index Density and Unit Weight of Soils Using a Vibratory Table; ASTM International: West Conshohocken, PA, USA, 2016. [Google Scholar]
- ASTM International. Standard Test Methods for Minimum Index Density and Unit Weight of Soils and Calculation of Relative Density; ASTM International: West Conshohocken, PA, USA, 2016. [Google Scholar]
- Hao, D.X.; Yue, C.; Chen, R.; Ren, J.; Chen, F. Shear characteristics and stress-dilation relation of medium sand under normal to high pressures. Chin. J. Geotech. Eng. 2020, 4, 765–772. [Google Scholar]
- Ladd, R.S. Preparing test specimens using under compaction. Geotech. Test. J. 1978, 1, 16–23. [Google Scholar]
Figure 1.
Grain size distribution curve of aeolian sand.

Figure 2.
The photos of the specimen. (a) Layered sand; (b) Prepared specimen.

Figure 3.
The tool for controlling specimen height.

Figure 4.
The deformation of specimens at the end of shear under undrained condition. (a) σ3′ = 300 kPa, Dr = 10%; (b) σ3′ = 300 kPa, Dr = 50%; and (c) σ3′ = 300 kPa, Dr = 90%.
Figure 4.
The deformation of specimens at the end of shear under undrained condition. (a) σ3′ = 300 kPa, Dr = 10%; (b) σ3′ = 300 kPa, Dr = 50%; and (c) σ3′ = 300 kPa, Dr = 90%.

Figure 5.
Deviatoric stress-axial strain-volumetric strain behaviour of the aeolian sand under drained condition. (a,b) σ3′ = 100 kPa; (c,d) σ3′ = 300 kPa; and (e,f) σ3′ = 600 kPa.
Figure 5.
Deviatoric stress-axial strain-volumetric strain behaviour of the aeolian sand under drained condition. (a,b) σ3′ = 100 kPa; (c,d) σ3′ = 300 kPa; and (e,f) σ3′ = 600 kPa.

Figure 6.
Deviatoric stress-axial and strain-excess pore water pressure behaviour of the aeolian sand under undrained condition. (a,b) σ3′ = 100 kPa; (c,d) σ3′ = 300 kPa; (e,f) σ3′ = 600 kPa.
Figure 6.
Deviatoric stress-axial and strain-excess pore water pressure behaviour of the aeolian sand under undrained condition. (a,b) σ3′ = 100 kPa; (c,d) σ3′ = 300 kPa; (e,f) σ3′ = 600 kPa.


Figure 7.
Dr = 50%, deviatoric stress-axial strain-excess pore water pressure behaviour of the aeolian sand under undrained condition. (a) The deviatoric stress-axial strain curves; (b) The excess pore water pressure-axial strain curves.
Figure 7.
Dr = 50%, deviatoric stress-axial strain-excess pore water pressure behaviour of the aeolian sand under undrained condition. (a) The deviatoric stress-axial strain curves; (b) The excess pore water pressure-axial strain curves.

Figure 8.
Undrained shear behaviour of aeolian sand. (a) The deviatoric stress-axial strain curves; (b) The effective stress paths.
Figure 8.
Undrained shear behaviour of aeolian sand. (a) The deviatoric stress-axial strain curves; (b) The effective stress paths.

Figure 9.
Effective stress path of aeolian sand. (a) Dr = 10%; (b) Dr = 30%; (c) Dr = 50%; (d) Dr = 70%; (e) Dr = 90%.
Figure 9.
Effective stress path of aeolian sand. (a) Dr = 10%; (b) Dr = 30%; (c) Dr = 50%; (d) Dr = 70%; (e) Dr = 90%.


Figure 10.
M value changes with relative density.

Figure 11.
The stress paths in the e-lnp’ plane of aeolian sand. (a) Dr = 10%; (b) Dr = 30%; (c) Dr = 50%; (d) Dr = 70%; (e) Dr = 90%.
Figure 11.
The stress paths in the e-lnp’ plane of aeolian sand. (a) Dr = 10%; (b) Dr = 30%; (c) Dr = 50%; (d) Dr = 70%; (e) Dr = 90%.


Figure 12.
The critical state lines in the e-lnp’ plane of aeolian sand.

Figure 13.
Variation of effective internal friction angle with relative density in aeolian sand under drained condition.
Figure 13.
Variation of effective internal friction angle with relative density in aeolian sand under drained condition.

Figure 14.
Variation of effective internal friction angle with confining pressure in aeolian sand under undrained condition.
Figure 14.
Variation of effective internal friction angle with confining pressure in aeolian sand under undrained condition.

Figure 15.
Variation of peak deviatoric stress with relative density of aeolian sand under drained condition.
Figure 15.
Variation of peak deviatoric stress with relative density of aeolian sand under drained condition.


Table 1.
Basic parameters of aeolian sand.
| Coefficient of Uniformity | Coefficient of Curvature | Specific Gravity | Void Ratio | |
|---|---|---|---|---|
| Cu | Cc | Gs | Max | Min |
| 2.1 | 1.0 | 2.67 | 0.907 | 0.589 |
Table 2.
Test program.
| CD/CU | Relative Density Dr (%) | Void Ratio e | Sand Mass (g) | Effective Confining Pressure σ3′ (kPa) |
|---|---|---|---|---|
| CD/CU | 10 | 0.875 | 533.8 | 100/300/600 |
| 30 | 0.812 | 552.5 | ||
| 50 | 0.748 | 572.7 | ||
| 70 | 0.684 | 594.5 | ||
| 90 | 0.621 | 617.6 | ||
| CU | 50 | 0.748 | 572.7 | 50 |
| 50 | 0.748 | 572.7 | 800 | |
| 50 | 0.748 | 572.7 | 1200 |
Publisher’s Note: MDPI stays neutral with regard to jurisdictional claims in published maps and institutional affiliations. |
© 2022 by the authors. Licensee MDPI, Basel, Switzerland. This article is an open access article distributed under the terms and conditions of the Creative Commons Attribution (CC BY) license (https://creativecommons.org/licenses/by/4.0/).
Share and Cite
MDPI and ACS Style
Li, X.; Xu, W.; Chang, L.; Yang, W. Shear Behaviour of Aeolian Sand with Different Density and Confining Pressure. Appl. Sci. 2022, 12, 3020. https://0-doi-org.brum.beds.ac.uk/10.3390/app12063020
AMA Style
Li X, Xu W, Chang L, Yang W. Shear Behaviour of Aeolian Sand with Different Density and Confining Pressure. Applied Sciences. 2022; 12(6):3020. https://0-doi-org.brum.beds.ac.uk/10.3390/app12063020
Chicago/Turabian StyleLi, Xuefeng, Wendong Xu, Lei Chang, and Wenwei Yang. 2022. "Shear Behaviour of Aeolian Sand with Different Density and Confining Pressure" Applied Sciences 12, no. 6: 3020. https://0-doi-org.brum.beds.ac.uk/10.3390/app12063020
Note that from the first issue of 2016, this journal uses article numbers instead of page numbers. See further details here.