
Detailed Characterization of Solid and Volatile Particle Emissions of Two Euro 6 Diesel Vehicles


European Commission, Joint Research Centre (JRC), 21027 Ispra, Italy
*
Author to whom correspondence should be addressed.
Appl. Sci. 2022, 12(7), 3321; https://0-doi-org.brum.beds.ac.uk/10.3390/app12073321
Submission received: 8 February 2022
/
Revised: 18 March 2022
/
Accepted: 22 March 2022
/
Published: 24 March 2022
(This article belongs to the Special Issue The Effect of Vehicle Emissions on Secondary Aerosol and Air Quality)
Abstract
:Featured Application
The particle number emissions of two Diesel vehicles, weighted with one Diesel particulate filter (DPF) active regeneration, were around 2 × 10¹¹ #/km for solid particles but 20–300 × 1011 #/km for volatile particles.
Abstract
The solid particle number emissions of Diesel vehicles are very low due to the particulate filters as exhaust aftertreatment devices. However, periodically, the trapped particles are oxidized (i.e., active regeneration) in order to keep the backpressure at low levels. The solid particle number emissions during regenerations are only partly covered by the regulations. Many studies have examined the emissions during regenerations, but their contribution to the overall emissions has not been addressed adequately. Furthermore, the number concentration of volatile particles, which is not included in the regulations, can be many of orders of magnitude higher. In this study, the particulate emissions of two light-duty Euro 6 vehicles were measured simultaneously at the tailpipe and the dilution tunnel. The results showed that the weighted (i.e., considering the emissions during regeneration) solid particle number emissions remained well below the applicable limit of 6 × 10¹¹ #/km (solid particles > 23 nm). This was true even when considering solid sub-23 nm particles. However, the weighted volatile particle number emissions were many orders of magnitude higher, reaching up to 3 × 10¹³ #/km. The results also confirmed the equivalency of the solid particle number results between tailpipe and dilution tunnel locations. This was not the case for the volatile particles which were strongly affected by desorption phenomena. The high number of volatiles during regenerations even interfered with the 10 nm solid particle number measurements at the dilution tunnel, even though a catalytic stripper equipped instrument was also used in the dilution tunnel.
1. Introduction
Diesel vehicles used to contribute significantly to the air pollution due to their high particulates (soot) and NOx emissions [1]. The typical particle number size distribution consisted of the accumulation (soot) mode with a mean size around 50–90 nm [2,3]. A smaller solid “core” mode was also detected in some engine operating points [4,5]. The picture has changed completely in the last years because Diesel particulate filters (DPFs) and selective catalytic reduction (SCR) for NOx systems have brought the soot and NOx emission levels close to the ambient air levels. This is the outcome of the development of the more stringent emission levels over the years and the introduction of the real driving emissions (RDE) regulation [6]. Cold start and low ambient temperatures emissions can be still an issue for NOx, but not so much for particulate emissions [7,8]. Nevertheless, emissions during active regenerations is still a topic of concern [9,10]. The increase in the gaseous pollutants during active regenerations is taken into account in the regulations by the so-called ki factor, which considers the emissions during the regeneration and the distance between regenerations. For particulates, there is no such factor defined, and most importantly, while the increase for gaseous pollutants is of the order of some percentage units (<5%), for particulates, it can be orders of magnitude [11,12]. Nevertheless, many studies have shown that the weighted emissions of solid particles larger than 23 nm remain below the limit of 6 × 10¹¹ #/km [12,13]. However, this is not always the case [14] and will be even more challenging with the lower emission limits and lower cut-off size of 10 nm as planned for Euro 7 [6,14,15]. Even though they are not regulated, volatile particles, weighted or not, are exceeding the limit for solid particles [9,10,13,16,17,18]. Note that the term “volatile” particles is used to characterize particles that form a nucleation mode upon cooling and dilution in the atmosphere or the sampling system, but are in the vapor phase at the tailpipe conditions (high exhaust gas temperature) [19]. Thus, the “volatiles” include nitrates, sulfates, and intermediate and semi-volatility compounds, while “solids” are soot and metals [19,20]. There are health and environmental concerns for volatile particles. The water-soluble organic carbon generates reactive oxygen species [21,22], and polycyclic aromatic hydrocarbons are toxic and carcinogenic [23]. Furthermore, the volatiles contribute to the formation of secondary aerosol, which is also associated with adverse health effect [24]. As volatile particles might contribute to adverse health effects and their number concentrations is measured in ambient air monitoring stations, their thorough characterization is necessary. This is not a simple task, however [19]. Many studies have shown that the sampling conditions (dilution ratio, dilution air temperature, etc.) have a significant impact on the measured volatile particle number concentration [25,26]. Furthermore, there are no standardized protocol or studies comparing different measurement systems [19]. To make things worse, outgassing of the lines can also impact the results, making the pre-history and pre-conditioning of the vehicle and the facility important [27].
The objective of this study is to determine the emissions of two diesel vehicles focusing on the regeneration events. Different sampling locations and instruments will give an insight on challenges and provide recommendations for future measurements especially for volatile particles.
2. Materials and Methods
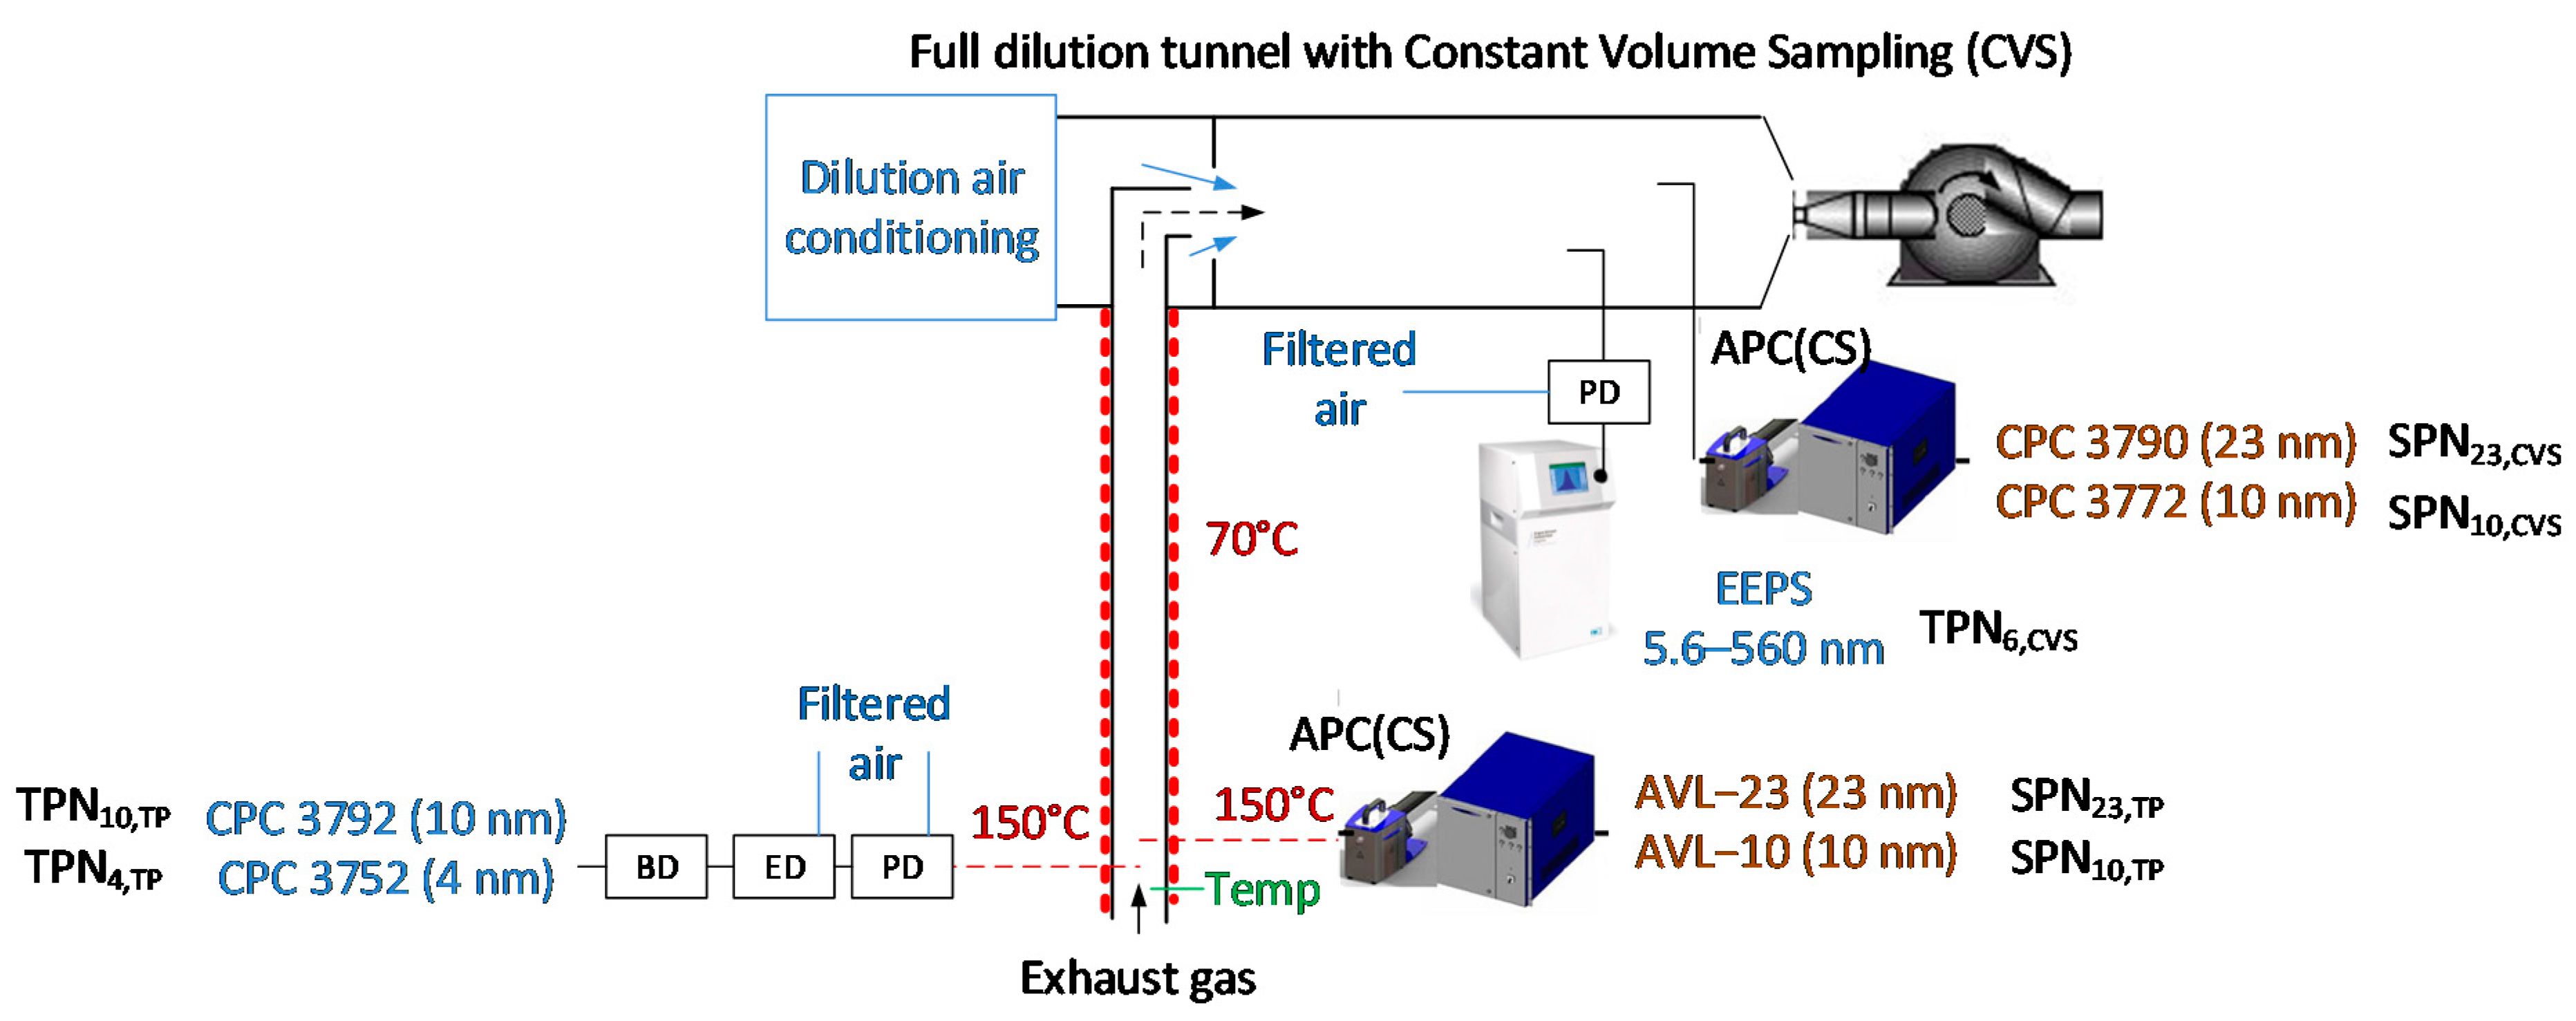
The tests were conducted at the vehicle emissions laboratory (VELA 1) of the Joint Research Centre (JRC) of the European Commission. The experimental setup is given in Figure 1.
2.1. Particles Instrumentation
Various instruments were used to measure particles from the tailpipe (TP) and the dilution tunnel with constant volume sampling (CVS). One advanced particle counter (APC) from AVL (Graz, Austria) [28] with 23 nm and 10 nm condensation particle counters (CPCs) was connected directly at the dilution tunnel and a second one at the tailpipe with a 0.5 m heated stainless steel line at 150 °C. Both APCs had a catalytic stripper (CS) operating with wall temperature set at 350 °C [29]. The difference between the two APCs was that the one at the dilution tunnel had condensation particle counters (CPCs) from TSI (Shoreview, MN, USA), while the one at the tailpipe from AVL. The counting efficiencies at 23 nm and 10 nm were approximately 50% and 65%, respectively, for both TSI and AVL counters. These efficiencies are defined in the respective 23 and 10 nm solid particle methodologies in the global technical regulation (GTR 15) for light duty vehicles [6,15]. The solid particle number (SPN) emissions from these instruments will be abbreviated as: SPNx,y, where x is 23 nm or 10 nm and y is the dilution tunnel (CVS) or tailpipe (TP). The particle number concentration reduction factor (PCRF), which is the dilution with the average losses at 30 nm, 50 nm, and 100 nm, was 1000 (primary dilution 100) for both instruments. This value has been found to minimize any interference from volatile particles [30].
For the measurement of total particle number (TPN) concentration (i.e., solid and volatile particles), two systems were used: one at the dilution tunnel and the other at the tailpipe. The one at the dilution tunnel consisted of a porous diluter (PD) with a cold (i.e., not heated) dilution of approximately 10:1. The particle number concentration and size distribution were measured with an engine exhaust particle sizer (EEPS) from TSI. The covered size range was 5.6 nm to 560 nm. The second system at the tailpipe, based on the DownToTen project [31], consisted of 0.8 m heated stainless-steel line at 150 °C, a porous diluter (PD) with dilution 10:1, an ejector diluter (ED) with dilution 10:1, and a bifurcated flow diluter (BD) with dilution 20:1. The filtered air of the PD and ED was not heated. The BD dilutes without the need of external air supply by splitting the flow: One part is filtered and used internally as dilution air. The reasons for having a third diluter and not a higher dilution at the first PD were twofold: Firstly, a primary dilution ratio of around 10–25:1 has been found to maximize the nucleation mode formation [19,27,32]. Secondly, as we did not control the real-time dilution ratio by gas measurements (only with pressure measurements), the lower dilution ratio had lower uncertainty compared to a higher dilution. The system was characterized at the laboratory for particle losses and were found to be around 30% more in the 10 nm to 23 nm range and 50% more in the sub-10 nm range than the losses in the >23 nm range [13,33]. The particle number concentration was determined with two CPCs from TSI: one with 65% counting efficiency at 10 nm and the other 50% counting efficiency at 5 nm. The total particle number (TPN) emissions from these instruments will be abbreviated as: TPNx,y, where x is 4 nm, 6 nm (approximately the lower size detected by the EEPS), or 10 nm and y is a dilution tunnel (CVS) or tailpipe (TP).
2.2. Vehicles and Fuel
The characteristics of the two vehicles can be found in Table 1: The first one (in the order of the testing) was a Euro 6d-Temp (vehicle #1 in the following), while the second one was a Euro 6b (vehicle #2 in the following). Both were equipped with Diesel oxidation catalyst (DOC), selective catalytic reduction (SCR) for NOx, and a Diesel particulate filter (DPF). Both vehicles were market vehicles (i.e., not prototypes or research vehicles), thus, the results should be representative of the real-life situation.
Market B7 fuel was used for all tests. It had a cetane number of 54, density 0.84 kg/L, 7.1 mg/kg sulfur content, 6.7% (vol.) FAME (fatty acid methyl ester) content, 3.6% (mass) polycyclic aromatics content, and 18.1% (mass) total aromatics.
The NOx emissions of the Euro 6d-Temp vehicle over its type approval cycle, the worldwide harmonized light vehicles test cycle (WLTC), were approximately half of the Euro 6 NOx limit of 80 mg/km and even lower at 120 km/h. The Euro 6b could fulfil the 80 mg/km NOx limit at its type approval New European Driving Cycle (NEDC), but the NOx emissions were 450 mg/km at the WLTC and 650 mg/km at 120 km/h. This means that the SCR of the Euro 6b was functioning only in a narrow window of operating conditions, and consequently, any urea-formed particles should be minimum for this vehicle. Nevertheless, urea-formed particles seem to not be an issue for light-duty vehicles [9], as they may be for heavy-duty vehicles [34,35].
2.3. Test Protocol
All tests were conducted were conducted at an ambient temperature of 23 ± 3 °C at the laboratory.
The test protocol of vehicle #1 (Euro 6d-Temp) included constant speed tests of 50 km/h, 90 km/h, and 120 km/h with 30 min duration each and a few WLTCs in between. Regeneration took place at the first and last constant speed test at 130 km/h and 120 km/h (Figure 2). The TPN counters were saturated at the first regeneration test. The 10 nm counter goes in photometric mode above >104 #/cm3, with a maximum around 5 × 10⁵ #/cm3, while the 4 nm counter goes in photometric mode above 105 #/cm3, with a maximum 107 #/cm3. The total distance covered was 510 km, with a total duration of 7 h of driving in different days. The distance between the 2 active regenerations was 460 km. Only this car was tested in the laboratory during the testing period in order to avoid any contamination of the setup from other vehicles.
The test protocol of vehicle #2 (Euro 6b) was similar. It included constant speed tests of 50 km/h, 90 km/h, and 120 km/h with 30 min duration each and a few WLTCs in between. The total distance covered was 830 km with a total duration of 13 h of driving in different days (Figure 2). Only one active regeneration took place during the first WLTC pre-conditioning test. Only this car was tested in the laboratory during the testing period in order to avoid any impact from the exhaust of other vehicles. Vehicle #2 was tested immediately after vehicle #1.
Based on this protocol we tried to minimize any impact from other vehicles’ exhaust in the sampling lines [19]. The last regeneration of vehicle #1 also aided to desorb any deposited material from vehicle #1 in the sampling lines. The first test with vehicle #2 triggered an active regeneration, which also resulted in a high exhaust gas temperature that (partly) desorbed the deposited material. Figure 2 gives the maximum exhaust gas temperature during the performed tests.
2.4. Calculations
The total or solid particle number (PN) real time emissions (#/s) were calculated for every second “i” as follows [36]:
where “location” is the dilution tunnel (CVS) or tailpipe (TP), “size” is the lower size of the respective instrument (i.e., 4 nm, 6 nm, 10 nm, or 23 nm), C is the particle number concentration of the respective instrument (corrected with the PCRF), Q is the flow rate (of the dilution tunnel or the exhaust), and ρexh is the exhaust gas density (assumed constant).
PNsize,location,size,i = 106 Csize,location,i Qlocation,i/ρexh
The integrated emissions were calculated by integration of the second-by-second emissions for the relevant duration and divided by the relevant distance. For example, for the WLTC, the duration was 30 min, and the distance 23.2 km. In some cases, in order to calculate the “overall” emissions, where one regeneration event was included, the particle number emissions of all cycles were integrated (including one regeneration event), and then they were divided by the total distance.
3. Results and Discussion
The following two sections present the comparison of the emissions of solid and volatile particles at different sampling setups and the emission characteristics of the vehicles with and without regenerations.
3.1. Sampling Location and Instrumentation
3.1.1. Dilution Tunnel Versus Tailpipe
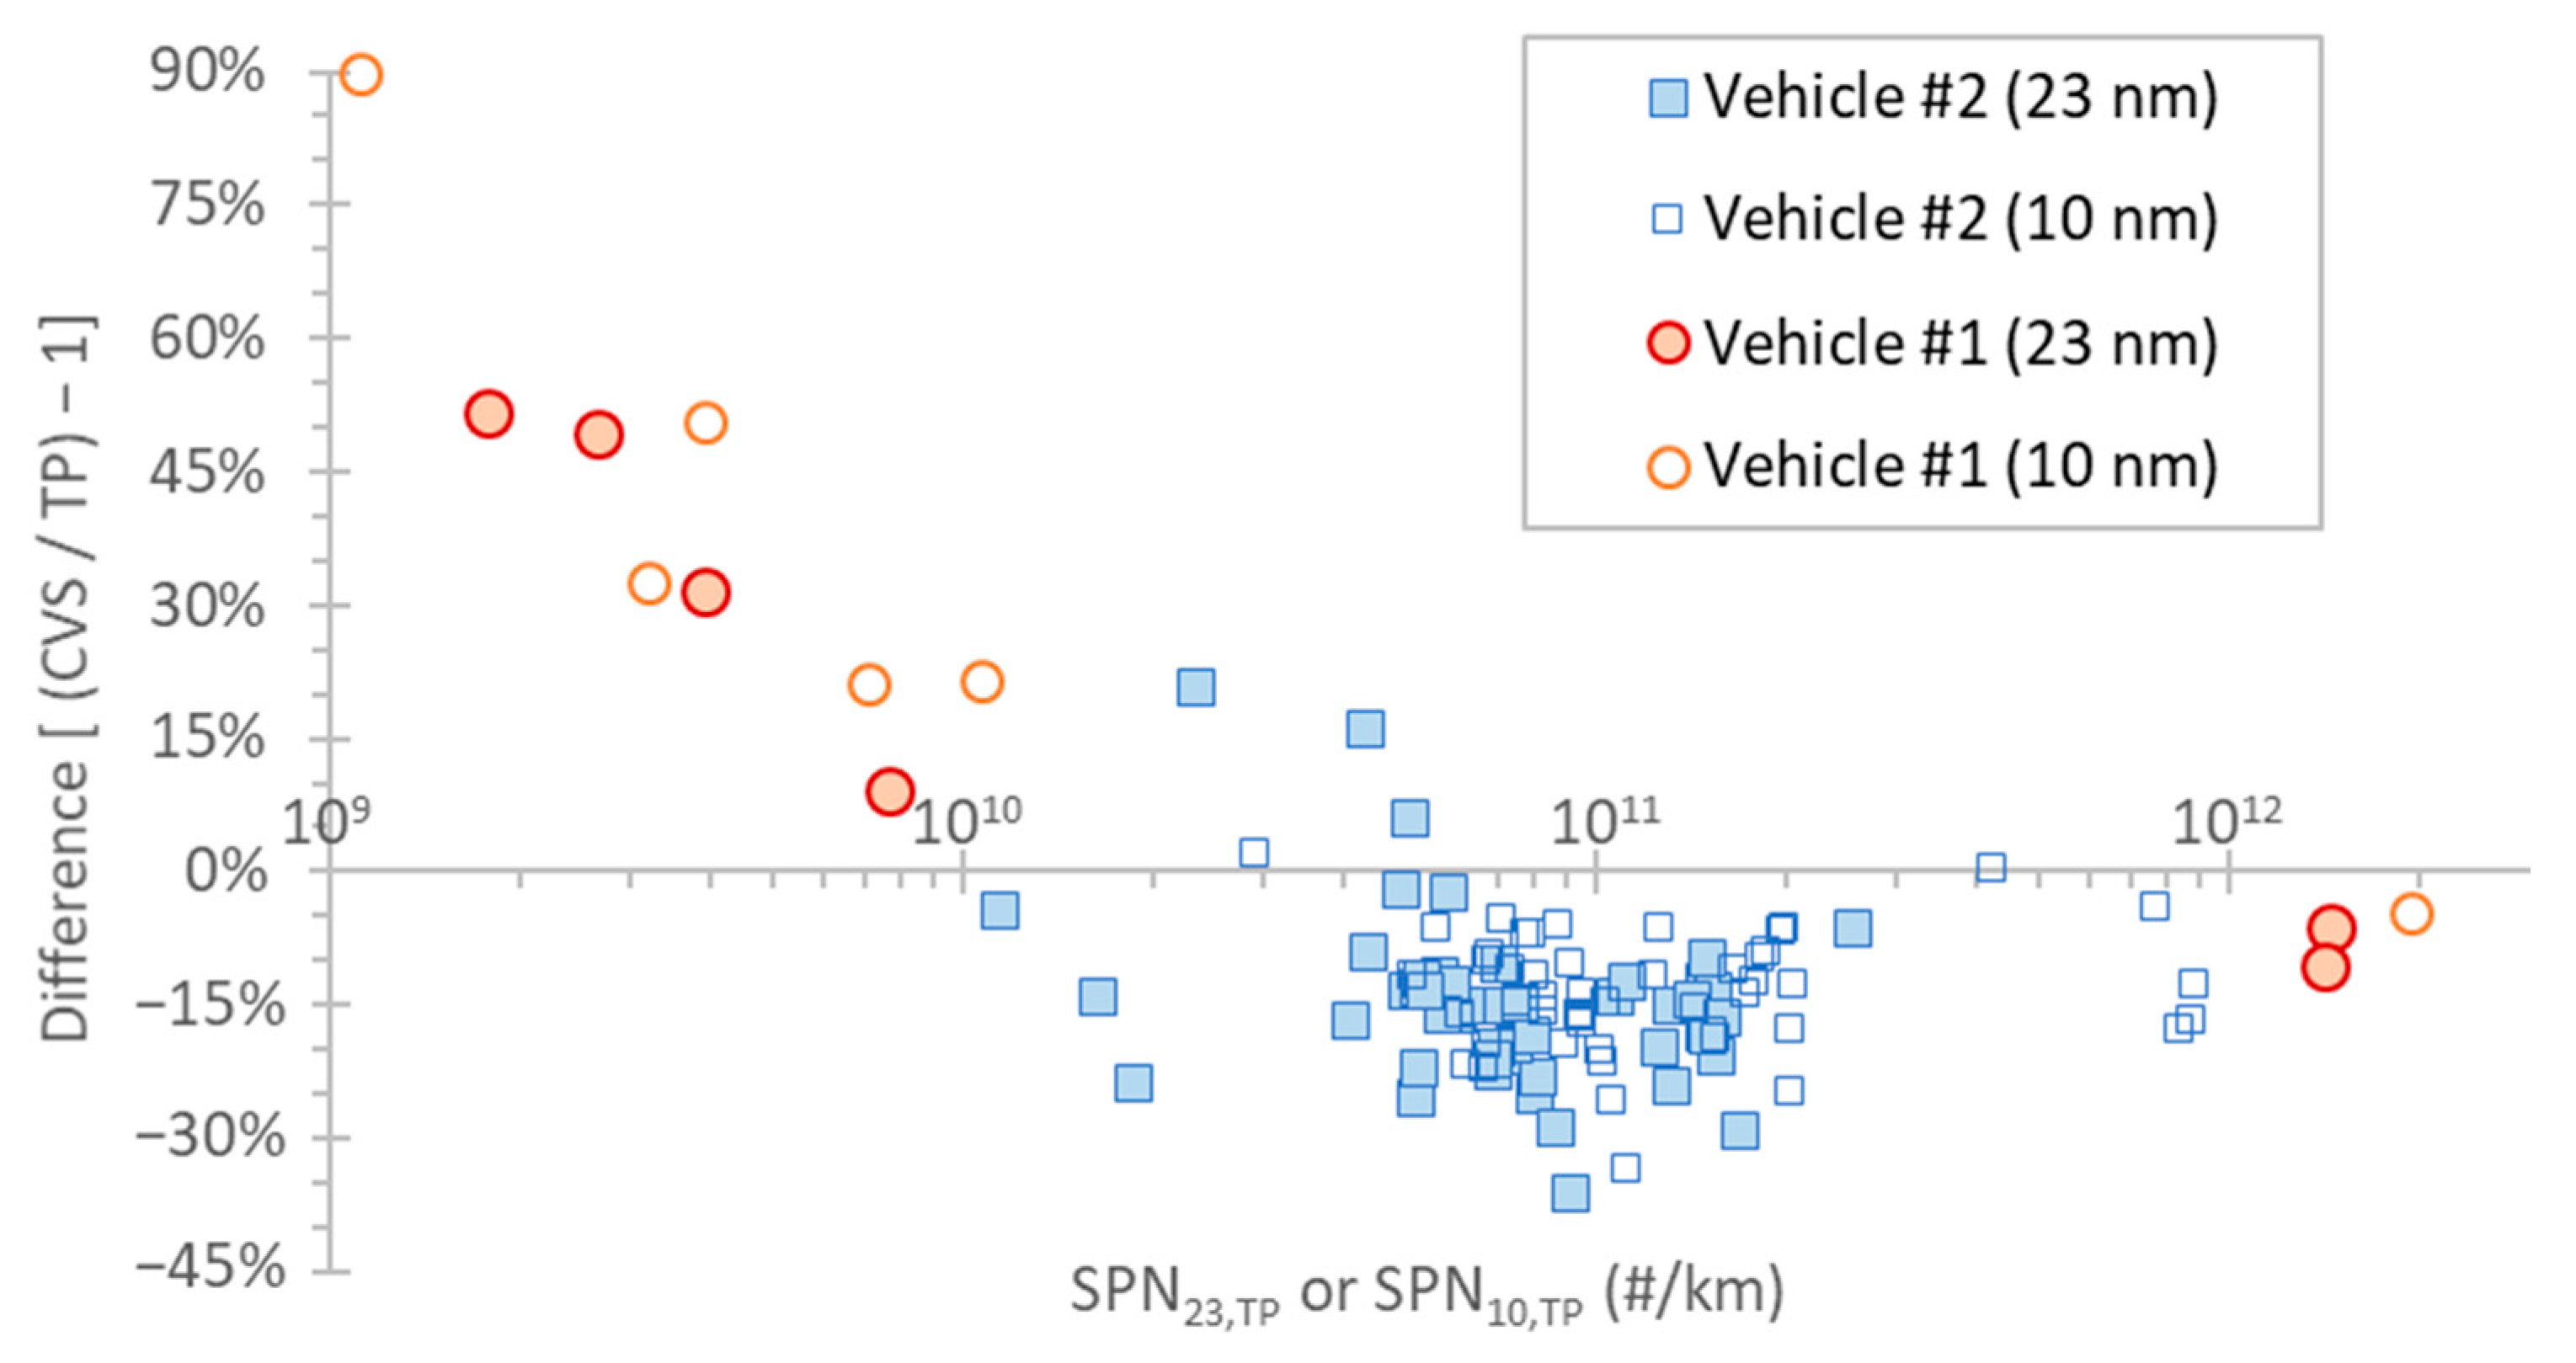
Figure 3 summarizes the differences between the SPN instruments connected at the tailpipe and the dilution tunnel for both >23 nm and >10 nm for both vehicles. The comparison is presented as the ratio of the SPN measured in the dilution tunnel (CVS) to the tailpipe (TP) measurement minus one. Thus, positive differences denote higher CVS measurements compared to TP, while negative differences denote the opposite. For emission levels > 5 × 10⁹ #/km, the differences were −35% to 20%, with the instrument at the dilution tunnel measuring lower levels on average. The results are in good agreement with the literature, where differences of ±30% have been reported [37,38]. The differences can be attributed to uncertainties of the exhaust flow determination (5%) and agglomeration particle losses (10%) when the concentration is high (>107 #/cm3) (e.g., during cold start) [36]. The thermophoretic losses are negligible for exhaust gas temperatures up to 200 °C, as our tailpipe sampling was performed at 150 °C. They can reach 10% at exhaust gas temperatures close to 400 °C. High differences (20%) can also be seen when the particle size distributions peak at the cut-off size of the instrument (around 23 nm or 10 nm).
For emission levels < 5 × 10⁹ #/km, the differences were >30%, with the instrument at the dilution tunnel measuring higher. The main reason was the higher background levels. For example, a 0.5 #/cm3 background (allowed in the regulation and typical for our systems) would translate to 6 × 10⁹ #/km at the dilution tunnel and 5 × 10⁸ #/km at the tailpipe, which is a >1000% difference. It should be mentioned that the current SPN23,CVS limit is 6 × 10¹¹ #/km, thus two orders of magnitude higher, and the high relative differences at levels < 5 × 10⁹ #/km were small or negligible in absolute values. These levels were also close to the lower detection limit of SPN systems, thus adding to the uncertainty of the instruments [36].
There are two cases with high differences between the 10 nm counters at the tailpipe and the dilution tunnel (not shown in the figure). One was the first active regeneration event of vehicle #1 at 130 km/h, and the other was the first active regeneration of vehicle #2 at the pre-conditioning WLTC. The differences between the tailpipe and dilution tunnel had a difference of a factor of 4–6 at emission levels of around 1012 #/km, higher than the 30% that would be acceptable. These two cases will be discussed in the next paragraphs. First, a regeneration event where no high differences were seen will be discuessed, and then the two regeneration cases with high differences will be presented.
3.1.2. Vehicle #1 Regenerations
Figure 4 plots the emissions during the last regeneration event with the Euro 6d-Temp vehicle that took place during the 120 km/h constant speed driving. After more than 20 min at 120 km/h (at 1300 s), the regeneration initiated: The exhaust flow increased, and the tailpipe exhaust temperature started increasing slowly. The total particles started increasing at approximately 1400 s, somewhat earlier at the dilution tunnel (TPN6,CVS). The exhaust gas temperature at the tailpipe was around 200 °C when the total particles at the dilution tunnel started increasing sharply. The TPN6,CVS emissions at the dilution tunnel exceeded the levels of the 4 nm counter at the tailpipe (TPN4,TP). The emissions of the 4 nm counter were double than of the 10 nm counter (TPN10,TP) when TPN10,TP saturated, which suggests that the peak (mean size) of the nucleation mode was below 10 nm and closer to 4 nm.
The solid particles started increasing at approximately 1500 s (exhaust gas temperature 300°C). The agreement between dilution tunnel and tailpipe was very good for both 23 nm and 10 nm counters (lines almost indistinguishable). The 10 nm emissions were 50% higher than the 23 nm emissions during the regeneration event. After the regeneration (2000 s and later), the 23 nm and 10 nm counters were at the same levels, indicating only a soot (accumulation) mode with a mean size > 23 nm. It is worth mentioning that at the end of regeneration (2000 s), the solid emissions increased, while the total emissions decreased. Nevertheless, the total particle emissions remained elevated, even after the regeneration, thus suggesting desorption of nucleating material after the regeneration.
An active regeneration is usually divided into the following phases [39]: (i) warm-up until the DPF has reached the appropriate temperature for soot oxidation; at this phase, the DPF filtration efficiency is high, and consequently, the SPN emissions are low (1300–1500 s in Figure 4); and (ii) the soot oxidation phase, where the trapped soot is oxidized (1500–2000 s). This phase is subdivided in the “increasing SPN emissions” (1500–1600 s) phase where the DPF filtration efficiency starts to drop, and the “stabilization phase” (1600–2000 s), where the DPF is empty, and the filtration efficiency is low [13,40].
The formation of volatile particles depends on the exhaust gas temperature. The general understanding is that they appear when the temperature is appropriate to convert enough SO2 from SO3 at the DOC [39,41,42,43] and/or to desorb enough sulfates from the aftertreatment devices [44,45,46,47]. As the exhaust gas is cooled down in the diluter, these sulfates form nucleation mode particles, which grow to the measurement range of the instruments, especially in the presence of hydrocarbons. The appropriate temperature is typically reached before the soot oxidation phase, and the volatile particles increase earlier than the solid particles [39,41], but not always [13]. Their concentration depends on the available pre-cursors, the sampling and dilution conditions, and the possible soot sink for the particles and vapors [48]. At the end of the regeneration in Figure 4, the exhaust gas temperature decreased, the soot particles increased, and the volatile particle concentration immediately dropped, as expected. However, their concentration was still much higher (1–2 orders of magnitude) than the concentration of solid particles because the exhaust gas temperature remained high enough.
In summary, during the active regeneration of the Euro 6d-Temp vehicle, the following particle classes were measured: (i) volatile particles that appeared when the tailpipe temperature was around 200 °C with a mean size between below 10 nm; (ii) core particles due to the incomplete combustion of the injected fuel with a mean size around 10 nm; and (iii) soot particles with a mean size > 23 nm. While the volatile and soot particle emissions are commonly reported in the literature, the existence of a core mode during active regenerations has not been identified before. The term “core” is used in lack of another term to characterize these particles. It is highly likely that these particles are heavy hydrocarbons from incomplete combustion during the late fuel injection to regenerate the filter. High concentrations of polycyclic aromatic hydrocarbons (PAHs) have also been detected during active regenerations [49]. Regeneration studies have identified fuel-originated hydrocarbons [45], but low-volatility oil hydrocarbons have been also measured in significant amounts [10].
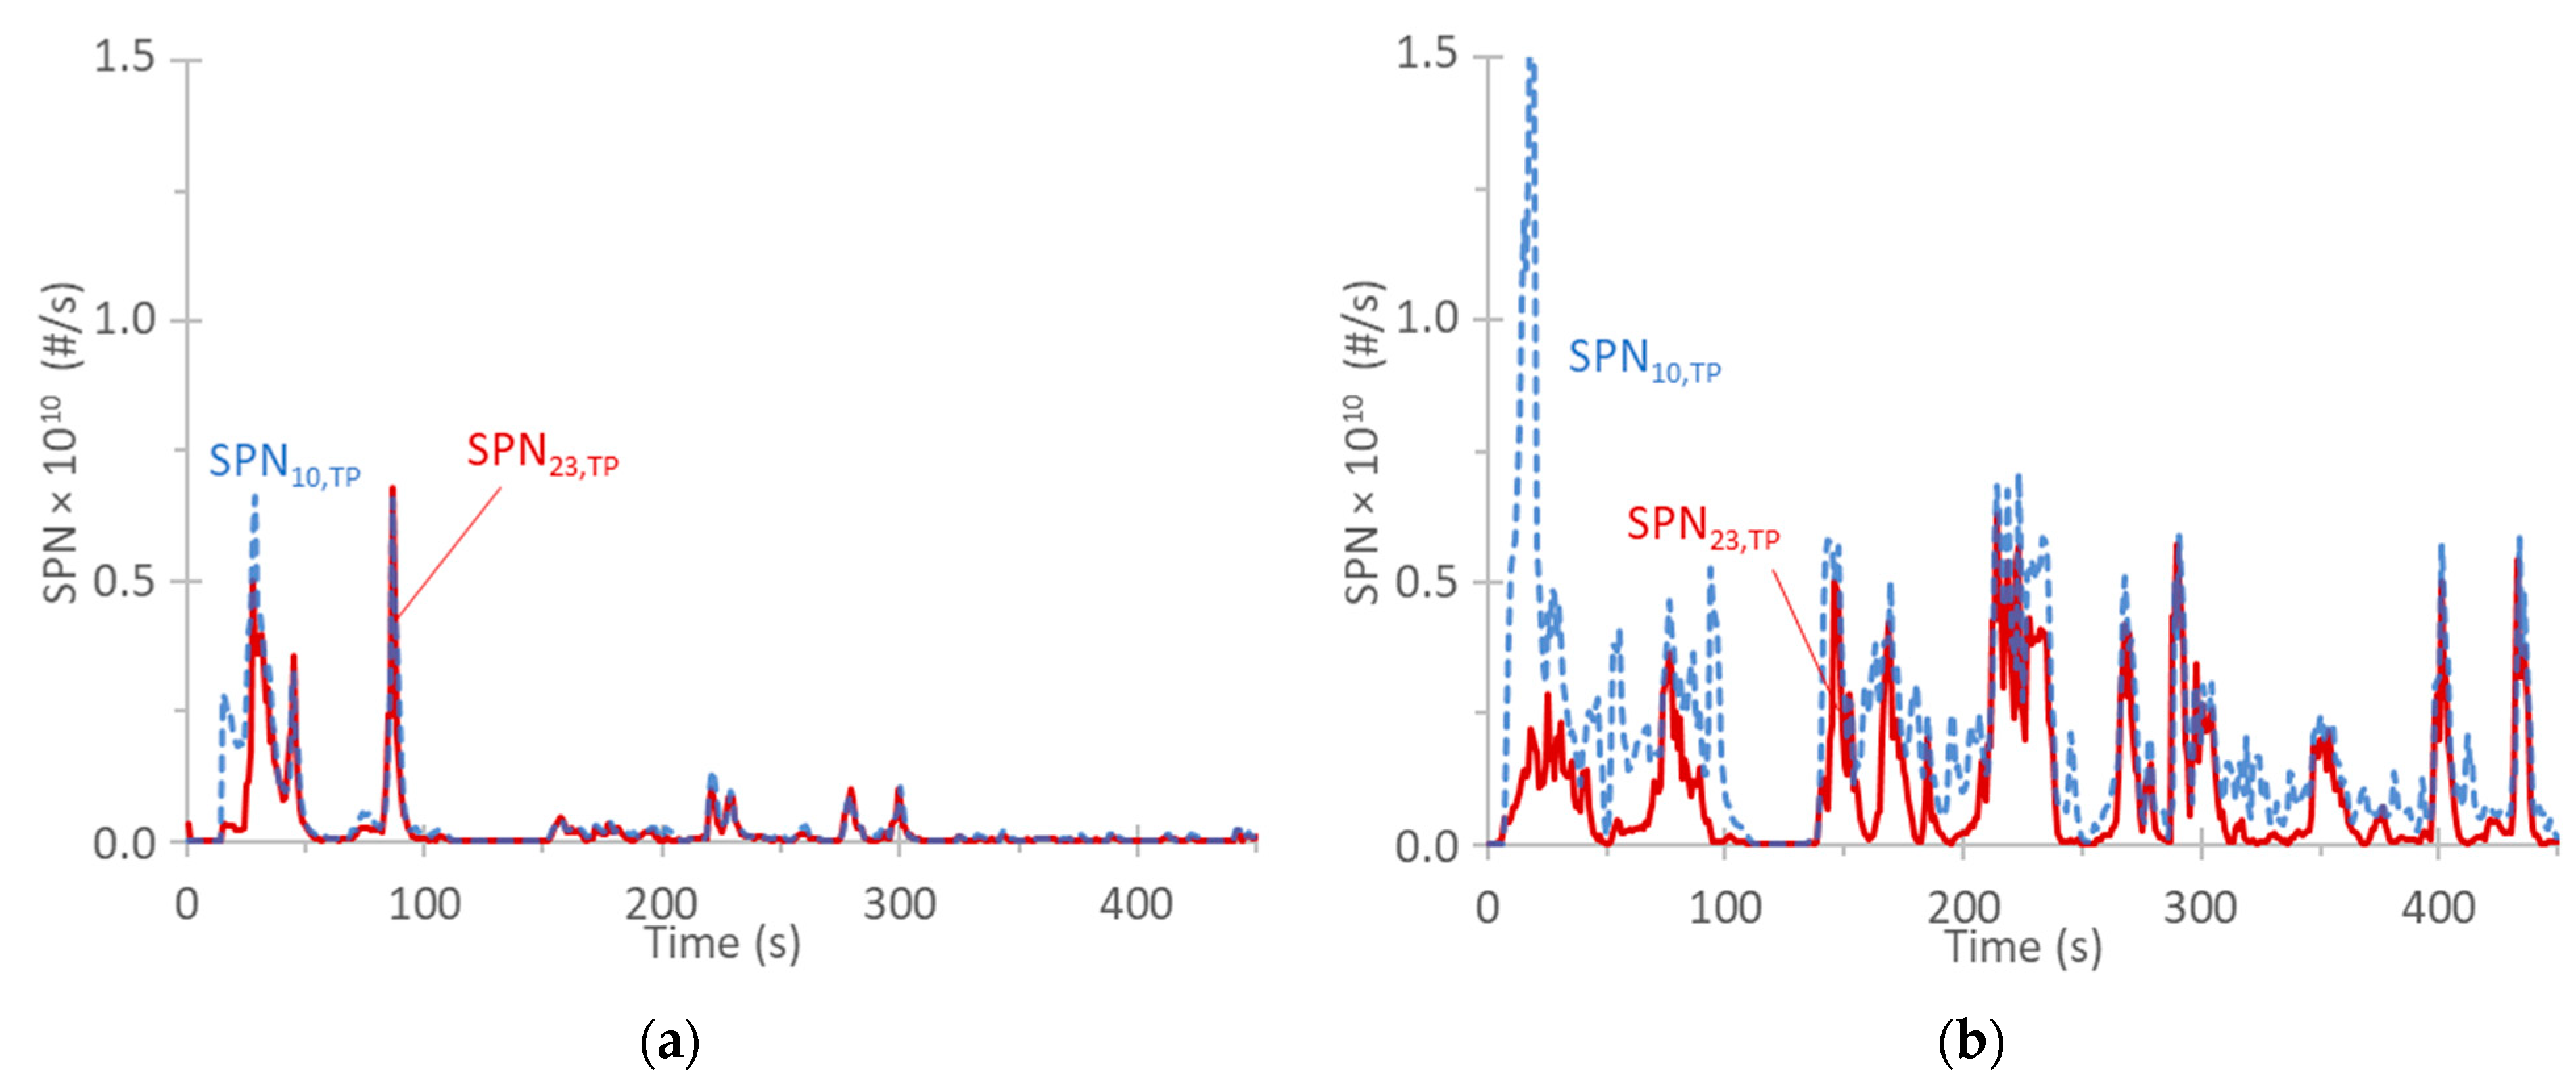
Figure 5 presents the first regeneration test of the same vehicle #1. The car was at 130 km/h, and after approximately 650 s, the regeneration initiated, as shown by the increase in the exhaust flow rate and the exhaust temperature at the tailpipe. The solid particles > 23 nm at the tailpipe (SPN23,TP) and the dilution tunnel (SPN23,CVS) started increasing gradually. A similar increase was noted for the solid 10 nm particles at the tailpipe (SPN10,TP), which were approximately 50% higher than the 23 nm concentrations. What was rather unexpected was the high increase in the solid 10 nm particles at the dilution tunnel (SPN10,CVS), which started almost from the beginning of the regeneration (750 s) when the exhaust gas temperature at the tailpipe was 250 °C. During the regeneration, the speed of the car changed from 130 km/h to 120 km/h (1250 s). The exhaust gas temperature dropped slightly, but remained elevated at around 350 °C. The difference between 10 nm and 23 nm particle number concentrations at the tailpipe remained at similar levels as before (50%), while the 10 nm concentration at the CVS came closer to the rest of the instrument’s concentrations. At the end of the regeneration (1350 s), all SPN concentrations reached the same level in both sampling locations.
With the exception of the SPN10,CVS concentration, the two regenerations had similar behavior. In both cases, the duration was around 700 s, the exhaust gas temperature reached 350 °C, and there was a considerable number of particles below 23 nm. It is not clear why the SPN10,CVS was different at the two regenerations. Volatile artefacts (i.e., volatiles that penetrate through the catalytic stripper) is one possible explanation. The total concentration of volatiles at the dilution tunnel (TPN6,CVS) is not known because the instrument (EEPS) was saturated in most part of the regeneration. The fitting of the non-saturated parts of the size distribution during times that the total concentration was saturated gave a geometric mean diameter (GMD) of 37 nm with geometric standard deviation of 1.49 and concentration of 2 × 10⁸ #/cm3. Assuming unit density, this gave a mass concentration of more than 11 mg/m3. The mass of the volatiles at the last regeneration of Figure 4 (without such strange behavior) was 1.5 mg/m3, (GMD = 29 nm, GSD = 1.45, concentration 6 × 10⁷ #/cm3). In this regeneration, there were solid cores, so any breakthrough of volatiles could have grown the core particles to the measurement range of the 10 nm counter. This will be further elaborated later. When the regeneration was finished, only soot particles > 23 nm were detected. Any breakthrough would grow the particles that were already >23 nm, so it would not impact the concentrations measured by all instruments, which were at the same levels after 1350 s.
Regarding total particles from the tailpipe sampling, the 10 nm counter was saturated (not shown in the figure), and the 4 nm was measuring in the photometric mode. The agreement between EEPS at the dilution tunnel and the 4 nm counter at the tailpipe was not as good (at the parts that the EEPS was not saturated) as in Figure 4. Figure 5 highlights how difficult it is to measure total particles, as their emission levels span over many orders of magnitude. Other reasons for the differences, in addition to the desorption phenomena discussed before, include different lower cut-points (6 nm vs. 4 nm), different principles of operation (diffusion charging vs. condensation particle counter), and different dilution concepts (variable at the dilution tunnel vs. fixed at the tailpipe).
3.1.3. Vehicle #2 Regeneration
Figure 6 presents the regeneration of the Euro 6b vehicle at the last part of the WLTC. A non-regenerating WLTC is also plotted for comparison. Figure 6a shows that the speed and the exhaust flow rate were identical for the regenerating and non-regenerating WLTCs. The only difference was in the exhaust gas temperature at approximately 1600 s for the regenerating cycle.
Figure 6b plots the particle number emissions. Only the solid particle number emissions > 10 nm at tailpipe (SPN10,TP) and dilution tunnel (SPN10,CVS) are given for the non-regenerating cycle for better clarity of the figure, and they are indistinguishable. The SPN10,TP of the regenerating and non-regenerating cycles were identical up to 1570 s; after that point, the SPN10,TP were higher for the regenerating cycle. The SPN23,TP were at the same level, without any evident existence of a solid core mode as with the Euro 6d-Temp vehicle. The >10 nm concentration from the dilution tunnel SPN10,CVS were at the same level as the SPN10,TP until approximately 1620 s; after that time, the SPN10,CVS clearly deviated. The total particle number (TPN) concentration started to increase from approximately 1600 s at the dilution tunnel, but the system at the tailpipe measured a significant increase after 1670 s. The SPN10,CVS followed the TPN signals, indicating that they could be volatile artefacts, even though the system had a catalytic stripper. Another fact that supports this assumption is that the SPN10,CVS was increasing when the SPN10,TP was decreasing, a behavior typical of volatile particles. The estimated mass from the EEPS was >10 mg/m3, which is at the same level with the mass of Figure 3, where such differences were also noticed.
Similar differences between tailpipe and dilution tunnel have been reported a few times: In one case, changing the dilution ratio of the device did not change the concentration of the sub-23 nm particles during the regeneration, indicating that they are non-volatile particles [12]. Another study found similar concentrations of 10 nm particles with evaporation tube and catalytic stripper during a regeneration [50]. A dedicated study with a moped gave some insight for the differences in solid particles < 10 nm between the tailpipe and the dilution tunnel [51]. It was suggested that the moped emitted nanoclusters (particles in the 1–3 nm size range), which would grow in the transfer tube to sizes detectable by the instruments due to heterogeneous nucleation and the condensation of volatile material either emitted from the moped or desorbed from the transfer tube due to the high exhaust gas temperatures. It was explained that the reason that the particles were not evaporated in the catalytic stripper of the instrument at 350 °C was due to their low volatility and kinetic restrictions (finite residence time in the catalytic stripper). Thus, for the regeneration tests, it is possible that the differences are due to nanoclusters that reached different sizes at the two locations. These nanoclusters could be due to the injected fuel or even oxidation-driven soot fragmentation at the DPF [52,53,54], which may result in the increase in nucleation particles, as indicated in experimental [53] and theoretical [55] studies.
Figure 7 presents tests with the Euro 6b vehicle at 120 km/h at different days. The particle number emissions are plotted in Figure 7a, while the speed and exhaust gas temperature at Figure 7b. Based on the signals of speed and exhaust temperature, the tests were very repeatable. However, this was not the case for the particle emissions, which were dropping over time (distance driven). Even though the instrument at the tailpipe had lower cut-point than at the dilution tunnel (4 nm vs. 6 nm), the TPN emissions at the dilution tunnel were much higher than at tailpipe for the same test. For example, at the first test, the emissions at the dilution tunnel reached 7 × 10¹² #/s, while at the tailpipe, they were 5 × 10¹⁰ #/s (two orders of magnitude lower) for the same test. Over time, the concentrations were decreasing. At the third test (after 280 km from the first test), the instrument at the tailpipe did not increase, while the instrument at the dilution tunnel had a small increase reaching 3 × 10¹⁰ #/s. This series of tests demonstrates the high variability of the volatile particles. There can be a huge difference in the measured TPN between sampling locations, different tests, as well as between different days.
The variability in the emissions between different days comes from the desorption of the deposited material at the aftertreatment and tailpipe of the vehicle and, in case of CVS, the tube that connects the vehicle with the dilution tunnel. For the same day, the difference between the tailpipe and the dilution tunnel is probably due to the deposited material at the tube between the vehicle and the dilution tunnel. The data in Figure 7 clearly show that the transfer line can be a huge source of nucleation mode particles. What is important to mention at this point is that all these tests with vehicle #2 were conducted after the tests with vehicle #1, which ended with a regeneration event (plus one WLTC) with the exhaust gas temperature at the tailpipe reaching 350 °C during the regeneration (see protocol in Figure 2). Furthermore, the first test with vehicle #2 had a regeneration at the last part of the WLTC, and the temperature reached 400 °C. One would expect that the desorption of any deposited material at the subsequent tests would be minimal, as the exhaust gas temperature at the 120 km/h tests only reached up to 275 °C. The results indicate that this may not be the case. There was still enough material to be desorbed at temperatures around 250 °C that took more than 1.5 h of driving at 120 km/h to reach low levels. Some of this material was probably deposited during the testing of the 330 km with this car (typical WLTCs).
The literature has also highlighted the need of stabilization time to the variability of the volatile particles measurements [56]: Many studies have found that it can take more than 1 h to stabilize the concentration of volatile particles [42,57], similar to what was demonstrated in our study. Other studies have also found higher concentration of volatile particles at the dilution tunnel compared to the tailpipe due to the desorption from the tube between the vehicle and the tailpipe [9,58].
3.2. Emission Levels
Figure 8 plots the excess sub-23 nm particles not counted with the current SPN procedure in the regulation, which considers only particles larger than 23 nm. Lowering the cut-off size to 10 nm would increase 10–40% the emissions for both vehicles in the concentration range of interest (>1010 #/km). At lower number concentrations in a few cases, higher percentages can be seen (the 80% values are from two WLTCs).
Appendix A gives examples of where the sub-23 nm particles come from (mainly due to cold start). One noticeable exception, not shown in the figure, is vehicle #2’s excess sub-23 nm concentration of cold idle (16 times higher than the >23 nm concentrations) and of the hot idle (2.2 times the >23 nm concentrations).
The emission levels of the two vehicles are presented in Figure 9a,b, respectively. The emissions are given separately for the WLTC, 120 km/h, the same tests with active regeneration, and the overall emissions. For vehicle #1, the overall emissions are the emissions after the first regeneration until the second regeneration (including the second regeneration event) (460 km) (see also Figure 2). For vehicle #2, the overall emissions include all emissions over the 830 km driven. Each bar gives the solid particle number (SPN) emissions > 23 nm, and >10 nm, as well as the total particle number (TPN) emissions > 10 nm and >4 nm. Only the results from the tailpipe were considered in the figures for the reasons discussed in the previous section.
For vehicle #1 (Euro 6d-Temp), the emissions (solid and total particles) were low for tests without regeneration (<1011 #/km). The emissions during regeneration, though, were very high (>1014 #/km). The overall TPN emissions were dominated by the emissions measured over the regeneration event. The TPN-weighted emissions were still more than two orders of magnitude higher than the overall SPN emissions, which were still below the Euro 6 limit. For vehicle #2, the SPN emissions with and without regeneration were not very different and remained below the Euro 6 limit. The TPN increased by more than two orders of magnitude during the regeneration. The overall TPN emissions were one order of magnitude above the Euro 6 limit. High emissions of volatiles are commonly reported in the literature. Most studies have measured a nucleation mode with mean size < 20 nm [10,39,41,44,46,53,59] and concentration around 1–2.5 × 10¹³ #/km [13,18,39,41] but also higher 2–8 × 10¹⁴ #/km [9,10,46,53,60].
Table 2 summarizes the emissions of the two vehicles for the WLTC and the overall emissions. Focusing on the >23 nm SPN, the WLTC emissions were very low for the Euro 6d-Temp car, and one fourth of the limit (6 × 10¹¹ #/km) for the Euro 6b. The overall (i.e., weighted emissions including one regeneration event) >23 nm SPN emissions for both vehicles were one-fourth of the limit. The increase in the emissions considering the sub-23 nm particles was 25–30% for the Euro 6b vehicles and 36% for the Euro 6d-Temp (48% for the WLTC).
The emissions of the total particles (solids and volatiles) > 10 nm remained at the same levels with the solid > 10 nm for the WLTC. However, when considering the overall emissions, they exceeded 2.4 times (Euro 6b vehicle) to 25.5 times (Euro 6d-Temp) the SPN23 limit. The sub-10 nm total particles were 35% higher for the WLTC, but 95% higher for the overall emissions. As it was described in Section 2 (Material and Methods), no particle loss corrections were applied for sub-23 nm particles. As discussed before, the measurements from the dilution tunnel showed much higher values at high-speed tests due to the desorption of particle pre-cursors from the tube connecting the vehicle to the dilution tunnel and were not considered in this figure.
The results are in line with other studies that have reported a wide range of emissions during regenerations (e.g., SPN23 and SPN10 levels up to 3 × 10¹² #/km [9,10,11,13,18]). These studies also showed that the SPN emissions weighted with one regeneration were around 3 × 10¹¹ #/km, again in agreement with our results. However, exceedance of the limit has also been reported for the weighted emissions [14]. The reported TPN weighted emissions are in the range of 0.8–2 × 10¹² #/km [10]. As some studies have shown the absolute values of SPN and TPN depend on many parameters, e.g., the loading cycles, the regeneration speed, the soot load [9,11,39].
4. Conclusions
In this study, we measured the particle number emissions of two Euro 6 Diesel vehicles. The emissions of both solid and volatile particles were determined using instruments sampling directly from the tailpipe and from the dilution tunnel with different lower cut-points. Three main topics were addressed: (i) sampling location, i.e., differences between tailpipe and dilution tunnel; (ii) differences between solid and total (i.e., solids and volatile) particles; and (iii) emissions during regenerations and contribution to the overall emission levels.
The first vehicle in order (Euro 6d-Temp) regenerated a second time after 460 km of driving, while the second one (Euro 6b) had not regenerated a second time after 830 km. The solid particle number emissions including the regeneration events for both vehicles were <2 × 10¹¹ #/km, with a sub-23 nm particle concentration of 10 to 40%. However, the total (i.e., solids and volatiles) particle number emissions were 15 to 300 × 1011 #/km, raising the question of whether these particles can be neglected. The measurements from the dilution tunnel and the tailpipe gave similar results (−35% to 20%) for the solid particles, but much higher differences were measured for the total particles. The reason was the desorption of particle pre-cursors from the tube that connects the vehicle to the tailpipe. Even though a good conditioning of the tube was done by driving at high speed, such desorption phenomena were evident even after >1 h of high-speed driving. During the first active regeneration tests, the concentration of volatiles was so high that it interfered with the >10 nm measurement of solid particles from the dilution tunnel, even though a catalytic stripper was implemented in the instrument.
The key message is that the solid particle emissions of regenerations should be considered in future regulations, even though the weighted emissions did not exceed the current limit in our results. The volatile particles, which might also have health and environmental effects, should also be monitored, as this study and others in the literature showed very high concentrations. We believe that the tailpipe measurement is more representative for such particles. Even for solid particles, the dilution tunnel measurements might be suspect to volatile interference at the instruments at some regeneration events.
Author Contributions
Conceptualization, B.G.; formal analysis, A.M. and B.G.; writing—original draft preparation, B.G.; writing—review and editing, A.M. and T.L. All authors have read and agreed to the published version of the manuscript.
Funding
This research received no external funding.
Institutional Review Board Statement
Not applicable.
Informed Consent Statement
Not applicable.
Data Availability Statement
Data are available from the corresponding author.
Acknowledgments
This work was partly conducted in the framework of the DownToTen project, which was funded from the European Union’s Horizon 2020 research and innovation programme under grant agreement Nr. 724085. Special acknowledgment to D. Lesueur and P. Le Lijour for the experimental support.
Conflicts of Interest
The authors declare no conflict of interest.
Appendix A
Figure A1 plots the cold start solid particle number (SPN) emissions > 23 nm and >10 nm for the 2 vehicles. For vehicle #1 (Euro 6d-Temp), there was a substantial fraction of particles < 23 nm only during the first idling period, while for vehicle #2 (Euro 6b), the sub-23 nm particles remained for a much longer duration with a dropping tendency over time.
Figure A1.
Solid particle number (SPN) emissions measured from the tailpipe (TP): (a) Vehicle #1 (Euro 6d-Temp); (b) Vehicle #2 (Euro 6b).
Figure A1.
Solid particle number (SPN) emissions measured from the tailpipe (TP): (a) Vehicle #1 (Euro 6d-Temp); (b) Vehicle #2 (Euro 6b).

References
- Chen, Y.; Sun, R.; Borken-Kleefeld, J. On-Road NO x and Smoke Emissions of Diesel Light Commercial Vehicles–Combining Remote Sensing Measurements from across Europe. Environ. Sci. Technol. 2020, 54, 11744–11752. [Google Scholar] [CrossRef] [PubMed]
- Harris, S.J.; Maricq, M.M. Signature Size Distributions for Diesel and Gasoline Engine Exhaust Particulate Matter. J. Aerosol Sci. 2001, 32, 749–764. [Google Scholar] [CrossRef]
- Giechaskiel, B.; Mamakos, A.; Andersson, J.; Dilara, P.; Martini, G.; Schindler, W.; Bergmann, A. Measurement of Automotive Nonvolatile Particle Number Emissions within the European Legislative Framework: A Review. Aerosol Sci. Technol. 2012, 46, 719–749. [Google Scholar] [CrossRef]
- Lähde, T.; Rönkkö, T.; Virtanen, A.; Solla, A.; Kytö, M.; Söderström, C.; Keskinen, J. Dependence between Nonvolatile Nucleation Mode Particle and Soot Number Concentrations in an EGR Equipped Heavy-Duty Diesel Engine Exhaust. Environ. Sci. Technol. 2010, 44, 3175–3180. [Google Scholar] [CrossRef] [PubMed]
- Filippo, A.D.; Maricq, M.M. Diesel Nucleation Mode Particles: Semivolatile or Solid? Environ. Sci. Technol. 2008, 42, 7957–7962. [Google Scholar] [CrossRef]
- Giechaskiel, B.; Melas, A.; Martini, G.; Dilara, P. Overview of Vehicle Exhaust Particle Number Regulations. Processes 2021, 9, 2216. [Google Scholar] [CrossRef]
- Suarez-Bertoa, R.; Astorga, C. Impact of Cold Temperature on Euro 6 Passenger Car Emissions. Environ. Pollut. 2018, 234, 318–329. [Google Scholar] [CrossRef]
- Lähde, T.; Giechaskiel, B.; Pavlovic, J.; Suarez-Bertoa, R.; Valverde, V.; Clairotte, M.; Martini, G. Solid Particle Number Emissions of 56 Light-Duty Euro 5 and Euro 6 Vehicles. J. Aerosol Sci. 2022, 159, 105873. [Google Scholar] [CrossRef]
- Giechaskiel, B. Particle Number Emissions of a Diesel Vehicle during and between Regeneration Events. Catalysts 2020, 10, 587. [Google Scholar] [CrossRef]
- Transport & Environment New Diesels, New Problems. European Federation for Transport and Environment AISBL. Brussels, Belgium. 2020. Available online: https://www.transportenvironment.org/wp-content/uploads/2021/07/2020_01_New_diesels_new_problems_full_report.pdf (accessed on 7 February 2022).
- Valverde, V.; Giechaskiel, B. Assessment of Gaseous and Particulate Emissions of a Euro 6d-Temp Diesel Vehicle Driven >1300 Km Including Six Diesel Particulate Filter Regenerations. Atmosphere 2020, 11, 645. [Google Scholar] [CrossRef]
- Giechaskiel, B.; Lähde, T.; Suarez-Bertoa, R.; Clairotte, M.; Grigoratos, T.; Zardini, A.; Perujo, A.; Martini, G. Particle Number Measurements in the European Legislation and Future JRC Activities. Combust. Engines 2018, 174, 3–16. [Google Scholar] [CrossRef]
- Toumasatos, Z.; Raptopoulos-Chatzistefanou, A.; Kolokotronis, D.; Pistikopoulos, P.; Samaras, Z.; Ntziachristos, L. The Role of the Driving Dynamics beyond RDE Limits and DPF Regeneration Events on Pollutant Emissions of a Euro 6d-Temp Passenger Vehicle. J. Aerosol Sci. 2022, 161, 105947. [Google Scholar] [CrossRef]
- Samaras, Z.; Andersson, J.; Aakko-Saksa, P.; Cuelenaere, R.; Mellios, G. Additional Technical Issues for Euro 7 (LDV). Presented at the AGVES Meeting, Belgium, Brussels, 27 April 2021. [Google Scholar]
- Lahde, T.; Giechaskiel, B.; Martini, G. Development of Measurement Methodology for Sub 23 Nm Particle Number (PN) Measurements. SAE Int. J. Adv. Curr. Prac. Mobil. 2020, 3, 551–560. [Google Scholar] [CrossRef]
- Wang, T.; Quiros, D.C.; Thiruvengadam, A.; Pradhan, S.; Hu, S.; Huai, T.; Lee, E.S.; Zhu, Y. Total Particle Number Emissions from Modern Diesel, Natural Gas, and Hybrid Heavy-Duty Vehicles during on-Road Operation. Environ. Sci. Technol. 2017, 51, 6990–6998. [Google Scholar] [CrossRef] [PubMed]
- Smith, J.D.; Ruehl, C.; Burnitzki, M.; Sobieralski, W.; Ianni, R.; Quiros, D.; Hu, S.; Chernich, D.; Collins, J.; Huai, T.; et al. Real-Time Particulate Emissions Rates from Active and Passive Heavy-Duty Diesel Particulate Filter Regeneration. Sci. Total Environ. 2019, 680, 132–139. [Google Scholar] [CrossRef]
- Mamakos, A.; Martini, G.; Manfredi, U. Assessment of the Legislated Particle Number Measurement Procedure for a Euro 5 and a Euro 6 Compliant Diesel Passenger Cars under Regulated and Unregulated Conditions. J. Aerosol Sci. 2013, 55, 31–47. [Google Scholar] [CrossRef]
- Giechaskiel, B.; Melas, A.; Martini, G.; Dilara, P.; Ntziachristos, L. Revisiting Total Particle Number Measurements for Vehicle Exhaust Regulations. Atmosphere 2022, 13, 155. [Google Scholar] [CrossRef]
- Maricq, M.M. Chemical Characterization of Particulate Emissions from Diesel Engines: A Review. J. Aerosol Sci. 2007, 38, 1079–1118. [Google Scholar] [CrossRef]
- Duarte, R.M.B.O.; Duarte, A.C. On the Water-Soluble Organic Matter in Inhalable Air Particles: Why Should Outdoor Experience Motivate Indoor Studies? Appl. Sci. 2021, 11, 9917. [Google Scholar] [CrossRef]
- Samara, C. On the Redox Activity of Urban Aerosol Particles: Implications for Size Distribution and Relationships with Organic Aerosol Components. Atmosphere 2017, 8, 205. [Google Scholar] [CrossRef] [Green Version]
- Patel, A.B.; Shaikh, S.; Jain, K.R.; Desai, C.; Madamwar, D. Polycyclic Aromatic Hydrocarbons: Sources, Toxicity, and Remediation Approaches. Front. Microbiol. 2020, 11, 562813. [Google Scholar] [CrossRef] [PubMed]
- Pye, H.O.T.; Ward-Caviness, C.K.; Murphy, B.N.; Appel, K.W.; Seltzer, K.M. Secondary Organic Aerosol Association with Cardiorespiratory Disease Mortality in the United States. Nat. Commun. 2021, 12, 7215. [Google Scholar] [CrossRef] [PubMed]
- Abdul-Khalek, I.; Kittelson, D.; Brear, F. The Influence of Dilution Conditions on Diesel Exhaust Particle Size Distribution Measurements; SAE Technical Paper 1999-01–1142; SAE International: Warrendale, PA, USA, 1999. [Google Scholar]
- Ntziachristos, L.; Giechaskiel, B.; Pistikopoulos, P.; Samaras, Z.; Mathis, U.; Mohr, M.; Ristimäki, J.; Keskinen, J.; Mikkanen, P.; Casati, R.; et al. Performance Evaluation of a Novel Sampling and Measurement System for Exhaust Particle Characterization; SAE Technical Paper 2004-01–1439; SAE International: Warrendale, PA, USA, 2004. [Google Scholar]
- Kittelson, D.; Khalek, I.; McDonald, J.; Stevens, J.; Giannelli, R. Particle Emissions from Mobile Sources: Discussion of Ultrafine Particle Emissions and Definition. J. Aerosol Sci. 2022, 159, 105881. [Google Scholar] [CrossRef]
- Giechaskiel, B.; Cresnoverh, M.; Jörgl, H.; Bergmann, A. Calibration and Accuracy of a Particle Number Measurement System. Meas. Sci. Technol. 2010, 21, 045102. [Google Scholar] [CrossRef]
- Amanatidis, S.; Ntziachristos, L.; Giechaskiel, B.; Katsaounis, D.; Samaras, Z.; Bergmann, A. Evaluation of an Oxidation Catalyst (“Catalytic Stripper”) in Eliminating Volatile Material from Combustion Aerosol. J. Aerosol Sci. 2013, 57, 144–155. [Google Scholar] [CrossRef]
- Yamada, H.; Funato, K.; Sakurai, H. Application of the PMP Methodology to the Measurement of Sub-23 Nm Solid Particles: Calibration Procedures, Experimental Uncertainties, and Data Correction Methods. J. Aerosol Sci. 2015, 88, 58–71. [Google Scholar] [CrossRef]
- Samaras, Z.C.; Andersson, J.; Bergmann, A.; Hausberger, S.; Toumasatos, Z.; Keskinen, J.; Haisch, C.; Kontses, A.; Ntziachristos, L.D.; Landl, L.; et al. Measuring Automotive Exhaust Particles down to 10 Nm; SAE Technical Paper 2020-01–2209; SAE International: Warrendale, PA, USA, 2020. [Google Scholar]
- Mathis, U.; Ristimäki, J.; Mohr, M.; Keskinen, J.; Ntziachristos, L.; Samaras, Z.; Mikkanen, P. Sampling Conditions for the Measurement of Nucleation Mode Particles in the Exhaust of a Diesel Vehicle. Aerosol Sci. Technol. 2004, 38, 1149–1160. [Google Scholar] [CrossRef]
- Samaras, Z.; Rieker, M.; Papaioannou, E.; van Dorp, W.F.; Kousoulidou, M.; Ntziachristos, L.; Andersson, J.; Bergmann, A.; Hausberger, S.; Keskinen, J.; et al. Perspectives for Regulating 10 Nm Particle Number Emissions Based on Novel Measurement Methodologies. J. Aerosol Sci. 2022, 162, 105957. [Google Scholar] [CrossRef]
- Giechaskiel, B. Solid Particle Number Emission Factors of Euro VI Heavy-Duty Vehicles on the Road and in the Laboratory. Int. J. Environ. Res. Public Health 2018, 15, 304. [Google Scholar] [CrossRef] [Green Version]
- Mamakos, A.; Schwelberger, M.; Fierz, M.; Giechaskiel, B. Effect of Selective Catalytic Reduction on Exhaust Nonvolatile Particle Emissions of Euro VI Heavy-Duty Compression Ignition Vehicles. Aerosol Sci. Technol. 2019, 53, 898–910. [Google Scholar] [CrossRef] [Green Version]
- Giechaskiel, B.; Lähde, T.; Melas, A.D.; Valverde, V.; Clairotte, M. Uncertainty of Laboratory and Portable Solid Particle Number Systems for Regulatory Measurements of Vehicle Emissions. Environ. Res. 2021, 197, 111068. [Google Scholar] [CrossRef] [PubMed]
- Giechaskiel, B.; Lähde, T.; Drossinos, Y. Regulating Particle Number Measurements from the Tailpipe of Light-Duty Vehicles: The next Step? Environ. Res. 2019, 172, 1–9. [Google Scholar] [CrossRef] [PubMed]
- Nakamura, K.; Fukano, I.; Hosogai, S.; Dardiotis, C.; Kandlhofer, C. Comparison of Solid Particle Number Emission of Gasoline Direct Injection Vehicles between CVS and Tailpipe Samplings. Int. J. Automot. Eng. 2021, 12, 142–149. [Google Scholar] [CrossRef]
- Zinola, S.; Raux, S.; Leblanc, M. Persistent Particle Number Emissions Sources at the Tailpipe of Combustion Engines; SAE Technical Paper 2016-01–2283; SAE International: Warrendale, PA, USA, 2016. [Google Scholar]
- Lao, C.T.; Akroyd, J.; Eaves, N.; Smith, A.; Morgan, N.; Bhave, A.; Kraft, M. Modelling Particle Mass and Particle Number Emissions during the Active Regeneration of Diesel Particulate Filters. Proc. Combust. Inst. 2019, 37, 4831–4838. [Google Scholar] [CrossRef] [Green Version]
- Giechaskiel, B.; Munoz-Bueno, R.; Rubino, L.; Manfredi, U.; Dilara, P.; De Santi, G.; Andersson, J. Particle Measurement Programme (PMP): Particle Size and Number Emissions before, during and after Regeneration Events of a Euro 4 DPF Equipped Light-Duty Diesel Vehicle; SAE Technical Paper 2007-01–1944; SAE International: Warrendale, PA, USA, 2007. [Google Scholar]
- Giechaskiel, B.; Ntziachristos, L.; Samaras, Z.; Casati, R.; Scheer, V.; Vogt, R. Effect of Speed and Speed-Transition on the Formation of Nucleation Mode Particles from a Light Duty Diesel Vehicle; SAE Technical Paper 2007-01-1110; SAE International: Warrendale, PA, USA, 2007. [Google Scholar]
- Karjalainen, P.; Rönkkö, T.; Pirjola, L.; Heikkilä, J.; Happonen, M.; Arnold, F.; Rothe, D.; Bielaczyc, P.; Keskinen, J. Sulfur Driven Nucleation Mode Formation in Diesel Exhaust under Transient Driving Conditions. Environ. Sci. Technol. 2014, 48, 2336–2343. [Google Scholar] [CrossRef] [PubMed]
- Leblanc, M.; Noel, L.; R’Mili, B.; Boréave, A.; D’Anna, B.; Raux, S. Impact of Engine Warm-up and DPF Active Regeneration on Regulated & Unregulated Emissions of a Euro 6 Diesel SCR Equipped Vehicle. J. Earth Sci. Geotechn. Eng. 2016, 6, 29–50. [Google Scholar]
- R’Mili, B.; Boréave, A.; Meme, A.; Vernoux, P.; Leblanc, M.; Noël, L.; Raux, S.; D’Anna, B. Physico-Chemical Characterization of Fine and Ultrafine Particles Emitted during Diesel Particulate Filter Active Regeneration of Euro 5 Diesel Vehicles. Environ. Sci. Technol. 2018, 52, 3312–3319. [Google Scholar] [CrossRef]
- Bergmann, M.; Kirchner, U.; Vogt, R.; Benter, T. On-Road and Laboratory Investigation of Low-Level PM Emissions of a Modern Diesel Particulate Filter Equipped Diesel Passenger Car. Atmos. Environ. 2009, 43, 1908–1916. [Google Scholar] [CrossRef]
- Ruehl, C.; Smith, J.D.; Ma, Y.; Shields, J.E.; Burnitzki, M.; Sobieralski, W.; Ianni, R.; Chernich, D.J.; Chang, M.-C.O.; Collins, J.F.; et al. Emissions during and Real-World Frequency of Heavy-Duty Diesel Particulate Filter Regeneration. Environ. Sci. Technol. 2018, 52, 5868–5874. [Google Scholar] [CrossRef]
- Vouitsis, E.; Ntziachristos, L.; Samaras, Z. Modelling of Diesel Exhaust Aerosol during Laboratory Sampling. Atmos. Environ. 2005, 39, 1335–1345. [Google Scholar] [CrossRef]
- Shibata, K.; Enya, K.; Ishikawa, N.; Sakamoto, K. EC/OC and PAHs Emissions from a Modern Diesel Engine with DPF Regeneration Fueled by 10% RME Biodiesel. Aerosol Air Qual. Res. 2019, 19, 1765–1774. [Google Scholar] [CrossRef]
- Giechaskiel, B. Differences between Tailpipe and Dilution Tunnel Sub-23 Nm Nonvolatile (Solid) Particle Number Measurements. Aerosol Sci. Technol. 2019, 53, 1012–1022. [Google Scholar] [CrossRef] [Green Version]
- Giechaskiel, B. Effect of Sampling Conditions on the Sub-23 Nm Nonvolatile Particle Emissions Measurements of a Moped. Appl. Sci. 2019, 9, 3112. [Google Scholar] [CrossRef] [Green Version]
- Cauda, E.; Hernandez, S.; Fino, D.; Saracco, G.; Specchia, V. PM0.1 Emissions during Diesel Trap Regeneration. Environ. Sci. Technol. 2006, 40, 5532–5537. [Google Scholar] [CrossRef] [PubMed]
- Beatrice, C.; Iorio, S.D.; Guido, C.; Napolitano, P. Detailed Characterization of Particulate Emissions of an Automotive Catalyzed DPF Using Actual Regeneration Strategies. Exp. Therm. Fluid Sci. 2012, 39, 45–53. [Google Scholar] [CrossRef]
- Meng, Z.; Chen, Z.; Tan, J.; Wang, W.; Zhang, Z.; Huang, J.; Fang, J. Regeneration Performance and Particulate Emission Characteristics during Active Regeneration Process of GPF with Ash Loading. Chem. Eng. Sci. 2022, 248, 117114. [Google Scholar] [CrossRef]
- Drossinos, Y.; Melas, A.D.; Kostoglou, M.; Isella, L. Morphology-Dependent Random Binary Fragmentation of in Silico Fractal-like Agglomerates. Europhys. Lett. 2019, 127, 46002. [Google Scholar] [CrossRef] [Green Version]
- Yang, J.; Pham, L.; Johnson, K.C.; Durbin, T.D.; Karavalakis, G.; Kittelson, D.; Jung, H. Impacts of Exhaust Transfer System Contamination on Particulate Matter Measurements. Emiss. Control Sci. Technol. 2020, 6, 163–177. [Google Scholar] [CrossRef] [Green Version]
- Swanson, J.J.; Kittelson, D.B.; Watts, W.F.; Gladis, D.D.; Twigg, M.V. Influence of Storage and Release on Particle Emissions from New and Used CRTs. Atmos. Environ. 2009, 43, 3998–4004. [Google Scholar] [CrossRef]
- Maricq, M.M.; Chase, R.E.; Xu, N. A Comparison of Tailpipe, Dilution Tunnel, and Wind Tunnel Data in Measuring Motor Vehicle PM. J. Air Waste Manag. Assoc. 2001, 51, 1529–1537. [Google Scholar] [CrossRef] [Green Version]
- Dwyer, H.; Ayala, A.; Zhang, S.; Collins, J.; Huai, T.; Herner, J.; Chau, W. Emissions from a Diesel Car during Regeneration of an Active Diesel Particulate Filter. J. Aerosol Sci. 2010, 41, 541–552. [Google Scholar] [CrossRef]
- Zerboni, A.; Rossi, T.; Bengalli, R.; Catelani, T.; Rizzi, C.; Priola, M.; Casadei, S.; Mantecca, P. Diesel Exhaust Particulate Emissions and in Vitro Toxicity from Euro 3 and Euro 6 Vehicles. Environ. Pollut. 2022, 297, 118767. [Google Scholar] [CrossRef] [PubMed]
- Pajdowski, P.; Puchałka, B. The Process of Diesel Particulate Filter Regeneration under Real Driving Conditions. IOP Conf. Ser. Earth Environ. Sci. 2019, 214, 012114. [Google Scholar] [CrossRef]
Figure 1.
Schematic setup. APC = advanced particle counter; BD = bifurcated diluter; CPC = condensation particle counter; CS = catalytic stripper; CVS = constant volume sampling; EEPS = engine exhaust particle sizer; ED = ejector diluter; PD = porous diluter; SPN = solid particle number; Temp = temperature; TP = tailpipe; TPN = total particle number.

Figure 2.
Schematic presentation of the test protocol. Temperatures are the maximum exhaust gas tailpipe temperatures of the specific tests. In red, tests where active regeneration took place. The 330 km and 610 km indicate the first and third test at 120 km/h which will be discussed in the Results section.

Figure 3.
Differences between the SPN instruments at the dilution tunnel (CVS) and the tailpipe (TP). Results from vehicle #1 (Euro 6d-Temp) are plotted with circles and from vehicle #2 with squares (Euro 6b). Solid symbols are the results from the 23 nm counters, while open symbols from the 10 nm counters.

Figure 4.
Emissions during the last regeneration event of vehicle #1 (Euro 6d-Temp) at 120 km/h.

Figure 5.
Emissions during the first regeneration event of vehicle #1 (Euro 6d-Temp) at 130 and 120 km/h.
Figure 5.
Emissions during the first regeneration event of vehicle #1 (Euro 6d-Temp) at 130 and 120 km/h.

Figure 6.
Comparison of regenerating and non-regenerating WLTCs with vehicle #2 (Euro 6b): (a) exhaust gas temperature at the tailpipe, speed, and exhaust flow rate. Continuous lines are data from regenerating cycle. Dashed lines from non-regenerating cycle; (b) solid particle number (SPN) and total particle number (TPN) emissions of the regenerating cycle. Only the 10 nm SPN at the tailpipe (TP) and dilution tunnel (CVS) is shown for the non-regenerating cycle for better clarity.

Figure 7.
Three tests at 120 km/h at 330 km (1), 390 km (2), and 610 km (3): (a) Total particle number (TPN) emissions at the tailpipe (TP) or the dilution tunnel (CVS); (b) Speed and exhaust gas temperature at the tailpipe.
Figure 7.
Three tests at 120 km/h at 330 km (1), 390 km (2), and 610 km (3): (a) Total particle number (TPN) emissions at the tailpipe (TP) or the dilution tunnel (CVS); (b) Speed and exhaust gas temperature at the tailpipe.

Figure 8.
Excess of sub-23 nm particle concentrations calculated as (SPN10,TP − SPN23,TP)/SPN23,TP.

Figure 9.
Solid particle number (SPN) and total particle number (TPN) emissions measured from the tailpipe with counters of different lower cut-points. The results are plotted separately for the worldwide harmonized light vehicles test cycle (WLTC) and 120 km/h, without and with active regeneration, and the overall (i.e., weighted with one regeneration event) emissions: (a) Vehicle #1 (Euro 6d-Temp); (b) Vehicle #2 (Euro 6b).


Table 1.
Characteristics of the two vehicles tested.
| Vehicle | #1 | #2 |
|---|---|---|
| Emission standard | Euro 6d-Temp | Euro 6b |
| Registration month/year | January 2020 | June 2017 |
| Engine displacement (L) | 1.6 | 1.6 |
| Maximum power (kW) | 85 | 88 |
| Odometer (km) | 8500 | 21,000 |
| After-treatment configuration | DOC, DPF, SCR | DOC, DPF, SCR |
DOC = Diesel oxidation catalyst; DPF = Diesel particulate filter; SCR = selective catalytic reduction for NOx.
Table 2.
Emissions (×1011 #/km) of the two vehicles following the type approval cycle and including emissions during regeneration. Only measurements from the tailpipe were considered.
Table 2.
Emissions (×1011 #/km) of the two vehicles following the type approval cycle and including emissions during regeneration. Only measurements from the tailpipe were considered.
| Vehicle | #1 (Euro 6d-Temp) | #2 (Euro 6b) | ||
|---|---|---|---|---|
| Cycle | WLTC | Overall 1 | WLTC | Overall 2 |
| SPN23,TP | 0.04 | 1.44 | 1.64 | 1.21 |
| SPN10,TP | 0.06 | 1.96 | 2.06 | 1.57 |
| TPN10,TP | 0.16 | 153 | 2.49 | 19.9 |
| TPN4,TP | 0.22 | 304 | 3.37 | 27.3 |
1 Based on 460 km of driving and one active regeneration event; 2 Based on 830 km of driving and one active regeneration event.
Publisher’s Note: MDPI stays neutral with regard to jurisdictional claims in published maps and institutional affiliations. |
© 2022 by the authors. Licensee MDPI, Basel, Switzerland. This article is an open access article distributed under the terms and conditions of the Creative Commons Attribution (CC BY) license (https://creativecommons.org/licenses/by/4.0/).
Share and Cite
MDPI and ACS Style
Giechaskiel, B.; Melas, A.; Lähde, T. Detailed Characterization of Solid and Volatile Particle Emissions of Two Euro 6 Diesel Vehicles. Appl. Sci. 2022, 12, 3321. https://0-doi-org.brum.beds.ac.uk/10.3390/app12073321
AMA Style
Giechaskiel B, Melas A, Lähde T. Detailed Characterization of Solid and Volatile Particle Emissions of Two Euro 6 Diesel Vehicles. Applied Sciences. 2022; 12(7):3321. https://0-doi-org.brum.beds.ac.uk/10.3390/app12073321
Chicago/Turabian StyleGiechaskiel, Barouch, Anastasios Melas, and Tero Lähde. 2022. "Detailed Characterization of Solid and Volatile Particle Emissions of Two Euro 6 Diesel Vehicles" Applied Sciences 12, no. 7: 3321. https://0-doi-org.brum.beds.ac.uk/10.3390/app12073321
Note that from the first issue of 2016, this journal uses article numbers instead of page numbers. See further details here.