
Dynamic Identification on an Irregular Structure


1
Department of Civil, Environmental, Land, Building Engineering and Chemistry (DICATECh), Polytechnic University of Bari, 70125 Bari, Italy
2
Department of Civil Engineering Sciences and Architecture (DICAR), Polytechnic University of Bari, 70125 Bari, Italy
3
Department of Innovation Engineering (DII), University of Salento, 73100 Lecce, Italy
*
Author to whom correspondence should be addressed.
Appl. Sci. 2022, 12(7), 3445; https://0-doi-org.brum.beds.ac.uk/10.3390/app12073445
Submission received: 17 January 2022
/
Revised: 14 March 2022
/
Accepted: 25 March 2022
/
Published: 28 March 2022
(This article belongs to the Special Issue New Achievements in Structural Dynamics Analysis)
Abstract
:This paper presents the experimental analysis on the “Municipal Headquarters” of Palagianello Town. This is a strategic building with a high complexity at planimetric and altimetric level, so it is interesting the evaluation of its structural dynamic performance in case of seismic emergency management. To this aim, environmental vibrations have been acquired in situ and accelerometers have been positioned in well-defined points. The data were analyzed with an easy and accurate process that includes the Operational Modal Analysis (OMA), to identify the natural frequencies, the mode shapes and the damping ratios with non-destructive testings. Subsequently, the experimental results were compared with those of two numerical models (with and without infill walls) defined by means of the finite element method (FEM); this allowed for better calibration of the model and to arrive at more realistic conclusions about the behavior of the structure. The paper discusses the influence of the stiffness contribution of masonry infills on the dynamic properties of the building. Moreover, it shows that the adoption of ad hoc chosen locations of the sensors could influence the accuracy of the experimental results, especially for structures characterized by irregularities.
1. Introduction
The seismicity of the Italian territory and the recently recorded seismic events require the adoption of effective measures capable of mitigating the effects of earthquakes on structures.
The high vulnerability of the Italian built heritage is mainly associated with the high variability of the seismic hazard classification that has occurred in recent decades. The consequence of this circumstance is the existence of a great amount of the building stock realized in accordance with the seismic criteria but considering seismic forces lower than those imposed by the new seismic classification, and, in addition, a number of other buildings, the oldest ones, which have been built without any seismic criterion. Thus, in these cases, interventions to adapt the structures to the new seismic hazard are needed. To better design these types of interventions it is advisable to proceed with the structural monitoring before their execution, to obtain useful information on the building under exam. The level of knowledge acquired, in fact, strongly influences the design of structural improvement interventions.
Monitoring is one of the most important management tools to guarantee the safety of buildings and to allow an economic and effective planning of maintenance interventions. This is useful in the case of structures that must perform their function for many years and that are utilized for several uses during their service life, different from those initially foreseen.
In recent years, the Operational Modal Analysis (OMA) has become one of the most utilized techniques, leading to the identification of the unknown modal parameters of a building from the monitoring output-only analysis [1,2,3,4]. This procedure allows us to accurately evaluate in situ the actual behavior of the structures [5,6] in standard environmental conditions, without any applied force; for this reason, it is also used for buildings with monumental and historical value [7,8,9,10,11,12,13,14,15,16,17,18]. In fact, some recent studies [19,20,21,22] demonstrate that the knowledge of the modal parameters of the structure is essential for the evaluation of the seismic vulnerability and the effects of horizontal forces on structural parts and masonry infills during earthquakes. Furthermore, modern structural design techniques require the increasingly important use of mathematical models for the prediction of structural behavior such as the finite element (FE) model. The reliability of the results that can be obtained from these models depends on the underlying assumptions, i.e., the constraint conditions, the mechanical model adopted for the materials, the internal restraints, etc. For this reason, it is important to study data reprocessing techniques and their results that allow for structural identification and related parameters.
In the literature, several experimental tests on structures have been studied and carried out to improve the level of knowledge; the final aim is to define the test apparatus capable of validating the FE model and guarantee the acquisition of a high level.
However, the application to the analysis of reinforced concrete (r.c.) buildings characterized by irregularities is limited. In these cases, the irregularities influence the dynamic properties that are thus expected to be different from the usual ones and, consequently, an ad hoc definition of the testing set-up is needed. The present paper deals with these issues by analyzing the dynamic behavior of a strategic building, the “Municipality Headquarter” of Palagianello (Italy). This building is characterized by an r.c. frame and presents irregularities both in plan and elevation.
In detail, this study involved a first phase of monitoring obtained by acquiring data with the installation of accelerometers in ad hoc chosen points of the structure. The second phase was to perform OMA on the acquired data, by means of ARTeMIS software [23]. The third phase was to define a FE model by means of SAP2000 software [24], in accordance with the documentation and geometrical survey performed on the structure. The last step consists of an optimization procedure whose main aim is to change the parameters correlated with the uncertainties to reduce the percentage of error on the frequencies of the main modal shapes identified.
2. The Town Hall of Palagianello
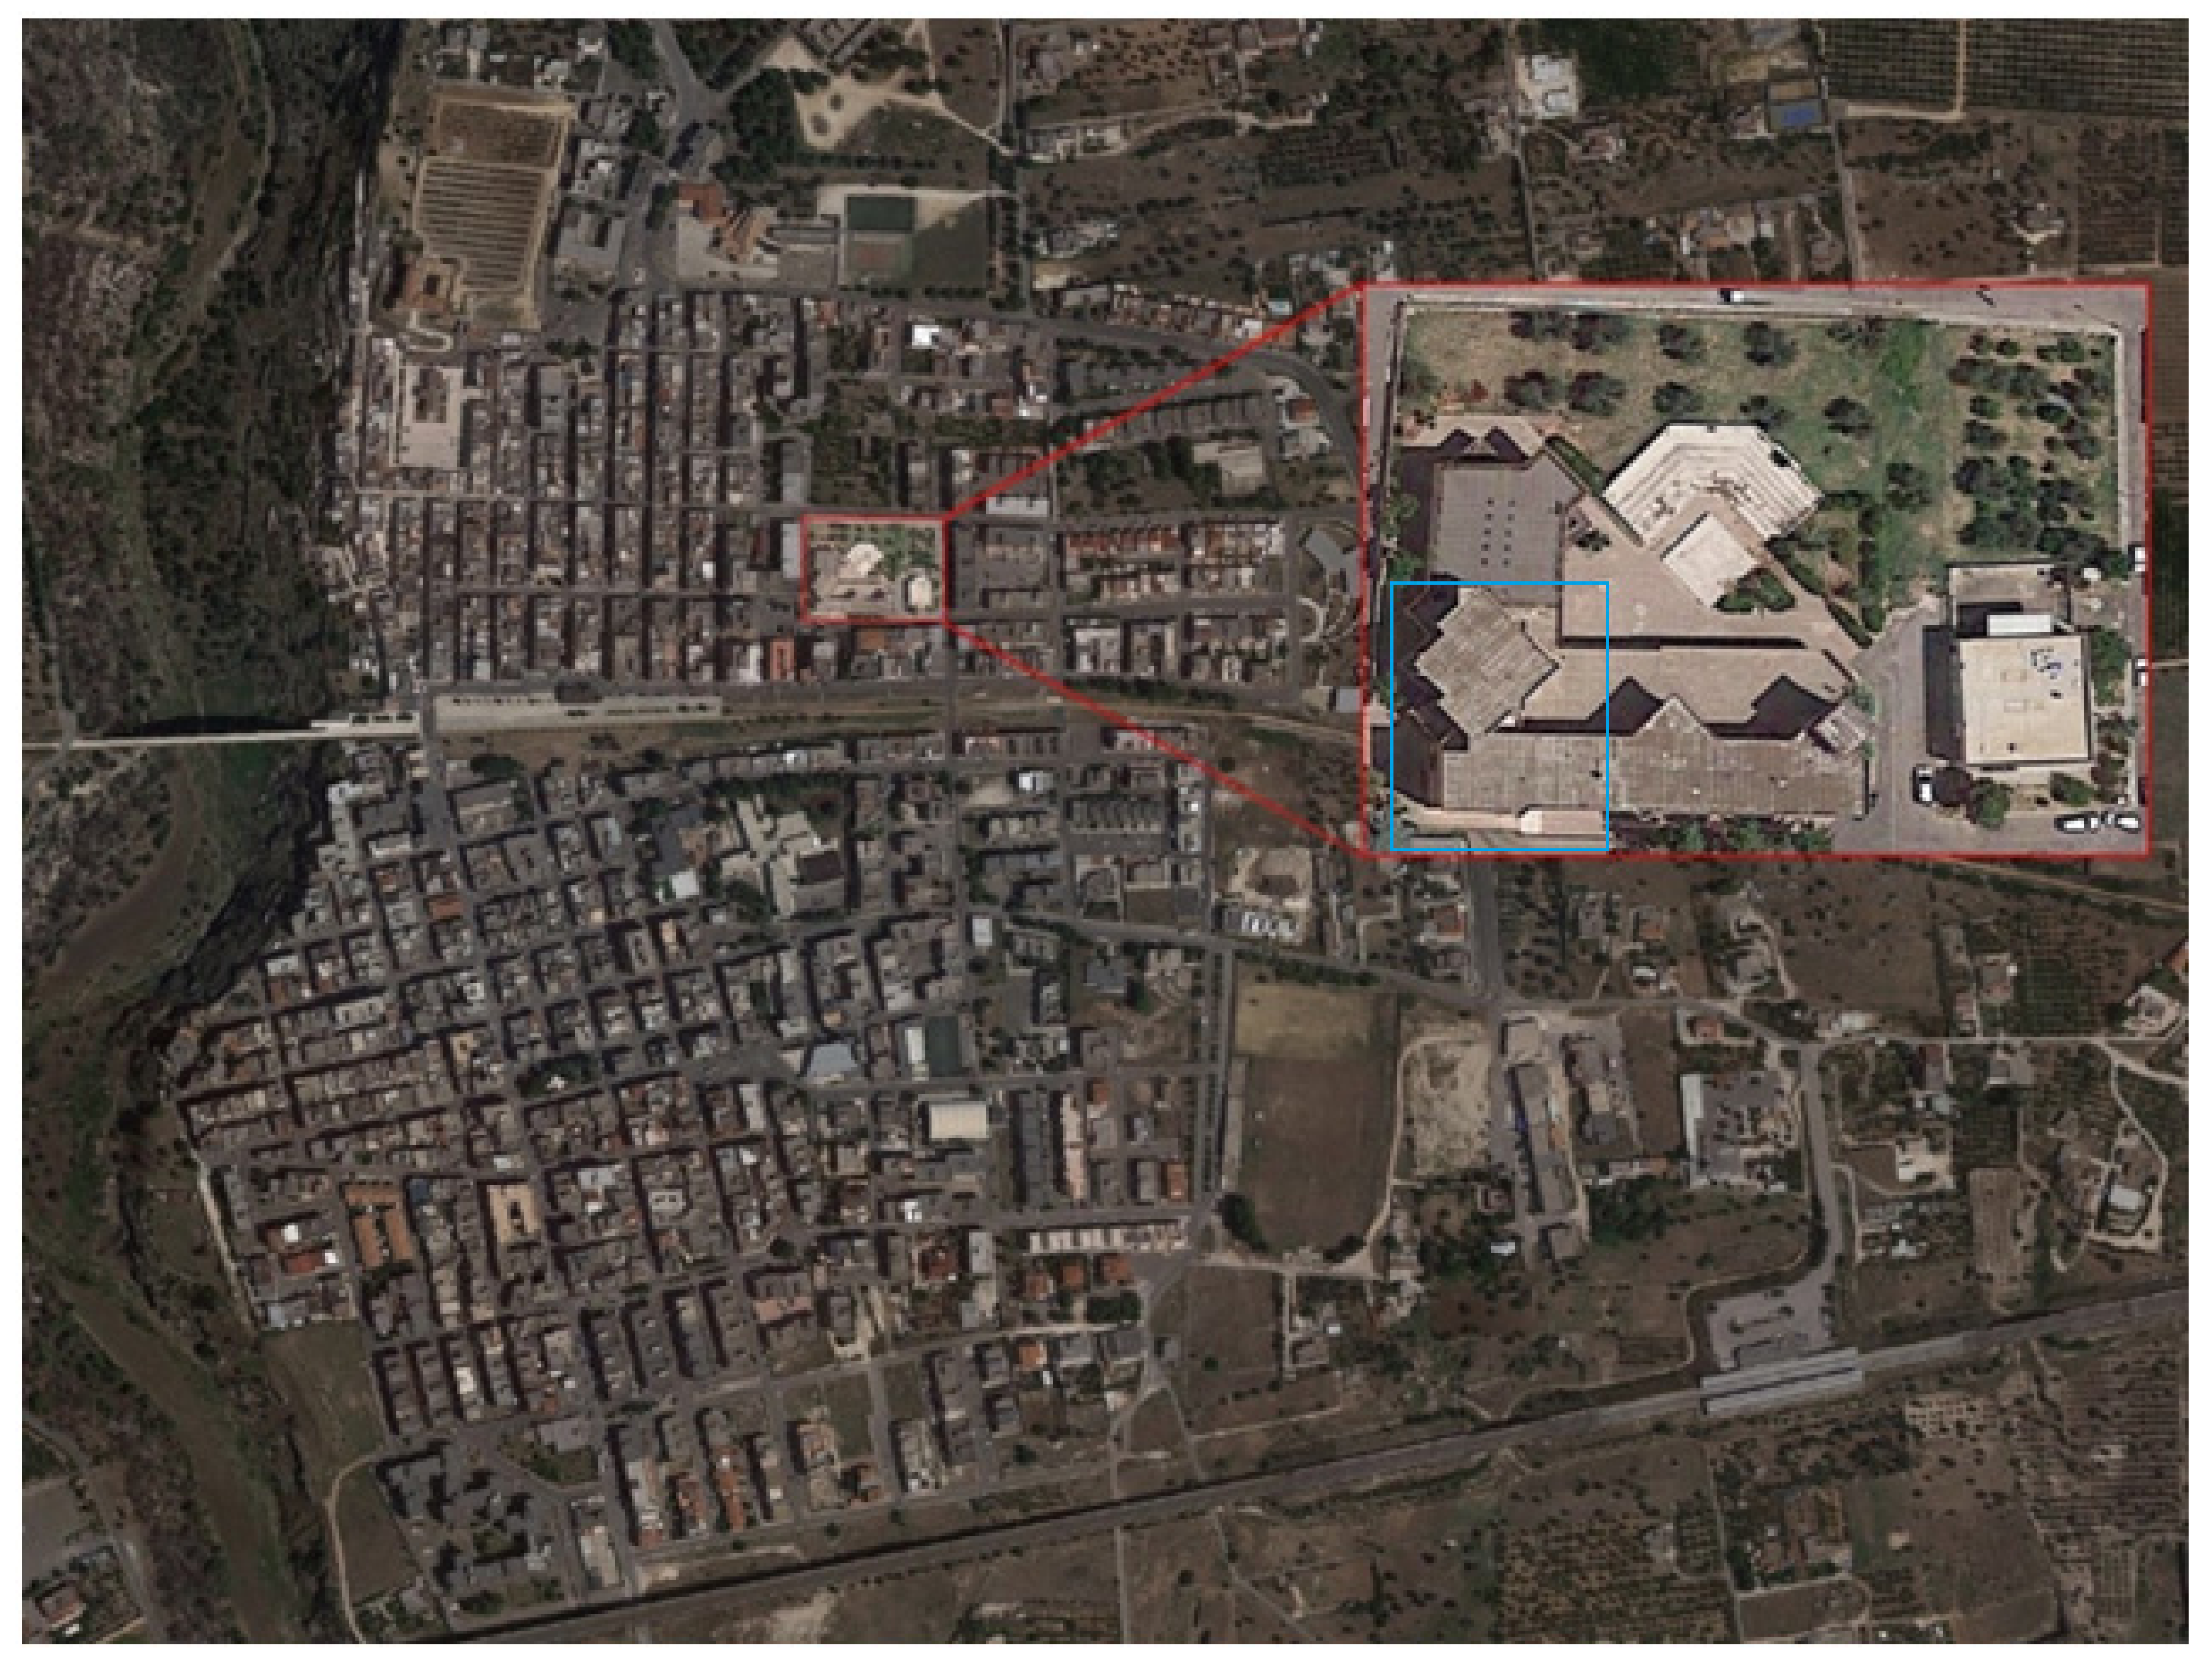
The monitored building is the Town Hall of the Municipality of Palagianello (Taranto, Apulia, Italy) located in the northern part of the urbanized part of the town (Figure 1), at an altitude of about 130 m above the sea level. Therefore, the building falls within Seismic Zone 3 (low seismicity) following the Italian seismic classification [25,26].
The building was designed in 1988 but its construction dates to 1991. The building is divided into three independent blocks, each one separated from the other by an expansion joint of 2 ÷ 3 cm and having three different service destinations: institutional Headquarters of the Municipality, Council Hall and School (in red in Figure 1). The present research investigates the block adopted as institutional Headquarters of the Municipality, indicated in blue in Figure 1. Following the Italian Decree [27,28], the building is considered a strategic one by the Civil Protection and falls into category A, which includes civil structures with functional operational support for emergency management. Table 1 shows the parameters of the structure.
Charatteristic of the Structure
The “Municipal Headquarters” of Palagianello (Figure 2) is a very articulate structure, with a complex irregularity in plan and in elevation. The building has a flat roof, and it consists of a framed structure in r.c. with masonry infill panels, r.c. and hollow tiles mixed floors. It is also characterized by the presence of some stiffening r.c. walls (with 130 × 30 cm or 170 × 30 cm sizes). The building consists of a basement level and four levels above the ground level; the heights and relative plans of the individual decks are:
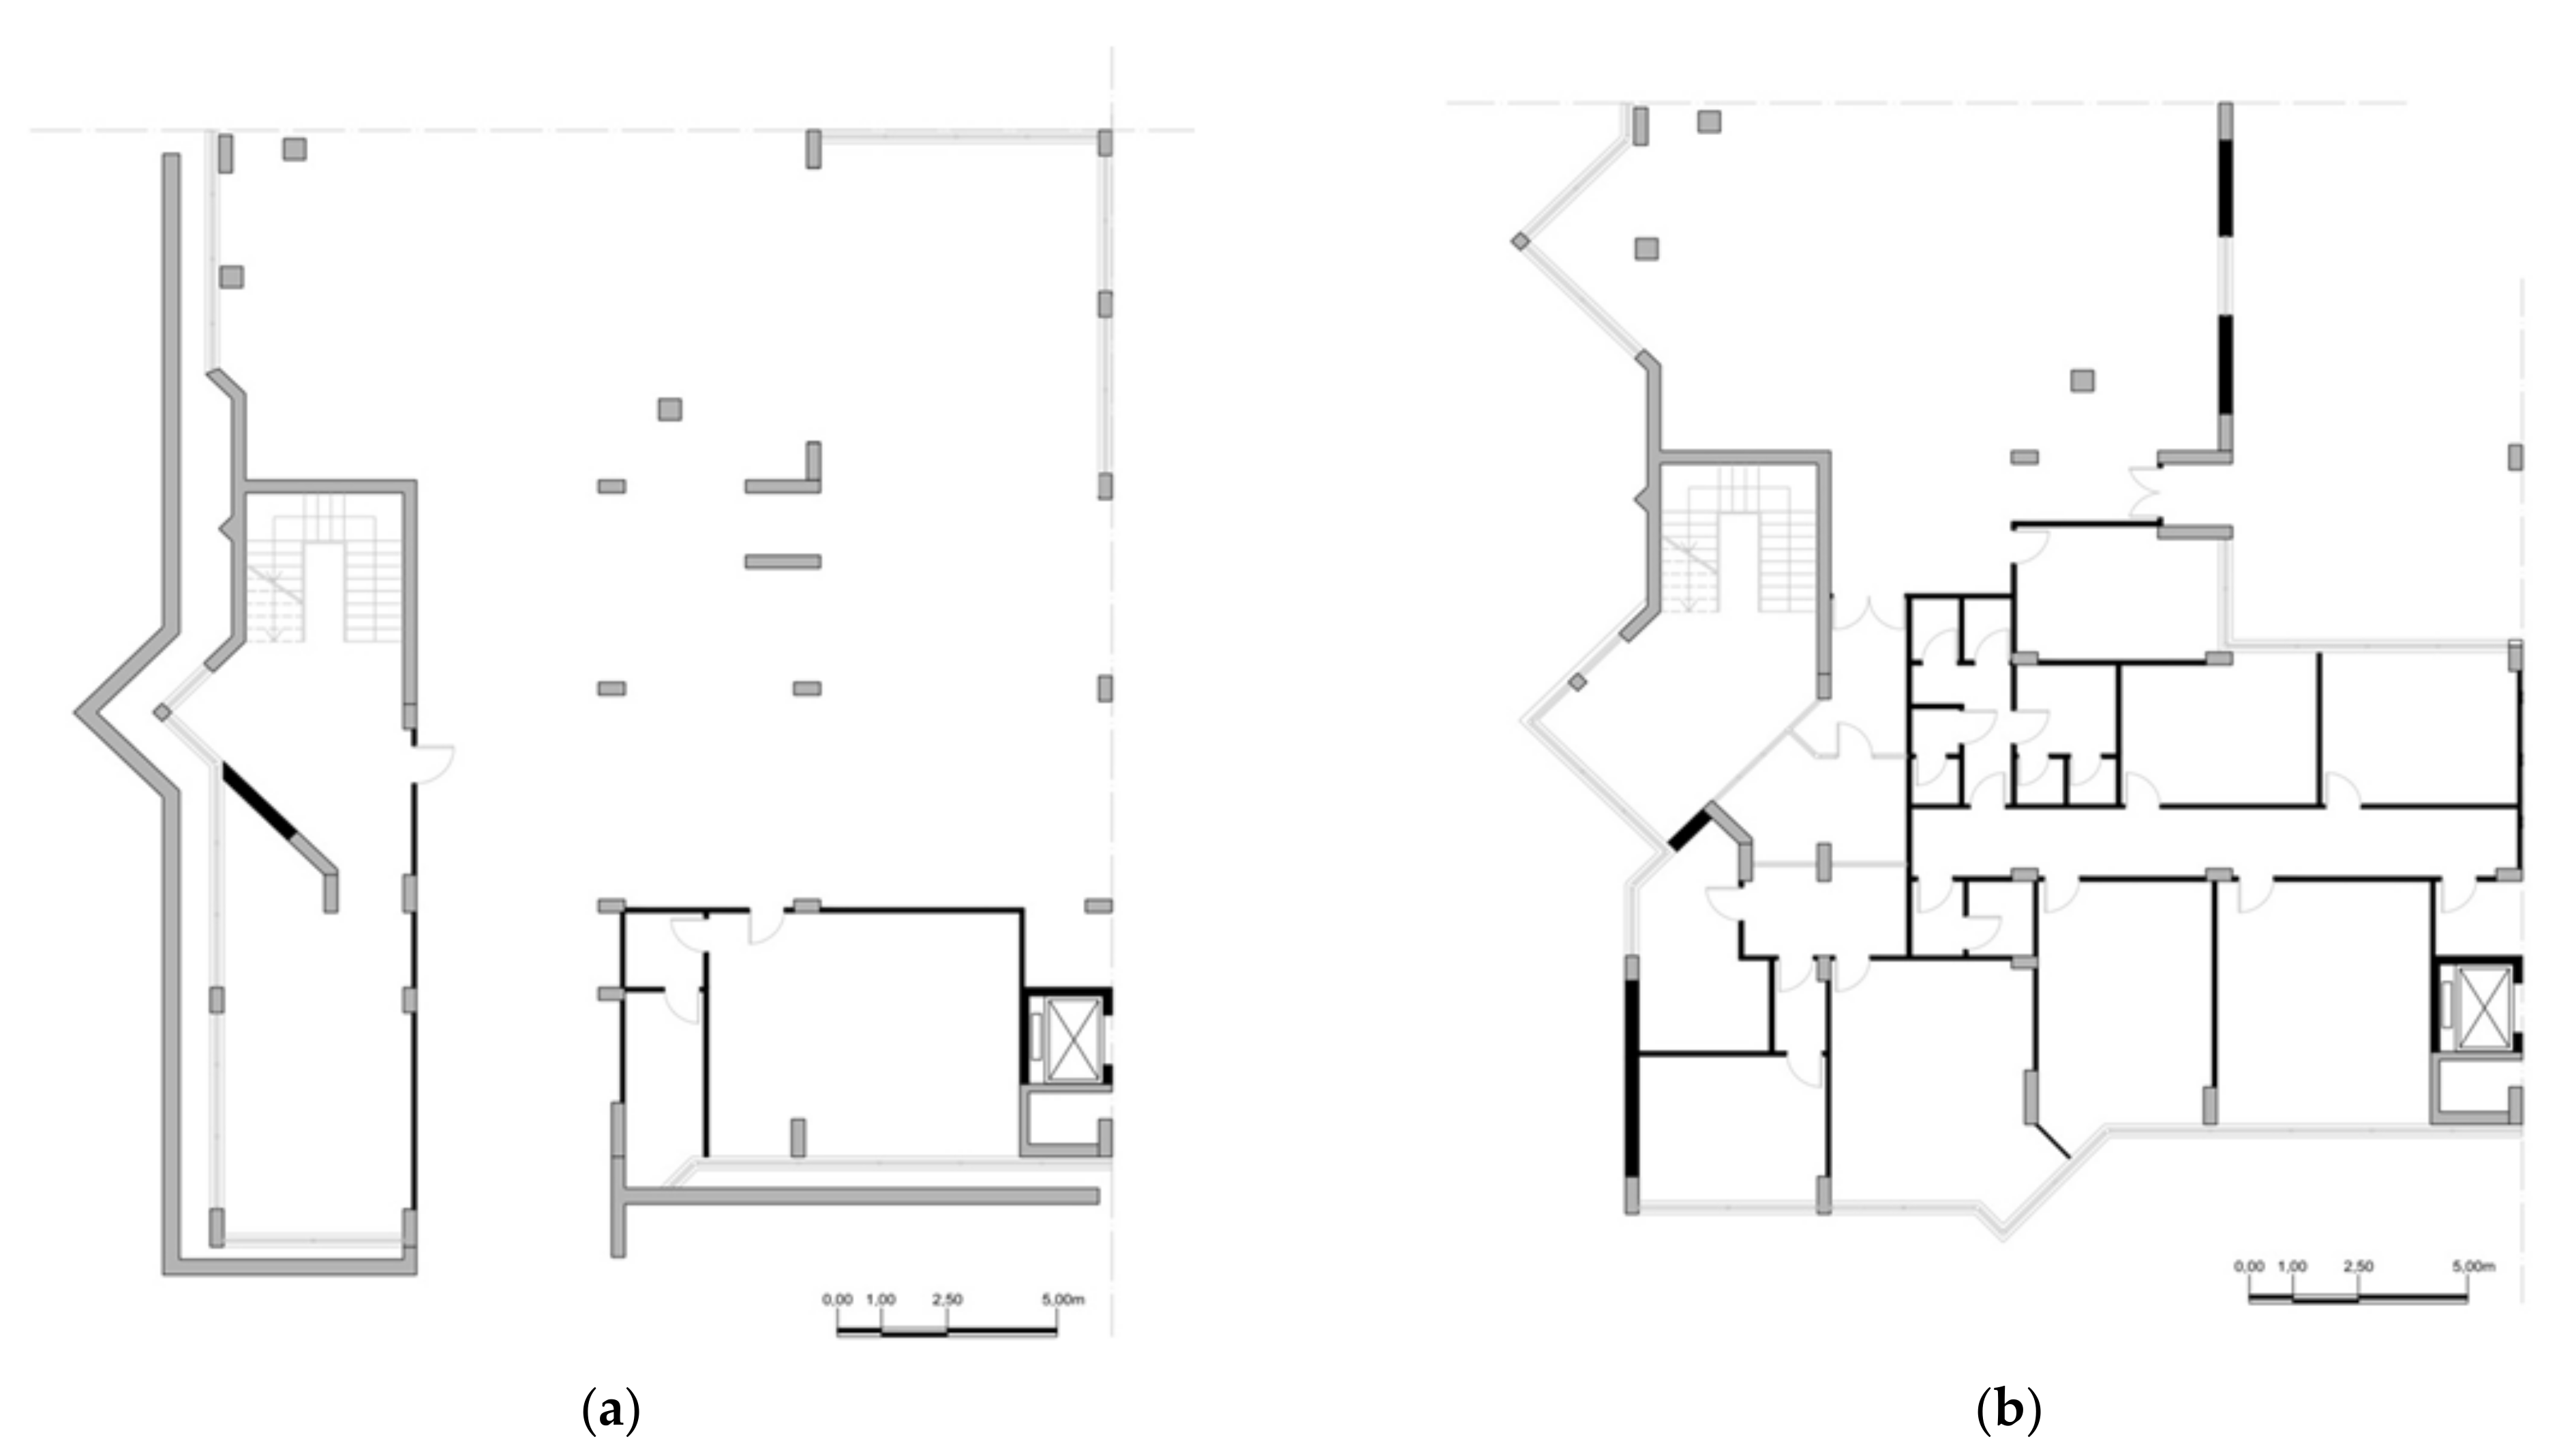
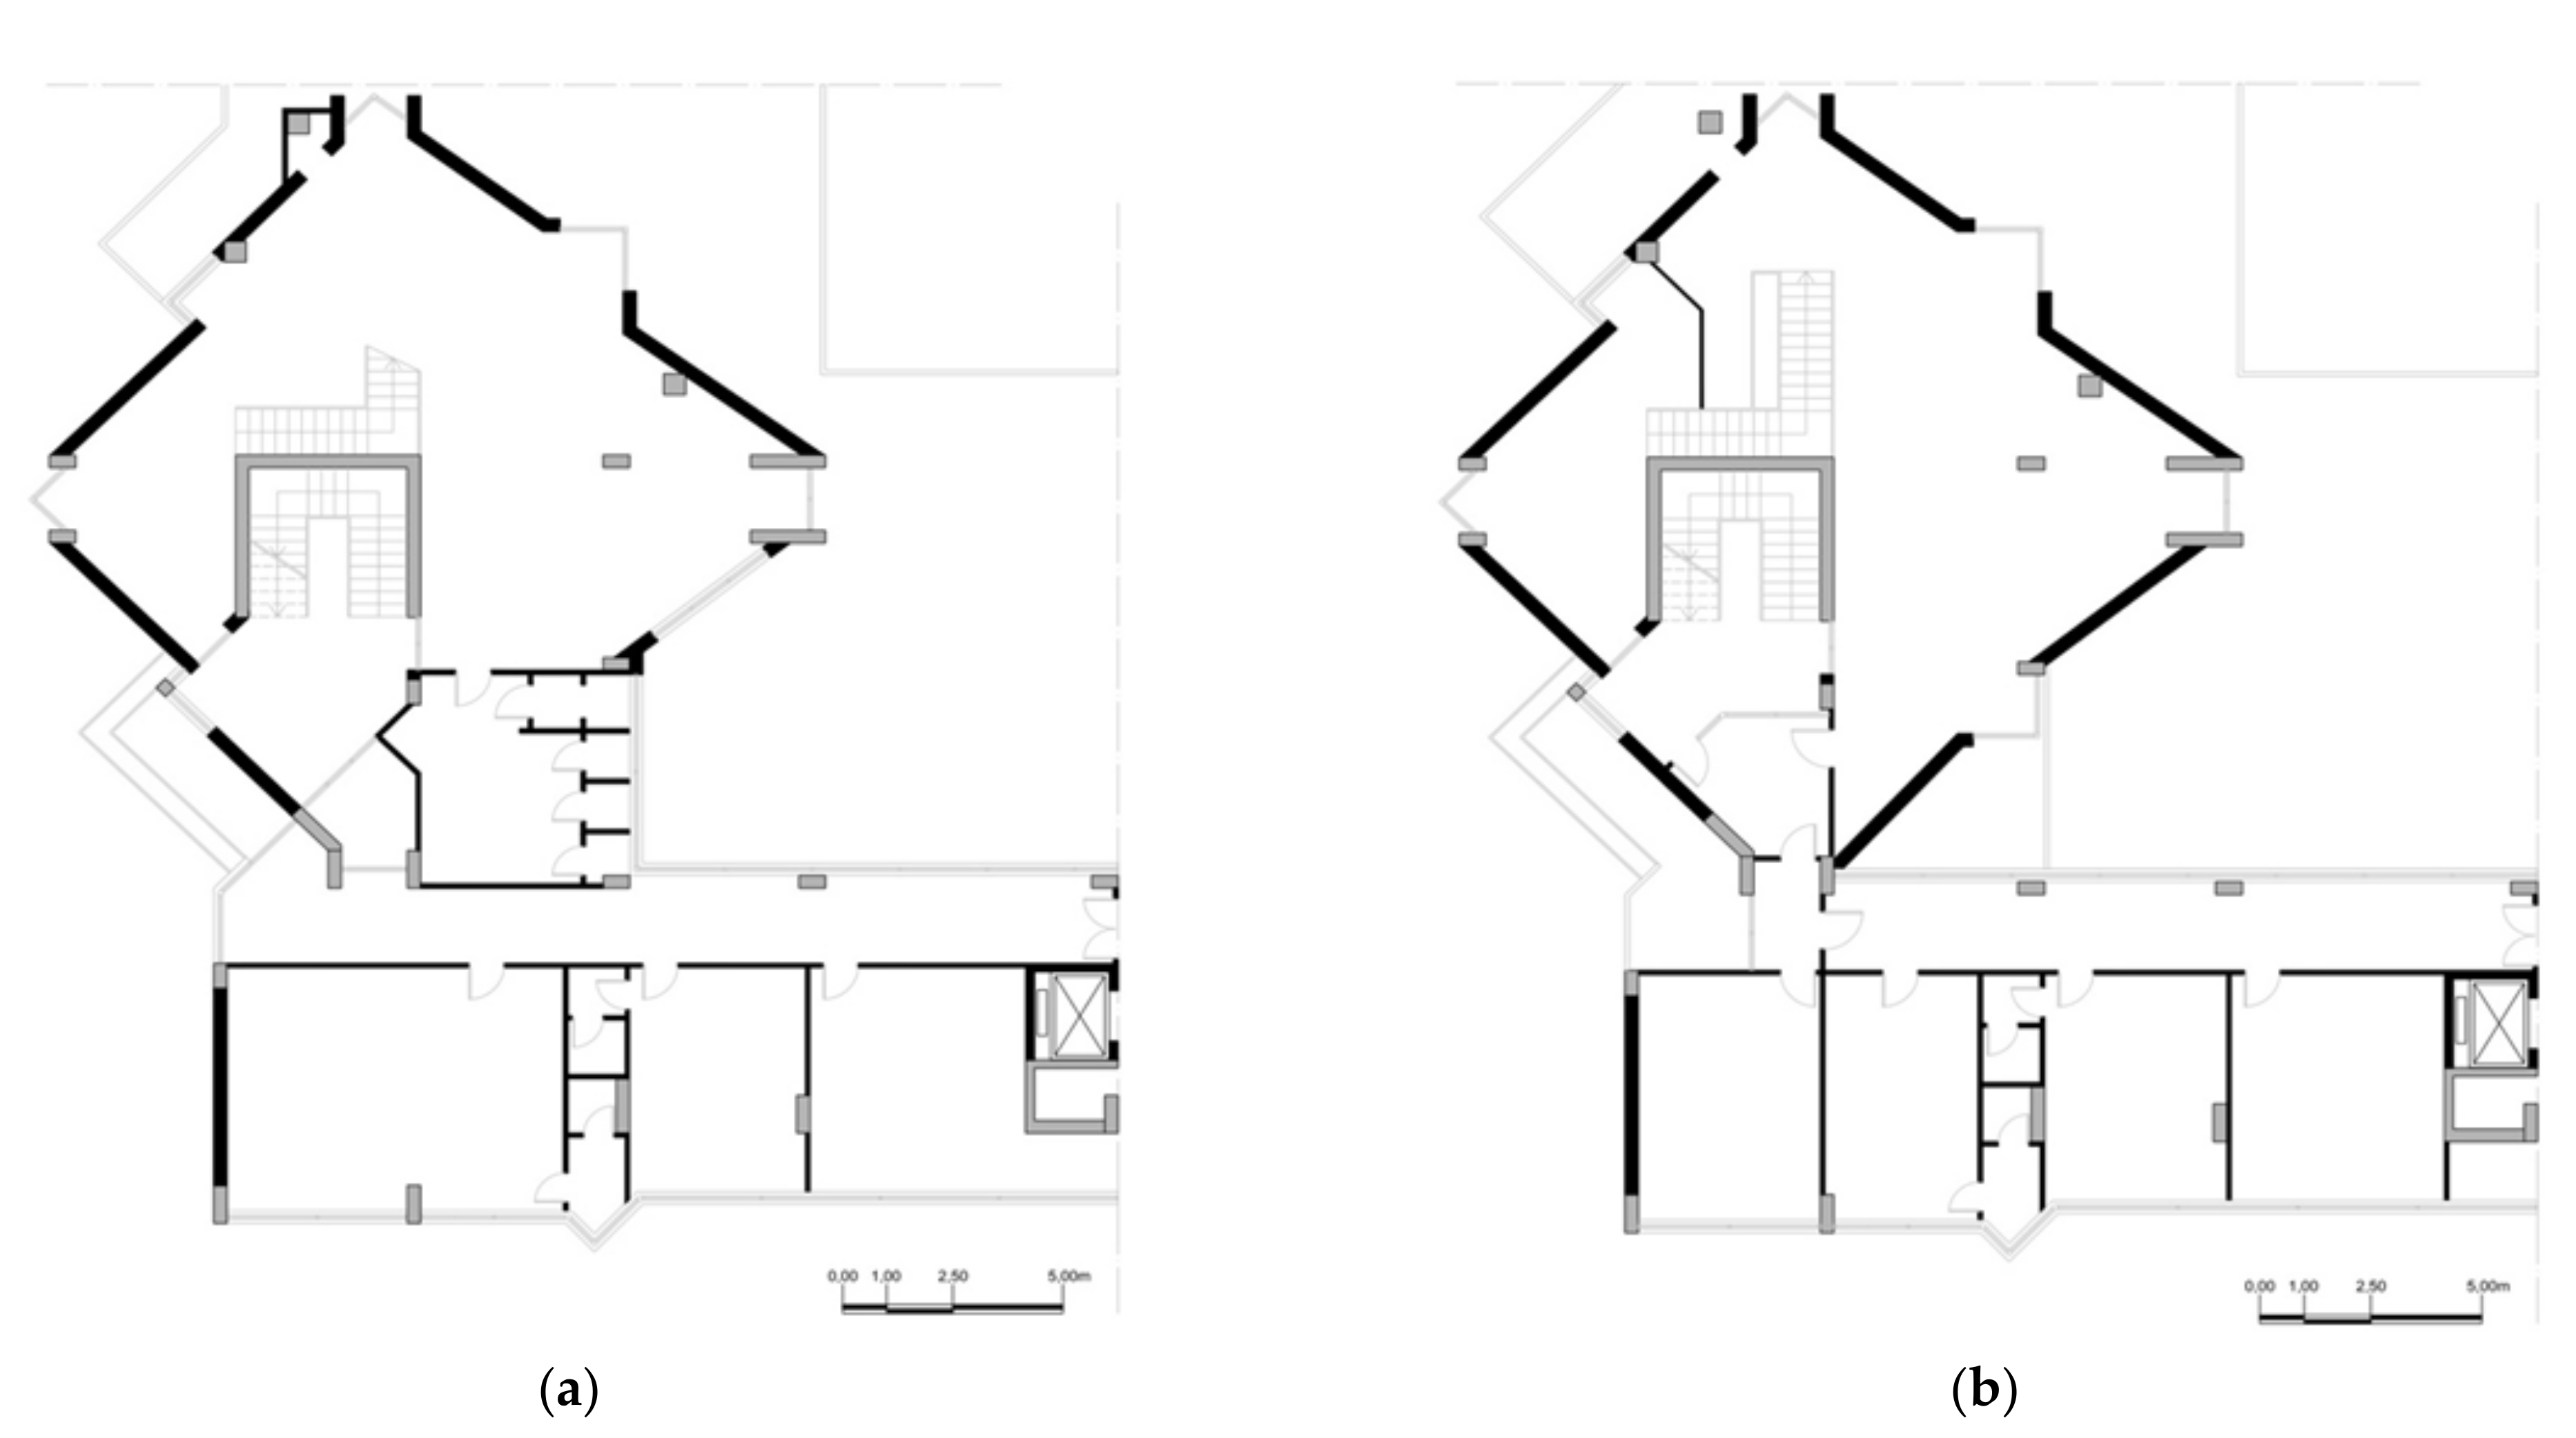
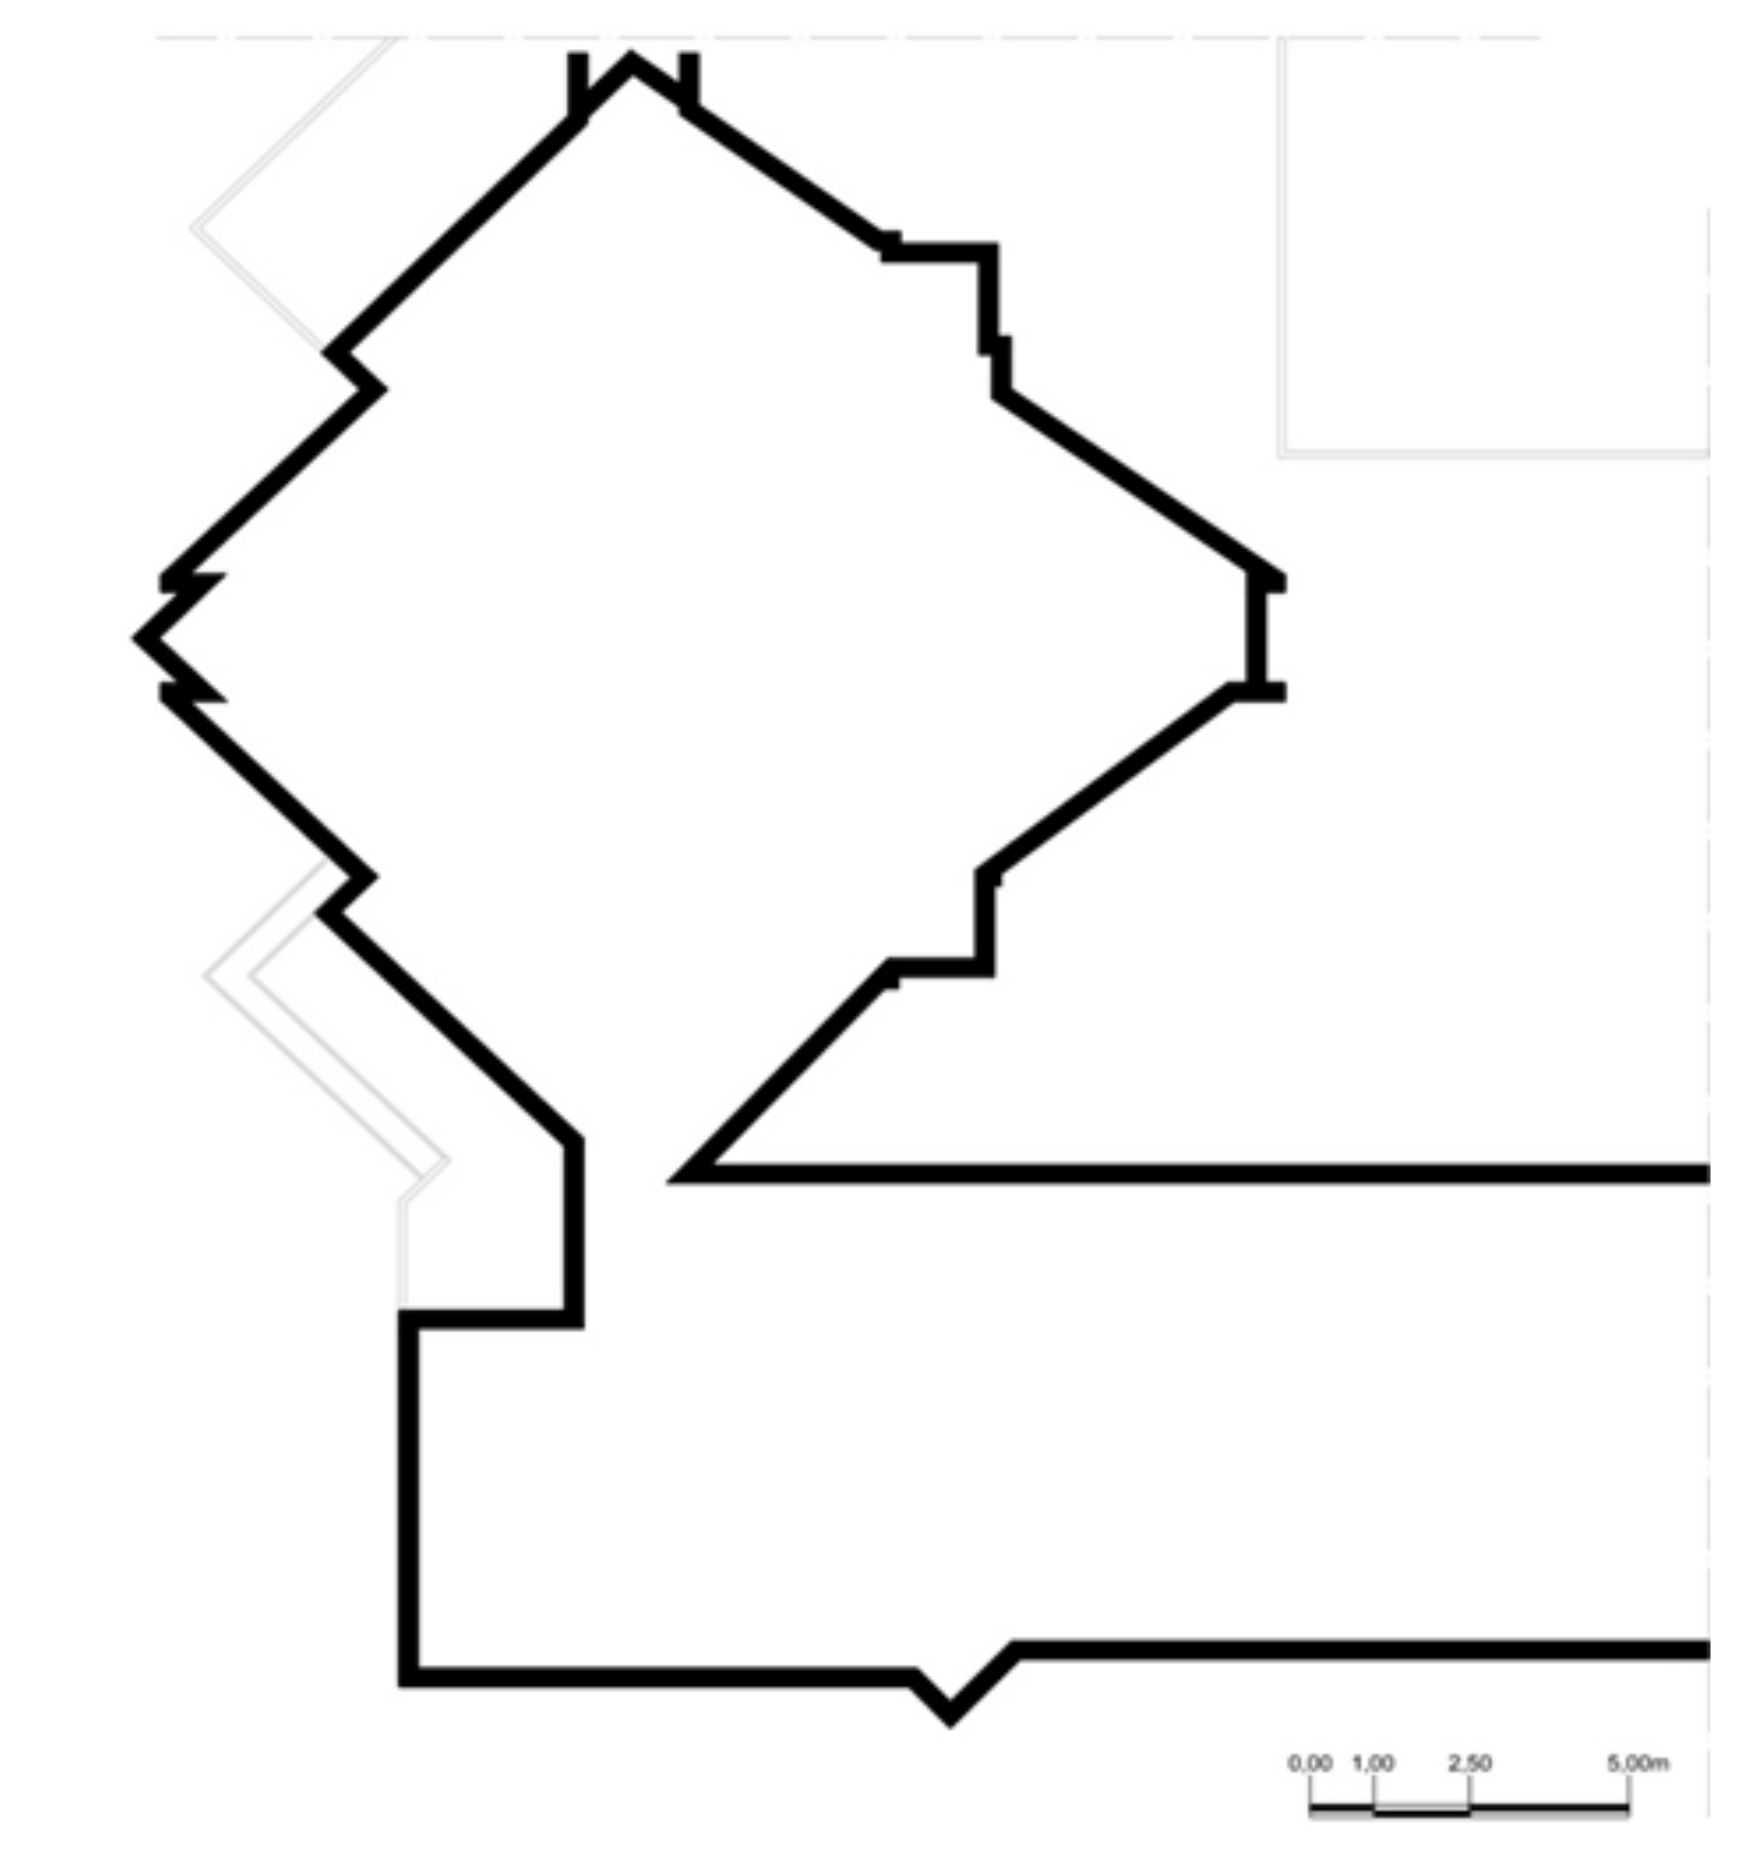
As shown in Figure 3, Figure 4 and Figure 5, at the first floor the structure completely changes its geometry. At the Basement and Raised floor it has an “L” shape with an arm equal to about 20 × 13 m and the other equal to about 12 × 12.50 m. At the First and Second floors, the structure splits into two bodies joined only to guarantee a passage in correspondence with the stairwell. One body has a rectangular shape of about 20 × 6 m and the other one shows an irregular rhomboid shape with sides equal to about 13 × 11 m.
3. Experimental Campaign
A geometrical survey was performed to acquire detailed information for the definition of a finite element model of the structure; however, the documentation regarding the design of the structure was not available, and thus it was chosen to extend the analysis by including experimental tests.
In detail, to increase the level of knowledge, a survey campaign was carried out on the structure including Pacometric and Sonreb investigations on three structural elements, the mean value of the estimated concrete cubic compressive strength is equal to 40.2 MPa which corresponds to a concrete C32/40 and at an elastic modulus equal to about 33,640 MPa. At the Basement floor, the structure consists of r.c. walls which have been modeled by means of shell elements whose mechanical properties have been assumed equal to the ones considered for the frame elements. The floors have been assumed as rigid diaphragms.
It is worth highlighting that the main uncertainties are related to the masses and to the geometrical dimensions of the horizontal structural elements, but also to the mechanical properties of the concrete, because the number of the Sonreb tests is very low and it was not possible to perform compressive tests on drilled cores [29,30,31].
In Figure 6, the FE model of the structure is shown, and the irregularities are clearly visible: the structural elements at the Basement floor are characterized by stiffness quite different from that at the higher floors. Moreover, also the two parts that compose the L-shape plan have mass and stiffness distributions rather different. The structure has fix restrains at street level.
The structure was considered subjected to the self-weights of the structural elements defined in the FE model, to structural self-weights acting on each floor equal to 3.61 kN/m2 and to a non-structural dead load equal to 3.80 kN/m2. The masonry infills have been considered as uniform dead loads acting on the beams equal to 6.00 kN/m2. The live loads have been assumed equal to 1.00 kN/m2 on the floors.
The mode shapes and natural frequencies of the FE model, obtained by assuming the masses and stiffnesses defined above, have been evaluated. The results show that, as expected by observing the masses and stiffnesses distributions, the structure has mode shapes highly influenced by the torsional behavior. In detail, the first three modes have both torsional and bending components; in particular, the first and second ones are torsional-bending mode shapes along the x axis, while the third mode is along the y axis.
As previously mentioned, some assumptions have been made to completely define the FE model, which need an extensive experimental campaign for their validation.
To overcome the difficulties related to the execution of such tests, and considering the complexity of the structure and the need of acquiring a high level of knowledge, it was decided to perform tests to evaluate the whole actual behavior of the structure and its dynamic properties in particular. The dynamic tests were performed by acquiring the vibrations induced by the environmental loads. The positioning of the accelerometers was decided to obtain several monitored points adequate to estimate the mode shapes of the examined structure. On a planimetric level, the building was simplified and divided into two polygons, and a rigid plane behavior has been imposed to each one of the polygons at each level: one has a rectangular shape and the other one has a rhomboid shape. As shown in Figure 7 the accelerometers were positioned on two opposite vertices of the two polygons, when possible (Second and Roof floor), or only on one vertex (Raised and First floor); in fact, their positioning was conditioned by the accessibility of the individual rooms where the four vertices fell. Along the vertical direction the vertices of the polygons have been chosen aligned because this position favors to identify the behavior of the structure.
The testing setup was composed by n. 28 accelerometers PCB 393B31 (sensitivity 10 V/g, frequency range 0.1 to 200 Hz), n. 11 three-channel Dynamic Signal Acquisition Module (12.8 kS/channel, 30 V, capable of measuring signals from IEPE and non-IEPE sensors), n. 3 chassis CompactDAQ 9178 and RG58 coaxial cables with impedance 50 Ω.
Each CompactDAQ 9178 chassis is connected to a modem by means of an ethernet cable and connected to the others by means of a synchronization cable. The data acquired by the control units are therefore sent via wireless connection from the model to the computer on which the data acquisition software is installed. Specifically, the data acquisition software used is National Instrument’s LabVIEW (Laboratory Virtual Instrumentation Engineering Workbench), which allows customizing the way the measurement data is acquired, displayed, and managed.
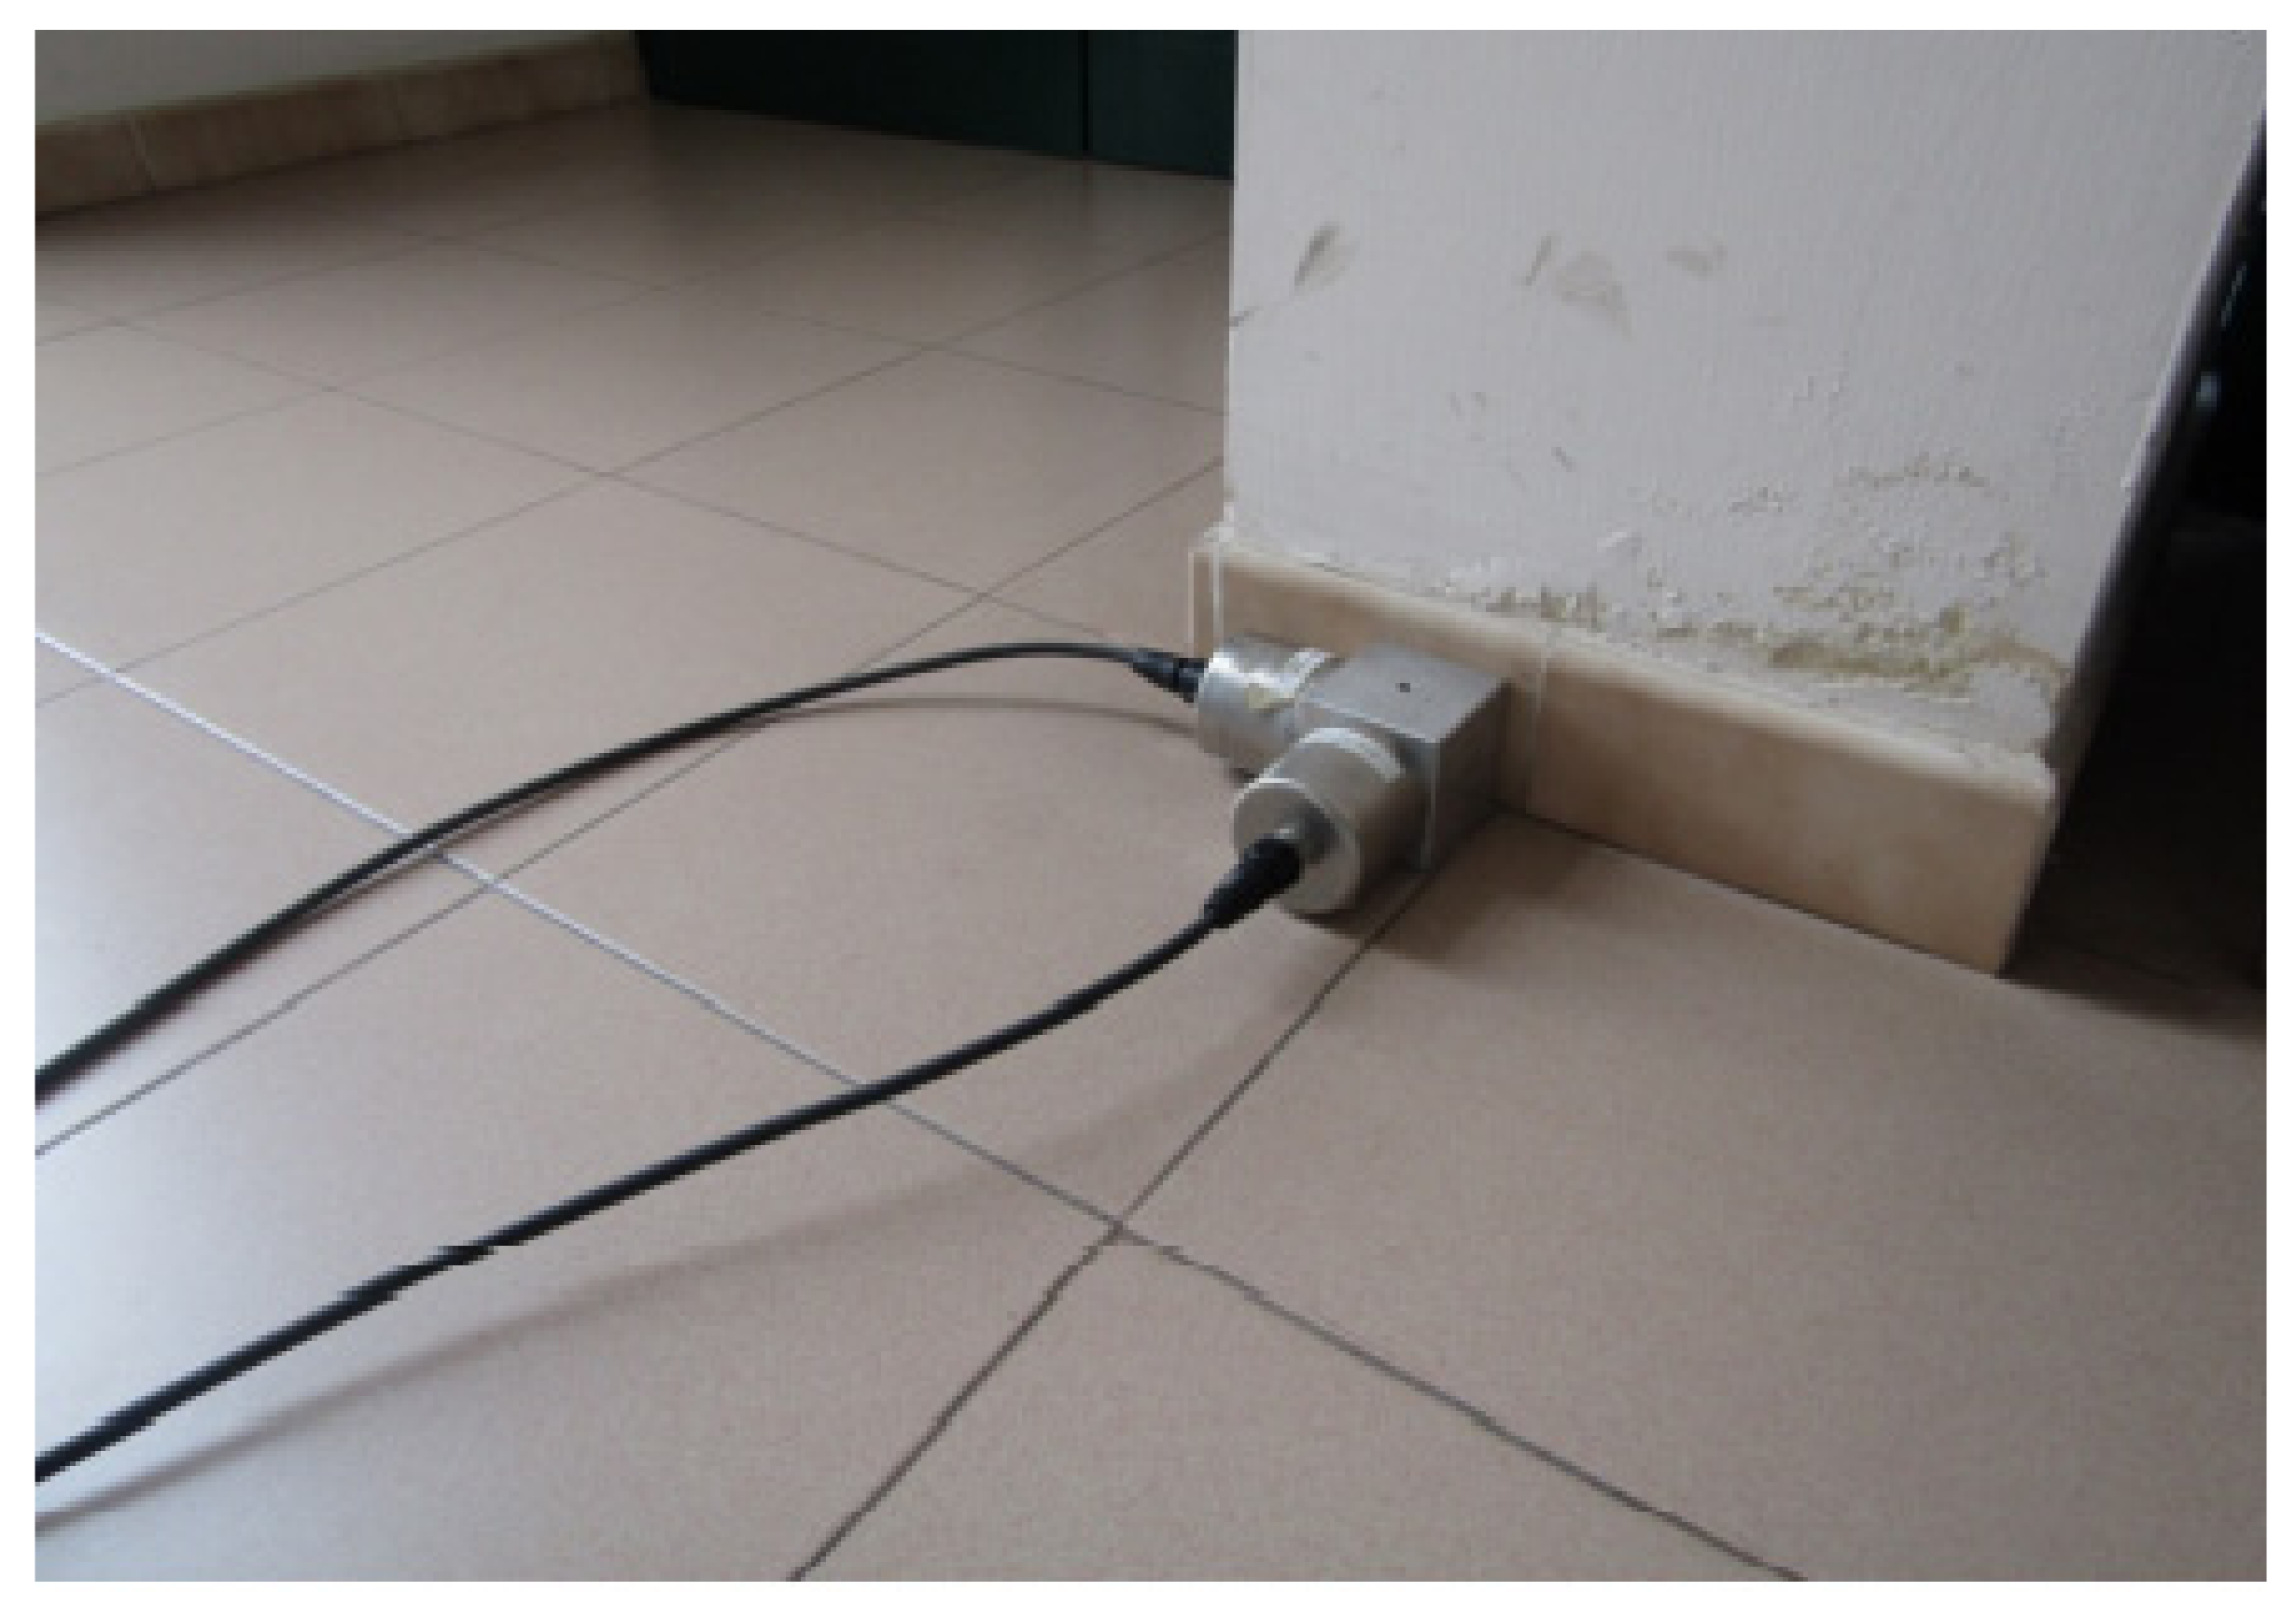
The selection of the points to be monitored was made by considering dividing the plan into the polygons characterized by rigid plan behavior, thus the sensors have been installed at the vertices of these polygons in order to be able to evaluate the displacements of each part. Each point was monitored along two orthogonal directions; thus, to assure this condition, two sensors have been installed in each point on two different faces of an aluminum cube (see Figure 8).
A total number of 14 points have been monitored subdivided as follows: three points at the Raised floor (Figure 7a) and First floor (Figure 7b), four points at the Second (Figure 7c) and Roof floor (Figure 7d).
The n. 3 CompactDAQ have been installed to acquire the signals of the accelerometers; in Figure 7 each DAQ was indicated by a different color and the sensors have been drawn by utilizing the color of the DAQ to which they are connected to.
Three different tests have been conducted, each one of about 10 min and with an acquisition frequency of 1024 Hz.
A total of 28 ICP accelerometers perfectly synchronised and perfectly aligned to the orthogonal x, y directions (horizontal xy plane) in the 14 selected measurement points have been used. The very high sampling rate available for each accelerometer (1024 Hz) was fully utilised both in the acquisition phase and in the subsequent processing phase. Considering that each test was carried out with a continuous acquisition in environmental conditions of 10 min, for each accelerometer, 614,400 samples were acquired for each test, a total of 17,203,200 acceleration data. All the acquired data were used in the identification phase for each test. The acquisition system has already been widely used previously by the authors for the dynamic monitoring of structures as follows: a preliminary calibration phase was performed in the laboratory and a subsequent phase in situ provided the choice of the measurement points and the arrangement of the accelerometers which are screwed onto blocks, suitably made to maintain the orthogonality of the measurements and, in turn, connected with specific glues to the points of the structure; all these operations are widely described in previous experiences and carried out with standard methods that do not require further investigation.
4. Identification Results and Up-Dating Procedure
4.1. Structural Dynamic Identification
The acquired vibrations have been analyzed by means of ARTeMIS software [23], and thus a geometrical model has been defined introducing the directions of acquisition of the 28 installed sensors, which are reported as arrows in Figure 9 where the xyz reference system, the same of the FE model, is also indicated.
The vibrations have been analyzed by Stochastic Subspace Identification (SSI-UPC), and, considering the particularly complex shape of the building, a high number of projection channels has been considered. Figure 9 shows the channels used for the identification of the two sub-structures; in particular, the 12 reference channels are colored in magenta. Moreover, to have a confirmation of the experimental identification, also the CFDD identification method, which operates in the domain frequency, has been used for checking the detection of the frequencies identified by SSI-UPC. Figure 10 shows the results of the SSI-UPC analysis performed on the data acquired during Test 1.
The dynamic identification was carried out considering all the acquired data, with a sampling frequency of 1024 Hz. The final analysis, which led to the identification here presented, was carried out in the interval [0–12.8] Hz. The robustness of the identification was ascertained both by verifying the results obtained by means of various identification techniques and modifying some parameters which must be chosen during the numerical elaboration of the recoded data. For the sake of simplicity, four channels were considered in the identification shown in Figure 10, but the same results were obtained considering a greater number of channels. Furthermore, a resolution of 4096 was considered and the order was set to its maximum value equal to 100 for the SSI decomposition in the diagram shown in Figure 10. However, numerous tests were carried out even for these parameters by varying them in reasonable intervals and obtaining the same results. Finally, further proof of the goodness of the identification is ensured by the extreme repeatability of the results in different tests conducted on the structure. In addition to the three tests (Test 1, Test 2 and Test 3) reported in the present work, other experimental tests were carried out giving the same results and, for sake of brevity, not reported in this article.
The identification results of the first three frequencies identified with both the identification methods and for all the three different tests, named Test 1, Test 2 and Test 3, are reported in Table 2.
To complete the estimation of the modal parameters, also the damping corresponding to the identified frequencies have been inserted in Table 2.
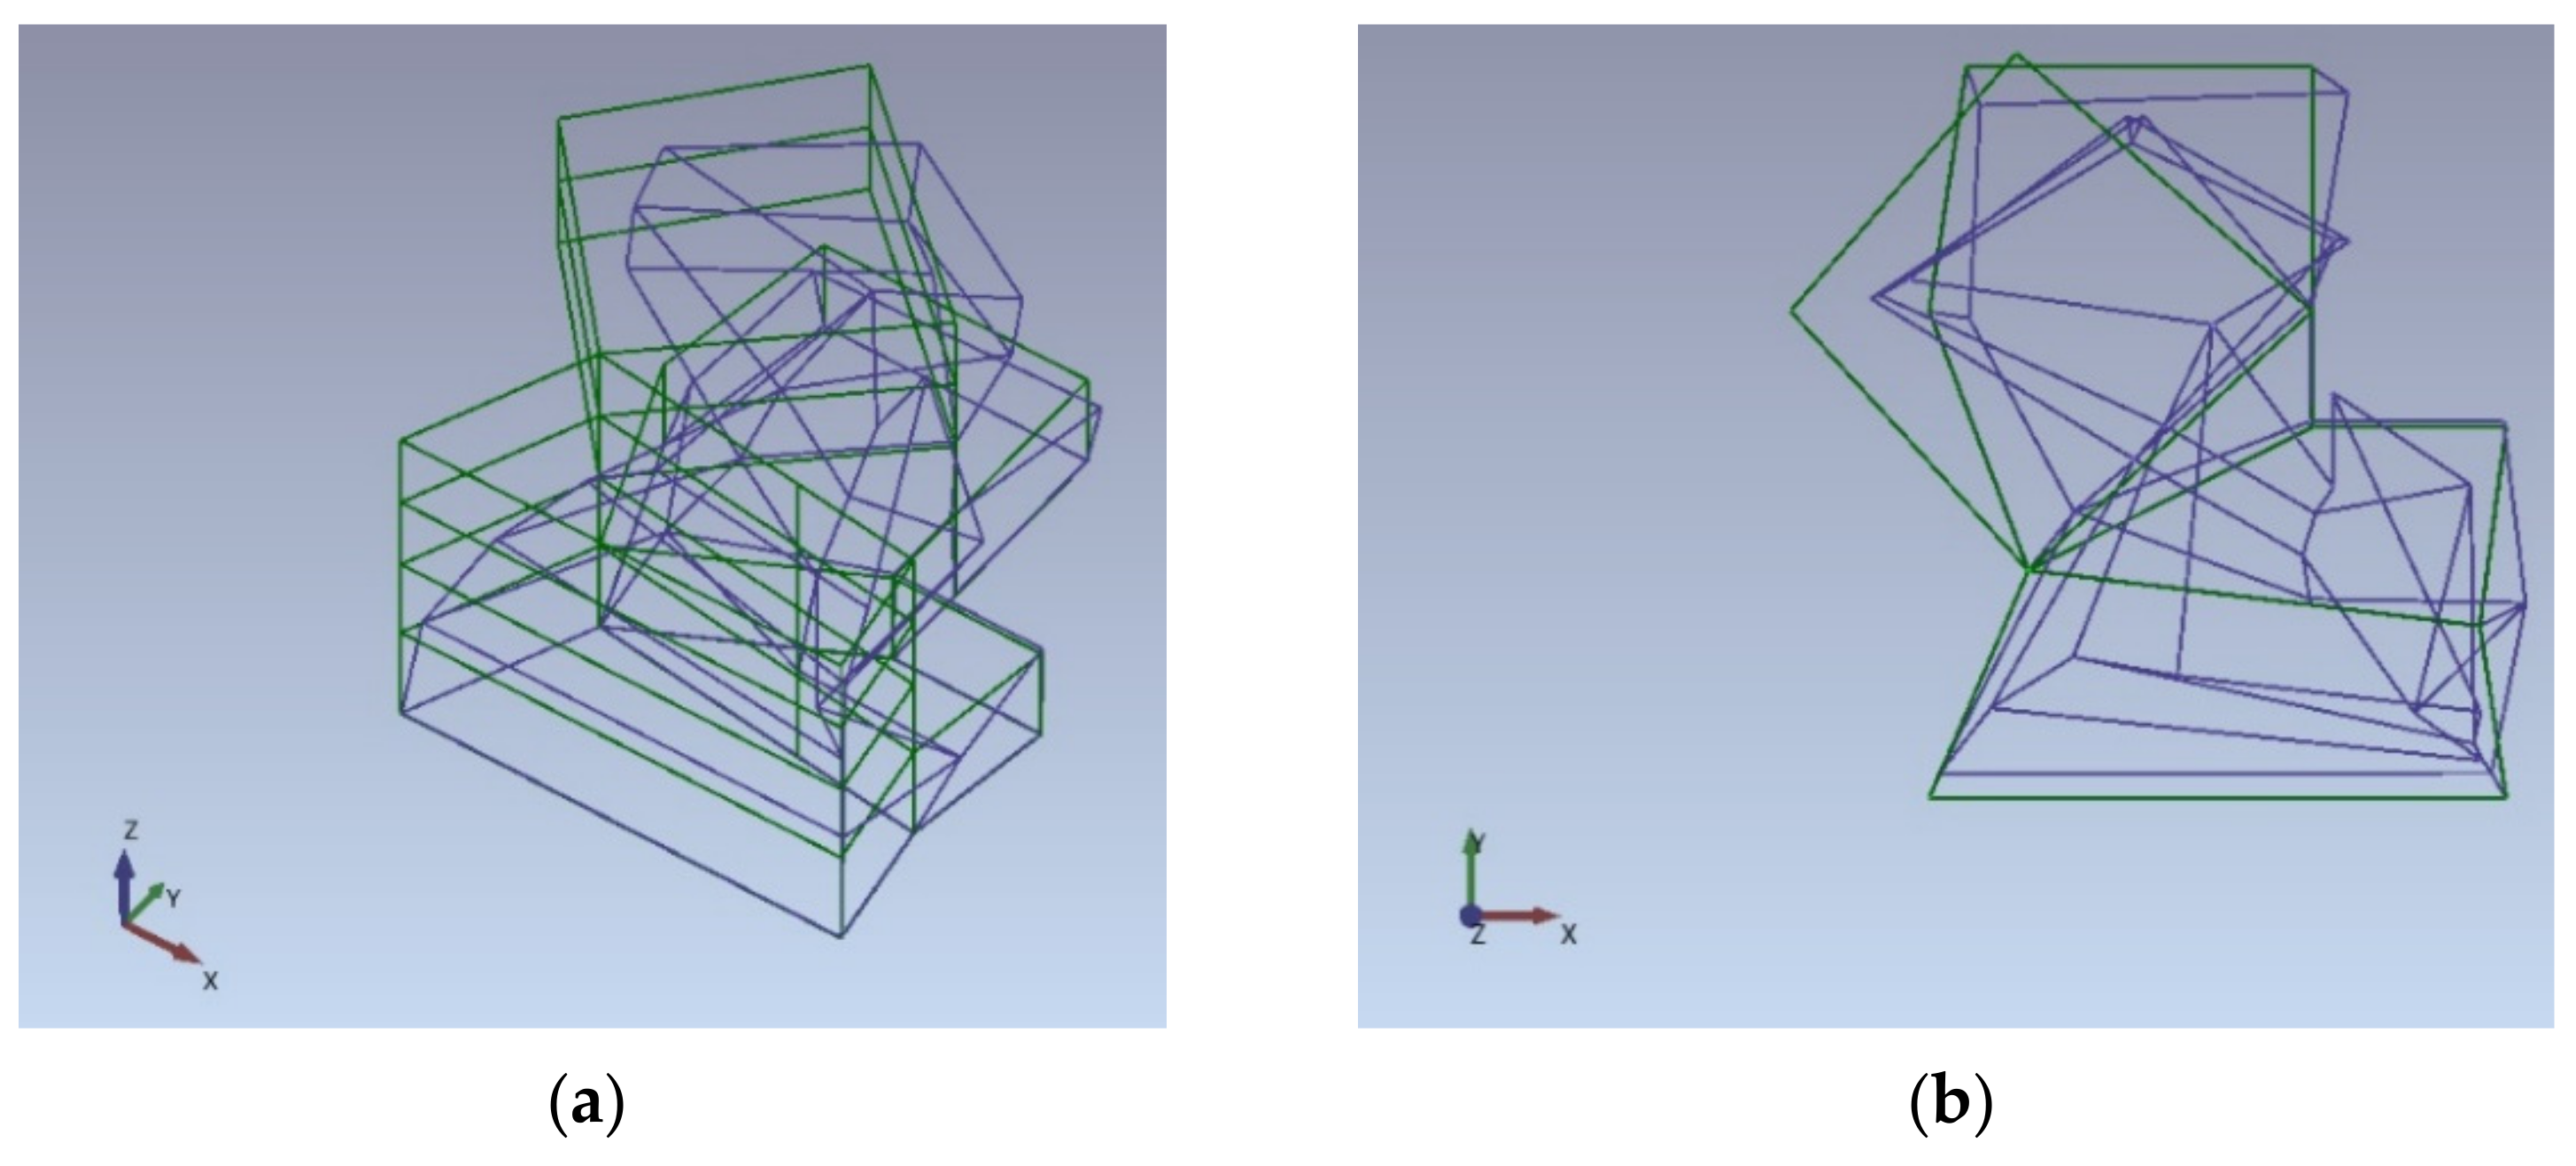
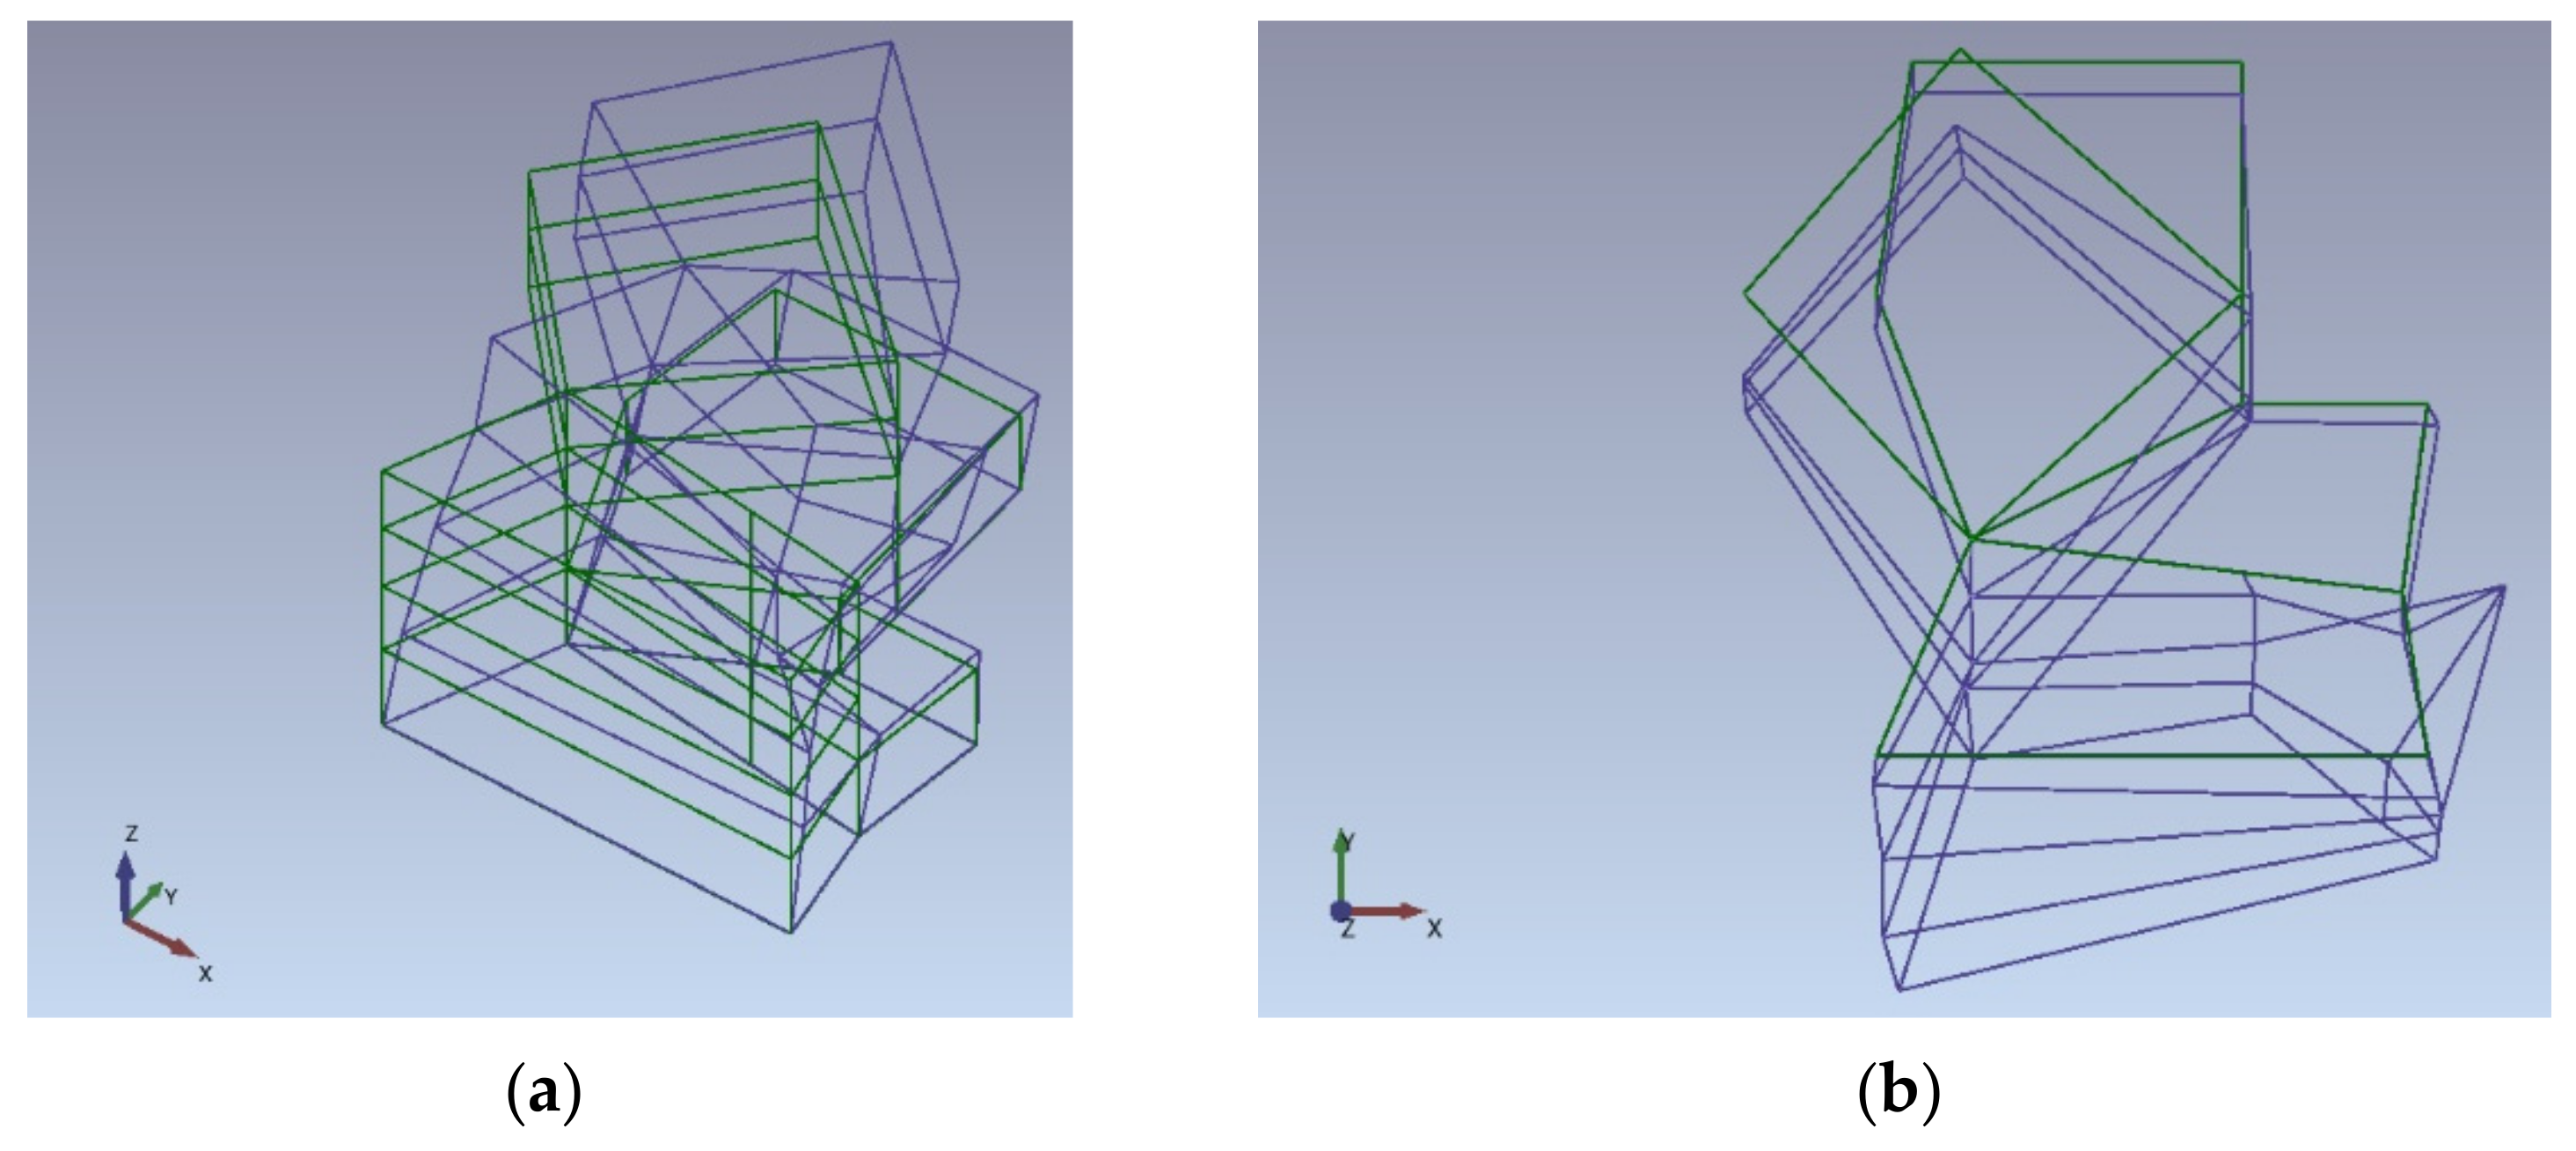
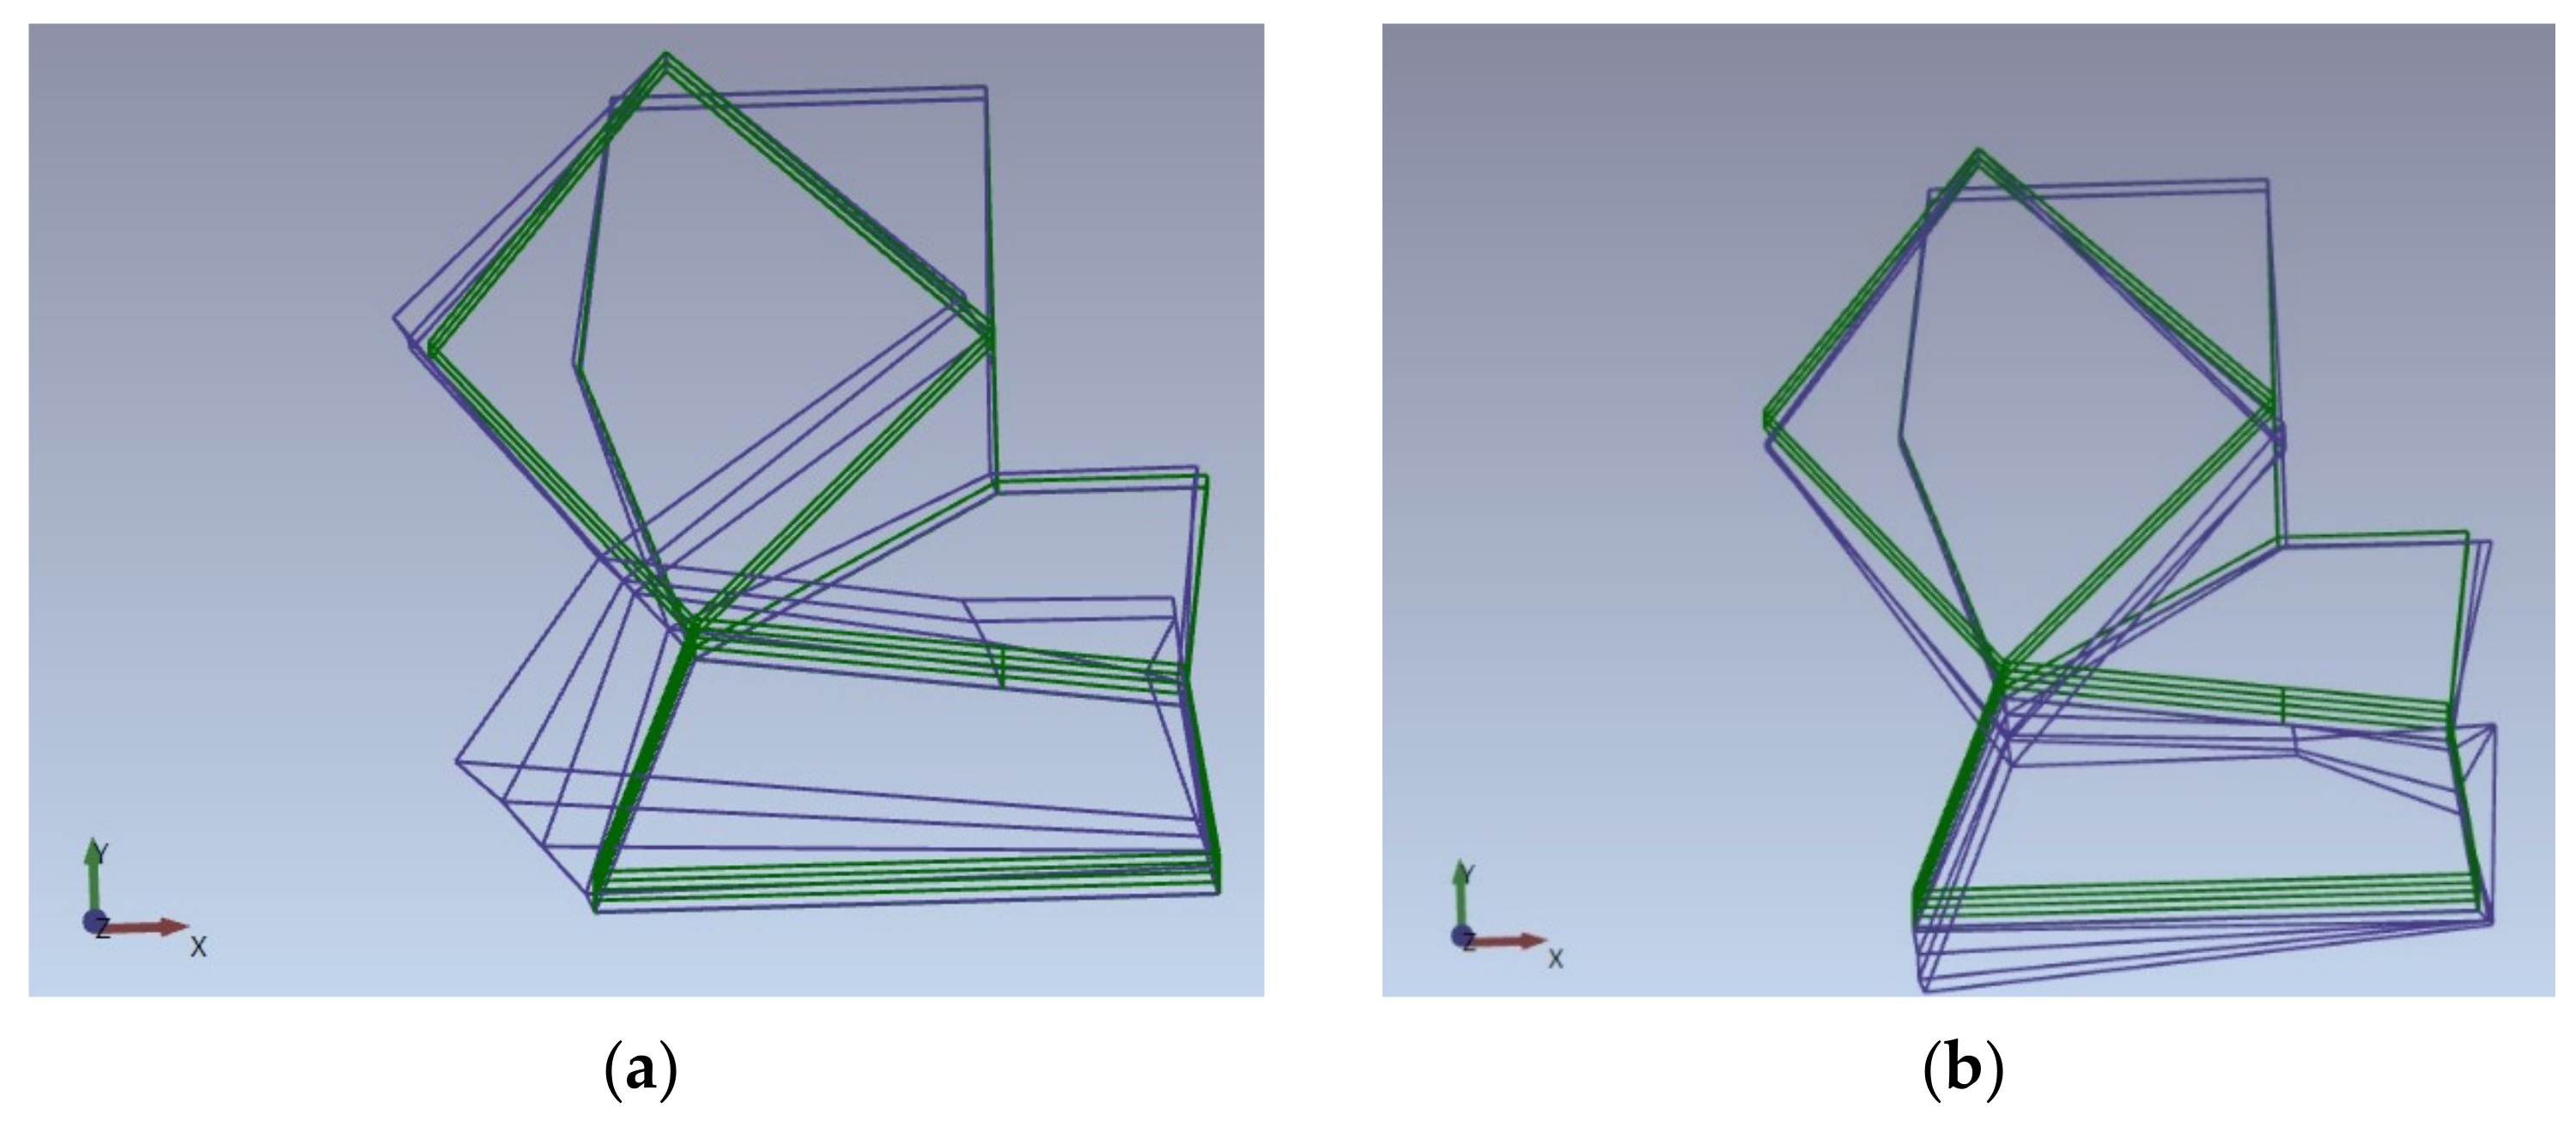
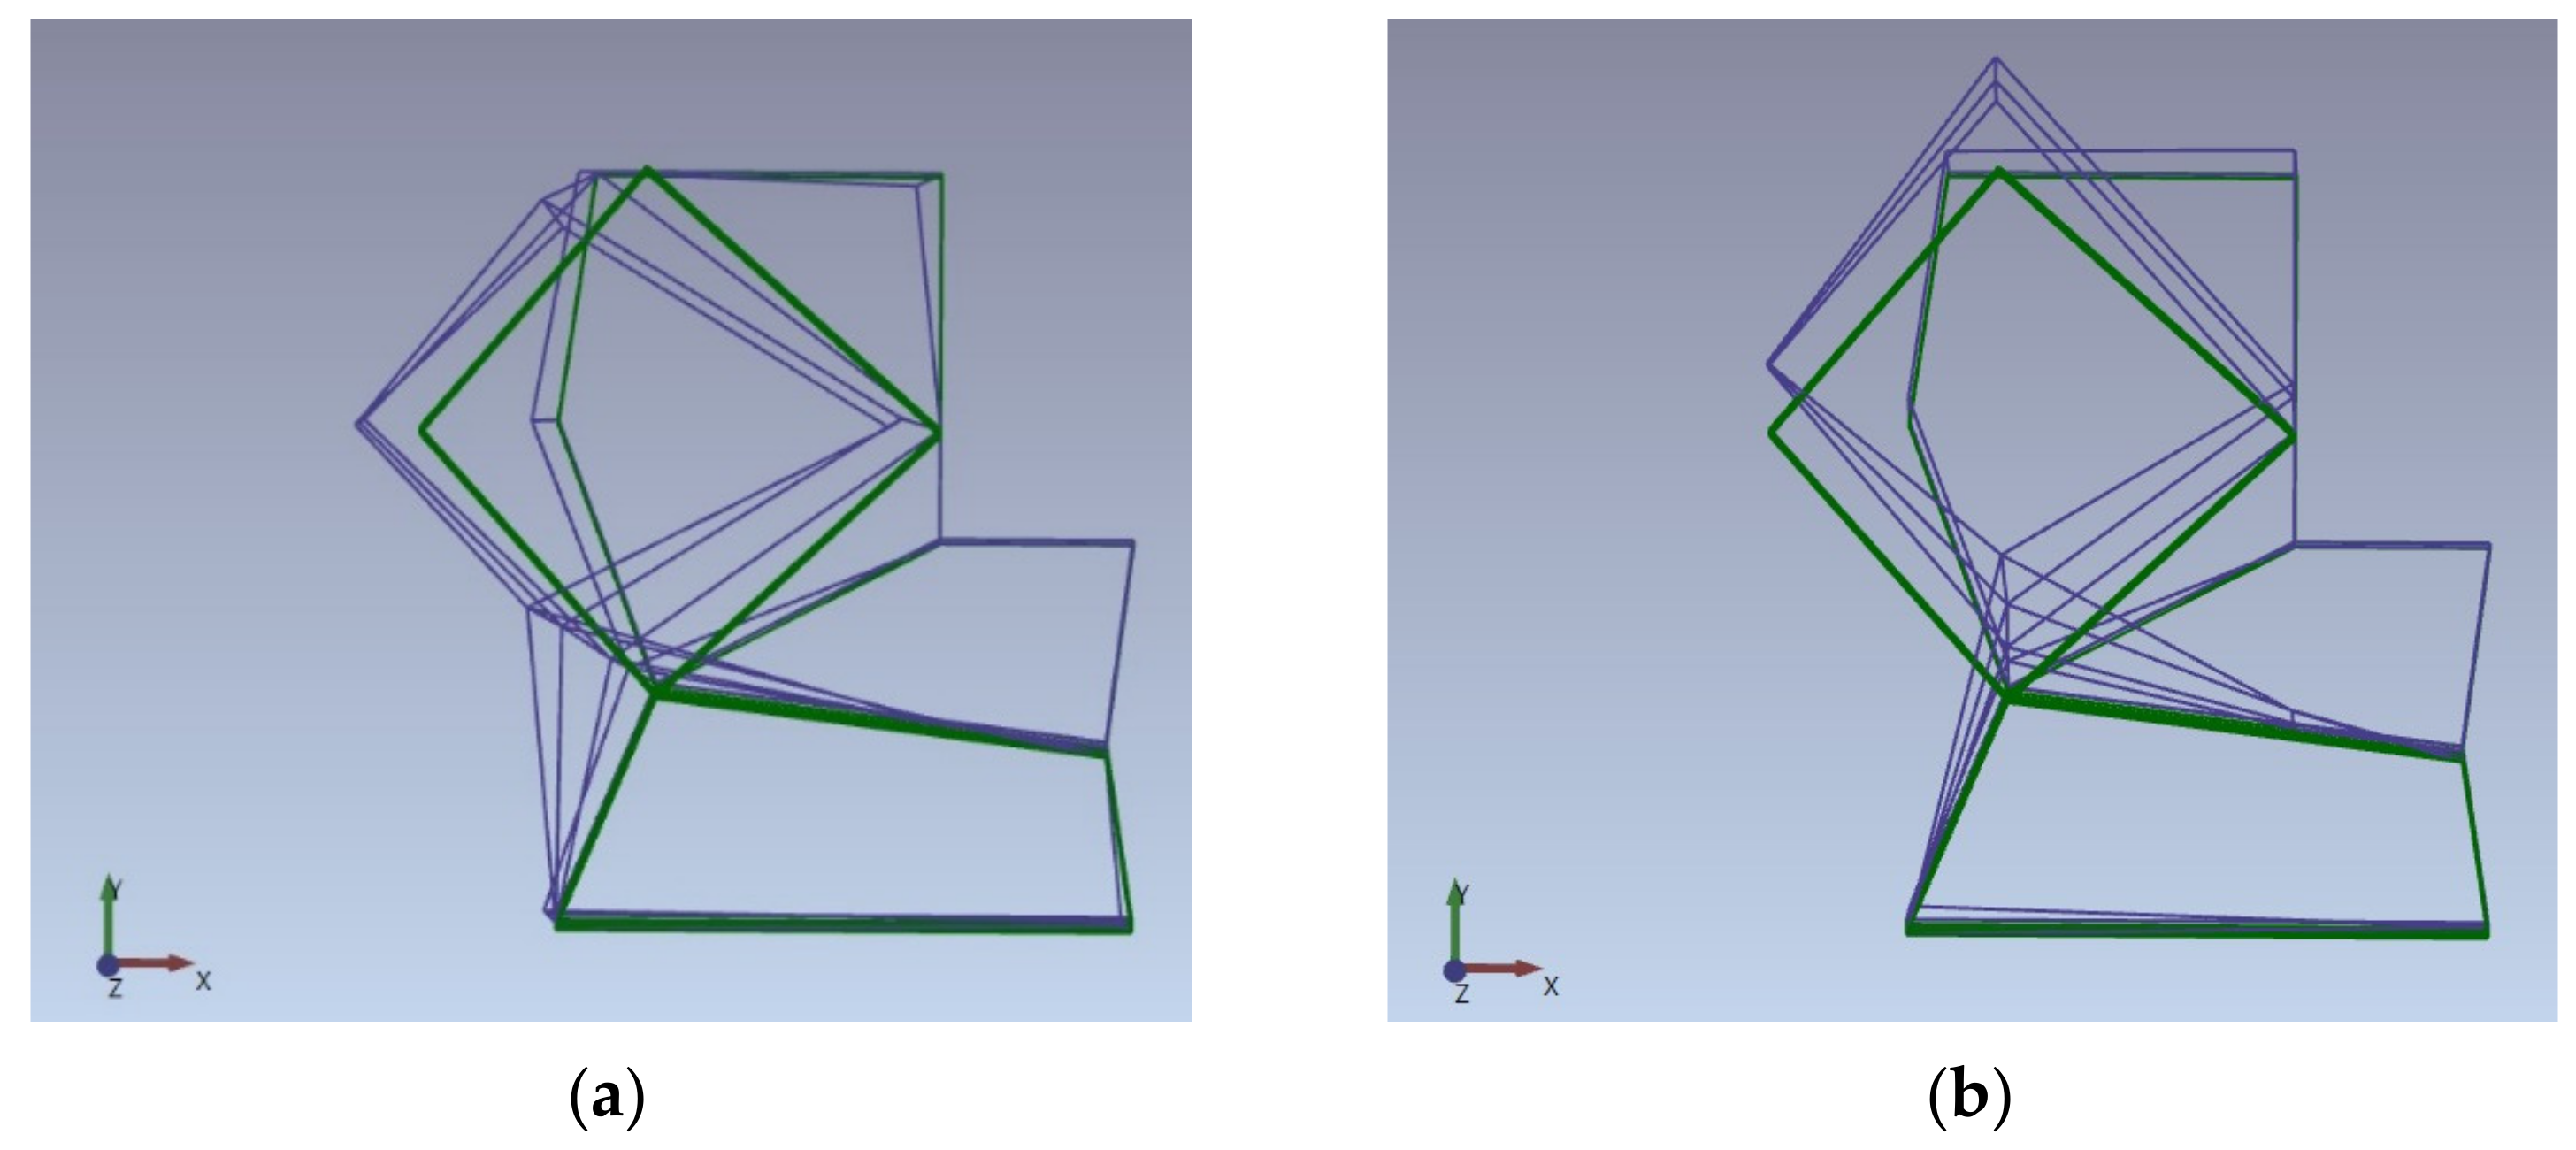
The mode shapes have been evaluated: the experimental identification results principally show that the first detected modes do not, in any case, have a purely flexural behavior (first or second flexural along x or y). The modes relating to the first frequencies all have a flexural-torsional behavior with an evident torsional component, due to the particularity of the analyzed structure, constituted by two main asymmetrical bodies, as widely described above. Figure 11 shows the first mode characterized by a torsional component and a bending component along the x axis, Figure 12 plots the second mode characterized by a torsional component and a bending component along the x axis, and Figure 13 shows the third mode characterized by a torsional component and a bending component along the y axis.
It is worth noting that the results show a quite high repetitiveness of the frequency values and that the complexity and irregularities of the structure need a high number of sensors to accurately identify the mode shapes. The chosen position for the accelerometers corresponds to the opposite vertices of the polygons, the rectangle, and the rhombus, for each floor. In fact, it was not possible to insert the sensors as described in all the building corners on each floor, due to the impossibility of accessing to some rooms.
Several setup configurations have been analyzed by excluding in the identification procedure some sensors and evaluating the frequency values and the mode shapes. In Table 3, the frequency values of first three modes estimated for the effective setup configuration and those established by excluding some sensors are summarized. In detail, Test 1.a has been performed by excluding the sensors installed in nodes 46, 38, 30 and 22 (see Figure 12) and, Test 1.b by excluding the sensors installed in nodes 14, 25, 33, 31, 23, 39 and 41. It has been verified that the ‘limited’ configurations also allow for the identification of the first frequencies, unless if it has been necessary to reduce the number of reference channels to four.
The experimental results obtained for the installed sensors are considered for the updating procedure of the FE model, to obtain an accurate numerical model for the vulnerability evaluation.
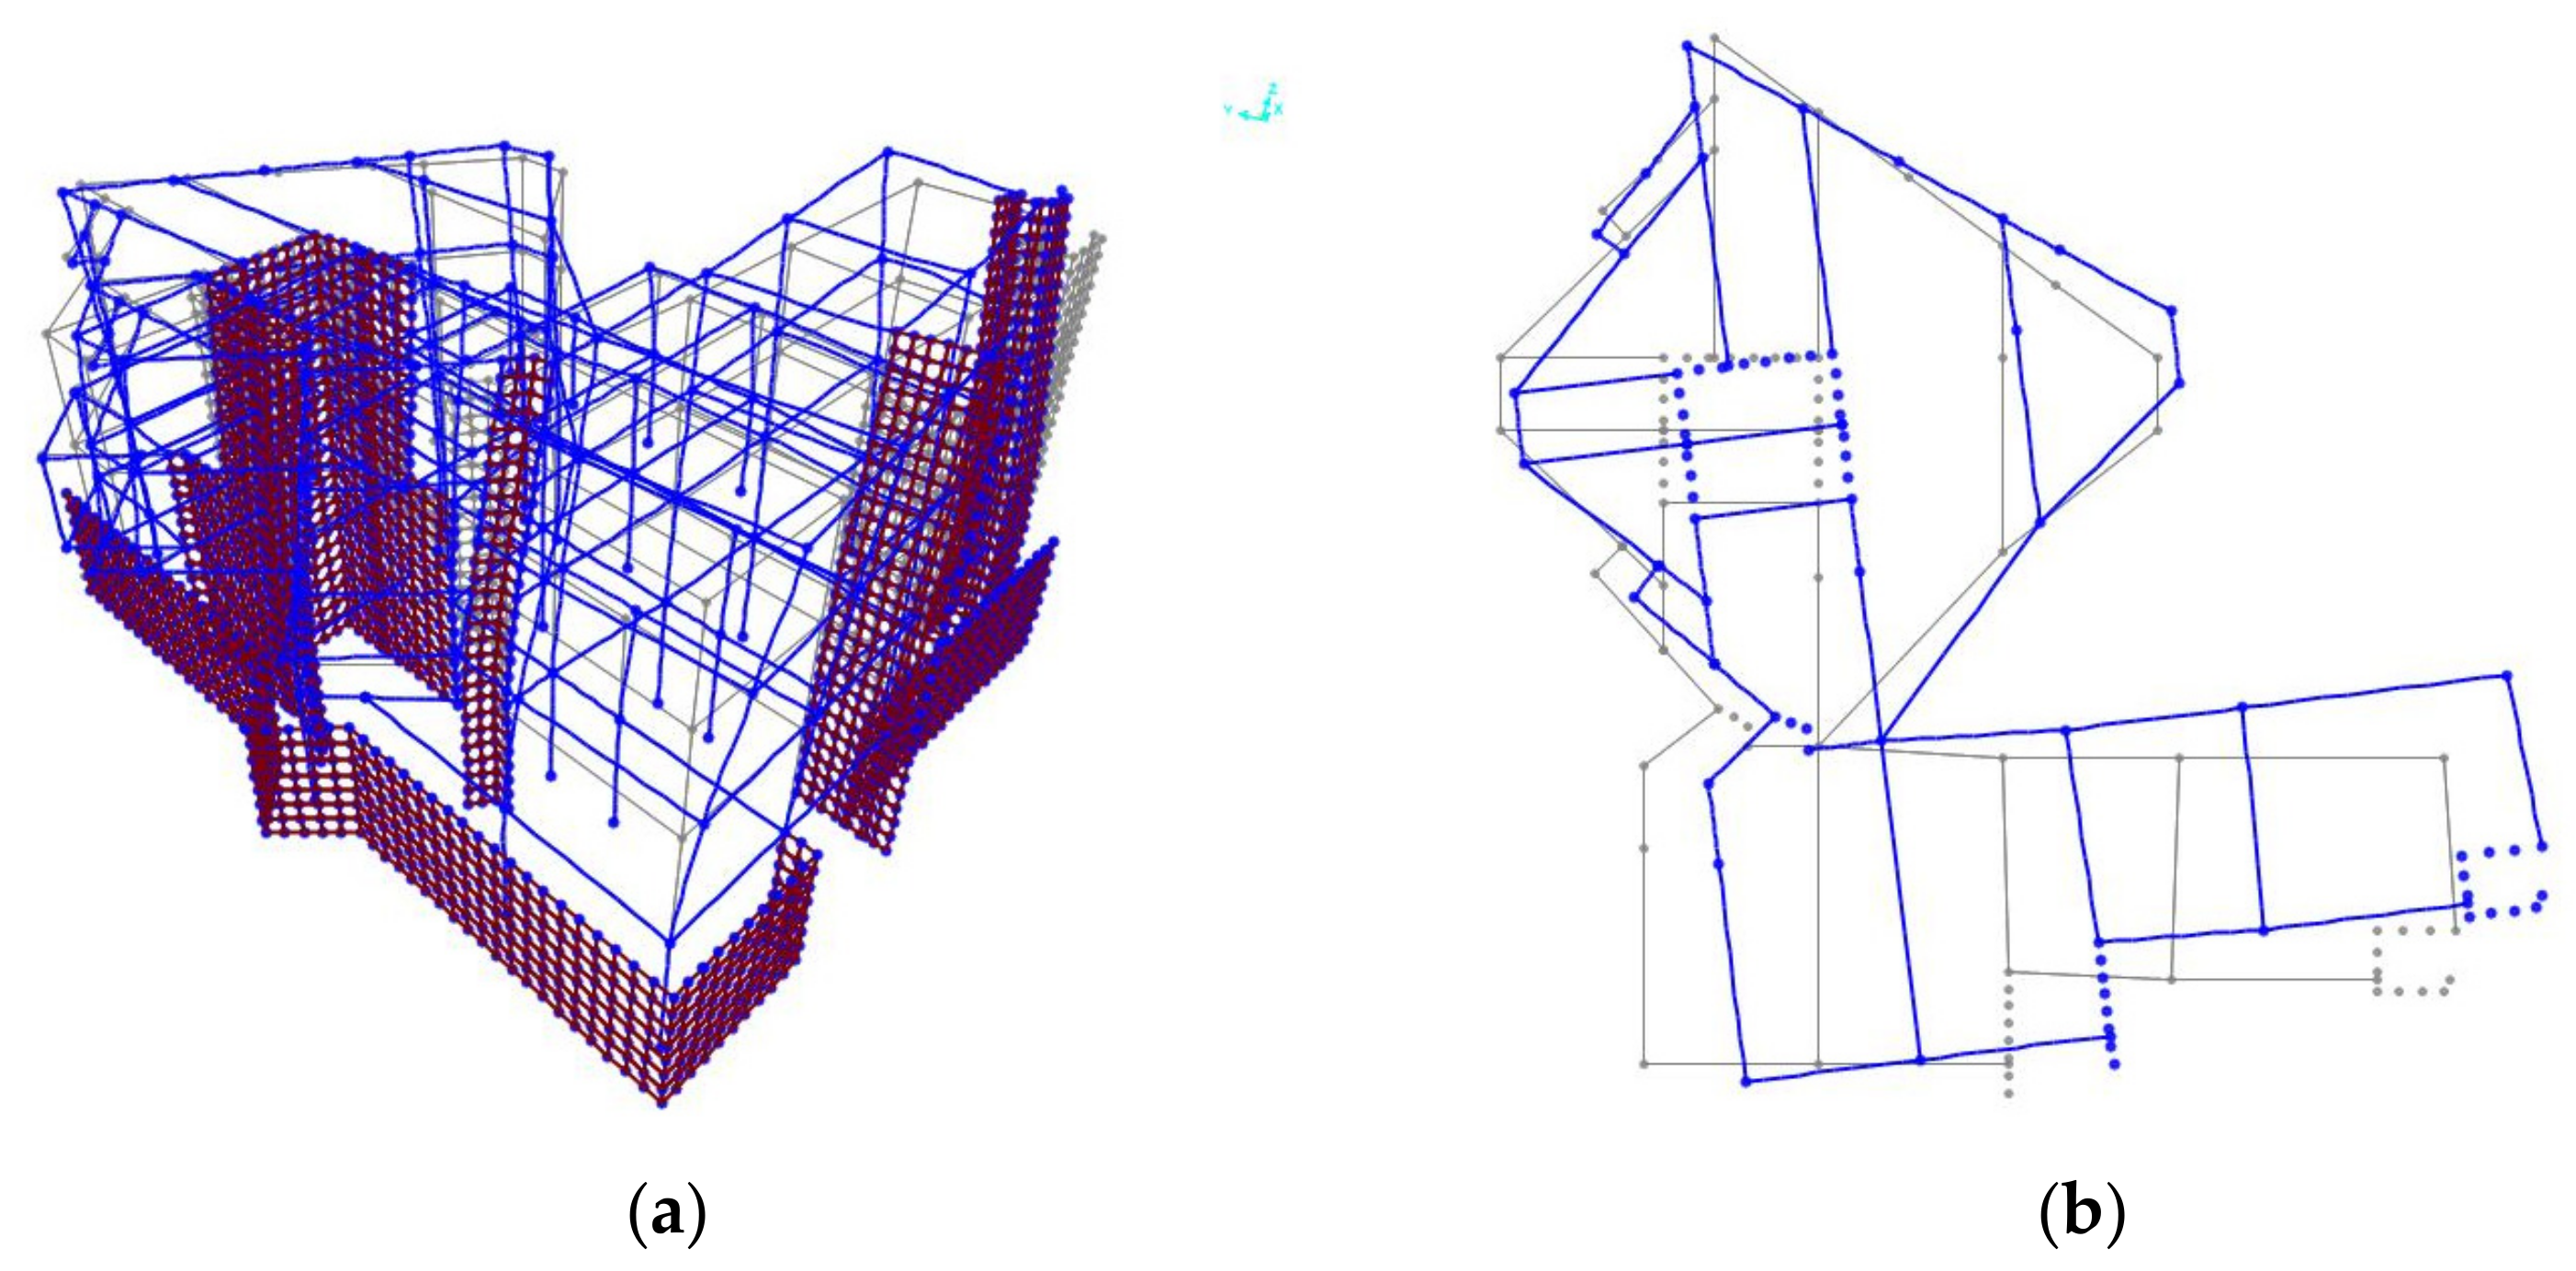
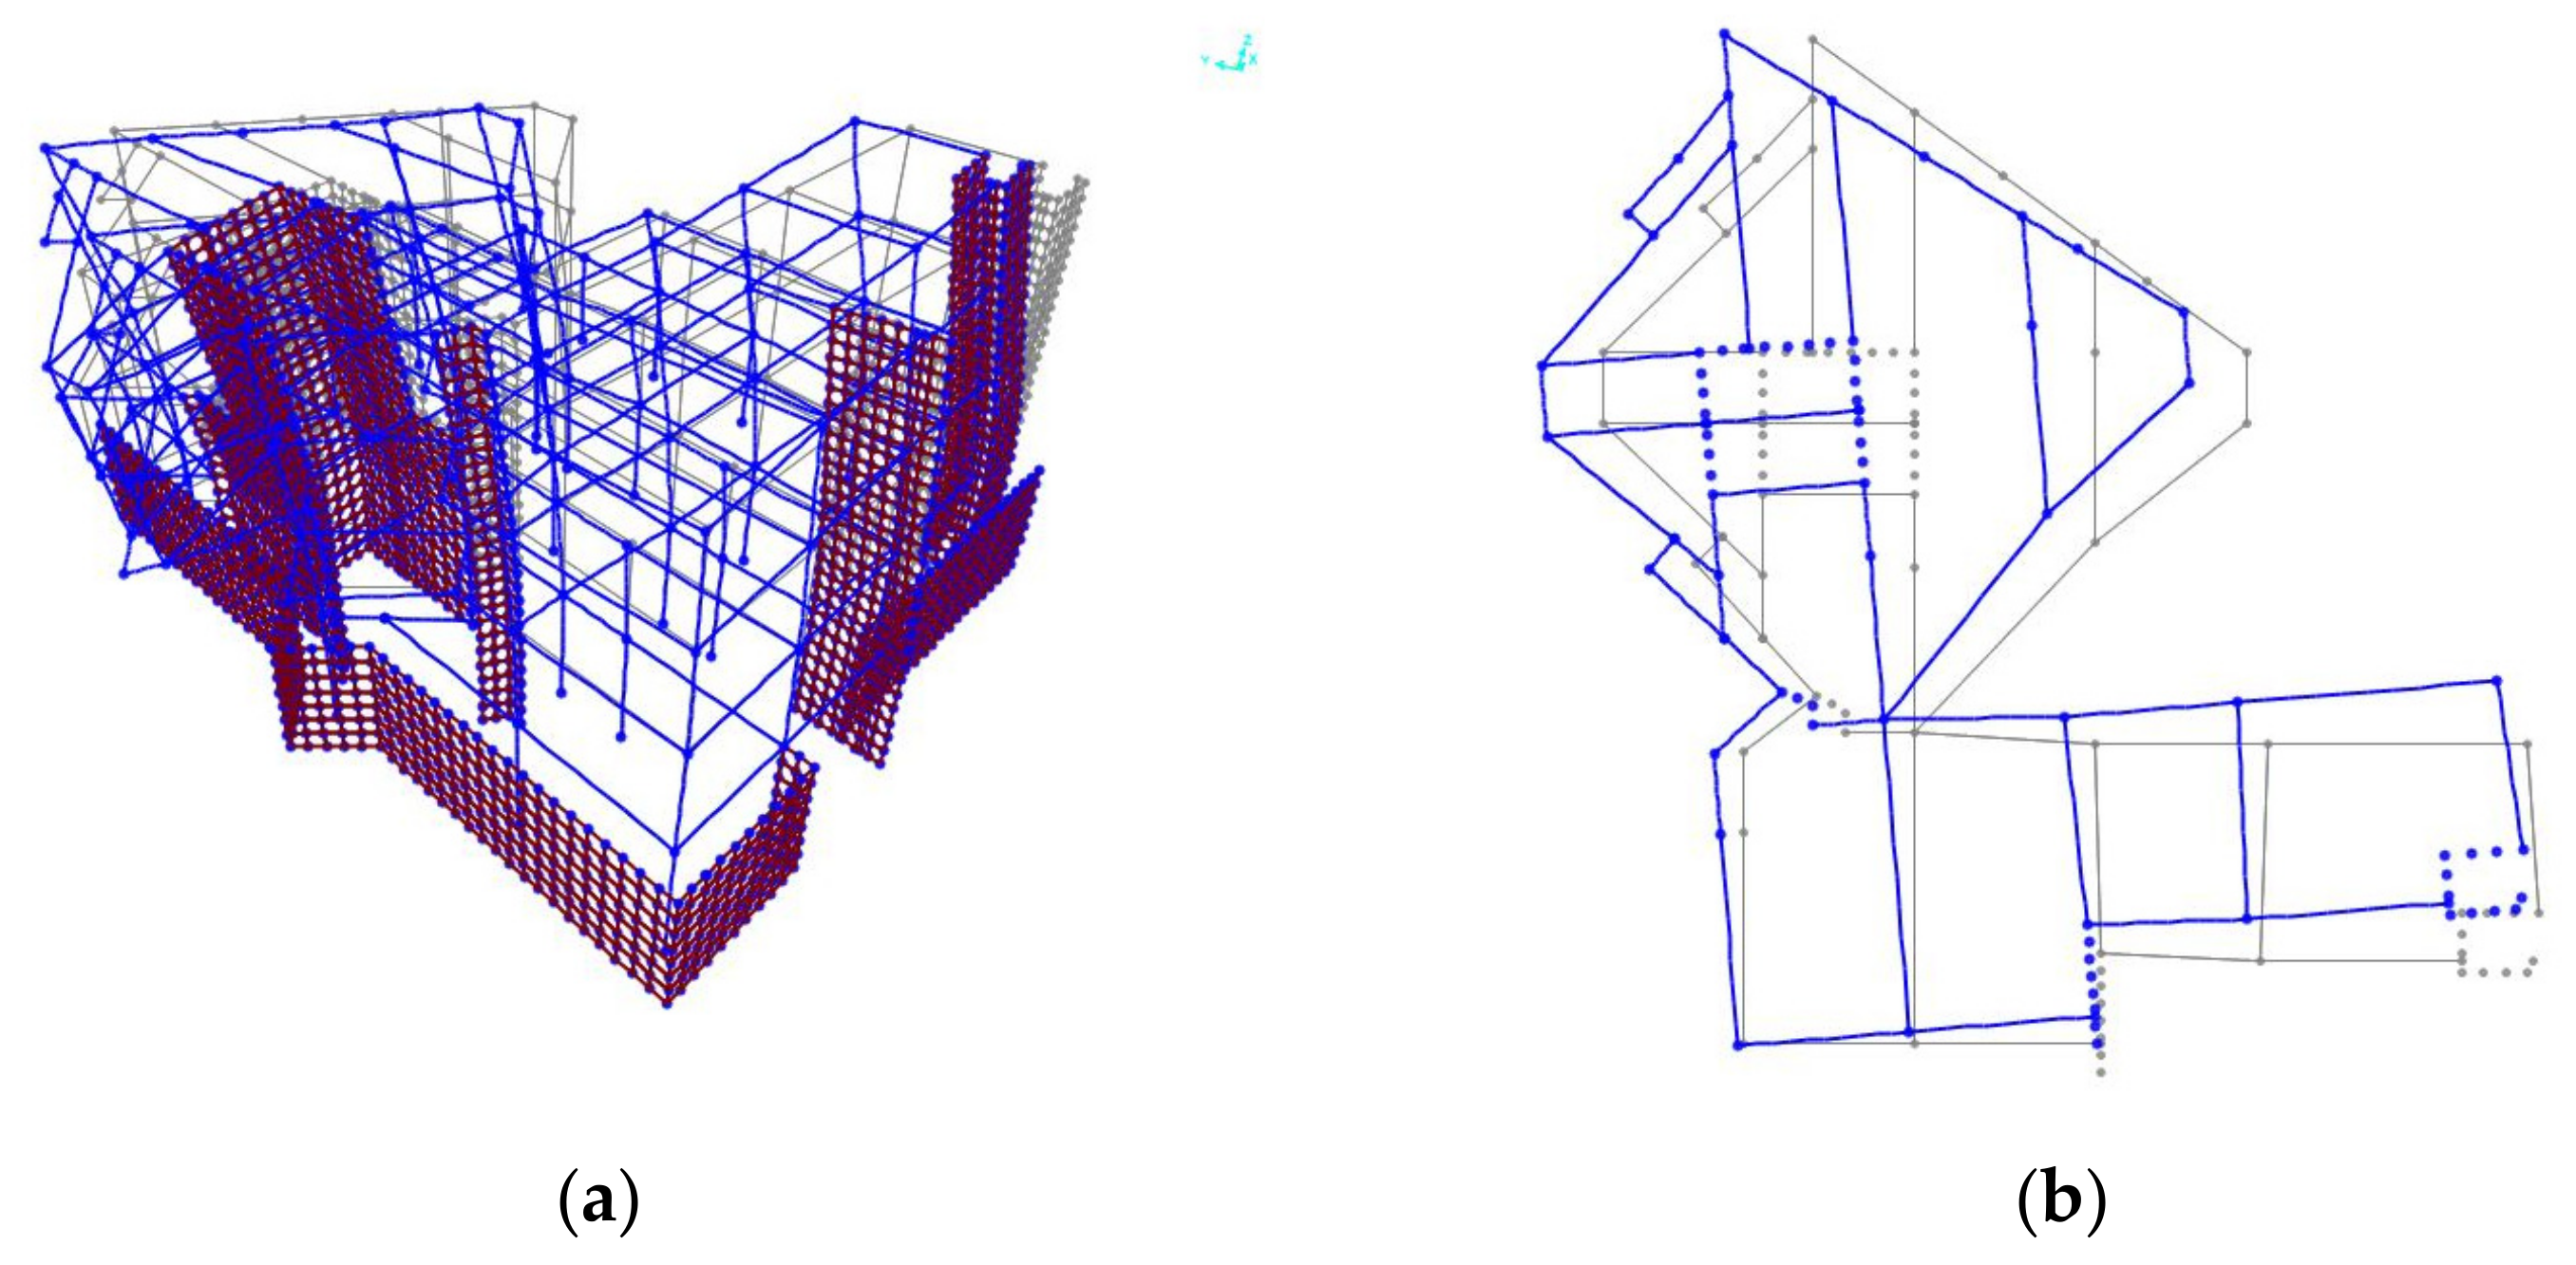
The experimental acquisitions have been analyzed by means of OMA method by decreasing the number of considered sensors, with the final aim of verifying how the number and location of sensors may influence the identification process for this complex and irregular structure. Thus, three different setups of sensors have been examined; the results show that a reduction in sensors does not significantly influence the identified frequency values, which manifest very low percentage variations; however, the most significant modification is recorded on the modal shapes. Indeed, the identified modal shapes change by considering a reduced number of accelerometers, and this reduction does not permit us to identify with certainty the shape typology, and thus the comparison with the dynamic FE model behavior worsens. In particular, the identified mode shapes related to the Test 1.a (analysis without the sensors placed at nodes 46, 38, 30, 22, as indicated in Figure 9) lose the torsional component for the third mode (torsional-bending along the y axis), and also for the second one (torsional-bending along the x axis) that may be easily exchanged as purely bending modes, making very difficult the comparison with the model that, on the contrary, shows clearly the torsional effects. Additionally, the identified mode shapes related to the Test 1.b (analysis without the sensors placed at nodes 41, 33, 25, 14, 39, 31, 23) lose their torsional characteristics, especially for the second and third. In order to show the important difference between the modes identified with all the accelerometers (shown in Figure 13), in Figure 14 and Figure 15, the second and third mode identified without sensors as indicated for Test 1.a and Test 1.b, respectively. The identification results clearly show that with a reduced configuration of accelerometers, probably due to the complexity of the building, it is not possible to determine the typology of the modal forms that may appear (see Figure 14 and Figure 15 for the second and third modes) only bending modes, losing the torsional characteristic that was, instead, evident and clear with the original configuration of accelerometers.
4.2. Optimization Updating Procedure
The FE model has been updated to match the experimental results; the adopted criterion is to minimize the errors of the frequency values of the first three modes. The main uncertainties are related to the masses and the stiffnesses. Two different updating procedures have been conducted on the finite element model of the structure. In the first model, the masonry infills have been modelled only by inserting their contribution on the seismic mass acting on the beams of the r.c. frame. In the second model, starting from the same assumptions on the involved masses, the updating was firstly conducted by inserting diagonal strut in the positions of the infill walls.
In the model without the infills (Figure 6), due to the particular condition which was conducted during an out-of-service period of the structure, an accurate evaluation of the masses was possible, and the uncertainties were expected to be of low amplitude; in addition, a not significant influence of such uncertainties was reasonably expected on the natural frequency values. Thus, on the first model, the updating procedure was performed by changing the elastic modulus of the concrete to match the experimental frequency results. In this way the concrete elastic modulus was set equal to 38,640 MPa.
In the second model, starting from the same assumptions on the involved masses, the updating procedure was firstly conducted by inserting diagonal struts in the positions of the infills whose properties have been established according to [32]. In particular, the gross cross-sectional area of the equivalent diagonal strut was defined starting assuming a depth equal to the real size of the infill walls, while the other dimension of the transversal section was established according to [32], whereas the elastic modulus E adopted for the equivalent strut is that of the masonry itself equal to 2.9 MPa. The diagonal strut was not inserted only in the windowed walls. Thus, the updating strategy was to modify the elastic modulus of the concrete, which at the end of the updating was set equal to 33,640 MPa, i.e., a reduction of 13% of such value. It is worth noting that this new value is close to the survey campaign values
The first three modes are equal to 4.94 Hz, 7.67 Hz and 8.44 Hz. Following the plots of the first three mode shapes are reported in Figure 16, Figure 17 and Figure 18.
The second FE model has been improved considering including the infill walls into the model as shown in Figure 19. This has allowed us to consider the contribution of the masonry infill walls as regards the stiffness and not only the mass as in the first FE model.
The infill walls were modelled as diagonal strut with axial stiffness only and their properties have been established according to [32]. In particular, the gross cross-sectional area of the equivalent diagonal strut was defined starting to the real size of the infill walls, whereas the elastic modulus E adopted for the equivalent strut is that of the masonry itself equal to 2.9 MPa. The diagonal strut was not inserted only in the windowed walls.
The updating strategy was to modify the r.c. elastic modulus E of the concrete starting from the same assumptions of the first model for the involved masses. The final r.c. elastic modulus was set equal to 33,640 MPa, i.e., a reduction of 13% of such a value from the first FE model. It is worth noting that this new value is close to the survey campaign values.
Table 4 shows the results of the two FE models and the comparison with these frequencies with the ARTeMIS values; it highlights the influence of masonry infill walls. The mode shapes do not change between the FE models with and without the infill walls.
5. Discussion
The ARTeMIS and the second FE models report concordant results for the identified first three modes which occur at almost coincident frequencies and have comparable modal shapes. Therefore, it can be assumed that the 3D FE model has reached a good approximation after the second updating phase and the importance of the insertion of the infill and the relative increase in the stiffness of the model.
Due to the irregularity of the structure in plan and elevation, the participating masses and the variation of the center of masses at each level is identified for each FE model in Table 5 and Table 6, in order to evaluate how these geometric irregularities affect the building dynamic behavior, as indicated in [33,34].
In Table 5, the constant presence of a torsional component is highlighted for all the first three natural frequencies of the structure; this component is almost certainly due to the structural irregularity.
Table 6 demonstrates that, as previously indicated, the mass between the two FE models does not vary having almost coincident centers of mass, as can be seen from the comparison of the coordinates.
6. Conclusions
This research has the goal of identifying the structural behavior of the “Municipal Headquarters” of Palagianello Town, a building with a strategic importance. The case study gives us the opportunity to discuss the importance of a correct design of the test setup in the presence of in-plan and in-elevation structural irregularities. The dynamic identification was made considering the structure subjected only to environmental actions and through the installation with “classical” distributions of highly sensitive sensors; so, the latter collected accelerations data during ordinary service conditions. The advantages of the OMA technique are the precision of the results and the possibility to collect the vibration data when the structure is under its operating conditions; so, there is no activity interruption during the monitoring phases in the structure. The latter highly facilitate the monitoring and the determination of the dynamic characteristics and the vulnerability of the “strategic” buildings.
The present paper investigates and analyses two questions:
- The variation of the identified frequency values by assuming two different configurations of the installed sensors;
- The efficacy of the FE model to match the experimental results by including diagonal strut connected at the intersection points of the r.c. frame.
The experimental acquisitions have been analyzed by means of OMA method by changing the number of considered sensors, with the final aim of verify how the number and location of sensors may influence the identification process. Thus, three different setups of sensors have been examined, and the results show that a reduction in sensors does not influence significantly on the frequency values, which manifests a very low percentage variation; however, the more significant modification is recorded on the modal shapes. In fact, the identified shapes change substantially, losing (second and third identified mode) the torsional characteristic that is very important for a correct comparison with the FE model.
The paper shows that the adoption of ad hoc chosen locations of the sensors could modify the experimental results, and the influence of the masonry infills on the frequency values may be significant. Furthermore, the paper discusses the influence of the stiffness contribution on the dynamic properties of an irregular building which is usually neglected into the updating procedures, but as demonstrated, it is important for a correct model improvement.
Author Contributions
Conceptualization, M.D. and M.F.S.; methodology, M.D., N.I.G. and M.F.S.; validation, M.D. and N.I.G.; data curation, N.I.G.; writing—original draft preparation, M.D. and M.F.S.; writing—review and editing, M.D., N.I.G. and M.F.S.; supervision, D.F.; project administration, D.F.; funding acquisition, D.F. All authors have read and agreed to the published version of the manuscript.
Funding
This research was funded by the Presidency of the Council of Ministers Department of Civil Protection within the project “PON Governance 2014–2020 project on the reduction of seismic. volcanic and hydrogeological risk for civil protection purposes—CIG 6980737E65—CUP J59G16000160006”.
Acknowledgments
This work was carried out as part of a research agreement among Polytechnic University of Bari (Dora Foti). University of Basilicata (Felice Ponzo). and the Institute of Environmental Geology and Geoengineering of the National Research Council (Federico Mori). Research activities were performed in the framework of the project “PON Governance 2014–2020 project on the reduction of seismic. volcanic and hydrogeological risk for civil protection purposes—CIG 6980737E65—CUP J59G16000160006”. funded by the Presidency of the Council of Ministers Department of Civil Protection.
Conflicts of Interest
The authors declare no conflict of interest.
References
- Peeters, B.; De Roeck, G. Stochastic system identifcation for operatinal modal analysis: A review. J. Dyn. Syst. Meas. Control. 2001, 123, 659–667. [Google Scholar] [CrossRef]
- Reynders, E. System identification methods for (operational) modal analysis: Review and comparison. Archives Comput. Meth. Eng. 2012, 19, 51–124. [Google Scholar] [CrossRef]
- Ranieri, C.; Fabbrocino, G. Operational Modal Analysis of Civil Engineering Structures: An Introduction and Guide for Applications; Springer: Berlin, Germany, 2014. [Google Scholar]
- Bru, D.; Ivorra, S.; Baeza, F.J.; Reynau, R.; Foti, D. OMA Dynamic Identification of a Masonry Chimney with Severe Cracking Condition. In Proceedings of the 6th International Operational Modal Analysis Conference (IOMAC 2015), Gijón, Spain, 12–14 May 2015. [Google Scholar]
- Diaferio, M.; Foti, D.; Ivorra, S.; Giannoccaro, N.I.; Notarangelo, G.; Vitti, M. Monitoring and structural identification of a “Star-shaped” reinforced concrete bell tower. In Proceedings of the 8th International Operational Modal Analysis Conference (IOMAC), Copenhagen, Denmark, 13–15 May 2019; pp. 47–54. [Google Scholar]
- Ivorra, S.; Foti, D.; Gallo, V.; Vacca, V.; Bru, D. Bell’s dynamic interaction on a singular concrete bell tower: A case of Study. Eng. Struct. 2019, 183, 965–975. [Google Scholar] [CrossRef]
- Foti, D.; Diaferio, M.; Giannoccaro, N.I.; Mongelli, M. Ambient vibration testing. dynamic identification and model updating of a historic tower. NDT E Int. 2019, 47, 88–95. [Google Scholar] [CrossRef]
- Foti, D.; Giannoccaro, N.I.; Diaferio, M.; Ivorra, S. Structural identification and numerical models for slender historical structures. In Handbook of Research on Seismic Assessment and Rehabilitation of Historic Structures; IGI Global: Hershey, PA, USA, 2015; pp. 674–703. [Google Scholar]
- Bartoli, G.; Betti, M.; Giordano, S. In situ static and dynamic investigations on the ‘Torre Grossa’ masonry tower. Eng. Struct. 2013, 52, 718–733. [Google Scholar] [CrossRef]
- De Sortis, A.; Antonacci, E.; Vestroni, F. Dynamic identification of a masonry building using forced vibration tests. Eng. Struct. 2005, 27, 155–165. [Google Scholar] [CrossRef]
- Foti, D.; Ivorra, S.; Sabbà, M.F. Dynamic investigation of an ancient masonry bell tower with operational modal analysis: A non-destructive experimental technique to obtain the dynamic characteristics of a structure. Open Constr. Build. Technol. J. 2012, 6, 384–391. [Google Scholar] [CrossRef] [Green Version]
- Mori, F.; Spina, D. Vulnerability assessment of strategic buildings based on ambient vibrations measurements. Struct. Monit. Maint. 2015, 2, 115–132. [Google Scholar] [CrossRef]
- Torres, W.; Almazán, J.L.; Sandoval, C.; Boroschek, R. Operational modal analysis and FE model updating of the Metropolitan Cathedral of Santiago. Chile. Eng. Struct. 2017, 143, 169–188. [Google Scholar] [CrossRef]
- Diaferio, M.; Venerito, M.; Vitti, M. Experimental Investigations and Numerical Simulations for the Seismic Assessment of a Masonry Building. Lect. Notes Civ. Eng. 2022, 204, 57–70. [Google Scholar]
- Spina, D.; Acunzo, G.; Fiorini, N.; Mori, F.; Dolce, M. A probabilistic simplified seismic model of masonry buildings based on ambient vibrations. Bull. Earthq. Eng. 2019, 17, 985–1007. [Google Scholar] [CrossRef]
- Tronci, E.M.; Pietrosanti, D.; Cordisco, G.; De Angelis, M. Vibration analysis of the civic tower in Rieti. Procedia Eng. 2017, 199, 2268–2273. [Google Scholar] [CrossRef]
- Diaferio, M.; Foti, D.; Giannoccaro, N.I. Modal parameters identification on environmental tests of an ancient tower and validation of its FE model. Int. J. Mech. 2016, 10, 80–89. [Google Scholar]
- Diaferio, M.; Foti, D.; Sabbà, M.F.; Lerna, M. A procedure for the seismic risk assessment of the cultural heritage. Bull. Earthq. Eng. 2021, 19, 1027–1050. [Google Scholar] [CrossRef]
- Mazza, F. A plastic-damage hysteretic model to reproduce strength stiffness degradation. Bull. Earthq. Eng. 2019, 17, 3517–3544. [Google Scholar] [CrossRef]
- Mazza, F. In-plane–out-of-plane non-linear model of masonry infills in the seismic analysis of r.c.-framed buildings. Earthq. Eng. Struct. Dyn. 2019, 48, 432–453. [Google Scholar] [CrossRef]
- Diaferio, M.; Foti, D. Seismic risk assessment of Trani’s Cathedral bell tower in Apulia. Italy. Int. J. Adv. Struct. Eng. 2017, 9, 259–267. [Google Scholar] [CrossRef] [Green Version]
- Sivori, D.; Cattari, S.; De Ferrari, R.; Lepidi, M.; Spina, D. Ambient vibration testing of existing buildings aimed to seismic assessment: Experiences in Liguria (abstract). In Proceedings of the 9th International Conference on Computational Methods (ICCM2018), Rome, Italy, 6–10 August 2018. [Google Scholar]
- Ambient Response Testing and Modal Identification Software ARTeMIS Extractor Pro 5.3. Structural Vibration Solution A/S Aalborg East. 2019. Available online: www.svibs.com (accessed on 16 January 2022).
- SAP2000, Computers and Structures Inc. University Avenue: Berkeley, CA, USA, 2009.
- Italian Law. Ordinance of the President of the Council of Ministers (O.P.C.M.) n. 3519/06 of the 28 April 2006. Pressed by “Gazzetta Uffi-ciale” n. 108 Published the 11 May 2006. Available online: https://www.gazzettaufficiale.it/eli/id/2006/05/11/06A04427/sg (accessed on 16 January 2022). (In Italian).
- Italian Law. Presidency Decree of The Council of Ministers. Civil Protection Department (D.P.C.M.) of the 21 October 2003. pressed by “Gazzetta Ufficiale” n. 252 published the 29 October 2003. Available online: https://www.gazzettaufficiale.it/atto/serie_generale/caricaDettaglioAtto/originario?atto.dataPubblicazioneGazzetta=2003-10-29&atto.codiceRedazionale=03A11625&elenco30giorni=false (accessed on 16 January 2022). (In Italian).
- Italian Law. Minister Decree (D.M.) of the 17 January 2018 “Norme Tecniche per le Costruzioni (NTC 2018)”. Presssed by “Gazzetta Uf-ficiale” n. 42 published the 20 February 2018. Available online: https://www.gazzettaufficiale.it/eli/gu/2018/02/20/42/so/8/sg/pdf (accessed on 16 January 2022). (In Italian).
- Italian Law. The circular of the Ministry of Infrastructures and Transports n. 7 of the 21 January 2019 “Istruzioni per l’applicazione dell’«Aggiornamento delle “Norme tecniche per le costruzioni”»” Pressed by “Gazzetta Ufficiale” n.35 Published the 11 February 2019. Available online: https://www.gazzettaufficiale.it/eli/id/2019/02/11/19A00855/sg (accessed on 16 January 2022). (In Italian).
- Ali-Benyahia, K.; Sbartaï, Z.M.; Breysse, D.; Ghrici, M.; Kenai, S. Improvement of nondestructive assessment of on-site concrete strength: Influence of the selection process of cores location on the assessment quality for single and combined NDT techniques. Constr. Build. Mater. 2019, 195, 613–622. [Google Scholar] [CrossRef]
- Diaferio, M.; Vitti, M. Correlation curves to characterize concrete strength by means of UPV tests. Lect. Notes Civ. Eng. 2021, 110, 209–218. [Google Scholar]
- Breysse, D. Nondestructive evaluation of concrete strength: An historical review and a new perspective by combining NDT methods. Constr. Build. Mater. 2012, 33, 139–163. [Google Scholar] [CrossRef]
- Bovo, M.; Tondi, M.; Savoia, M. Infill modelling influence on dynamic identification and model updating of reinforced concrete framed buildings. Adv. Civ. Eng. 2020, 2020, 16. [Google Scholar] [CrossRef]
- Alam, Z.; Zhang, C.; Samali, B. Influence of seismic incident angle on response uncertainty and structural performance of tall asymmetric structure. Struct. Des. Tall Spec. Buildings 2020, 29, e1750. [Google Scholar] [CrossRef]
- Smith, B.S. Methods for predicting the lateral stiffness and strength of multi-storey infilled frames. Build. Sci. 1967, 2, 247–257. [Google Scholar] [CrossRef]
Figure 1.
Location of the Town Hall of Palagianello (source Google Earth Pro).

Figure 2.
Principal façade of the “Municipal Headquarters” of Palagianello.

Figure 3.
Building Plans: (a) Basement floor; (b) Raised floor.

Figure 4.
Building Plans: (a) First floor; (b) Second floor.

Figure 5.
Plan of the Roof floor.

Figure 6.
3D view of the FE model of the “Municipal Headquarters” of Palagianello without infill walls defined by means of SAP2000.
Figure 6.
3D view of the FE model of the “Municipal Headquarters” of Palagianello without infill walls defined by means of SAP2000.

Figure 7.
View of the directions of acquisition of the accelerometers installed at the Raised floor (a), the First floor (b), the Second floor (c) and the Roof floor (d).
Figure 7.
View of the directions of acquisition of the accelerometers installed at the Raised floor (a), the First floor (b), the Second floor (c) and the Roof floor (d).

Figure 8.
View of the sensors installed in one of the monitored points.

Figure 9.
Model of the “Municipal Headquarters” of Palagianello defined in Artemis software. The arrows show the position and direction of each installed accelerometer.
Figure 9.
Model of the “Municipal Headquarters” of Palagianello defined in Artemis software. The arrows show the position and direction of each installed accelerometer.

Figure 10.
Results of the SSI-UPC identification analysis performed on the data acquired during Test 1.
Figure 10.
Results of the SSI-UPC identification analysis performed on the data acquired during Test 1.

Figure 11.
First experimental mode is a torsional-bending mode along x (in green the un-deformed configuration and in blue the mode shape): (a) 3D view; (b) plan view.
Figure 11.
First experimental mode is a torsional-bending mode along x (in green the un-deformed configuration and in blue the mode shape): (a) 3D view; (b) plan view.

Figure 12.
Second experimental mode is a torsional-bending mode along x axis (in green the un-deformed configuration and in blue the mode shape): (a) 3D view; (b) plan view.
Figure 12.
Second experimental mode is a torsional-bending mode along x axis (in green the un-deformed configuration and in blue the mode shape): (a) 3D view; (b) plan view.

Figure 13.
Third experimental mode is a torsional-bending mode along y axis (in green the un-deformed configuration and in blue the mode shape): (a) 3D view; (b) plan view.
Figure 13.
Third experimental mode is a torsional-bending mode along y axis (in green the un-deformed configuration and in blue the mode shape): (a) 3D view; (b) plan view.

Figure 14.
Experimental mode shapes identified for Test 1.a (without sensors placed at nodes 46, 38, 30, 22) plan views (in green the un-deformed configuration and in blue the mode shape): (a) second mode (bending along x axis); (b) third mode (bending along y axis).
Figure 14.
Experimental mode shapes identified for Test 1.a (without sensors placed at nodes 46, 38, 30, 22) plan views (in green the un-deformed configuration and in blue the mode shape): (a) second mode (bending along x axis); (b) third mode (bending along y axis).

Figure 15.
Experimental mode identifies for Test 1.b (without sensors placed at nodes 46, 38, 30, 22) plan views (in green the un-deformed configuration and in blue the mode shape): (a) second mode (bending along x axis); (b) third mode (bending along y axis).
Figure 15.
Experimental mode identifies for Test 1.b (without sensors placed at nodes 46, 38, 30, 22) plan views (in green the un-deformed configuration and in blue the mode shape): (a) second mode (bending along x axis); (b) third mode (bending along y axis).

Figure 16.
First mode is a torsional-bending mode along x axis with frequency equal to 4.94 Hz (in grey the un-deformed configuration and in blue the mode shape): (a) 3D view; (b) plan view.
Figure 16.
First mode is a torsional-bending mode along x axis with frequency equal to 4.94 Hz (in grey the un-deformed configuration and in blue the mode shape): (a) 3D view; (b) plan view.

Figure 17.
Second mode is a torsional-bending mode along x axis with frequency equal to 7.67 Hz (in grey the un-deformed configuration and in blue the mode shape): (a) 3D view; (b) plan view.
Figure 17.
Second mode is a torsional-bending mode along x axis with frequency equal to 7.67 Hz (in grey the un-deformed configuration and in blue the mode shape): (a) 3D view; (b) plan view.

Figure 18.
Third mode is a torsional-bending mode along y axis with frequency equal to 8.44 Hz (in grey the un-deformed configuration and in blue the mode shape): (a) 3D view; (b) plan view.
Figure 18.
Third mode is a torsional-bending mode along y axis with frequency equal to 8.44 Hz (in grey the un-deformed configuration and in blue the mode shape): (a) 3D view; (b) plan view.

Figure 19.
3D view of the FE model of the “Municipal Headquarters” of Palagianello with infill walls defined by means of SAP2000.
Figure 19.
3D view of the FE model of the “Municipal Headquarters” of Palagianello with infill walls defined by means of SAP2000.


Table 1.
Structure Parameters.
| Use Class | Nominal Life [Years] | Use Coefficient | Period [Years] | Soil Type | Topographic Category |
|---|---|---|---|---|---|
| III | 50.0 | 1.5 | 75.0 | A | T1 |
Table 2.
Identified frequency values.
| Mode | Test 1 | Test 2 | Test 3 | Mean Frequency | |||
|---|---|---|---|---|---|---|---|
| Frequency [Hz] | Damping Ratio [%] | Frequency [Hz] | Damping Ratio [%] | Frequency [Hz] | Damping Ratio [%] | [Hz] | |
| 1 | 5.17 | 1.25 | 5.14 | 1.75 | 5.35 | 1.30 | 5.20 |
| 2 | 7.68 | 2.75 | 7.65 | 2.58 | 7.66 | 2.98 | 7.66 |
| 3 | 8.86 | 2.09 | 8.63 | 1.93 | 8.79 | 2.06 | 8.76 |
Table 3.
Comparison between the identified frequency values for different set-up configurations.
| Mode | Frequency Test 1 (Identification with All Sensors) [Hz] | Frequency Test 1.a (Identification without Sensors Placed at Nodes 46, 38, 30, 22) [Hz] | Frequency Test 1.b (Identification without Sensors Placed at Nodes 41, 33, 25, 14, 39, 31, 23) [Hz] |
|---|---|---|---|
| 1 | 5.17 | 5.12 | 5.13 |
| 2 | 7.68 | 7.66 | 7.69 |
| 3 | 8.86 | 8.71 | 8.78 |
Table 4.
Comparison between the identified frequency values for different set-up configurations.
| Mode | FE Model without Infill Walls Frequency [Hz] | FE Model with Infill Walls Frequency [Hz] | ARTeMIS Mean Frequency [Hz] |
|---|---|---|---|
| 1 | 4.94 | 5.26 | 5.20 |
| 2 | 7.67 | 7.72 | 7.66 |
| 3 | 8.44 | 8.83 | 8.76 |
Table 5.
Modal Participating Mass Ratios.
| Mode | FE Model without Infill Walls | FE Model with Infill Walls | ||||||
|---|---|---|---|---|---|---|---|---|
| Period [s] | Ux [-] | Uy [-] | Rz [-] | Period [s] | Ux [-] | Uy [-] | Rz [-] | |
| 1 | 0.202 | 0.260 | 0.050 | 0.331 | 0.189 | 0.297 | 0.068 | 0.304 |
| 2 | 0.130 | 0.365 | 0.067 | 0.163 | 0.129 | 0.394 | 0.080 | 0.207 |
| 3 | 0.118 | 0.000 | 0.490 | 0.096 | 0.113 | 0.003 | 0.485 | 0.163 |
Table 6.
Center of Mass coordinates of the two FE Model for each floor.
| Axis | FE Model without Infill Walls | FE Model with Infill Walls | ||||
|---|---|---|---|---|---|---|
| U1 | U2 | U3 | U1 | U2 | U3 | |
| Raised floor | ||||||
| x | 10.35 | 10.35 | 6.02 | 10.36 | 10.36 | 6.02 |
| y | 8.88 | 8.88 | 12.32 | 8.88 | 8.88 | 12.32 |
| z | 0 | 0 | 0 | 0 | 0 | 0 |
| First floor | ||||||
| x | 9.36 | 9.36 | 7.47 | 9.36 | 9.36 | 7.47 |
| y | 9.71 | 9.71 | 10.01 | 9.71 | 9.71 | 10.01 |
| z | 3.60 | 3.60 | 3.60 | 3.60 | 3.60 | 3.60 |
| Second floor | ||||||
| x | 7.29 | 7.29 | 7.13 | 7.31 | 7.31 | 7.13 |
| y | 10.21 | 10.21 | 10.93 | 10.21 | 10.21 | 10.93 |
| z | 6.90 | 6.90 | 6.90 | 6.90 | 6.90 | 6.90 |
| Roof floor | ||||||
| x | 7.07 | 7.07 | 7.03 | 7.10 | 7.10 | 7.03 |
| y | 9.80 | 9.80 | 10.82 | 9.80 | 9.80 | 10.82 |
| z | 10.20 | 10.20 | 10.20 | 10.20 | 10.20 | 10.20 |
Publisher’s Note: MDPI stays neutral with regard to jurisdictional claims in published maps and institutional affiliations. |
© 2022 by the authors. Licensee MDPI, Basel, Switzerland. This article is an open access article distributed under the terms and conditions of the Creative Commons Attribution (CC BY) license (https://creativecommons.org/licenses/by/4.0/).
Share and Cite
MDPI and ACS Style
Diaferio, M.; Foti, D.; Giannoccaro, N.I.; Sabbà, M.F. Dynamic Identification on an Irregular Structure. Appl. Sci. 2022, 12, 3445. https://0-doi-org.brum.beds.ac.uk/10.3390/app12073445
AMA Style
Diaferio M, Foti D, Giannoccaro NI, Sabbà MF. Dynamic Identification on an Irregular Structure. Applied Sciences. 2022; 12(7):3445. https://0-doi-org.brum.beds.ac.uk/10.3390/app12073445
Chicago/Turabian StyleDiaferio, Mariella, Dora Foti, Nicola Ivan Giannoccaro, and Maria Francesca Sabbà. 2022. "Dynamic Identification on an Irregular Structure" Applied Sciences 12, no. 7: 3445. https://0-doi-org.brum.beds.ac.uk/10.3390/app12073445
Note that from the first issue of 2016, this journal uses article numbers instead of page numbers. See further details here.