Article

Calculation of Intracoronary Pressure-Based Indexes with JLabChart

1
Department of Surgical and Medical Science, University eCampus, 22060 Novedrate, Italy
2
Department of Surgical and Medical Science, University Magna Graecia of Catanzaro, 88100 Catanzaro, Italy
*
Author to whom correspondence should be addressed.
Submission received: 2 February 2022 / Revised: 24 February 2022 / Accepted: 3 March 2022 / Published: 29 March 2022
(This article belongs to the Special Issue Biotechnology and Numerical Methods in Cardiovascular Application)

Abstract

:
The Fractional Flow Reserve (FFR) and instantaneous wave-Free Ratio (iFR) have been proposed and clinically validated to measure the pressure gradient across coronary stenoses. They provide quantitative information on stenosis severity. Both are used in coronary revascularization procedures to measure intracoronary pressure giving quantitative information to evaluate coronary diseases during angiographic procedures. We designed and implemented a tool able to acquire and measure iFR and FFR supporting the physicians studying and treating patients in interventional cardiology laboratories. We designed an extensive case study to assess the performance of the tool in (i) acquiring pressure signals from blood pressure measurement systems; (ii) calculating FFR and iFR; and (iii) filtering out extra-beats signals during realtime signal analysis phases. The tool, named JLabChart, is available online. We tested it on two sets of data for a total of 600 cycles from 201 pressure measurements performed on 65 patients, from the Interventional Cardiology Unit of Magna Graecia University. The recognition of cardiac cycles and keypoint of the pressure curve was effective in 100 % of cases for proximal (aortic) pressure and in 99.2 % for distal pressure. The FFR calculated by JLabChart had an excellent correlation ( R p = 0.960 ; p < 0.001 ) with the FFR values obtained through the commercial systems. Similar results were obtained with iFR ( R p = 0.998 ; p < 0.001 ). Finally, the tool measurement results were compared with a commercial tool proving JLabChart’s efficiency with real cases. It was also compared with measurements performed on synthetic vessels and stenosis designed using the Comsol commercial tool. JLabChart is able to provide reliable measurements of FFR and iFR indexes used to support decisions on interventional procedures. It represents a valuable open source support system that can be used in an interventional cardiology laboratory.

1. Introduction

Coronary heart disease is a major cause of death and morbidity worldwide [1]. Coronary revascularization by means of Percutaneous Coronary Intervention (PCI) is the most widely used treatment for coronary artery disease (CAD) [2]. Coronary angiography represents the standard diagnostic examination for CAD, to assess coronary stenoses on the basis of their impact on coronary lumen, as it is able to characterize stenosis geometry [3]. In fact, angiography allows a visual evaluation of stenosis severity, but it does not provide details on the actual impact of the stenosis on blood flow. Thus, coronary angiography allows physicians to assess the status of coronary arteries and, in particular, of specific features such as the shape, length, and eccentricity of the lesion [4]. However, it is not able to provide information on the hemodynamic impact of coronary stenoses [5]. For this reason, the Fractional Flow Reserve (FFR) was developed, which represents the mean distal–to–proximal pressure ratio across a coronary stenosis under maximal hyperemia [6]. In other words, FFR is a diagnostic index indicating whether or not a particular stenosis of a coronary artery might be causing myocardial ischemia, that is, an impairment in myocardial blood perfusion because of the physical restraint brought about by the narrowing of vessel lumen (stenosis). FFR has been proven effective in identifying ischemia-causing stenoses [7] and in guiding PCI [8,9,10]. FFR is measured by definition under maximal hyperemia (an increase in blood flow), induced by means of a vasodilation of coronary microvasculature (known as hyperemia). To obtain hyperemia, vasodilatory drugs are administered to reduce downward resistance to blood flow. Adenosine is the most frequently used vasodilator for this purpose in clinical practice [11,12]. As the administration of adenosine requires intravascular injection (either an intracoronary bolus or an intravenous infusion) this requires additional time-consuming procedures. In addition, adenosine might be responsible for adverse effects, such as respiratory problems, a cutaneous rash, or transient bradycardia [13]. For these reasons, adenosine-free indices were developed as an alternative to simplify and to foster the spread of coronary pressure guidance during PCI [14]. Among adenosine-free indices, the instantaneous wave-Free Ratio (iFR) has shown a very high diagnostic agreement with FFR [15,16,17], with a similar performance in head-to-head studies on inducible ischemia against multiple comparators [18,19]. As it does not require hyperemia (and thus adenosine administration), iFR has attracted physicians’ attention since it can cut time and costs, as well as enhance patient comfort. The relationship between FFR and iFR has been verified in multiple studies [20,21]. The diagnostic performance of iFR in the evaluation of the severity of coronary stenosis severity has been assessed against FFR, used as the standard of reference [22,23,24,25]. iFR was tested in different clinical scenarios, including acute coronary syndromes and multivessel disease [22] and left main coronary artery disease, and its use in guiding PCI was recently validated in two large-scale clinical trials [26,27].
The FFR-guided revascularization strategy has been proven to be more effective than the angiography-guided alternative.
Here, we present the architecture and the use of a tool called JLabChart and report on the validation of the  proposed tool by means of measurements and tests, proving the efficacy of the resulting measurements. The tool has been compared in terms of measurement values with real tests and synthetic vessels stenosis designed on the Comsol flow simulation commercial tool. The latter allows physicians to design vessels with known values and, thus, with known pressure values. In [28], the authors identified independent clinical and angiographic parameters associated with stenosis functional significance developing a weighted fractional flow reserve angiographic scoring tool (FAST) to improve lesion selection for FFR assessment. In [29,30,31], Matlab tools (Mathworks, Inc., Natick, MA) were used to define a custom built software package, whose aim was to calculate physiological stenosis severity by FFR, iFR, and resting whole-cycle Pd/Pa indexes. These attempts were based on the measurement and analysis of FFR and iFR in a offline mode after pressure data acquisition performed by a commercially available proprietary software [32,33,34].
This paper presents the architecture, implementation and use of JLabChart, a software tool able to (i) acquire pressure data and calculate FFR and iFR indexes, (ii) acquire data from a polygraph and (iii) evaluate stenosis severity during a hemodynamic procedure. The system is able to acquire online measurements of FFR and iFR indexes to qualitatively estimate vessel stenosis severity, where measures for  calculating indexes are acquired online by using intracavitary probes. The system also allows physicians to represent and manipulate the data obtained from the measurement devices in order to quantitatively evaluate pressure values detected in the patient vessels during a realtime procedure.
In the rest of the paper, we report the methods and algorithms, as well as the experimental results performed at the University Magna Graecia Clinical Hospital. The results were also compared with commercial system features proving the reliability and the efficiency of the proposed system. Measurements were also tested using a finite element method through Comsol, a commercial tool which uses known blood flow values and known vessel forms (in terms of sections and dimensions), thus proving the reliability of the proposed tool in terms of measurement results (see Figure 1), as also in [35].

2. Material and Methods

Blood pressure is an important index for studying cardiovascular diseases [36]. Blood pressure, flow, and vessel resistance form the main indexes in hemodynamic studies [37,38]. Given two points P 1 and P 2 in a vessel, Δ P is the blood pressure difference between P 1 and P 2 . Let R be the resistance to the blood flow; then, the blood flow Q is given by Equation (1).
Q [ mL · s 1 ] = Δ P [ mmHg ] R [ mmHg · mL 1 · s ]
In the top half of Figure 2, an example of time varying blood pressure is reported. This figure also shows the relation between blood pressure and cardiac frequency (also known as cardiac cycle, represented by an electrocardiogram ECG in the lower half part of Figure 2). In the blood pressure time varying plot, two important values are measured: the dicrotic notch point and the wave-free period, as shown in Figure 3.
Pressure values in the dicrotic notch point, as well as the iFR and FFR indexes, can be used as the optimal strategy in an interventional cardiology laboratory in order to treat stenosis and reduce the risk of  ischemia. We focus on the acquisition, measurement, and analysis of the iFR and FFR indexes during cardiology interventions. There are several commercial tools for measuring pressure values and calculating such indexes [8,39]. In order to calculate both FFR and iFR, proximal (aortic) and distal (coronary) pressures are measured invasively. Proximal pressure is measured through a fluid-filled angioplasty catheter. This measurement acquires aortic pressure, used as the proximal pressure. On the other hand, distal pressure is measured by using a 0.014 pressure wire (VERRATA, Volcano, Philips, Excelsiorlaan 41, 1930 Zaventem, Belgium). The pressure wire embeds a high fidelity pressure transducer in its tip, connected to the hardware unit through an optic fiber. Pressure measurements are obtained both at rest (to calculate iFR) and under maximal hyperaemia obtained through continuous venous infusion of adenosine 140 mcg/kg/min (useful for calculation of FFR). Calculations performed by means of the JLabChart, were compared with the Volcano commercial system (Volcano Consolle, Philips, Excelsiorlaan 41, 1930 Zaventem, Belgium, software version 3.4).

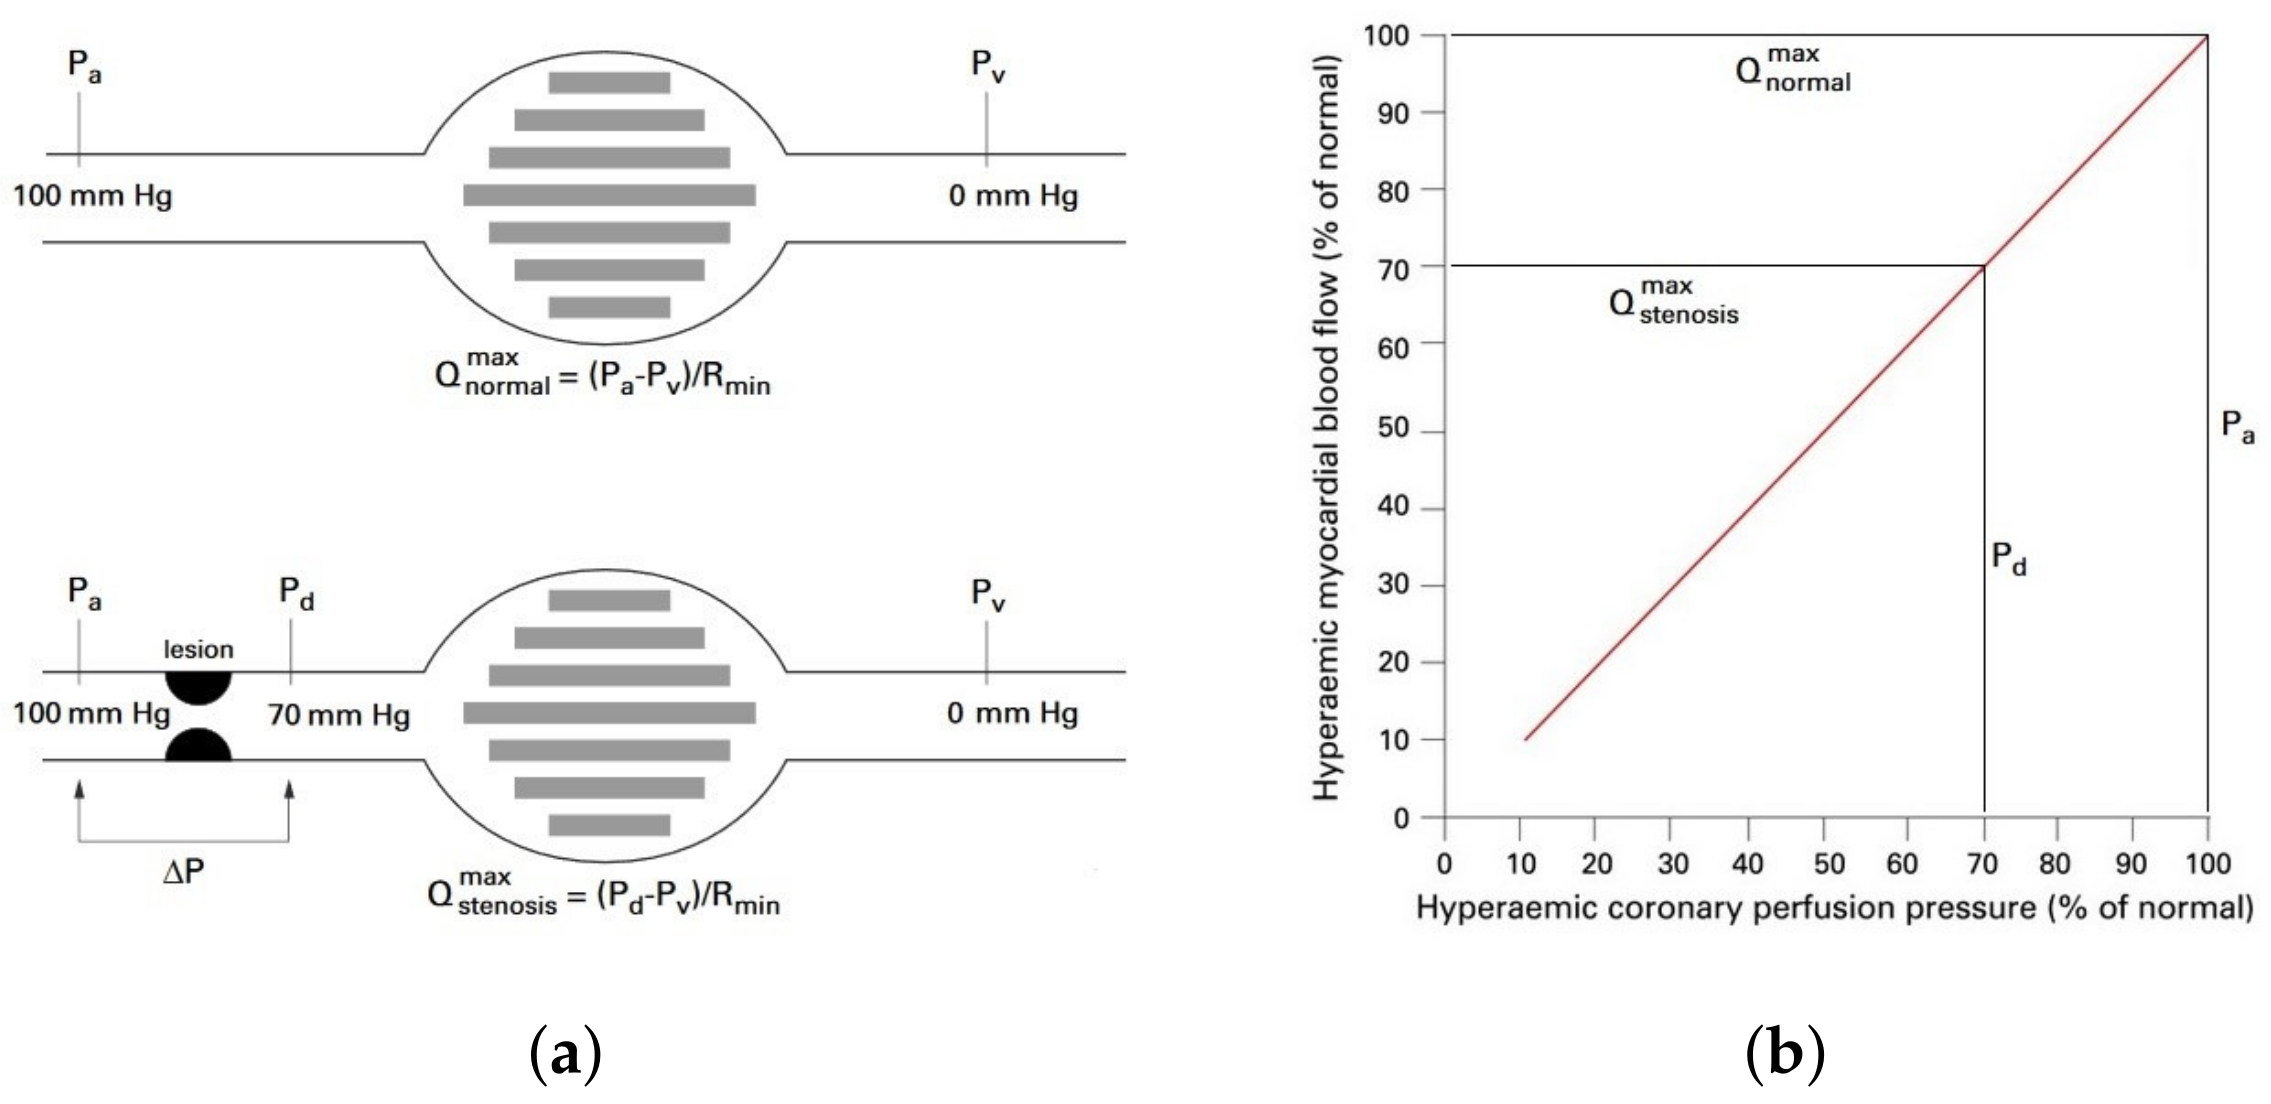
2.1. Fractional Flow Reserve

We refer to the FFR index to measure intracoronary pressure and to evaluate stenosis severity [40]. The maximal vasodilation of the microcirculation, known as maximal hyperemia, is induced by adenosine and papaverine. The FFR index is evaluated by considering the proximal aortic pressure P a and the distal coronary artery pressure P d . Figure 4 reports a schematic representation of the FFR at the maximum vasodilation condition, where a condition without lesions is shown at the top and a condition with stenosis at the bottom.
In the latter case, the stenosis is responsible for a hyperemic pressure gradient ΔP of 30 mmHg; so, the driving pressure ranges from 100 mmHg to 70 mmHg ( P d ). During maximal hyperemia, the relationship between the driving pressure and myocardial blood flow is linear and the myocardial blood flow reaches 70 % of its normal value. P a , P d , and P v indicate (i) aortic pressure values in the proximity of the vessel lesion, (ii) the coronary artery pressure distal to the lesion and the (iii) central venous pressure, respectively. Finally, R m i n is the minimal myocardial resistance. The FFR is defined as in Equation (2):
FFR = Q s t e n o s i s m a x Q n o r m a l m a x
where Q s t e n o s i s m a x is the maximum myocardial blood flow in the presence of stenosis, and Q n o r m a l m a x represents the maximum myocardial flow in a normal condition. Q n o r m a l m a x and Q s t e n o s i s m a x are evaluated as the ratio between the pressure value and the coronary index of resistance, as expressed in Equations (3) and (4). In particular:
Q n o r m a l m a x = ( P a P v ) R m i n
Q s t e n o s i s m a x = ( P d P v ) R m i n .
By using these values in Equation (2), the FFR can be expressed in the following Equation (5):
FFR = Q s t e n o s i s m a x Q n o r m a l m a x = ( P d P v ) R ( P a P v ) R .
By considering the central venous pressure ( P v ) as negligible, the FFR formula may be also simplified as in Equation (6):
FFR = P d P a .
The FFR is a dimensionless parameter, which can be expressed with values between 0 and 1 indicating an occluded vessel or a healthy vessel, respectively. In a healthy coronary artery, the FFR is equal to 1 because the pressure in the origin and in the distal tract of a healthy vessel is the same, even during maximal hyperemia. In the presence of stenosis, however, the blood pressure downstream is lower than the measured one from the guide catheter tip, during maximal hyperemia, so the FFR is reduced. In particular, F F R > 0.80 means that the stenosis presents a minimal hemodynamic impairment and is not associated with clinical risk.

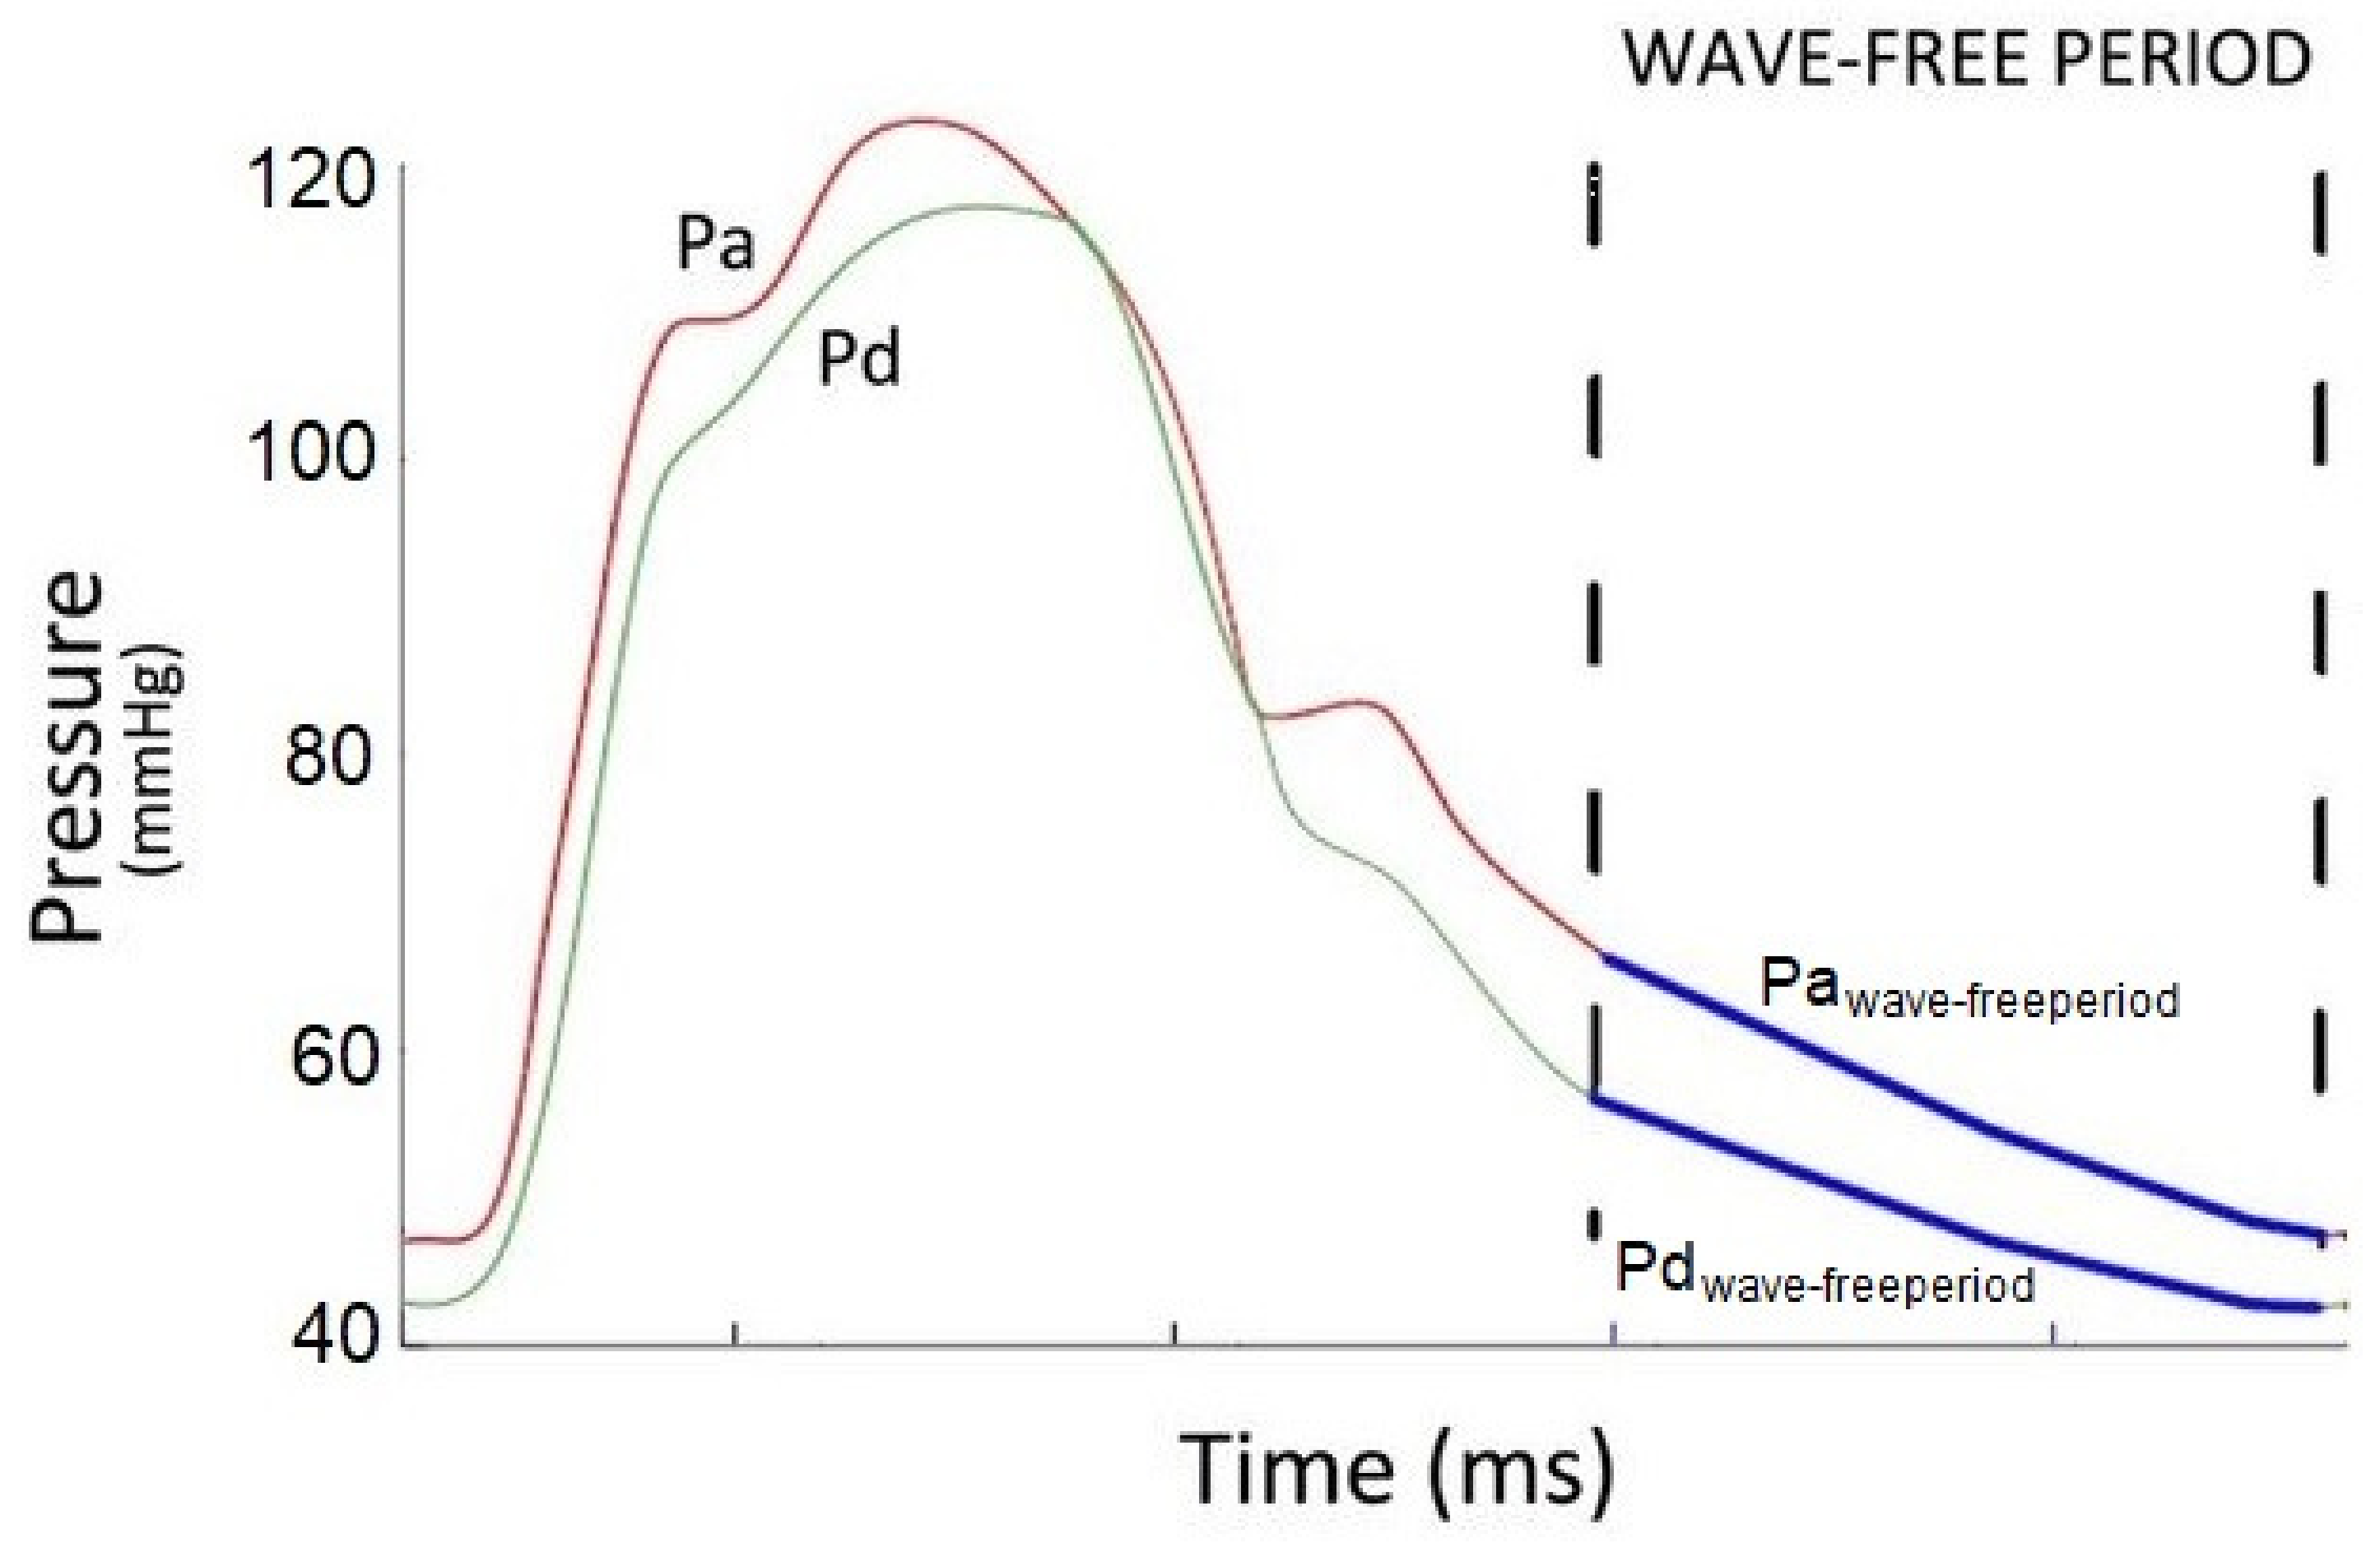
2.2. Instantaneous Wave-Free Ratio (iFR)

Maximal hyperemia is required to perform an FFR measurement with the use of adenosine as a pharmacological agent. To reduce the use of drugs, the instantaneous wave-free Ratio (iFR) index is used to evaluate coronary artery stenosis [18]. iFR is a pressure-only index that is measured without vasodilators [41]. It is based on intracoronary pressure sampling during the diastolic wave-free period. The iFR measurement is based on diastolic intracoronary pressure values, both proximal and distal to the stenosis, during the diastolic interval in which the resistors are spontaneously minimum (that is during the wave-free period). Generally, the measurement of the i F R requires an average over 5 heart beats, but sometimes it can be performed by using a single heart beat. Wave-intensity analysis of the coronary flow curve is performed by means of a guide wire, equipped with pressure and Doppler sensors. The i F R isolates the wave-free period in the diastole and evaluates the ratio of the distal coronary pressure ( P d w a v e f r e e p e r i o d ) to the proximal aortic pressure ( P a w a v e f r e e p e r i o d ) over this period, as shown in Figure 5.
The onset of the diastole is identified by the dicrotic notch, while the end of the diastole is defined as the point of the lowest pressure leading into the next cardiac cycle. Therefore, the i F R can be calculated by Equation (7):
iFR = P d w a v e f r e e p e r i o d P a w a v e f r e e p e r i o d .
An iFR value for an healthy subject is equal to 1.0 . A value lower than 0.9 usually suggests a flow limitation, while a value higher than 0.9 indicates a negligible stenosis.
Following the original definition reported in the ADVISE study, we developed an independent algorithm for calculating iFR, that we described in the FORECAST study and in the FORECAST-LM study. The calculation of iFR with JLabChart is based on that algorithm.

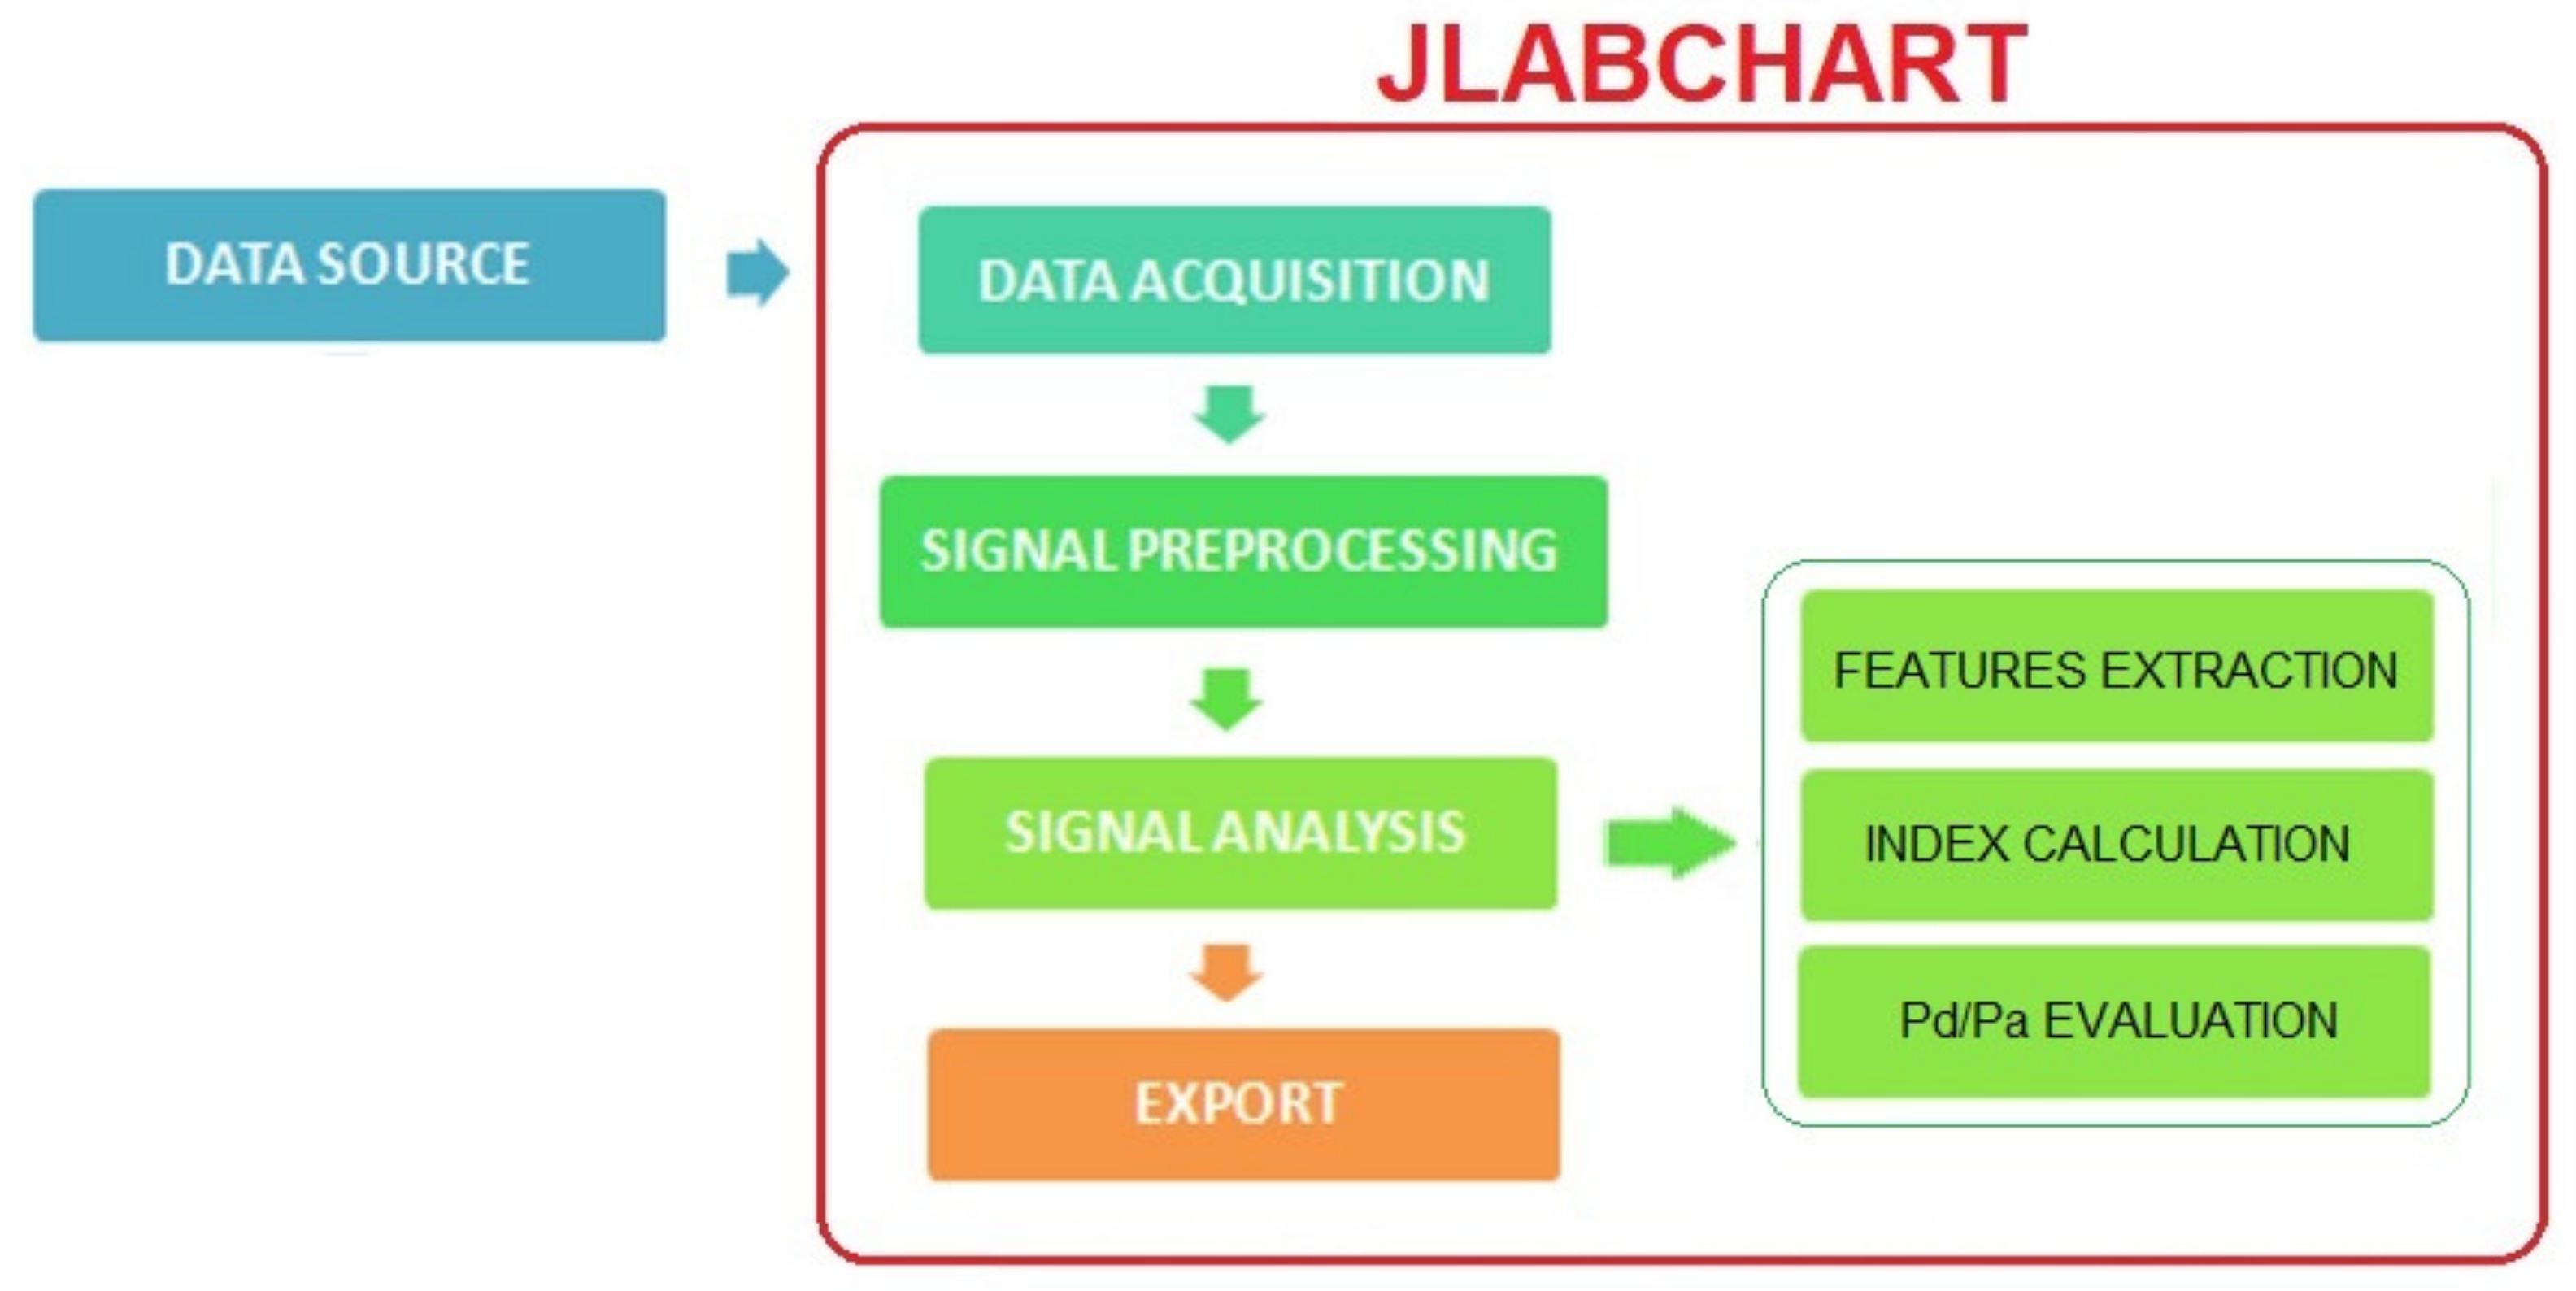
2.3. JLabChart Architecture

JLabChart is freely available to download at the following website https://sites.google.com/site/jlabchart/home, accessed on 14 March 2022 (see Figure 6). The website also includes documentation and data on how to use the system in different operating environments (see Figure 7). Figure 8 shows the JLabChart system architecture and module relations in a process workflow representation. The GUI of the software is depicted in and Figure 9.
Input signals are acquired by probes and a polygraph (as in [42]). Blood pressure signals are acquired during an intracavitary vessel study. Probes are placed in the proximal and distal position from a stenosis. Signals are acquired at a sample frequency of 250 Hz by the polygraph, saved, and then examined by the system proposed here.
We now briefly describe the modules reported in Figure 8. The Data Acquisition module extracts the distal pressure ( P d ), the proximal pressure ( P a ), and the time window chosen for the analysis. The analysis module extracts the features, calculates the indexes, and evaluates the P d / P a ratio. The Signal Analysis module elaborates the blood pressure signals by means of: (i) the identification of the maximum peak, minimum peak, and dicrotic points, (ii) the evaluation of the FFR, iFR, mean, duration, and frequency of the signal pressure, and (iii) the P d / P a ratio evaluation.
Lastly, the processed data are exported by the Export module and presented to the physician during the intervention procedure, in order to analyze and plan further experiments and tests.
The extraction consists of the identification of the maximum and minimum peak values and the dicrotic value. These values are associated with specific points on the graphical representation of the signal waveform. For the first two values (points), a derivative mathematical function is applied on the pressure signal. The maximum peak is evaluated by using a local search function, which uses a quadratic interpolation method. Then, a threshold value of 160 bpm (beats per minute) and a minimum time distance of 0.4 s are chosen to extract only the peaks of interest corresponding to the systolic peaks. Analogously, the same procedure can be used to find the minimum peaks corresponding to the diastolic peaks, albeit through a negative derivative function. For the identification of the dicrotic point, the signal between the systolic and diastolic peaks is considered. This part of the signal is segmented into 1 / 250 intervals (i.e., a sample every 0.004 s). A local minimum search is then performed, by comparing neighboring samples, until a sample can be promoted to the dicrotic point. The extracted features are then used to estimate the frequency and duration of the pressure signal and to evaluate the FFR and iFR.
The FFR is evaluated according to Equation (efeqFFR). Moreover, for each signal cycle the following parameters are also identified: (i) FFR D , as the difference between the mean distal pressure and the mean proximal pressures; (ii) FFR R , as the ratio between the mean distal pressure and the mean proximal pressures; and (iii) FFR M , as the mean between the FFR R of cycles with a regular heart rate. A heart rate is regular if the values of two consecutive heart rates do not exceed ± 20 % . For iFR, the identification of the wave-free period is performed as described in Section 2.2. Figure 9 reports an example of using JLabChart tool.
JLabChart includes additional functionalities that can be customized by physicians. For instance, it automatically identifies irregular cardiac frequencies for the identification of various arrhythmias such as extra-systoles and tachycardia. It also filters out cycles with an irregular cardiac frequency, removing them from the analyses performed on the signal. In fact, signals with a variation of ± 20 % of the cycle, are marked as not evaluable and filtered out.
The measures that can be evaluated by using JLabChart are: (i) the mean of P d , (ii) the mean of P a , (iii) the difference between P d and P a , (iv) the ratio between P d and P a , and (v) the mean of P d and P a . The P d / P a ratio can be studied by using an ad hoc function supporting the physician’s choice.

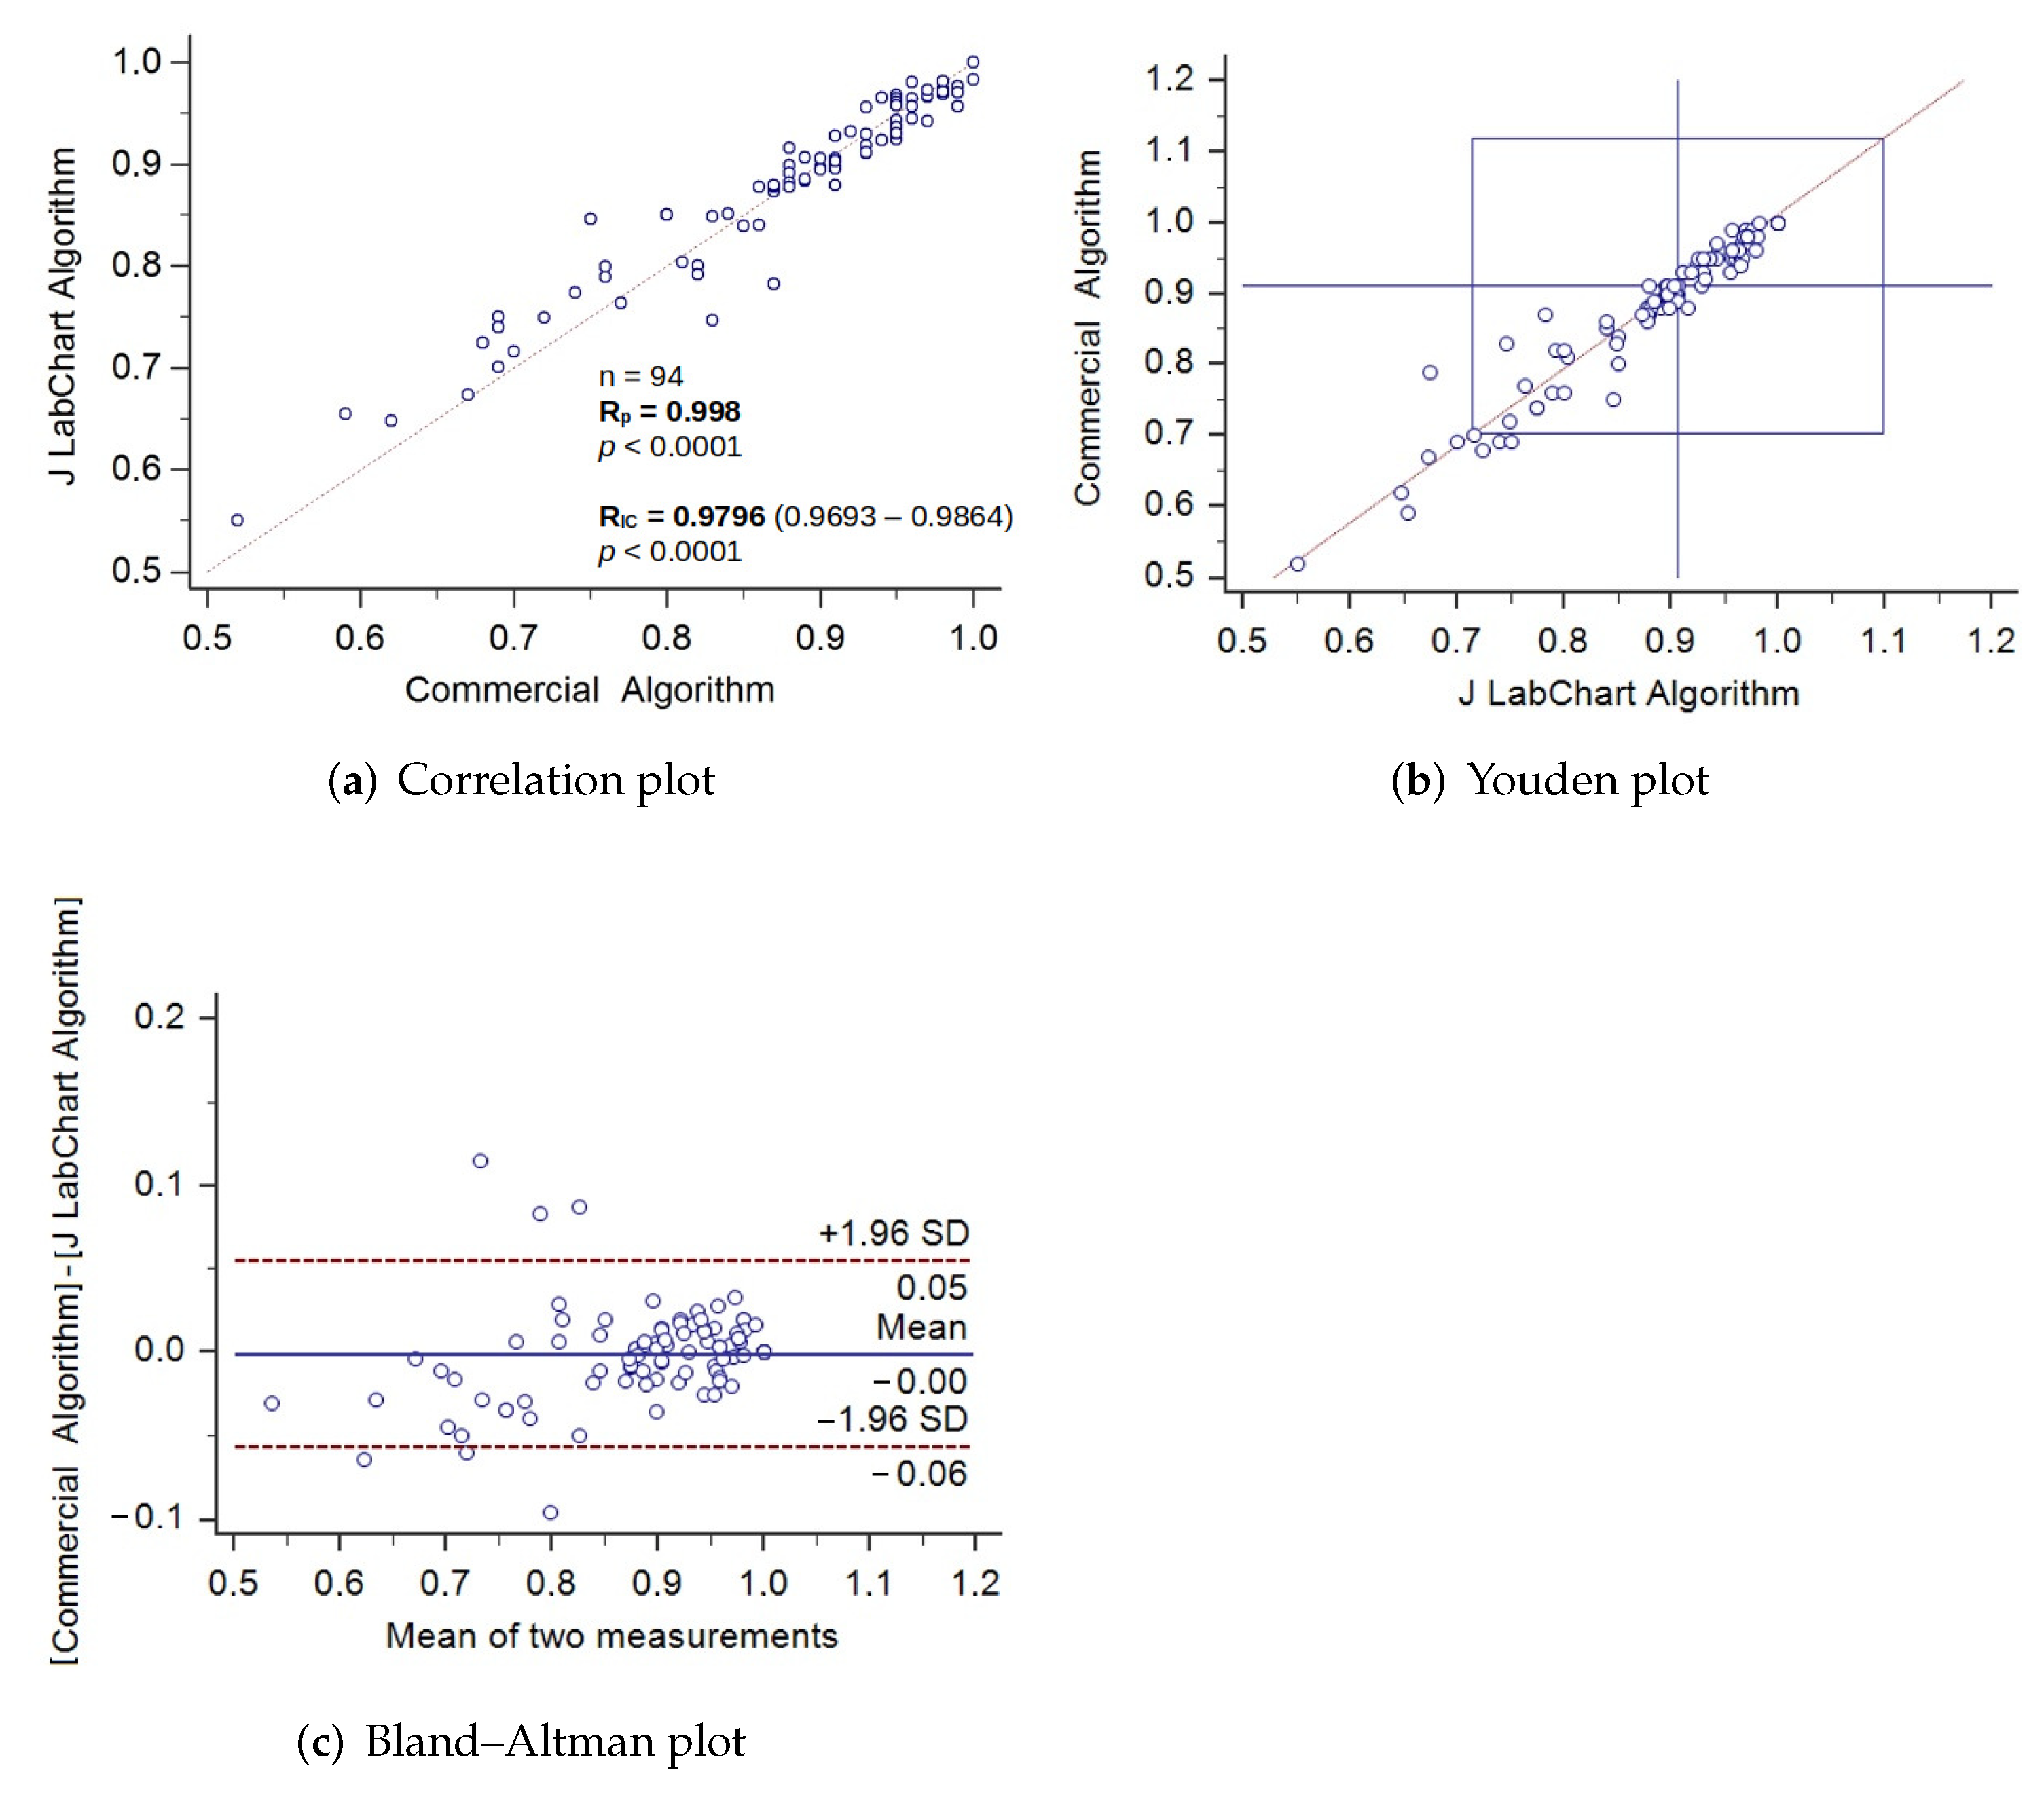
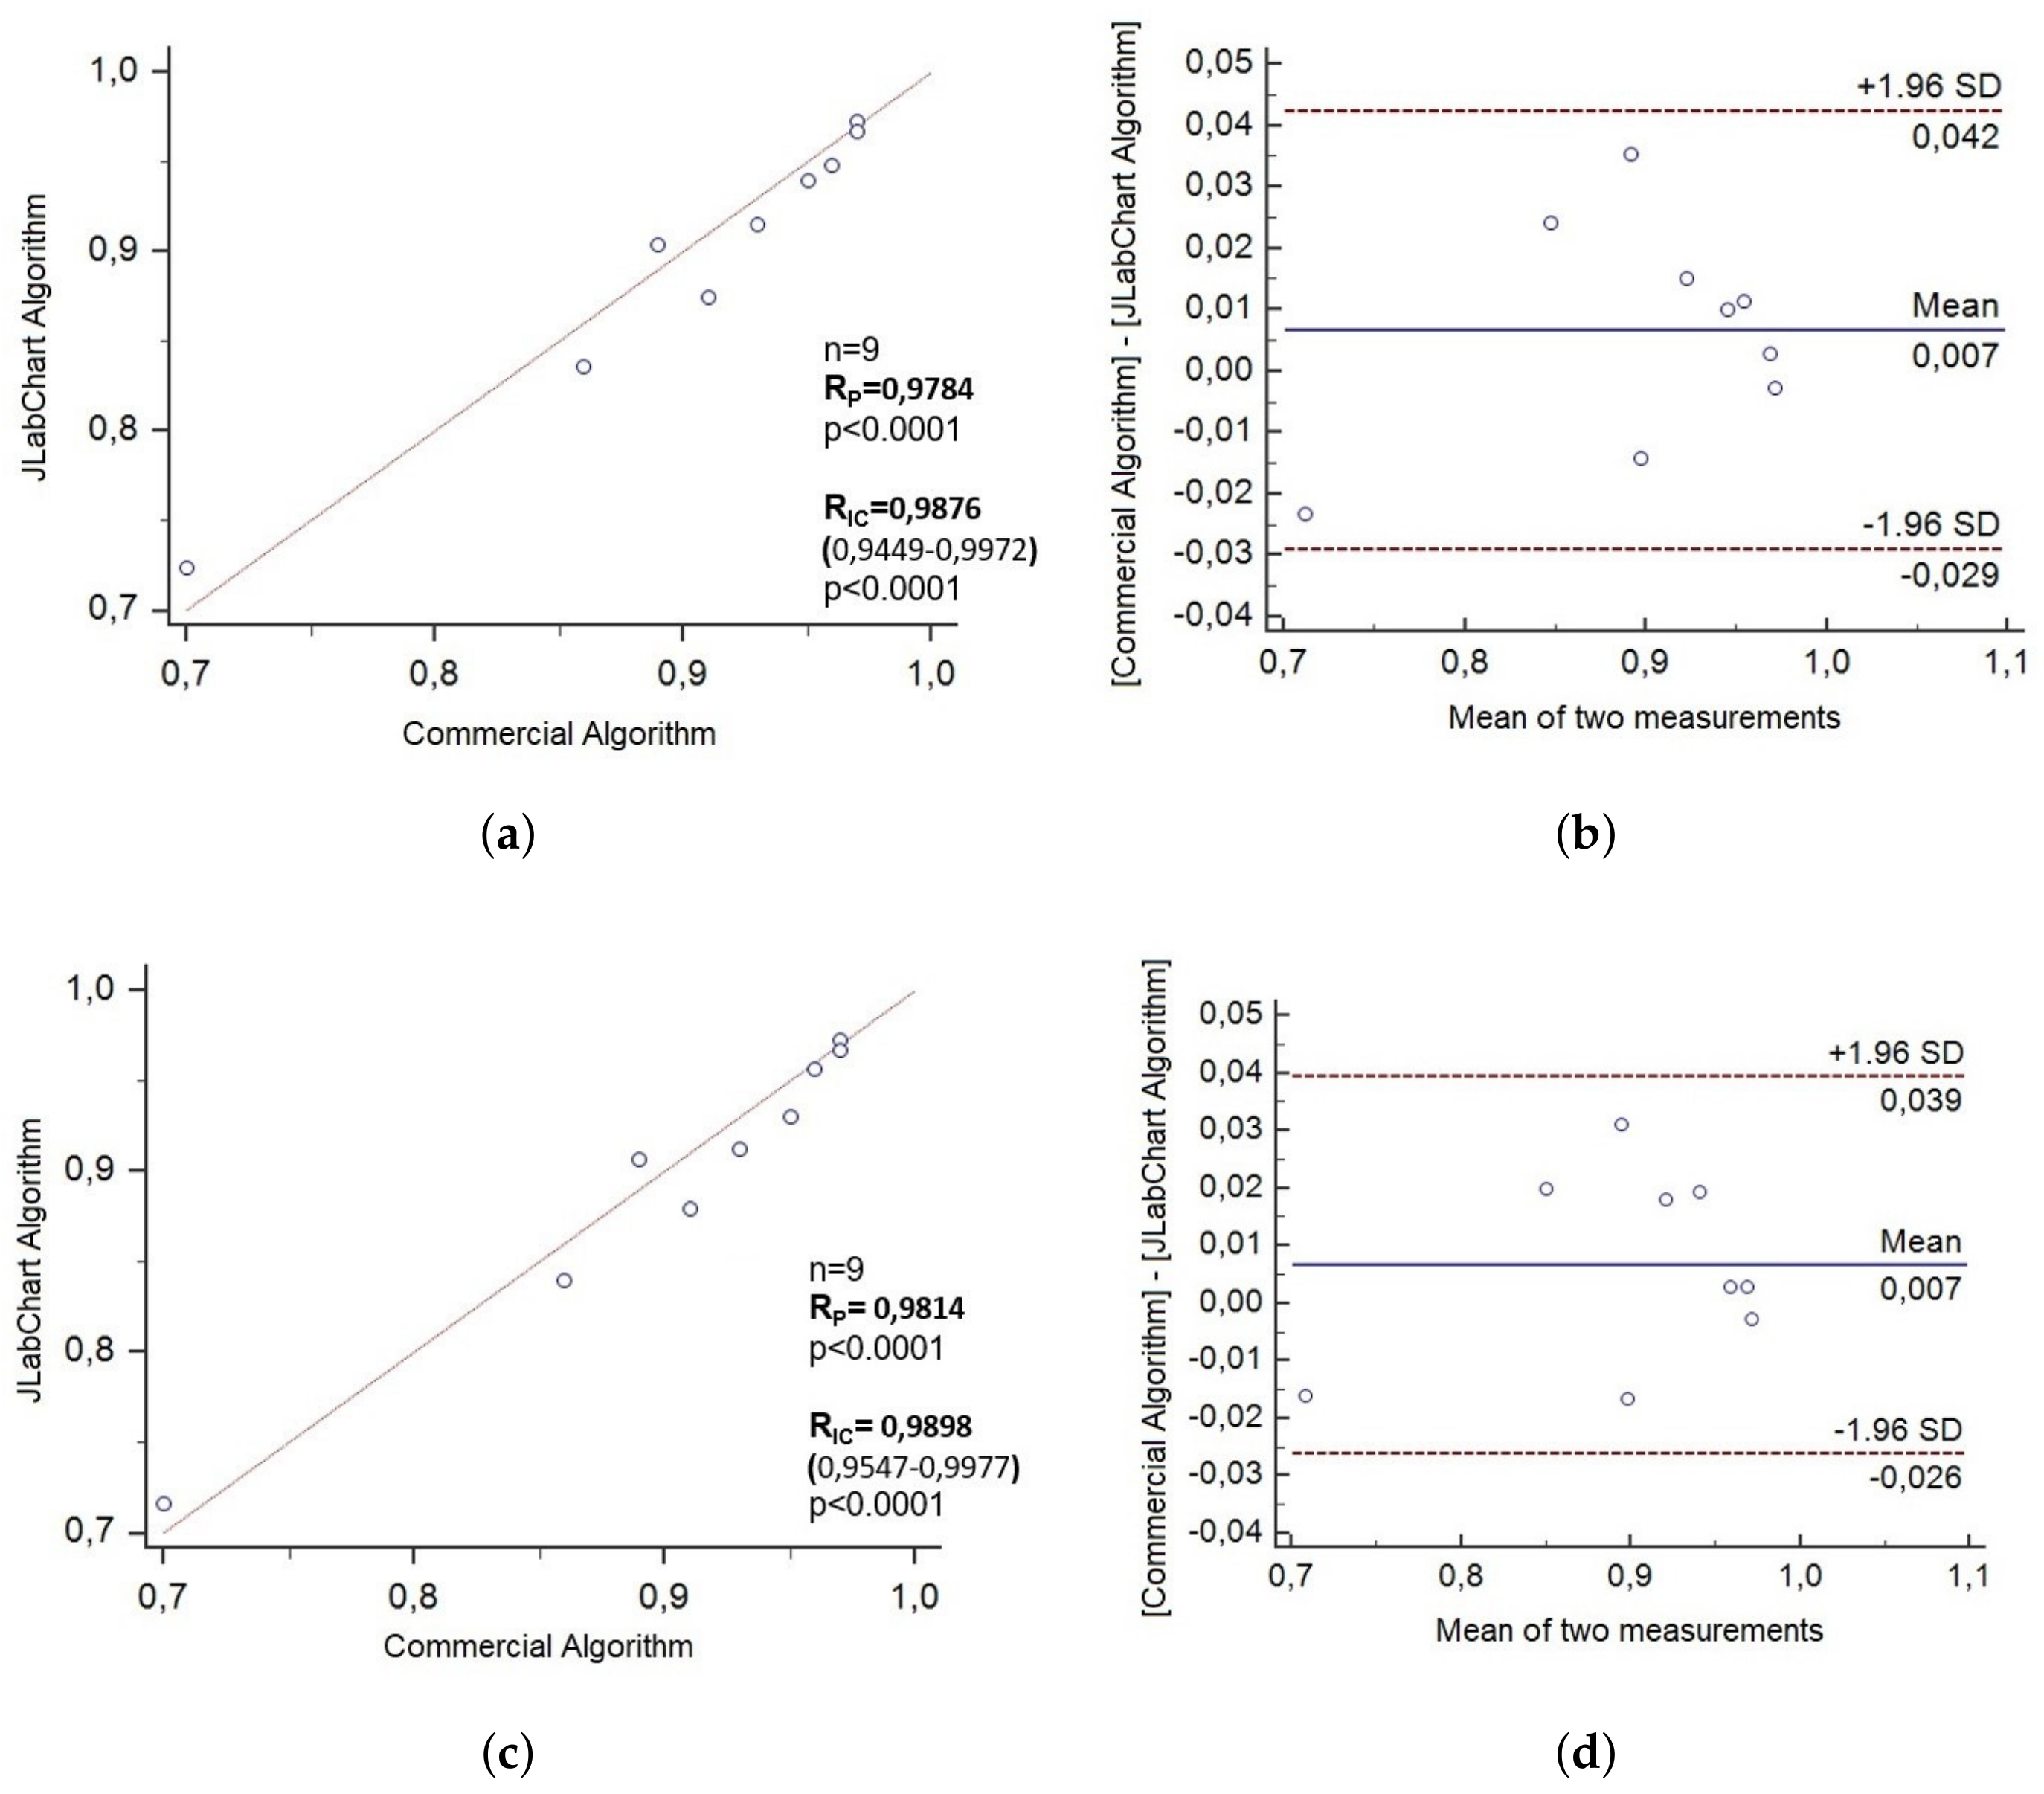
3. Results and Discussion

JLabChart was tested on pressure measurements obtained in the interventional cardiology laboratory of the University Hospital of Catanzaro on 65 patients divided into two datasets: (i) 58 patients (102 runs) and (ii) 39 patients (102 runs), with an overlap of 32 patients between the two groups, where both FFR and iFR measurements were available, for a total of 600 cardiac cycles. A cardiac cycle is a pressure cycle between two consecutive diastolic points. A run is a 6 second time interval.
Two types of experimental tests were performed to measure JLabChart’s calculated values in terms of quality and reliability compared to commercial software. Starting from 600 cardiac cycles, JLabChart identified:
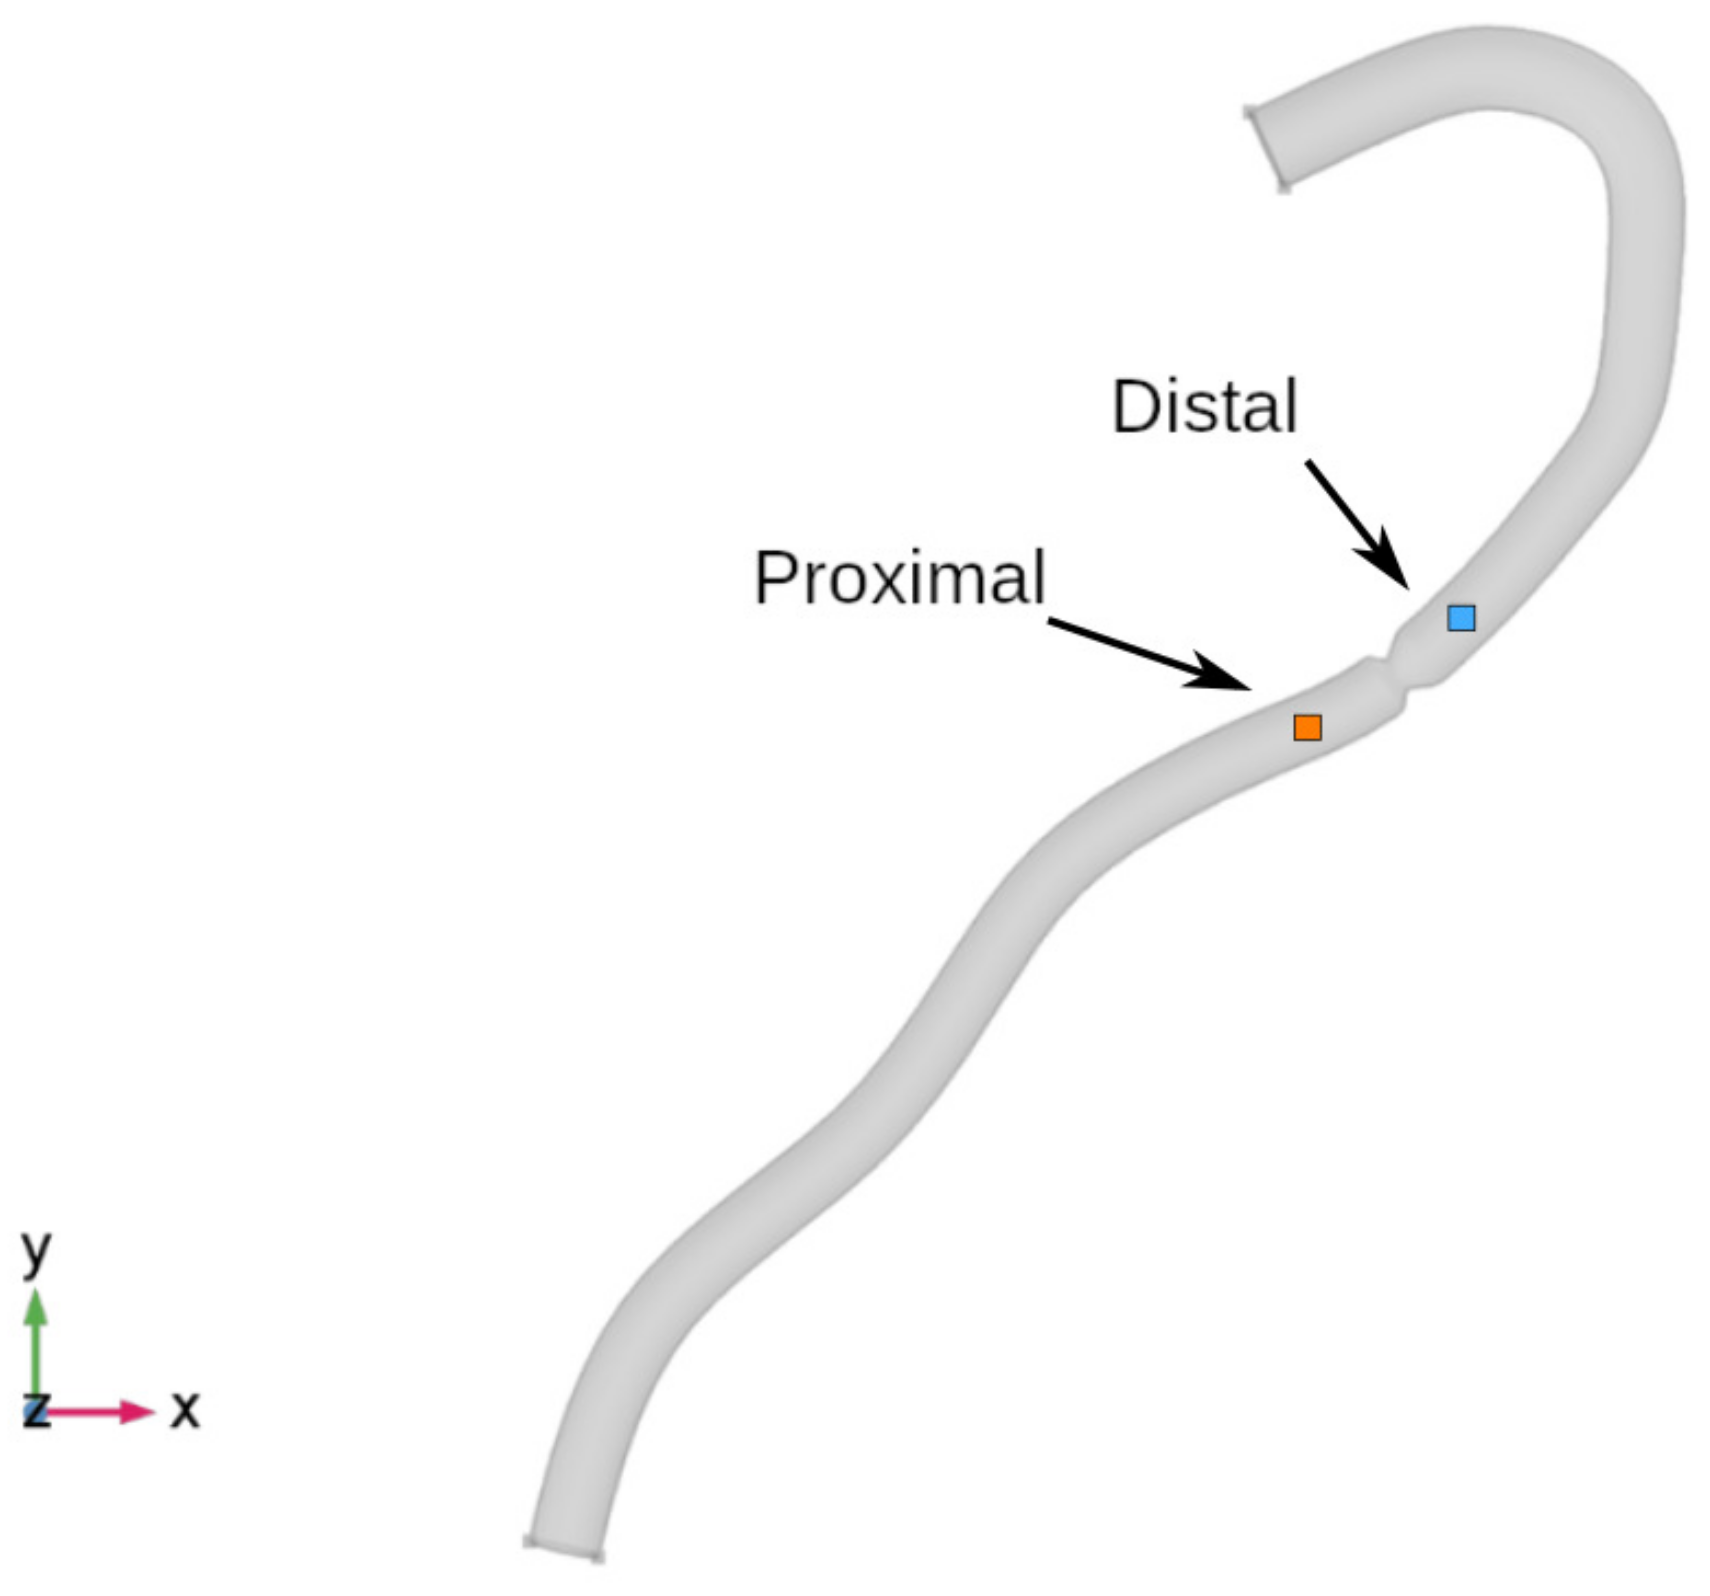
  • 595 recognized cycles in the distal pressure signal;
  • 600 recognized cycles in the proximal pressure signal.
An extract of measures comparing the values (FFR and iFR) calculated with both JLabChart and commercial software is reported in Table 1.
FFR and iFR values calculated with JLabChart and commercial software show that the JLabChart results are reliable and comparable with those obtained by the commercial system. A statistical analysis was performed in order to find the correlations between measures. The analysis included: (i) a correlation plot (Figure 10a and Figure 11a), (ii) a Youden plot (Figure 10b and Figure 11b), and (iii) a Bland–Altman plot (Figure 10c and Figure 11c). These plots report both the FFR and iFR indexes.
The correlation plots in Figure 10a and Figure 11a confirm the strong correlation between the results obtained with the two systems. This is demonstrated by (i) the dissemination degree of the points in the diagram, (ii) a high value of the correlation coefficient (FFR: R p = 0.96 , iFR: R p = 0.998 ), and (iii) a value of the intraclass correlation coefficient (FFR: R I C = 0.96 , iFR: R I C = 0.9796 ), implying an excellent reproducibility of the measurements. Both plots confirm that JLabChart has a robust correlation with commercial software and a high reproducibility between measurements.
In Figure 10b and Figure 11b we report two Youden plots, a type of scatter plot used to visually plot measurement results from multiple instruments on the same graph in order to uncover any bias in measurements and make it easy to detect any differences between JLabChart and the commercial software. The Youden plots showed that the FFR and iFR values from the two tools lay on the bisector line of the first and third quadrants, which proves that the JLabChart FFR (or iFR) values and commercial software FFR or (iFR) values were statistically similar. This means that the FFR and iFR values calculated by JLabChart agreed with the commercial tool.
Lastly, the Bland–Altman plots, also known as difference plots, reported in Figure 10c and Figure 11c plot the FFR and iFR values calculated by JLabChart and the commercial software in order to analyze the agreement between the two different groups of measures. In fact, any two methods designed to measure the same parameter (or property) should have a good correlation when a set of samples is chosen such that the property to be determined varies considerably. Figure 10 and Figure 11 show that the values obtained by using JLabChart are comparable with those of the commercial system, since the data points are around the mean value and are delimited by the standard deviation. The four graphs shown in Figure 12 report our investigation into irregular cardiac frequency recognition, with the aim of identifying the presence of noise as well as extra-systoles or tachycardias (thus, cycles with irregular cardiac frequency were filtered out from the analysis). Irregular cycles were found in nine patients (data points shown in Figure 12). Furthermore, for these patients, new values of iFR were calculated (indicated as iFR*) removing the irregular cycles.
Figure 12 shows the correlation plot and the Bland–Altman plot generated for iFR, considering all the cycles, and for iFR*, considering only the regular cycles, respectively. The experimental results show that the correlation between the values measured with JLabChart and the commercial software was higher when the irregular cycles were eliminated from the dataset (iFR: R p = 0.9784 , R I C = 0.9876 ; iFR*: R p = 0.9814 , R I C = 0.9898 ).
Finally, the tool was tested with synthetic vessels generated using the Comsol [43] software tool. The vessel images were designed with several known measures regarding stenosis, blood flow pressures, and so on. Figure 1 shows one of the 55 Comsol syntetic images used to measure iFR and FFR values. The JLabChart was used on such images, which simulated patients, and the resulting measurements demonstrated that the tool is reliable in terms of measurement and evaluation of iFR and FFR even on synthetic images. Indeed, we performed measurements using both JLabChart and Comsol (latter as correct and. thus, used as the reference) obtaining an average error of 0.05661818 and a standard deviation of 0.07071159, thereby proving JLabChart’s reliability.
The performance improved after the exclusion of the irregular cycles. The correlation plot showed an increased correlation coefficient R p and intraclass correlation coefficient R I C nearer to one. By the Bland–Altman plot, the values of the confidence interval were adjacent to the mean value, and the confidence interval was limited, which implies that the percentage differences are constant and the difference in the values is moderate.

4. Study Limitations

Our study had some limitations. First, JLabChart, in its current form, does not allow realtime analysis of pressure curves during coronary interventions, which de facto limits its usefulness to research applications. However, it might be easily adapted to online use for clinical purposes. In this regard, a potential barrier could be the need to interact with commercial vendors of coronary pressure measurement systems. Second, the clinical validation was retrospective, as we used pressure measurements from an institutional registry. However, it should be noted that all consecutive pressure recordings were included without any selection, so as to limit selection bias. Third, JLabChart is able to automatically recognize pressure data extracted from one commercial vendor (Philips Volcano®, Philips Volcano, Rancho Cordova, CA, USA), while additional vendors offer similar pressure indices. Hence, JLabChart should be integrated with the interface in order to access data from all different vendors. Finally, alternative noninvasive indices have been recently proposed, including a number of angiography-derived indices and CT-derived FFR/iFR estimations. As calculation of pressure indexes from data images requires a different approach, JLabChart is unable to analyze CT- or angiography-derived data to calculate iFR or FFR. However, we have recently developed a computational model to derive pressure indices from coronary angiography [44,45,46,47] and the computational model could be embedded in JLabChart to create a multiple software platform.

5. Conclusions

Pressure signal analysis was implemented to extract relevant features to calculate the value of FFR and iFR indexes. The JLabChart is a freely available software tool, proposed as a diagnostic support for assessing the anatomical and functional state of blood vessels with stenoses. A comparison with a widely used commercial tool was performed, and tests with synthetic vessels and values were added to verify reliability. Our statistical evidence demonstrates the reliability of the JLabChart. The implemented system, which is currently available, can be used in different environments as an efficient tool for the quantitative monitoring of cardiovascular procedures.
Summary points:
  • FFR and iFR are established indexes used to assess severity of coronary stenoses by measuring intra-coronary pressure.
  • Despite their widespread use, not all commercial vendors proved calculates both indexes, hence there is still an unmet need for a tool to calculate all pressure-based indexes accurately.
  • JLabChart also meets the need to calculate both hyperemic (FFR) and non-hyperemic (iFR) coronary pressure-based indexes from retrospective pressure tracings.
  • Measurements performed with JLabChart were first tested by using synthetic images created in a multiphysics modeling environment.
  • Measurements performed with JLabChart were then successfully validated on a retrospective clinical dataset.

Author Contributions

Conceptualization, G.T. and S.D.R. and G.F.; methodology, P.V. (Pierangelo Veltri) and C.I.; software development, P.V. (Pierangelo Veltri) and G.T. and P.H.G.; validation and tests, P.V. (Patrizia Vizza), P.H.G. and S.D.R.; data curation, G.T.; writing—original draft preparation, G.T., P.V. (Pierangelo Veltri) and S.D.R. All authors have read and agreed to the published version of the manuscript.

Funding

Part of this work has been developed to support results for PON VQA research project.

Informed Consent Statement

Informed consent was obtained from all subjects involved in the study.

Data Availability Statement

Anonimized data sample is available from the JLabChart web site (https://sites.google.com/site/jlabchart/home).

Acknowledgments

The authors would like to thank Angela D’Alessio for her contribution to the JLabChart testing phase.

Conflicts of Interest

The authors declare no conflict of interest.

References

  1. Timmis, A.; Townsend, N.; Gale, C.P.; Torbica, A.; Lettino, M.; Petersen, S.E.; Mossialos, E.A.; Maggioni, A.P.; Kazakiewicz, D.; May, H.T.; et al. Atlas Writing Group European Society of Cardiology: Cardiovascular Disease Statistics 2019 (Executive Summary). Eur. Heart J. Qual. Care Clin. Outcomes 2020, 6, 7–9. [Google Scholar] [CrossRef] [PubMed]
  2. Al-Lamee, R.K.; Nowbar, A.N.; Francis, D.P. Percutaneous coronary intervention for stable coronary artery disease. Heart 2019, 105, 11–19. [Google Scholar] [CrossRef] [PubMed]
  3. Iaizzo, P.A. Handbook of Cardiac Anatomy, Physiology, and Devices; Springer: Berlin/Heidelberg, Germany, 2010. [Google Scholar]
  4. Safi, M.; Khaheshi, I.; Eslami, V.; Beheshtian, M.M.; Naderian, M. Impact of Lesion Length on Functional Significance in Intermediate Coronary Lesions. Int. J. Cardiovasc. Pract. 2017, 2, 57–60. [Google Scholar] [CrossRef] [Green Version]
  5. Marcus, M.L.; Skorton, D.J.; Johnson, M.R.; Collins, S.M.; Harrison, D.G.; Kerber, R.E. Visual estimation of precent diameter coronary stenosis: “A battered gold standard”. J. Am. Coll. Cardiol. 1988, 11, 1143. [Google Scholar] [CrossRef] [Green Version]
  6. Pijls, N.H.; Van Gelder, B.; Van der Voort, P.; Peels, K.; Bracke, F.A.; Bonnier, H.J.; El Gamal, M.I. Fractional flow reserve. A useful index to evaluate the influence of an epicardial coronary stenosis on myocardial blood flow. Circulation 1995, 92, 3183–3193. [Google Scholar] [CrossRef] [PubMed]
  7. Pijls, N.H.; De Bruyne, B.; Peels, K.; Van Der Voort, P.H.; Bonnier, H.J.; Bartunek, J.; Koolen, J.J.; Koolen, J.J. Measurement of fractional flow reserve to assess the functional severity of coronary-artery stenoses. N. Engl. J. Med. 1996, 334, 1703–1708. [Google Scholar] [CrossRef]
  8. De Bruyne, B.; Pijls, N.H.; Kalesan, B.; Barbato, E.; Tonino, P.A.L.; Piroth, Z.; Jagic, N.; Möbius-Winkler, S.; Rioufol, G.; Witt, N.; et al. Fractional Flow Reserve-Guided PCI Versus Medical Therapy in Stable Coronary Disease. N. Engl. J. Med. 2012, 36, 991–1001. [Google Scholar] [CrossRef] [Green Version]
  9. Scalise, M.; Torella, M.; Marino, F.; Ravo, M.; Giurato, G.; Vicinanza, C.; Cianflone, E.; Mancuso, T.; Aquila, I.; Salerno, L.; et al. Atrial myxomas arise from multipotent cardiac stem cells. Eur. Heart J. 2020, 41, 4332–4345. [Google Scholar] [CrossRef] [PubMed] [Green Version]
  10. Salatino, A.; Aversa, I.; Battaglia, A.M.; Sacco, A.; Di Vito, A.; Santamaria, G.; Chirillo, R.; Veltri, P.; Tradigo, G.; Di Cello, A.; et al. H-Ferritin Affects Cisplatin-Induced Cytotoxicity in Ovarian Cancer Cells through the Modulation of ROS. Oxidative Med. Cell. Longev. 2019, 2019, 3461251. [Google Scholar] [CrossRef]
  11. Stouffer, G.A. Cardiovascular Hemodynamics for the Clinician; John Wiley and Sons: Hoboken, NJ, USA, 2016. [Google Scholar]
  12. Murtagh, B.; Higano, S.; Lennon, R.; Mathew, V.; Holmes, D.R., Jr.; Lerman, A. Role of incremental doses of intracoronary adenosine for fractional flow reserve assessment. Am. Heart J. 2003, 146, 99–105. [Google Scholar] [CrossRef]
  13. Samady, H.; Gogas, B.D. Does Flow During Rest and Relaxation Suffice? J. Am. Coll. Cardiol. 2013, 61, 1436–1439. [Google Scholar] [CrossRef] [PubMed] [Green Version]
  14. Baumann, S.; Bojara, W.; Post, H.; Rudolph, T.; Schäufele, T.; Ong, P.; Lehmann, R.; Von Zur Mühlen, C.; Universitäts-Herzzentrum Freiburg-Bad Krozingen; Medizinische Fakultät Albert-Ludwigs-Universität Freiburg; et al. Coronary physiology in the catheter laboratory. Herz 2020, 46, 15–23. [Google Scholar] [CrossRef] [PubMed]
  15. Matsuo, H.; Kawase, Y. FFR and iFR guided percutaneous coronary intervention. Cardiovasc. Interv. Ther. 2016, 31, 183–195. [Google Scholar] [CrossRef] [PubMed]
  16. Sen, S.; Escaned, J.; Malik, I.S.; Mikhail, G.W.; Foale, R.A.; Mila, R.; Tarkin, J.; Petraco, R.; Broyd, C.; Jabbour, R.; et al. Development and Validation of a New Adenosine-Independent Index of Stenosis Severity From Coronary Wave—Intensity Analysis. J. Am. Coll. Cardiol. 2012, 59, 1392–1402. [Google Scholar] [CrossRef] [PubMed] [Green Version]
  17. Nijjer, S.; Davies, J. Application of iFR in Clinical Scenarios. In Physiological Assessment of Coronary Stenoses and the Microcirculation; Springer: London, UK, 2017; pp. 233–248. [Google Scholar]
  18. De Rosa, S.; Polimeni, A.; Petraco, R.; Davies, J.E.; Indolfi, C. Diagnostic Performance of the Instantaneous Wave-Free Ratio: Comparison With Fractional Flow Reserve. Circ Cardiovasc. Interv. 2018, 11, e004613. [Google Scholar] [CrossRef] [PubMed]
  19. Kikuta, Y.; Cook, C.M.; Sharp, A.S.P.; Salinas, P.; Kawase, Y.; Shiono, Y.; Giavarini, A.; Nakayama, M.; De Rosa, S.; Sen, S.; et al. Pre-Angioplasty Instantaneous Wave-Free Ratio Pullback Predicts Hemodynamic Outcome In Humans With Coronary Artery Disease: Primary Results of the International Multicenter iFR GRADIENT Registry. JACC Cardiovasc. Interv. 2018, 11, 757–767. [Google Scholar] [CrossRef] [PubMed]
  20. Petraco, R.; van de Hoef, T.P.; Nijjer, S.; Sen, S.; van Lavieren, M.A.; Foale, R.A.; Meuwissen, M.; Broyd, C.; Echavarria-Pinto, M.; Foin, N.; et al. Baseline instantaneous wave-free ratio as a pressure-only estimation of underlying coronary flow reserve results of the JUSTIFY-CFR Study (Joined Coronary Pressure and Flow Analysis to Determine Diagnostic Characteristics of Basal and Hyperemic Indices of Functional Lesion Severity-Coronary Flow Reserve). Circ. Cardiovasc. Interv. 2014, 7, 492–502. [Google Scholar] [PubMed] [Green Version]
  21. Jeremias, A.; Maehara, A.; Généreux, P.; Asrress, K.N.; Berry, C.; Bruyne, B.; Davies, J.E.; Escaned, J.; Fearon, W.F.; Gould, K.L.; et al. Multicenter core laboratory comparison of the instantaneous wave-free ratio and resting Pd/Pa with fractional flow reserve: The RESOLVE study. J. Am. Coll. Cardiol. 2014, 63, 1253–1261. [Google Scholar] [CrossRef] [Green Version]
  22. Indolfi, C.; Mongiardo, A.; Spaccarotella, C.; Torella, D.; Caiazzo, G.; Polimeni, A.; Sorrentino, S.; Micieli, M.; Sabatino, J.; Curcio, A.; et al. The instantaneous wave-free ratio (iFR) for evaluation of non-culprit lesions in patients with acute coronary syndrome and multivessel disease. Int. J. Cardiol. 2015, 178, 46–54. [Google Scholar] [CrossRef]
  23. Darenskiy, D.; Gramovich, V.; Mitroshkin, M.; Sergienko, V.; Zharova, E.; Matchin, Y. Instantaneous wave-free ratio is not inferior to fractional flow reserve for assessment of intermediate coronary artery stenoses. J. Am. Coll. Cardiol. 2016, 67, 397. [Google Scholar] [CrossRef]
  24. Petraco, R.; Javier, E.; Justin, D. Validation of iFR: Clinical registries. In Physiological Assessment of Coronary Stenoses and the Microcirculation; Springer: London, UK, 2017; pp. 225–231. [Google Scholar]
  25. Man, W.; Hu, J.; Zhao, Z.; Zhang, M.; Wang, T.; Lin, J.; Duan, Y.; Wang, L.; Wang, H.; Sun, D.; et al. Diagnostic performance of instantaneous wave-free ratio for the evaluation of coronary stenosis severity confirmed by fractional flow reserve: A PRISMA-compliant meta-analysis of randomized studies. Medicine 2016, 95, e4774. [Google Scholar] [CrossRef] [PubMed]
  26. Davies, J.E.; Sen, S.; Dehbi, H.M.; Al-Lamee, R.; Petraco, R.; Nijjer, S.S.; Bhindi, R.; Lehman, S.J.; Walters, D.; Sapontis, J.; et al. Use of the Instantaneous Wave-free Ratio or Fractional Flow Reserve in PCI. N. Engl. J. Med. 2017, 376, 1824–1834. [Google Scholar] [CrossRef] [PubMed] [Green Version]
  27. Gotberg, M.; Christiansen, E.H.; Gudmundsdottir, I.J.; Sandhall, L.; Danielewicz, M.; Jakobsen, L.; Olsson, S.E.; Öhagen, P.; Olsson, H.; Omerovic, E.; et al. iFR-SWEDEHEART Investigators. Instantaneous Wave-free Ratio versus Fractional Flow Reserve to Guide PCI. N. Engl. J. Med. 2017, 376, 1813–1823. [Google Scholar] [CrossRef] [PubMed] [Green Version]
  28. Hoole, S.P.; Seddon, M.D.; Poulter, R.S.; Starovoytov, A.; Wood, D.A.; Jacqueline, S. Development and validation of the fractional flow reserve (FFR) angiographic scoring tool (FAST) to improve the angiographic grading and selection of intermediate lesions that require FFR assessment. Coron. Artery Dis. 2012, 23, 45–50. [Google Scholar] [CrossRef]
  29. Nijjer, S.S.; Sen, S.; Petraco, R.; Sachdeva, R.; Cuculi, F.; Escaned, J.; Broyd, C.; Foin, N.; Hadjiloizou, N.; Foale, R.A.; et al. Improvement in coronary haemodynamics after percutaneous coronary intervention: Assessment using instantaneous wave-free ratio. Heart 2013, 99, 1740–1748. [Google Scholar] [CrossRef] [PubMed] [Green Version]
  30. Cook, C.M.; Ahmad, Y.; Shun-Shin, M.J.; Nijjer, S.; Petraco, R.; Al-Lamee, R.; Mayet, J.; Francis, D.P.; Sen, S.; Davies, J.E. Quantification of the Effect of Pressure Wire Drift on the Diagnostic Performance of Fractional Flow Reserve, Instantaneous Wave-Free Ratio, and Whole-Cycle Pd/Pa. Circ. Cardiovasc. Interv. 2016, 9, e002988. [Google Scholar] [CrossRef] [PubMed] [Green Version]
  31. Va not Veer, M.; Pijls, N.H.J.; Hennigan, B.; Watkins, S.; Ali, Z.A.; De Bruyne, B.; Zimmermann, F.M.; van Nunen, L.X.; Barbato, E.; Berry, C.; et al. Comparison of Different Diastolic Resting Indexes to iFR: Are They All Equal? J. Am. Coll. Cardiol. 2017, 70, 3088–3096. [Google Scholar] [CrossRef] [PubMed]
  32. Morioka, Y.; Arashi, H.; Otsuki, H.; Yamaguchi, J.; Hagiwara, N. Relationship between instantaneous wave-free ratio and fractional flow reserve in patients receiving hemodialysis. Cardiovasc. Interv. Ther. 2018, 33, 256–263. [Google Scholar] [CrossRef]
  33. Rivero, F.; Cuesta, J.; Bastante, T.; Benedicto, A.; Fernández-Pérez, C.; Antuña, P.; García-Guimaraes, M.; Alfonso, F. Reliability of physiological assessment of coronary stenosis severity using intracoronary pressure techniques: A comprehensive analysis from a large cohort of consecutive intermediate coronary lesions. EuroIntervention 2017, 13, 193–200. [Google Scholar] [CrossRef]
  34. Harle, T.; Meyer, S.; Vahldiek, F.; Elsasser, A. Differences between automatically detected and steady-state fractional flow reserve. Clin. Res. Cardiol. 2016, 105, 127–134. [Google Scholar] [CrossRef]
  35. Tradigo, G.; Vizza, P.; Fragomeni, G.; Veltri, P. On the reliability of measurements for a stent positioning simulation system. Int. J. Med. Inform. 2019, 123, 23–28. [Google Scholar] [CrossRef] [PubMed]
  36. Moser, D.K.; Riegel, B. Cardiac Nursing: A Companion to Braunwald’s Heart Disease; Elsevier Health Sciences: Amsterdam, The Netherlands, 2007. [Google Scholar]
  37. Miller, G. Fundamentals of Biomedical Transport Processes; Morgan and Claypool Publishers: Williston, VT, USA, 2010. [Google Scholar]
  38. Caroprese, L.; Veltri, P.; Vocaturo, E.; Zumpano, E. Deep learning techniques for electronic health record analysis (2019). In Proceedings of the 2018 9th International Conference on Information, Intelligence, Systems and Applications, IISA, Zakynthos, Greece, 23–25 July 2018. [Google Scholar]
  39. Escaned, J.; Echavarría-Pinto, M.; Garcia-Garcia, H.M.; Van de Hoef, T.P.; De Vries, T.; Kaul, P.; Raveendran, G.; Altman, J.D.; Kurz, H.I.; Brechtken, J.; et al. Prospective Assessment of the Diagnostic Accuray of Instantaneous Wave-Free Ratio to Assess Coronary Stenosis Relevance: Results of ADVISE II International, Multicenter Study (ADenosine Vasodilator Independent Stenosis Evaluation II. JACC Cardiovasc. Interv. 2015, 8, 824–833. [Google Scholar] [CrossRef] [Green Version]
  40. Adiputra, Y.; Chen, S.L. Clinical Relevance of Coronary Fractional Flow Reserve: Art-of-state. Chin. Med. J. 2015, 128, 1399–1406. [Google Scholar] [CrossRef] [PubMed]
  41. Sen, S.; Asrress, K.N.; Nijjer, S.; Petraco, R.; Malik, I.; Foale, R.A.; Mikhail, G.W.; Foin, N.; Broyd, C.; Hadjiloizou, N.; et al. Diagnostic Classification of the Instantaneous Wave-Free Ratio is Equivalent to Fractional Flow Reserve and Is Not Improved with Adenosine Administration. J. Am. Coll. Cardiol. 2013, 61, 1409–1420. [Google Scholar] [CrossRef] [Green Version]
  42. Vizza, P.; Curcio, A.; Tradigo, G.; Indolfi, C.; Veltri, P. A framework for the atrial fibrillation prediction in electrophysiological studies. Comput. Methods Programs Biomed. 2015, 120, 65–76. [Google Scholar] [CrossRef]
  43. Comsol Multiphysics. Available online: https://www.comsol.it/ (accessed on 6 March 2022).
  44. Caruso, M.V.; De Rosa, S.; Indolfi, C.; Fragomeni, G. Computational analysis of stenosis geometry effects on right coronary hemodynamics. Annu. Int. Conf. IEEE Eng. Med. Biol. Soc. 2015, 2015, 981–984. [Google Scholar] [CrossRef] [PubMed]
  45. Gaudio, L.T.; Caruso, M.V.; De Rosa, S.; Indolfi, C.; Fragomeni, G. Different Blood Flow Models in Coronary Artery Diseases: Effects on hemodynamic parameters. Proc. IEEE Annu. Int. Conf. Eng. Med. Biol. Soc. 2018, 1, 3185–3188. [Google Scholar] [CrossRef]
  46. Gaudio, L.T.; Veltri, P.; De Rosa, S.; Indolfi, C.; Fragomeni, G. Model and Application to Support the Coronary Artery Diseases (CAD): Development and Testing. Interdiscip. Sci. 2020, 12, 50–58. [Google Scholar] [CrossRef]
  47. Kukic, P.; Mirabello, C.; Tradigo, G.; Walsh, I.; Veltri, P.; Pollastri, G. Toward an accurate prediction of inter-residue distances in proteins using 2D recursive neural networks. BMC Bioinform. 2014, 5, 15. [Google Scholar] [CrossRef] [PubMed] [Green Version]
Figure 1. Proximal and distal virtual measurement points inside the vessel model reconstructed in Comsol.
Applsci 12 03448 g001
Figure 2. Blood pressure signal (top) and its corresponding ECG signal (bottom).
Applsci 12 03448 g002
Figure 3. Dicrotic notch point and wave-free period characteristics in the blood pressure signal.
Applsci 12 03448 g003
Figure 4. Graphical representation of Fractional Flow Reserve (FFR). (a) FFR represented graphically in the vessels; (b) FFR as the ratio between maximum blood flow distal to a stenotic lesion to normal maximum flow in the same vessel.
Applsci 12 03448 g004
Figure 5. Instantaneous wave-free ratio (iFR) as the ratio of the distal coronary pressure to the pressure in the aorta over a specific period in diastole.
Applsci 12 03448 g005
Figure 6. JLabChart website, available at https://sites.google.com/site/jlabchart/home.
Applsci 12 03448 g006
Figure 7. JLabChart download page.
Applsci 12 03448 g007
Figure 8. JLabChart system architecture.
Applsci 12 03448 g008
Figure 9. JLabChart Software tool. User interface with various visual and numerical signal analyses.
Applsci 12 03448 g009
Figure 10. Statistical analysis results for the FFR index between commercial software and JLabChart.
Applsci 12 03448 g010
Figure 11. Statistical analysis results for the iFR index between commercial software and JLabChart.
Applsci 12 03448 g011
Figure 12. Correlation plot and Bland–Altman for iFR and iFR*. (a) Correlation plot for iFR. (b) Bland–Altman plot for iFR. (c) Correlation plot for iFR*. (d) Bland–Altman plot for iFR*.
Applsci 12 03448 g012
Table 1. FFR and iFR values extracted by commercial software ( FFR c , iFR c ) and JLabChart ( FFR j , iFR j ).
ID_Patient FFR c FFR j iFR c iFR j
10.770.790.900.91
20.850.870.870.88
30.870.880.900.89
40.820.840.740.77
50.840.850.970.97
60.700.720.770.76
70.960.960.970.94
80.750.870.850.84
90.660.670.520.55
100.730.770.840.85
110.910.930.990.96
120.820.840.740.77
130.730.790.950.94
140.790.830.950.94
150.800.950.950.96
160.710.730.910.93
170.910.940.910.90
180.970.980.990.98
190.760.770.880.90
200.970.980.980.97
210.810.890.690.70
220.710.730.870.78
230.900.900.960.95
240.850.860.980.97
250.800.820.900.90
260.800.820.960.98
27
Publisher’s Note: MDPI stays neutral with regard to jurisdictional claims in published maps and institutional affiliations.

