
An Information-Theoretic Approach for Detecting Community Structure Based on Network Representation


School of Software Engineering, South China University of Technology, Guangzhou 510006, China
*
Author to whom correspondence should be addressed.
Appl. Sci. 2022, 12(9), 4203; https://0-doi-org.brum.beds.ac.uk/10.3390/app12094203
Submission received: 16 March 2022
/
Revised: 20 April 2022
/
Accepted: 20 April 2022
/
Published: 21 April 2022
(This article belongs to the Special Issue Selected Papers from FCPAE2022 and 4th International Conference on Artificial Intelligence and Advanced Manufacturing (AIAM2022))
Abstract
:Community structure is a network characteristic where nodes can be naturally divided into densely connected groups. Community structures are ubiquitous in social, biological, and technological networks. Revealing community structure in the network helps in the understanding of the topological associations and interactions of elements in the network, as well as helping to mine their potential information. However, this has been proven to be a difficult challenge. On the one hand, this is because there is no unified definition of the quality of a community; on the other hand, due to the complexity of the network, it is impossible to traverse all the possibilities of community partitions to find the best one. Aiming at performing high-accuracy community detection, an information-theoretic approach AMI-NRL was proposed. The approach first constructs a community evolution process based on the representation of the target network, then finds the most stable community structure during the evolution using an average-mutual-information-based criterion. The experiments show that the approach can effectively detect community structures on real-world datasets and synthetic datasets.
1. Introduction
A network topology diagram (or network diagram for short) is an abstract representation of systems and structures that commonly exist in the real world. In a network diagram, a node represents an individual or element in the system, and an edge represents the relationship between individuals or elements. It has been shown that some nodes in the network are more closely connected to each other than to the other parts of the network, and therefore these nodes can be regarded as an independent part, called a community [1]. Community structures reflect the local topological features and the relationships between elements. Thus, detecting communities in a network diagram becomes an indispensable step in understanding the maintenance and evolution of a network, and this can be applied to the analysis and prediction of the real-world network systems. For example, constructing a recommendation system on the basis of the community detection of friend relationship networks and identifying advertising marketing behaviors and telecom frauds by detecting abnormal links between communities in a telecommunication network [2].
However, finding the community structure accurately in the network has been proven to be a difficult task. This is mainly due to two reasons, one being the ambiguity definition of the pros and cons of a community, and the other being that there are an exponentially large number of possible community partitions [1]. For the former, although researchers generally reach a consensus that a community is a cluster of nodes with closer internal connections than external connections, different researchers use different indexes to define and measure this closeness, including the well-known modularity. However, these indexes cannot be accurate in all cases. For example, modularity has a resolution limit problem, meaning that in some cases, multiple small communities may be unreasonably identified as one large community. Moreover, there is an exponentially large number of possible community partitions for a network, which makes it impossible to find the optimal by traversing all community partitions under the current computing power. Researchers are trying to find the best partition in a limited search space through various methods of transforming a partition, but there is no guarantee of finding the optimal one.
Aiming at these two aspects, a typical community detection algorithm usually includes two parts: one is a community evaluation index, such as modularity, used to evaluate the quality of community partition; the other is a certain method, such as top-down split in GN [3] and LFM algorithms [4], constantly changing the community partition and trying to obtain the maximum value of the community evaluation index. However, for the former, the community evaluation indexes used by the existing algorithms are still inaccurate, which makes the results obtained by these algorithms sets far from ground truth on many real-world datasets. For the latter, the search space of the algorithm is too large, and thus the algorithm cannot efficiently find the optimal community, and sometimes even falls into a local optimum. In recent years, researchers have devoted more attention to studying how to extract the structural information of networks by means of network representation learning, as well as the relationship between the vectorial representation and the original structure of the network. Work in this area includes using community labels to improve network representation algorithms [5,6], as well as using network representation to improve the accuracy of community detection [6]. Inspired by these studies, we propose a new approach, AMI-NRL. The main idea is to simulate the evaluation process of communities in the real world by network representation learning (NRL) and clustering, then trying to find the most stable state in the process, under the guidance of the community evaluation index on the basis of average mutual information (AMI). The stable state will be output as the result of community detection. Compared with the existing methods, the AMI-NRL does not measure the quality of static community structure but judges the stability through the community structure evolution, which gains more accurate results. In addition, by introducing network representation learning for preprocessing, the search space is greatly reduced in terms of revealing community structures at multiple granularities, which brings about higher scalability.
The main contributions of this paper are as follows:
- An average mutual-information-based community evaluation index is proposed, which is applicable to top-down community evolution processes and bottom-up community evolution processes. By calculating the average mutual information and information entropy of adjacent states, the AMI-based community evaluation index can measure the stability of each state of a community evolution process.
- An information-theoretic approach based on network representation named AMI-NRL is proposed. This approach combines network representation and the AMI-based community evaluation index to achieve stable and accurate community detection.
- Experiments were conducted to verify the accuracy and stability of the approach, in comparison with typical community detection algorithms on real-world and synthetic datasets.
The rest of this paper is organized as follows: Section 2 summarizes the current research on community detection. Section 3 introduces and explains in detail the AMI-NRL approach. Section 4 shows the experiments conducted to verify the effectiveness of the algorithm. Section 5 concludes the article and provides a prospect of our research.
2. Related Work
The current research on community detection mainly focuses on finding community structures from multiple types of networks. Depending on the type of community structure, they can be divided into overlapping/non-overlapping community detection. Depending on the type of networks, they can be divided into algorithms for static/dynamic, directed/undirected, weighted/unweighted networks, etc. [1]. The design of a community detection method mainly includes two parts—one is an index to evaluate a given community partition, the other is a specific method of community division. The former evaluates the strengths and weaknesses of a community partition, and the latter finds the best partition of a network by certain steps or processes according to the guidance of the former.
In the community evaluation index, the most widely used is Girvan and Newman’s modularity [3], which is applied in their GN algorithm and the fast Newman algorithm. Modularity brings about an unprecedented development on static non-overlapping community detection algorithms, but the resolution limit of it [7] makes traditional modularity-based approaches unable to obtain ideal community partitions in many cases, and even sometimes leads to obviously unreasonable results. Besides the modularity method, a variety of other types of community evaluation indexes have also been proposed for overlapping or non-overlapping community detection. The two-layer coding method of Rosvall et al. [8] transforms the community partitioning problem into an information compression problem. This method considers that the average coding length of nodes for a random walking in the network can be used to measure the quality of a partition. The accuracy of the method is time-dependent, and more iterations will provide more accurate results. By evaluating the stability of random walks in the network, the stability index [9] proposed by Lambiotte et al. can also be used to evaluate the quality of community partition. The hyperparameter of the stability metric determines on what time scale the index will measure the random walking, but it is difficult to determine what value t should be chosen for t in different networks. Unlike the above research, we introduce the average mutual information (AMI) by the inspiration of information theory and system stability in order to measure the stability of communities during the evolution process of them, as well as to propose an AMI-based community evaluation index aiming at obtaining accurate, stable, and unique results.
In terms of the method of community division, many types of methods have been successively proposed and coordinated with the community evaluation index in order to detect communities in networks. The top-down splitting method, for example, the GN algorithm [3], continuously deletes edges in the network until all edges are deleted, finding the optimal state as the final result using the community evaluation index. The efficiency of the GN algorithm is low, due to a large time cost calculating the edge-betweenness when the network is large. The bottom-up aggregation method initializes the network that each node is a separated community, and then pairs of communities are continuously selected to merge until the entire network finally forms a large community; following this, a community evaluation index is used to search the optimal state as the result in this process. For example, the FN algorithm [10], the CNM algorithm [11], the fast-unfolding algorithm (also known as the Louvain algorithm) [12], and the Infomap algorithm [8] are specific methods for generating community partitions using a bottom-up aggregation idea. Such types of methods are faster and more efficient, but the accuracy is also low because the deviation tends to widen from the previous state to next state during the aggregation process. The label propagation method detects the communities by first labeling some nodes and propagating labels between nodes by the similarity of two nodes, such as the COPRA algorithm [13] and the CLPA-GNR algorithm [14]. These types of algorithms are characterized by high operating efficiency but are less stable. On the basis of the idea of local optimization, local expansion methods follow the idea starting from multiple nodes and greedily expand to their neighborhoods until the specified community boundary conditions are reached, thereby obtaining overlapping/non-overlapping community partitions. Examples are LFM [4] and GCE [15]. This type of method can be effectively applied to detect overlapping communities, but it is easy for it to fall into local optima due to the difficulty in dealing with global information in the process of expansion. Heuristic methods are also used for community detection. Infomap [16] proposed by Rosvall et al. encodes and compresses the network information and obtains the optimal community partitioning by simulated annealing. The clone selection algorithms such as CSA-Net [17] can be applied to detect community structures in complex networks at multiple resolutions. However, such algorithms often have multiple adjustable parameters. It is difficult to determine appropriate parameter values, and it is also easy to obtain trapping in the local optimum. The random-walking methods obtain structural information such as the closeness of the connections between nodes (or node correlation) through random walks in the network, and then are based on this structural information (or the preset community evaluation index) to detect communities. An example is the community detection algorithm based on positive and negative links [18] proposed by Su et al. Such a type of method is difficult to distinguish between the two partitions with similar community structures, which leads to the failure of finding the best partition. Recently, some motif-based methods have been proposed that focus on the higher-order structural characteristics of the network, e.g., EdMot [19] proposed by Pei-Zhen Li et al. Such methods have high efficiency, especially in large neural networks and collaboration networks, but have a lack of accuracy on unweighted and undirected networks compared with other methods.
In recent years, researchers have devoted more attention to studying how to extract the structural information of networks by means of network representation learning, such as ComE [6], which constructs the “community detection–community representation–node representation” closed-loop framework, and MemeRep [20], which uses network representation to optimize the modularity density. Although gaining of a better representation of a network has been extensively studied in the literature, the issue of how to obtain accurate partitioning by using the representation has not gained much attention, while the community partitions are straightway obtained by clustering the representation vectors using methods such as K-means or DBSCAN, which lead to multiple results depending on the parameters and initialization methods. Our research pays more attention to how to use the network representation obtained to get a community partition with higher stability and accuracy. In our approach, a bottom-up community evolution process is generated using the representation of the target network, so that the most stable state of the process can be found as the optimal partition, by the usage of the AMI-based community evaluation index.
3. The Approach
3.1. Community Evaluation Index Based on Average Mutual Information
The community evaluation index is used to measure the quality of a partition for a specific network. The approach uses a community evaluation index based on average mutual information (AMI) to measure the stability of each state of a bottom-up cohesion or top-down division community evolution process by calculating the average mutual information and information entropy of adjacent states, which finally leads to the optimal community partition of such a process.
Definition 1.
Community evolution process of top-down division.
In a community evolution process: ; each state is a community partition. If adjacent partitions and satisfy
where and denote communities in a partition, is an integer, and , then community evolution process is named a top-down division community evolution process. In other words, partition comes from where one or several of the communities split into more communities.
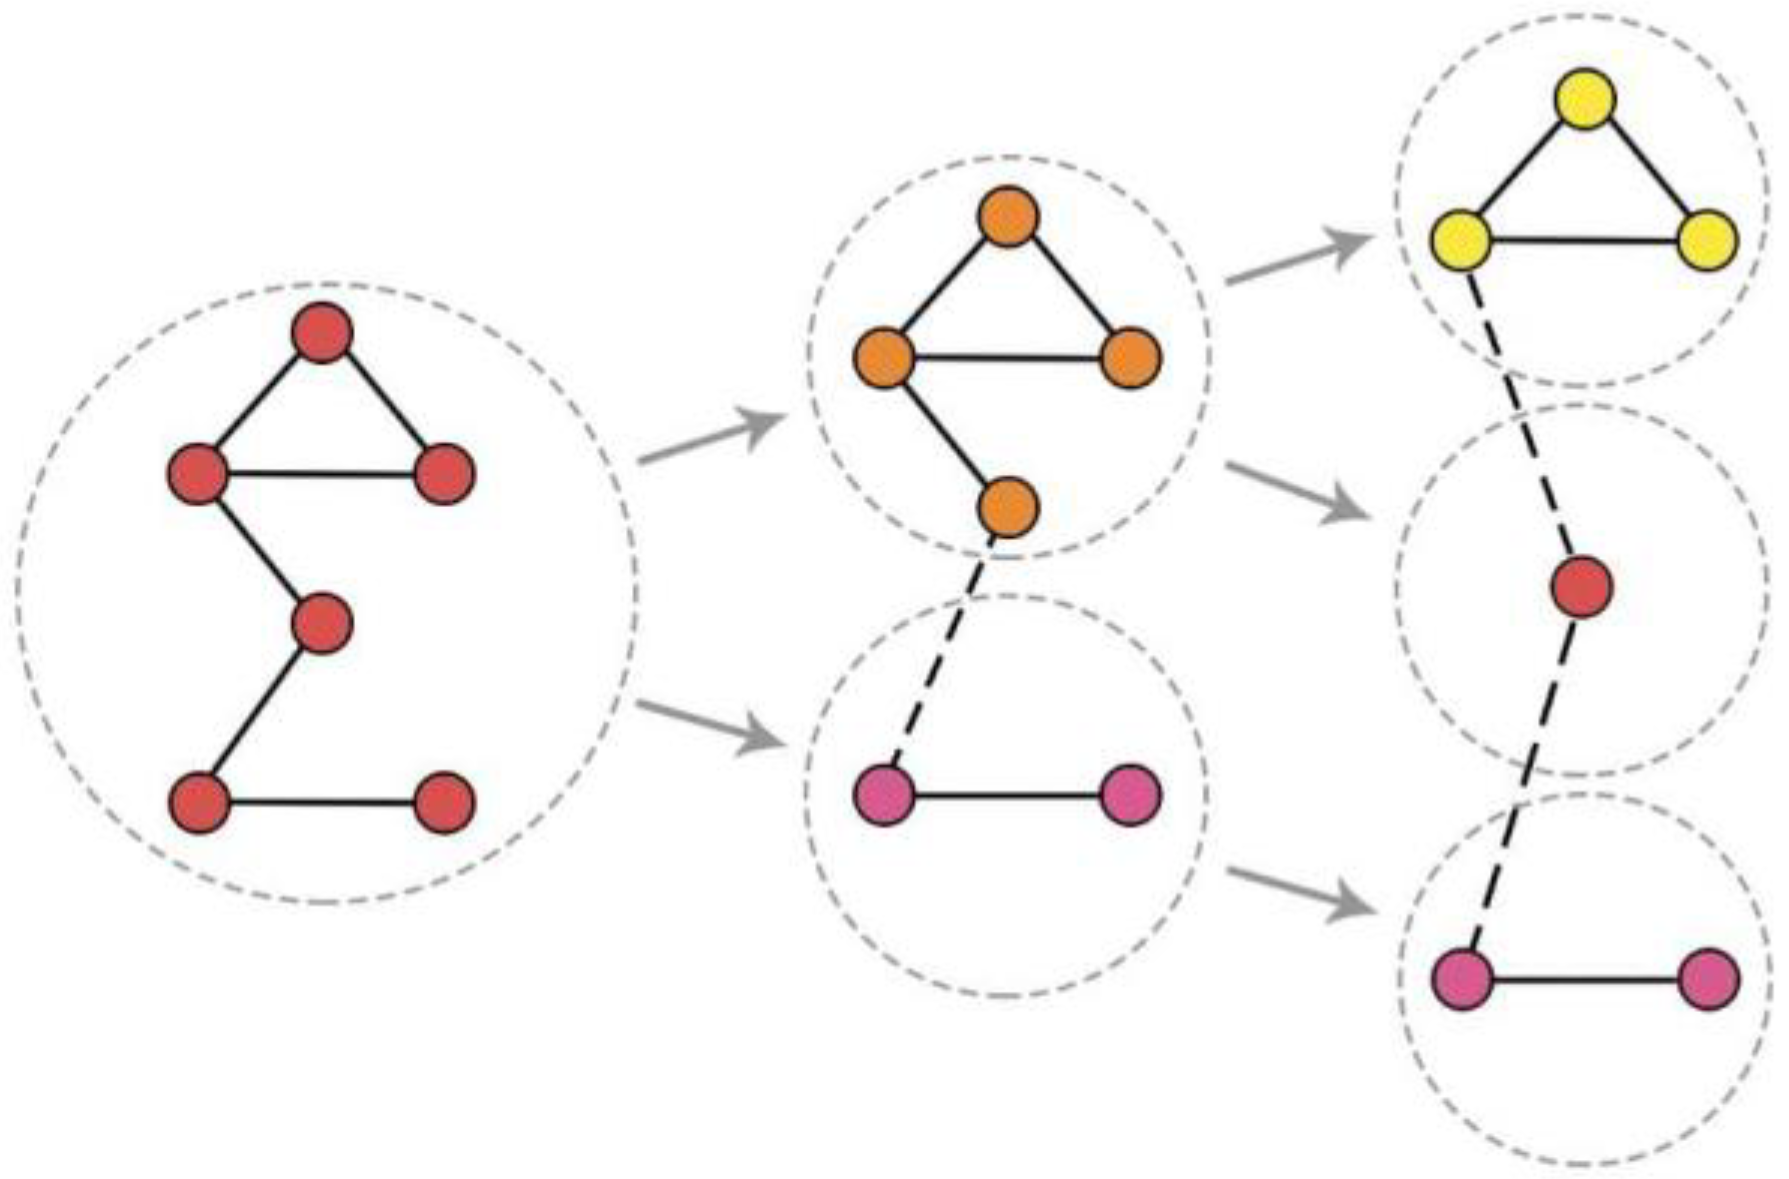
Figure 1 shows an example of community evolution process of top-down division.
Definition 2.
Community evolution process of bottom-up cohesion.
Correspondingly, if adjacent partitions and satisfy
then community evolution process is named a community evolution process of bottom-up cohesion. In other words, partition comes from , where some of the communities merge into one.
For a partition in a bottom-up cohesion or top-down division community evolution process, the community evaluation index based on AMI is defined as
where and are the AMI value between the partition of current state with that of the previous state, and that of the next state, respectively. is the entropy of , and is the scale factor. Better results can be achieved in our experiments when setting to the total number of nodes of the target network.
The community evaluation index can be used to measure the stability of each state. This is because when a state has a high AMI-value with its adjacent states and a low entropy, it is considered instantaneously stable on the category of information theory.
Since the essence of a community is a node set and the essence of a partition is a set of communities, the AMI value between two partitions and () can be calculated using the AMI formula between sets, namely,
where , which denotes the th community in partition ; , which denotes the th community in partition . denotes the mutual information between communities and , and denotes the relevancy degree between communities and , which is defined as
Consider a top-down division community evolution process . Since states of such a process are essentially partitions, there are only three possible cases for a pair of random communities :
- 1.
- , which denotes that in partitions and , the member nodes of communities and are totally the same. and are actually the same community, which remain unchanged in two states.
- 2.
- , which denotes that community in partition comes from a splitting community in partition .
- 3.
- , which denotes that in partitions and , the member nodes of and are totally different; in other words, the two communities have no relations on the timeline.
For Case 1, .
For Case 2, , where and are, respectively, the number of member nodes of communities and .
For Case 3, .
From Equations (4) and (5), we can further derive that in Case 3 is 0, but in Case 1 and 2, the value of still needs to be calculated to obtain . To achieve this, we use the following formula:
where , . denotes the probability of taking a random node, and it belongs to community .
Thus, , where is the number of the member nodes of community , and is the total number of nodes of the whole network.
denotes the probability of taking a random node, and it does not belong to community . Thus, .
and can be calculated in a similar way.
denotes the probability of taking a random member node of community , and it is also a member node of community . Therefore,
For Case 1 and Case 2, if a node does not belong to community , then it certainly cannot belong to community . Therefore, .
For a community evolution process of bottom-up cohesion, by inverting its states, it can be transformed into a top-down division community evolution process. For instance, if is a bottom-up cohesion community evolution process, then is its corresponding top-down division community evolution process. Thereby, the AMI value of any pair of the adjacent states of it can be calculated by the method above. Here, we do not go into detail.
After the AMI value of the adjacent partitions, the entropies of each partition also need to be calculated.
For partition , the entropy of it is defined as
where denotes the th community of partition .
Finally, the community evaluation index of each state in the community evolution process can be calculated. The state that has the largest is the best partition in the community evolution process.
3.2. Basic Process of the Approach
The basic idea of AMI-NRL is to form a community evolution process using the representation of the nodes and then to select the most stable partition in process as the final result. The following steps show the basic process of the approach:
- Random walks through out the network, recording the passing nodes to obtain the node sequences.
- Obtaining the vectorial representation of each node by inputting these sequences into the Word2vec model.
- Cluster these vectors with aggregation hierarchical clustering, regarding the clusters as communities, in order to form a bottom-up cohesion community evolution process
- Calculating the AMI value of each two adjacent partitions, as well as the entropy of each partition.
- Calculating the value of each partition and selecting the partition with largest to output as the result partition.
Steps 1 and 2 are used to obtain the representation of each node of the network using Deepwalk [21]. We conducted experiments on a number of different network representation learning methods, including Deepwalk [21], Node2Vec [22], Walklets [23], NMFADMM [24], NetMF [25], GLEE [26], RandNE [27], BoostNE [28], and GraRep [29]. By comparing the results of applying them to our approach, we finally selected Deepwalk because of its clearer and more stable boundaries in its clustering results on multiple real-world datasets.
In Step 1, a random walk iteration of times is designed. According to our experiments, better results can be achieved in our experiments when setting from 10 to 25. In each iteration, each node of the network is correspondingly set as the starting point of the random walker. Then, it randomly moves to its neighboring nodes equiprobably. After moves, it generates node sequences with length . In our experiments, we found that for larger networks, larger values were needed to be set. Step 1 finally generates node sequences with length .
In Step 2, the sequences are input into the Skip-gram model, which is a two-layer neural network used in Word2vec. In the training phase, a specific node is input at one time, and the model is required to output the predict nodes accurately within its window, that is, the context of the input node. After multiple iterations, a weight matrix from the input layer to the hidden layer can be learned. Each row of the weight matrix represents the weight of each node in the input layer corresponding to the neurons in the hidden layer. This is a vectorial representation of the node. A good result can be obtained by setting the context window size to 7 and the number of hidden-layer neurons to 50.
After obtaining the representation of the nodes, Step 3 performs an agglomerative hierarchical clustering on them to construct a bottom-up cohesion community evolution process. While clustering, Euclidean distance and Ward’s method [30] are used to calculate the distance between vectors and between clusters, respectively. The hierarchical clustering will produce a dendrogram. Each layer of the dendrogram naturally corresponds to a community partition. In adjacent layers, there will be a pair of communities merged into one. A bottom-up cohesion community evolution process can be generated in this way.
Finally, in Steps 4 and 5, by using the community evaluation index based on AMI, the value of each partition of the process is calculated. The partition with largest value is selected as the result of community detection.
The pseudo code of the implemented approach is shown in Algorithm 1:
| Algorithm 1 AMI-NRL | |
| Input: The original network ; | |
| Output: The optimal partition of network ; | |
| 1: | for to do |
| 2: | for to do |
| 3: | Perform a random walk of length started with node ; |
| 4: | Save random walk sequence into list_seq; |
| 5: | end for |
| 6: | end for |
| 7: | model Word2Vec(list_seq, size=neurons_size, window=window_size); |
| 8: | embeddings model.get_embeddings(); |
| 9: | Perform an aggregation hierarchical clustering with embeddings; |
| 10: | Save each state of the aggregation hierarchical clustering into list_partition; |
| 11: | for to do |
| 12: | list_AMI[] average mutual information of list_partition[], list_partition [+1]; |
| 13: | end for |
| 14: | for to do |
| 15: | entropy_i entropy of list_partition[]; |
| 16: | Calculate community evaluation index using max(list_AMI[-1], list_AMI[]) and entropy_i; |
| 17: | if max_Q then |
| 18: | max_Q ; |
| 19: | opt_i ; |
| 20: | end if |
| 21: | end for |
| 22: | return list_partition[opt_i] |
4. Experiments
This section shows the implementation of the approach and experimentally verifies its accuracy. Three real-world networks of different sizes and LFR synthetic networks were selected for the experiments. These datasets and corresponding parameters are specifically described in Table 1. Since these four datasets involved ground-truth labels, we used the number of communities (CN) and normalized mutual information (NMI) as evaluation indicators and compared them with other community detection algorithms in order to evaluate the accuracy of the approach.
4.1. Datasets and Experimental Parameters
The datasets used in the experiment include the Karate Club [31], Dolphins [32], Polbooks, Polblogs [33], and LFR benchmark [34]. In the first four are real-world datasets, the last one generates synthetic networks with given parameters.
Table 1 lists the main properties of datasets, as well as the experimental parameters including random-walk length, number of iterations, and dimensions of vectors.
4.2. Benchmarks
To verify the accuracy of the algorithm, we considered both the number of communities (CN) and normalized mutual information (NMI).
NMI evaluates the difference between two partitions on the basis of information theory; therefore, it can be used as an index aiming at evaluating the accuracy of community detection, which is introduced in [35].
The formula of NMI is shown as follows:
where and are the number of communities of partitions and , respectively. is a confusion matrix that indicates the number of nodes that belong to a pair of communities at the same time. Specifically, denotes the number of nodes simultaneously belonging to community in partition and community in partition . and denote the sum of all elements of a row and a column, respectively, in matrix . and denote the number of communities of partitions and , respectively. NMI measures the similarity of two community partitions; it is equal to 1 if the two partitions are identical, and it is close to 0 if they are quite dissimilar.
4.3. Results
This section shows the results of applying AMI-NRL to the networks, compared with community detection algorithms including GN [3], FN [9], Louvain [12], IE [36], and EdMot [19].
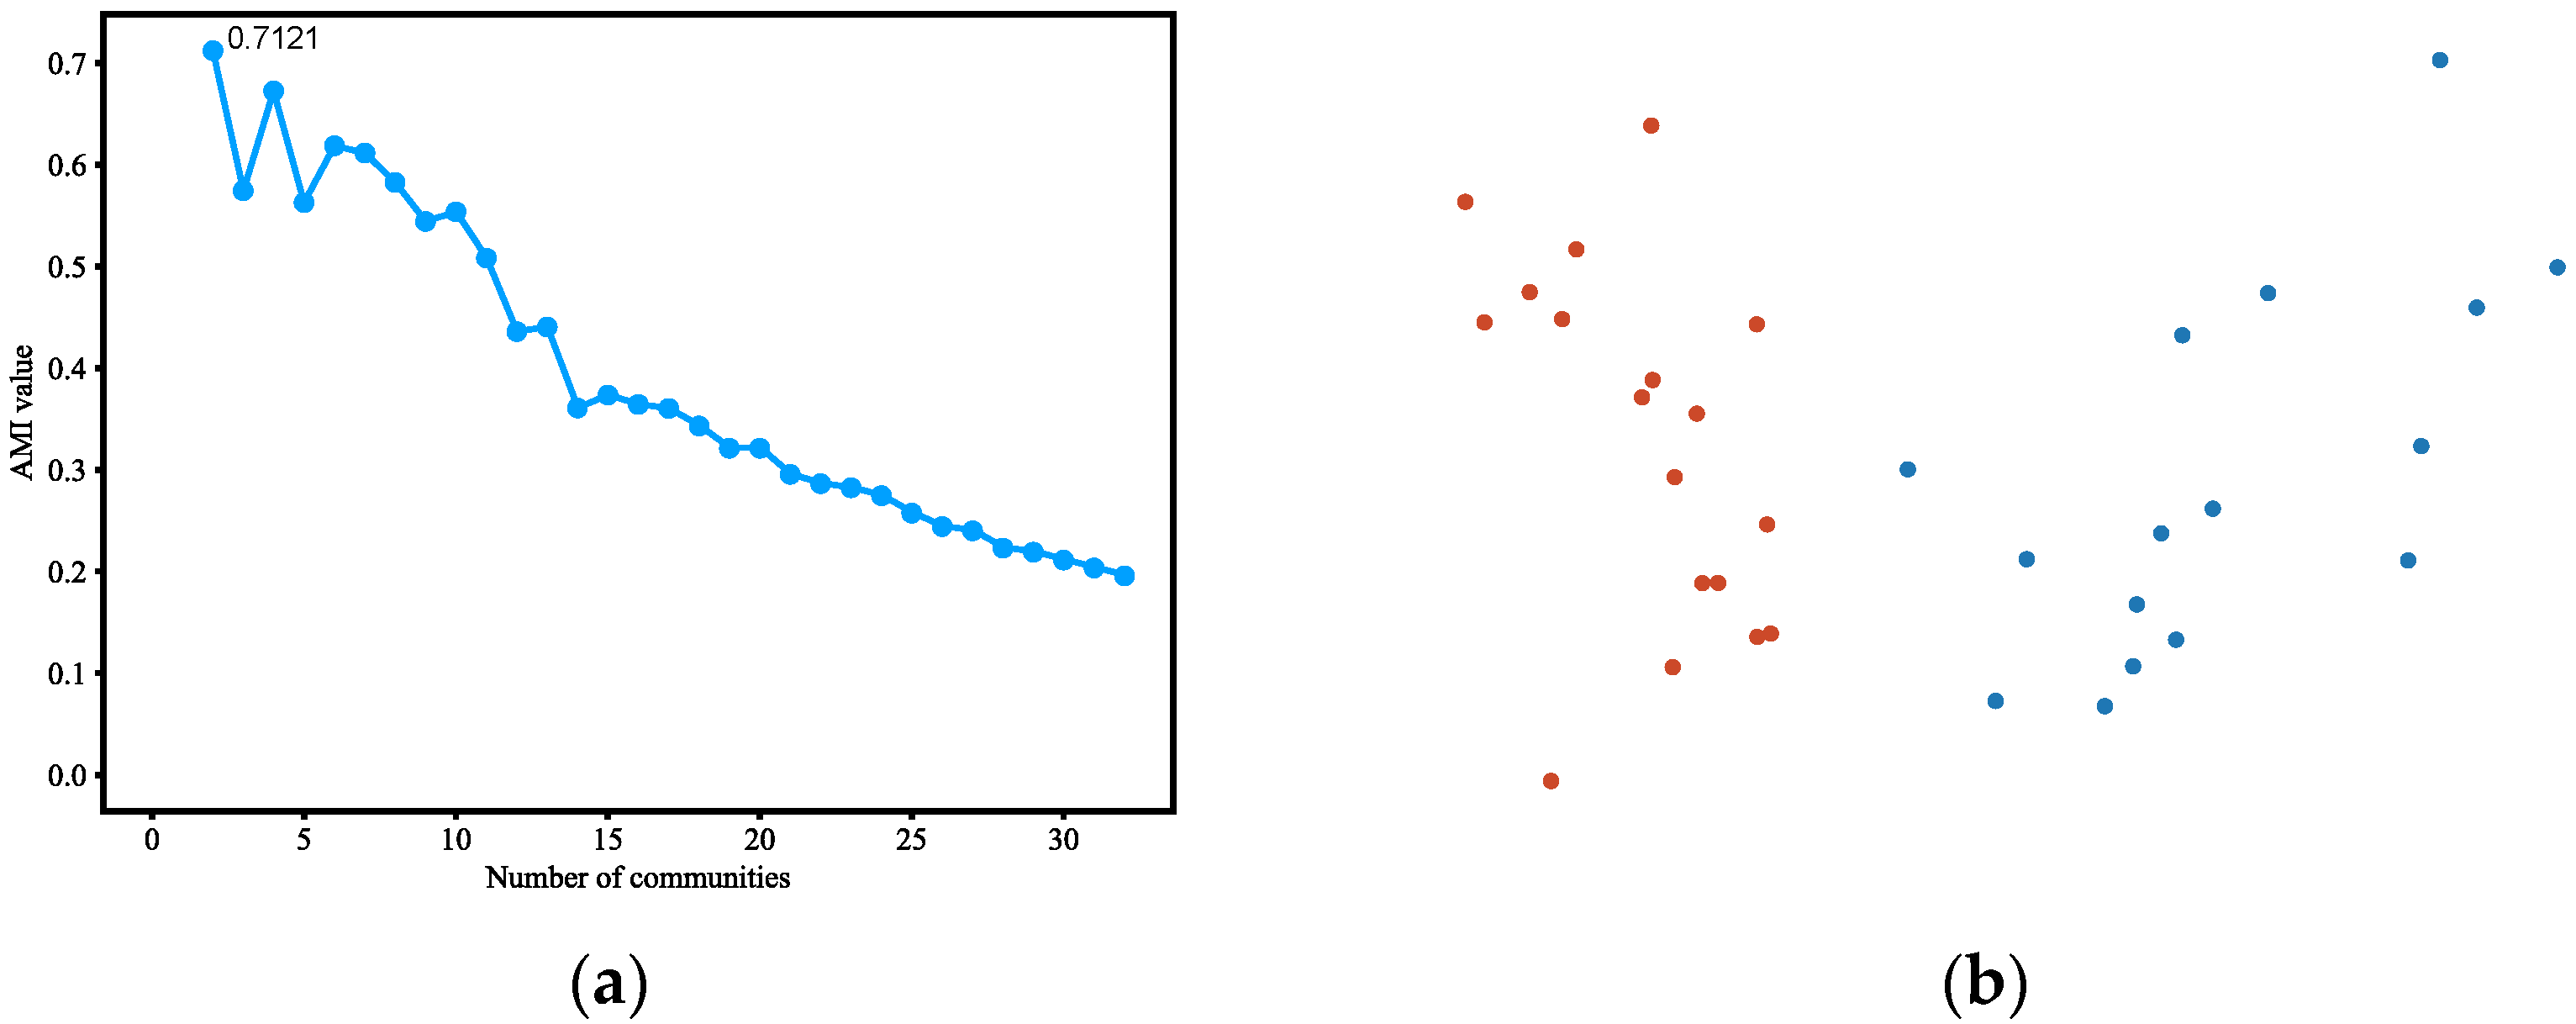
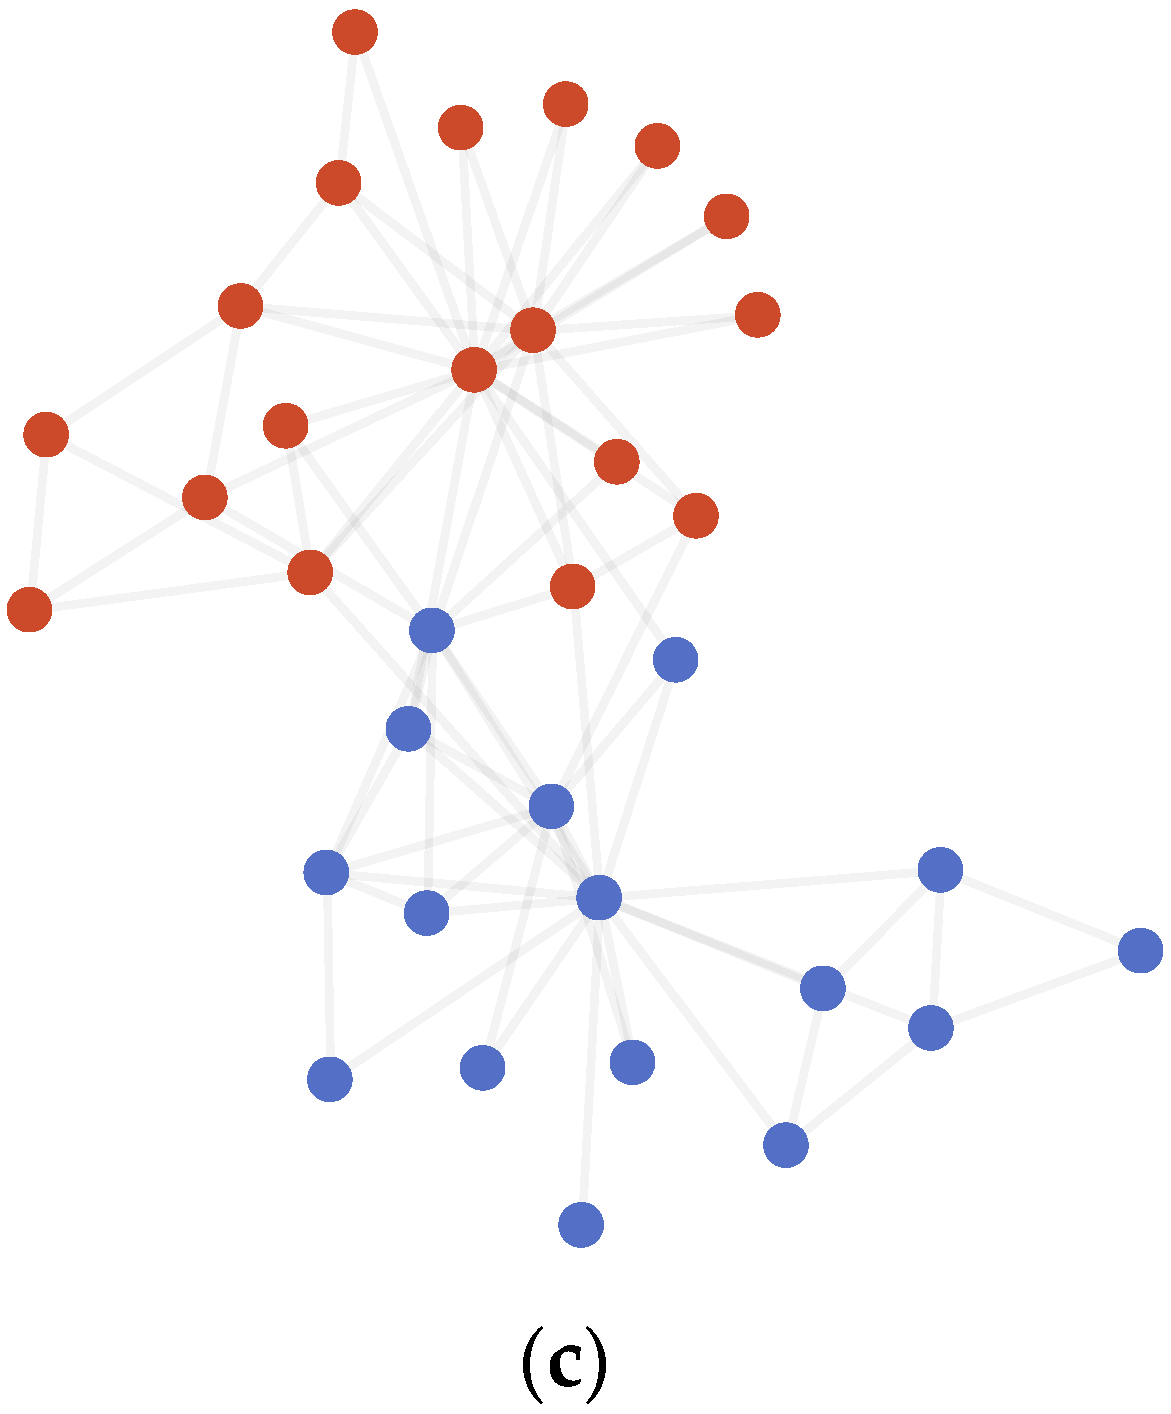
4.3.1. Karate Club
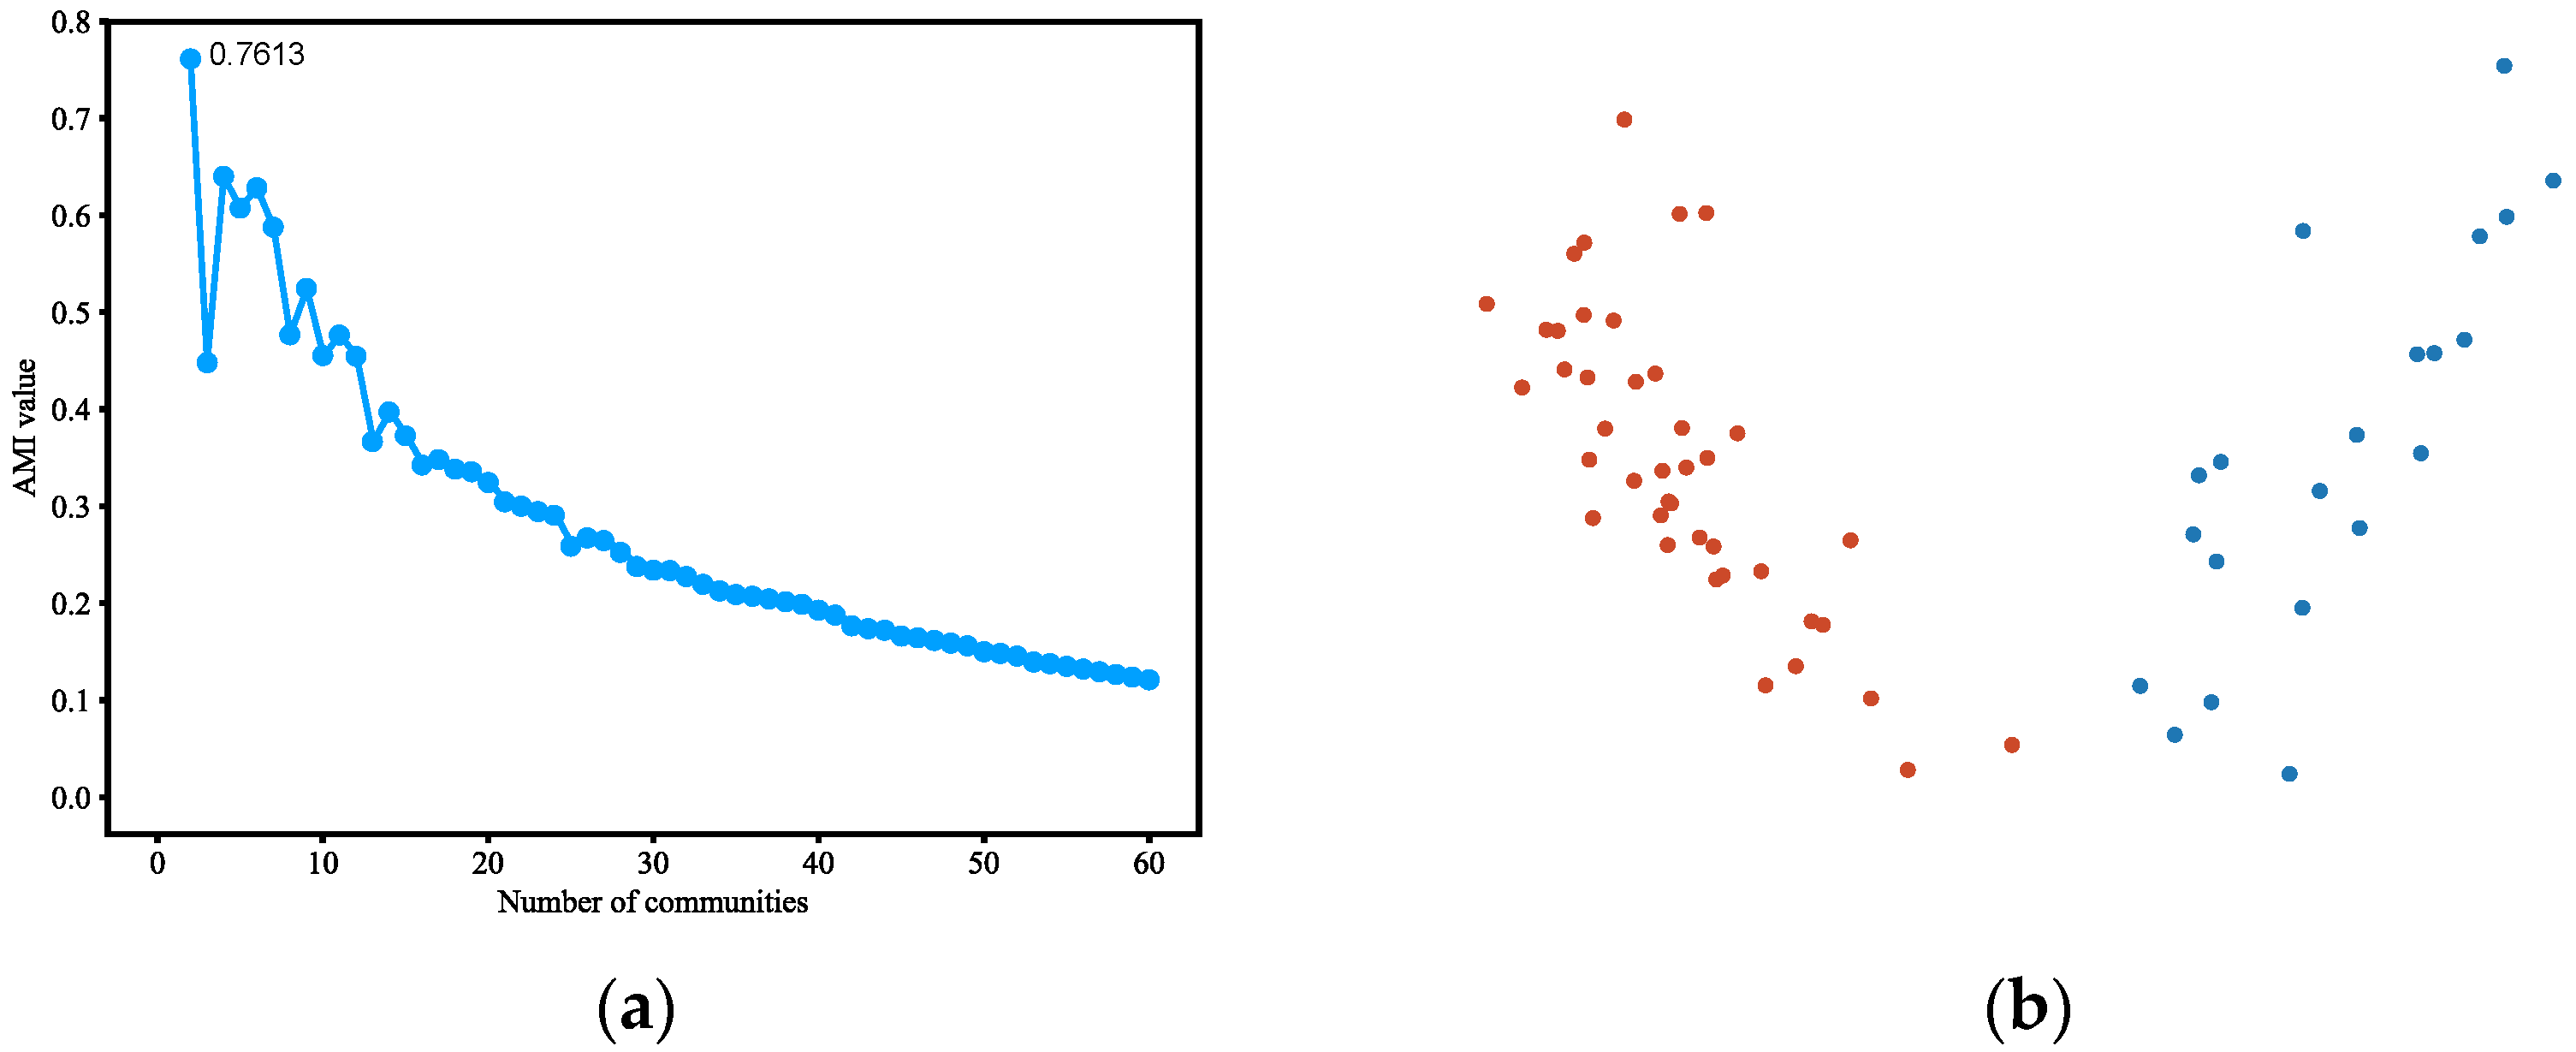
4.3.2. Dolphins
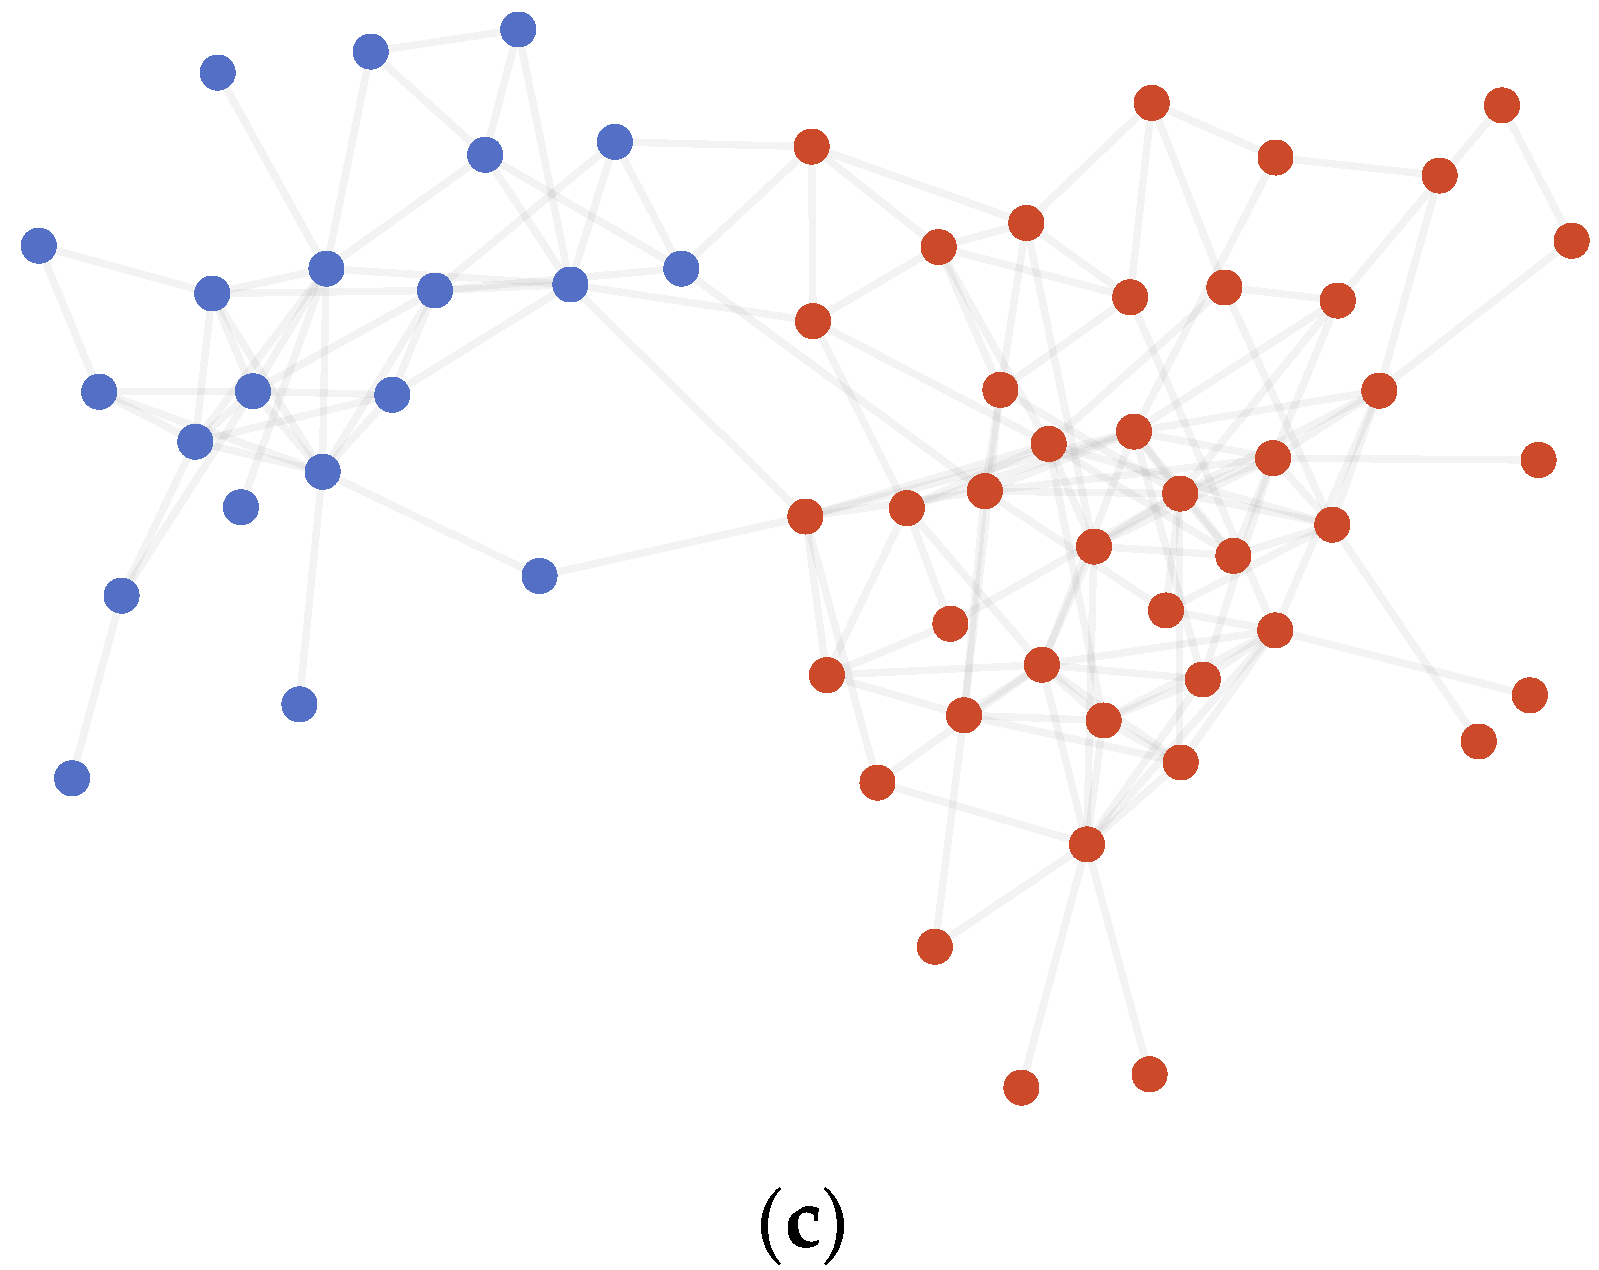
The results on the Dolphins dataset, as shown in Figure 3 and Table 3, had a difference of 0 to 1 point from the labeled partition when running multiple times. The difference node was Node 39, which had two edges connected correspondingly to two communities, and therefore we hold the opinion that it is reasonable no matter which community the node belongs to.
4.3.3. Polbooks
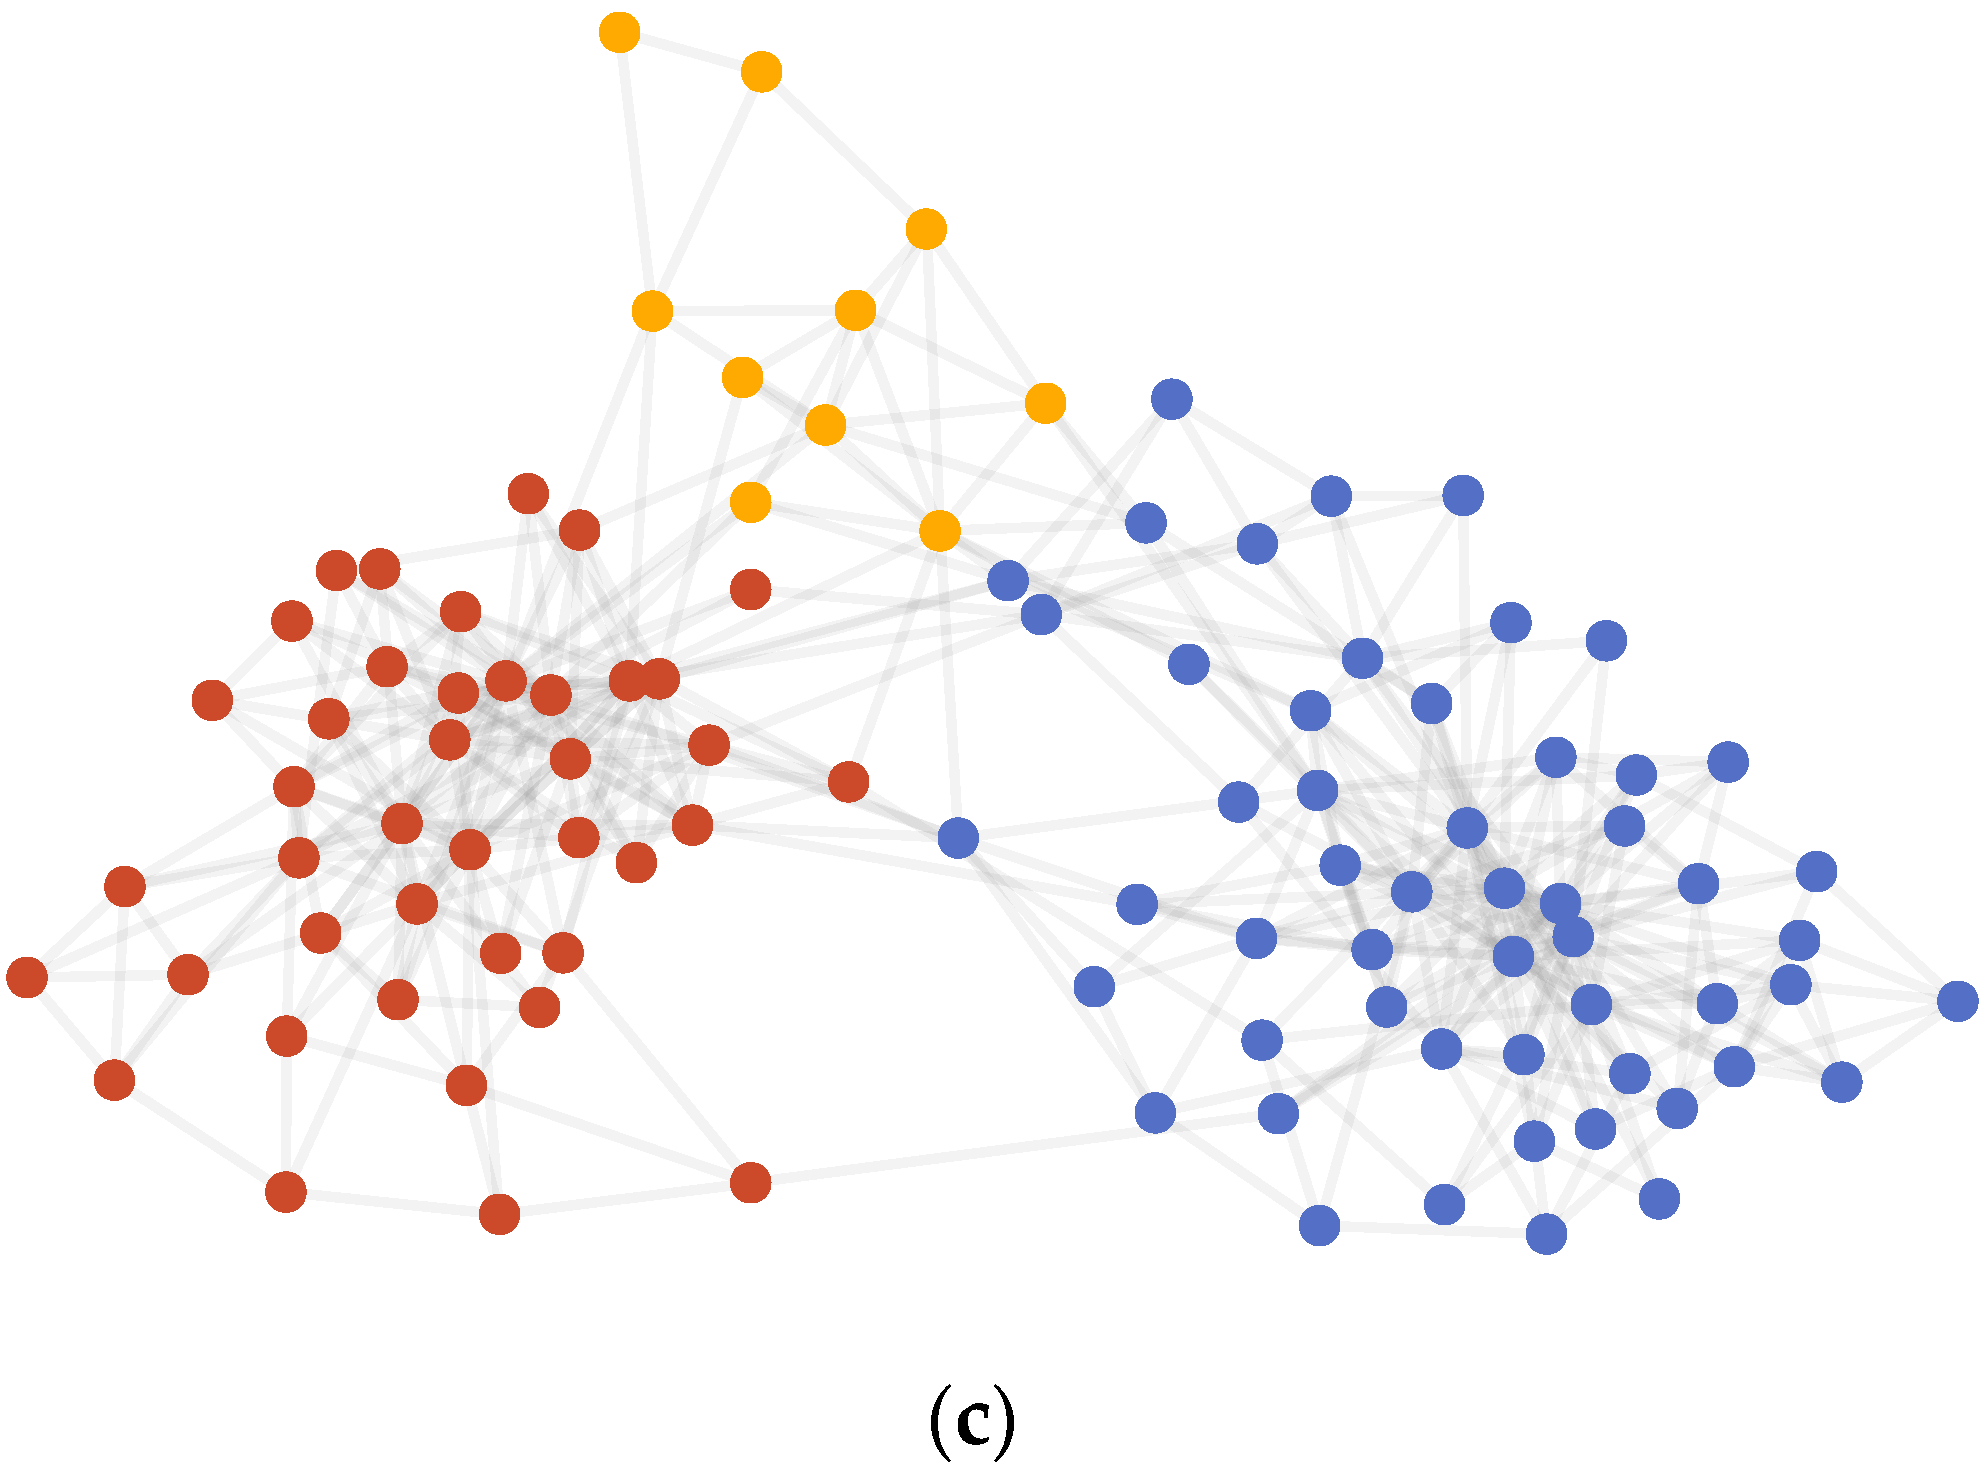
Table 4 and Figure 4 show the results on the Polbooks dataset. The result differs from the labeled partition by 16 nodes: 0, 4, 6, 18, 28, 46, 48, 52, 58, 64, 65, 67, 68, 76, 77, and 85.
Table 5 shows the result of the link analysis on these nodes, taking into account the edges inside communities and between communities in both community detection results and labeled partitions. As shown in Table 5, nodes 0, 4, 6, 18, 28, 46, 48, 58, 64, 65, 76, and 77 had a greater number of edges inside communities than the labeled partition; nodes 52, 67, and 68 had the same internal and external edges as that of the labeled partition. Only node 85 had one more internal edge than the labeled partition. Therefore, we hold the opinion that the AMI-NRL achieves a better result on the Polbooks than the labeled partition.
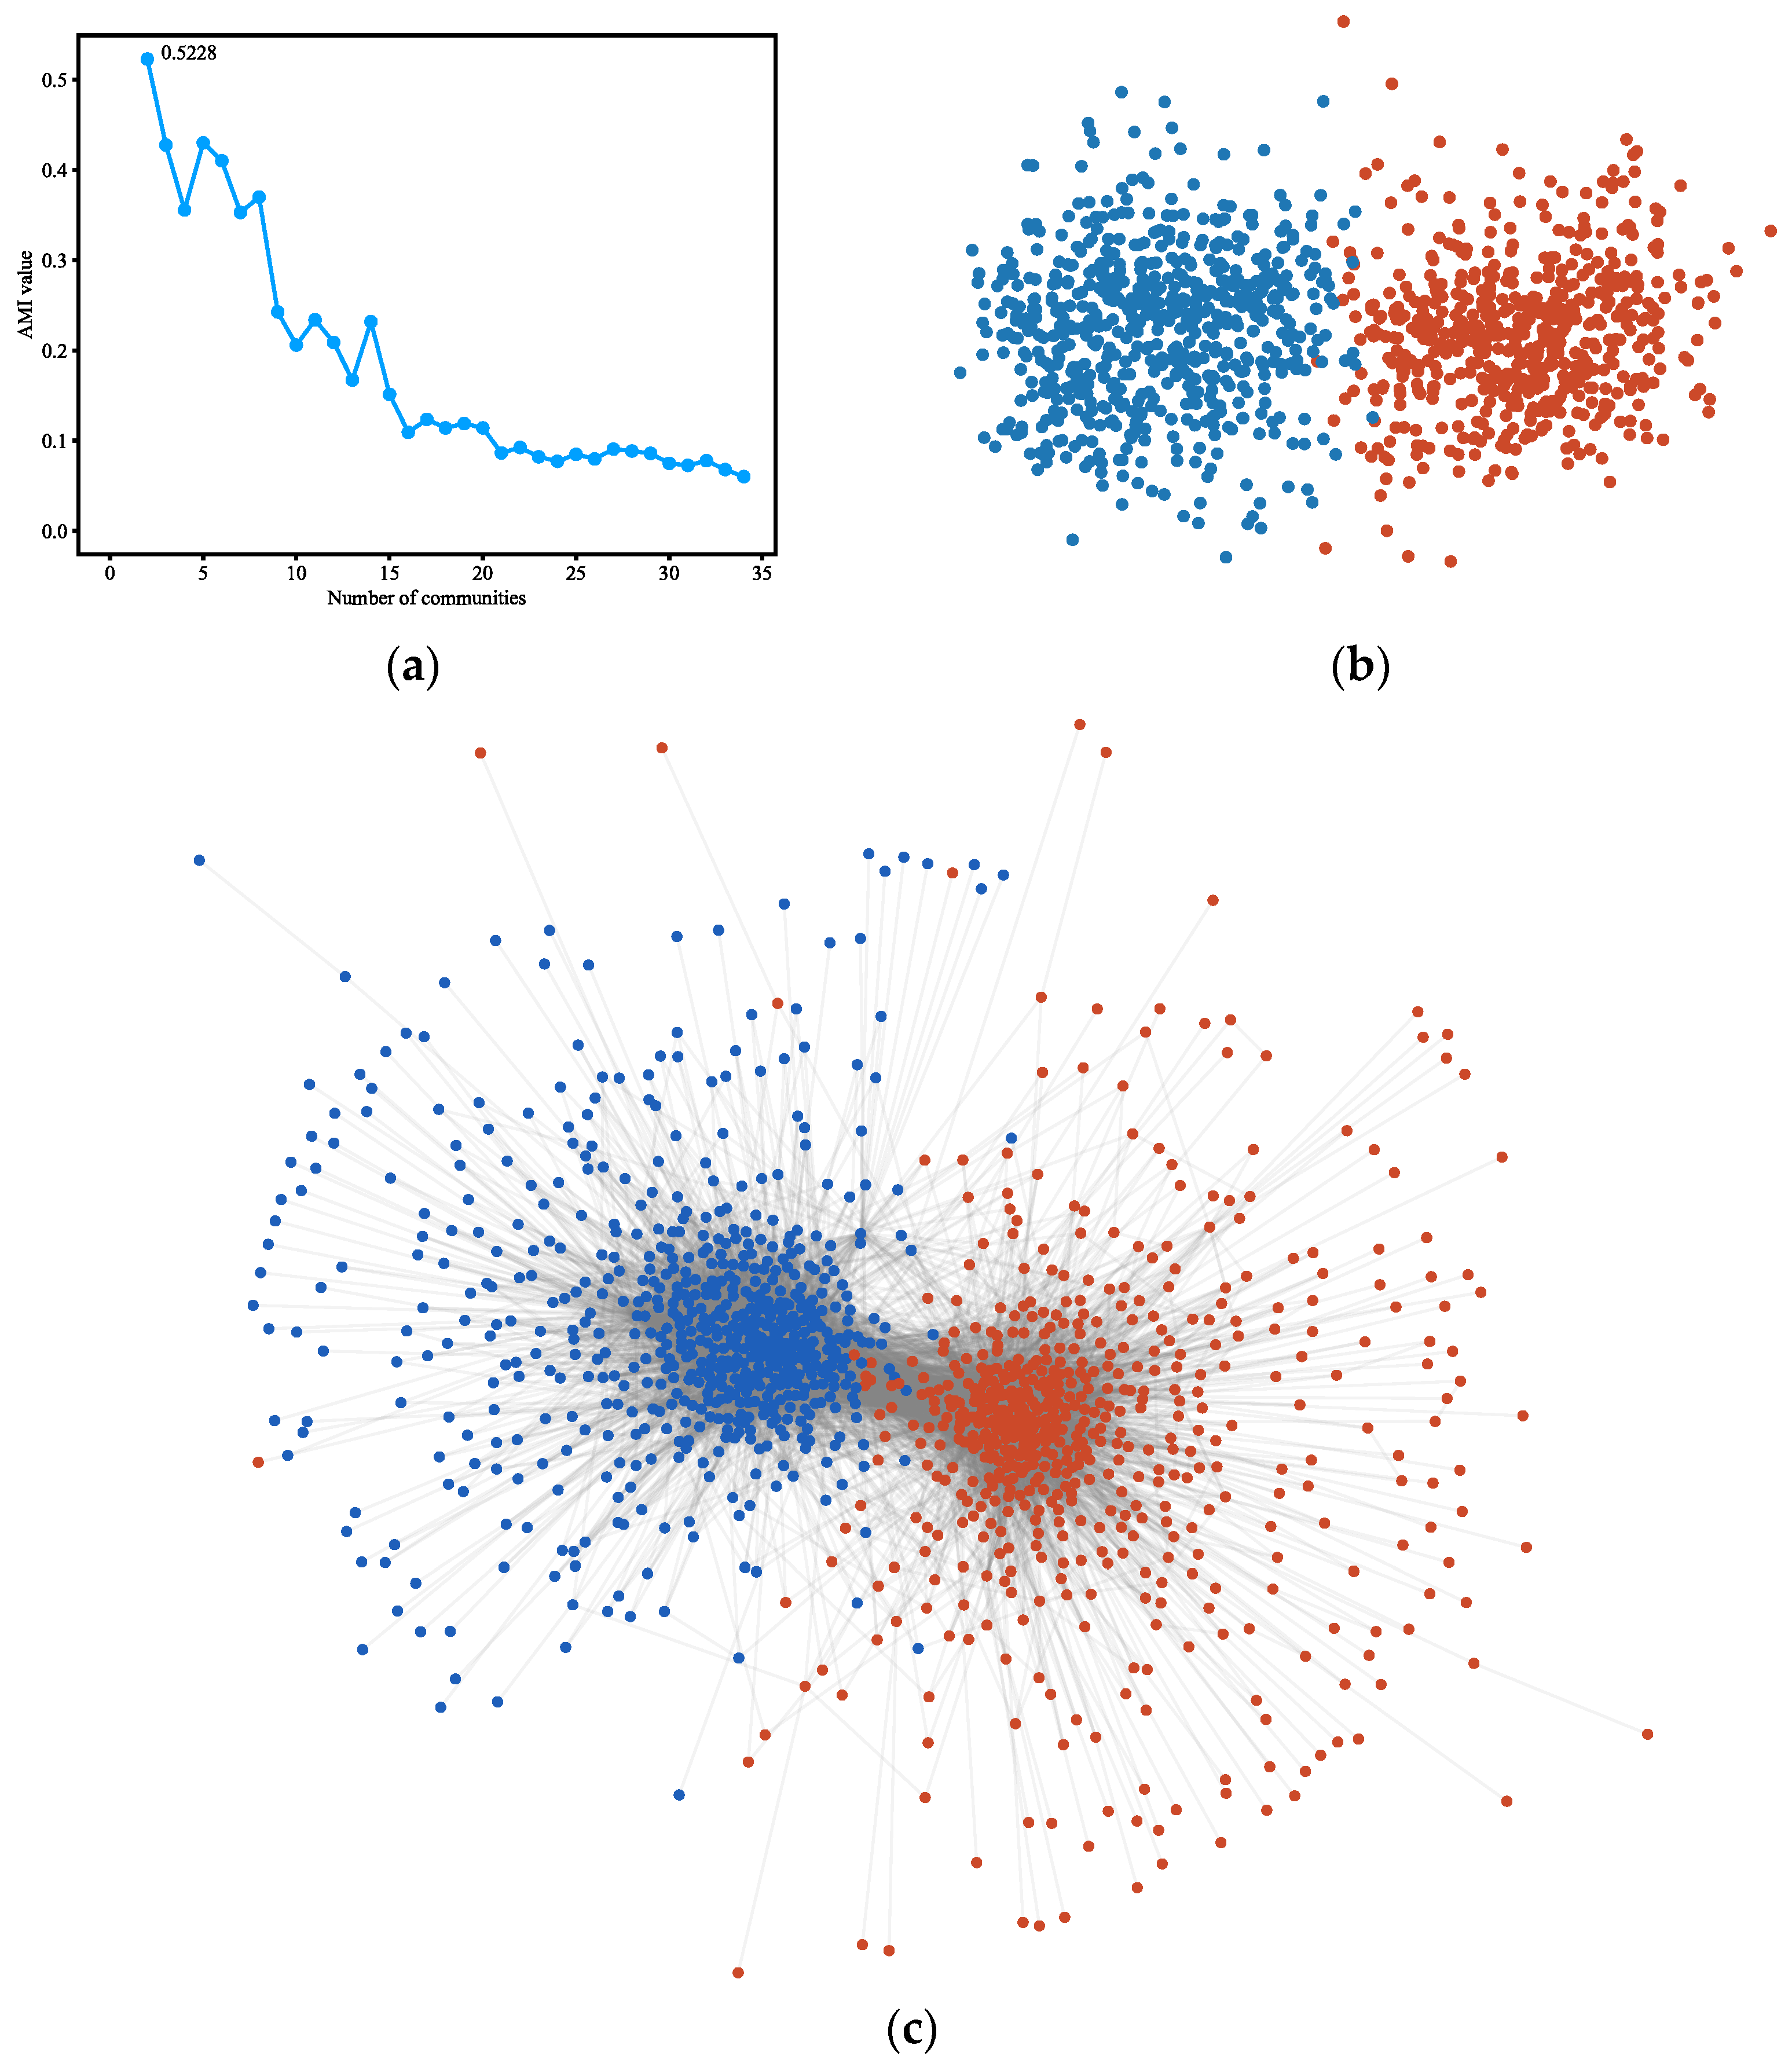
4.3.4. Polblogs
4.3.5. LFR Benchmark
The LFR benchmark is a type of artificially generated network proposed by Andrea Lancichinetti et al. in [33]. Compared to GN benchmark networks, LFR networks can simulate real-world networks more accurately in terms of its scale-free feature on degree distribution and community size. By altering multiple parameters, users can determine characteristics of the network such as network size, community size, average node degree, and community mixing degree. Table 7 shows the parameters used in the experiments.
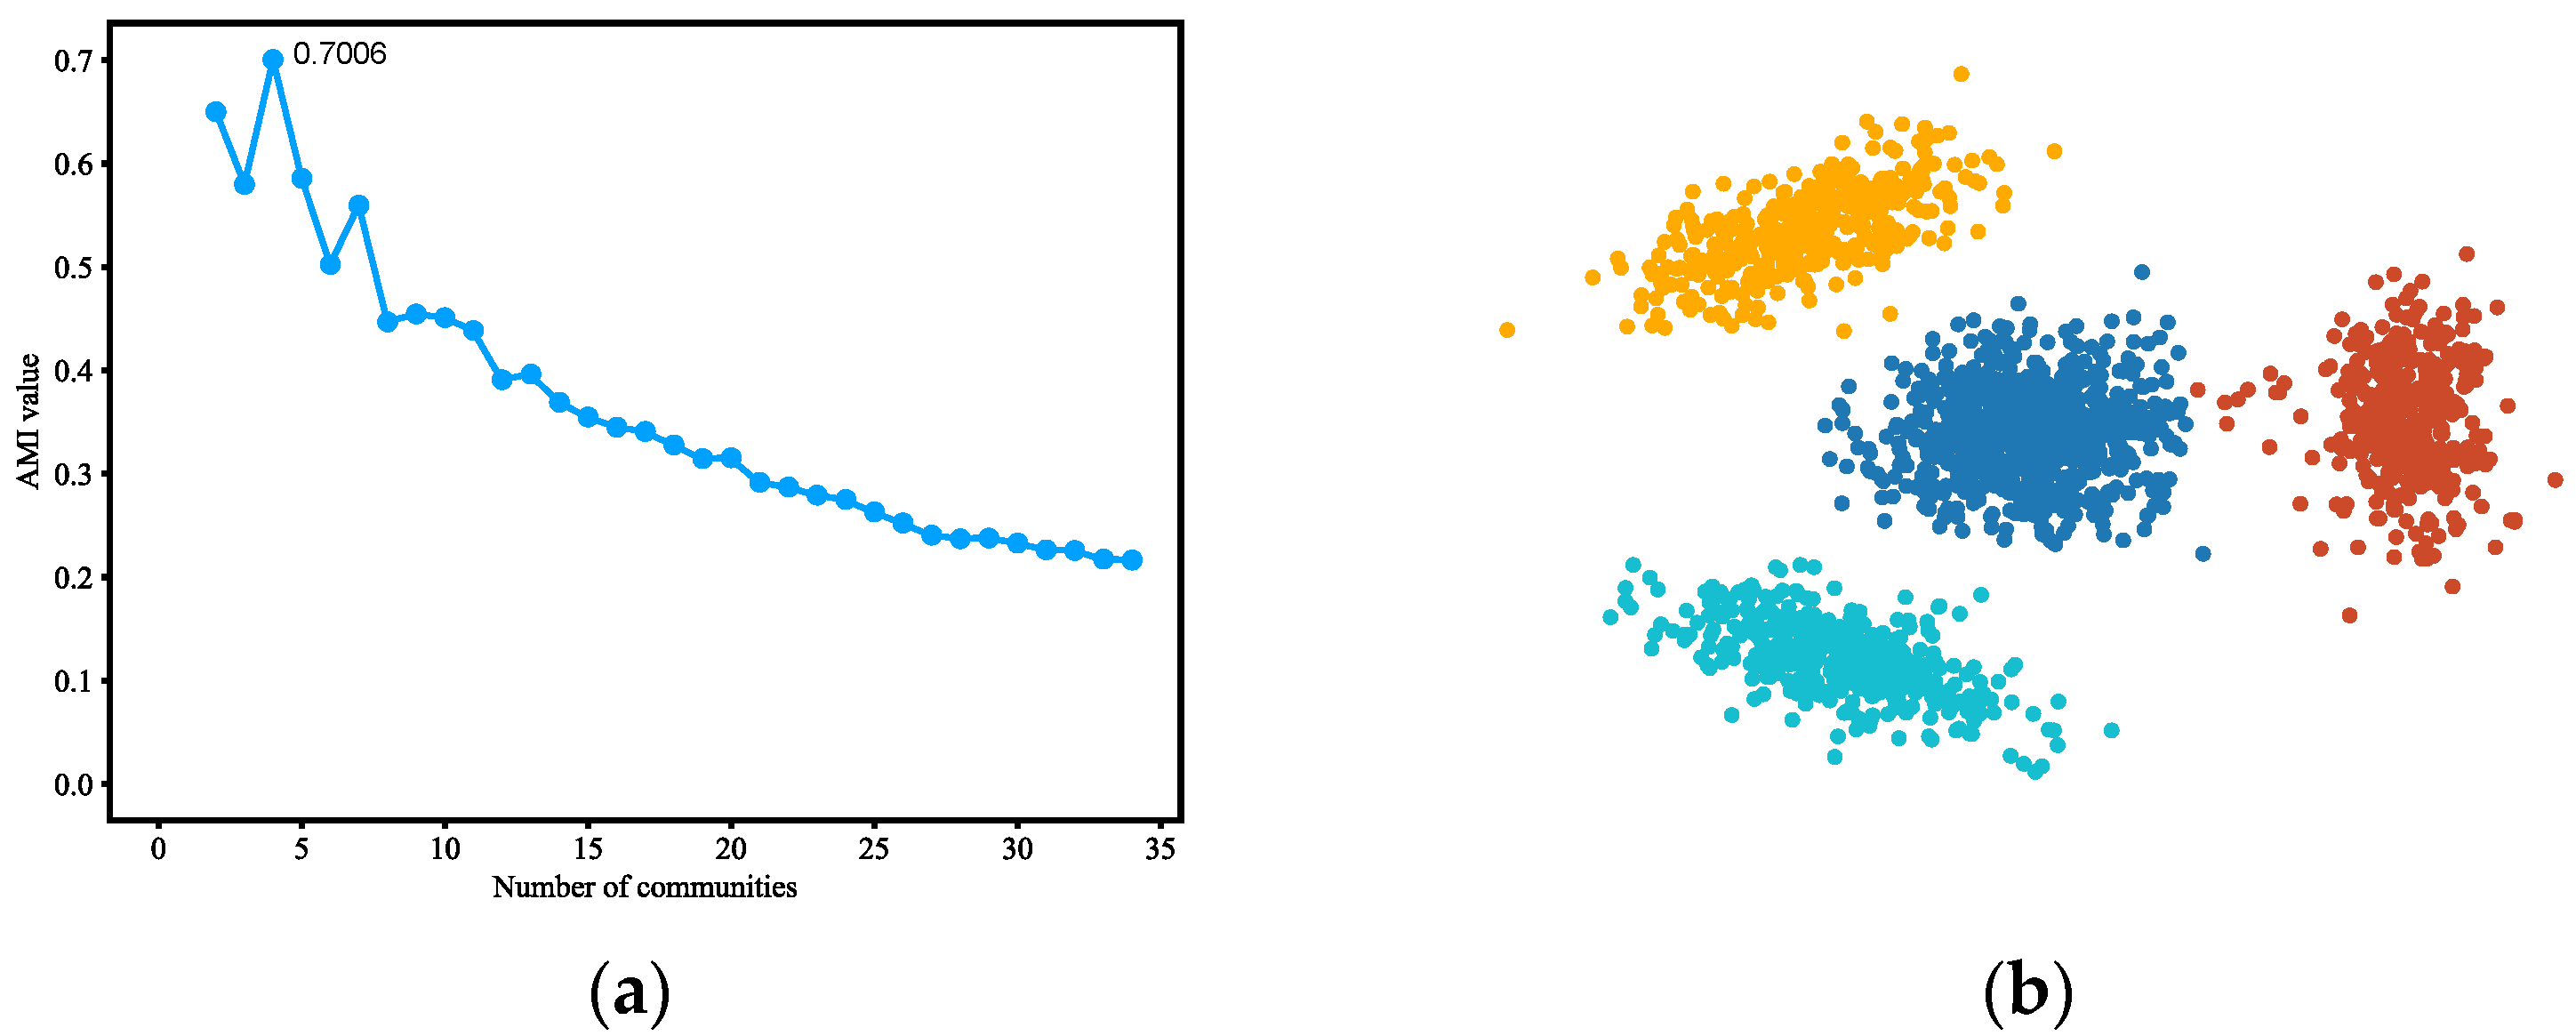
The key parameter of the LFR reference network is the parameter (mu). This parameter controls the mixing degree of a single community with other communities. The higher the mixing degree is set at, the more edges will be generated to connect different communities. This results in a higher average externality of the network, which makes it more difficult for a community detection algorithm to distinguish the community structure. The results of running AMI-NRL on LFR networks and the comparison with the other community detection algorithms are shown in Figure 6 and Table 8 and Table 9.
5. Conclusions
In this paper, we raise the idea of detecting communities in the network on the basis of stability. Following this idea, a community evaluation index based on average mutual information was used to find the most stable state in a community evolution process. The stability of each state of the process was measured by calculating the average mutual information of adjacent states and their information entropy. On the basis of this index, we proposed AMI-NRL. In this approach, the network is transformed into vectors through network representation learning. Then, agglomerative hierarchical clustering is performed on these vectors to simulate a real-world evolution process of communities. Finally, the optimal community partition can be found through the process by finding the peak value of the community evaluation index. Experiments on real-world and synthetic networks show that the approach is accurate and stable for the detection of communities.
In experiments, we also found that the ground truth of some datasets was not necessarily the most reasonable community partition. By comparing the labeled partition of the Polbooks dataset and the partition obtained by AMI-NRL, we found that the community structure obtained by the latter was more closely connected within the community, while the connection between communities was sparser. In other words, its community structure was more explicit. In future research, we will analyze this issue in depth and try to propose a more accurate and reasonable community evaluation model.
Due to the definition of AMI and the limitations of agglomerative hierarchical clustering, the current approach is limited to non-overlapping community detection in undirected and unweighted networks. We will continue to expand our research to more types of networks, as well as the detection of overlapping communities.
Author Contributions
Conceptualization, Y.C. and D.L.; methodology, Y.C.; software, Y.C.; validation, C. Wang; investigation, C.W.; data curation, C.W. and D.L.; writing—original draft preparation, Y.C.; writing—review and editing, all authors.; visualization, Y.C.; supervision, D.L.; project administration, D.L. All authors have read and agreed to the published version of the manuscript.
Funding
This research received no external funding.
Institutional Review Board Statement
Not applicable.
Informed Consent Statement
Not applicable.
Data Availability Statement
The datasets generated and analyzed during the current study are available from the corresponding author on reasonable request.
Conflicts of Interest
The authors declare no conflict of interest.
References
- Fortunato, S.; Castellano, C. Community structure in graphs. arXiv 2007, arXiv:0712.2716. [Google Scholar]
- Karataş, A.; Şahin, S. Application areas of community detection: A review. In Proceedings of the 2018 International Congress on Big Data, Deep Learning and Fighting Cyber Terrorism (IBIGDELFT), Ankara, Turkey, 3–4 December 2018; Volume 2018, pp. 65–70. [Google Scholar]
- Newman, M.E.J. Modularity and community structure in networks. Proc. Natl. Acad. Sci. USA 2006, 103, 8577–8582. [Google Scholar] [CrossRef] [PubMed] [Green Version]
- Lancichinetti, A.; Fortunato, S.; Kertész, J. Detecting the Overlapping and Hierarchical Community Structure in Complex Networks. New J. Phys. 2009, 11, 033015. [Google Scholar] [CrossRef]
- Tu, C.; Zeng, X.; Wang, H.; Zhang, Z.; Liu, Z.; Sun, M.; Zhang, B.; Lin, L. A unified framework for community detection and network representation learning. IEEE Trans. Knowl. Data Eng. 2018, 31, 1051–1065. [Google Scholar] [CrossRef] [Green Version]
- Cavallari, S.; Zheng, V.W.; Cai, H.; Chang, K.C.; Cambria, E. Learning community embedding with community detection and node embedding on graphs. In Proceedings of the 2017 ACM on Conference on Information and Knowledge Management, Singapore, 6–10 November 2017; pp. 377–386. [Google Scholar]
- Chen, M.; Nguyen, T.; Szymanski, B.K. A New Metric for Quality of Network Community Structure. Comput. Sci. 2013, 2, 22–29. [Google Scholar]
- Martin, R.; Bergstrom, C.T. Maps of Random Walks on Complex Networks Reveal Community Structure. Proc. Natl. Acad. Sci. USA 2008, 105, 1118–1123. [Google Scholar]
- Lambiotte, R.; Delvenne, J.C.; Barahona, M. Laplacian dynamics and multiscale modular structure in networks. arXiv 2008, arXiv:0812.1770. [Google Scholar]
- Newman, M.E.J. Fast Algorithm for Detecting Community Structure in Networks. Phys. Rev. E 2004, 69, 066133. [Google Scholar] [CrossRef] [Green Version]
- Clauset, A.; Newman, M.E.J.; Moore, C. Finding community structure in very large networks. Phys. Rev. E 2004, 70, 066111. [Google Scholar] [CrossRef] [Green Version]
- Blondel, V.D.; Guillaume, J.L.; Lambiotte, R.; Lefebvre, E. Fast unfolding of communities in large networks. J. Stat. Mech. Theory Exp. 2008, 2008, P10008. [Google Scholar] [CrossRef] [Green Version]
- Gregory, S. Finding Overlapping Communities in Networks by Label Propagation. New J. Phys. 2010, 12, 103018. [Google Scholar] [CrossRef]
- Hou Chin, J.; Ratnavelu, K. A Semi-Synchronous Label Propagation Algorithm with Constraints for Community Detection in Complex Networks. Sci. Rep. 2017, 7, 45836. [Google Scholar] [CrossRef] [PubMed] [Green Version]
- Lee, C.; Reid, F.; McDaid, A.; Hurley, N. Detecting highly overlapping community structure by greedy clique expansion. In Proceedings of the 2010, 16th ACM SIGKDD International Conference on Knowledge Discovery and Data Mining (KDD 2010), Anchorage, AK, USA, 4–8 August 2010. [Google Scholar]
- Rosvall, M.; Bergstrom, C.T. An Information-theoretic Framework for Resolving Community Structure in Complex Networks. Proc. Natl. Acad. Sci. USA 2007, 104, 7327–7331. [Google Scholar] [CrossRef] [PubMed] [Green Version]
- Cai, Q.; Gong, M.; Ma, L.; Jiao, L. A novel clonal selection algorithm for community detection in complex networks. Comput. Intell. 2015, 31, 442–464. [Google Scholar] [CrossRef]
- Su, Y.; Wang, B.; Cheng, F.; Zhang, L.; Zhang, X.; Pan, L. An Algorithm Based on Positive and Negative Links for Community Detection in Signed Networks. Sci. Rep. 2017, 7, 10874. [Google Scholar] [CrossRef] [Green Version]
- Li, P.Z.; Huang, L.; Wang, C.D.; Zhang, L.; Zhang, X.; Pan, L. EdMot: An edge enhancement approach for motif-aware community detection. In Proceedings of the 2019, 25th ACM SIGKDD International Conference on Knowledge Discovery & Data Mining, Anchorage, AK, USA, 4–8 August 2019; pp. 479–487. [Google Scholar]
- Maoguo, G.; Cheng, C.; Yu, X.; Wang, S. Community Preserving Network Embedding Based on Memetic Algorithm. IEEE Trans. Emerg. Top. Comput. Intell. 2018, 2018, 1–11. [Google Scholar]
- Perozzi, B.; Al-Rfou, R.; Skiena, S. Deepwalk: Online learning of social representations. In Proceedings of the 2014, 20th ACM SIGKDD International Conference on Knowledge Discovery and Data Mining, New York, NY, USA, 24–27 August 2014; pp. 701–710. [Google Scholar]
- Grover, A.; Leskovec, J. Node2vec: Scalable feature learning for networks. In Proceedings of the 2016, 22nd ACM SIGKDD international conference on Knowledge discovery and data mining, San Francisco, CA, USA, 13–17 August 2016; pp. 855–864. [Google Scholar]
- Perozzi, B.; Kulkarni, V.; Chen, H.; Skiena, S. Don’t Walk, Skip! Online learning of multi-scale network embeddings. In Proceedings of the 2017, 2017 IEEE/ACM International Conference on Advances in Social Networks Analysis and Mining, Sydney, Australia, 31 July–3 August 2017; pp. 258–265. [Google Scholar]
- Sun, D.L.; Fevotte, C. Alternating direction method of multipliers for non-negative matrix factorization with the beta-divergence. In Proceedings of the 2014 IEEE International Conference on Acoustics, Speech and Signal Processing (ICASSP), Florence, Italy, 4–9 May 2014; pp. 6201–6205. [Google Scholar]
- Qiu, J.; Dong, Y.; Ma, H.; Li, J.; Wang, K.; Tang, J. Network embedding as matrix factorization: Unifying deepwalk, line, pte, and node2vec. In Proceedings of the Eleventh ACM International Conference on Web Searchand Data Mining, Los Angeles, CA, USA, 5–9 February 2018; pp. 459–467. [Google Scholar]
- Torres, L.; Chan, K.S.; Eliassi-Rad, T. GLEE: Geometric Laplacian eigenmap embedding. J. Complex Netw. 2020, 8, cnaa007. [Google Scholar] [CrossRef] [Green Version]
- Zhang, Z.; Cui, P.; Li, H.; Wang, X.; Zhu, W. Billion-scale network embedding with iterative random projection. In Proceedings of the 2018 IEEE International Conference on Data Mining (ICDM), Singapore, 17–20 November 2018; pp. 787–796. [Google Scholar]
- Li, J.; Wu, L.; Guo, R.; Liu, C.; Liu, H. Multi-level network embedding with boosted low-rank matrix approximation. In Proceedings of the 2019 IEEE/ACM International Conference on Advances in Social Networks Analysis and Mining, Vancouver, BC, Canada, 27–30 August 2019; pp. 49–56. [Google Scholar]
- Donnat, C.; Zitnik, M.; Hallac, D.; Leskovec, J. Learning structural node embeddings via diffusion wavelets. In Proceedings of the 2018, 24th ACM SIGKDD International Conference on Knowledge Discovery & Data Mining, London, UK, 19–23 August 2018; pp. 1320–1329. [Google Scholar]
- Ward, J.H., Jr. Hierarchical grouping to optimize an objective function. J. Am. Stat. Assoc. 1963, 58, 236–244. [Google Scholar] [CrossRef]
- Zachary, W.W. An Information Flow Model for Conflict and Fission in Small Groups. J. Anthropol. Res. 1977, 33, 452–473. [Google Scholar] [CrossRef] [Green Version]
- Lusseau, D.; Schneider, K.; Boisseau, O.J.; Haase, P.; Slooten, E.; Dawson, S.M. The bottlenose dolphin community of Doubtful Sound features a large proportion of long-lasting associations. Behav. Ecol. Sociobiol. 2003, 54, 396–405. [Google Scholar] [CrossRef]
- Adamic, L.A.; Glance, N. The political blogosphere and the 2004 US Election. In Proceedings of the 3rd international workshop on Link discovery, Chicago, IL, USA, 21–25 August 2005; pp. 36–43. [Google Scholar]
- Lancichinetti, A.; Fortunato, S.; Radicchi, F. Benchmark Graphs for Testing Community Detection Algorithms. Phys. Rev. E Stat. Nonlinear Soft Matter Phys. 2008, 78, 046110. [Google Scholar] [CrossRef] [PubMed] [Green Version]
- Danon, L.; Díazguilera, A.; Duch, J.; Arenas, A. Comparing Community Structure Identification. J. Stat. Mech. 2005, 2005, 09008. [Google Scholar] [CrossRef]
- Deng, X.; Wang, B.; Wu, B.; Yang, S. Research and evaluation on modularity modeling in community detecting of complex network based on information entropy. In Proceedings of the Third IEEE International Conference on Secure Software Integration and Reliability Improvement, Shanghai, China, 8–10 July 2009; pp. 297–302. [Google Scholar]
Figure 1.
Community evolution process of top-down division.

Figure 2.
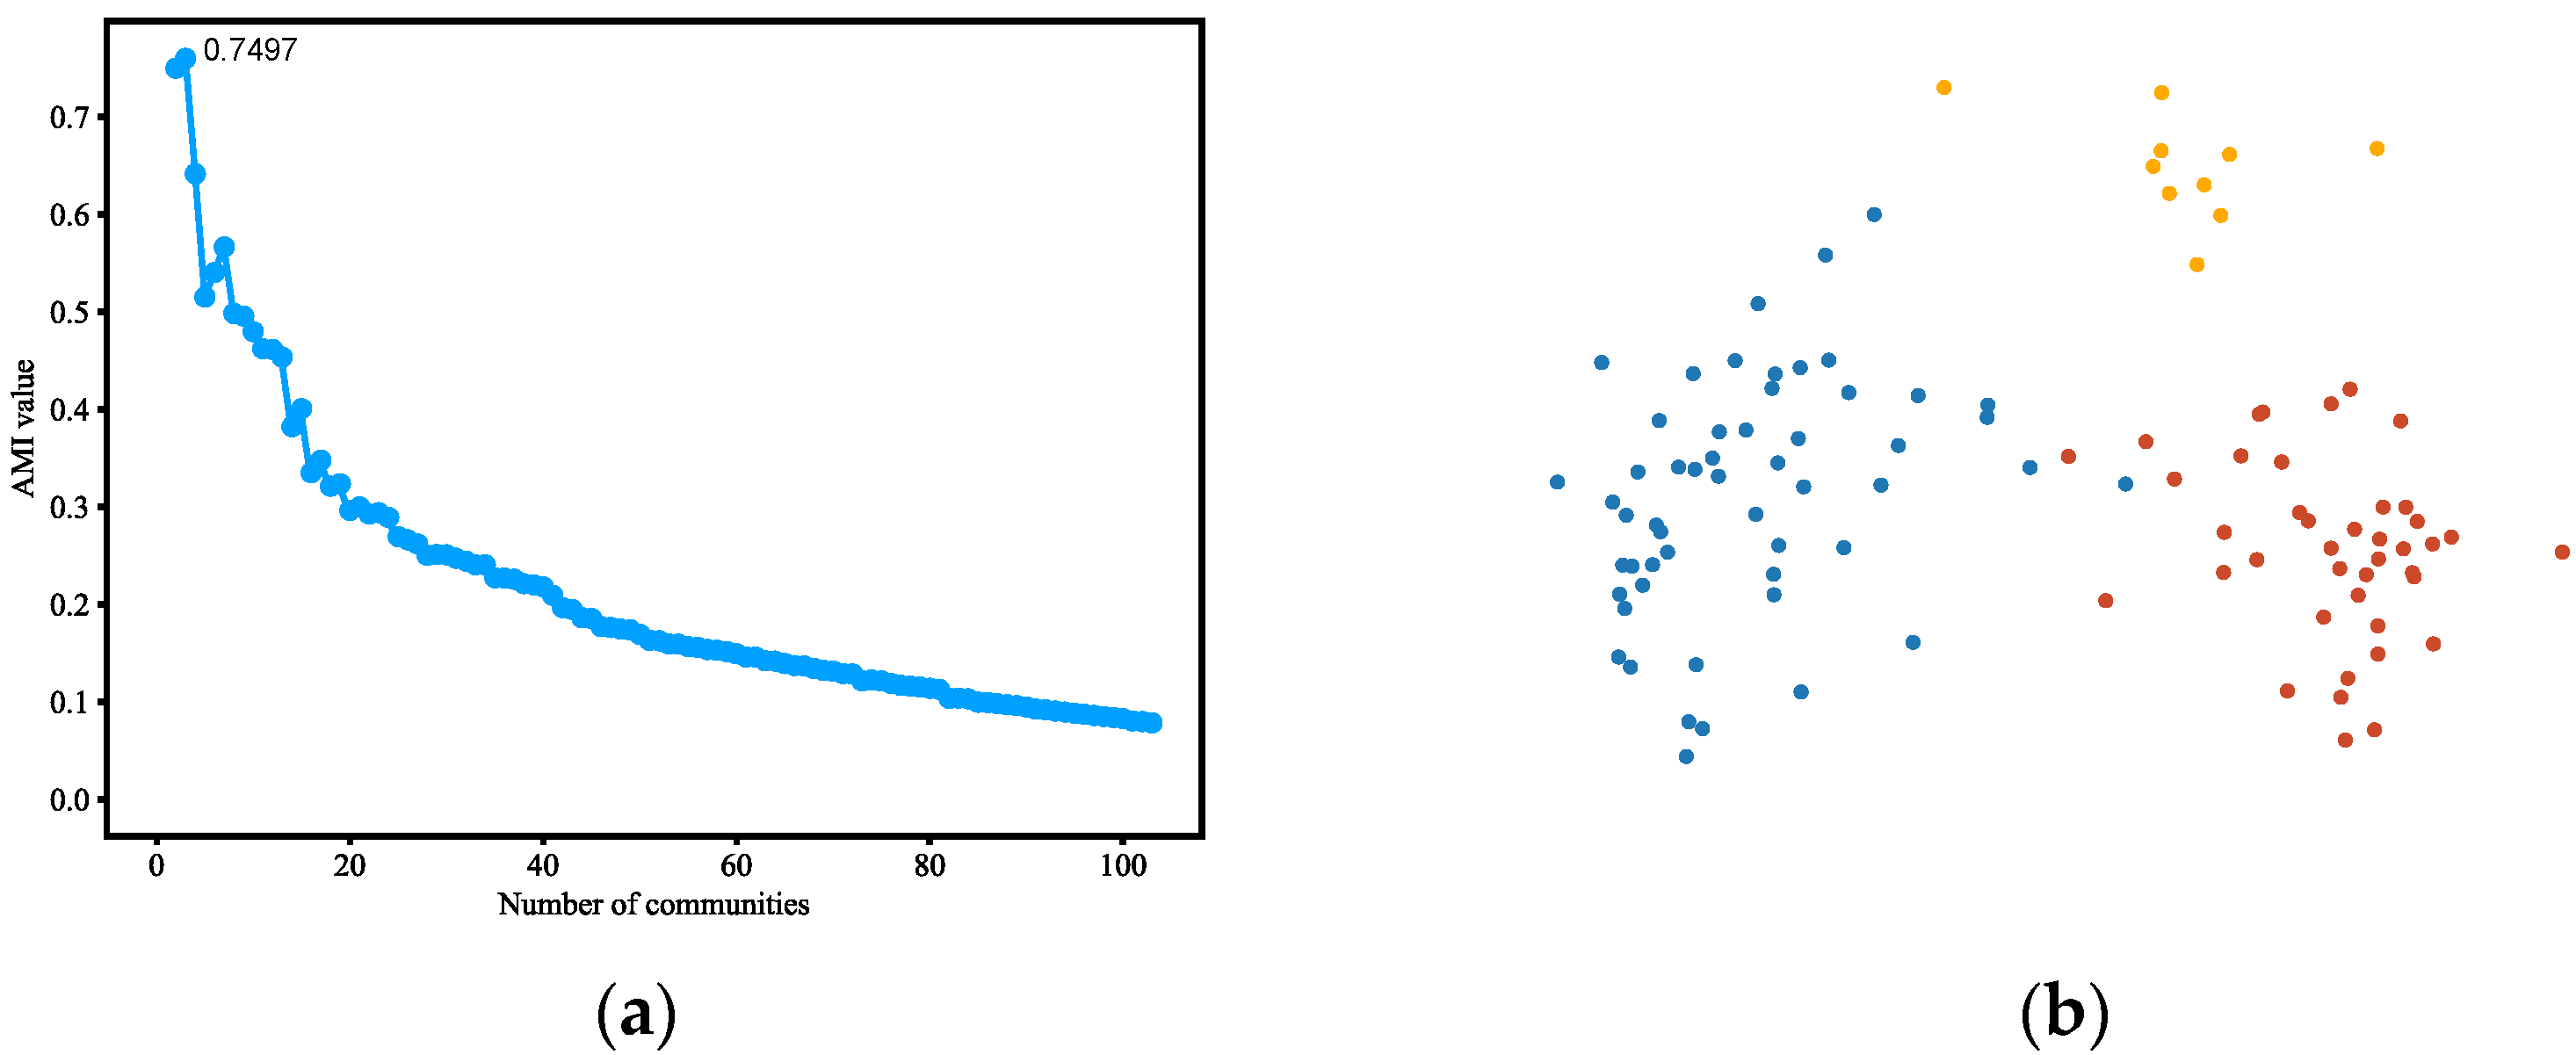
(a) AMI variation graph of adjacent partitions of Karate Club, with the abscissa indicating the number of communities and the ordinate indicating the AMI values between the corresponding partitions and their previous partitions. (b)Vectors representing each node of Karate Club (reduced to 2D using PCA). (c) Result of community detection on Karate Club.
Figure 2.
(a) AMI variation graph of adjacent partitions of Karate Club, with the abscissa indicating the number of communities and the ordinate indicating the AMI values between the corresponding partitions and their previous partitions. (b)Vectors representing each node of Karate Club (reduced to 2D using PCA). (c) Result of community detection on Karate Club.


Figure 3.
(a) AMI variation graph of adjacent partitions of Dolphins. (b) Vectors representing each node of Dolphins. (c) Result of community detection on Dolphins.
Figure 3.
(a) AMI variation graph of adjacent partitions of Dolphins. (b) Vectors representing each node of Dolphins. (c) Result of community detection on Dolphins.


Figure 4.
(a) AMI variation graph of adjacent partitions of Polbooks. (b) Vectors representing each node of Polbooks. (c) Result of community detection on Polbooks.
Figure 4.
(a) AMI variation graph of adjacent partitions of Polbooks. (b) Vectors representing each node of Polbooks. (c) Result of community detection on Polbooks.


Figure 5.
(a) AMI variation graph of adjacent partitions of Polblogs. (b) Vectors representing each node of Polblogs. (c) Result of community detection on Polblogs.
Figure 5.
(a) AMI variation graph of adjacent partitions of Polblogs. (b) Vectors representing each node of Polblogs. (c) Result of community detection on Polblogs.

Figure 6.
(a) AMI variation graph of adjacent partitions of LFR benchmark (mu = 0.3). (b) Vectors representing each node of LFR benchmark (mu = 0.3).
Figure 6.
(a) AMI variation graph of adjacent partitions of LFR benchmark (mu = 0.3). (b) Vectors representing each node of LFR benchmark (mu = 0.3).


Table 1.
Main properties of datasets and experimental parameters.
| Dataset | Node# | Edge# | CN | Length | Iterations | Dimensions |
|---|---|---|---|---|---|---|
| Karate Club | 34 | 78 | 2 | 50 | 10 | 10 |
| Dolphins | 62 | 159 | 2 | 50 | 10 | 10 |
| Polbooks | 105 | 441 | 3 | 50 | 10 | 10 |
| Polblogs | 1490 | 19,090 | 2 | 100 | 10 | 10 |
| LFR Benchmark | 2000 | Variable * | 4 | 100 | 10 | 10 |
# Here Node# and Edge# denotes the numbers of nodes and edges of the network respectively; * Number of edges of LFR networks are variable according to the parameters.
Table 2.
Results of AMI-NRL and the other community detection algorithms on Karate Club.
| CN | NMI | |
|---|---|---|
| Labeled partition | 2 | / |
| AMI-NRL | 2 | 1.00 |
| GN | 5 | 0.58 |
| FN | 2 | 0.84 |
| Louvain | 2 | 0.84 |
| IE | 2 | 0.84 |
| EdMot | 2 | 0.59 |
The bold numbers emphasize the best experimental results compared with the labeled partition.
Table 3.
Results of AMI-NRL and the other community detection algorithms on Dolphins.
| CN | NMI | |
|---|---|---|
| Labeled partition | 2 | / |
| AMI-NRL | 2 | 0.96 |
| GN | 5 | 0.55 |
| FN | 3 | 0.65 |
| Louvain | 2 | 0.65 |
| IE | 2 | 0.89 |
| EdMot | 5 | 0.51 |
Table 4.
Results of AMI-NRL and the other community detection algorithms on Polbooks.
| CN | NMI | |
|---|---|---|
| Labeled partition | 3 | / |
| AMI-NRL | 3 | 0.58 |
| GN | 5 | 0.56 |
| FN | 3 | 0.57 |
| Louvain | 3 | 0.55 |
| IE | 2 | 0.55 |
| EdMot | 5 | 0.5 |
Table 5.
Link analysis of the result and the labeled community partition on Polbooks.
| Labeled Partition | AMI-NRL | |||
|---|---|---|---|---|
| Node | Internal Links | External Links | Internal Links | External Links |
| 0 | 2 | 4 | 6 | 0 |
| 4 | 3 | 5 | 5 | 3 |
| 6 | 4 | 7 | 11 | 0 |
| 18 | 1 | 2 | 3 | 0 |
| 28 | 1 | 2 | 2 | 1 |
| 46 | 0 | 4 | 1 | 3 |
| 48 | 0 | 4 | 4 | 0 |
| 52 | 3 | 2 | 3 | 2 |
| 58 | 5 | 8 | 7 | 6 |
| 64 | 5 | 4 | 7 | 2 |
| 65 | 4 | 3 | 7 | 0 |
| 67 | 4 | 2 | 4 | 2 |
| 68 | 3 | 1 | 3 | 1 |
| 76 | 0 | 13 | 11 | 2 |
| 77 | 2 | 5 | 5 | 2 |
| 85 | 3 | 2 | 2 | 3 |
Table 6.
Results of AMI-NRL and the other community detection algorithms on Polblogs.
| CN | NMI | |
|---|---|---|
| Labeled partition | 2 | / |
| AMI-NRL | 2 | 0.72 |
| FN | 11 | 0.52 |
| Louvain | 4 | 0.63 |
| EdMot | 6 | 0.58 |
Table 7.
Parameters of the datasets generated by LFR benchmark.
| Node# (n) | Average Degree (k) | Max Degree (maxk) | Mixing Parameter (mu) | Community Scale (minc, maxc) | CN | |
|---|---|---|---|---|---|---|
| 1 | 2000 | 15 | 50 | 0.1 | 200∼1000 | 4 |
| 2 | 2000 | 15 | 50 | 0.2 | 200∼1000 | 4 |
| 3 | 2000 | 15 | 50 | 0.3 | 200∼1000 | 4 |
Table 8.
Results of AMI-NRL community detection on LFR benchmark datasets.
| Mixing Parameter (mu) | CN Labeled | CN Result | NMI | |
|---|---|---|---|---|
| 1 | 0.1 | 4 | 4 | 1 |
| 2 | 0.2 | 4 | 4 | 1 |
| 3 | 0.3 | 4 | 4 | 0.99 |
Table 9.
Result comparison of AMI-NRL and the other community detection algorithms on LFR benchmark (mu = 0.3).
Table 9.
Result comparison of AMI-NRL and the other community detection algorithms on LFR benchmark (mu = 0.3).
| CN | NMI | |
|---|---|---|
| Labeled partition | 4 | / |
| AMI-NRL | 4 | 0.99 |
| FN | 8 | 0.63 |
| Louvain | 5 | 0.76 |
| EdMot | 5 | 0.82 |
Publisher’s Note: MDPI stays neutral with regard to jurisdictional claims in published maps and institutional affiliations. |
© 2022 by the authors. Licensee MDPI, Basel, Switzerland. This article is an open access article distributed under the terms and conditions of the Creative Commons Attribution (CC BY) license (https://creativecommons.org/licenses/by/4.0/).
Share and Cite
MDPI and ACS Style
Chen, Y.; Wang, C.; Li, D. An Information-Theoretic Approach for Detecting Community Structure Based on Network Representation. Appl. Sci. 2022, 12, 4203. https://0-doi-org.brum.beds.ac.uk/10.3390/app12094203
AMA Style
Chen Y, Wang C, Li D. An Information-Theoretic Approach for Detecting Community Structure Based on Network Representation. Applied Sciences. 2022; 12(9):4203. https://0-doi-org.brum.beds.ac.uk/10.3390/app12094203
Chicago/Turabian StyleChen, Yinan, Chuanpeng Wang, and Dong Li. 2022. "An Information-Theoretic Approach for Detecting Community Structure Based on Network Representation" Applied Sciences 12, no. 9: 4203. https://0-doi-org.brum.beds.ac.uk/10.3390/app12094203
Note that from the first issue of 2016, this journal uses article numbers instead of page numbers. See further details here.