Article

A Proposed Method to Evaluate the Effect of Changing the Kerfing Parameters upon the Static Bending Behavior of Flexible Plywood Panels Cut by Laser

by
Cristina-Daria Condoroţeanu
,
Lidia Gurău
*,
Camelia Coşereanu
and
Sergiu-Valeriu Georgescu
Department of Wood Processing and Wood Products Design, Transilvania University of Brasov, 29 Eroilor Blvd., 500036 Brasov, Romania
*
Author to whom correspondence should be addressed.
Submission received: 12 April 2022 / Revised: 19 April 2022 / Accepted: 22 April 2022 / Published: 24 April 2022

Abstract

:
The purpose of this paper is to propose a method for testing the effect of varying the kerfing parameters, on the flexibilization of plywood panels for indoor applications. The evaluation was made by comparisons of the change in the MOE, MOR, and maximum deflection, between flexibilized and non-flexibilized specimens subjected to static bending tests based on EN 310. In order to prevent the problem of sliding from the supports occurring for the flexibilized specimens, the standard specimens were modified by adding a frame and subjecting to bending just their central rail. Framed specimens of poplar plywood, of 8 mm thick, were laser cut with a rigid central rail, taken as reference and with the flexible kerfed rail. These had lengths of the flexible area of 50, 70, 90, and 110 mm and with two dimensions of the kerfing pitch, 6 and 10 mm. Very good correlations were found for MOE, MOR, and maximum deflection with the length of the kerfed area, for both values of the kerf pitch, which proves the sensitivity of the proposed method to the changes in the input parameters. The method could further serve to mathematically model the flexibility of a kerfed plywood panel by selecting the appropriate input data.

1. Introduction

In furniture design, there has always been a great appeal to curved surfaces, but wood and wood-based materials are rather stiff materials if they are not plasticized. Saw kerfing, on one side, is one of the known solutions for bending large wooden panels, with radius limitations given by the material type and thickness and of the distance between cuts [1]. More recent trends in design seem to look for a higher material flexibility by using a cut-through kerfing pattern, which can transform a planar 2D stiff and thick panel (plywood; MDF) into a flexible 3D shape, bent in one or more directions [2,3,4]. Material is removed in a specific controlled pattern in order to make it locally more flexible, so that bending can be done [5]. While the cut-through kerfing was mostly used and experimented on in architectural works, its use and research in furniture is new. Architects and designers have experimented with a wide variety of cut patterns and demonstrated that some specific cut patterns, such as spirals, generate a significant amount of flexibility [6]. A super flexible plywood was obtained by Ivanišević [7] when inventing a meander pattern. However, the straight line kerfing is the most common pattern that has been applied to structures [5]. This simple pattern of kerfing is indicated when bending is required in only one direction [8], and this makes it applicable for furniture’s simple bent panels, providing the process is well understood [9,10].
Due to the versatility of the shapes created by bending using the kerfing method, different types of freeform structures were developed for architectural purposes [8], for furniture [2], for lamps [11], and for other miscellaneous purposes, such as shape-changing interfaces [12] and indoor acoustics [4]. Besides its many advantages, such as easiness and fast production time, this bending technique is mostly recommended for interior applications because of its low structural resistance [5]. While the kerfing technique promotes flexible surfaces, it generally reduces the load-carrying ability of the panels, so that a balance between flexibility and load bearing should be considered [3].
A number of researchers have looked into observing the impact of kerfing variables and material characteristics upon material curvature and flexibility, and employed direct practical experimentation or various self-designed testing methods supplemented or not by finite element analysis.
Güzelci et al. [13] experimented on cardboard models, 1–2 mm thick and kerfed with a laser, in order to observe the influence factors upon planar structures’ flexibility. They measured the behavior in bending when one end of the samples was fixed and the other end was bent. The influence of the material thickness, of the type, size, and frequency of the kerfing pattern upon the bending angle was studied.
Greenberg and Körner [14] investigated the behavior in practical bending of a plywood pavilion structure flexibilized by kerfing with a CNC router, and examined the reasons for local structure failure. Finite element analysis was employed in order to observe the local material stiffness as relate to the cutting geometry in the plywood structure. The authors underlined the need for further studies in order to understand the relationship between material stiffness and curvature with some parameters, such as: material, structural requirements, kerfing length, kerfing pattern, and distance between cuts (kerfing pitch).
Kalantar and Borhani [8] included thin sheets of plywood in an architectural experiment with double-curved surfaces obtained by complex kerfing. They stated, citing the work of Zarrinmehr et al. [6], that by utilizing multiple kerfing-line angles, it is possible to bend the sheet into a wide variety of complex shapes, while a variation of the local kerfing parameters would modify the local stiffness in order to obtain the shape desired. They also noticed an increase in the kerfing pattern density, which means a reduction of the uncut sections size can increase the material flexibility. However, if the cuts are too close, the material becomes frail and can break and if the cuts are too far apart, the material becomes too stiff and can break in bending. In this sense, [11] recommends that minimum-cut widths be no smaller than the corresponding thickness of the material.
Another remark of Kalantar and Borhani [8] states that the thinner and lengthier the cut areas are, the more pliable the material is, but only to a limit which must be known. The material plays an important role because it influences the behavior in bending, the value of the minimum radius of curvature, and panel stiffness. In case of wood and plywood, a factor of influence is also the orientation of the kerfing lines, if they are parallel or perpendicular to the grain. They concluded that it is important to predict, in the case of kerfed structures and a desired curvature, the maximum deformation before fracturing as well as the maximum resistance to breakage.
Chen et al. [3] studied the effect of two kerfing patterns and of different laser cutting densities on 3 mm thick MDF samples. The samples were unit-patterns, subjected, in a custom-built mechanical testing system, to stretching, bending, and twisting. A bending test, using the same custom built testing equipment, was also performed on an MDF panel, where the sides of the panel were rigidly clamped, while a bending rod pressed the panel in the center. The results showed that higher density cuts lead to more flexible but lower-load bearing panels.
Kalama et al. [5] studied the bendability of plywood kerfed by laser with different cutting patterns and kerfing densities (kerfing pitch values). For bending, the 100 × 100 mm specimens had both sides fixed, while weights of different values in kg were centrally applied to determine the maximum load to fracture. Some of the specimens were elongated during this process. The specimens were photographed during maximum bending in order to determine their minimum radius at breakage. The conclusion was that the bendability depends on the material, its thickness, and the kerfing orientation with regard to wood grain, as well on the kerfing parameters (pattern type and complexity, pattern density, and the pattern lines length and their alignment).
In conclusion, in order to obtain a specific curvature, understanding the behavior of the kerfed material is necessary. Although there have been several studies on utilizing the kerfing method to create flexible structures, a systematic investigation regarding the effect of varying the kerfing parameters on the flexibilization of plywood panels, especially in kerfing using linear patterns, is still lacking. There are no specific guidelines with regard to which kerfing parameters should be used for a targeted panel flexibility.
The purpose of this paper is to propose a method for testing the effect of varying the kerfing parameters on the flexibilization of poplar plywood panels cut with a laser for indoor applications, such as furniture. Two kerfing parameters are taken in the analysis: the kerfing pitch and the kerfing length. A straight cut-through kerfing pattern is used for simple bending. The panel’s comparative behavior is studied in static bending, with a modified geometry of the test specimens, derived from the standard.

2. Materials and Methods

The testing material was poplar plywood, 8 mm thick, with 5 layers, a quality of AB/BB (corresponding to I/III from EN 635-2 [15]), and with a density of 0.456 kg/m3. It was purchased from the available market (Holver, Romania) and conditioned by storage in the working laboratory to a 7% moisture content. Two sheets of plywood with dimensions of 1500 × 1500 (mm) were used for cutting the testing samples.
The laser equipment was a CO2 laser (model 1610LP with RDWorks software, version V8.01.50), imported from China by WoodIQ, Comănești, Romania, and it provided a working surface of 1000 × 1600 mm. The laser has a wavelength of 10.6 μm, a 90 mm lens focal length, and a maximum output power of 180 W. All types of specimens used in this research were cut with a laser, using a scanning speed of 6 mm/s and at a power of 124.2 W (69% of the maximum power).
The specimen’s length coincided with the surface veneer grain direction. The test specimens prepared for static bending were of four categories as follows:
  • A standard specimen, which complied with EN 310 [16] requirements. The dimensions for testing plywood at 8 mm thick were 210 × 50 × 8 (mm), for a distance of 160 mm between the testing supports (20 times the panel thickness). It was referred as “standard” (Figure 1a).
  • A specimen derived from standard EN 310 [16], where dimensional recommendations were preserved (210 × 50 × 8 mm), but the sample was flexibilized in the central zone by kerfing with a laser at a 10 mm model pitch and on a 50 mm length (app. 30% of the distance between the testing supports). This was referred as “simple flexible sample” with a code indicating the pitch and flexibilization length: 10/50 (Figure 1b).
  • A modified specimen, derived from the standard test sample, to which a frame was added so that only the middle element/rail was subjected to bending. Frame dimensions were: 350 × 150 mm. The dimensions of the middle rail were 250 × 50 × 8 (mm), tested at a distance of 160 mm between the testing supports. It was referred as “framed rigid” or “reference” (Figure 1c).
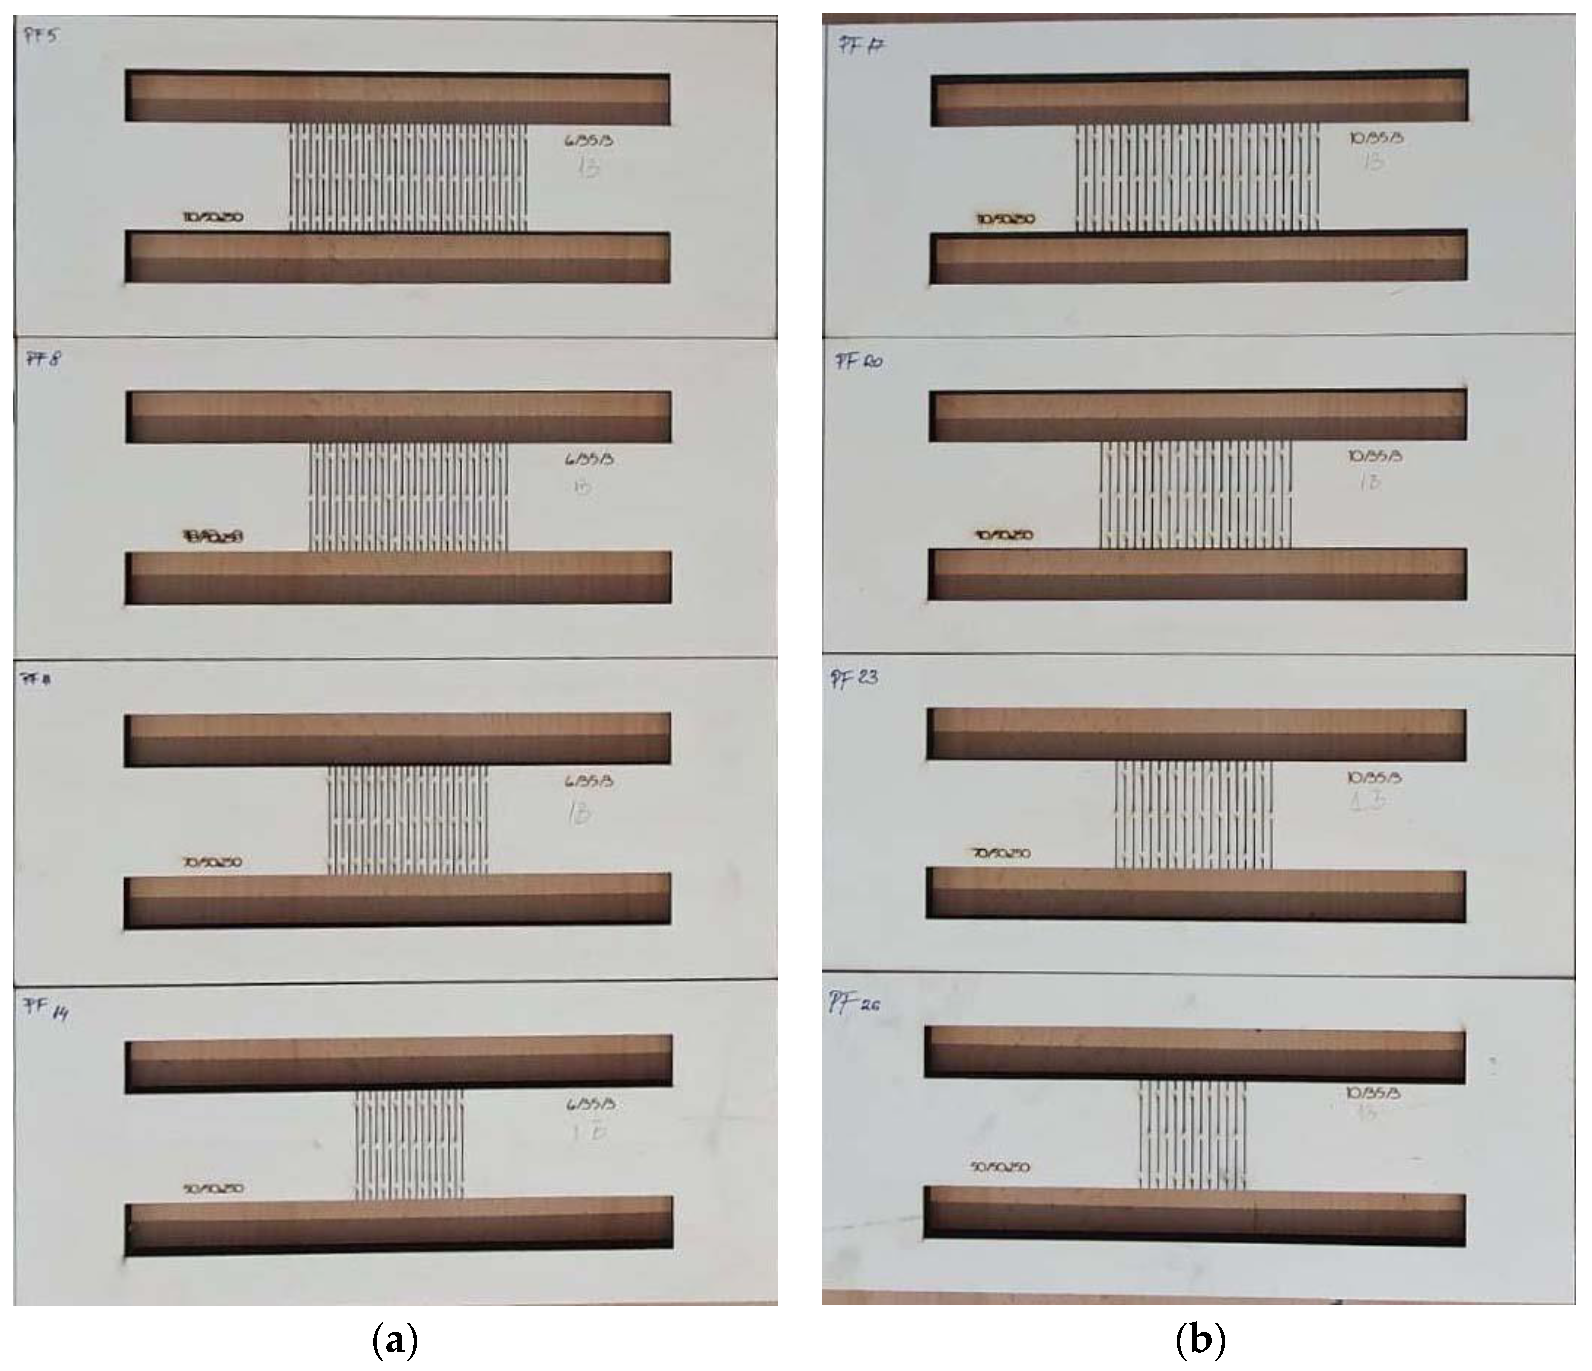
  • The modified specimens, to which a frame was added, as above, where the standard middle rail respected the standard dimensions, but the inner rail was flexibilized, similar to the “simple flexible sample”. The kerfing was made on different lengths: 50, 70, 90, and 110 mm (corresponding to a range from app. 30 to 70% of the distance between the testing supports). This type of specimen is referred as “framed flexible sample”, having a code related to the combination of model pitch and flexibilization length: 6/50, 6/70. 6/90. 6/110, 10/50, 10/70, 10/90, and 10/110 (Figure 1d and Figure 2).
The framed specimens were designed in such a way that the testing supports did not touch the outer frame, and neither did the load cell. In order to prevent the engagement in the bending test of the specimen frame, a length of 250 mm of the central rail and a gap of 20 mm (Figure 1c,d and Figure 3) from the frame elements, were found suitable.
The four types of specimens were meant to:
  • Test and compare the effect of using a framed specimen with a rigid inner rail, instead of a classic standard specimen.
  • Test the effect of kerfing the simple sample in comparison with the standard and with framed flexible ones.
  • From the above, decide upon the selection of the most appropriate testing samples, capable to sense the effect of changing the flexibilization variables
  • Testing the effect of flexibilization variables in static bending: model pitch (6 and 10 mm) and flexibilization length (50, 70, 90, and 110 mm).
The kerfing pattern selected for flexibilization was inspired from a model called “Straight”; it was chosen from the templates of an open design library, namely Obrary, licensed by CC-BY-SA (Creative Commons Attribution ShareAlike 4.0) [17]. “Straight” is the most common flexibility pattern and is based on straight lines repeatedly interleaved and cut at a certain distance, called pitch. The pitch is the distance between two straight lines placed at the same level and having the same length. The kerfing dimensional details are represented in Figure 4, for a flexibilization length of 50 mm and a kerfing pitch of 10 mm. The kerfing design used for the 6 mm kerfing pitch differed only in the frequency of cuts. It must be noted that kerfing lines were perpendicular to the grain of the outer veneer layers.
A universal testing machine, Zwick Roell Z10, produced by Zwick GmbH & Co., Ulm, Germany, with a 10 kN nominal test load, was used for the bending tests. The load was applied at a constant speed of 20 mm/min for the flexible samples and of 6 mm/min for those that were non-flexibilized. A higher testing speed for the flexible samples was considered necessary in order to reduce the long test duration. This decision was encouraged by previous tests, which have shown that measured parameters were not affected by reducing the test duration. Data were acquired and evaluated with testXpert® II software, version V5.20/2012. The software records the pairs load (N) deflection (mm) for the standard reference moments: 10% (F1, a1), 40% (F2, a2), and 100% (Fmax, aFmax) of the maximum load and at the moment of break (Fbreak, aFbreak). It calculates the values of the MOE (Em) and MOR (fm) by following the EN 310 instructions (1) and (2).
E m = l 1 3 ( F 2 F 1 ) 4 bt 3 ( a 2 a 1 )
where:
Em—the modulus of elasticity (N/mm2),
l1—the distance between the centers of the supports (mm),
b—the width of the test specimen (mm),
t—the thickness of the test specimen (mm),
F2 − F1—the increment of load on the straight-line portion of the load-deflection curve (N). According to EN 310 [16], F1 was approximately 10% and F2 was 40% of the maximum load.
a2 − a1—the increment of deflection at the mid-length of the test specimen (corresponding to F2 − F1).
f m = 3 F max l 1 2 bt 2
fm—the bending strength (N/mm2);
Fmax—the maximum load (N).
Generally, a number of 3–4 specimens were tested from each sample category and a mean value and standard deviation were calculated for each bending result. The MOE, MOR, and maximum deflection were analyzed in absolute values and percentage increase/decrease as relating to established references. Microscopic images were captured with a stereo-microscope, NIKON SMZ 18-LOT2 (Nikon Corporation, Tokyo, Japan) in order to examine the specimen’s failure and visualize the effect of the laser on plywood.

3. Results

3.1. Microscopic Examination

Figure 5 captures the stratified edge of a simple flexible test specimen, which was longitudinally cut by laser. The dark line represents the transversal kerfing. It can be observed that the laser affected the veneer layers in a different way as a function of their orientation. In the cross section, the laser seems to highlight all types of wood’s anatomical cells (fibers, vessels, and rays). The surface looks clean, with some molten material being visible inside the vessel’s cavities. However, longitudinal to the grain, wood looks carbonized; the wood anatomy is not identifiable with the exception of some vessels’ cavities being filled with molten material. The transversal kerfing showed a similar interesting phenomenon: when cutting along the grain, laser ablation was more pronounced than across the grain, and this appears as a difference in the kerfing width. The above behavior may be caused by the different thermal conductivity as related to the wood grain and heat direction of propagation. The less conductive direction, such as perpendicular to the grain, seems to transmit heat at a lower rate, increasing the occurrence of local carbonization and volatilization, and deepening the wood ablation.

3.2. Comparisons between Types of Test Specimens: Standard, Simple Flexible, and Framed Flexible

The tests in the EN 310 [16] are meant to give information about the performance of samples, which sit stable on the supports. However, the simple flexible samples were very flexible and tended to fall between the supports at high deflections. The deflection of the simple flexible samples was much higher in comparison to the standard and framed specimens (Table 1), and breakage eventually took place in the kerfed area. Past tests have shown that flexibilized simple samples, with a flexible length longer than 30% of the supporting distance, slide completely from the supports. Breakage does not occur and testing data are not recorded, which makes any comparisons impossible. EN 310 [16] gives a recommendation in case deflection of the test piece is large but failure does not occur, suggesting that the distance between supports shall be reduced. In a previous series of tests, this standard recommendation was tested and the distance between supports was reduced to 120 mm, but elements flexibilized to 40–70% of the supporting distance failed the test. It was anticipated that future testing on panels thinner than 8 mm will cause even more problems. EN 310 [16] also specifies: “plywood test pieces shall be free of visible strength-reducing characteristics”. Obviously, the kerfed samples were not. It was concluded that the method using the simple flexible specimens, directly derived from standard, is not suitable for the purpose of our research, and a more robust method is needed that will work for any flexibilization variable intended, for example panel thickness, species, kerfing pattern, model pitch, length of flexibilization, and panel type (plywood, MDF, others).
Instead, frame-type specimens prevented the slip of the tested middle element from the equipment supports, which seems promising for managing the tests with different flexibilization variables, and therefore, they were preferred for this purpose.
Figure 6 shows the failure of specimens. For all types of specimens, failure began from the side in tension. The outer layer of veneer broke as a result of tensile stresses, then the stresses continued to propagate causing longitudinal share failure, resembling a “simple tension failure” [18], for standard specimens in Figure 6a,b. The same aspect was visible for frame rigid specimens. The simple flexible specimens failed, after a long deflection, in the central part of the sample, which was frailed by kerfing (Figure 6c,d). The model of kerfing leaves only one or two small contact areas between the consecutive cuts. On the cross section, the veneer plies 1, 3, and 5 had a longitudinal grain orientation at bending, while plies 2 and 4 had a 90° orientation. This means that the resistance to bending is mostly attributed to the panel outer plies, since ply number three coincides with the location of the neutral axis. The way of breakage may be influenced by the local quality and orientation of material plies, the reduced area of the kerfed model, the orientation of the kerfing lines, the differences in elasticity between adjacent zones and not on the last, and by the changes induced by the laser (local carbonization, loss in moisture content, and an increase in brittleness).
It was observed that the frame-type variants recorded two possible places of breakage in comparison with simple flexible specimens. Here, the breakage sometimes occurred in the central kerfed region (Figure 6e,f), while some other times, breakage occurred at the interface between the rigid (unkerfed) area and the flexible area (Figure 6g,h). Approximately 80% of the framed flexible samples, at a 6 mm pitch and app. 35% of those with 10 mm pitch, failed at the rigid–flexible interface (Figure 6g), while the difference till 100% broke in the middle of the kerfed model (Figure 6). The breakage in the flexible specimens began from the small connecting regions of the kerfing model, failing in tension, and continued with share efforts at multiple depth levels (Figure 6d,f,h).

3.3. Comparisons between the Standard and Framed Rigid Specimens

In this analysis, it was interesting to see to which extent the addition of a frame to the testing specimen is affecting the testing results, in comparison with standard testing specimen, in static bending.
The testing results are contained in Table 2.
From Table 2, it can be observed that changing the type of testing specimens from standard to the framed ones produced a slight increase of the MOE with about 15% and of the MOR with app. 8%, while the maximum deflection decreased with 35%. This result indicates that framing the specimens produces a slight increase in their stiffness, but this, however, does not invite a change in the testing method. In order to quantify the change produced by each flexibilization parameter, framed rigid specimens can be kept as a reference, as non-flexibilized panels. They will be compared with modified specimens of the same type, the framed-flexible specimens.

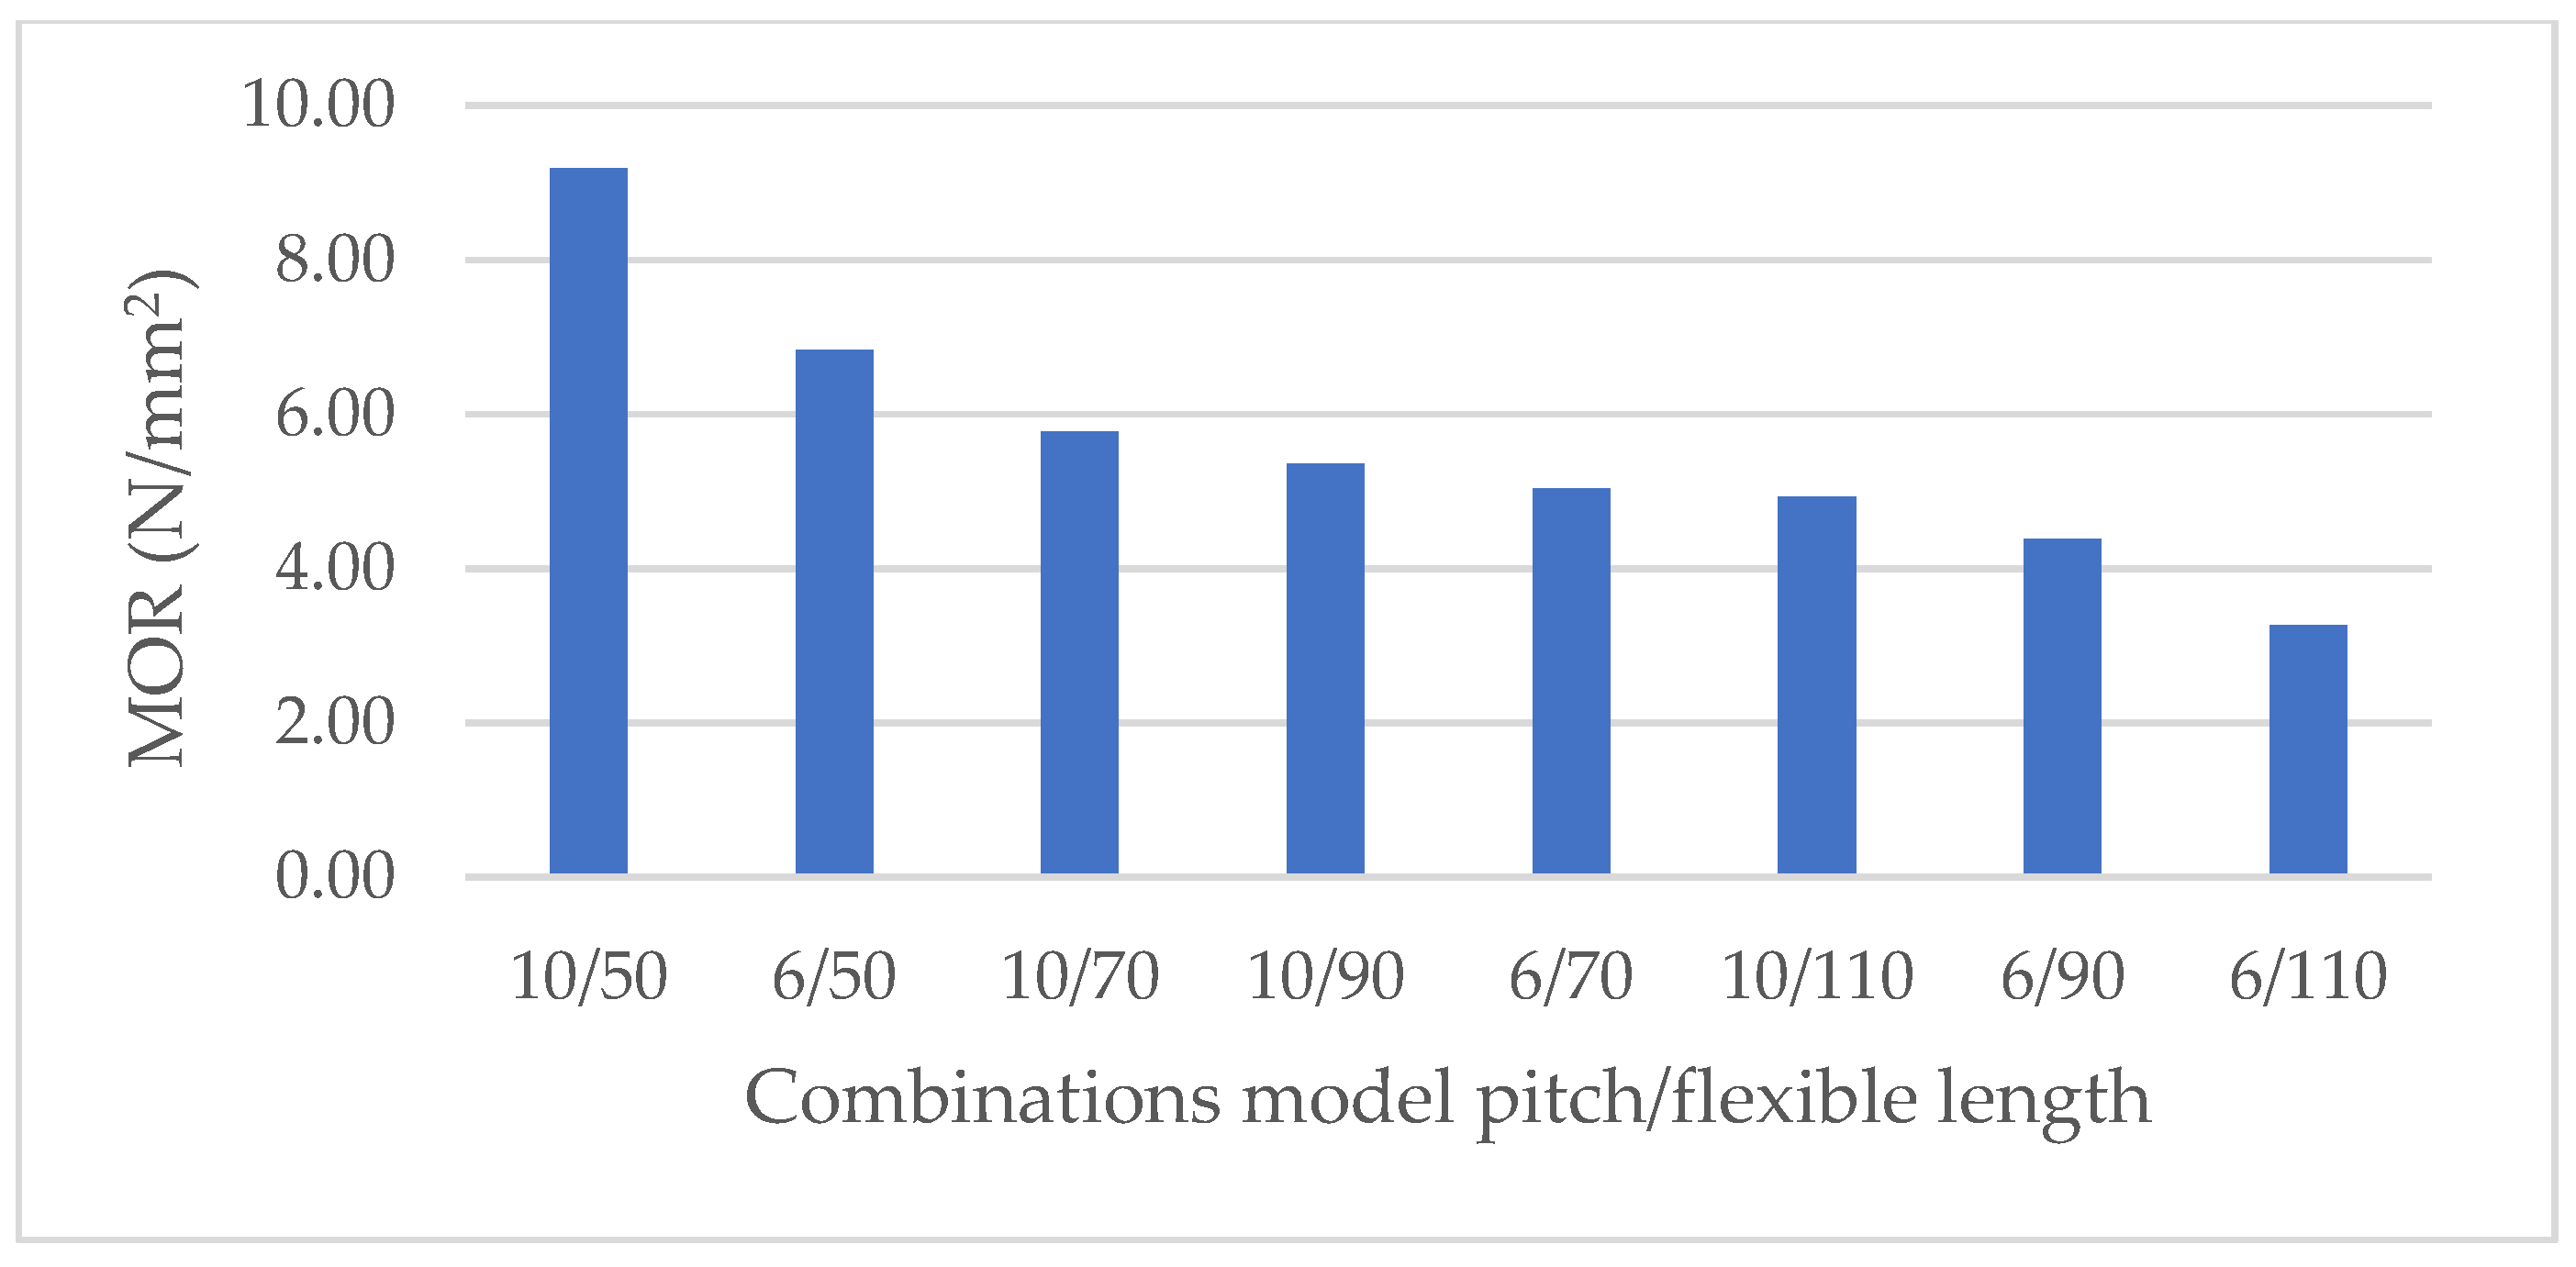
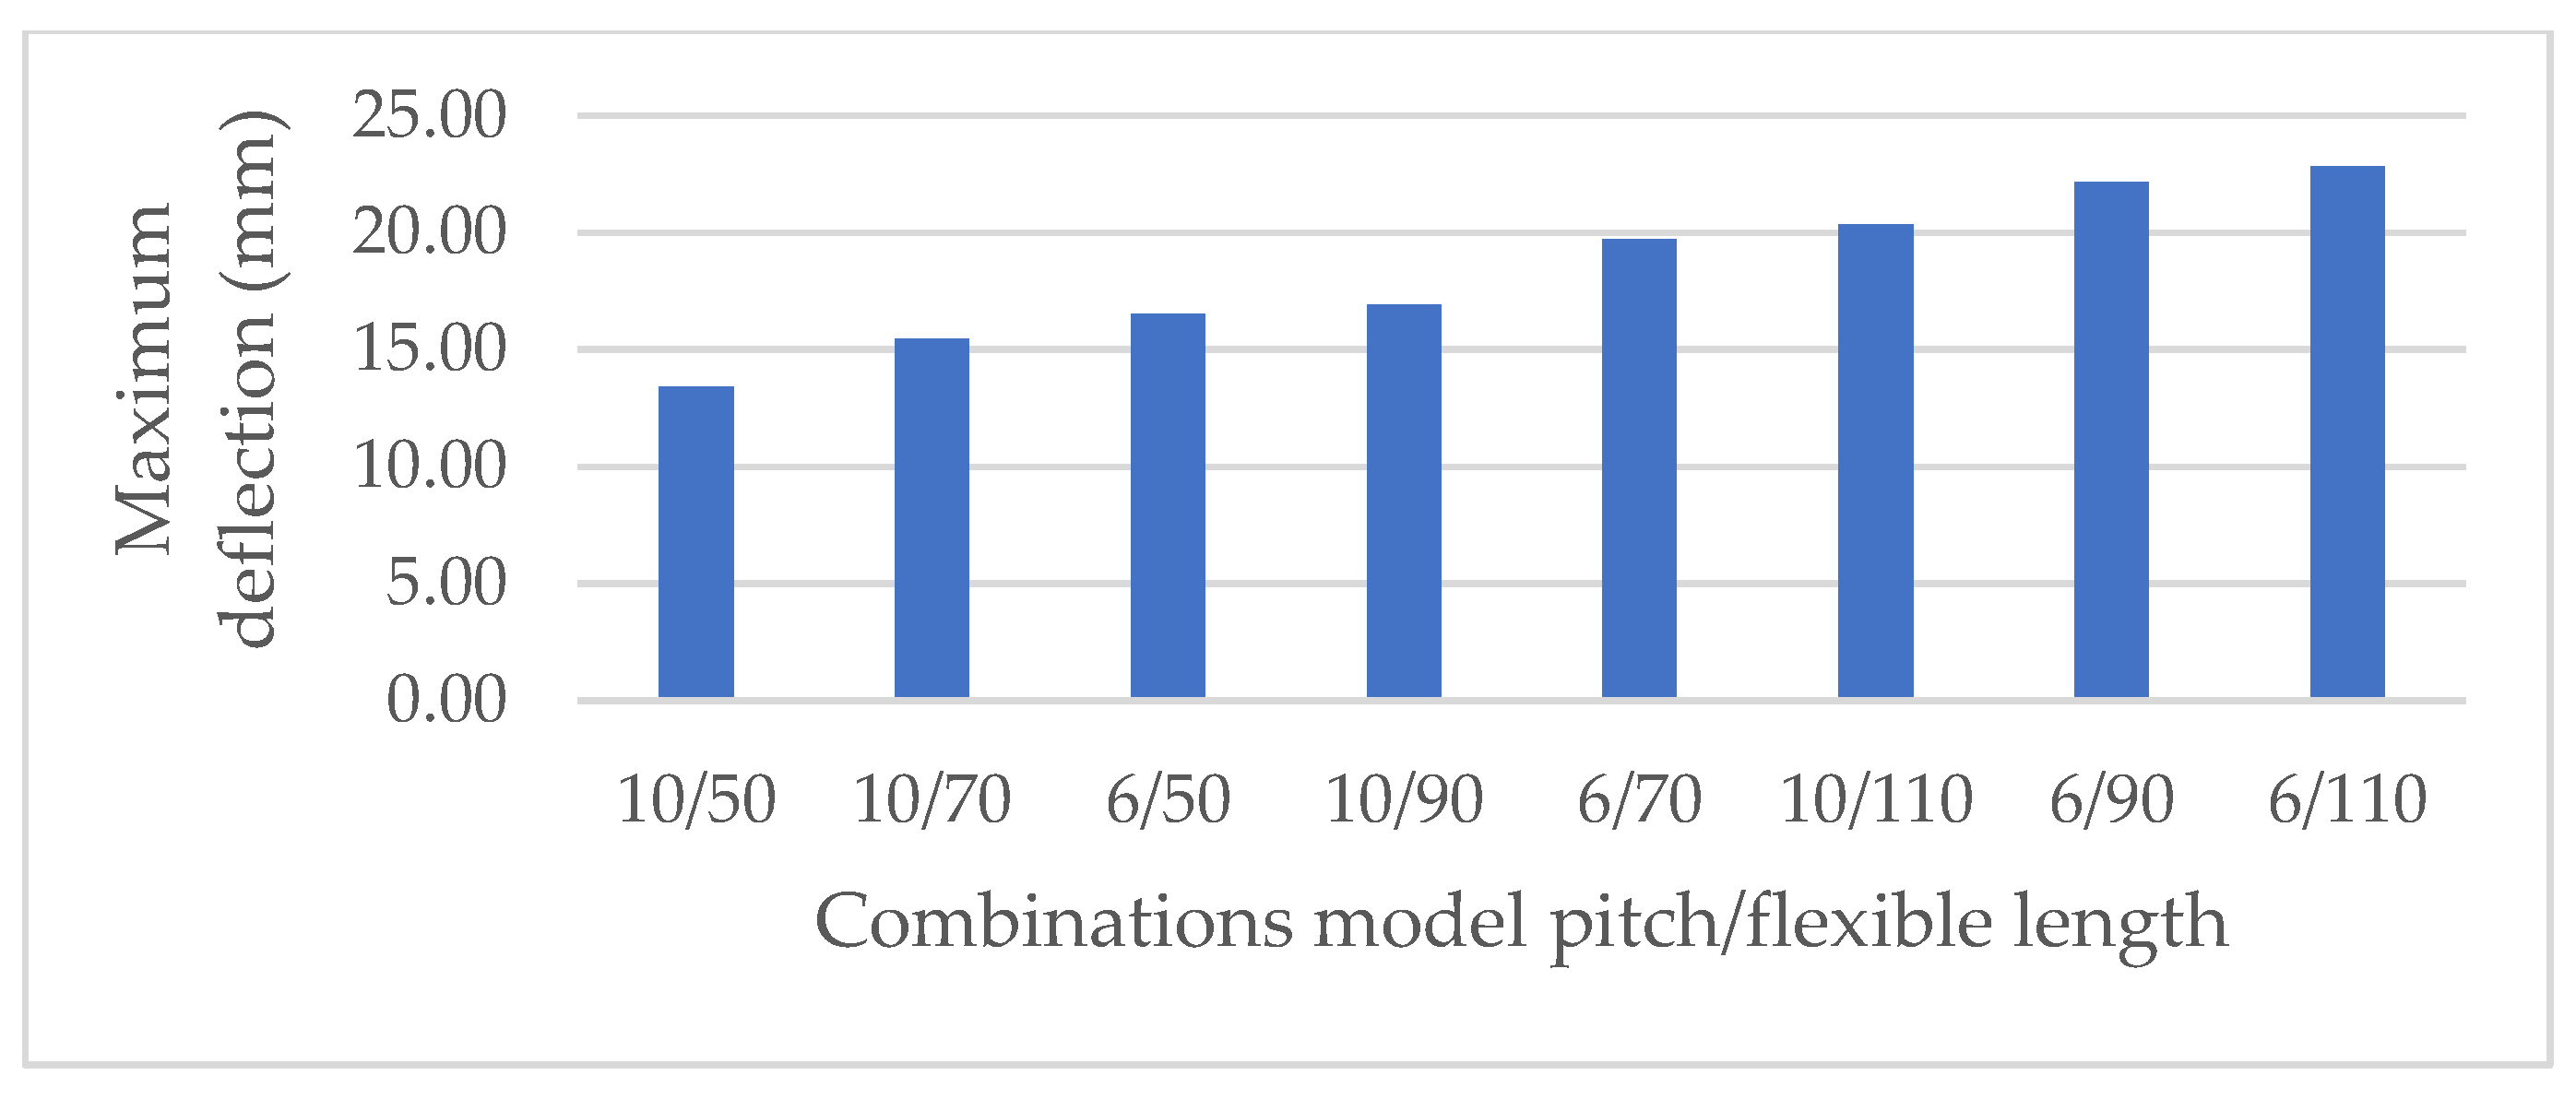
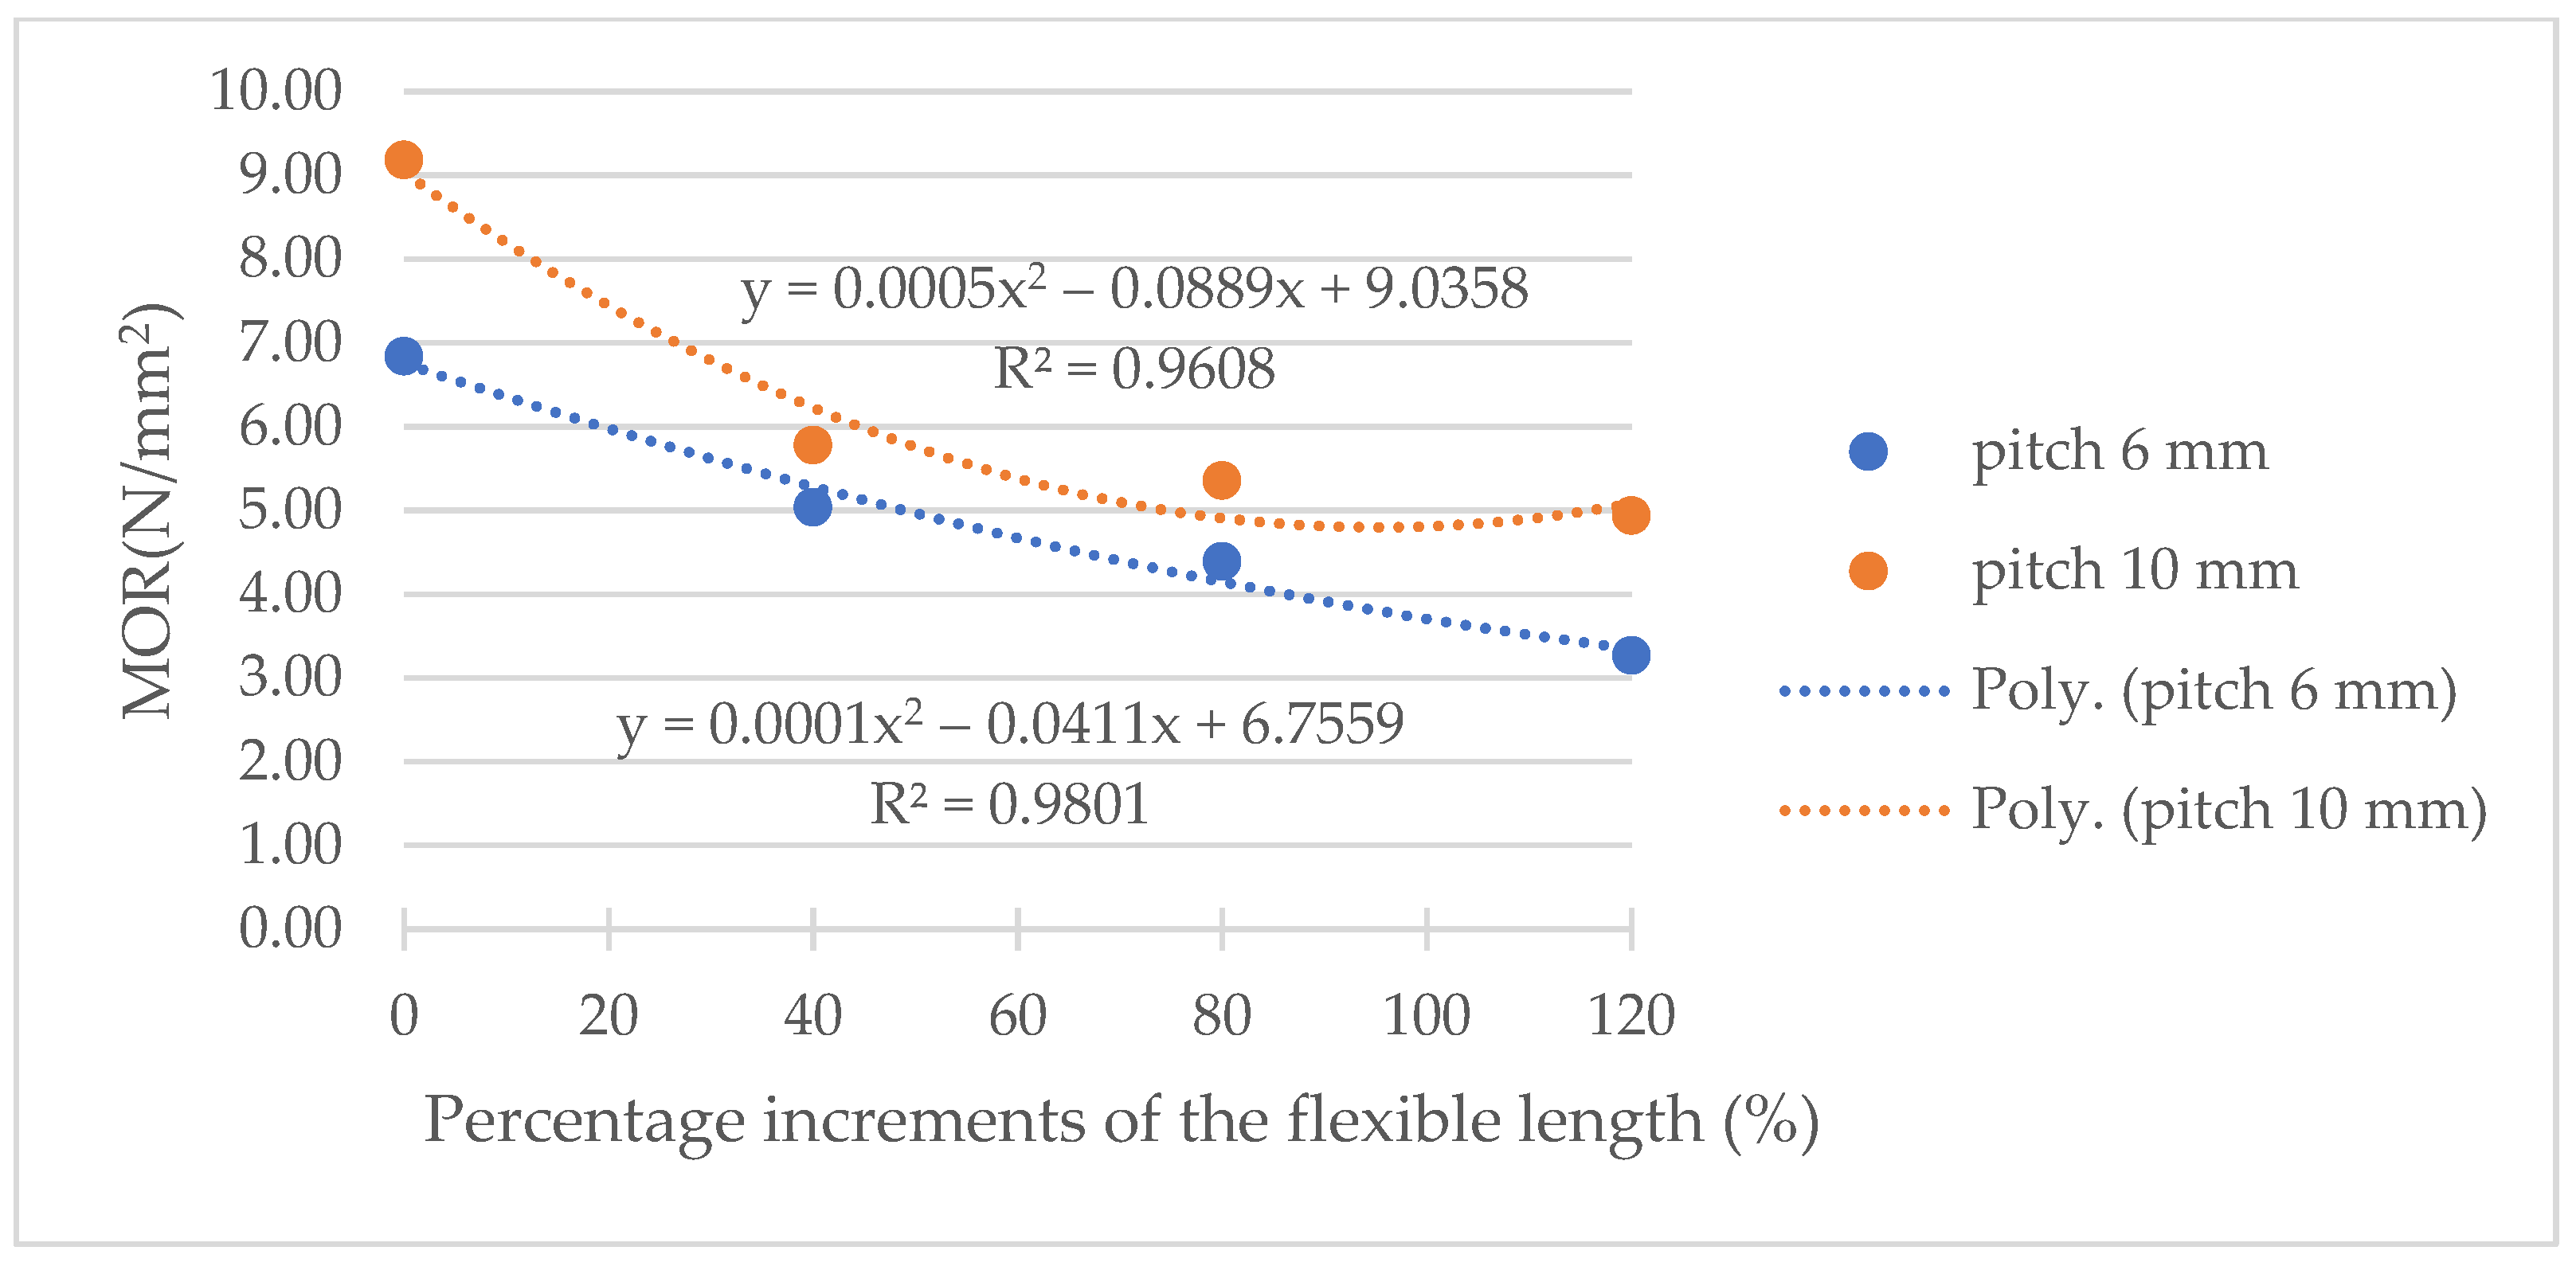
3.4. Study regarding the Impact of Flexibilization Parameters upon the MOE, MOR, and Maximum Deflection in Static Bending

This study was performed on modified, framed test specimens, where the effect of the flexibilization parameters was studied in comparison with the framed rigid specimens, taken as a reference. It was also studied in comparison between the flexibilized specimens. The measuring results are included in Table 3.
It must be mentioned that the measured values, in the case of frame-type specimens, are indicative and not absolute, but can be useful for comparisons and for evaluation of the changes in the MOE, MOR, or maximum deflection, as percentage increases or decreases, occurring by flexibilization.
The test results in Table 3 gathered the most important pairs of load-deflection data. This allowed a graphical representation of the load-deflection curves for each case of flexibilization (Figure 7). The first pair of data was F1 and a1, corresponding to 10% of Fmax, and the last was Fbreak and abreak. The slopes of the elastic domain have clearly shown a hierarchy from the most rigid samples, characterized by the highest slope and the lowest maximum deflection, 10/50 and then 6/50, to the most flexible ones, corresponding to the lowest slope and highest deflection (6/110, 6/90, and 10/110). As expected, for the same kerfing pitch, an increase of the kerfing length increases the flexibilization. For the same flexibilization length, an increase in the frequency of laser cuts makes the material more flexible. Another observation is related to the shape of the load-deflection curves, which were predominantly linear until occurrence of Fmax, followed by an abrupt change in direction at failure. In comparison, the classic curves in bending have a distinctive curve beyond the elastic linear zone. It would be interesting, in future research, to study this behavior in more depth.
An increase in flexibility translates in a decrease in the MOE and MOR and an increase in maximum deflection (Table 3). The effect of combinations of pitch/flexibilization length upon the MOE, MOR, and maximum deflection, can be visually analyzed in Figure 8, Figure 9 and Figure 10, where mean values were arranged in descending order for MOE and MOR and ascending order for the maximum deflection.
According to [3], the kerfing technique promotes flexible surfaces, but it reduces the load carrying capacity of the panels so that higher density cuts (larger pitch) lead to more flexible but lower load bearing structures. This is confirmed by results in Table 3 and Figure 9, when comparing the impact of the kerfing pitch for the same flexibilization length: higher frequency cuts caused a lowering in the MOR. Chen et al. [3] recommend, when designing desired geometrical shapes, to consider the kerfing pitch so that a balance between panel flexibility and bending strength is reached. It was observed and tested with ANOVA, that combinations 6/70 and 10/110 had similar values of the MOR and maximum deflection, although the combination 10/110 has a 20% lower stiffness. This result is inspiring when the same deflection of the sample is envisaged but on different flexibilization lengths, giving the possibility of achieving the goal by simply changing the frequency of the model. A greater number of tests and combinations of flexibilization parameters are needed in order to optimize the selection of the best combination for achieving the desired bendability and at the best possible strength.
The following analysis is looking to observe whether there is a law of variation in the MOE, MOR, and maximum deflection with an incremental increase in the flexibilization length. The reference, in this case, was the 50 mm flexibilization length, for which the length increased in increments of 40%: 0% (for 50 mm), 40% (for 70 mm), 80% (for 90 mm), and 120% (for 110 mm). The results are displayed in Figure 11, Figure 12 and Figure 13.
The representation is useful if we look for evaluation of the effect of a certain percentage increase in the flexibilization length on the bending results. For example, an increase of the flexibilization length by 120% has decreased the MOE with app. 72% and increased the maximum deflection with app. 52% for a kerfing pitch of 10 mm.
The differences in the values of the MOE between the two kerfing pitch variants have attenuated with the increase in the flexibilization length, while for the MOR and maximum deflection not specific trend can be outlined.
High correlations were found for MOE, MOR, and the maximum deflection with the flexibilization length (R2 greater than 0.9). This, on one hand, is a useful result for future building of a mathematical model of bending, such flexible structures for different input parameters. On another hand, it can be considered a successful test for the new proposed samples, with modified geometry, which proved their sensitivity to the variation in the input parameters and made them reliable.
The judgement went further and included the non-flexible framed samples in a comparative analysis with the flexible ones. The framed rigid samples were taken as references and the effect of including a flexible zone of different lengths in the specimen was studied. Since the absolute values of the MOE, MOR, and maximum deflection may have been somehow altered by the new sample’s geometry, the comparisons were made as a percentage increase or decrease. The flexibilization length was related to the distance between the testing supports (160 mm), as a percentage, so that for the non-flexible samples, the flexibilization percentage was zero; for the 50 mm length, this was 31 and 25% and so on. The percentage change in the MOE, MOR, and maximum deflection was calculated for each combination pitch/flexibilization length as related to the framed rigid samples, taken as a reference.
The results are shown in Figure 14, Figure 15 and Figure 16.
From the absolute values in Table 3 and the percentage difference from Figure 14, Figure 15 and Figure 16, it can be seen that the most flexible variant was 6/110. This corresponds to a pitch of 6 mm and to an app. 70% increase in the flexibilization length as related to the non-flexibilized reference. The flexibilization caused a sharp decrease in the MOE, app. 74 times, corresponding to a 98% gain in elasticity. However, the MOR decreased as well, 12 times, corresponding to a 91% loss in strength. As far as the maximum deflection is concerned, it increased 4.5 times. For the same flexibilization length, an increase of the kerfing pitch from 6 to 10 mm has reduced the loss in the MOE to 43 times, in the MOR to 8 times, and increased the maximum deflection approximately 4 times as related to the rigid samples. The laws of variation were similar for both values of the kerfing pitch.
The correlations in Figure 14, Figure 15 and Figure 16 were very good. This means that for a given change in the flexibilization length, a percentage change in the MOE, MOR, and maximum deflection could be predicted. However, a greater number of tests, with a larger range of flexibilization parameters are needed, in order to confirm the reliability of these initial experimental mathematical correlations. The selection of the flexibilization parameters will also be conditioned by the final use of the flexible panels and their strength requirements.
Based on such studies, a better understanding of the influence of flexibilization variables on the MOE, MOR, and maximum deflection can be pursued and followed by modeling of the flexibilization process.

4. Discussion and Conclusions

There is a lack of information regarding the effect of various input variables upon the flexibilization of plywood panels kerfed through with a laser, which can be used in indoors applications, such as furniture parts. The quantification of this effect requires a reliable testing method. The understanding of the behavior of flexibilized panels in bending is challenged by the limitations in testing with standard procedures, such as in EN310 [16] and by a lack of specific recommendations. Flexibilized specimens based on standard dimensions are prone to fail the test; they slip from the supports and, most often, test data are not recorded. In order to overcome these testing limitations, this research proposed a test method in static bending, which is able to detect the changes caused by modifications of the flexibilization parameters, such as the kerfing pitch (6 and 10 mm) and the flexibilization length (50, 70, 90, and 110 mm). New test samples were proposed for this purpose, but with a modified geometry (a frame was added), as compared with the standard specimens. To our knowledge, no similar method was found in the literature.
Flexibilized framed test samples were compared with framed samples without flexibilization, in absolute values and percentage change. It was found that for the same kerfing pitch, an increase of the kerfing length increased the flexibilization, and for the same flexibilization length, an increase in the frequency of the laser cuts has made the material more flexible. These findings are in agreement with statements from literature [3,5,8,14]. The flexibilization result was measurable, in our study, by a decrease in the MOE and an increase in the maximum deflection. A reduction, at the same time, of the MOR, indicates the need for a balance between the panel flexibility and bending strength suitable to the panel’s final use, as also remarked in studies of [3,8].
High correlations were found for MOE, MOR, and the maximum deflection with the flexibilization length (R2 greater than 0.9). The correlations are useful if we look for evaluating the effect of a certain percentage change in the flexibilization length upon the bending results. Furthermore, those high correlations prove the usefulness and sensitivity of the test method to the input variables. The method could be used in further studies for a better understanding of the influence of more flexibilization variables (type of material, panel thickness, kerfing pattern and pitch, flexibilization length, kerfing direction with relation to the grain, minimum bending radius, and others), which will help in modeling the flexibilization process for given indoors applications.

Author Contributions

Conceptualization, L.G. and C.-D.C.; methodology, L.G. and C.-D.C.; software, S.-V.G.; validation, L.G., C.-D.C. and C.C.; formal analysis, L.G. and C.C.; investigation, C.-D.C. and L.G.; resources, C.-D.C. and S.-V.G.; data curation, C.-D.C.; writing—original draft preparation, L.G. and C.-D.C.; writing—review and editing, L.G., C.-D.C. and C.C.; visualization, C.C.; supervision, L.G. All authors have read and agreed to the published version of the manuscript.

Funding

This research received no external funding.

Institutional Review Board Statement

Not applicable.

Informed Consent Statement

Not applicable.

Data Availability Statement

Not applicable.

Acknowledgments

The authors acknowledge the structural funds project PRO-DD (POS-CCE, O.2.2.1., ID 123, SMIS 2637 and ctr. No. 11/2009) for providing the infrastructure used in this work.

Conflicts of Interest

The authors declare no conflict of interest.

References

  1. Kang, H.G. A Study on the Technique and Process of Bending Wood. KFS J. 2010, 21, 459–468. [Google Scholar]
  2. Gutowski, S.M. Bend, Break, and Learn. Master’s Thesis, University of Iowa, Iowa City, IA, USA, 2019. [Google Scholar]
  3. Chen, R.; Turman, C.; Jiang, M.; Kalantar, N.; Moreno, M.; Muliana, A. Mechanics of kerf patterns for creating freeform structures. Acta Mech. 2020, 231, 3499–3524. [Google Scholar] [CrossRef]
  4. Shahid, Z.; Hubbard, J.E.; Kalantar, N.; Muliana, A. An investigation of the dynamic response of architectural kerf structures. Acta Mech. 2022, 233, 157–181. [Google Scholar] [CrossRef]
  5. Kalama, A.M.; Tzoni, D.; Symeonidou, I. Kerf Bending: A Genealogy of Cutting Patterns for Single and Double Curvature. In Proceedings of the 7th International Conference on Geometry and Graphics Mongeometrija, Faculty of Mechanical Engineering, Belgrade, Serbia, 18–21 September 2020. [Google Scholar]
  6. Zarrinmehr, S.; Ettehad, M.; Kalantar, N.; Borhani, A.; Sueda, S.; Akleman, E. Interlocked Archimedean spirals for conversion of planar rigid panels into locally flexible panels with stiffness control. Comput. Graph. Amst. 2017, 66, 93–102. [Google Scholar] [CrossRef]
  7. Super Flexible Laser Cut Plywood. Available online: http://lab.kofaktor.hr/en/portfolio/super-flexible-laser-cut-plywood (accessed on 2 March 2022).
  8. Kalantar, N.; Borhani, A. Informing deformable formworks, parameterizing deformation behavior of a non-stretchable membrane via kerfing. In Learning, Prototyping and Adapting—Proceedings of the 23rd CAADRIA Conference—Volume 2, Beijing, China, 17–19 May 2018; Tsinghua University: Beijing, China, 2018; pp. 339–348. [Google Scholar]
  9. Dukta.com. Available online: https://dukta.com/en/projects/boutique/ (accessed on 2 March 2022).
  10. Pinterest. Available online: https://www.pinterest.ie/pin/375206212688700052/ (accessed on 2 March 2022).
  11. Capone, M.; Lanzara, E. Kerf bending: Ruled double curved surfaces manufacturing. In Proceedings of the 22th Conference of the Iberoamerican Society of Digital Graphics, São Paulo, Brazil, 7–9 November 2018. [Google Scholar]
  12. Jensen, M.B.; Blindheim, J.; Steinert, M. Prototyping shape-changing interfaces—An evaluation of living hinges’ abilities to resemble organic, shape-changing interfaces. In Proceedings of the 21st International Conference on Engineering Design (ICED17), Volume 4, Design Methods and Tools, Vancouver, BC, Canada, 21–25 August 2017. [Google Scholar]
  13. Güzelci, O.Z.; Alaçam, S.; Bacinoğlu, S.Z. Three-step experimentation on embedding curvature to rigid planar materials through cut patterns. Gestão e Tecnologia de Projetos 2017, 12, 93–107. [Google Scholar] [CrossRef]
  14. Greenberg, E.; Körner, A. Subtractive manufacturing for variable-stiffness plywood composite structures. In Proceedings of the International Conference on Sustainable Design and Manufacturing, Cardiff University, Cardiff, UK, 28–30 April 2014. [Google Scholar]
  15. EN 635-2: 1995; Plywood-Classification by Surface Appearance. Part 2-Hardwood. European Committee for Standardization: Brussels, Belgium, 1995.
  16. EN 310: 1993; Wood-Based Panels—Determination of Modulus of Elasticity in Bending and of Bending Strength. British Standards Institution: London, UK, 1993.
  17. Obrary, Living Hinge Swatches. Available online: https://obrary.com/products/living-hinge-patterns (accessed on 5 April 2022).
  18. Bodig, J.; Jayne, B.A. Mechanics of Wood and Wood Composites; Krieger Publishing: Melbourne, FL, USA, 1993; p. 736. [Google Scholar]
Figure 1. Four types of samples, tested in bending: (a) standard; (b) simple flexible; (c) framed rigid; (d) framed flexible.
Applsci 12 04303 g001
Figure 2. Framed flexible samples, for four flexibilization lengths, from bottom to top (50, 70, 90, and 110 mm) and two values of the kerfing pitch: (a) 6 mm; (b) 10 mm.
Applsci 12 04303 g002
Figure 3. Framed rigid specimen during bending test.
Applsci 12 04303 g003
Figure 4. Kerfing pattern and dimensions for a flexibilization length of 50 mm and a kerfing pitch of 10 mm.
Applsci 12 04303 g004
Figure 5. Microscopic image of the edge of a simple flexible specimen (poplar plywood) cut by laser. The dark zone corresponds to the transversal kerfing (magnification 22.5×).
Applsci 12 04303 g005
Figure 6. Failure of test specimens: (a,b) standard; (c,d) simple flexible; (e,f) frame flexible-central failure; (g,h) frame flexible-side failure. Micrographs (b,d,f,h) have 22.5× magnification.
Applsci 12 04303 g006aApplsci 12 04303 g006b
Figure 7. Load-deflection curves for flexibilized plywood samples.
Applsci 12 04303 g007
Figure 8. Mean values of the MOE for combinations of model pitch and flexible length.
Applsci 12 04303 g008
Figure 9. Mean values of the MOR for combinations of model pitch and flexible length.
Applsci 12 04303 g009
Figure 10. Mean values of the maximum deflection for combinations of model pitch and flexible length.
Applsci 12 04303 g010
Figure 11. The variation in the MOE with an incremental increase in the flexibilization length, for two values of the model pitch.
Applsci 12 04303 g011
Figure 12. The variation in the MOR with an incremental increase in the flexibilization length, for two values of the model pitch.
Applsci 12 04303 g012
Figure 13. The variation in the maximum deflection with an incremental increase in the flexibilization length, for two values of the model pitch.
Applsci 12 04303 g013
Figure 14. Correlations between percentage change in the MOE with changes in the flexibilization length, for two values of the kerfing pitch.
Applsci 12 04303 g014
Figure 15. Correlations between percentage change in the MOR with changes in the flexibilization length, for two values of the kerfing pitch.
Applsci 12 04303 g015
Figure 16. Correlations between percentage change in the maximum deflection with changes in the flexibilization length, for two values of the kerfing pitch.
Applsci 12 04303 g016
Table 1. Results of static bending (mean values and standard deviation) for standard, simple flexible, and framed flexible samples.
CodeSpecimen IdentifierF1
N
F2
N
a1
mm
a2
mm
Em
N/mm2
Fmax
N/mm2
fm
N/mm2
aFmax
mm
FBreak
N
fBreak
N/mm2
aBreak
mm
StandardStandard rigid48.70194.900.722.263800.00487.0036.507.90487.0037.007.90
10/50Simple flexible1.506.150.4711.1817.1515.301.1542.2513.251.0058.05
stdev0.140.640.300.301.771.560.121.771.340.001.77
10/50Framed flexible12.2549.001.385.40369.00125.009.1913.4396.707.5013.98
stdev0.692.880.060.172.839.900.550.8825.882.121.51
Table 2. Results of static bending (mean values) for standard and framed rigid samples.
CodeSpecimen IdentifierF1
N
F2
N
a1
mm
a2
mm
Em
N/mm2
Fmax
N/mm2
fm
N/mm2
aFmax
mm
FBreak
N
fBreak
N/mm2
aBreak
mm
StandardStandard rigid48.70194.900.722.263800.00487.0036.507.90487.0037.007.90
ReferenceFramed rigid52.73210.880.782.234395.00512.0039.535.13512.0038.505.13
Table 3. Results of static bending (mean values and standard deviation) for reference-framed rigid and framed flexible samples kerfed with two pitch values (6 and 10 mm) and four flexibilization lengths (50, 70, 90, and 110 mm).
CodeSpecimen Identifier F1
N
F2
N
a1
mm
a2
mm
Em
N/mm2
Fmax
N/mm2
fm
N/mm2
aFmax
mm
FBreak
N
fBreak
N/mm2
aBreak
mm
Ref.Framed rigidMean52.73210.880.782.234395.00512.0039.535.13512.0038.505.13
stdev11.6146.420.110.317.0724.048.741.2624.042.121.26
10/50Framed flexibleMean12.2549.001.385.40369.00125.009.1913.4396.707.5013.98
stdev0.692.880.060.172.839.900.550.8825.882.121.51
10/70Framed flexibleMean7.7030.801.535.92212.5077.035.7815.4866.584.5015.48
stdev1.887.450.311.0520.5118.611.402.4217.050.712.42
10/90Framed flexibleMean7.1528.601.867.49152.0071.455.3616.9067.405.0017.20
stdev0.642.400.180.089.906.010.451.130.990.000.85
10/110Framed flexibleMean6.5726.302.8310.31103.5065.774.9320.3363.104.6720.33
stdev0.351.410.190.439.193.470.260.747.170.580.74
6/50Framed flexibleMean9.3836.481.706.33239.0091.286.8416.5384.607.0016.68
stdev2.137.010.301.0118.0017.721.322.6418.641.002.63
6/70Framed flexibleMean6.7026.832.158.38129.3367.135.0419.7067.035.0019.70
stdev0.261.020.240.452.082.510.191.782.340.001.78
6/90Framed flexibleMean5.8523.453.1611.1887.5558.554.3922.1555.304.5022.15
stdev0.351.630.300.761.204.030.311.918.630.711.91
6/110Framed flexibleMean4.3517.403.4912.2659.4043.553.2722.8538.353.0022.90
stdev0.642.550.440.835.946.290.471.634.880.001.70
Publisher’s Note: MDPI stays neutral with regard to jurisdictional claims in published maps and institutional affiliations.

