
Detection of Yunnan Pine Shoot Beetle Stress Using UAV-Based Thermal Imagery and LiDAR


1
Key Laboratory of Remote Sensing and Geographic Information System of Henan Province, Institute of Geography, Henan Academy of Sciences, Zhengzhou 450000, China
2
Qianyanzhou Ecological Research Station, Key Laboratory of Ecosystem Network Observation and Modeling, Institute of Geographic Sciences and Natural Resources Research, Chinese Academy of Sciences, Beijing 100101, China
3
State Key Laboratory of Subtropical Silviculture, Zhejiang Agriculture and Forest University, Hangzhou 311300, China
4
PIESAT International Information Technology Limited, Beijing 100195, China
5
Key Laboratory for Silviculture and Conservation of Ministry of Education, Beijing Forestry University, Beijing 100083, China
*
Author to whom correspondence should be addressed.
Appl. Sci. 2022, 12(9), 4372; https://0-doi-org.brum.beds.ac.uk/10.3390/app12094372
Submission received: 17 February 2022
/
Revised: 13 April 2022
/
Accepted: 20 April 2022
/
Published: 26 April 2022
(This article belongs to the Special Issue Advances in Geospatial Techniques on Ecosystem Monitoring)
Abstract
:Infestations of Tomicus spp. have caused the deaths of millions of Yunnan pine forests in Southwest China; consequently, accurate monitoring methods are required to assess the damage caused by these pest insects at an early stage. Considering the limited sensitivity of optical reflectance on the early stage of beetle stress, the potential of thermal infrared (TIR) can be exploited for monitoring forest health on the basis of the change of canopy surface temperature (CST). However, few studies have investigated the impact of the leaf area index (LAI) on the accuracy of TIR data-based SDR assessments. Therefore, the current study used unmanned airborne vehicle (UAV)-based TIR and light detection and ranging (LiDAR) data to assess the capacity of determining the potential for using TIR data for determining SDR under different LAI conditions. The feasibility of using TIR for monitoring SDRs at the tree level and plot scales were analyzed using the relationship between SDR and canopy temperature. Results revealed that: (1) prediction accuracy of SDR from CST is promising at high LAI values and decreases quickly with LAI, and is higher at the single tree scale (R2 = 0.7890) than at the plot scale (R2 = 0.5532); (2) at either single tree or plot scale, a significant negative correlation can be found between CST and LAI (−0.9121 at tree scale and −0.5902 at plot scale); (3) LAI affects the transmission paths of sunlight and sensor, which mainly disturbs the relationship between CST and SDR. This article evaluated the high possibility of using TIR data to monitor SDRs at both tree and plot levels and assessed the negative impact of a low LAI (<1) on the relationship between temperature and SDR. Accordingly, when measuring forest health using TIR data, additional data sources are required to eliminate the negative impact of low LAIs and to improve the monitoring accuracy.
1. Introduction
Forest pests, such as Tomicus spp., have seriously affected the economic benefits and ecological environment of coniferous forests [1,2]. Moreover, forest pests also cause the issues of forest degradation and disturbed ecosystem services and have an impact on forest carbon sequestration and sustainable forest management [3,4]. The appearance and spread of pests and diseases can be reflected quickly and objectively using data acquired from high-precision satellite technology [5]. Therefore, it is becoming increasingly necessary to use spatial data at various scales to rapidly locate and assess affected areas and the degrees of pest stress in forests [6]. Optical remote sensing, which uses spectral characteristics to monitor forest pests, is limited to red and gray attacks (late stage) [7,8,9]. Accordingly, some researchers use the water content sensitivity of thermal infrared (TIR) remote sensing to monitor forest pests during the early stage of an attack [10,11].
The canopy surface temperature (CST) reflects the transfer and exchange of energy within a soil–plant–atmosphere continuum (SPAC). The changes in CST monitored by TIR imaging exhibit responses to environment stress, such as drought [12,13], disease [14], and pest infestation [15]. With improvements in the method and accuracy of the technique, the TIR satellite images can provide surface temperatures to determine CSTs at the regional scale [1,16]. However, CSTs obtained from satellite images are unsuitable for the precise analysis of small areas because of their coarse resolution compared with optical images.
The resolution of thermal data was limited to 1–10 m for manned airborne sensors or to centimeter-scale resolutions for infrared thermal images via a settled flux tower. The advent of unmanned aerial vehicles (UAVs) supports the application of high-resolution thermal images with low-weight thermal cameras at centimeter-scale resolutions [17,18,19]. These images can describe in detail the transpiration from canopies according to the basic relationship between canopy temperatures and evaporation in plant ecophysiological research [20,21]. High-resolution thermal images can help to quantify the link between CST and canopy health and clarify the response mechanism of canopy physiological parameters to pest stress [14].
Forest pests can disrupt water equilibrium in plants and decrease the water content of the canopy. Whether by defoliating needles or boring into shoots, bark, or wood, pests may cause temporary or permanent damage to physiological and biochemical parameters of forests [22]. The main species of pests responsible for destroying 1.5 million hectares of Yunnan pine forest in Southwest China over the past 20 years is Tomicus spp. [23,24]. The beetles of these species attack the shoots of the Yunnan pine from May and commence wood boring in November. Over several weeks, the affected needle shoots gradually change from green to yellow and, typically, the needles turn red within several months (red attack). During December, the host trees bored by beetles lose their needles (gray attack) (this occurs within 3 years of the initial attack) [25]. The spectral changes that occur during the late stage are easily identified by optical remote sensing [26]. However, it is difficult to recognize the spectral characteristics of a green attack (early stage) [27]. Despite the proposal of various remote sensing methods for evaluating forest damage, the forecasting of beetle attacks remains a challenge, particularly during the green attack stage [22,28].
Thermal infrared imaging techniques can be used to monitor abnormal canopy temperatures due to the disruption to the water cycle of canopy during the green attack stage [29]. However, the use of thermal remote sensing for monitoring forest pests is uncommon. One reason is the difficulty of interpreting the CST, which is heavily influenced by environmental factors and physiological vegetation parameters [13]. In agricultural research, the underlying surface of crops is homogeneous, and the temperature of the crop canopy receives little disturbance, making it easy to obtain.
The complex structure and irregular shape of forestry canopies result in the heterogeneity of the canopy [30], which increases the uncertainty of canopy temperatures extracted from UAV-based thermal images. Light detection and ranging (LiDAR) data provide a method for obtaining detailed three-dimensional (3D) structural parameters of tree crowns with dense cloud points, which are used to obtain the spatial distribution of foliage [31,32,33]. The intensity of laser signal can produce a reflection characteristic in the near-infrared region of foliage within a canopy. Therefore, LiDAR has significant potential for monitoring forest health by detecting the severity of damage from forest pest infestations [34]. However, obtaining fine-grained measurements that reflect the health of an individual canopy is limited when using TIR or LiDAR only. The mixed radiation from trees and the background presents difficulties for accuracy accessing the canopy structures using thermal remote sensing techniques. The data obtained by LiDAR serves as an additional source of information for capturing the fine structures of tree crowns, such as the leaf area index (LAI), fractional cover, and canopy density [35,36].
Few studies have used TIR for monitoring forest infestations at the canopy scale to assess the damage caused by pine-shoot beetles in Yunnan pine forests. Accordingly, this article investigated the capacity of thermal imagery for monitoring the shoot damage ratio (SDR) of the crowns of Yunnan pine trees. The degree of damage to Yunnan pine crowns from attack by Tomicus spp. was assessed using the SDR [23,37]. The study also presents and discusses the impact of the LAI on the CST-SDR relationship using TIR and LiDAR datasets at canopy and plot scales in addition to corresponding field measurements.
2. Materials and Methods
2.1. Study Sites
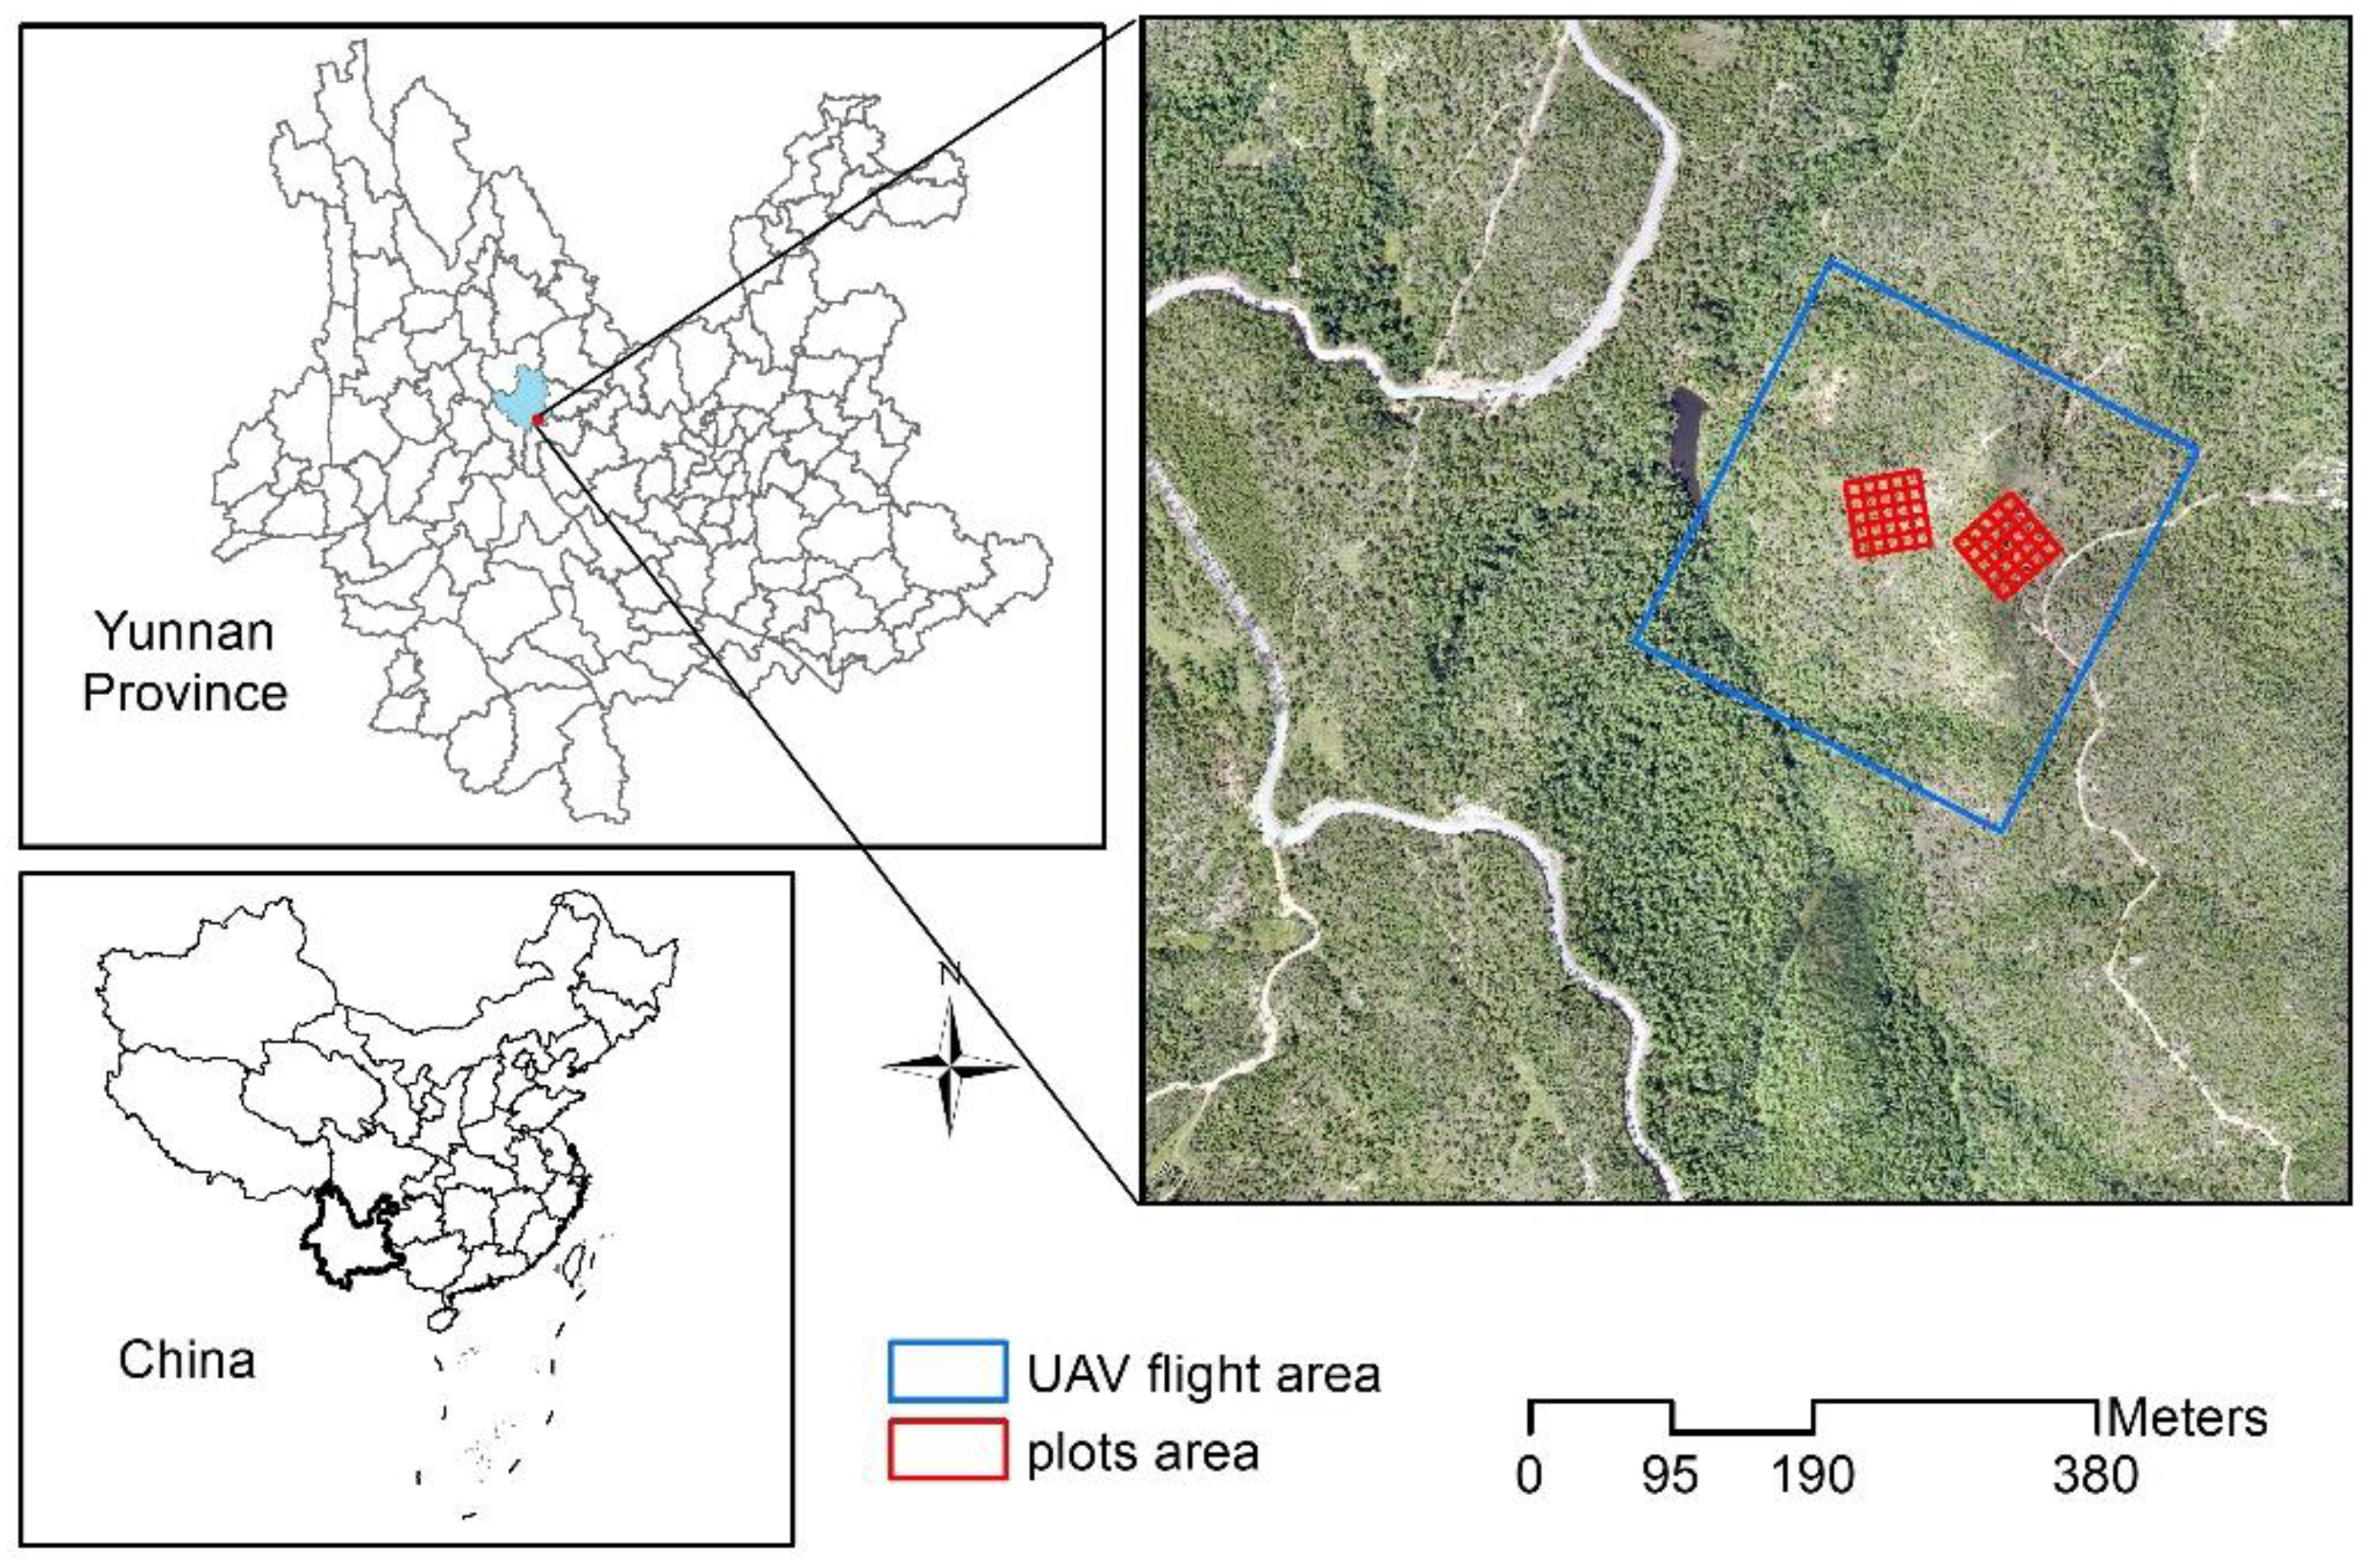
The study sites (25°14′–25°29′ N, 100°48′–101°3′ E) were located on Tianfeng Mountain in Yunnan Province, Southwestern China (Figure 1) at an elevation of between 1720 and 2570 m. In this area, continuous drought and infestations of Tomicus spp. have led to a high number of Yunnan pine deaths. The annual average temperature in this area is 14.2 °C, and the annual precipitation is 783.7 mm.
Field measurements of tree parameters were obtained in September 2018. As shown in Figure 1, the study areas contained plots of 50 × 50 m. The coordinates of each plot and trees were measured using a real-time kinematic (RTK) device (HI-TARGET A8 GNSS) with an accuracy of ±2.5 mm. Variables, such as tree height (H), diameter at breast height (DBH), crown diameter, and SDR, were measured on each tree (DBH > 4 cm). As an indicator of the degree of Yunnan pine infestation damage, the SDR was defined as the ratio of the number of damaged shoots to total shoots for each crown (a value between 0% and 100%). The plot SDR was the average SDR of the single trees within a plot.
Each plot was divided into 25 smaller plots of 10 m × 10 m. The LAI of each small plot was obtained using plant canopy analyzer with a 270-degree view restrictor (LAI-2200, Li-Cor, Lincoln, NE, USA), which was located 1.2 m above the ground (shrubs were excluded). To prevent interference from sunlight, the LAI measurement of each small plot was performed in the afternoon or under cloudy conditions. The summary statistics for each tree variable of two plots are shown in Table 1.
2.2. Thermal Imagery
The TIR data were acquired using a high-sensitivity thermal sensor (TAU2, FLIR, Wilsonville, OR, USA) on a fixed-wing UAV between 13:00 and 13:30 on 17 September 2018. The TIR sensor was a focal plane array with an uncooled vanadium oxide microbolometer and heat sensitivity below 50 mK. The flight took place at a height of 280 m, and the flight path was designed with overlaps of 60% (side) and 80% (forward). The pixel value of the TIR images obtained from the thermal sensor was the digital number (DN) of the land surface thermal radiation, which required correction by temperature. The produced resolution of the TIR data was 0.23 m.
2.2.1. The Correction of Thermal Imagery
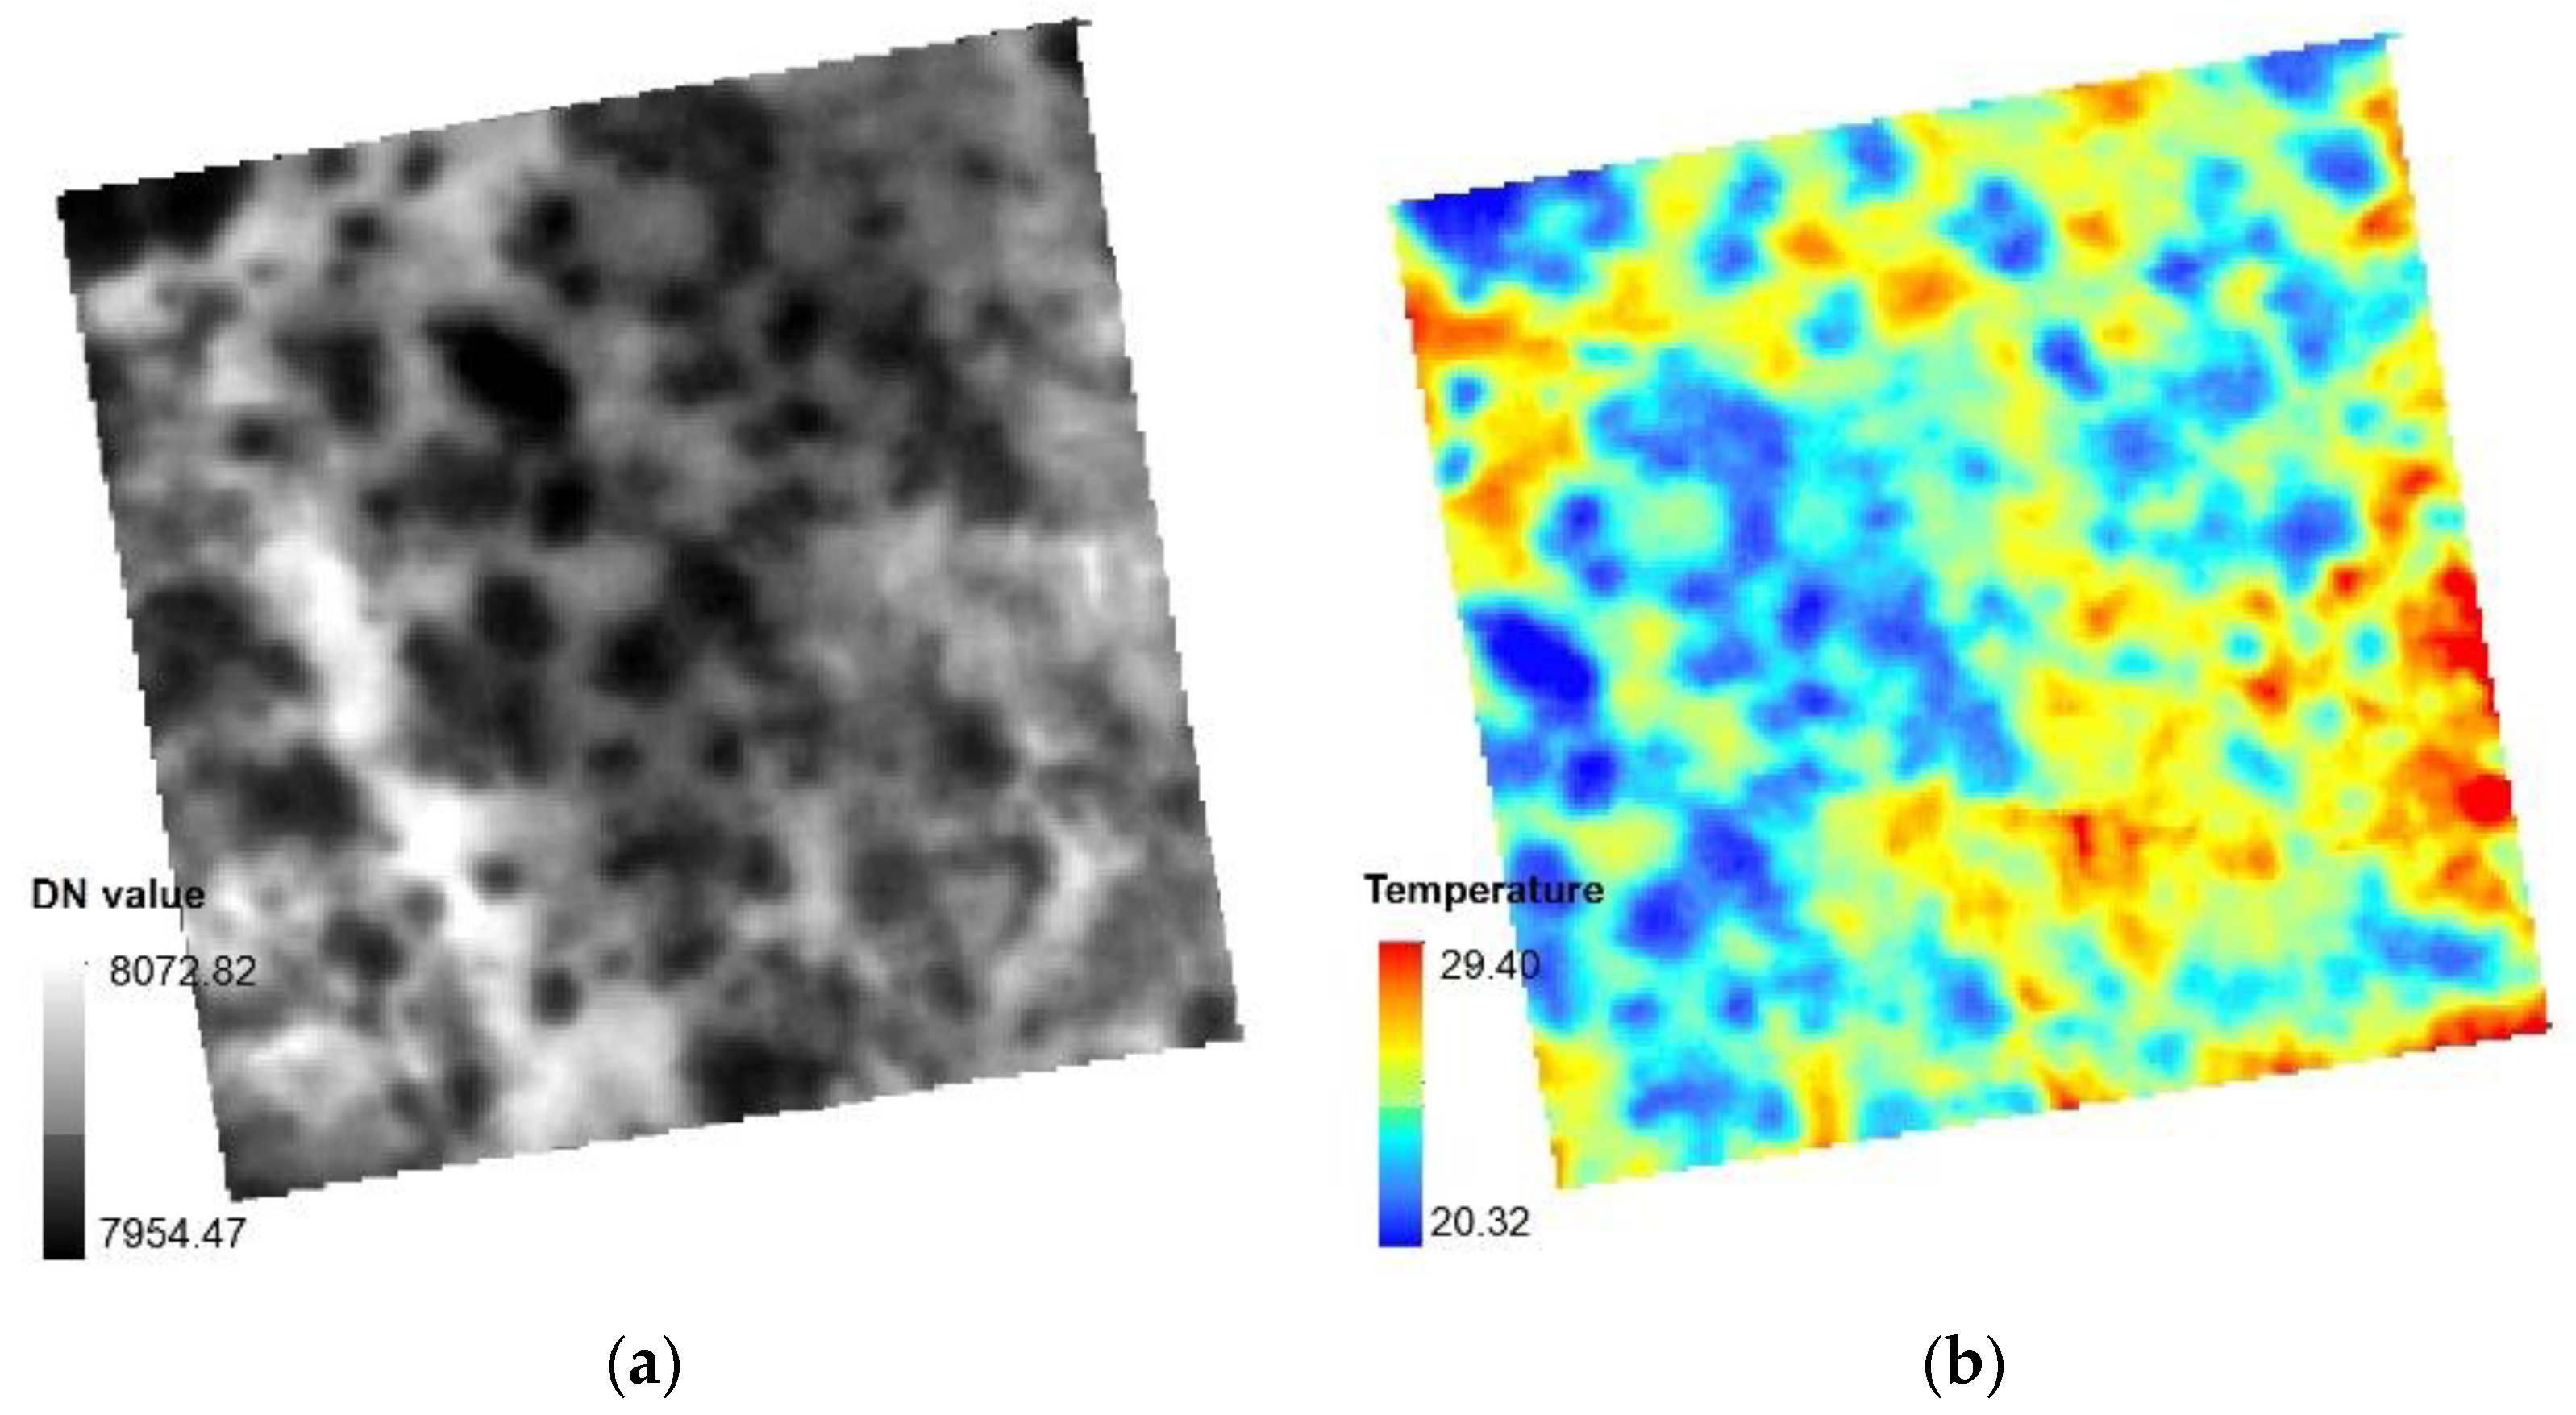
The temperatures of four ground features (tile, polyvinyl chloride board, wood, and asphalt road) with known emissivity (Table 2), were measured by an infrared thermal imager (T-420, FLIR Systems, Inc., Wilsonville, OR, USA). The coordinates of the features were measured using an RTK global positioning satellite device. Then, the linear regression relationship between the temperatures and DN values of the four features in the TIR images was established; consequently, the gray TIR image was converted into brightness temperature (Figure 2).
2.2.2. The Temperature of Ground Features within Plots
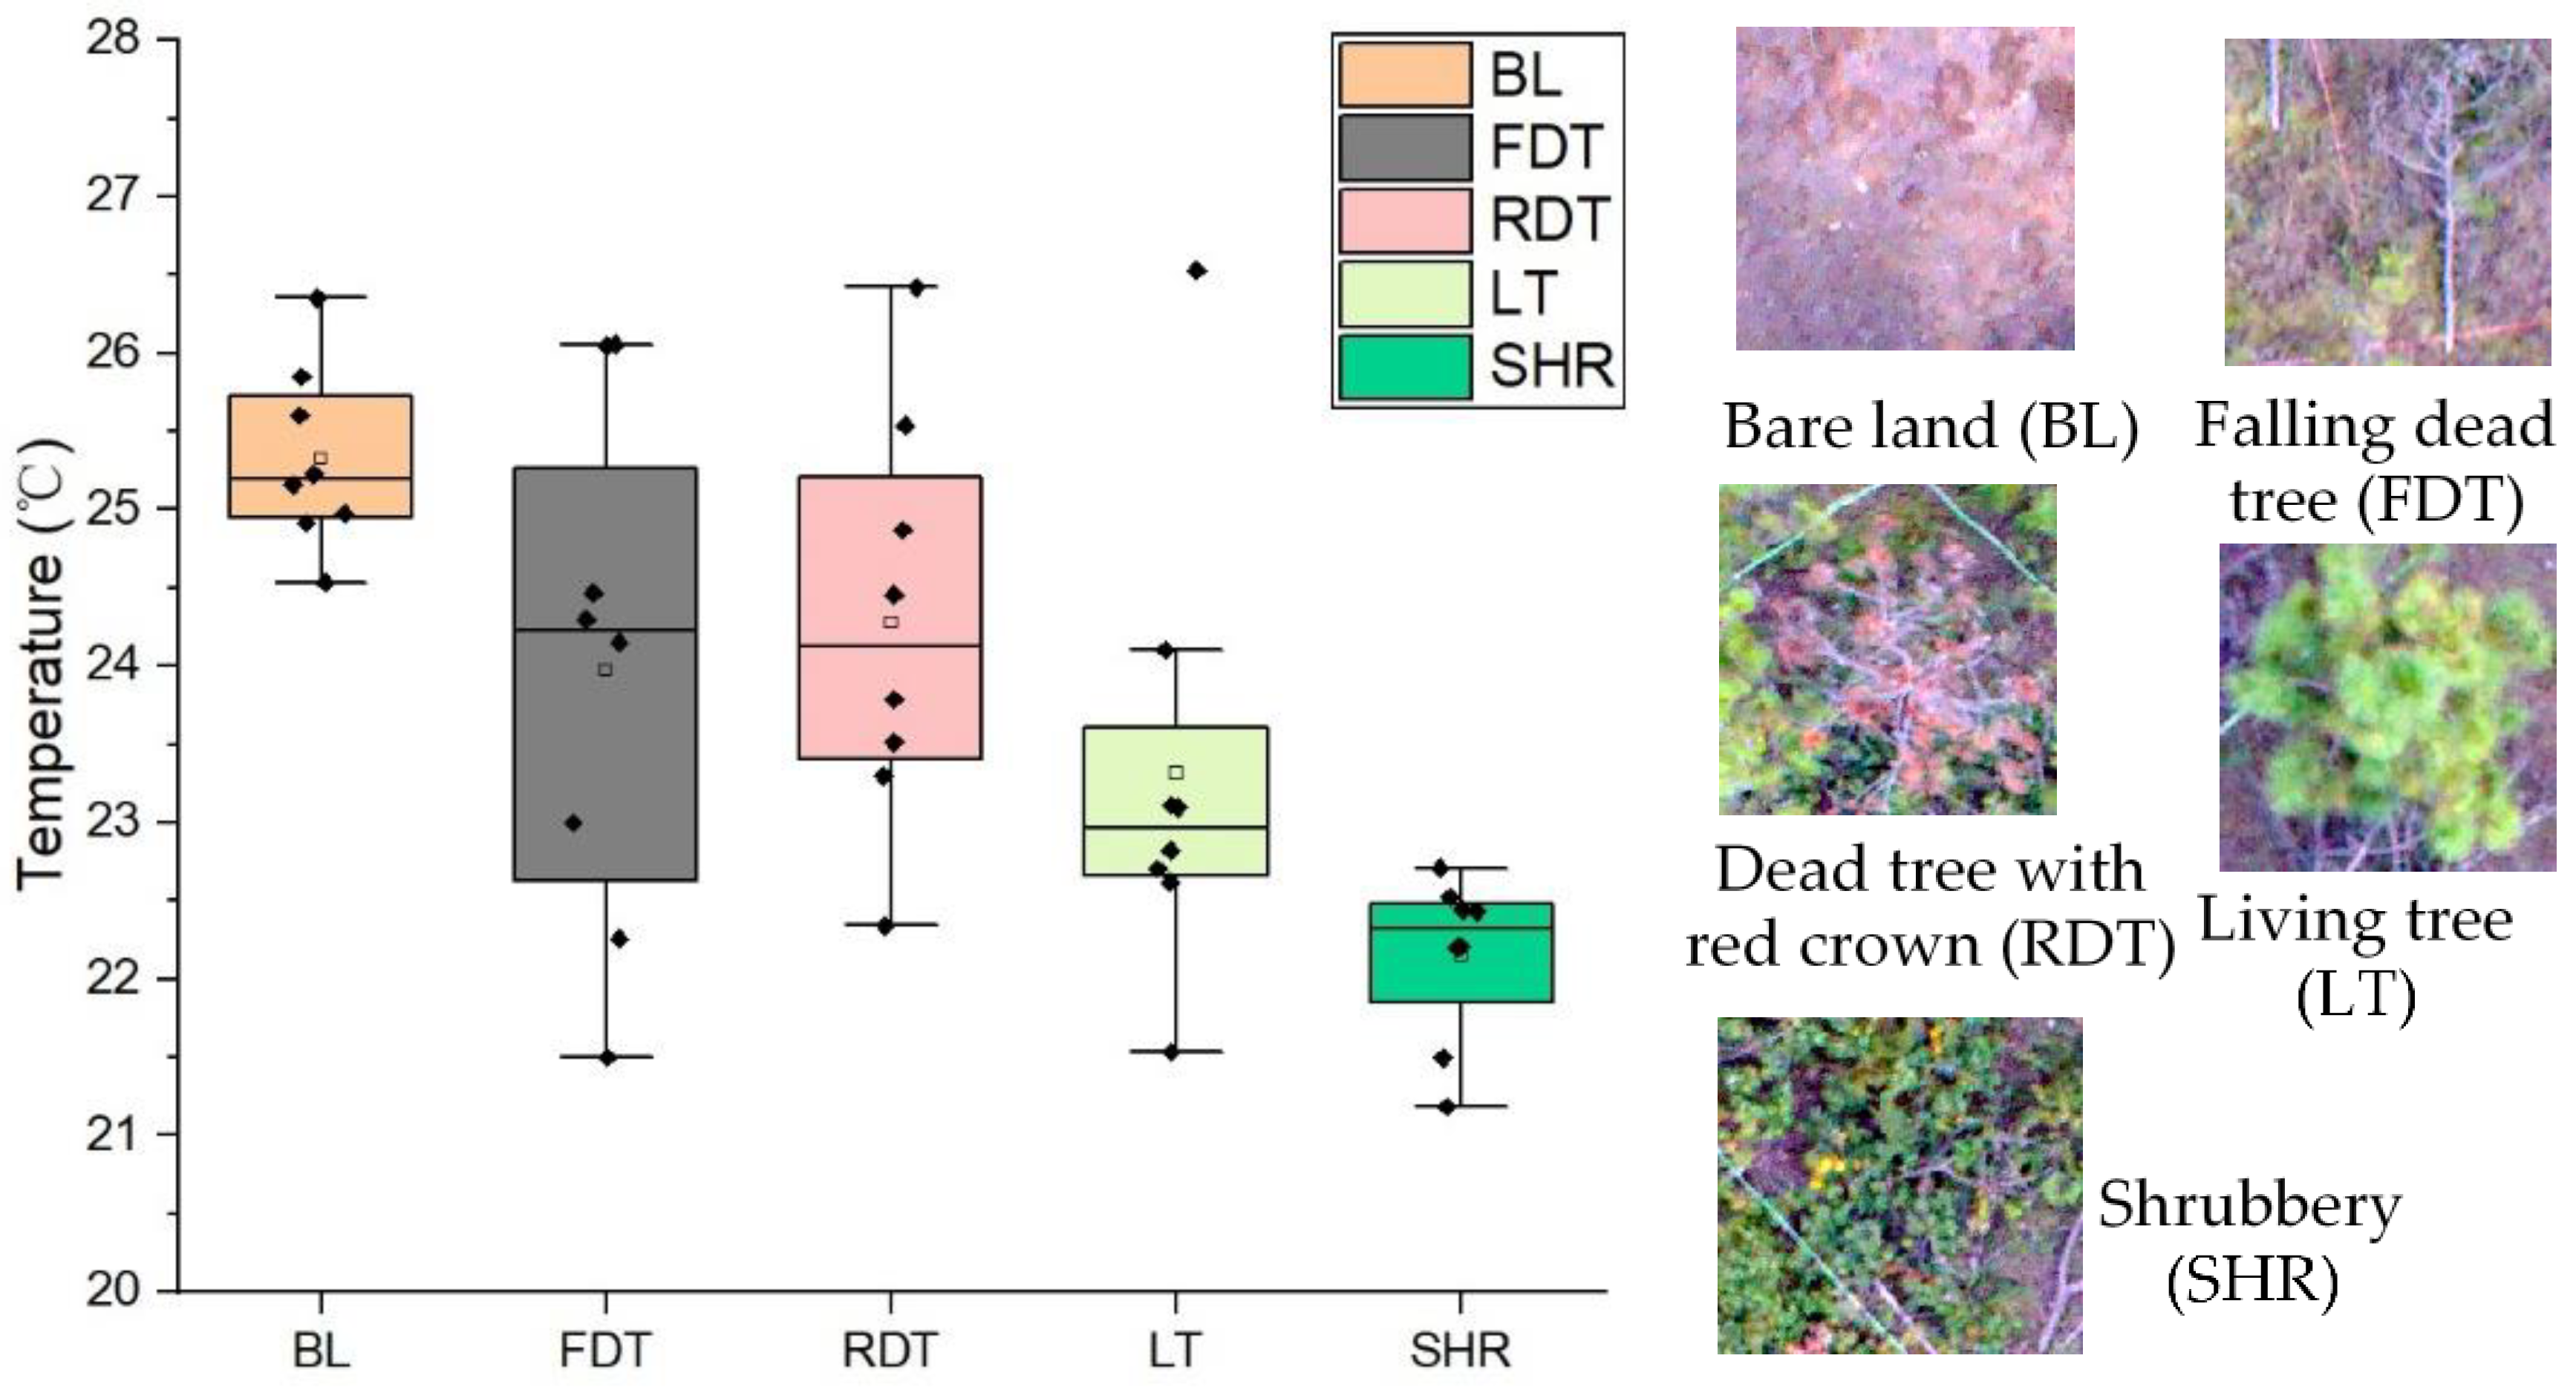
According to the actual sample investigation, the ground features were divided into five types, namely, bare land (BL), falling dead trees (FDT), dead trees with red crowns (RDT), living trees (LT), and shrubbery (SHR). The shapes and locations of the five types were extracted from visible UAV-based images with 0.02 m resolution that were shot on the same LiDAR data flight. The average temperatures of features at the plots were extracted from TIR images.
2.2.3. The Average Temperatures of the Small Plots
The 50 small plots of 10 m × 10 m were subdivided from two larger plots to analyze the effect of the LAI on the relationship between temperature and the SDR. The plot temperature (Tp) was the production of mixed of thermal radiation from all the ground features in the plot. When calculating the average temperature of a sample plot, if many shrubs are present, the contribution of shrub temperature should be considered because of the lower temperature of shrubs compared with pine-tree crowns. Therefore, LiDAR data were used to reverse LAI of a plot with a large number of shrubs.
2.3. LiDAR Data
2.3.1. Individual Tree Segmentation from LiDAR
The UAV-based LiDAR data were obtained from the core area of the affected Yunnan pine forests (including the two plots) using a UAV-mounted system (LiAir 200, GreenVlley Inc., Beijing, China) with a 40-channel Pandar40 laser sensor. The average flight altitude was 70 m above ground level, with a pulse rate of 10 HZ and a maximum viewing angle of 10° (from channels 2 to 30). The georeferenced coordinate of the LiDAR data was generated in the UTM 50 N zone using Word Geodetic System data. The LiDAR cloud points were classified into ground and above-ground points using the improved progressive TIN densification algorithm in the LiDAR360 software package.
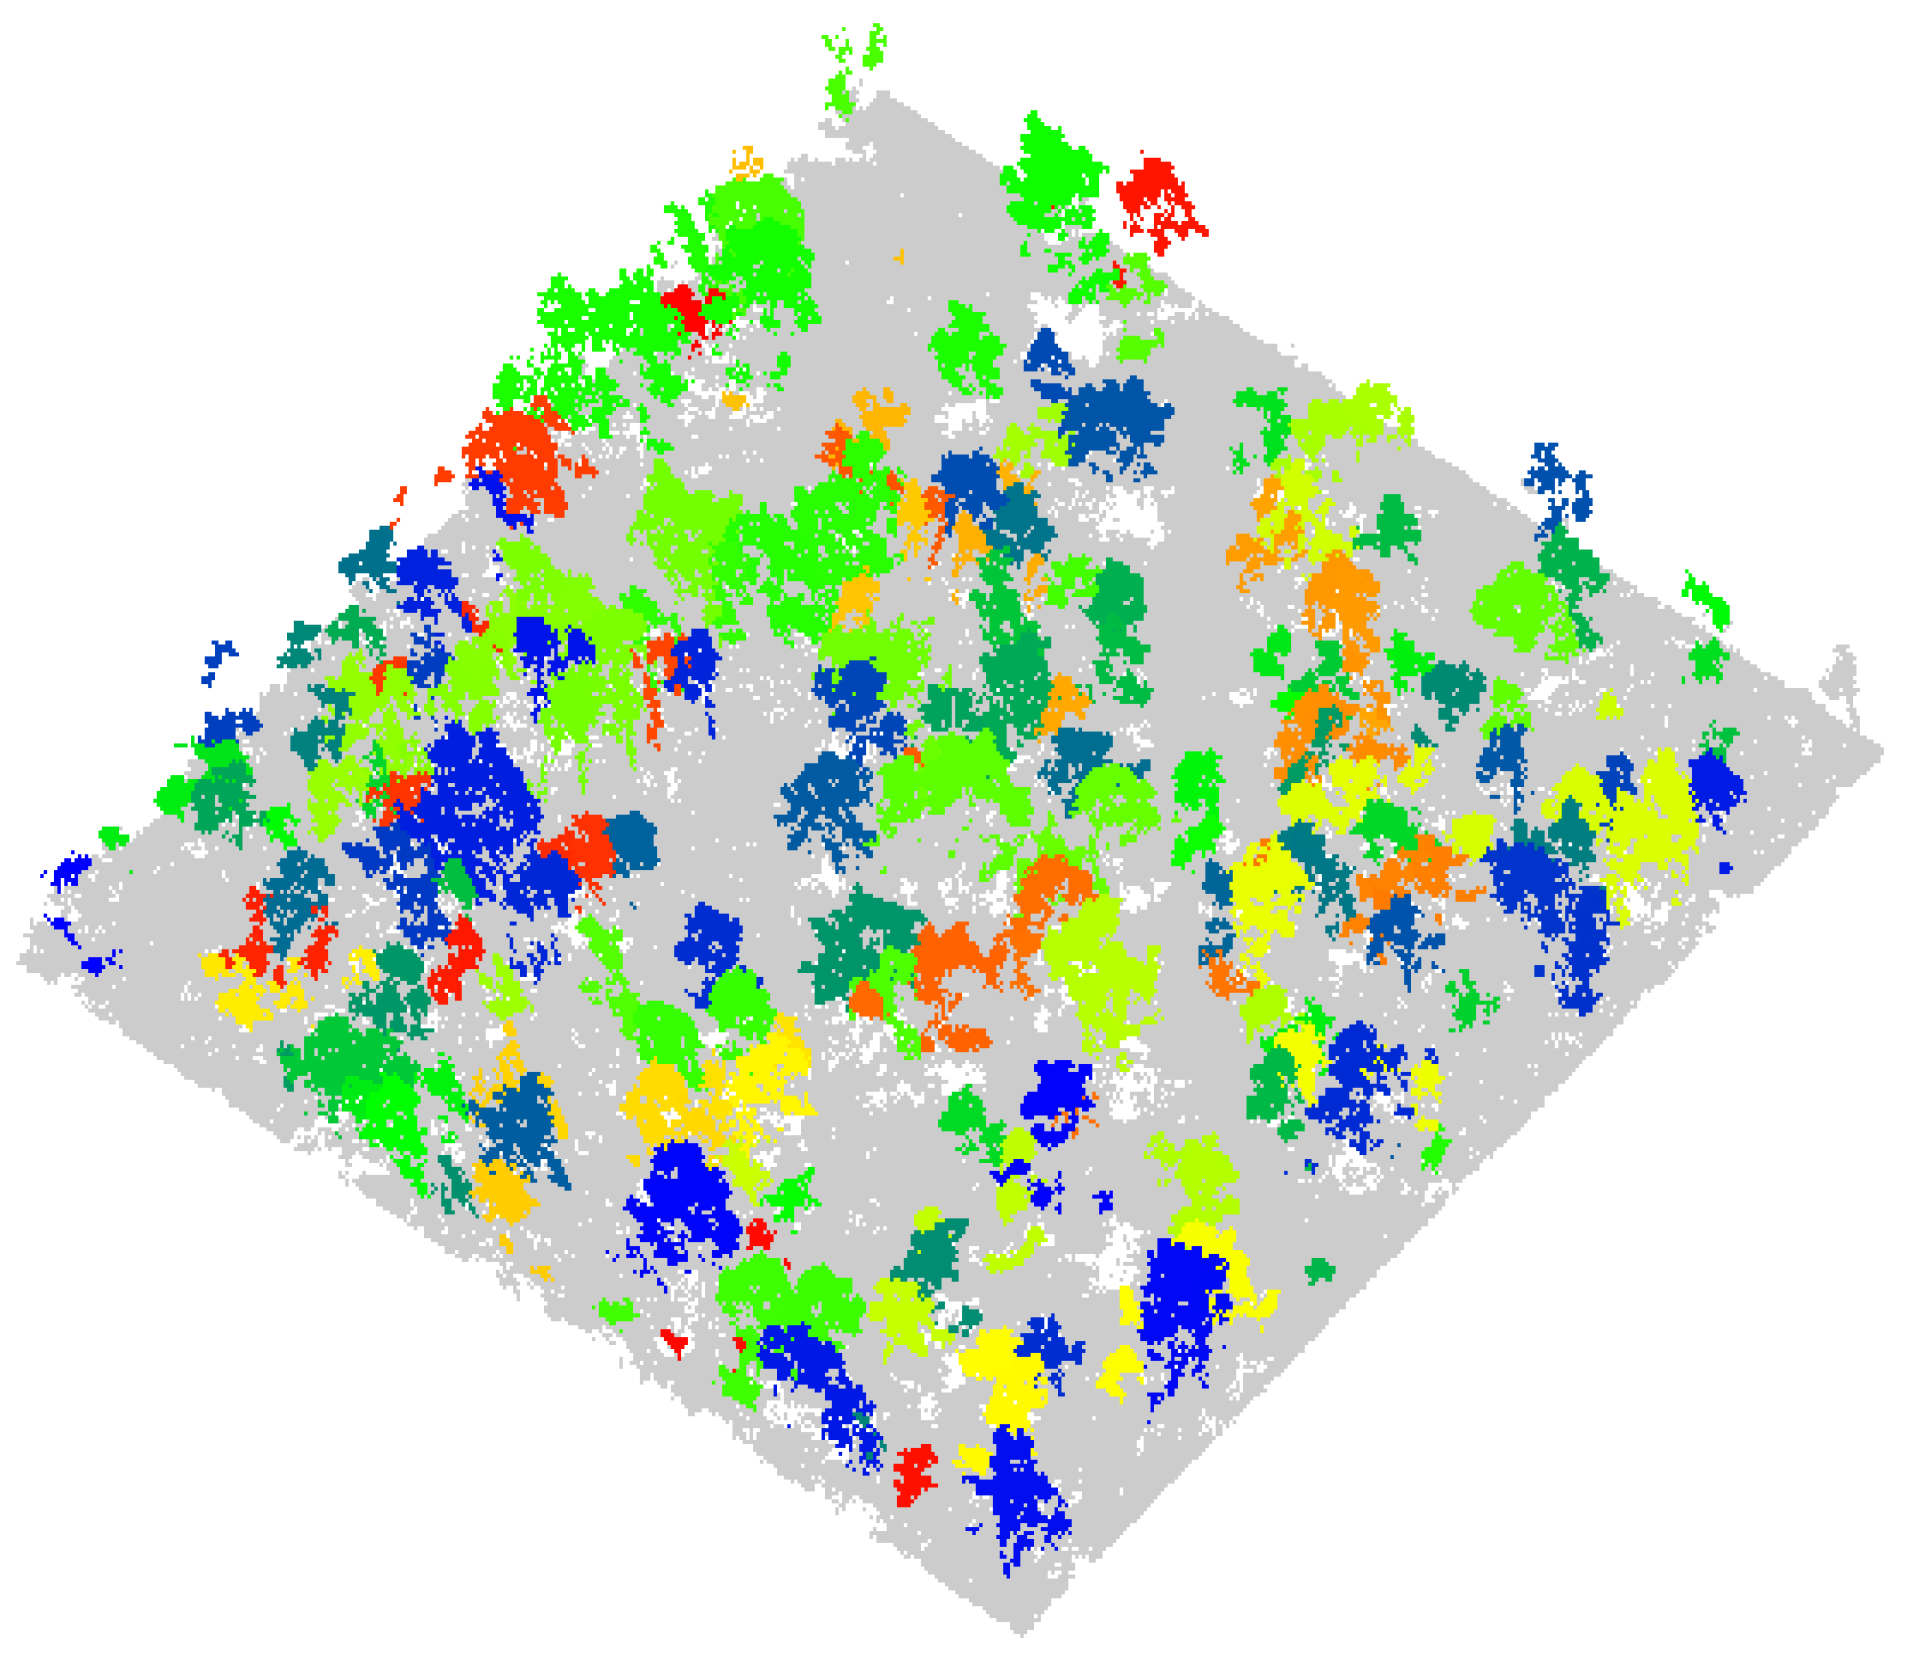
The canopy height model with a resolution of 0.5 m was derived from the classified point cloud using a point cloud segmentation (PCS) algorithm, and the accuracy assessment of canopu segmentation was evaluated using three parameters, which included precision (p), recall (r), and F-score (F) [30]. The structural parameters of the tree canopy (e.g., locations, heights, crown areas, and volumes) were extracted from the point clouds of individual trees (Figure 3). The TIR images and the LiDAR canopy areas were registered using visible images via ground control points, which were measured by the RTK device.
where TP is the number of detected trees in a plot; FP is the number of trees that are falsely detected; FN is the number of trees that are omitted; and p, r, and F refer to the detection accuracy, the detection rate, and the overall accuracy, respectively.
2.3.2. The Calculated Leaf Area Indices of Individual Trees
To analyze the impact of the background, the LAI of individual trees was selected as the parameter for evaluating the relationship between SDR and CST, which was calculated using the point clouds from the LiDAR data. The point clouds of individual trees were extracted from the segmentation results using a circumcircle of the crown and divided into canopy and ground parts. Then, the porosity of the canopy was calculated on the basis of the principle that a specific ground point was the reflection point at which the laser penetrated the canopy and hit the ground. Finally, the LAI of an individual tree was calculated according to the exponential relationship between the probability of finding canopy P and LAI in the random Beer–Lambert law of discontinuous canopy proposed by Shabanov [38]:
where cloudtree is the point clouds of canopy, cloudtotal is the total point cloud of the circumcircle, and k is the empirical coefficient that describes the relevance between the LAI and the porosity of the tree crown (typically, k = 0.5 for a conifer forest).
2.4. Correlation Analysis Method
To detect the shoot beetle stress using TIR and LiDAR data, the correlations between SDR and temperature at tree and plot scales were analyzed using Origin software (OriginLab, Northampton, MA, USA). At the individual tree scale, the data of trees (15 samples) with different LAIs were selected from the plots to calculate their LAI from the LiDAR point cloud dataset and evaluate the impact of LAI on the correlation between SDR and temperature. After weakening the impact of LAI, a linear regression method with a 95% level of confidence was applied to build the correlation between SDR and temperature.
To further analyze the correlation between SDR and temperature on a large scale, a total data of 50 small plots were analyzed with the same method, which was the same as the tree scale. The coefficient of determination (R2) between SDR and temperature was used to assess the accuracy of the regression model. The Pearson correlation coefficient (r) was used to indicate the relationship between LAI and temperature.
3. Results
3.1. CST Characteristics of Features within Plots
The temperatures of the five ground features were obtained using TIR imagery (Figure 4). BL had the highest temperature, and the temperature of SHR with high transpiration was lower than LT. Despite a large number of dead needles in RDTs, their RDT temperature was similar to that of FDTs due to the cessation of transpiration by the dead needles in the canopy. Considering the reduced contribution of SHR temperature to plot temperature (Tp), SHR features should be eliminated when the plot average temperature is calculated to analyze the correlation with plot SDR.
3.2. Crown Segmentation from LiDAR Data
The 0.23 m resolution of the TIR images made it difficult to confirm the edges of the canopy and to locate individual affected trees, particularly when canopies containing several trees were adjacent. Therefore, this study used LiDAR point clouds to distinguish nearby trees.
Segmenting the crown of a single plant is the first step in extracting CST to obtain the temperature characteristics. Unfortunately, due to the coarser resolution of the TIR band compared with the optical bands for the UAV-based platform, the degeneration of the canopy boundary made it difficult to accurately extract the CST (Figure 5a). Because of the mixed radiation from the canopy and surrounding objects, the degeneration of pixels at the canopy boundary occurred in the TIR image. To segment the canopy using TIR data, it was necessary to determine the temperature threshold to calculate the canopy boundary. The canopy boundary of individual trees can be extracted from high-resolution UAV-based optical images. However, the accurate separation of overlapping crowns is impossible from optical images without using the vertical information.
The multiple point clouds in LiDAR data provide additional 3D information on a canopy structure, allowing its edge to be demarcated in detail. To extract the canopy boundary, the canopy was segmented by LiDAR using the PCS algorithm, on the basis of the 3D information of the canopy (Figure 5b). The canopy segmentation of an individual tree had a good accuracy according to LiDAR data for the two plots (Table 3).
3.3. The Impact of LAI on the Relationship between Shoot Damage Ratio and CST in Individual Trees
Figure 6a shows the significant negative relationship between LAI and CST (r = −0.9121). Under a forest canopy, the CST was easily affected by background soil, as was canopy spectrum. As LAI decreased, the soil covered by the crown was exposed to the thermal sensor. The thermal radiation from the canopy received by the sensor was the mixed result of soil, background, and canopy radiation. As the radiation from the canopy was lower than from the soil, in the TIR images, the mixed result caused the CST to increase with a rising LAI.
An insignificant correlation was revealed for the same trees (the red line in Figure 6b) because of the impact of the abnormal data with a low LAI (0.81, 0.61, and 0.62), which is shown in Figure 6b (the red points). After the elimination of the abnormal CST with a low LAI, the correlation between other CSTs and SDRs was significantly improved, and the determination coefficient (R2) increased from 0.0907 to 0.6936. This confirmed that when the canopy had a low LAI, the impact of the LAI weakened the relationship between the CST and SDR by enhancing the ground radiation from the soil, resulting in an inaccurate CST. Therefore, to analyze the correlation between CST and SDR, field measurement data on Yunnan pine with high LAIs were used to ensure that the influence of LAI was weakened.
3.4. The Correlation Analysis of SDR and CST for an Individual Tree Canopy
Due to the influence of LAI, the SDR data of 30 trees with high LAIs (>1) were used to determine the relationship of SDR with CST. The canopy temperatures were extracted from TIR images using canopy areas generated from LiDAR data. The actual field data revealed the crown SDRs of the affected Yunnan pines was mainly between 10% and 20%, and there was fewer affected pines when the SDR was between 50% and 80%. This was because the survival time of an affected tree was shorter when the crown contained many dead needles as this reduced the volume of water obtained from the roots as the draw of transpiration decreased. Therefore, trees with a SDR exceeding 50% can die quickly, leading to a low number of samples in this stage. The CST increased with a rising SDR, as shown by the significant correlation in Figure 7. This strong correlation (R2 = 0.7890) indicated that UAV-based thermal remote sensing could effectively monitor the SDR of the canopy in individual trees.
3.5. The Effect of LAI on the Relationship between Temperature and SDR on Plot Scale
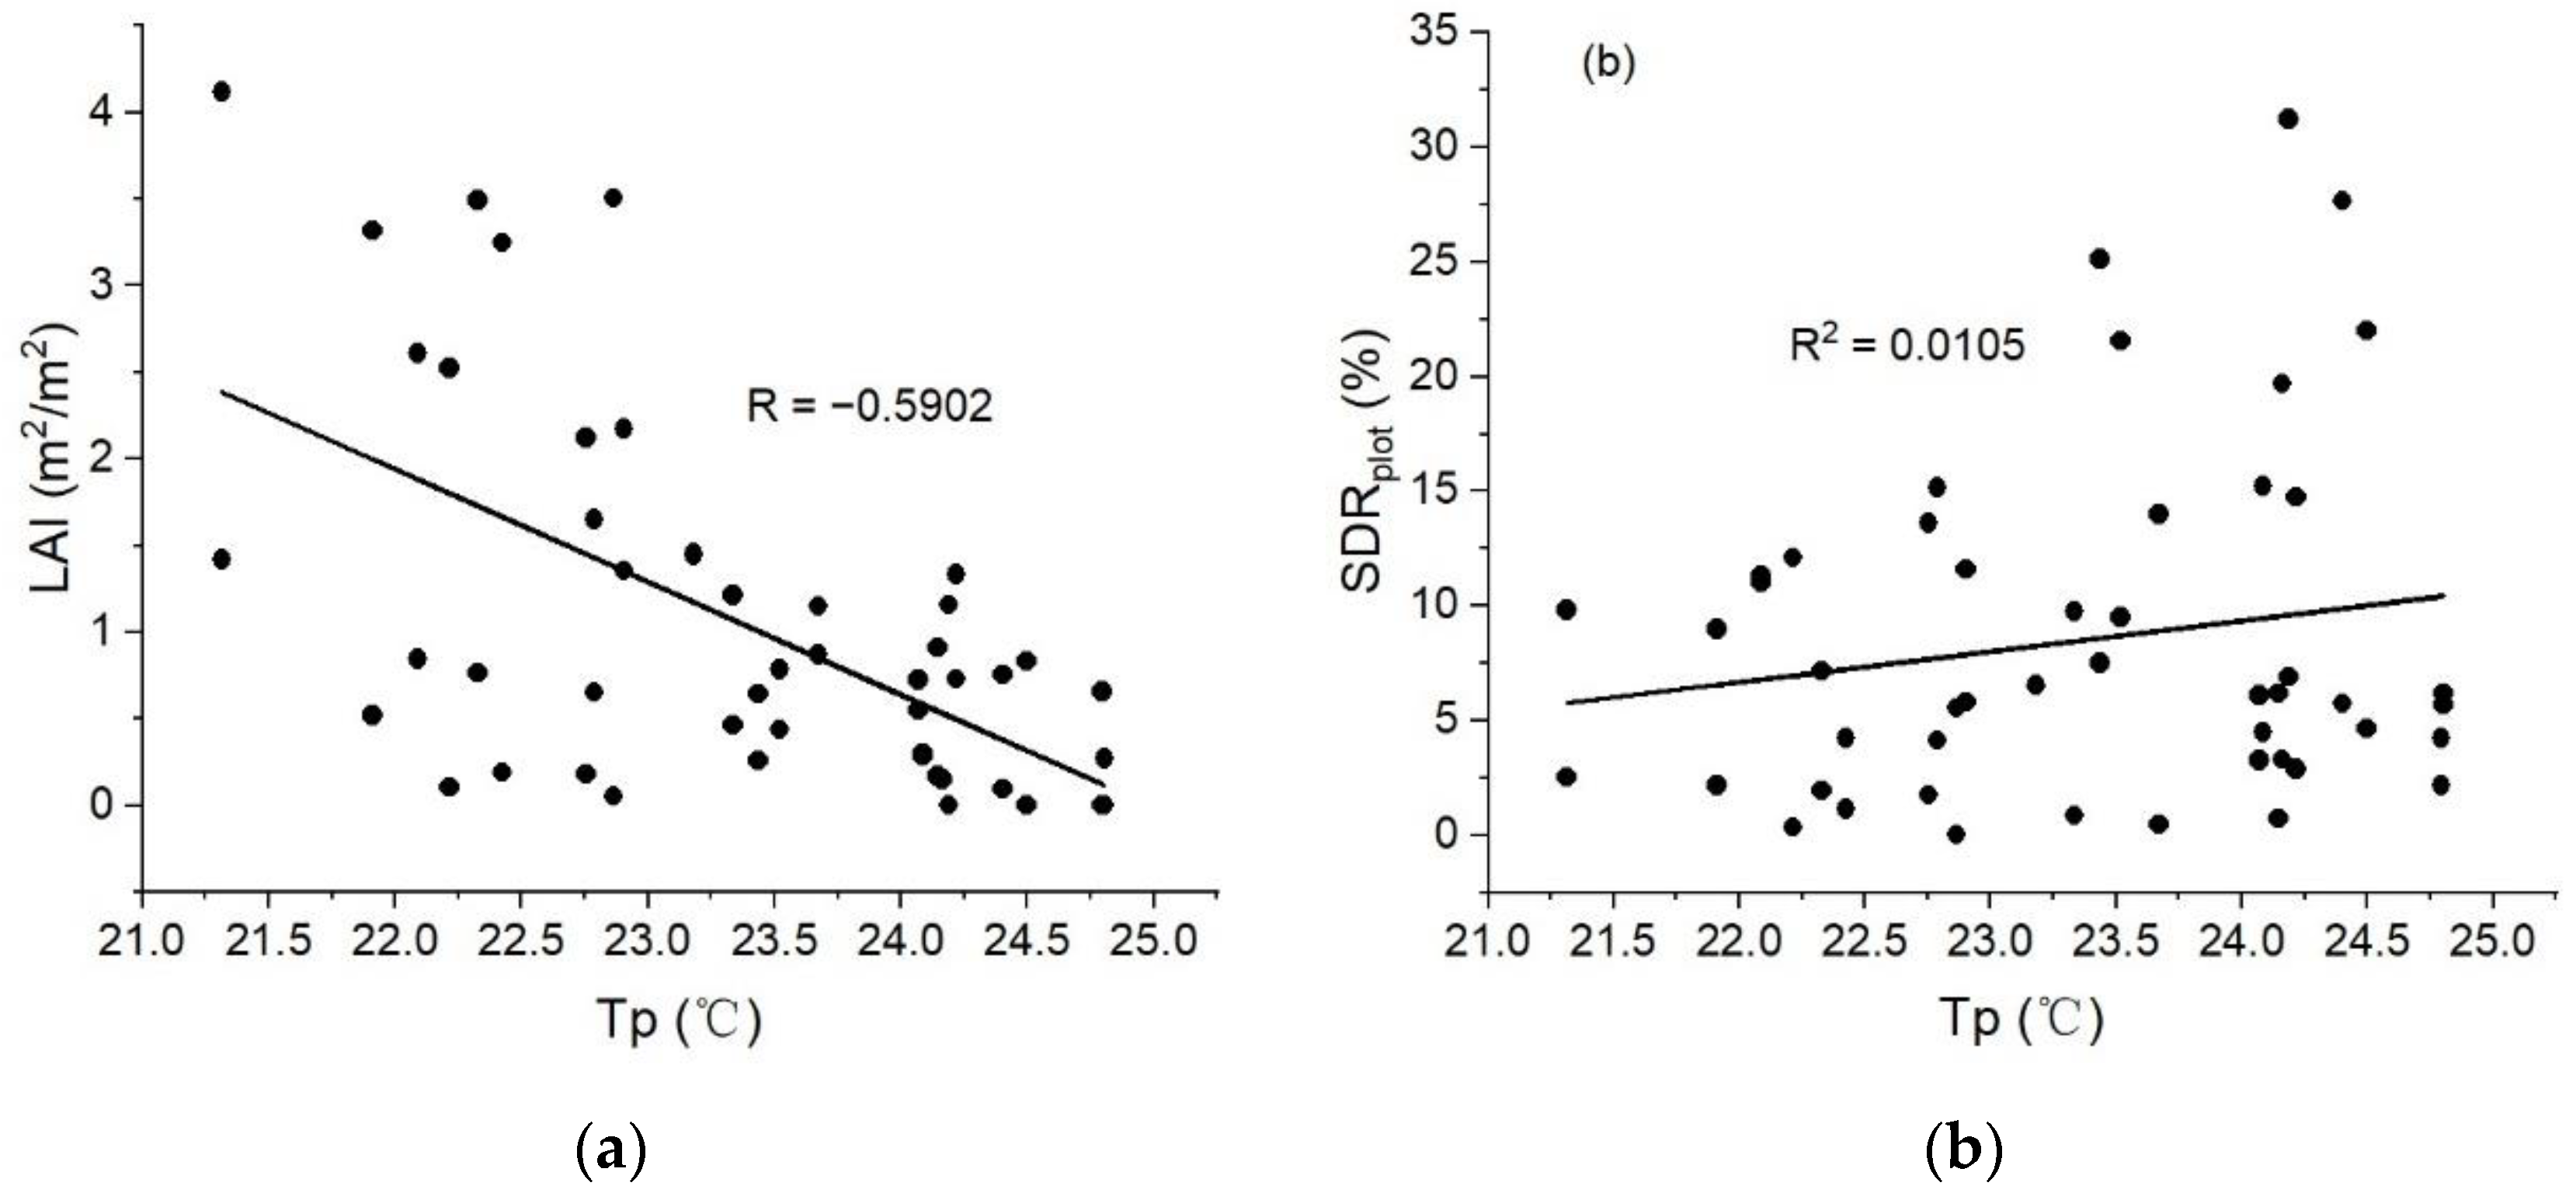
The correlation analysis of LAI and Tp revealed that LAI was also negatively correlated with temperature (r = −0.5902), which was the same as that at the canopy scale (Figure 8a). Stronger transpiration with a high number of leaves in a plot caused the Tp to decrease with a rising LAI.
Additionally, the plot SDRs were calculated using the average SDR of the single trees within a plot. Figure 8b shows the non-significant correlation of SDR and Tp, on the basis of the data of 50 plots, including different LAIs from 0 to 4 (R2 = 0.0105).
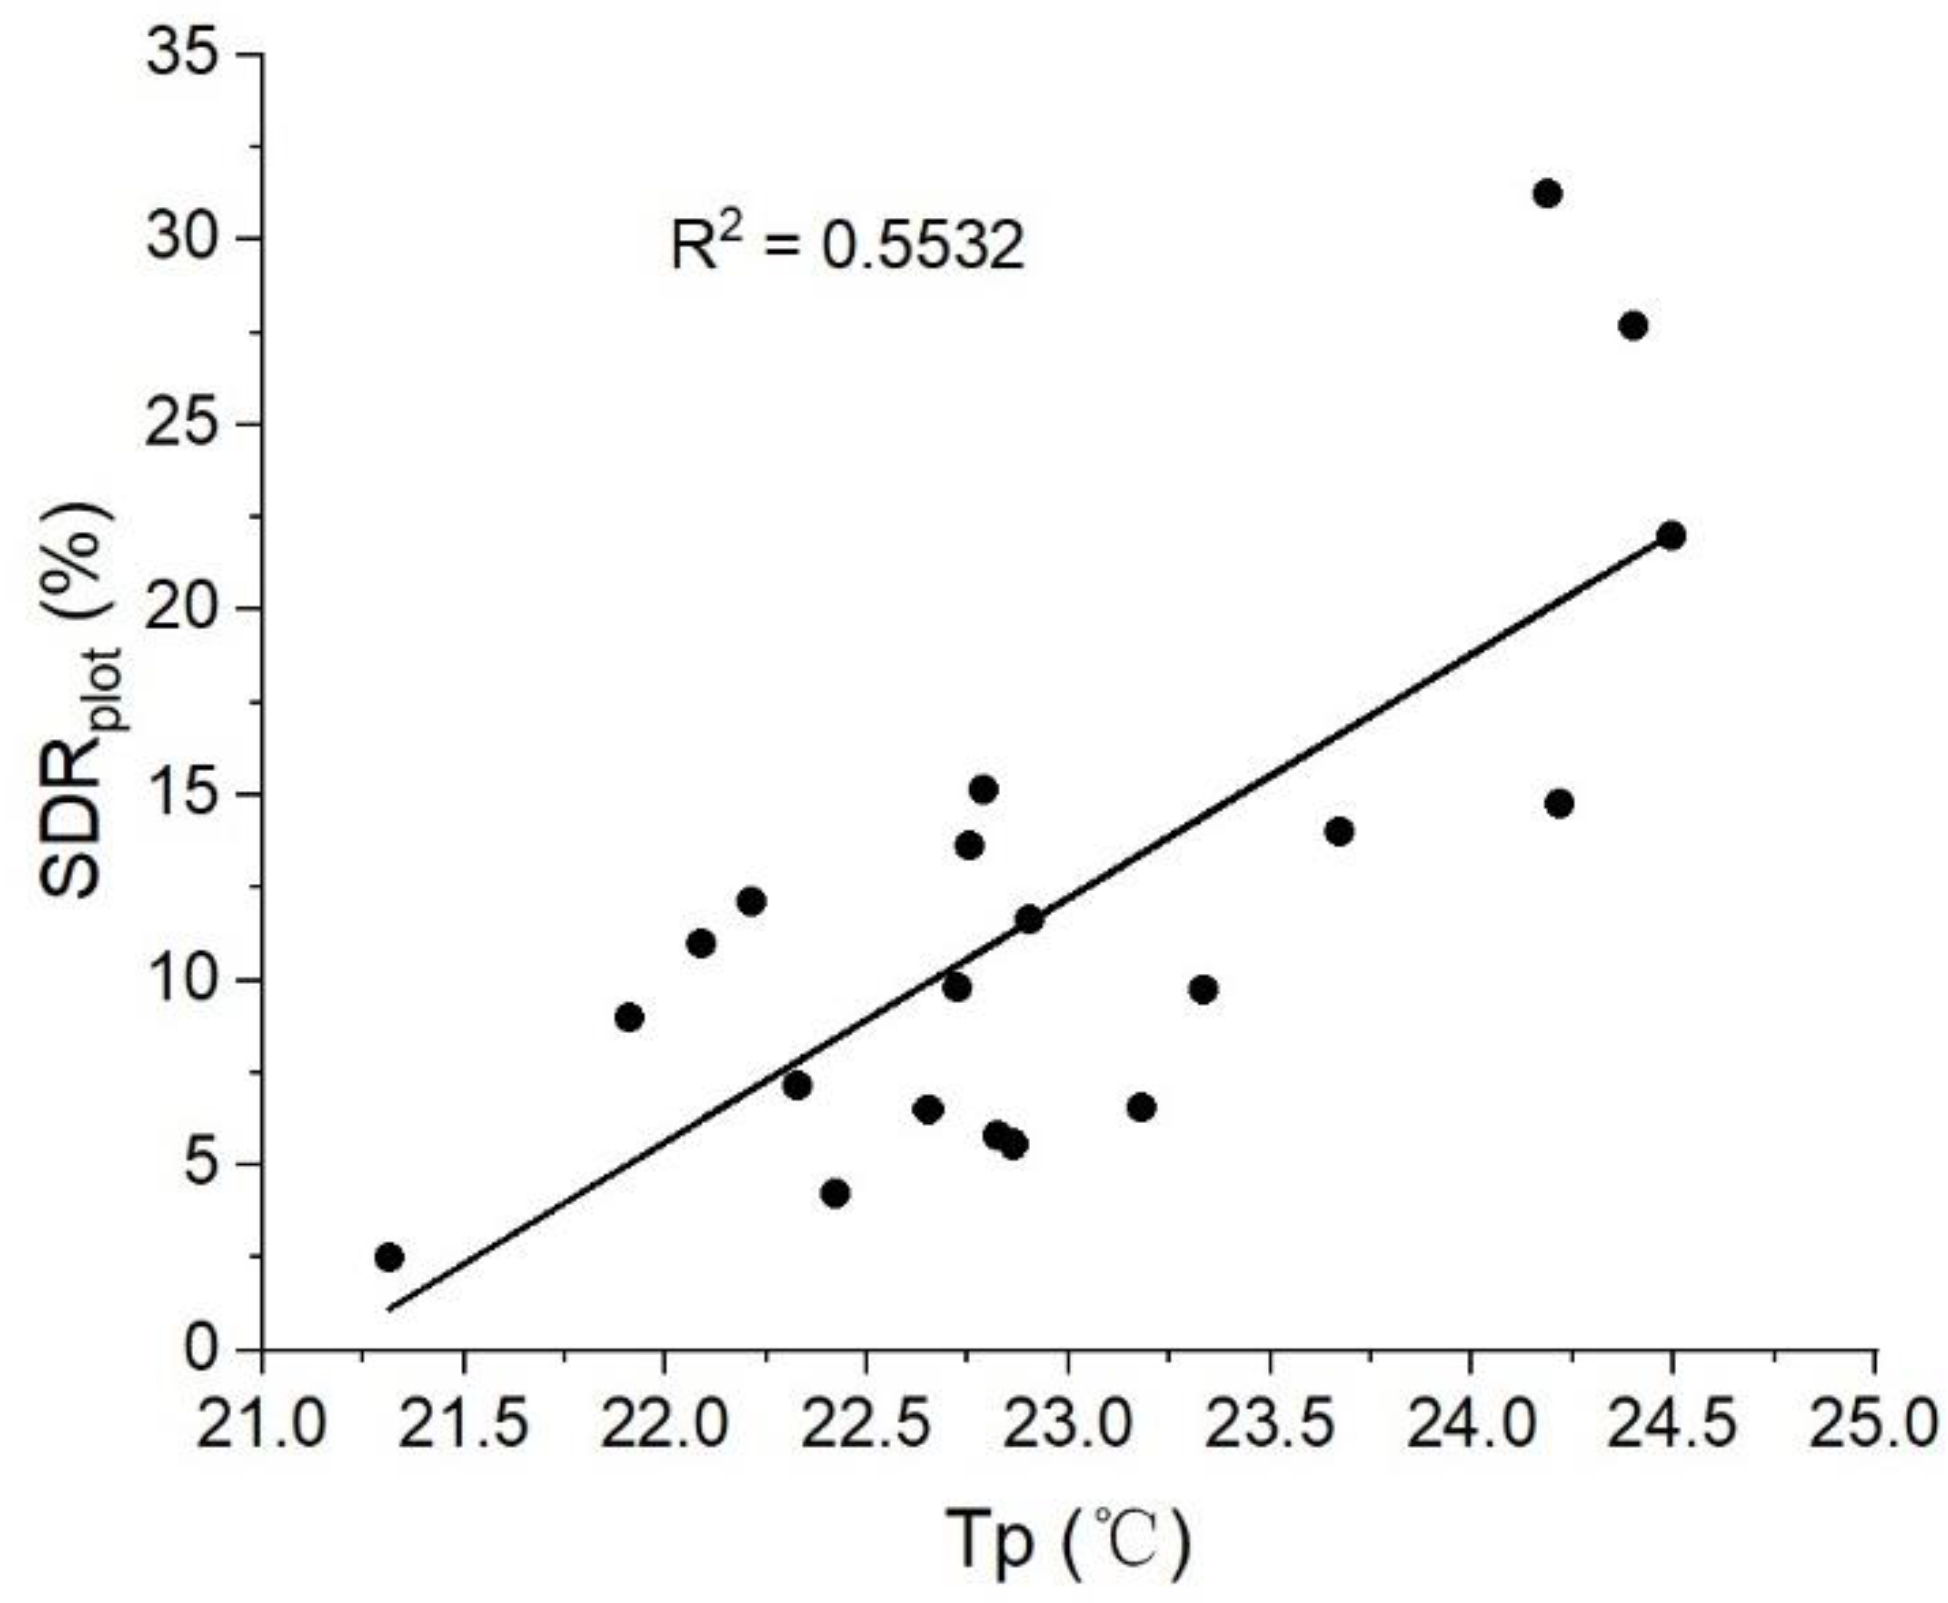
To further understand the relationship between SDR and Tp on a large scale and to explore the role of the LAI, the 20 plot data were filtered using the expression LAI > 1 for analysis (Figure 9). The results revealed a significant correlation in the relationship between SDR and Tp after the influence of a low LAI (R2 = 0.5532) was weakened. Therefore, the influence of the LAI on plot temperature should be considered when using TIR data to monitor forest infestation with the SDR at the pixel scale. In TIR images, pixels with a low LAI may include an excessive surface temperature due to the background radiation of soil; this will affect the correlation between the SDR and temperature, resulting in errors when monitoring forest infestations. In particular, in sparse coniferous forests where the crown needles have a small surface area and a non-aggregated canopy structure, background thermal radiation generated below the canopy can easily be captured by sensors.
4. Discussion
4.1. The Need for Thermal Infrared Imaging Combined with High-Resolution Optical Data and LiDAR Data
The technical limitations of TIR instruments mean that the resolution of TIR images is coarser than optical and LiDAR data generated from UAV-based sensors [39]. Only temperature is contained in the canopy information of TIR data, and additional data sources are needed to provide the required data regrading the tree crown. In TIR data, temperature information is available for reverse water content, stomatal conductance, evapotranspiration, and other ground-feature parameters [40,41,42]. However, optical data contain more information on the physiological and biochemical parameters of plants, which could cause spectral changes [43,44]. In contrast, LiDAR data contain rich spatial structural characteristics for distinguishing the geometric information of surface features, which is used mainly for extracting the structural parameters of plants at the canopy level [33,45].
Therefore, using a combination of different remote sensing data can exploit the advantages of each source and the different plant information, providing a more accurate evaluation of the health status of vegetation. The improved accuracy for monitoring forest infestations via the comprehensive use of multi-source, high-resolution remote sensing data may be conducive to quickly estimating the outbreak of forest pests in a large area and taking appropriate actions to limit the spread of the pests [30,46].
4.2. The Adverse Effects of Low LAI on the Correlation between SDR and Temperature
The analysis of the data from 15 trees revealed that the LAI was significantly negatively correlated with CST (r = −0.9121) in individual trees, and the LAI had a major impact on CST. Under a low LAI, the CST of a tree crown was affected by the radiation from the soil below the canopy; this led to mixed of crown/soil radiation that was not representative of the real temperature of the canopy. After the abnormal data was removed from three trees with low LAIs (<1), the relationship between the SDR and CST increased from 0.0907 to 0.6936. Hence, 30 trees with different SDRs were selected from the two plots to analyze the correlation between the extracted canopy temperature and the actual SDR. The great coefficient of determination (R2 = 0.7890) indicated that TIR was able to monitor the effect of bark beetles, as was also the case at the leaf scale [29]. Moreover, it performed better using TIR data than the spectral index approach, including normalized differential vegetation index (NDVI) and leaf pigment activity indices to estimate SDR (R2 = 0.67) [22].
The negative correlation between the LAI and temperature was also expressed at the plot scale (r = −0.5902). At this scale, the relatively weak correlation was influenced by shrubs within the plot. The lower temperature of the shrubs contributed to the overall temperature of the plot; therefore, if a plot included more shrubs, the average temperature decreased. As it is difficult to measure the LAI of shrubs, LiDAR is required for correction, although the results may not be entirely accurate. As such, the effects of non-target objects on monitoring results still exist on a large scale. It is necessary to eliminate this influence using other additional data sources such as LiDAR and hyperspectral images. The combination of structure and spectral information generated from LiDAR and hyperspectral data can take advantage of different sources of information to retrieve the parameters, such as LAI and vegetation indices, for monitoring forest health for improving the accuracy of SDR detection [47,48].
5. Conclusions
This study confirmed the feasibility of using TIR imagery for monitoring infestations of bark beetles in Yunnan pines using combined UAV-based LiDAR data at the individual tree and plot scales. The correlation between SDR and temperature was greatly affected by low LAIs. After the data of low LAI were removed, an obvious correlation between SDR and temperature was found to exist at the single plant and plot scales. Determination coefficients of 0.7890 and 0.5532 were calculated, respectively, which confirmed the feasibility of using TIR to estimate SDRs. In this study, the detection accuracy of SDR in infected forest still had room for improvement if a three-dimensional radiative transfer (RT) model was to be used, such as RAPID, DART, and LESS. These RT models can provide more detailed data for reducing the influence of environment parameters and furthering the application of multi-source remote sensing. In further research, the scale will be expanded to pixel scale using a combination of thermal infrared and optical satellite images to improve the accuracy of monitoring large-scale regional forest infestations.
Author Contributions
J.W. and H.H. conceived and designed the experiments; Q.L., S.M. and Y.L. conducted the field experiments; J.W. analyzed the data; J.W. wrote the paper. All authors have read and agreed to the published version of the manuscript.
Funding
This research was funded by the National Natural Science Foundation of China (41571332), the Science and Technology Project of Henan Province (212102310024), the Talents Training Program of the Henan Academy of Sciences (220401010), and the Special Project for Team Building of the Henan Academy of Sciences (200501007).
Institutional Review Board Statement
Not applicable.
Informed Consent Statement
Written informed consent has been obtained from the patient(s) to publish this paper.
Conflicts of Interest
The authors declare no conflict of interest.
References
- Abdullah, H.; Darvishzadeh, R.; Skidmore, A.K.; Heurich, M. Sensitivity of Landsat-8 OLI and TIRS Data to Foliar Properties of Early Stage Bark Beetle (Ips typographus, L.) Infestation. Remote Sens. 2019, 11, 398. [Google Scholar] [CrossRef] [Green Version]
- Morris, J.L.; Cottrell, S.; Fettig, C.J.; Hansen, W.; Sherriff, R.L.; Carter, V.; Clear, J.; Clement, J.; Derose, R.J.; Hicke, J.A.; et al. Managing bark beetle impacts on ecosystems and society: Priority questions to motivate future research. J. Appl. Ecol. 2016, 54, 750–760. [Google Scholar] [CrossRef]
- Rimal, B.; Keshtkar, H.; Stork, N.; Rijal, S. Forest Cover and Sustainable Development in the Lumbini Province, Nepal: Past, Present and Future. Remote Sens. 2021, 13, 4093. [Google Scholar] [CrossRef]
- Feng, X.M.; Fu, B.J.; Lu, N.; Zeng, Y.; Wu, B.F. How ecological restoration alters ecosystem services: An analysis of carbon sequestration in China’s Loess Plateau. Sci. Rep. 2013, 3, 2846–2851. [Google Scholar] [CrossRef] [PubMed]
- Näsi, R.; Honkavaara, E.; Lyytikäinen-Saarenmaa, P.; Blomqvist, M.; Litkey, P.; Hakala, T.; Viljanen, N.; Kantola, T.; Tanhuanpää, T.; Holopainen, M. Using UAV-Based Photogrammetry and Hyperspectral Imaging for Mapping Bark Beetle Damage at Tree-Level. Remote Sens. 2015, 7, 15467–15493. [Google Scholar] [CrossRef] [Green Version]
- Coops, N.C.; Wulder, M.A.; White, J.C. Integrating remotely sensed and ancillary data sources to characterize a mountain pine beetle infestation. Remote Sens. Environ. 2006, 105, 83–97. [Google Scholar] [CrossRef]
- Coops, N.C.; Johnson, M.; Wulder, M.; White, J. Assessment of QuickBird high spatial resolution imagery to detect red attack damage due to mountain pine beetle infestation. Remote Sens. Environ. 2006, 103, 67–80. [Google Scholar] [CrossRef]
- Netherer, S.; Matthews, B.; Katzensteiner, K.; Blackwell, E.; Henschke, P.; Hietz, P.; Pennerstorfer, J.; Rosner, S.; Kikuta, S.; Schume, H.; et al. Do water-limiting conditions predispose Norway spruce to bark beetle attack? New Phytol. 2015, 205, 1128–1141. [Google Scholar] [CrossRef]
- Marx, A.; Sagischewski, H.; Sossna, I.; Chmara, S. Detecting bark beetle infestation in spruce stands using multi-temporal RapidEye Satellite Data. J. Magn. Reson. Imaging. 2010, 42, 1281–1290. [Google Scholar]
- Michael, S.; Chen, J.; Peter, C. Combining land surface temperature and shortwave infrared reflectance for early detection of mountain pine beetle infestations in western Canada. J. Appl. Remote Sens. 2011, 5, 53566. [Google Scholar]
- Shen, Q.; Deng, J.; Liu, X.S.; Huang, H.G. Prediction of bark beetles pests based on temperature vegetation dryness index. Trans. Chin. Soc. Agric. Eng. 2018, 34, 167–174. [Google Scholar]
- Leinonen, I.; Grant, O.M.; Tagliavia, C.P.P.; Chaves, M.M.; Jones, H. Estimating stomatal conductance with thermal imagery. Plant Cell Environ. 2006, 29, 1508–1518. [Google Scholar] [CrossRef] [PubMed]
- Scherrer, D.; Bader, M.K.; Körner, C. Drought-sensitivity ranking of deciduous tree species based on thermal imaging of forest canopies. Agric. Forest Meteorol. 2011, 151, 1632–1640. [Google Scholar] [CrossRef]
- López-López, M.; Calderón, R.; González-Dugo, V.; Zarco-Tejada, P.J.; Fereres, E. Early Detection and Quantification of Almond Red Leaf Blotch Using High-Resolution Hyperspectral and Thermal Imagery. Remote Sens. 2016, 8, 276. [Google Scholar] [CrossRef] [Green Version]
- Hubbard, R.M.; Rhoades, C.C.; Elder, K.; Negron, J. Changes in transpiration and foliage growth in lodgepole pine trees following mountain pine beetle attack and mechanical girdling. For. Ecol. Manag. 2013, 289, 312–317. [Google Scholar] [CrossRef]
- Xu, H.Q. Change of Landsat 8 TIRS calibration parameters and its effect on land surface temperature retrieval. J. Remote Sens. 2016, 20, 229–235. [Google Scholar]
- Almalki, A.F.; Soufiene, O.B.; Alsamhi, H.S.; Sakli, H. A Low-Cost Platform for Environmental Smart Farming Monitoring System Based on IoT and UAVs. Sustainability 2021, 13, 5908. [Google Scholar] [CrossRef]
- Maes, W.H.; Huete, A.R.; Avino, M.; Boer, M.M.; Dehaan, R.; Pendall, E.; Griebel, A.; Steppe, K. Can UAV-Based Infrared Thermography Be Used to Study Plant-Parasite Interactions between Mistletoe and Eucalypt Trees? Remote Sens. 2018, 10, 2062. [Google Scholar] [CrossRef] [Green Version]
- Regnard, J.L. Contribution of High-Resolution Multispectral and Thermal-Infrared Airborne Imagery to Assess the Behavior of Fruit Trees Facing Water Stress: Proof of the Concept and First Results in an Apple Variety Field Trial. In Proceedings of the 2017 EFITA WCCA Congress, Montpellier, France, 2–6 July 2017. [Google Scholar]
- Leinonen, I.; Jones, H.G. Combining thermal and visible imagery for estimating canopy temperature and identifying plant stress. J. Exp. Bot. 2004, 55, 1423–1431. [Google Scholar] [CrossRef] [Green Version]
- Gerhards, M.; Schlerf, M.; Rascher, U.; Udelhoven, T.; Juszczak, R.; Alberti, G.; Miglietta, F.; Inoue, Y. Analysis of Airborne Optical and Thermal Imagery for Detection of Water Stress Symptoms. Remote Sens. 2018, 10, 1139. [Google Scholar] [CrossRef] [Green Version]
- Lin, Q.N.; Huang, H.G.; Wang, J.X.; Huang, K.; Liu, Y.Y. Detection of Pine Shoot Beetle (PSB) Stress on Pine Forests at Indi-vidual Tree Level using UAV-Based Hyperspectral Imagery and Lidar. Remote Sens. 2019, 11, 2540. [Google Scholar] [CrossRef] [Green Version]
- Yu, L.; Huang, J.; Zong, S.; Huang, H.; Luo, Y. Detecting Shoot Beetle Damage on Yunnan Pine Using Landsat Time-Series Data. Forests 2018, 9, 39. [Google Scholar] [CrossRef] [Green Version]
- Lieutier, F.; Ye, H.; Yart, A. Shoot damage by Tomicus sp. (Coleoptera: Scolytidae) and effect on Pinus yunnanensis resistance to subsequent reproductive attacks in the stem. Agric. For. Èntomol. 2003, 5, 227–233. [Google Scholar] [CrossRef]
- Vanderhoof, M.; Williams, C.A.; Ghimire, B.; Rogan, J. Impact of mountain pine beetle outbreaks on forest albedo and radiative forcing, as derived from Moderate Resolution Imaging Spectroradiometer, Rocky Mountains, USA. J. Geophys. Res. Biogeosci. 2013, 118, 1461–1471. [Google Scholar] [CrossRef]
- Hart, S.J.; Veblen, T.T. Detection of spruce beetle-induced tree mortality using high- and medium-resolution remotely sensed imagery. Remote Sens. Environ. 2015, 168, 134–145. [Google Scholar] [CrossRef] [Green Version]
- Wulder, M.A.; Dymond, C.C.; White, J.; Leckie, D.G.; Carroll, A.L. Surveying mountain pine beetle damage of forests: A review of remote sensing opportunities. For. Ecol. Manag. 2006, 221, 27–41. [Google Scholar] [CrossRef]
- Niemann, K.O.; Quinn, G.; Stephen, R.; Visintini, F.; Parton, D. Hyperspectral Remote Sensing of Mountain Pine Beetle with an Emphasis on Previsual Assessment. Can. J. Remote Sens. 2015, 41, 191–202. [Google Scholar] [CrossRef]
- Wang, J.-X.; Huang, H.-G.; Lin, Q.-N.; Wang, B.; Huang, K. Shoot beetle damage to Pinus yunnanensis monitored by infrared thermal imaging at needle scale. Chin. J. Plant Ecol. 2019, 43, 959–968. [Google Scholar] [CrossRef]
- Lin, Q.; Huang, H.; Chen, L.; Wang, J.; Huang, K.; Liu, Y. Using the 3D model RAPID to invert the shoot dieback ratio of vertically heterogeneous Yunnan pine forests to detect beetle damage. Remote Sens. Environ. 2021, 260, 112475. [Google Scholar] [CrossRef]
- Donoghue, D.N.; Watt, P.J.; Cox, N.J.; Wilson, J. Remote sensing of species mixtures in conifer plantations using LiDAR height and intensity data. Remote Sens. Environ. 2007, 110, 509–522. [Google Scholar] [CrossRef]
- Hovi, A.; Korhonen, L.; Vauhkonen, J.; Korpela, I. LiDAR waveform features for tree species classification and their sensitivity to tree- and acquisition related parameters. Remote Sens. Environ. 2016, 173, 224–237. [Google Scholar] [CrossRef]
- Dandois, J.P.; Ellis, E.C. High spatial resolution three-dimensional mapping of vegetation spectral dynamics using computer vision. Remote Sens. Environ. 2013, 136, 259–276. [Google Scholar] [CrossRef] [Green Version]
- Hanssen, K.H.; Solberg, S. Assessment of defoliation during a pine sawfly outbreak: Calibration of airborne laser scanning data with hemispherical photography. For. Ecol. Manag. 2007, 250, 9–16. [Google Scholar] [CrossRef]
- Shanley, C.S.; Eacker, D.R.; Reynolds, C.P.; Bennetsen, B.M.; Gilbert, S.L. Using LiDAR and Random Forest to improve deer habitat models in a managed forest landscape. For. Ecol. Manag. 2021, 499, 119580. [Google Scholar] [CrossRef]
- Ma, H.; Song, J.; Wang, J.; Xiao, Z.; Fu, Z. Improvement of spatially continuous forest LAI retrieval by integration of discrete airborne LiDAR and remote sensing multi-angle optical data. Agric. For. Meteorol. 2014, 189–190, 60–70. [Google Scholar] [CrossRef]
- Lin, Q.; Huang, H.; Yu, L.F.; Wang, J.X. Detection of Shoot Beetle Stress on Yunnan Pine Forest Using a Coupled LIBER-TY2-INFORM Simulation. Remote Sens. 2018, 10, 1133. [Google Scholar] [CrossRef] [Green Version]
- Shabanov, N.; Gastellu-Etchegorry, J.P. The stochastic Beer–Lambert–Bouguer law for discontinuous vegetation canopies. J. Quant. Spectrosc. Radiat. Transf. 2018, 214, 18–32. [Google Scholar] [CrossRef]
- Chen, X.; Li, W.; Chen, J.; Rao, Y.; Yamaguchi, Y. A Combination of TsHARP and Thin Plate Spline Interpolation for Spatial Sharpening of Thermal Imagery. Remote Sens. 2014, 6, 2845–2863. [Google Scholar] [CrossRef] [Green Version]
- Sandholt, I.; Rasmussen, K.; Andersen, J. A simple interpretation of the surface temperature/vegetation index space for as-sessment of surface moisture status. Remote Sens. Environ. 2002, 79, 213–224. [Google Scholar] [CrossRef]
- Zarco-Tejada, P.J.; González-Dugo, V.; Berni, J.A.J. Fluorescence, temperature and narrow-band indices acquired from a UAV platform for water stress detection using a micro-hyperspectral imager and a thermal camera. Remote Sens. Environ. 2012, 117, 322–337. [Google Scholar] [CrossRef]
- Zhang, L.; Niu, Y.; Zhang, H.; Han, W.; Li, G.; Tang, J.; Peng, X. Maize Canopy Temperature Extracted From UAV Thermal and RGB Imagery and Its Application in Water Stress Monitoring. Front. Plant Sci. 2019, 10, 1270. [Google Scholar] [CrossRef] [PubMed]
- Oumar, Z.; Mutanga, O. Integrating environmental variables and WorldView-2 image data to improve the prediction and mapping of Thaumastocoris peregrinus (bronze bug) damage in plantation forests. ISPRS J. Photogramm. 2014, 87, 39–46. [Google Scholar] [CrossRef]
- Darvishzadeh, R.; Skidmore, A.; Abdullah, H.; Cherenet, E.; Ali, A.; Wang, T.; Nieuwenhuis, W.; Heurich, M.; Vrieling, A.; O’Connor, B.; et al. Mapping leaf chlorophyll content from Sentinel-2 and RapidEye data in spruce stands using the invertible forest reflectance model. Int. J. Appl. Earth Obs. Geoinf. 2019, 79, 58–70. [Google Scholar] [CrossRef] [Green Version]
- Díaz-Varela, R.A.; De La Rosa, R.; León, L.; Zarco-Tejada, P.J. High-Resolution Airborne UAV Imagery to Assess Olive Tree Crown Parameters Using 3D Photo Reconstruction: Application in Breeding Trials. Remote Sens. 2015, 7, 4213–4232. [Google Scholar] [CrossRef] [Green Version]
- Stereńczak, K.; Mielcarek, M.; Modzelewska, A.; Kraszewski, B.; Fassnacht, F.E.; Hilszczański, J. Intra-annual Ips typographus outbreak monitoring using a multi-temporal GIS analysis based on hyperspectral and ALS data in the Białowieża Forests. For. Ecol. Manag. 2019, 442, 105–116. [Google Scholar] [CrossRef]
- Yu, R.; Luo, Y.Q.; Zhou, Q.; Zhang, X.D.; Wu, D.W.; Ren, L.L. A Machine Learning Algorithm to Detect Pine Wilt Disease using UAV-Based Hyperspectral Imagery and LiDAR Data at the Tree Level. Int. J. Appl. Earth Obs. 2021, 101, 102363–102372. [Google Scholar] [CrossRef]
- Neinavaz, E.; Darvishzadeh, R.; Skidmore, K.A.; Abdullah, H. Integration of Landsat-8 Thermal and Visible-Short Wave In-frared Data for Improving Prediction Accuracy of Forest Leaf Area Index. Remote Sens. 2019, 11, 390. [Google Scholar] [CrossRef] [Green Version]
Figure 1.
The location of the study sites and the flight area of the unmanned airborne vehicle (UAV). The red rectangles represent the location of two field plots, and the blue rectangle represents the UAV-based thermal and light detection and ranging (LiDAR) fight area.
Figure 1.
The location of the study sites and the flight area of the unmanned airborne vehicle (UAV). The red rectangles represent the location of two field plots, and the blue rectangle represents the UAV-based thermal and light detection and ranging (LiDAR) fight area.

Figure 2.
The correction of the thermal infrared (TIR) data: (a) the original TIR gray image with a digital number value, and (b) the TIR image in a plot after calibration and emissivity correction.
Figure 2.
The correction of the thermal infrared (TIR) data: (a) the original TIR gray image with a digital number value, and (b) the TIR image in a plot after calibration and emissivity correction.

Figure 3.
The segmentation of individual trees in the plot from LiDAR point cloud with the specific viewing angles (45°, 45°). Gray color means background, white color means no points, and other colors present segmented trees.
Figure 3.
The segmentation of individual trees in the plot from LiDAR point cloud with the specific viewing angles (45°, 45°). Gray color means background, white color means no points, and other colors present segmented trees.

Figure 4.
The temperatures of different ground features in two plots (leaf region). The visible images of each feature (right region) are cropped from the high-resolution visible image obtained by the unmanned airborne vehicle.
Figure 4.
The temperatures of different ground features in two plots (leaf region). The visible images of each feature (right region) are cropped from the high-resolution visible image obtained by the unmanned airborne vehicle.

Figure 5.
(a) Thermal infrared data of the plot and temperature profiles of the canopies. (b) LiDAR data of the same plot and the extracted canopy boundaries.
Figure 5.
(a) Thermal infrared data of the plot and temperature profiles of the canopies. (b) LiDAR data of the same plot and the extracted canopy boundaries.

Figure 6.
The correlation between leaf area index (LAI) and canopy surface temperature (CST) in 15 trees in the plots (a). The regression analysis of shoot damage ratio and CST with the same sample of trees (b). The red points represent the abnormal CST points of three trees with low LAIs.
Figure 6.
The correlation between leaf area index (LAI) and canopy surface temperature (CST) in 15 trees in the plots (a). The regression analysis of shoot damage ratio and CST with the same sample of trees (b). The red points represent the abnormal CST points of three trees with low LAIs.

Figure 7.
The correlation between SDR and CST of 30 affected pines with high LAI in plots.

Figure 8.
The correlation analysis between plot temperature and LAI (a) and SDR (b) in 50 plots, which were demarcated from two large plots.
Figure 8.
The correlation analysis between plot temperature and LAI (a) and SDR (b) in 50 plots, which were demarcated from two large plots.

Figure 9.
The correlation analysis of plot SDR and Tp with a leaf area index > 1.


Table 1.
The statistics for each tree variables of two plots (n = 409).
| Variables | Mean | Standard Deviation | Maximum | Minimum |
|---|---|---|---|---|
| DBH (m) | 8.14 | 3.31 | 25 | 1 |
| H (m) | 4.5 | 1.6 | 9.8 | 1.2 |
| CD (m) | 2.2 | 1.0 | 7.3 | 0.5 |
| SD (ha−1) | 1206 | 660 | 2560 | 868 |
| LAI (m2·m−2) | 0.89 | 0.47 | 2 | 0.4 |
| SDR (%) | 6.5 | 15.11 | 100 | 0 |
| SDRplot (%) | 14.96 | 6.22 | 34 | 2 |
Table 2.
The characteristic parameters and temperatures of four ground features.
| Emissivity | Area (m2) | Temperature (°C) | Object Distance (m) | |
|---|---|---|---|---|
| PVC board | 0.93 | 0.8 × 1.2 | 24.5 | 1.0 |
| Tile | 0.94 | 0.8 × 0.8 | 29.9 | 1.0 |
| Wood | 0.83 | 1.2 × 1.2 | 27.5 | 1.0 |
| Asphalt road | 0.97 | 1.5 × 1.5 | 39.1 | 1.0 |
Table 3.
Accuracy assessment of tree crown segmentation using LiDAR data in two plots.
| Filed Measured | TP | FP | FN | p | r | F | |
|---|---|---|---|---|---|---|---|
| Plot1 | 243 | 234 | 2 | 7 | 0.99 | 0.97 | 0.98 |
| Plot2 | 166 | 161 | 1 | 4 | 0.99 | 0.97 | 0.98 |
Publisher’s Note: MDPI stays neutral with regard to jurisdictional claims in published maps and institutional affiliations. |
© 2022 by the authors. Licensee MDPI, Basel, Switzerland. This article is an open access article distributed under the terms and conditions of the Creative Commons Attribution (CC BY) license (https://creativecommons.org/licenses/by/4.0/).
Share and Cite
MDPI and ACS Style
Wang, J.; Meng, S.; Lin, Q.; Liu, Y.; Huang, H. Detection of Yunnan Pine Shoot Beetle Stress Using UAV-Based Thermal Imagery and LiDAR. Appl. Sci. 2022, 12, 4372. https://0-doi-org.brum.beds.ac.uk/10.3390/app12094372
AMA Style
Wang J, Meng S, Lin Q, Liu Y, Huang H. Detection of Yunnan Pine Shoot Beetle Stress Using UAV-Based Thermal Imagery and LiDAR. Applied Sciences. 2022; 12(9):4372. https://0-doi-org.brum.beds.ac.uk/10.3390/app12094372
Chicago/Turabian StyleWang, Jingxu, Shengwang Meng, Qinnan Lin, Yangyang Liu, and Huaguo Huang. 2022. "Detection of Yunnan Pine Shoot Beetle Stress Using UAV-Based Thermal Imagery and LiDAR" Applied Sciences 12, no. 9: 4372. https://0-doi-org.brum.beds.ac.uk/10.3390/app12094372
Note that from the first issue of 2016, this journal uses article numbers instead of page numbers. See further details here.