
Are Quantitative Errors Reduced with Time-of-Flight Reconstruction When Using Imperfect MR-Based Attenuation Maps for 18F-FDG PET/MR Neuroimaging?


Abstract
:1. Introduction
2. Materials and Methods
2.1. Patient Data
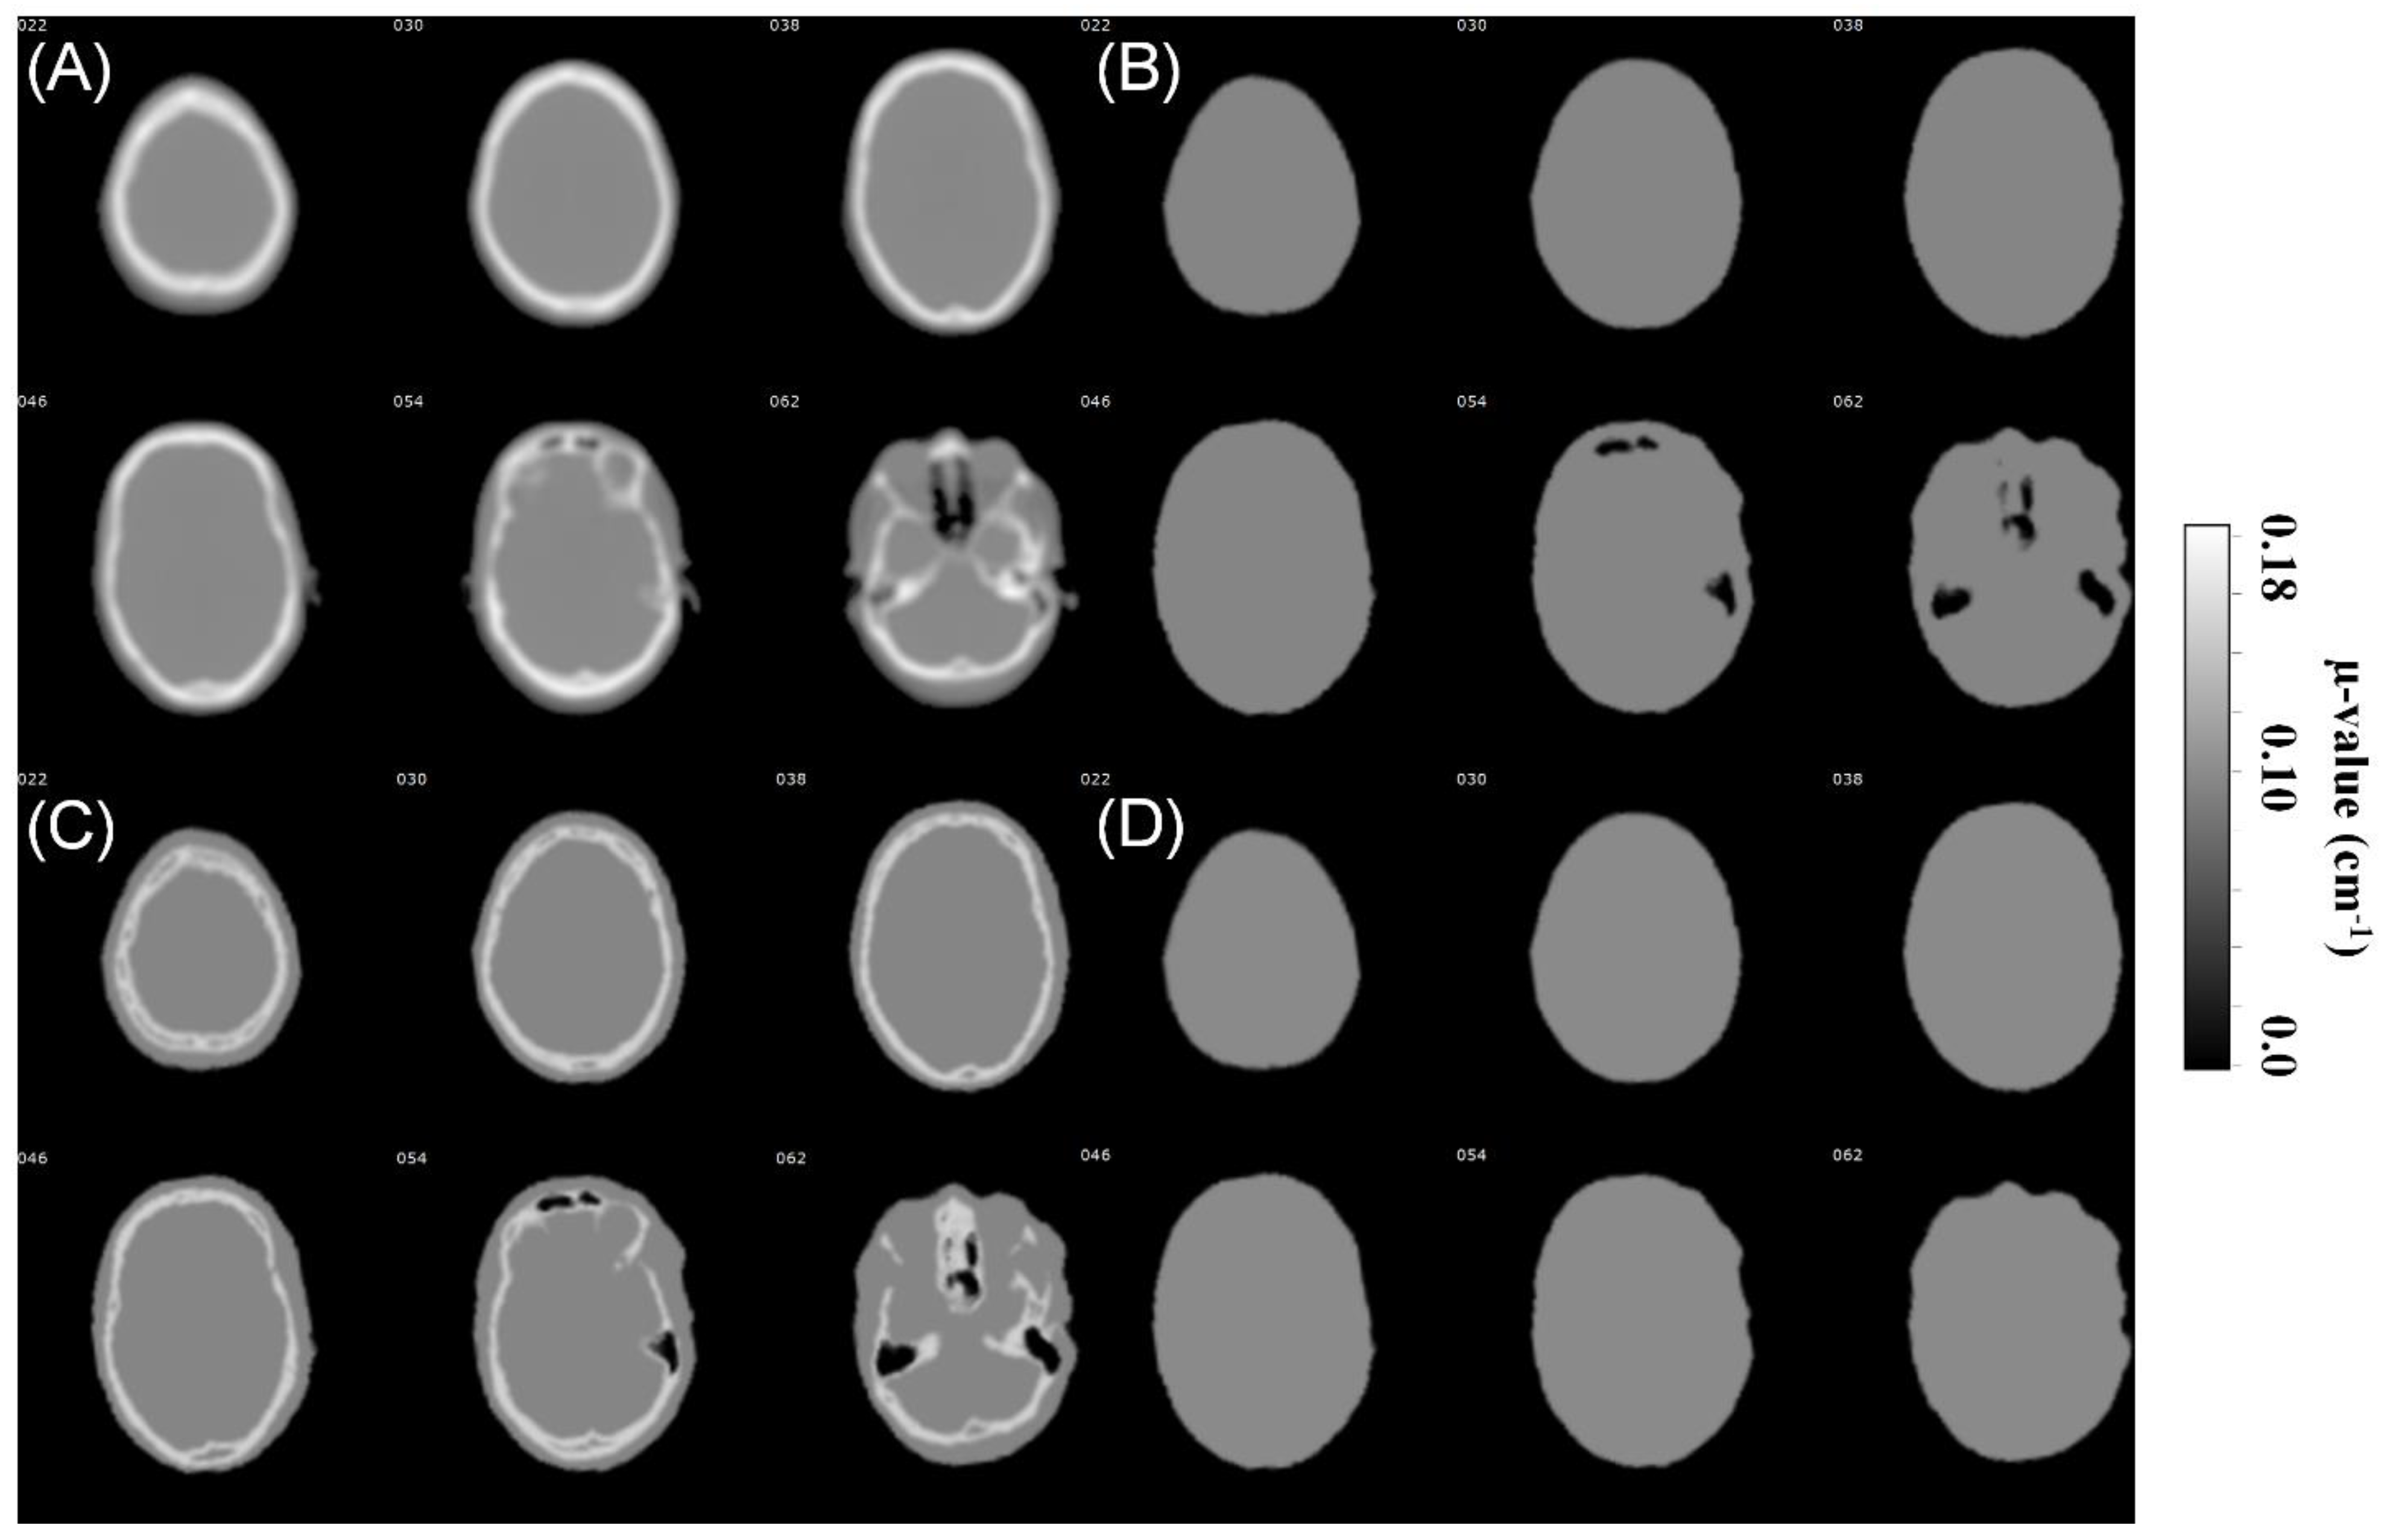
2.2. CTAC Data
2.3. MRAC Data
2.4. Importing CTAC and MRAC to PET Reconstruction
2.5. PET Reconstruction Protocol
2.6. PET Image Analysis
3. Results
4. Discussion
Limitations
5. Conclusions
Author Contributions
Funding
Institutional Review Board Statement
Informed Consent Statement
Data Availability Statement
Acknowledgments
Conflicts of Interest
Appendix A. VOI Analysis Result Tables

| 2-Class MRAC (No Air) | 2-Class MRAC | 3-Class MRAC | |||||||
|---|---|---|---|---|---|---|---|---|---|
| Non-TOF | TOF | DIFF | Non-TOF | TOF | DIFF | Non-TOF | TOF | DIFF | |
| Precentral | −6.55% | −6.43% | −0.12% | −6.67% | −6.58% | −0.09% | −2.86% | −3.02% | 0.16% |
| Rolandic_Oper | −3.99% | −3.45% | −0.54% | −4.18% | −3.75% | −0.43% | −2.33% | −2.49% | 0.16% |
| Supp_Motor Area | −4.92% | −5.66% | 0.74% | −5.04% | −5.79% | 0.75% | −3.34% | −3.10% | −0.24% |
| Olfactory | −4.20% | −4.77% | 0.57% | −4.64% | −5.16% | 0.52% | −2.77% | −2.84% | 0.07% |
| Region #5 | −5.40% | −5.80% | 0.40% | −5.88% | −6.23% | 0.35% | −2.94% | −2.99% | 0.05% |
| Frontal_Sup | −6.39% | −6.38% | −0.02% | −6.83% | −6.70% | −0.13% | −3.39% | −3.19% | −0.20% |
| Frontal_Mied | −6.37% | −5.54% | −0.83% | −6.94% | −6.05% | −0.90% | −2.84% | −2.79% | −0.05% |
| Frontal_Inf | −4.85% | −3.54% | −1.31% | −5.25% | −4.12% | −1.13% | −1.82% | −2.08% | 0.26% |
| Rectus | 0.01% | −1.59% | 1.61% | −1.26% | −2.21% | 0.94% | −1.44% | −2.30% | 0.86% |
| Insula | −0.80% | −0.94% | 0.14% | −1.11% | −1.30% | 0.19% | −2.50% | −2.22% | −0.28% |
| Cingulum_Ant | −1.08% | −2.03% | 0.95% | −1.25% | −2.21% | 0.96% | −2.88% | −2.25% | −0.62% |
| Cingulum_Mid | −1.14% | −2.54% | 1.40% | −1.28% | −2.71% | 1.43% | −3.02% | −2.62% | −0.40% |
| Cingulum_Post | −2.78% | −3.23% | 0.45% | −3.11% | −3.82% | 0.71% | −3.29% | −2.83% | −0.45% |
| Hippocampus/ParaHippocampal | −0.78% | −1.22% | 0.43% | −1.29% | −2.15% | 0.86% | −3.59% | −2.94% | −0.66% |
| Amygdala | −3.38% | −3.38% | 0.01% | −3.83% | −4.23% | 0.40% | −3.74% | −3.06% | −0.68% |
| Calcarine | −4.24% | −3.17% | −1.07% | −4.53% | −3.75% | −0.78% | −3.74% | −2.67% | −1.07% |
| Cuneus | −6.67% | −5.38% | −1.28% | −6.86% | −5.82% | −1.04% | −4.20% | −3.30% | −0.89% |
| Lingual | −4.03% | −3.22% | −0.80% | −4.50% | −4.18% | −0.32% | −3.61% | −2.67% | −0.94% |
| Occipital | −10.67% | −9.17% | −1.51% | −10.85% | −9.72% | −1.13% | −3.97% | −3.66% | −0.32% |
| Fusiform | −5.43% | −3.25% | −2.18% | −6.70% | −5.28% | −1.42% | −4.77% | −3.32% | −1.45% |
| Postcentral | −6.79% | −6.20% | −0.59% | −6.99% | −6.53% | −0.46% | −2.83% | −2.87% | 0.04% |
| SupraMarginal | −5.57% | −4.71% | −0.86% | −6.23% | −5.72% | −0.51% | −3.28% | −2.81% | −0.47% |
| Angular | −6.63% | −5.98% | −0.65% | −6.93% | −6.45% | −0.47% | −2.32% | −2.47% | 0.15% |
| Precuneus | −8.52% | −7.73% | −0.79% | −8.77% | −8.15% | −0.62% | −3.14% | −2.91% | −0.23% |
| Paracentral Lobule | −5.20% | −4.70% | −0.51% | −5.42% | −4.98% | −0.44% | −3.70% | −3.01% | −0.69% |
| Caudate | −5.72% | −5.28% | −0.43% | −6.18% | −6.01% | −0.17% | −3.51% | −2.92% | −0.60% |
| Putamen | −0.71% | −1.51% | 0.81% | −1.18% | −2.21% | 1.03% | −2.56% | −2.07% | −0.48% |
| Pallidum | −2.40% | −2.49% | 0.10% | −3.00% | −3.28% | 0.28% | −2.88% | −2.55% | −0.33% |
| Thalamus | −6.47% | −5.15% | −1.32% | −7.41% | −6.62% | −0.79% | −3.69% | −3.15% | −0.55% |
| Heschl | −4.18% | −3.78% | −0.40% | −4.86% | −4.84% | −0.02% | −3.28% | −2.75% | −0.53% |
| Parietal | −6.16% | −4.96% | −1.21% | −6.98% | −6.17% | −0.80% | −3.43% | −3.00% | −0.42% |
| Temporal | −8.32% | −8.02% | −0.29% | −8.60% | −8.40% | −0.19% | −3.20% | −3.33% | 0.13% |
| Vermis | −7.29% | −4.29% | −3.00% | −7.80% | −5.77% | −2.04% | −2.99% | −2.12% | −0.87% |
| Cerebellum Crus | −5.85% | −4.51% | −1.35% | −7.98% | −7.88% | −0.10% | −4.93% | −4.34% | −0.59% |
| Cerebellum | −6.62% | −5.14% | −1.47% | −9.63% | −9.38% | −0.25% | −5.25% | −4.80% | −0.45% |
| 2-Class MRAC (No Air) | 2-Class MRAC | 3-Class MRAC | ||||
|---|---|---|---|---|---|---|
| Non-TOF | TOF | Non-TOF | TOF | Non-TOF | TOF | |
| Precentral | 2.10% | 2.38% | 2.15% | 2.41% | 1.65% | 1.83% |
| Rolandic_Oper | 1.99% | 2.02% | 2.01% | 2.00% | 1.69% | 1.76% |
| Supp_Motor Area | 2.02% | 2.36% | 2.03% | 2.38% | 1.60% | 1.91% |
| Olfactory | 1.67% | 1.93% | 1.83% | 2.02% | 1.60% | 1.77% |
| Region #5 | 1.90% | 2.20% | 2.05% | 2.29% | 1.72% | 1.85% |
| Frontal_Sup | 2.16% | 2.23% | 2.17% | 2.26% | 1.66% | 1.65% |
| Frontal_Mied | 2.19% | 2.21% | 2.24% | 2.18% | 1.76% | 1.70% |
| Frontal_Inf | 2.21% | 2.19% | 2.32% | 2.19% | 1.91% | 1.80% |
| Rectus | 1.95% | 1.92% | 2.41% | 2.02% | 2.44% | 1.97% |
| Insula | 1.62% | 1.86% | 1.61% | 1.80% | 1.53% | 1.74% |
| Cingulum_Ant | 1.57% | 1.86% | 1.46% | 1.83% | 1.24% | 1.62% |
| Cingulum_Mid | 1.57% | 2.14% | 1.51% | 2.13% | 1.32% | 1.81% |
| Cingulum_Post | 1.56% | 2.06% | 1.55% | 2.04% | 1.40% | 1.88% |
| Hippocampus/ParaHippocampal | 1.78% | 1.96% | 1.86% | 2.22% | 1.62% | 2.08% |
| Amygdala | 1.90% | 2.15% | 2.02% | 2.27% | 1.80% | 2.08% |
| Calcarine | 1.67% | 1.91% | 1.67% | 1.78% | 1.55% | 1.76% |
| Cuneus | 1.73% | 2.03% | 1.73% | 1.93% | 1.64% | 1.83% |
| Lingual | 1.51% | 1.82% | 1.48% | 1.67% | 1.55% | 1.85% |
| Occipital | 2.30% | 2.18% | 2.33% | 2.07% | 2.14% | 2.11% |
| Fusiform | 1.64% | 2.15% | 1.70% | 1.91% | 1.54% | 1.87% |
| Postcentral | 2.15% | 2.30% | 2.14% | 2.27% | 1.88% | 1.94% |
| SupraMarginal | 1.77% | 2.10% | 1.68% | 1.92% | 1.62% | 1.94% |
| Angular | 2.33% | 2.53% | 2.26% | 2.42% | 1.89% | 2.06% |
| Precuneus | 2.42% | 2.80% | 2.37% | 2.70% | 2.02% | 2.29% |
| Paracentral Lobule | 1.53% | 2.24% | 1.50% | 2.18% | 1.42% | 1.84% |
| Caudate | 2.01% | 2.48% | 1.95% | 2.39% | 1.74% | 2.12% |
| Putamen | 1.40% | 1.86% | 1.29% | 1.72% | 1.25% | 1.75% |
| Pallidum | 1.49% | 1.81% | 1.52% | 1.70% | 1.62% | 1.83% |
| Thalamus | 1.79% | 2.10% | 1.88% | 2.00% | 1.86% | 2.05% |
| Heschl | 1.66% | 2.09% | 1.62% | 1.95% | 1.55% | 1.90% |
| Parietal | 1.75% | 2.06% | 1.71% | 1.93% | 1.73% | 1.94% |
| Temporal | 2.23% | 2.66% | 2.19% | 2.62% | 2.01% | 2.13% |
| Vermis | 2.18% | 2.29% | 2.28% | 2.44% | 2.08% | 2.33% |
| Cerebellum Crus | 2.19% | 2.37% | 2.31% | 2.21% | 1.97% | 2.10% |
| Cerebellum | 2.35% | 2.55% | 2.56% | 2.54% | 2.12% | 2.32% |
References
- Zaidi, H.; Ojha, N.; Morich, M.; Griesmer, J.; Hu, Z.; Maniawski, P.; Ratib, O.; Izquierdo-Garcia, D.; Fayad, Z.A.; Shao, L. Design and performance evaluation of a whole-body Ingenuity TF PET–MRI system. Phys. Med. Biol. 2011, 56, 3091. [Google Scholar] [CrossRef] [Green Version]
- Grant, A.M.; Deller, T.W.; Khalighi, M.M.; Maramraju, S.H.; Delso, G.; Levin, C.S. NEMA NU 2-2012 performance studies for the SiPM-based ToF-PET component of the GE SIGNA PET/MR system. Med. Phys. 2016, 43, 2334–2343. [Google Scholar] [CrossRef] [Green Version]
- Chen, S.; Gu, Y.; Yu, H.; Chen, X.; Cao, T.; Hu, L.; Shi, H. NEMA NU2-2012 performance measurements of the United Imaging uPMR790: An integrated PET/MR system. Eur. J. Nucl. Med. Mol. Imaging 2021, 48, 1726–1735. [Google Scholar] [CrossRef]
- Van Sluis, J.; De Jong, J.; Schaar, J.; Noordzij, W.; Van Snick, P.; Dierckx, R.; Borra, R.; Willemsen, A.; Boellaard, R. Performance Characteristics of the Digital Biograph Vision PET/CT System. J. Nucl. Med. 2019, 60, 1031–1036. [Google Scholar] [CrossRef]
- Conti, M. State of the art and challenges of time-of-flight PET. Phys. Med. Eur. J. Med. Phys. 2009, 25, 1–11. [Google Scholar] [CrossRef]
- Conti, M. Why is TOF PET reconstruction a more robust method in the presence of inconsistent data? Phys. Med. Biol. 2011, 56, 155–168. [Google Scholar] [CrossRef]
- Mehranian, A.; Zaidi, H. Impact of time-of-flight PET on quantification errors in MR imaging-based attenuation correction. J. Nucl. Med. 2015, 56, 635–641. [Google Scholar] [CrossRef] [Green Version]
- Conti, M.; Bendriem, B. The new opportunities for high time resolution clinical TOF PET. Clin. Transl. Imaging 2019, 7, 139–147. [Google Scholar] [CrossRef]
- Mehranian, A.; Arabi, H.; Zaidi, H. Vision 20/20: Magnetic resonance imaging-guided attenuation correction in PET/MRI: Challenges, solutions, and opportunities. Med. Phys. 2016, 43, 1130–1155. [Google Scholar] [CrossRef] [Green Version]
- Davison, H.; Ter Voert, E.E.G.W.; De Galiza Barbosa, F.; Veit-Haibach, P.; Delso, G. Incorporation of Time-of-Flight Information Reduces Metal Artifacts in Simultaneous Positron Emission Tomography/Magnetic Resonance Imaging: A Simulation Study. Investig. Radiol. 2015, 50, 423–429. [Google Scholar] [CrossRef] [Green Version]
- Svirydenka, H.; Delso, G.; De Galiza Barbosa, F.; Huellner, M.; Davison, H.; Fanti, S.; Veit-Haibach, P.; Ter Voert, E.E.G.W. The Effect of Susceptibility Artifacts Related to Metallic Implants on Adjacent-Lesion Assessment in Simultaneous TOF PET/MR. J. Nucl. Med. 2017, 58, 1167–1173. [Google Scholar] [CrossRef] [Green Version]
- Ter Voert, E.E.G.W.; Delso, G.; de Galiza Barbosa, F.; Huellner, M.; Veit-Haibach, P. The Effect of Defective PET Detectors in Clinical Simultaneous [18F]FDG Time-of-Flight PET/MR Imaging. Mol. Imaging Biol. 2017, 19, 626–635. [Google Scholar] [CrossRef] [Green Version]
- Delso, G.; Khalighi, M.; ter Voert, E.; Barbosa, F.; Sekine, T.; Hüllner, M.; Veit-Haibach, P. Effect of Time-of-Flight Information on PET/MR Reconstruction Artifacts: Comparison of Free-breathing versus Breath-hold MR-based Attenuation Correction. Radiology 2017, 282, 229–235. [Google Scholar] [CrossRef] [Green Version]
- Ter Voert, E.E.G.W.; Veit-Haibach, P.; Ahn, S.; Wiesinger, F.; Khalighi, M.M.; Levin, C.S.; Iagaru, A.H.; Zaharchuk, G.; Huellner, M.; Delso, G. Clinical evaluation of TOF versus non-TOF on PET artifacts in simultaneous PET/MR: A dual centre experience. Eur. J. Nucl. Med. Mol. Imaging 2017, 44, 1223–1233. [Google Scholar] [CrossRef]
- Boellaard, R.; Hofman, M.B.M.; Hoekstra, O.S.; Lammertsma, A.A. Accurate PET/MR quantification using time of flight MLAA image reconstruction. Mol. Imaging Biol. 2014, 16, 469–477. [Google Scholar] [CrossRef]
- Emond, E.C.; Bousse, A.; Machado, M.; Porter, J.; Groves, A.M.; Hutton, B.F.; Thielemans, K. Effect of attenuation mismatches in time of flight PET reconstruction. Phys. Med. Biol. 2020, 65, 085009. [Google Scholar] [CrossRef]
- Teuho, J.; Torrado-Carvajal, A.; Herzog, H.; Anazodo, U.; Klén, R.; Iida, H.; Teräs, M. Magnetic Resonance-Based Attenuation Correction and Scatter Correction in Neurological Positron Emission Tomography/Magnetic Resonance Imaging—Current Status With Emerging Applications. Front. Phys. 2020, 7, 243. [Google Scholar] [CrossRef]
- Ladefoged, C.N.; Law, I.; Anazodo, U.; Lawrence, K.S.; Izquierdo-Garcia, D.; Catana, C.; Burgos, N.; Cardoso, M.J.; Ourselin, S.; Hutton, B.; et al. A multi-centre evaluation of eleven clinically feasible brain PET/MRI attenuation correction techniques using a large cohort of patients. Neuroimage 2017, 147, 346–359. [Google Scholar] [CrossRef] [Green Version]
- Bettinardi, V.; Presotto, L.; Rapisarda, E.; Picchio, M.; Gianolli, L.; Gilardi, M.C. Physical performance of the new hybrid PET/CT Discovery-690. Med. Phys. 2011, 38, 5394–5411. [Google Scholar] [CrossRef]
- Burger, C.; Goerres, G.; Schoenes, S.; Buck, A.; Lonn, A.; Von Schulthess, G. PET attenuation coefficients from CT images: Experimental evaluation of the transformation of CT into PET 511-keV attenuation coefficients. Eur. J. Nucl. Med. 2002, 29, 922–927. [Google Scholar] [CrossRef] [Green Version]
- Schramm, G.; Langner, J.; Hofheinz, F.; Petr, J.; Beuthien-Baumann, B.; Platzek, I.; Steinbach, J.; Kotzerke, J.; Van Den Hoff, J. Quantitative accuracy of attenuation correction in the Philips Ingenuity TF whole-body PET/MR system: A direct comparison with transmission-based attenuation correction. Magma 2013, 26, 115–126. [Google Scholar] [CrossRef] [Green Version]
- Teuho, J.; Linden, J.; Johansson, J.; Tuisku, J.; Tuokkola, T.; Teräs, M. Tissue Probability-Based Attenuation Correction for Brain PET/MR by Using SPM8. IEEE Trans. Nucl. Sci. 2016, 63, 2452–2463. [Google Scholar] [CrossRef]
- Wald, A. Asymptotically Shortest Confidence Intervals. Ann. Math. Stat. 1942, 13, 127–137. [Google Scholar] [CrossRef]
- Benjamini, Y.; Hochberg, Y. Controlling the False Discovery Rate: A Practical and Powerful Approach to Multiple Testing. J. R. Stat. Soc. Ser. B 1995, 57, 289–300. [Google Scholar] [CrossRef]
- Ouyang, J.; Chun, S.Y.; Petibon, Y.; Bonab, A.A.; Alpert, N.; El Fakhri, G. Bias atlases for segmentation-based pet attenuation correction using PET-CT and MR. IEEE Trans. Nucl. Sci. 2013, 60, 3373–3382. [Google Scholar] [CrossRef]
- Khalifé, M.; Fernandez, B.; Jaubert, O.; Soussan, M.; Brulon, V.; Buvat, I.; Comtat, C. Subject-specific bone attenuation correction for brain PET/MR: Can ZTE-MRI substitute CT scan accurately? Phys. Med. Biol. 2017, 62, 7814–7832. [Google Scholar] [CrossRef] [Green Version]
- Lee, M.S.; Cates, J.W.; Gonzalez-Montoro, A.; Levin, C.S. High-resolution time-of-flight PET detector with 100 ps coincidence time resolution using a side-coupled phoswich configuration. Phys. Med. Biol. 2021, 66, 125007. [Google Scholar] [CrossRef]
- Schaart, D.R.; Schramm, G.; Nuyts, J.; Surti, S. Time of Flight in Perspective: Instrumental and Computational Aspects of Time Resolution in Positron Emission Tomography. IEEE Trans. Radiat. Plasma Med. Sci. 2021, 5, 598. [Google Scholar] [CrossRef]
- Maus, J.; Schramm, G.; Hofheinz, F.; Oehme, L.; Lougovski, A.; Petr, J.; Platzek, I.; Beuthien-Baumann, B.; Steinbach, J.; Kotzerke, J.; et al. Evaluation of in vivo quantification accuracy of the Ingenuity-TF PET/MR. Med. Phys. 2015, 42, 5773–5781. [Google Scholar] [CrossRef]


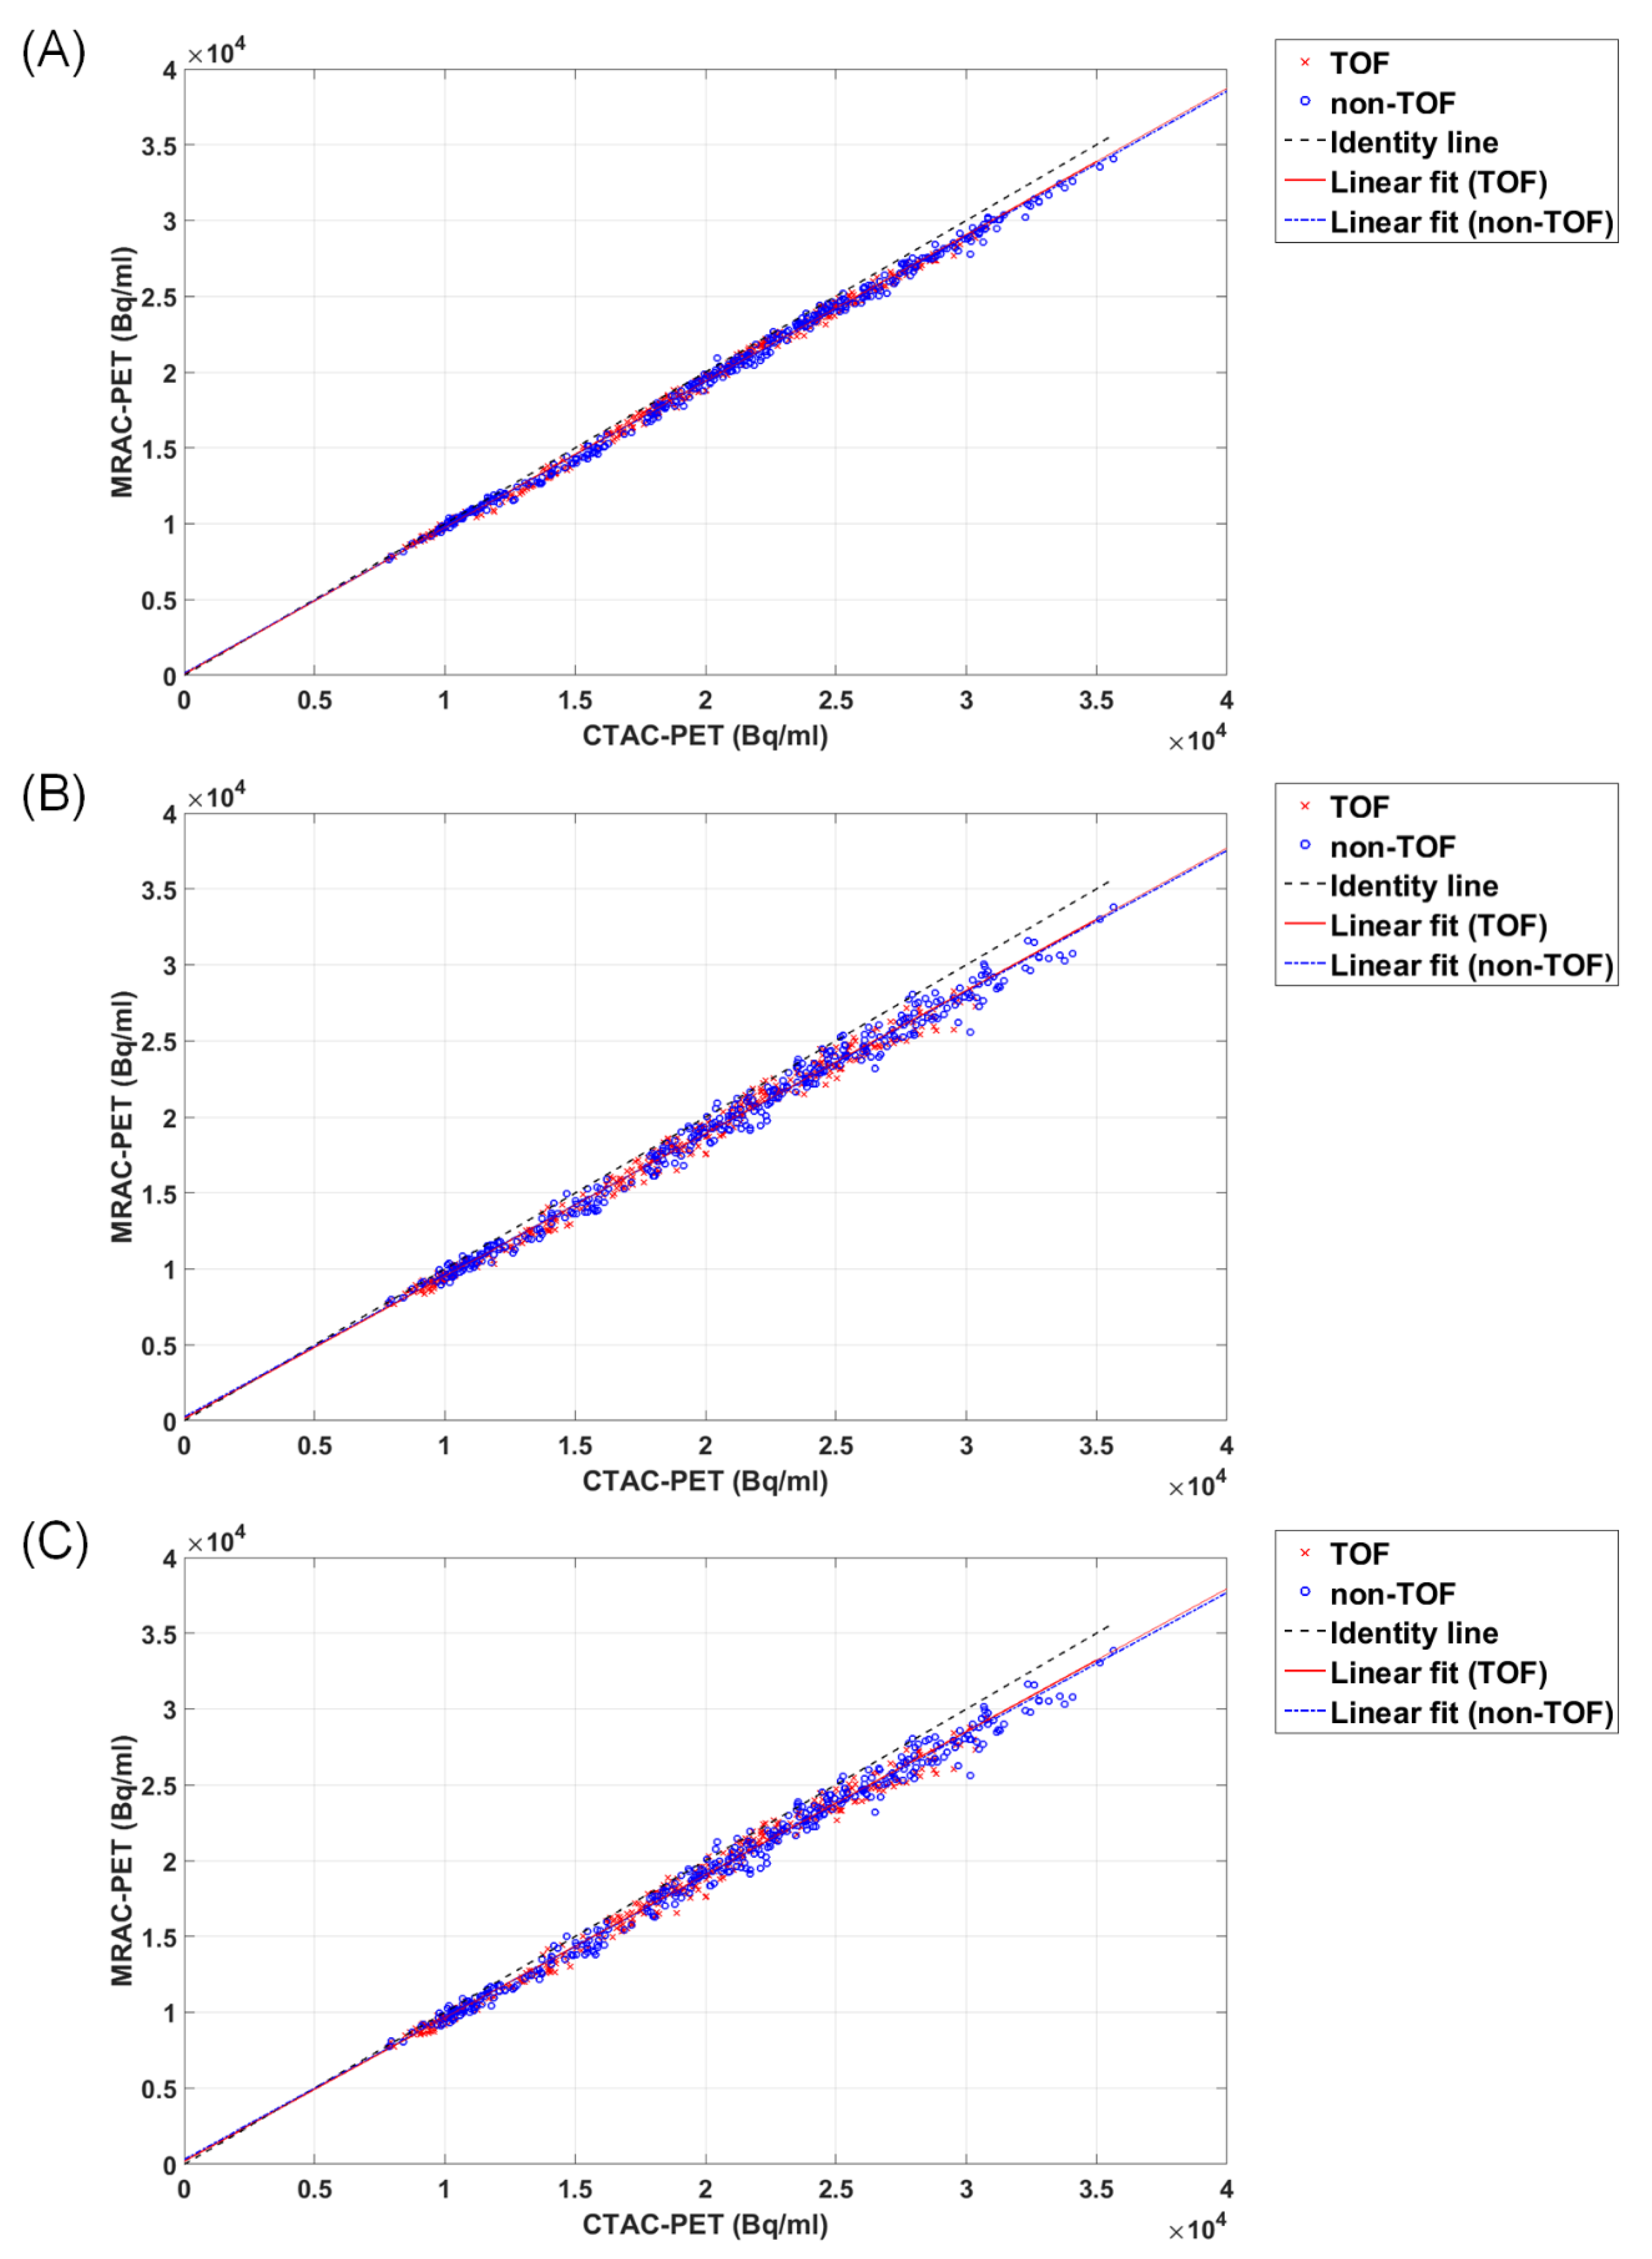
| Method | a | b | a p-Value | bp-Value | a 95% CI | b 95% CI | R2 | R p-Value | R 95% CI | |
|---|---|---|---|---|---|---|---|---|---|---|
| 3-class MRAC | TOF | 0.966 | 89.1 | <0.001 | 0.142 | [0.9595, 0.9717] | [−30.06, 208.32] | 0.996 | <0.001 | [0.9978, 0.9986] |
| non-TOF | 0.960 | 134 | <0.001 | 0.030 | [0.9544, 0.9656] | [12.77, 254.80] | 0.997 | <0.001 | [0.9981, 0.9988] | |
| 2-class MRAC | TOF | 0.938 | 152 | <0.001 | 0.115 | [0.9286, 0.9479] | [−37.25, 341.09] | 0.991 | <0.001 | [0.9942, 0.9962] |
| non-TOF | 0.932 | 256 | <0.001 | 0.022 | [0.9216, 0.9418] | [37.25, 474.32] | 0.990 | <0.001 | [0.9935, 0.9957] | |
| 2-class MRAC (no air cavities) | TOF | 0.943 | 211 | <0.001 | 0.027 | [0.9336, 0.9527] | [23.59, 398.48] | 0.991 | <0.001 | [0.9943, 0.9963] |
| non-TOF | 0.934 | 320 | <0.001 | 0.003 | [0.9241, 0.9439] | [104.95, 534.89] | 0.990 | <0.001 | [0.9938, 0.9959] | |
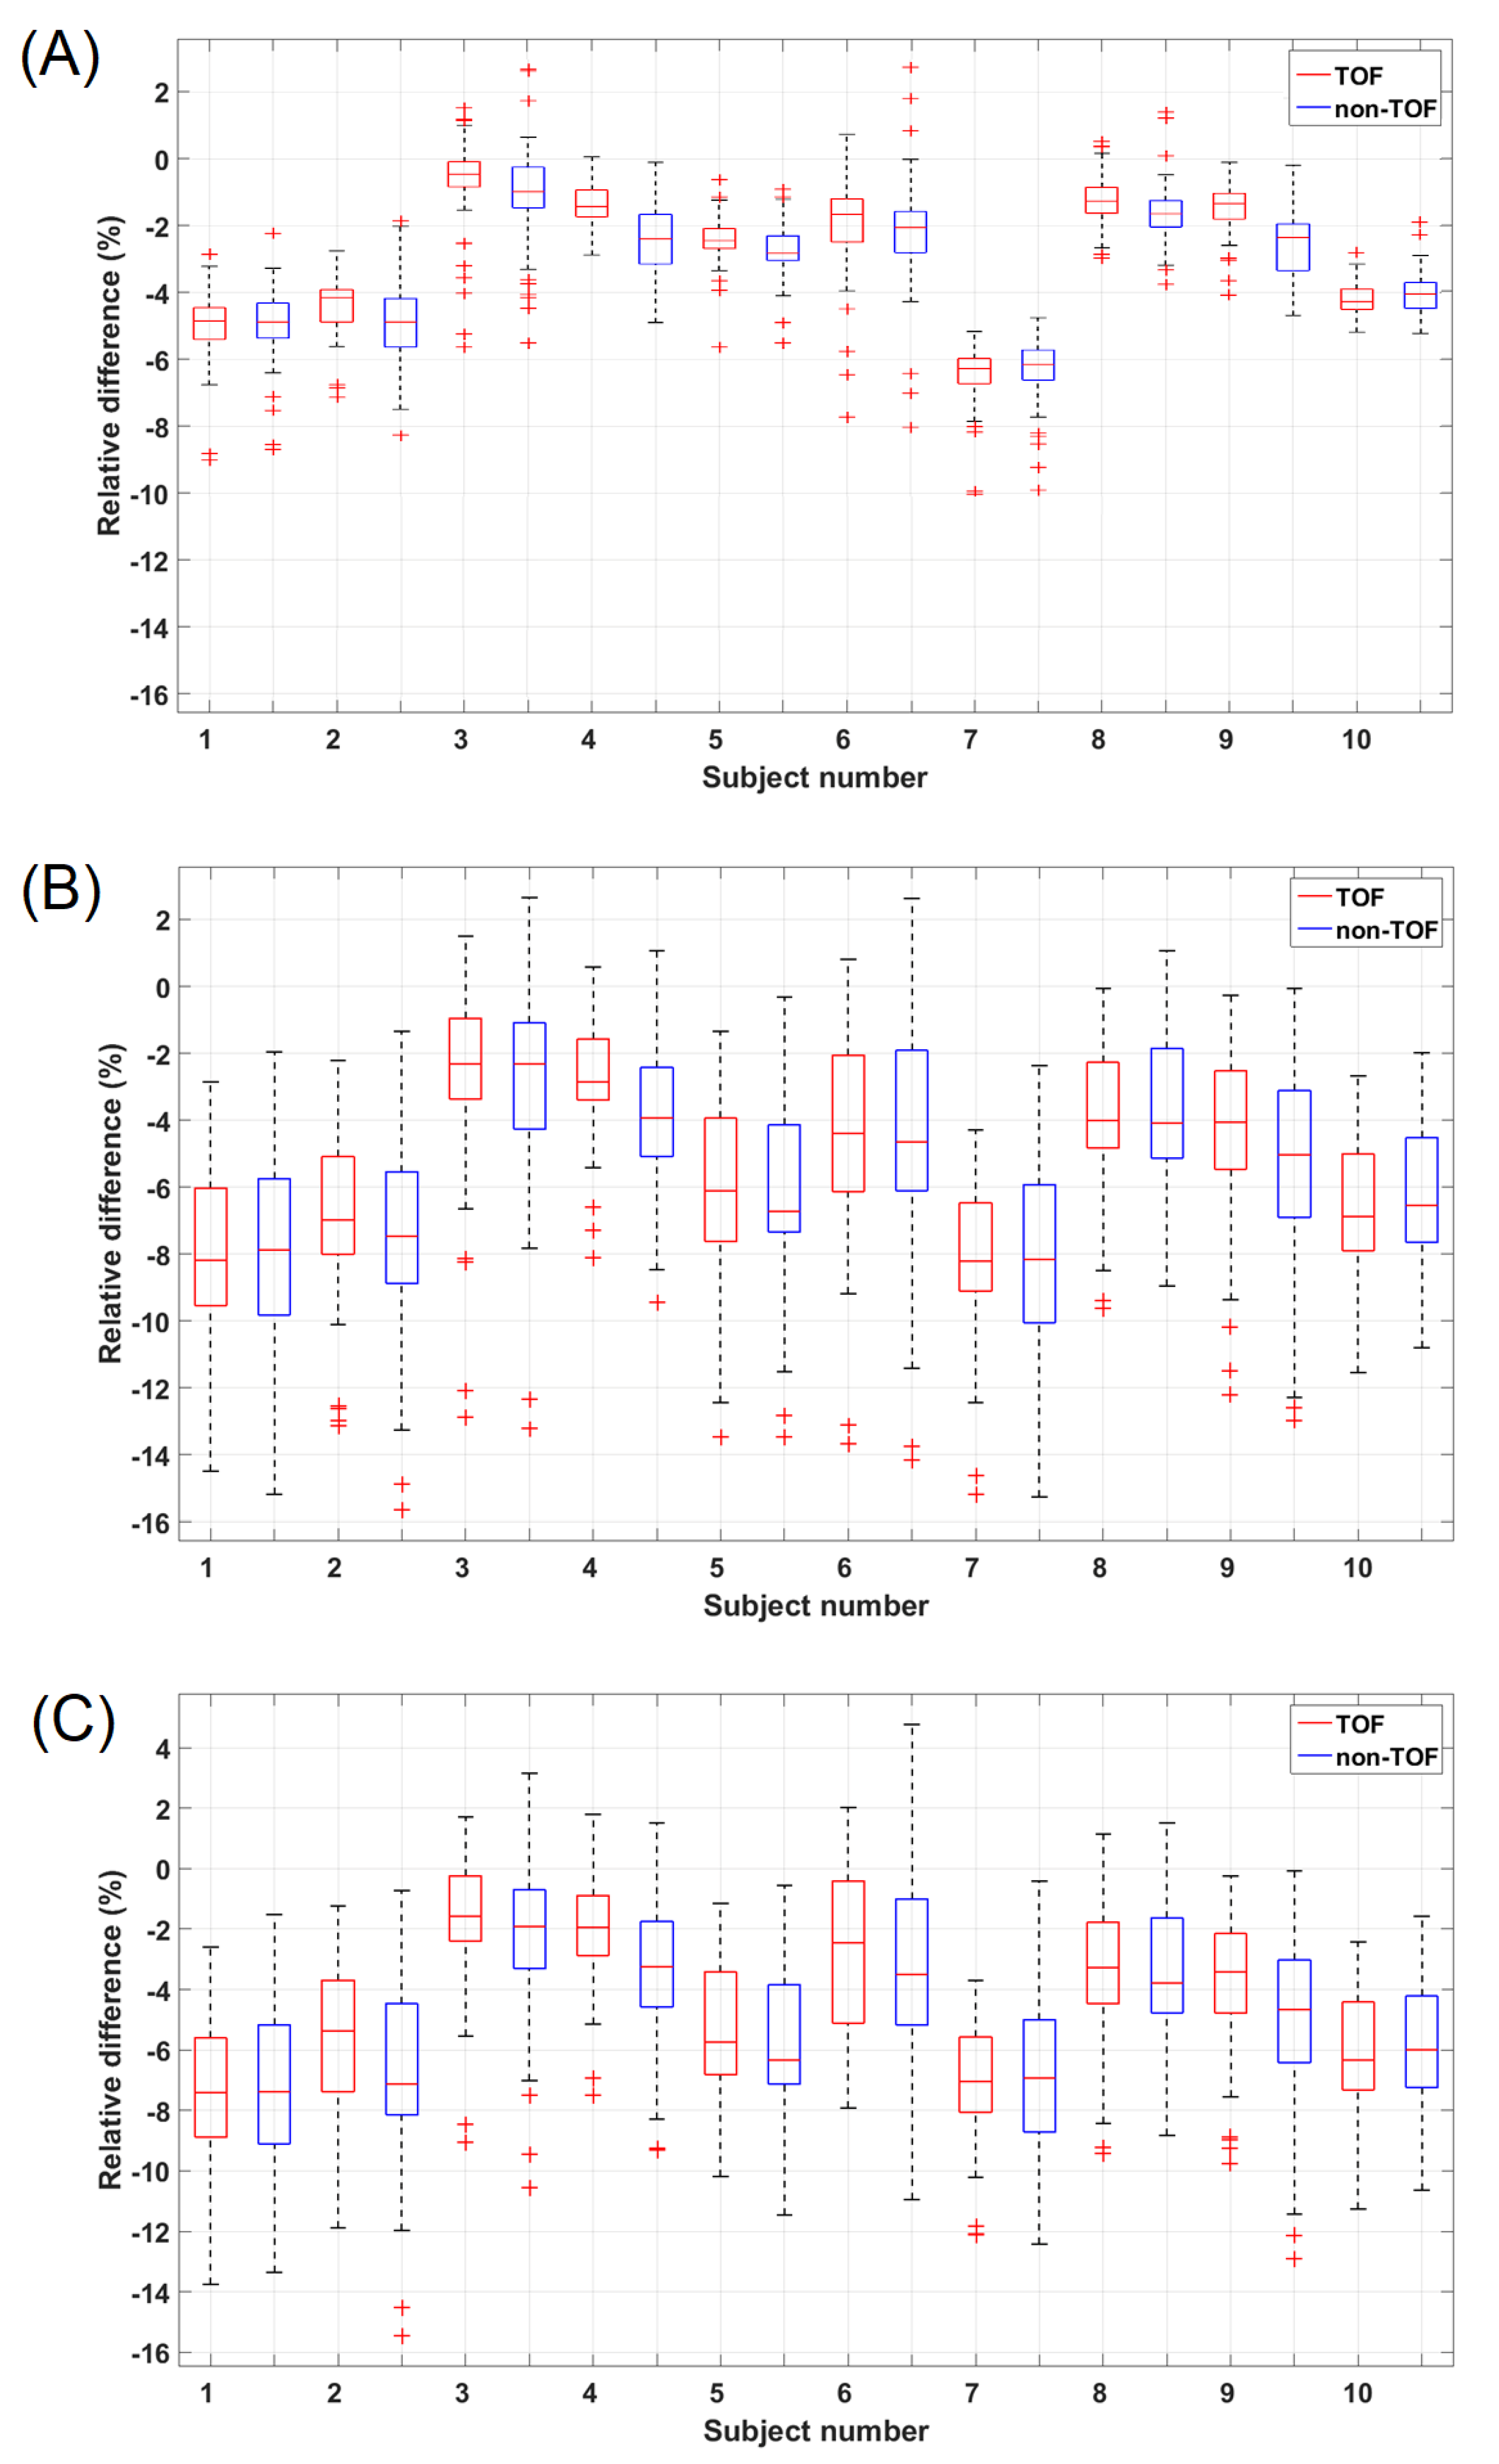
| Method | Median Difference (TOF vs. Non-TOF) | p-Value (Two-Tailed) | Benjamini–Hochberg Significance Threshold |
|---|---|---|---|
| 3-class MRAC | −2.9% vs. −3.3% | <0.001 * | 0.0166 |
| 2-class MRAC | −5.7% vs. −5.9% | 0.224 | 0.0500 |
| 2-class MRAC (no air cavities) | −4.7% vs. −5.4% | 0.018 * | 0.0333 |
Publisher’s Note: MDPI stays neutral with regard to jurisdictional claims in published maps and institutional affiliations. |
© 2022 by the authors. Licensee MDPI, Basel, Switzerland. This article is an open access article distributed under the terms and conditions of the Creative Commons Attribution (CC BY) license (https://creativecommons.org/licenses/by/4.0/).
Share and Cite
Lindén, J.; Teuho, J.; Klén, R.; Teräs, M. Are Quantitative Errors Reduced with Time-of-Flight Reconstruction When Using Imperfect MR-Based Attenuation Maps for 18F-FDG PET/MR Neuroimaging? Appl. Sci. 2022, 12, 4605. https://0-doi-org.brum.beds.ac.uk/10.3390/app12094605
Lindén J, Teuho J, Klén R, Teräs M. Are Quantitative Errors Reduced with Time-of-Flight Reconstruction When Using Imperfect MR-Based Attenuation Maps for 18F-FDG PET/MR Neuroimaging? Applied Sciences. 2022; 12(9):4605. https://0-doi-org.brum.beds.ac.uk/10.3390/app12094605
Chicago/Turabian StyleLindén, Jani, Jarmo Teuho, Riku Klén, and Mika Teräs. 2022. "Are Quantitative Errors Reduced with Time-of-Flight Reconstruction When Using Imperfect MR-Based Attenuation Maps for 18F-FDG PET/MR Neuroimaging?" Applied Sciences 12, no. 9: 4605. https://0-doi-org.brum.beds.ac.uk/10.3390/app12094605