
A Method for Safety Evaluation of Train Braking System Considering Multiple Types of Preventive Maintenance Cycles


Science and Technology on Reliability and Environmental Engineering Laboratory, School of Reliability and Systems Engineering, Beihang University, Beijing 100191, China
*
Author to whom correspondence should be addressed.
Appl. Sci. 2022, 12(9), 4799; https://0-doi-org.brum.beds.ac.uk/10.3390/app12094799
Submission received: 13 April 2022
/
Revised: 29 April 2022
/
Accepted: 6 May 2022
/
Published: 9 May 2022
Abstract
:The train braking system with redundant components has an essential effect on driver safety. In this paper, we consider the failure of K-out-of-N brake motors during operation and the redundant recovery by preventive maintenance. Two Continuous Time Markov Chains (CTMC) are used to model the working process and the preventive maintenance process of the braking system corresponding to the real situation of the train. Considering the maintenance effect of intermittent daily and cyclical overhaul with nested relationships, a new operation risk assessment model of the K-out-of-N system is developed to evaluate the effectiveness of the preventive maintenance of the train. Some safety parameters are solved based on the two coupled preventive maintenance periods, which conveniently design the safety of the train braking system. Finally, a case study illustrates the effectiveness of the safety evaluation method. The results show that we can trade off the effects of the multiple PM intervals on train safety considering the redundancy structure of the braking system by the proposed model.
1. Introduction
By the end of 2020, the total mileage of urban rail transit operations in mainland China reached 7969.7 km. Among them, the mileage of subway operating lines reached 6280.8 km. The amount of passenger traffic in 2020 reached 17.59 billion, which means that more than 24 million people travel by subway every day [1]. Drive safety is one of the inevitable issues with the surge in subway operations.
The braking system is one of the most important subsystems related to the driving safety of the subway, and untimely braking is the biggest safety hazard during subway operation [2,3]. Subway braking activities are divided into general braking and emergency braking [4]. General braking is also known as braking when the subway stops at a station, while emergency braking is braking under abnormal conditions while the subway is in motion. Nowadays, the primary source of braking force for general braking and emergency braking is the electric braking system [5]. The electric brakes are activated after the train control system issues a braking command, then the subway vehicle is ensured to be slowed down immediately. The electric brake system braking force is provided by the torque generated by the brake motor and the corresponding mechanical mechanism, the braking output can be adjusted, and the emergency braking conditions will require the brake system to provide the maximum output. The integrity of the emergency brake function affects the safety of the train, while the general brake does not. The braking activity explored in this paper refers exclusively to emergency braking.
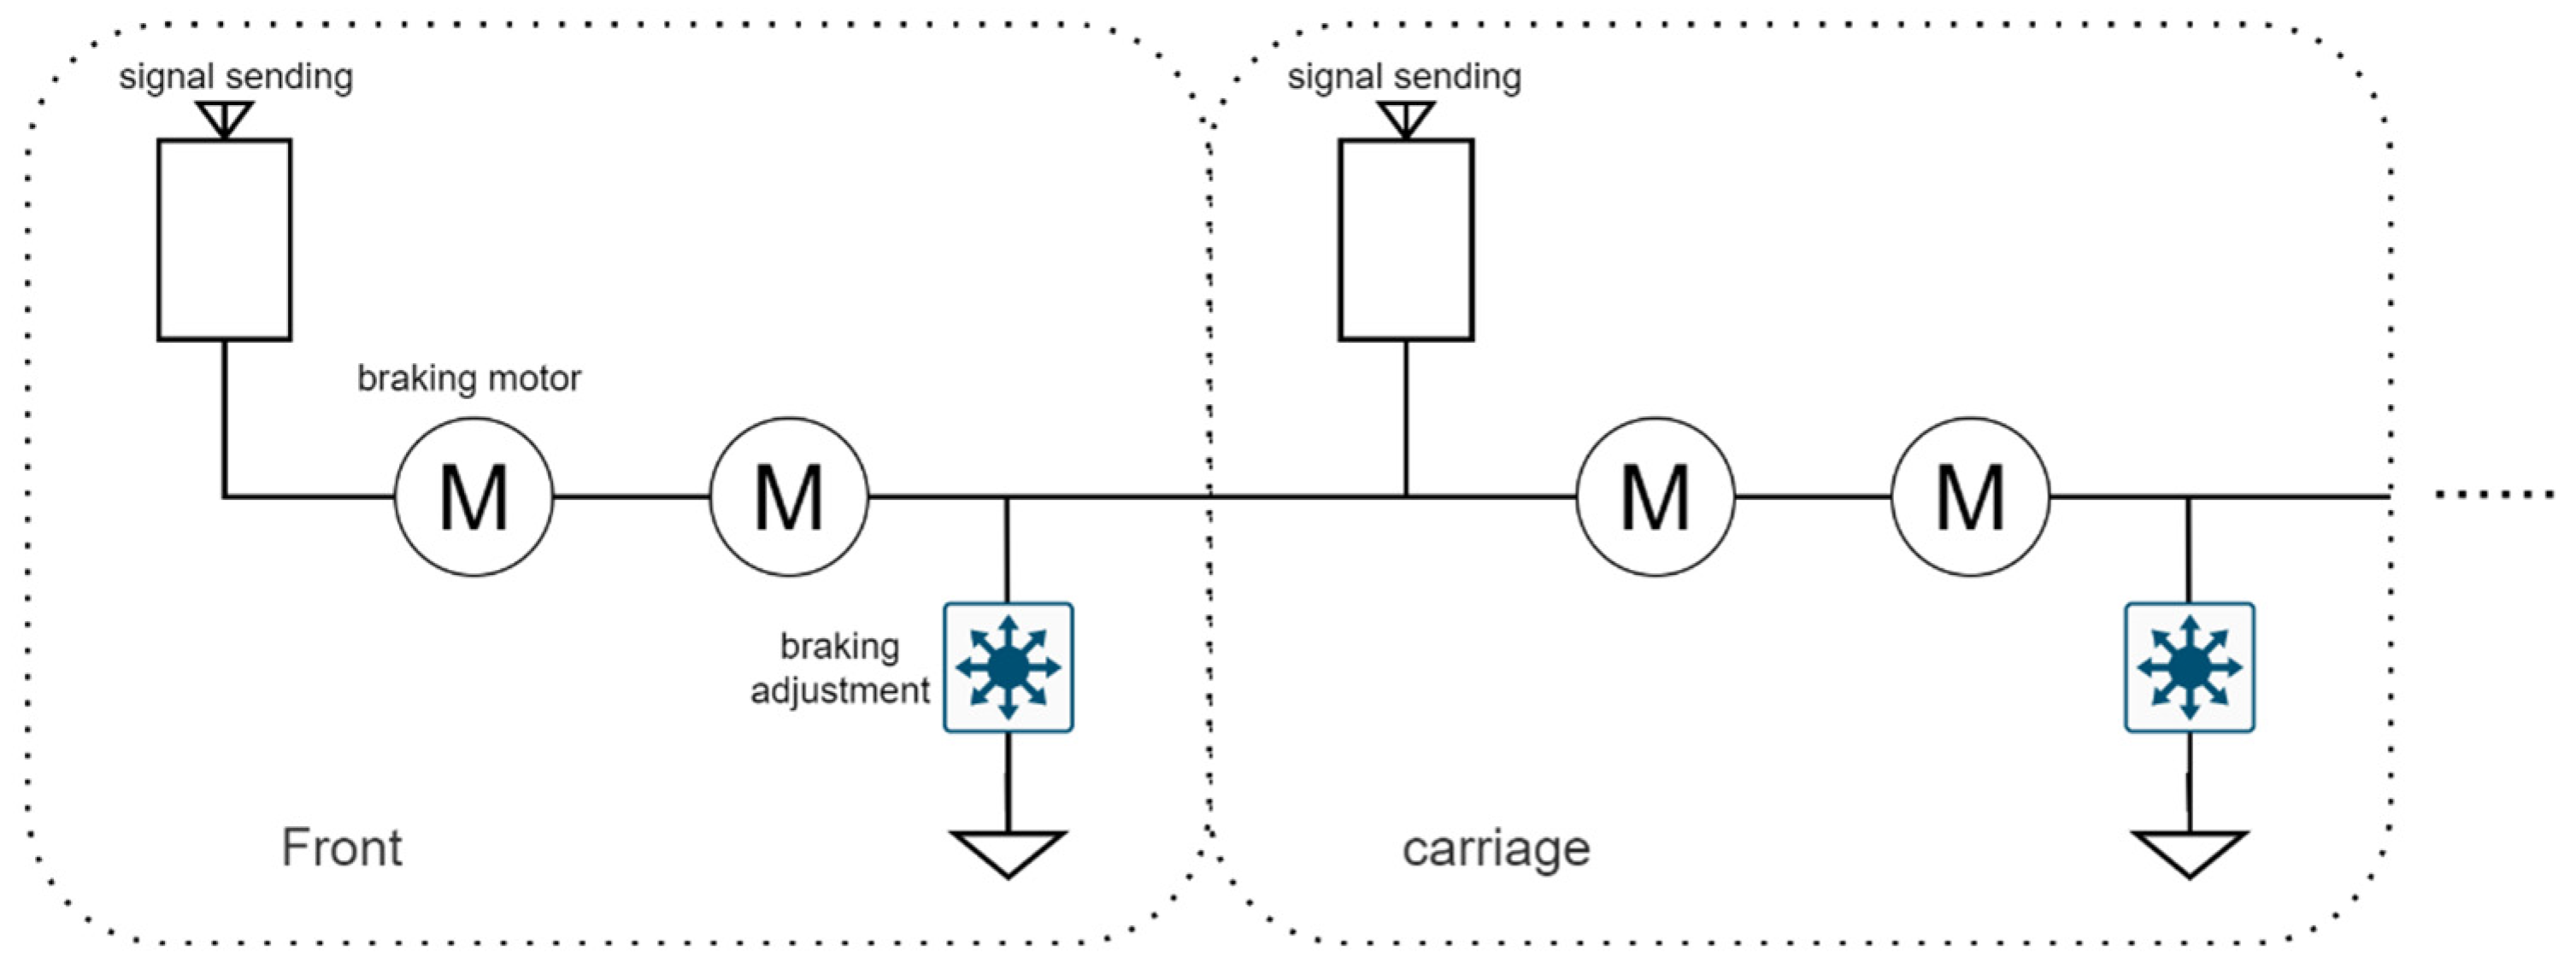
The brake motor as a part of the components forms the braking system and governs the key functions of the braking system [5]. Brake motors are generally installed in the bottom of multiple carriages in a distributed manner, with multiple motors working together to provide the braking force needed to brake, as is shown in Figure 1. If one or more of the motors fail to work, the maximum braking force provided by the braking system will be reduced. If the maximum braking force drops to a certain level, the emergency braking distance of the train will not meet a safety threshold, which is called the safe braking distance. Therefore, to meet this safe braking distance requirement, a sufficient number of brake motors are required to work properly. Additionally, the greater the residual redundance before the system fails, the more effective the brakes will be. Such a braking system is a typical K-out-of-N system. The K-out-of-N system is a common type of redundant system where the failure of components leads to system degradation, wherein the system as a whole fails when K components fail. To keep the train brakes at a safe distance during operation, the brake system needs maintenance to repair the failed motors.
The maintenance of the train system generally includes daily maintenance and overhaul. Daily maintenance is small-scale maintenance, mainly following the list of key components to inspect and simple repair, while overhaul is a complete inspection and replacement of the system. Different maintenance strategies can recover the degenerated braking distance to different extents. Thus, the system can operate properly while meeting safety conditions. Under the combination of routine maintenance and overhaul strategy, the better the effect of minor repair, the better the overhaul cycle can be properly extended, and vice versa. The coordination of routine maintenance and overhaul cycles is a solution to the balance between operational input and operational safety. Therefore, considering this mixed maintenance characteristic of train braking systems to ensure safety results in more economical operation for the subway corporations. It is necessary to develop an analytical model of the K-out-of-N system comprehensively including both cycles to address the balance between operation and safety, which is completely a new issue.
For train braking system performance, existing models have been studied based on physical models [6,7]. Building aerodynamic models is a common approach for the air braking system [8,9,10]. For electric braking systems, the corresponding physical model of the electromagnetic process of the brake motor can also be developed to obtain the braking curve [11,12]. Considering the effect of component failure on the braking system, there are also methods to model the vibration response or degraded wear [13,14,15]. These physical models do not consider the redundant structure of the braking system. Instead, systems with redundant structures can be seen as multi-state systems for modeling.
Multi-state systems usually describe the state of the system in terms of a composite of the states of the components [16,17]. The states of each component are considered as elements to describe multiple states of the system from normal operation to failure in the form of vectors or matrices. In other words, in a multi-state system, different states can be used to describe different failure combinations or different performance levels of the system [18,19]. As a typical K-out-of-N system, the braking system has the characteristic of being 0–1 state at the component level, but multi-state at the system level [20,21,22,23]. For a K-out-of-N system, the failure of a component does not represent the state of the system, it will only be a degradation of the system [24,25]. The failure of the system is a combination of the failures of the components when the number of the failure components reaches a threshold.
Continuous-time Markov chains are also widely used in multi-state system modeling [26,27,28]. In Markov chains, the failure process of a system is continuous or discrete in multiple steps. When a Markov chain has been determined, the different performances can be analyzed [29,30,31]. The analysis of the performance may be based on steady-state probabilities, transient probabilities, or cumulative probabilities [32]. The performance evaluation of the whole multi-state system is obtained with the help of different performance functions coupled with the state probabilities. Multi-state systems can be used to conveniently represent the repair effect of perfect or imperfect repairs of the braking system with multiple states [33,34]. With the effects of failures and preventive maintenance, Markov chains enable parametric representation of faults and maintenance processes by employing the corresponding stochastic distribution.
The general Markov chain cannot be used to establish state transfer relationships for the braking system with multi-cycle nested maintenance. Markov chains in a single phase cannot describe a model with multi-cycle nested maintenance. Phased Markov chains are commonly used to describe systems with multi-mission characteristics [35,36,37]. The multi-cycle nested maintenance of the brake system and the failure process can also be seen as different missions of the system in different periods. The system state is sensitive to different failure or maintenance parameters under different periods. Therefore, different phases can correspond to different distribution parameters. Additionally, the phased Markov chain can study these distribution parameters of different phases and the transfer relationships between states in the same functional relationship equation so that the influence of each of these parameters on the system state can be determined throughout time.
It can be seen that the current reliability models of braking systems ignore the effect of redundancy. Multi-state system models can model the redundant system by describing the failure and maintenance of the component state transition in which state transfer relations and the deterioration of the physical performance are coupled. In addition, there is no corresponding model to study the multi-cycle nested maintenance strategy that is unique to the considered braking system. Our research is centered on the K-out-of-N system modeling and analysis of this operation and maintenance model to evaluate its safety. Considering the operation and maintenance characteristics of train braking systems, their operation and maintenance processes are divided into different periods. Several phased Markov processes are used to model the operation and maintenance processes of the braking system installed in the train. The different phased Markov models can be applied to the description of phased events, which can be processed for events with different distributions in different phases. The purpose of this paper is to develop a model that can evaluate the operational safety and performance parameters of the K-out-of-N train braking system comprehensively considering the train system operational cycle and daily inspections.
The contribution of this paper contains three main aspects. (1) Considering the redundant loss of K-out-of-N brake motors during operation and the recovery of redundancy during routine maintenance, two Continuous Time Markov Chains (CTMC) are used to model the working process and the routine preventive maintenance process of the braking system corresponding to the real situation of the train. (2) Considering the maintenance effect of intermittent daily maintenance and cyclical overhaul with nested relationships, a new operation risk assessment model of the K-out-of-N system is developed to evaluate the effectiveness of the preventive maintenance of the braking system. (3) Some safety parameters are solved based on the two coupled preventive maintenance information, which conveniently designs the safety of the braking system of the train.
The rest of this paper is organized as follows. Section 2 will elaborate on the Markov state transfer model of the K-out-of-N system under such alternating work and daily maintenance cycles. Section 3 will further consider the maintenance effects of daily maintenance and cyclical overhaul with nested relationships, and a new maintenance model for the K-out-of-N system is developed. Section 4 will derive the physical properties model by combining the established Markov model with the physical discipline equations. Section 5 will use the braking system of a subway train as a case study to build a safety assessment model. Additionally, the model is verified to be correct by simulation with the Monte Carlo method. Section 6 will perform the analysis and conclusions.
2. Problem Description
System Description
The metro train braking system in this paper is modeled on its brake motors. Within the braking system, the total number of brake motors is n and the brake motors are all intact at the beginning. All brake motors have the same failure rate. The braking system needs to satisfy the condition of safe braking distance, that is, to ensure that k brake motors can work properly. Such a system is a typical K-out-of-N: G system.
For the metro train braking system, it is given that its work and preventive daily maintenance are intermittent and alternating in cycles of days. The operation hours of the train in a day are fixed , and daily maintenance cannot be performed during operation, so the redundant degree of the brake motors will only gradually decrease due to failure. The non-working hours of the train are considered daily maintenance time . During the daily maintenance period, the brake motors are stopped or on standby for inspection and no failure occurs, so the redundancy of the brake motors will rise with the maintenance.
In addition to the daily maintenance, the system schedules overhauls. The overhaul interval is T, and T must be an integer multiple of . After the overhaul, the system will be restored to a defined state between state n and state k + 1.
While a brake motor in the train braking system fails, the system is still available if the remaining redundancy of the brake motors is not completely lost, i.e., if there is still a remaining available redundancy. If the failed brake motors are not fully repaired, the system is in an incomplete state of operation. Thus, the train braking system contains n − k + 1 states. The state of this braking system at a time t is described by the number of intact brake motors n(t) at that moment.
The K-out-of-N system can operate when k of the n components in the system are working properly. All of the components are intact in the starting phase.
Thus, the following assumptions are made in this paper:
- The failure time of each brake motor follows an exponential distribution, which is a common assumption in K-out-of-N systems. All component failures are independent.
- All brake motors of the system are in operating condition at the outset. Additionally, when a component fails, it will immediately lose its ability to work.
- The work and maintenance of the system are carried out at intervals and alternates on a fixed cycle. This is in consideration of the characteristics of the maintenance schedule possessed by such equipment as trains.
- During system operation, inspection and maintenance activities for motor failures cannot be performed. Inspection and repair of motor failures can be performed only during maintenance time. The maintenance time of the brake motors also follows an exponential distribution and is independent.
- It is assumed that the system has sufficiently high safety requirements in the design phase to guarantee that the system will not experience system failures during operation. It means that the braking system will not fail during operation.
- During the overhaul, the components are not repaired one by one. Therefore, the overhaul time and the probability of change in the system’s state during the overhaul are not considered. Only the system’s repair effect after the overhaul will be considered.
After finding the braking system state probability, we then collect the train operation data to calculate the train braking distance, coupling the braking system state probability and train braking distance to obtain the braking distance with the brake motor state change relationship and braking distance expectation.
3. The CTMC of the Braking System
3.1. System States Transition Process with Daily Maintenance
The failing and daily maintenance processes of the braking system can be described by a multi-stage Markov chain. The system working time is and the inspection and maintenance time is , then the life cycle of the system can be divided into intervals such as , , [], etc. Each stage is similar to the finite pure death process (the maintenance stage can be considered as a reverse pure death process).
Such processes can be described in terms of absorbing Markov chains. For absorbing Markov chains, the state probability will be in an absorbing state after some steps, regardless of which state they start from. In the model of this paper, both the failing process and the daily maintenance process can be described separately by absorbing Markov chains. The two Markov chains are interrelated, and the initial states of the latter stage are dependent on the final state of the former stage.
The braking system starts with n brake motors normally intact, and the system is in a state in which only k brake motors are working properly before failing. Thus, the starting state of the Markov chain is the intact state , and the ending state is the pre-fault state . It is assumed that the system has a component failure rate of λ during the operating phase and a component repair rate of μ during the preventive inspection and maintenance phase. Both the failing process and the daily maintenance process follow an exponential distribution for t.
For such a K-out-of-N: G system, the total number of states can be expressed as , which includes n − k + 1 operating states and one shutdown state. Therefore, the system state probability can be expressed as . The initial state probability of the system can be expressed as follows:
As the braking system is in state i, there are n − i + 1 brake motors operating normally. When one of the brake motors fails, the number of motors in normal operation is left at n − i, and the system will transfer to state i + 1. This transfer process happens one by one. Thus, when the system is in the working phase, its state transfer rate is:
Therefore, the Markov state transfer rate of the working phase can be expressed as:
When one of the motors is repaired, the system will transfer from state i to state i − 1. As with the failure process, the transfer process happens one by one. Thus, when the system is under daily maintenance, the state transfer process is:
Therefore, the daily maintenance phase Markov state transfer matrix can be expressed as:
When the system is in daily maintenance, the instantaneous state probabilities of the system at different moments can be expressed as which is obtained from the above state transfer matrix. The state probability of each phase depends on the state transfer matrix of that phase, and the state probability at the beginning of each phase is the state probability at the end of the previous phase. Therefore, when , the system state probability can be expressed as:
When , the system enters the daily maintenance phase, and the start state of this phase is the end state of the previous working phase. At this time phase, the system state probability depends on the repair matrix M. According to the multi-stage Markov calculation method, the result can be directly obtained as follows:
When , , the system enters the next work phase, as the inspection and maintenance activities stop. The system state probability depends on the working matrix C, which is obtained in the same way as follows:
Additionally, as time t passes, the system state probabilities can be derived as the above equation in turn, and finally, we find:
3.2. System States Transition Process with the Overhaul
The state to which the system will be restored after the overhaul depends on the degree of maintenance. Depending on the degree of maintenance, these overhaul strategies can be generally classified as perfect repair, minimal repair, and imperfect repair. Perfect repair restores the system to its original state, but the cost of repair is high. Minimal repair ensures that the system is restored to minimum operating conditions, but the frequency of maintenance increases accordingly. Imperfect repair is somewhere in between.
After perfect repair, the system will be restored to its original state. For the K-out-of-N repairable system, the state probability is determined at this point:
For imperfect repairs, the state to which the system is restored is dependent on the extent of the repair. For K-out-of-N systems, such a state probability can be determined as well. The overhaul interval is generally fixed, and the overhaul interval is viewed as a cycle. This cycle T contains p operation and maintenance cycles as . Assuming that each overhaul is repaired to , the state probability at the end of each overhaul can be expressed in terms of . The state probability of the system can be expressed as:
so that the state probability in the overhaul interval can be expressed as:
In general, the smaller the overhaul cycle T, the higher the safety level of the system can be maintained, but the number of overhauls will be higher, as the cost will be correspondingly higher. The larger the overhaul cycle, the fewer overhauls will be performed, but the system will be maintained at a lower safety level. At the same time, the higher the degree of overhaul repair, the higher the safety level of the system will be maintained. Additionally, when the system is given the required safety indicator premise, the overhaul repair level and the overhaul cycle will be related.
4. Evaluation of Safety Indicators
The braking distance of the train braking system can be regarded as the safety indicator of the train. Our goal is to couple the braking distance with the failing state and the information on preventive maintenance of the braking system and to give the corresponding mathematical expressions. The train braking distance consists of the train braking lag distance and the effective braking distance .
The braking lag distance depends on the train braking lag time and the initial braking speed , and the train travels at a uniform speed during the lag braking process.
is the initial velocity before braking and is the final velocity after braking. The effective braking distance of the train is the deceleration distance after the brake is activated, which is given by the following formula [38]:
In the model of this paper, it can be assumed that the subway travels at a horizontal height with a constant maximum operating speed , which means that the slope is 0. Therefore, the equation can be abbreviated as:
The operational risk of the train braking system is related to the braking distance. When the braking distance of the train exceeds the given safe braking distance, the braking system can be considered as having a safety risk at this point. The braking force of electric braking equipment is provided by multiple motors, and the multiple motors can be viewed as a K-out-of-N system. Each motor provides the same braking output . If the system has motors working properly in the current state, the total braking force is related to the output of a single motor and the number of brake motors in some function.
In this paper, it is assumed that they satisfy a linear relationship, then the braking distance of the system at time t is:
Then, if the safe braking distance is to be met, the minimum number of motors that are able to work properly is:
Then, the safety index of the K-out-of-N system at time t can be expressed as:
In the previous section, we have obtained the state probability coupled with fault information and two kinds of preventive maintenance information, where is obtained from Equations (9) and (12). Then, the mean train braking distance will be able to be expressed as follows:
The braking distance in each state can be expressed:
Therefore, the braking distance under a certain moment is related to the braking system state probability. Additionally, the state probability of the braking system is related to the failure rate and repair rate of the motor. The average value of the braking distance during the overhaul interval is expressed as follows:
5. Case of Establishing an Operational Risk Assessment Model
5.1. Input Parameters of the Case
In this section, we consider a case of a train consisting of six vehicles including three locomotives and three traction vehicles [39]. As this electric braking system requires two motors to operate properly, the motor part of this metro brake system can be seen as a 2-out-of-6 redundant system. At the initial moment, all motors of the system are working properly. During the operation of the metro, the motors may fail, which can lead to degradation in the braking system of the metro. During non-working periods, the subway is subject to daily maintenance. No new motor failure occurs during maintenance. In addition, the braking system will be scheduled for an overhaul to restore its function of the braking system. The train cannot work during the overhaul period and the overhaul time is not counted as part of this calendar time. The overhaul behavior occurs periodically.
The maximum operating speed of the train is 80 km/h. The empty weight of the train is 220 t. However, considering the different operating conditions of the subway, the load at the full seat is 240.496 t, the full load is 333.46 t, and the overload during the peak hours of the subway is 370.06 t. The electric brake is provided by the brake motor on the locomotive, and the braking force depends on the number of brake motors, the magnitude of the current through the motors, and the train speed. The motors provide the maximum braking force under emergency braking conditions with constant current magnitude and without variation with the train speed. The emergency brake has a braking lag time of 5 s, and the train’s electric braking force reaches its maximum after 5 s, disregarding the deceleration effect and running distance provided by the motor during the gradual increase in the braking force to the maximum.
The other parameters of the case are also shown in the following Table 1:
The basic resistance function is given with the following formula:
In addition, the case calculation environment of this paper is as Table 2:
5.2. Simulation Verification
The simulation method is used to verify the numerical results given by the model proposed in this paper. The simulation environment is the same as the calculation environment above.
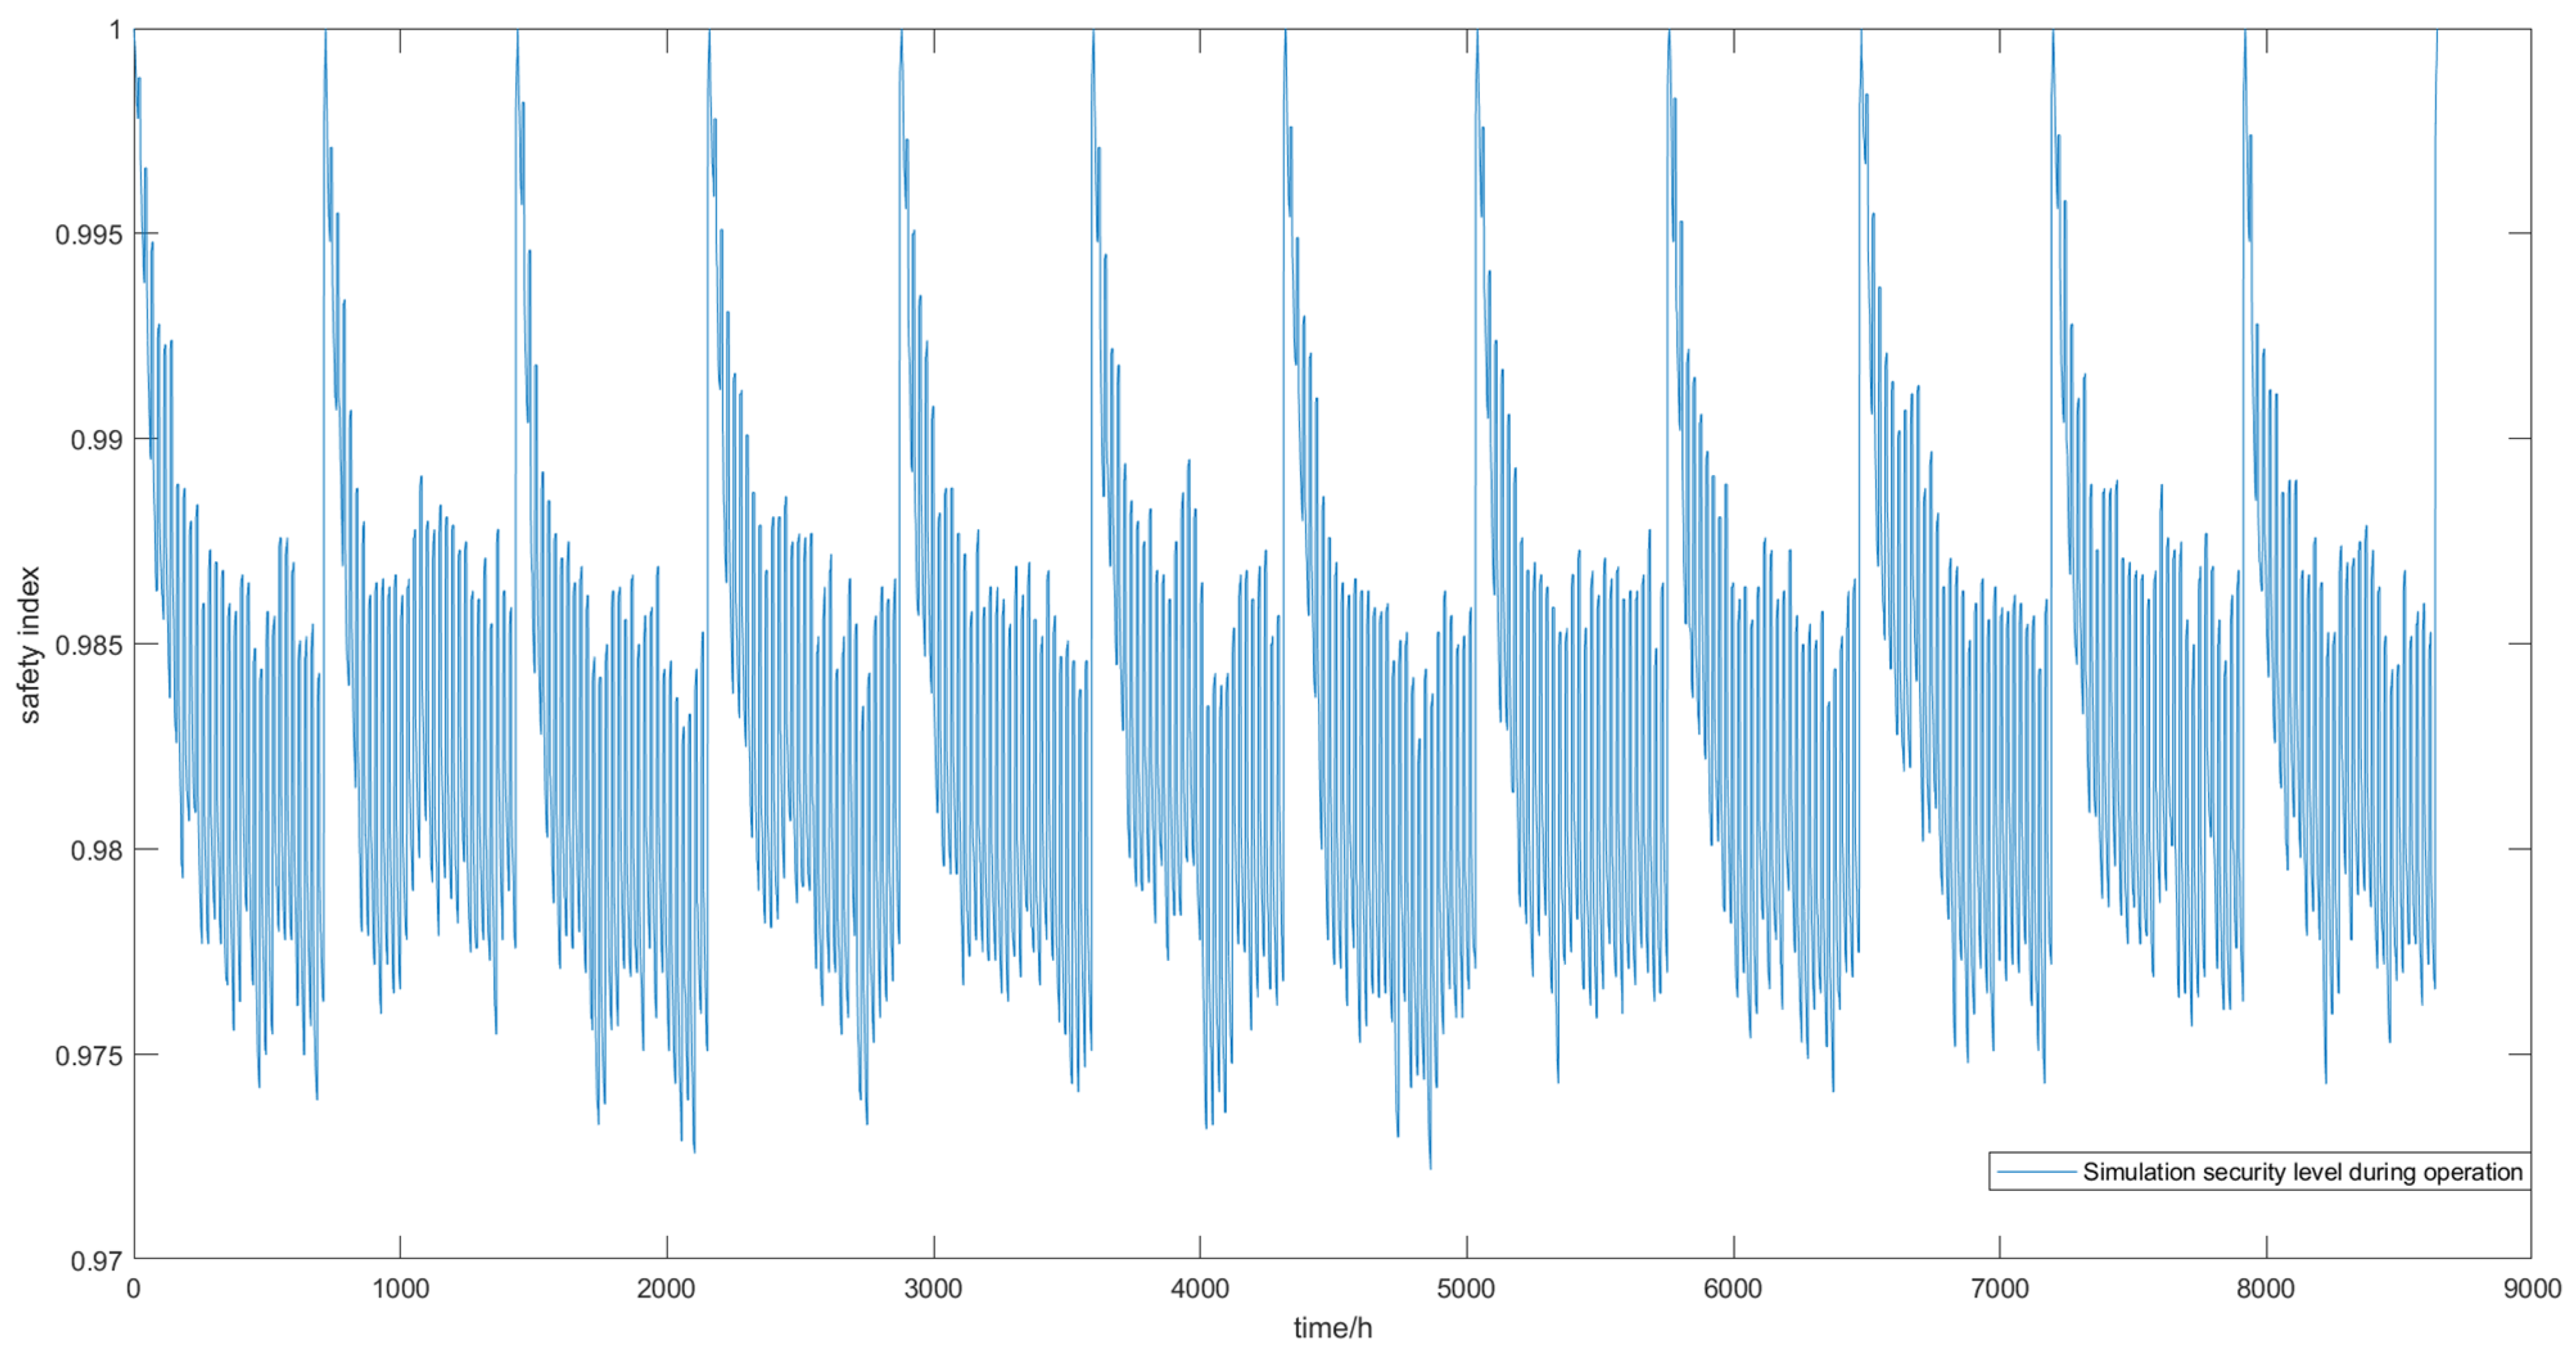
In simulation conditions, the safe braking distance of the train is ds = 400 m, while the motor failure rate under the electric brake system is fixed at λ = 0.003, and the maintenance rate is fixed at μ = 0.03. The overhaul interval is fixed at T = 720 h, and the overhaul level is fixed at repairing until at least five motors can work properly (if the motors that can work properly are more than or equal to five then no repair is needed). The simulation results are shown below.
In Figure 2, after 10,000 simulations, the mean value of the safety index is 0.983. The variance is . As a comparison, the mean value of the safety index obtained after inputting the parameters in Table 1 into the analytic model is 0.966, with an error of 1.24%. The simulation time is 70.996441 s. In contrast, the numerical calculation time only takes 3.823471 s, much less than the simulation time.
5.3. Brake System Performance under a Single Overhaul Interval
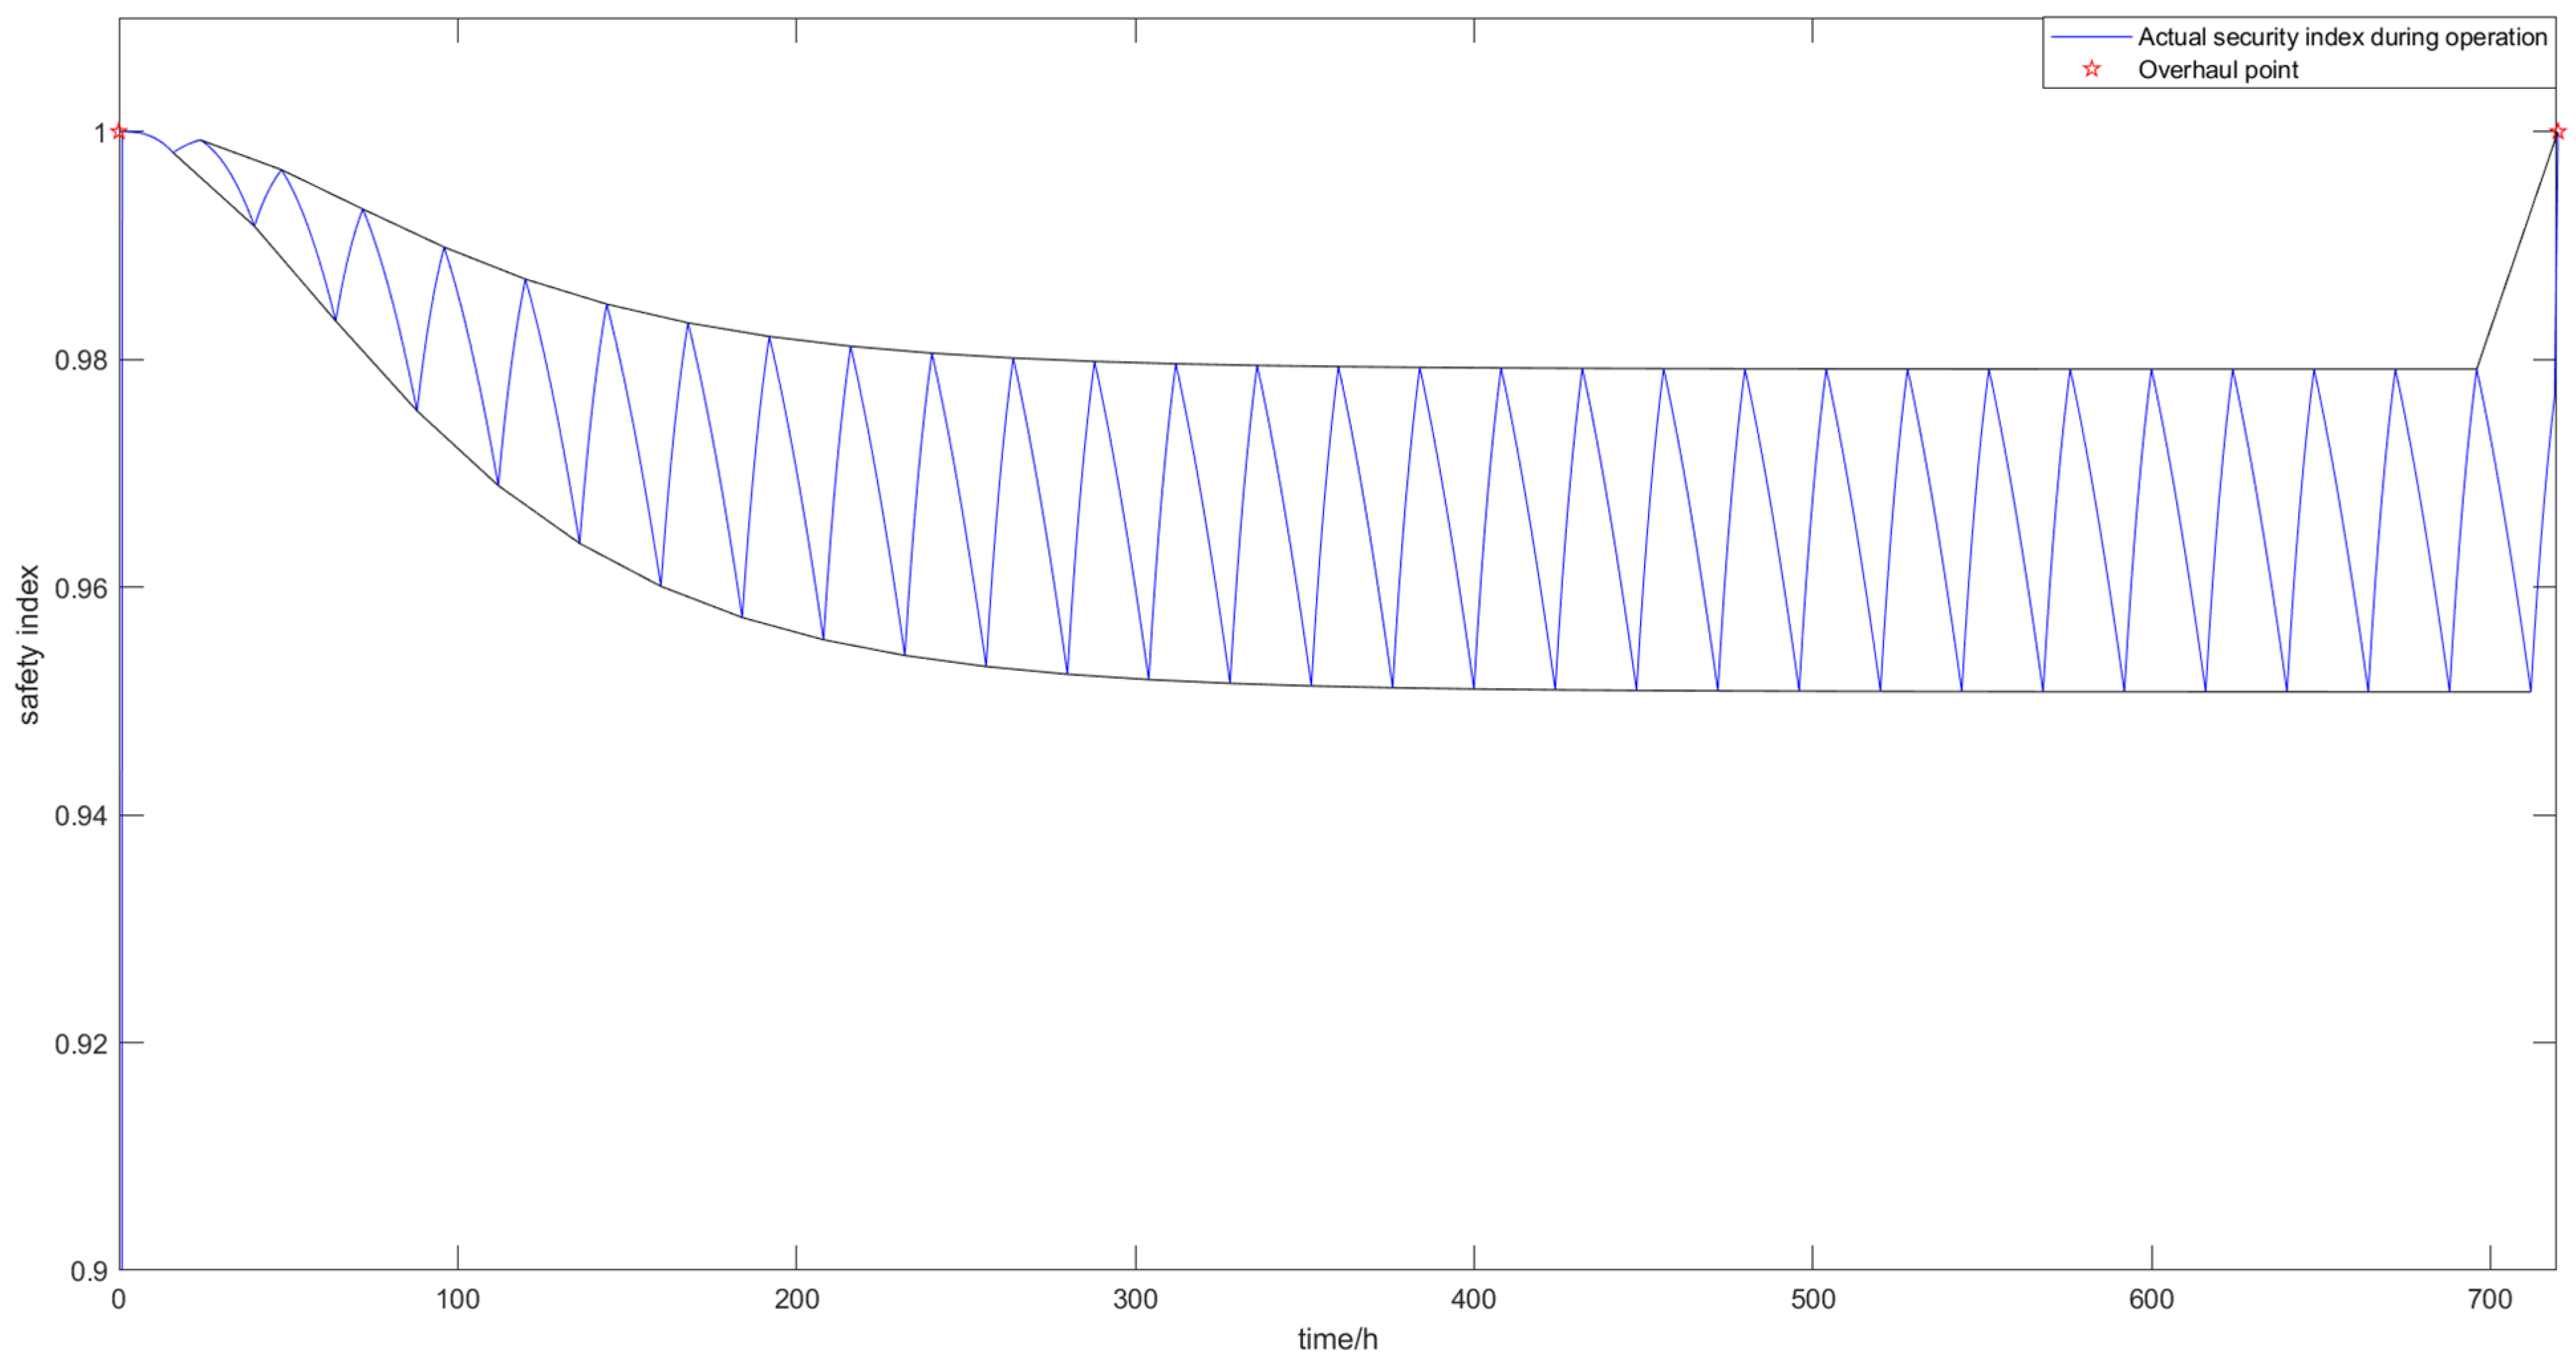
We calculated the variation of the train braking safety index over time for a single overhaul interval. The input parameters are shown in Table 1. In Figure 3, we can see the safety index decreases over time during operation, while it gradually increases during maintenance time. The upper bound of the curve over time is the safety index at the beginning of every day, that is, the safety index at the initial state and the state after each daily maintenance. Accordingly, the lower boundary of the curve is the safety index at the end of every day’s work before daily maintenance has begun.
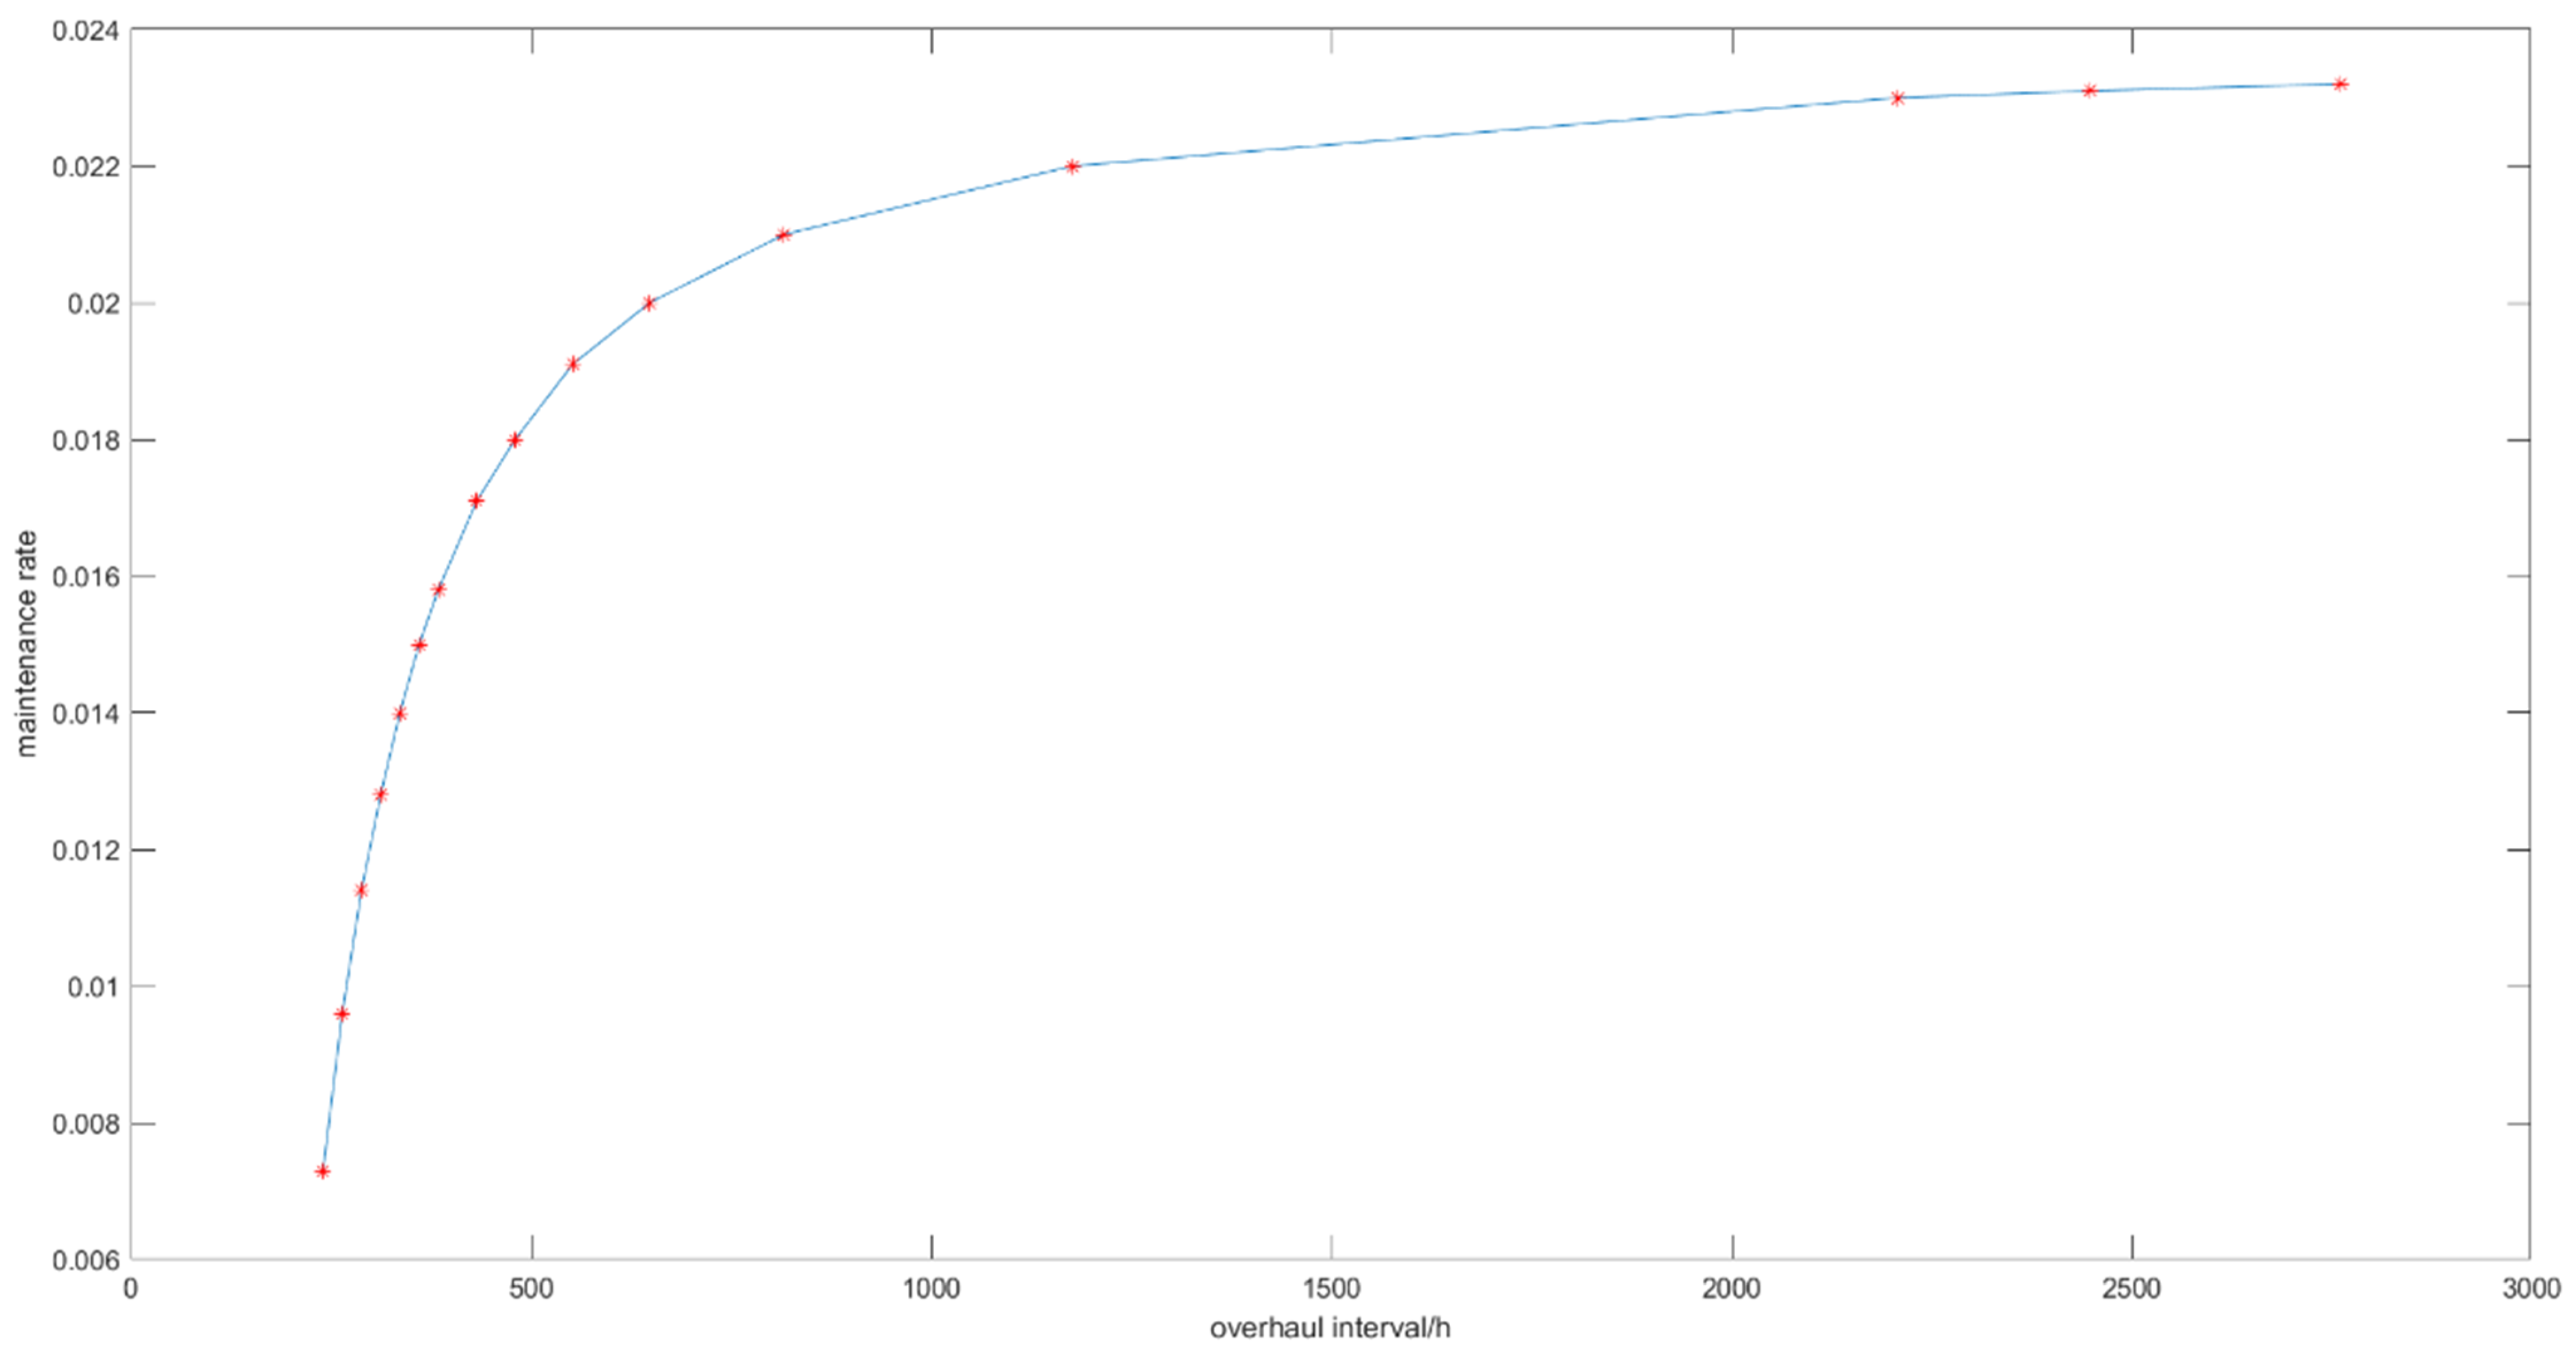
To compare the impact of daily maintenance and overhaul, different daily maintenance rates and overhaul interval values with the same average safety index at a single cycle are put under one curve for comparison. The input parameters are the same as in Table 1 except for the daily maintenance rate and overhaul interval. In Figure 4, we can find that as the routine maintenance repair rate increases, the minimum overhaul interval of the required maintenance strategy becomes longer and longer while meeting the safety level requirements. Similarly, the longer the overhaul interval is scheduled, the higher the required routine maintenance rate will be, but eventually, it will gradually stabilize. This is because as the condition stabilizes, the safety level of the brake system will also stabilize during the overhaul interval.
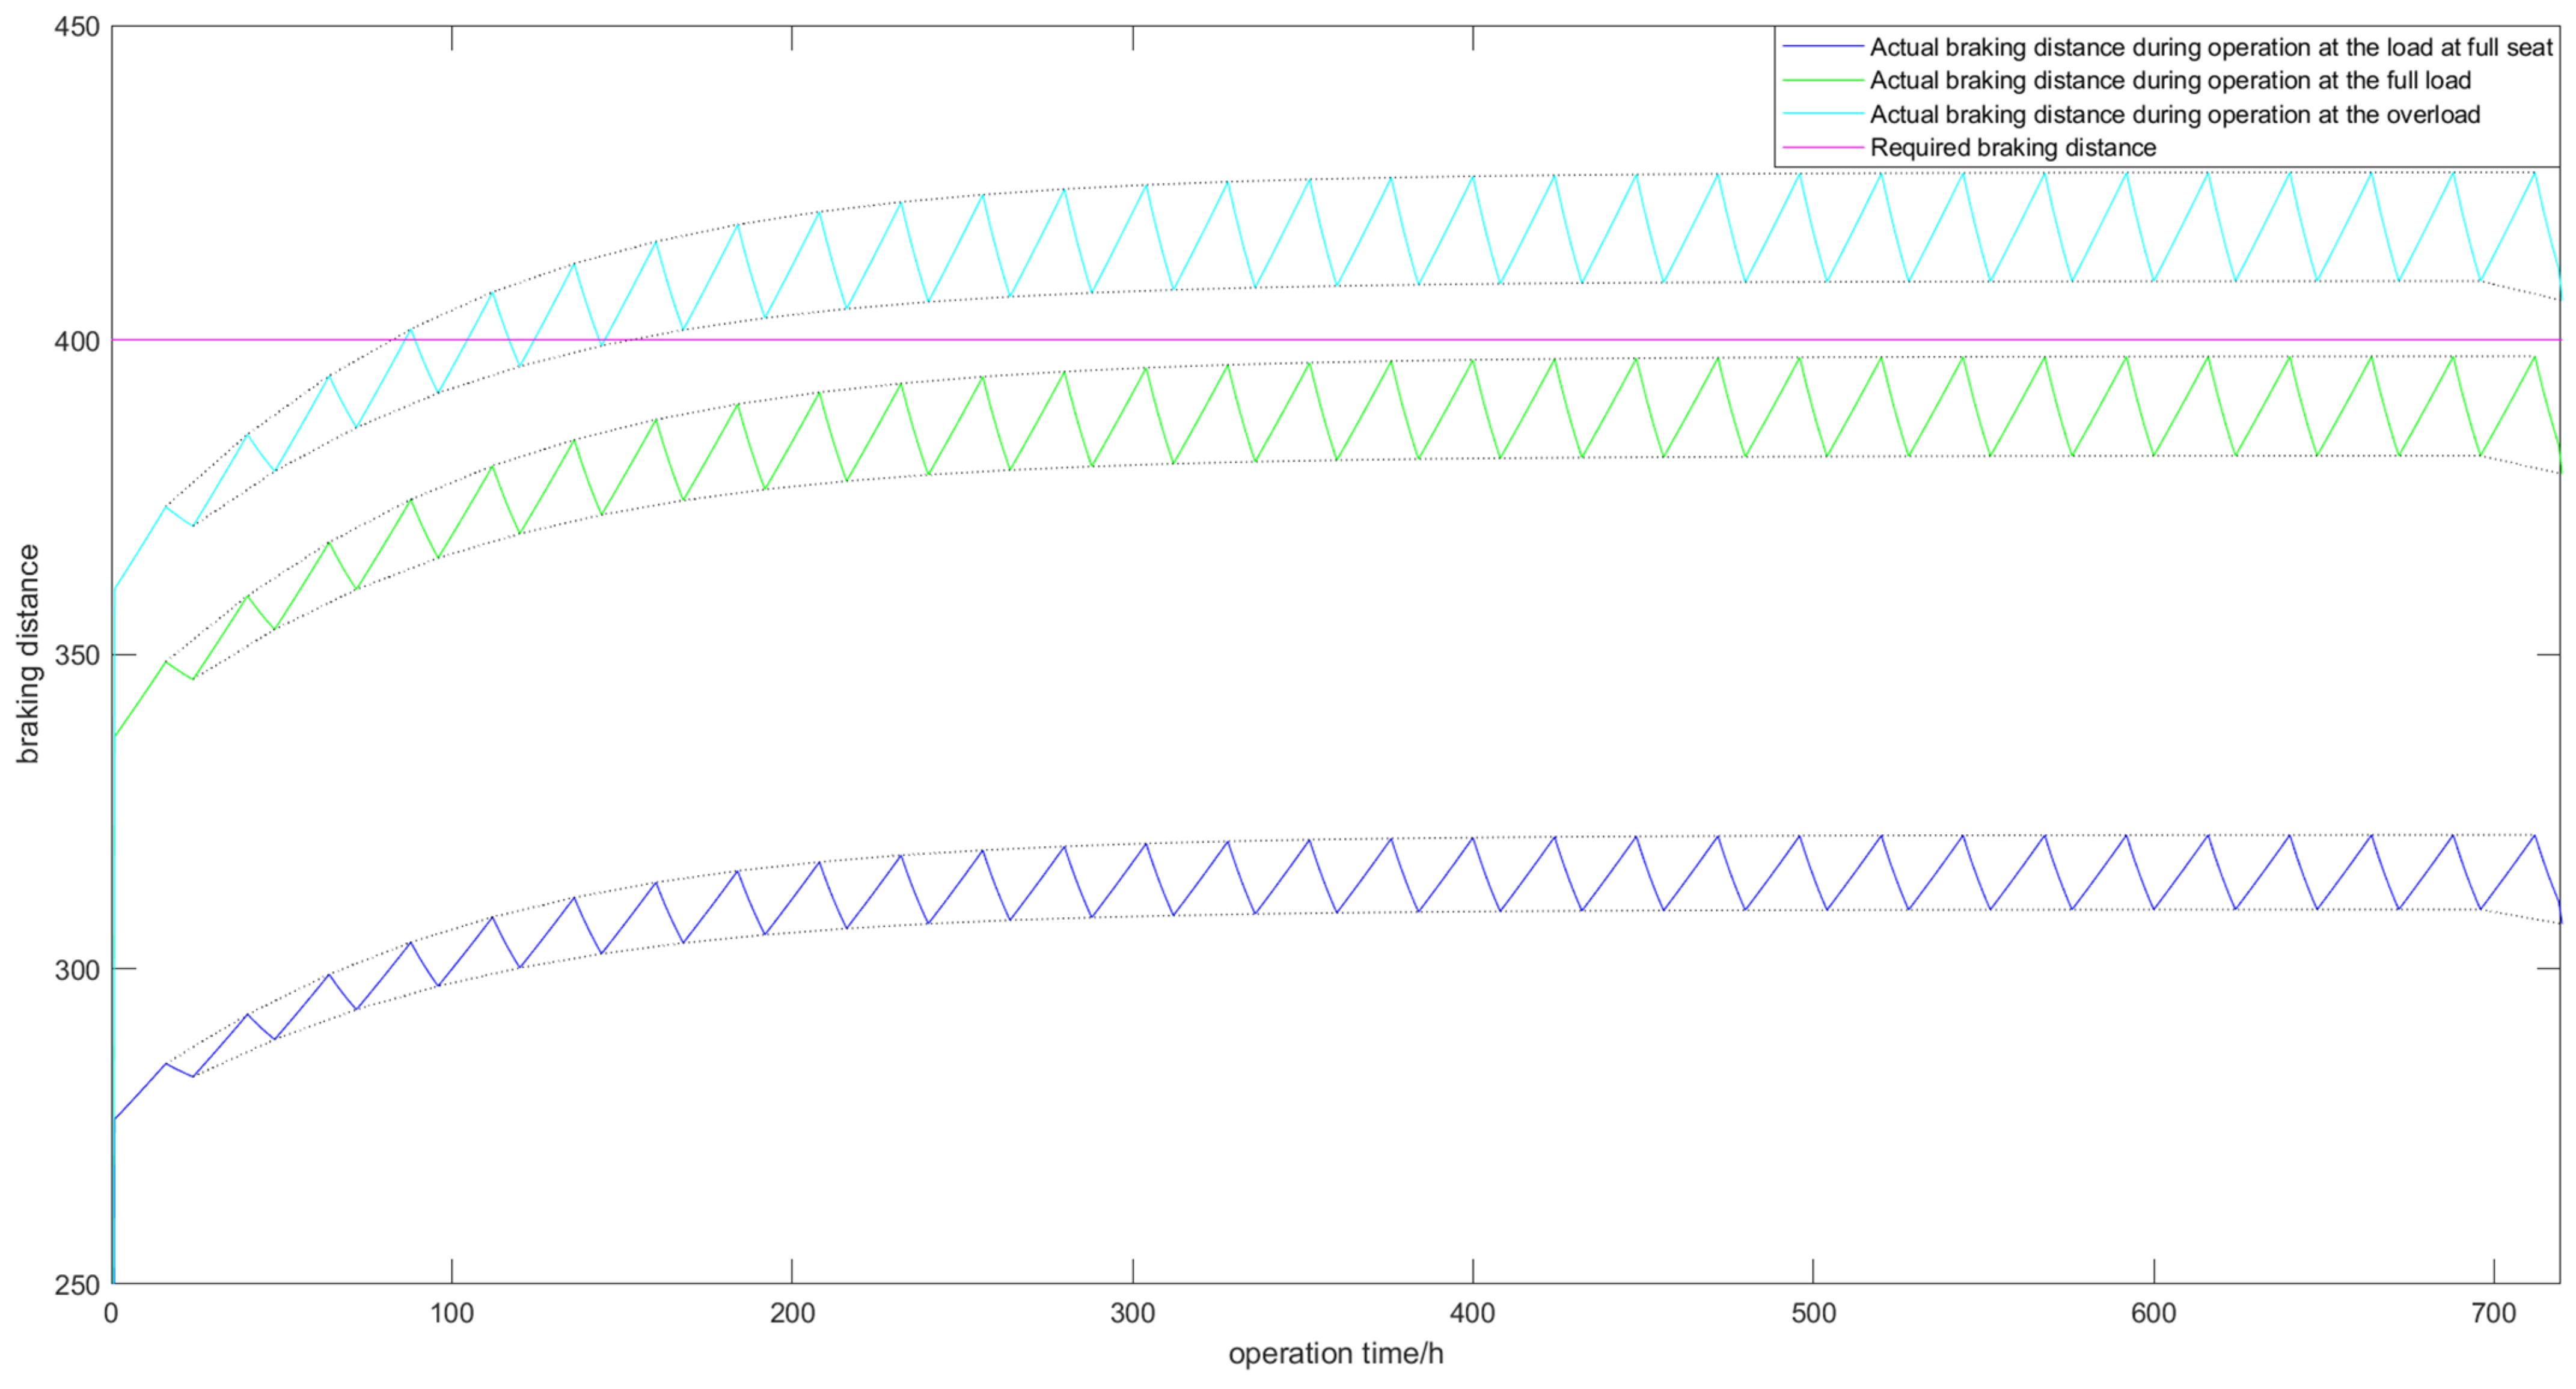
Then, we compared the variation of braking distance with time for a train under three specified load conditions in a single cycle. The input parameters are the same as in Table 1 except for the load. In Figure 5, it can be seen that as the trainload increases, the braking distance becomes correspondingly longer, and the fluctuation range of the braking distance between the upper and lower bound becomes larger. The braking distance of the subway train at the load at full load and full load conditions meet the requirements of safe braking distance regulations. While in the overload condition, the braking distance cannot meet the requirements of the safe braking distance regulations.
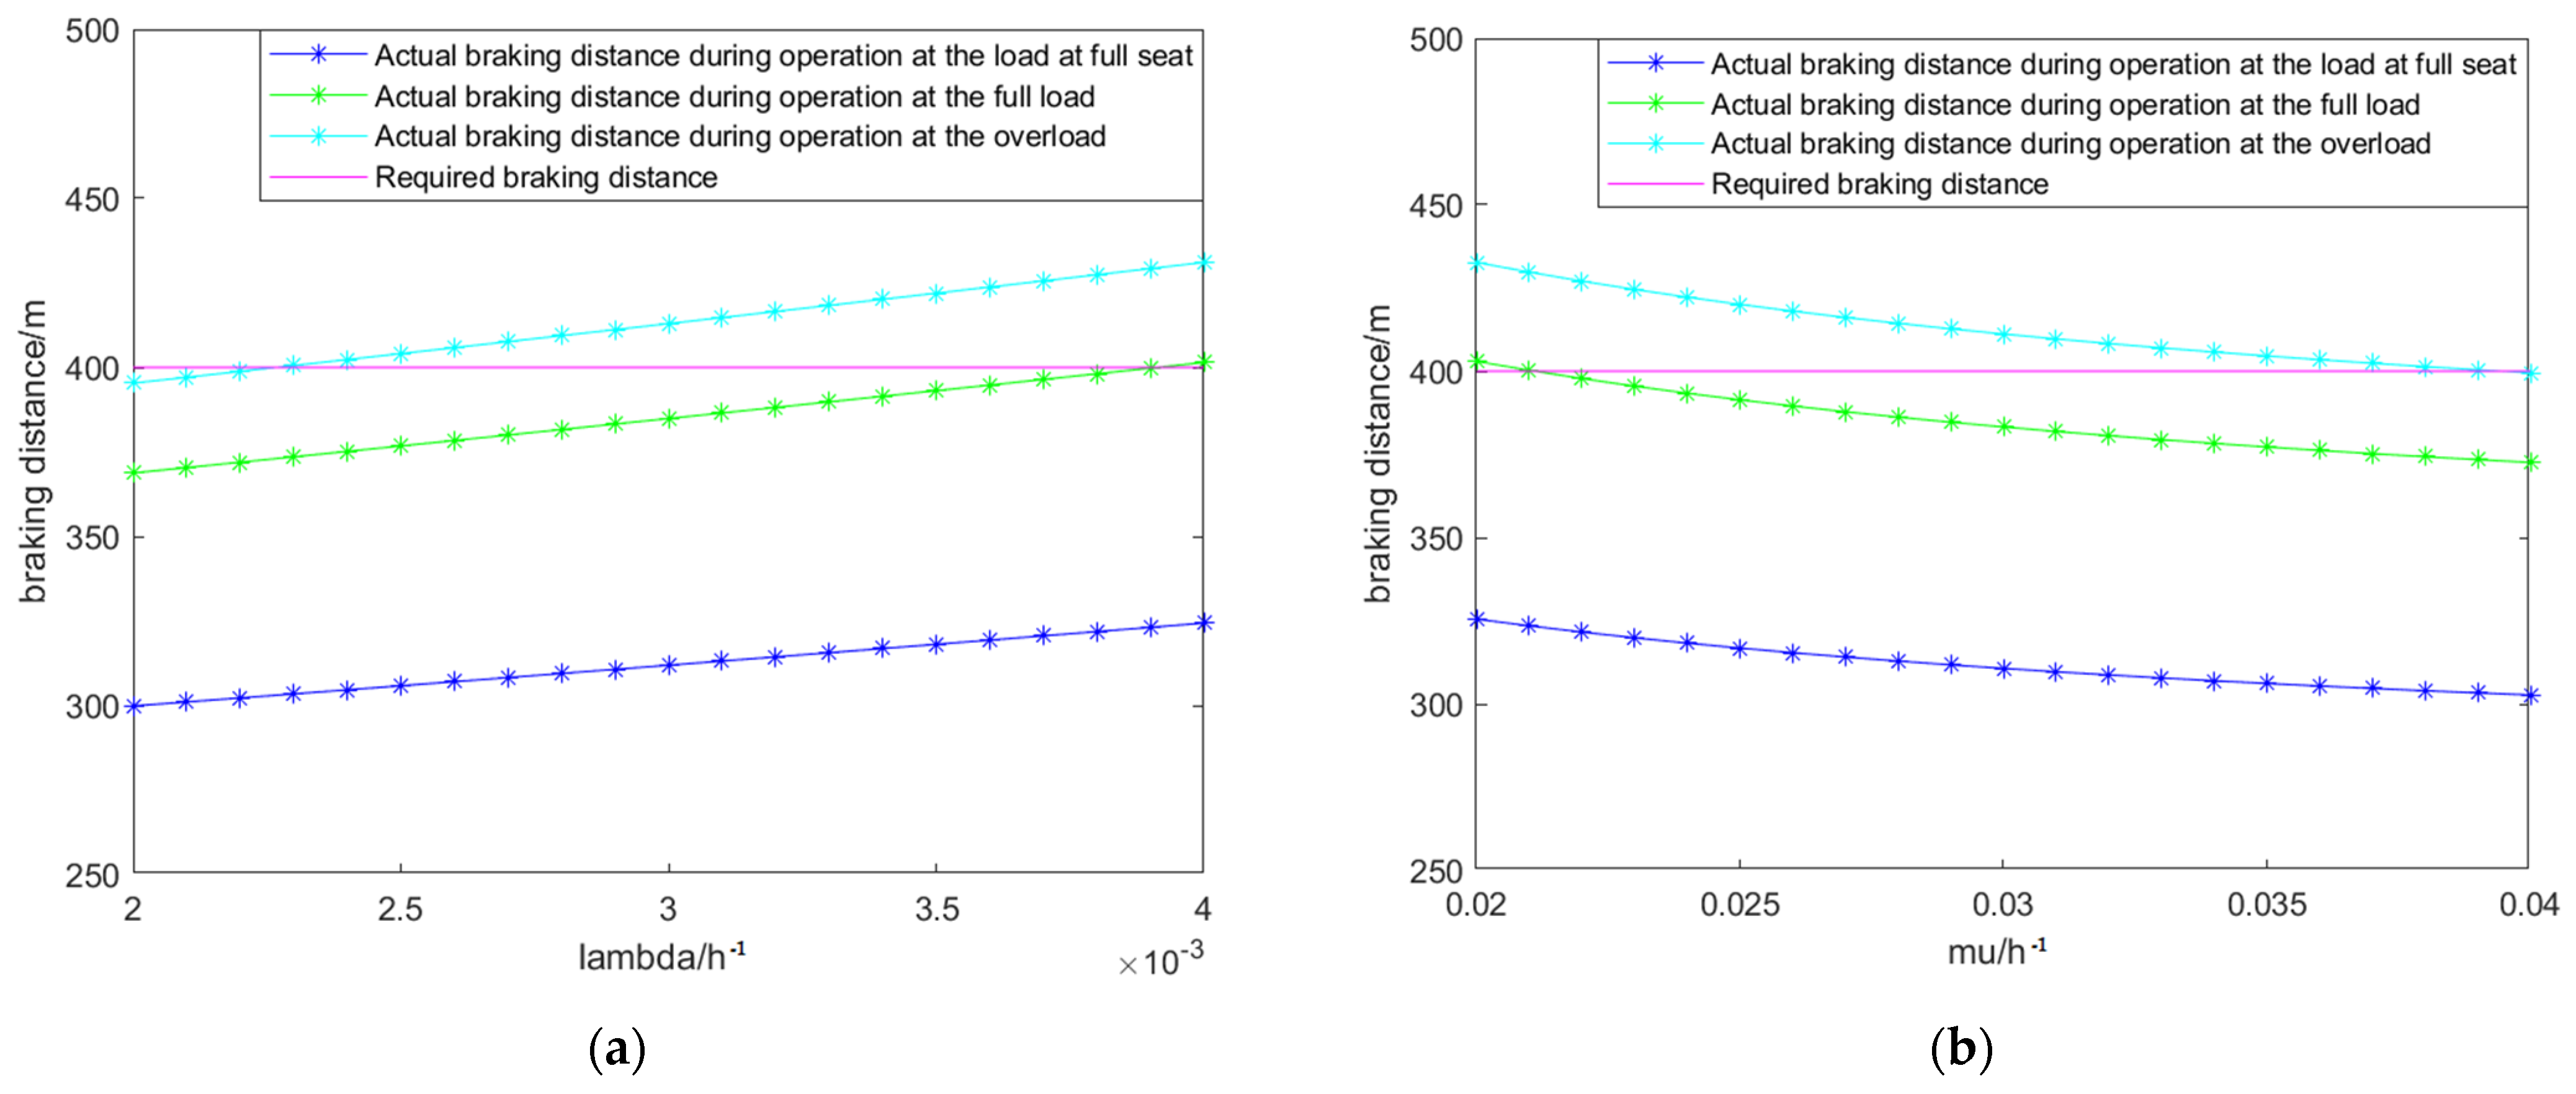
To compare the effects of daily maintenance rate and failure rate on braking distance, we calculated the variation of the average braking distance in one cycle with the motor failure rate λ and daily maintenance repair rate μ for metro trains under three different loads. The input parameters are the same as in Table 1 except for the load, λ, and μ. The results are shown in Figure 6. It can be seen that the effect of routine maintenance repair rate on the average braking distance is significantly higher than the effect of motor failure rate on the average braking distance.
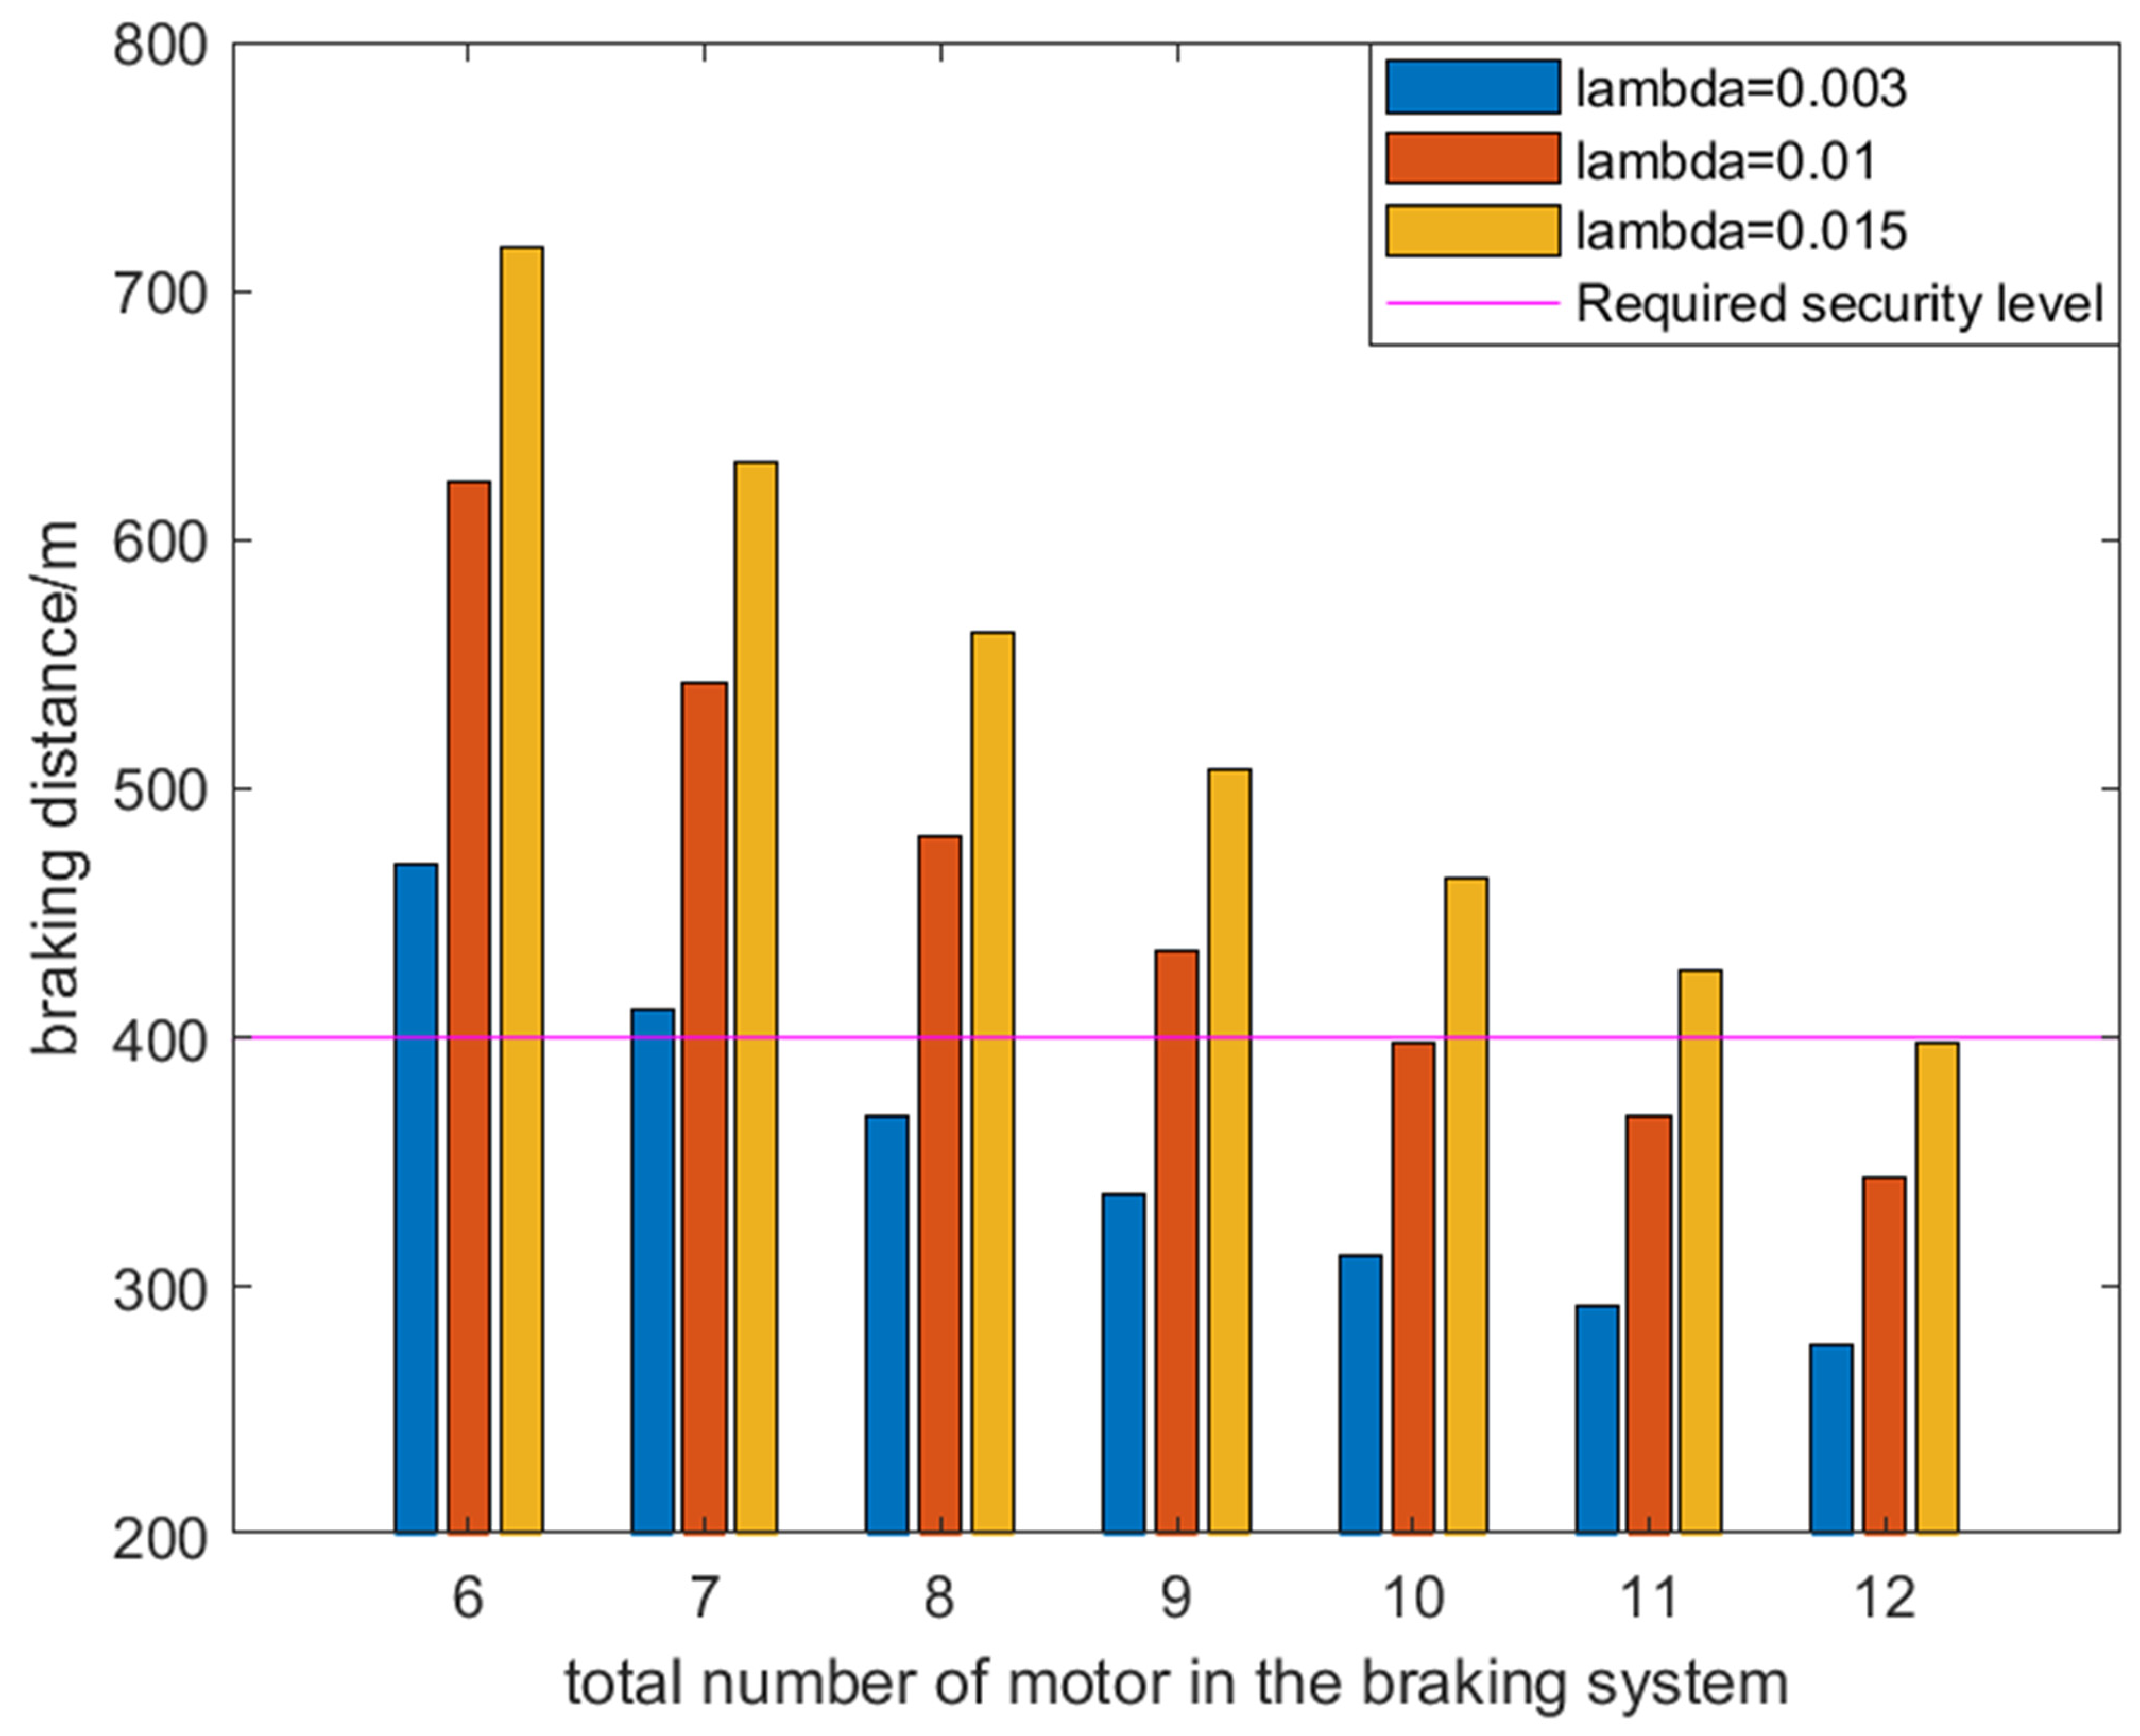
To compare the effect of brake motors with different failure rates and different installation numbers on the braking distance, we calculated the average braking distance within a single overhaul interval for three different failure rates and different installation numbers. The input parameters are the same as in Table 1 except for the number of motors and λ. In Figure 7, we can see that the number of motors required to meet the safe braking distance will also be higher when motors with higher failure rates are selected.
5.4. Braking System Performance under the Nested Preventive Maintenance Cycles
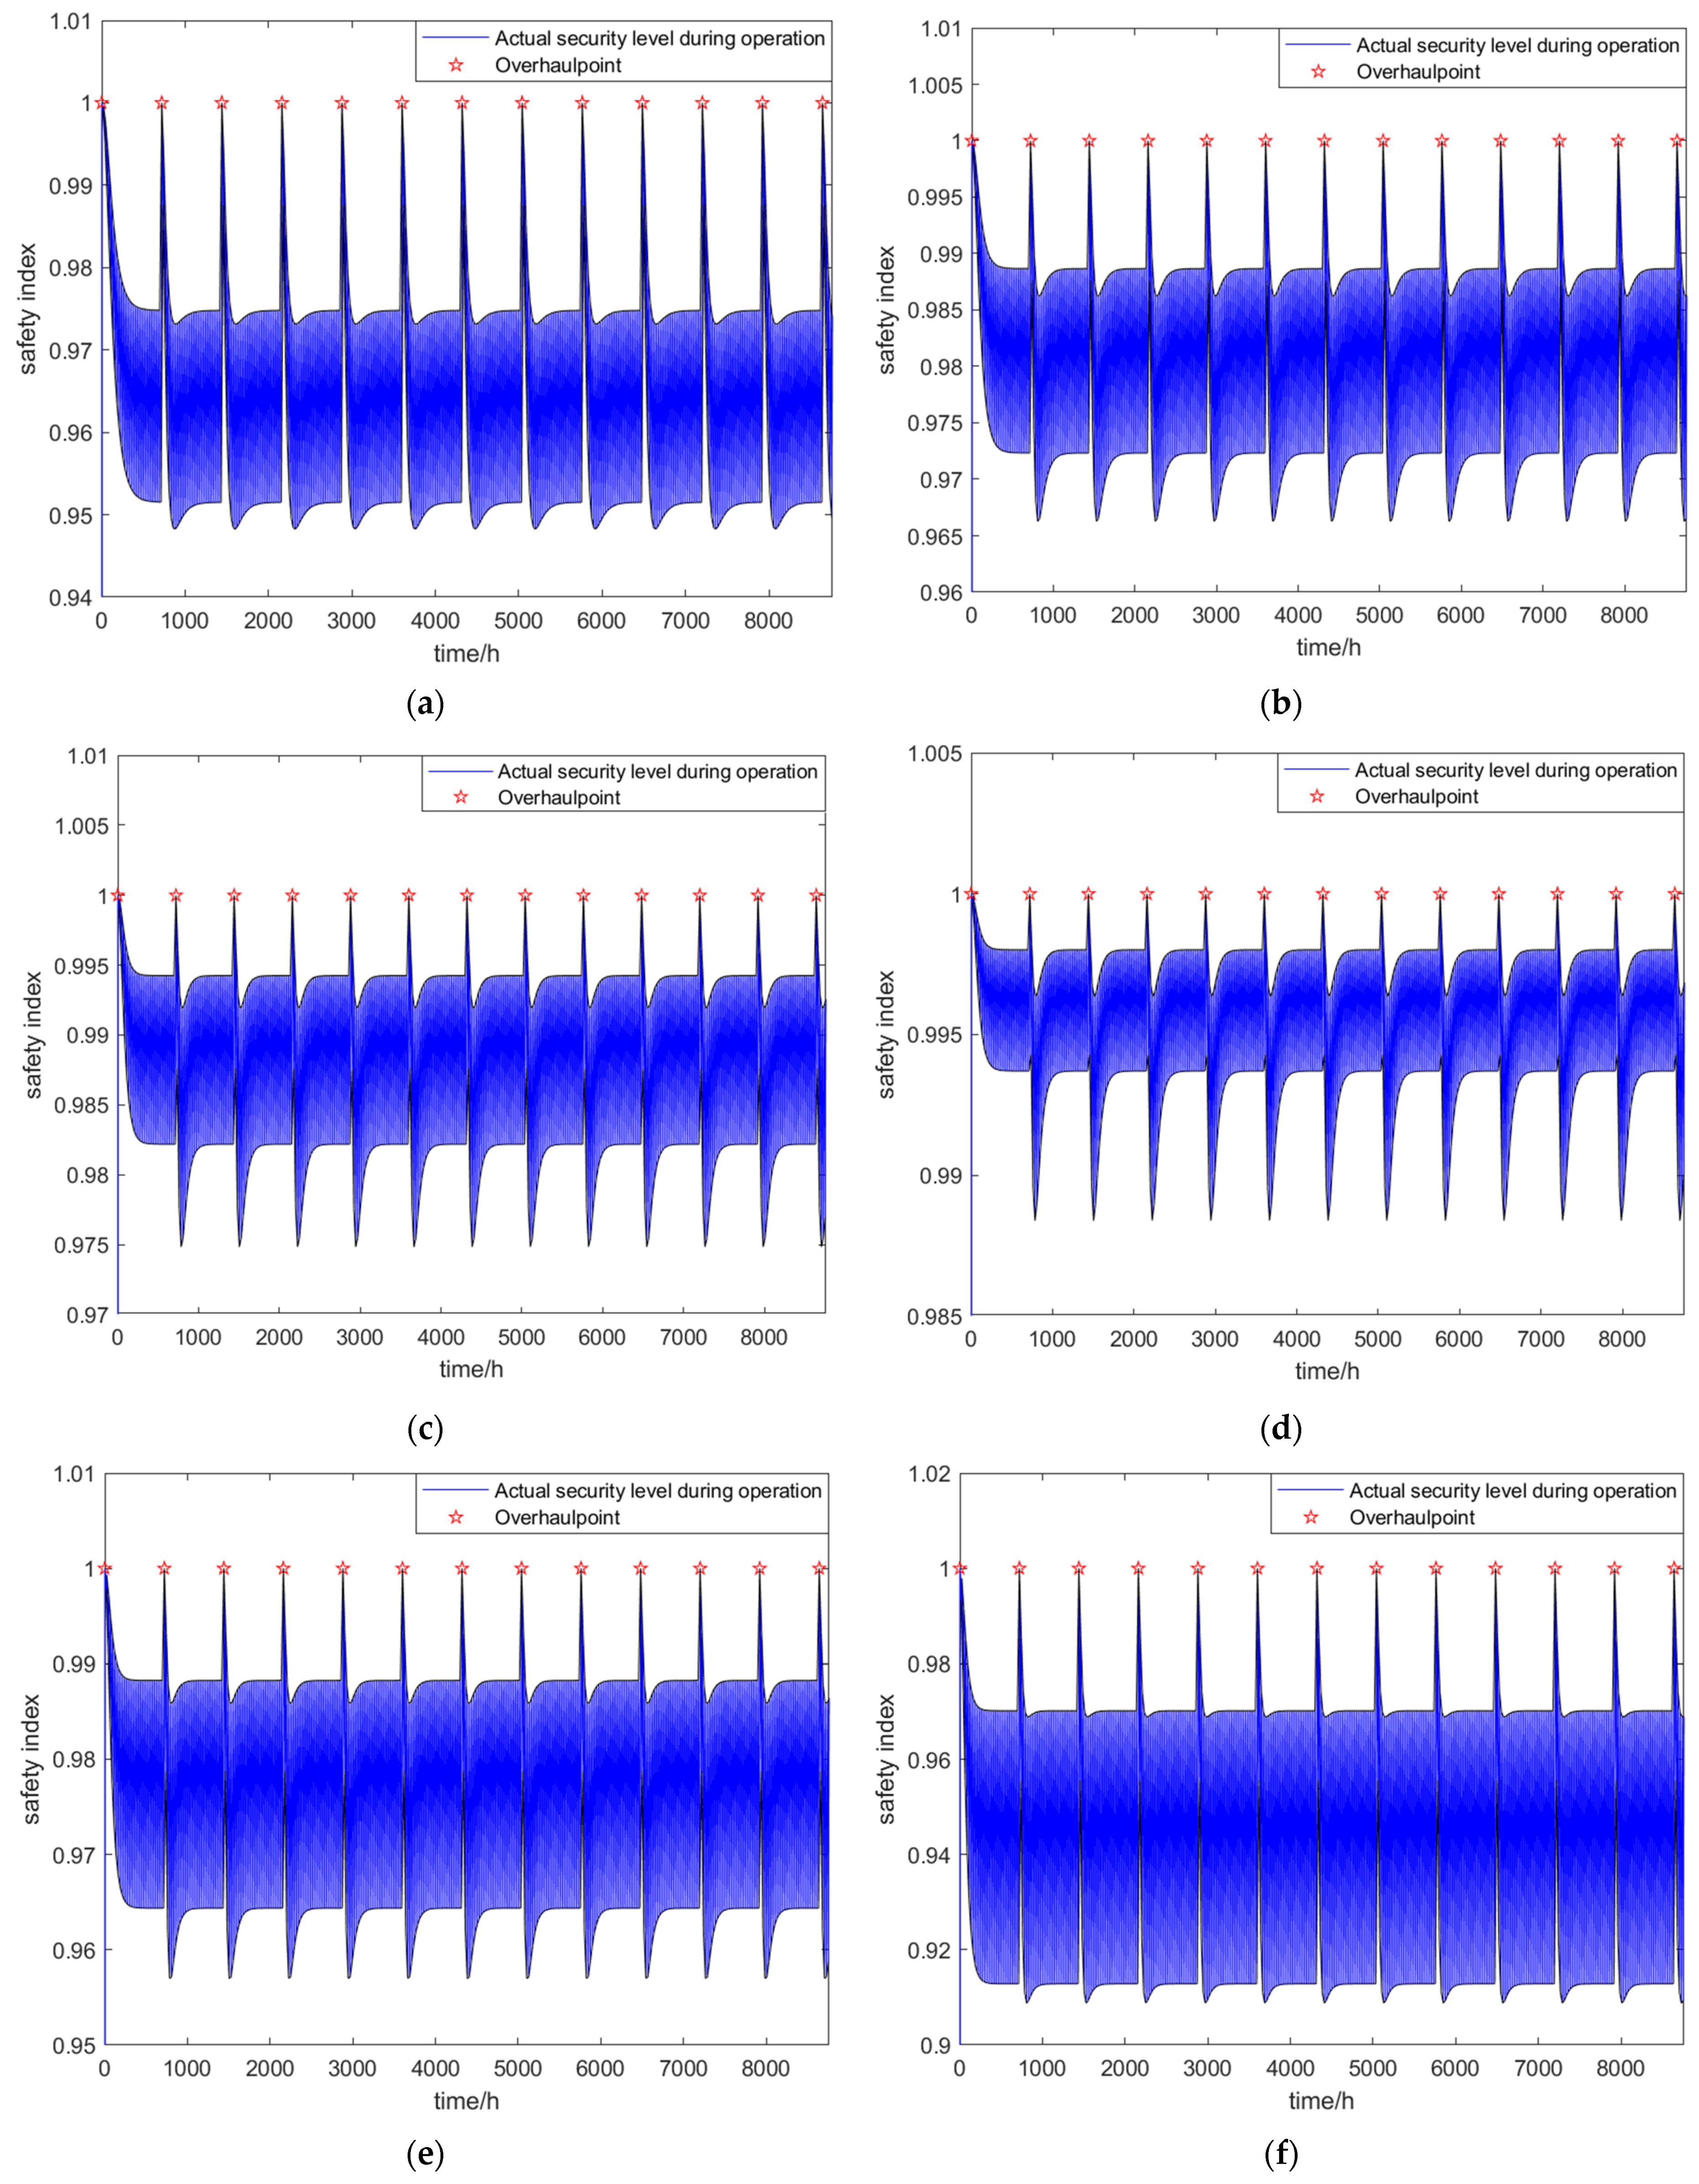
To compare the effect of different failure rates and daily maintenance rates on the safety index of the braking system, we calculated the variation of the safety index overtime for 8640 h. The input parameters are the same as in Table 1 except for the μ and λ. The results are shown in Figure 8. From the figure, it can be seen that the safety probability of the braking system decreases to a certain level and then gradually stabilizes during each overhaul interval. When μ represents a higher daily maintenance rate, the safety performance of the train braking system is also better. In contrast, when the motor failure rate λ is lower, the safety index stabilization will be higher.
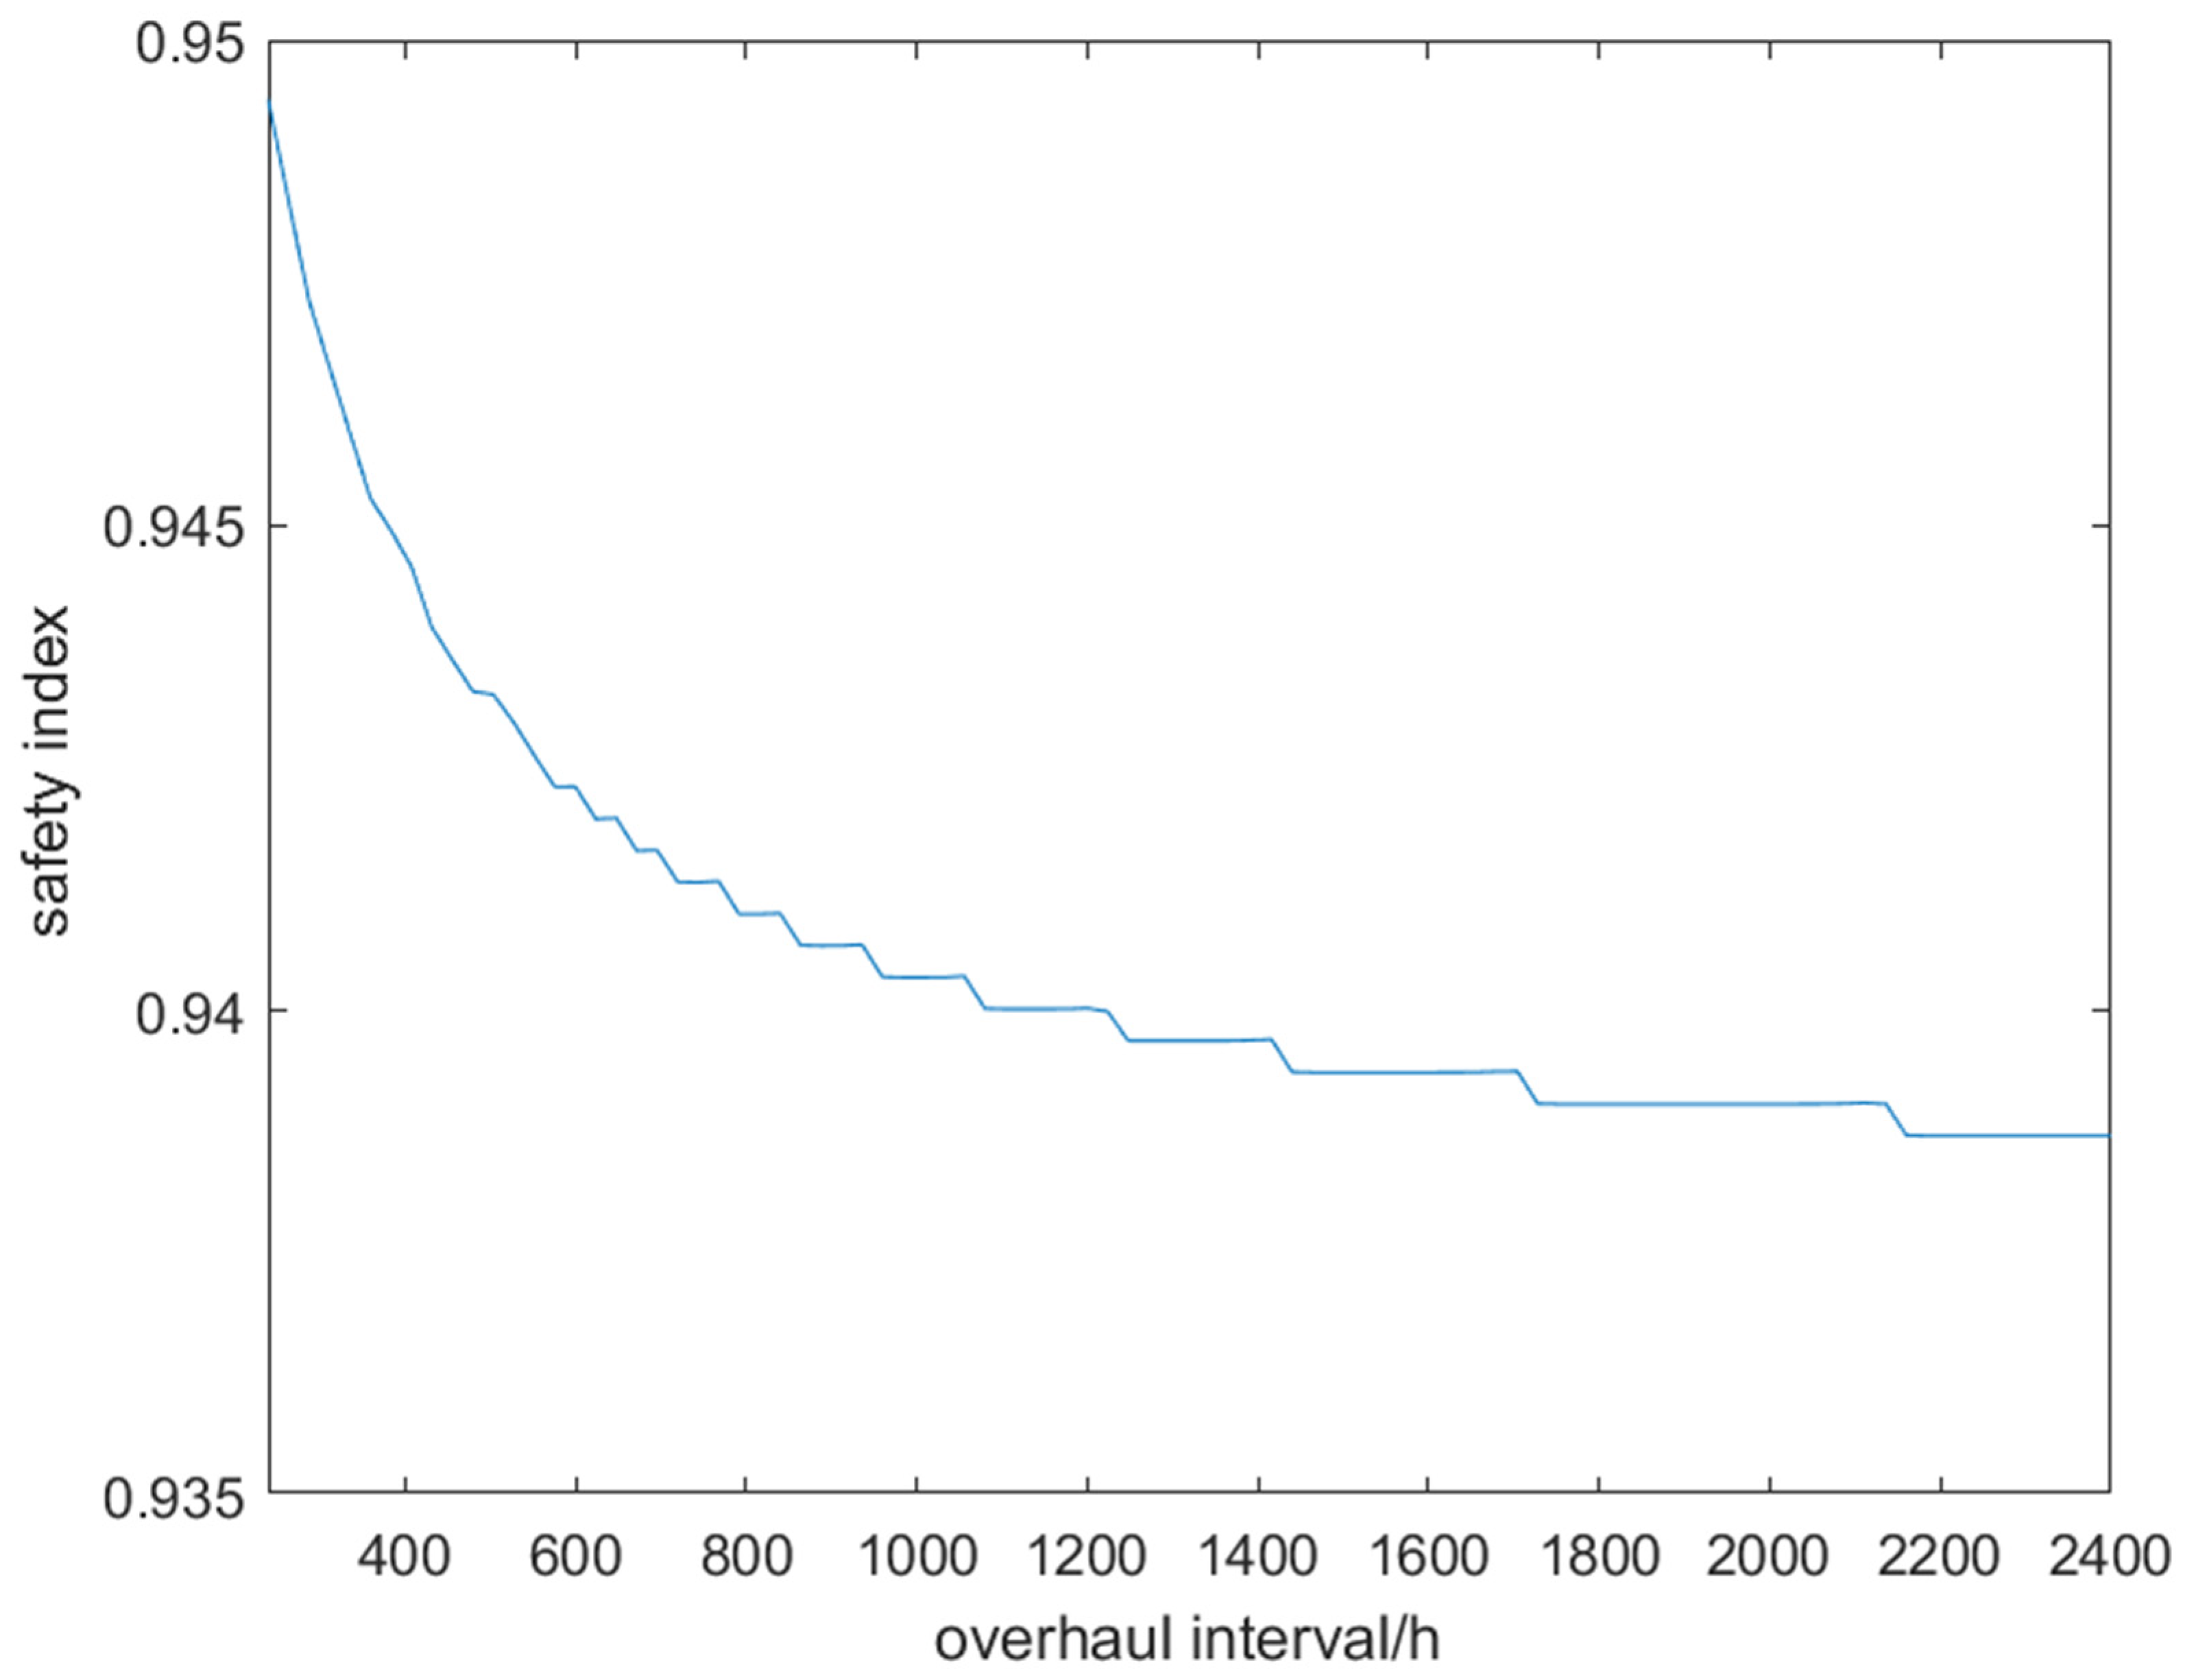
Finally, to obtain the effect of the overhaul interval on the safety performance of the braking system, we calculated the average safety index over 8640 h at different overhaul intervals. The input parameters are the same as in Table 1 except for the overhaul interval. In Figure 9, it can be seen that as the overhaul interval becomes longer, the average safety index of the braking system decreases. In other words, a reasonable choice of overhaul intervals can help maintain the safety of the braking system.
6. Analysis and Conclusions
In this paper, for the unique operation and maintenance mode of the subway train system, the train braking system is modeled as a K-out-of-N model. A multi-phase Markov chain is applied to analyze its operation and maintenance process which contains fault states and two preventive maintenance modes, the mathematical description of its states is given, the braking distance of the braking system is coupled with its states, and the mathematical relationship between them is given. Finally, a numerical case is used to analyze the influence of the operation and maintenance parameters of this braking system on the braking distance and its safety level.
By using this method, we established mathematical relationships between brake system operation and maintenance parameters and safety indicators such as braking distance. A framework for analyzing the physical performance of the braking system under the influence of faults and maintenance is built. It can be seen that by selecting a brake motor with a lower failure rate, the safe braking distance requirement can be achieved with a smaller number. Similarly, if more intensive overhauls are scheduled, the number of brake motors required can be reduced. Additionally, after the brake system design is completed, design compensation can also be achieved by rationalizing the sizing of routine maintenance and overhaul cycles. We can trade off the effects of the multiple PM intervals on train safety considering the redundancy structure of the braking system by the proposed model. This method can be extensively applied to the modeling and analysis of any other K-out-of-N system with such operational characteristics, allowing the analysis of the requirements decision of the relevant equipment reliability and the determination of the maintenance scheme parameters given a safety threshold.
In future work, we will consider more operational scenarios. On the one hand, we can consider the downtime maintenance in addition to the preventive maintenances. Another possible extension direction is to consider a K-out-of-N system containing different components, such that the parameters of the K-out-of-N system becoming multidimensional and the system state dimension increasing.
Author Contributions
Conceptualization, L.Z. and L.G.; methodology, L.Z. and Y.W.; investigation, L.Z.; writing—original draft preparation, L.Z.; writing—review and editing, L.G. and R.L. All authors have read and agreed to the published version of the manuscript.
Funding
This research was funded by Beijing Natural Science Foundation (L191010).
Institutional Review Board Statement
Not applicable.
Informed Consent Statement
Not applicable.
Data Availability Statement
Not applicable.
Conflicts of Interest
The authors declare no conflict of interest.
Abbreviations
| the state of the braking system | |
| n | the number of the total brake motors |
| the number of the brake motors at time t | |
| k | the number of the brake motors satisfying the safe braking distance |
| the interval of working time every day, h | |
| the interval of maintenance time every day, h | |
| the total number of states | |
| the state probability of the system at time t | |
| the probability of state i | |
| the daily maintenance rate of the brake motor, | |
| the failure rate of the brake motor, | |
| C | the failure matrix of the braking system |
| M | the maintenance matrix of the braking system |
| the braking distance, m | |
| the lag braking distance, m | |
| the effective braking distance, m | |
| the train braking lag time, s | |
| the initial braking speed, km/h | |
| the utilization ratio of the braking force | |
| b | the unit braking force, N/kN |
| B | the braking force of the train, kN |
| the braking force of each brake motor, kN | |
| G | the weight of the train, t |
| the basic resistance, N/kN | |
| per mileage of equivalent gradient in the braking area |
References
- Urban Rail Transit 2020 Annual Statistics and Analysis Report. Available online: https://www.camet.org.cn/tjxx/7647 (accessed on 10 April 2021).
- Di Nardo, M.; Madonna, M.; Murino, T.; Castagna, F. Modelling a Safety Management System Using System Dynamics at the Bhopal Incident. Appl. Sci. 2020, 10, 903. [Google Scholar] [CrossRef] [Green Version]
- Di Nardo, M.; Madonna, M.; Addonizio, P.; Gallab, M. A Mapping Analysis of Maintenance in Industry 4.0. J. Appl. Res. Technol. 2021, 19, 653–675. [Google Scholar] [CrossRef]
- Sharma, R.C.; Dhingra, M.; Pathak, R.K. Braking systems in railway vehicles. Int. J. Eng. Res. Technol. 2015, 4, 206–211. [Google Scholar]
- Hasegawa, I.; Uchida, S. Braking systems. Jpn. Railw. Transp. Rev. 1999, 20, 52–59. [Google Scholar]
- Murtaza, M.; Garg, S. Brake modelling in train simulation studies. Proc. Inst. Mech. Eng. Part F J. Rail Rapid Transit 1989, 203, 87–95. [Google Scholar] [CrossRef]
- Levitin, G.; Lisnianski, A. Optimization of imperfect preventive maintenance for multi-state systems. Reliab. Eng. Syst. Saf. 2000, 67, 193–203. [Google Scholar] [CrossRef]
- Afshari, A.; Specchia, S.; Shabana, A.A.; Caldwell, N. A train air brake force model: Car control unit and numerical results. Proc. Inst. Mech. Eng. Part F J. Rail Rapid Transit 2013, 227, 38–55. [Google Scholar] [CrossRef]
- Specchia, S.; Afshari, A.; Shabana, A.A.; Caldwell, N. A train air brake force model: Locomotive automatic brake valve and brake pipe flow formulations. Proc. Inst. Mech. Eng. Part F J. Rail Rapid Transit 2013, 227, 19–37. [Google Scholar] [CrossRef]
- Pugi, L.; Palazzolo, A.; Fioravanti, D. Simulation of railway brake plants: An application to SAADKMS freight wagons. Proc. Inst. Mech. Eng. Part F J. Rail Rapid Transit 2008, 222, 321–329. [Google Scholar] [CrossRef]
- Lee, J.; Lee, H.; Kwak, J. A study for improvement performance of electric brake for electric train. In Proceedings of the 2008 International Conference on Control, Automation and Systems, Seoul, Korea, 14–17 October 2008; pp. 1345–1348. [Google Scholar] [CrossRef]
- Aleksandrov, A.V.; Kiselev, I.P.; Makarova, E.I. Simulations of electromagnetic processes in an asynchronous traction drive of automatic electric braking of an electric train. Russ. Electr. Eng. 2016, 87, 256–259. [Google Scholar] [CrossRef]
- Xiang, Z.; Mo, J.; Ouyang, H.; Massi, F.; Tang, B.; Zhou, Z. Contact behaviour and vibrational response of a high-speed train brake friction block. Tribol. Int. 2020, 152, 106540. [Google Scholar] [CrossRef]
- Liu, Y.; Wu, Y.; Ma, Y.; Gao, W.; Yang, G.; Fu, H.; Xi, N.; Chen, H. High temperature wear performance of laser cladding Co06 coating on high-speed train brake disc. Appl. Surf. Sci. 2019, 481, 761–766. [Google Scholar] [CrossRef]
- Appoh, F.; Yunusa-Kaltungo, A.; Sinha, J.K. Hybrid adaptive model to optimise components replacement strategy: A case study of railway brake blocks failure analysis. Eng. Fail. Anal. 2021, 127, 105539. [Google Scholar] [CrossRef]
- Yingkui, G.; Jing, L. Multi-State System Reliability: A New and Systematic Review. Procedia Eng. 2012, 29, 531–536. [Google Scholar] [CrossRef] [Green Version]
- Pandey, M.; Zuo, M.; Moghaddass, R. Selective maintenance modeling for a multistate system with multistate components under imperfect maintenance. IIE Trans. 2013, 45, 1221–1234. [Google Scholar] [CrossRef]
- Zhao, X.; Wang, S.; Wang, X.; Cai, K. A multi-state shock model with mutative failure patterns. Reliab. Eng. Syst. Saf. 2018, 178, 1–11. [Google Scholar] [CrossRef]
- Levitin, G.; Lisnianski, A. Structure optimization of multi-state system with two failure modes. Reliab. Eng. Syst. Saf. 2001, 72, 75–89. [Google Scholar] [CrossRef]
- Chen, R.W.; Hwang, F.K. Failure Distributions of Consecutive-k-out-of-n:F Systems. IEEE Trans. Reliab. 1985, 34, 338–341. [Google Scholar] [CrossRef]
- Cramer, E.; Kamps, U. Sequential order statistics and k-out-of-n systems with sequentially adjusted failure rates. Ann. Inst. Stat. Math. 1996, 48, 535–549. [Google Scholar] [CrossRef]
- Huang, J.; Zuo, M.; Wu, Y. Generalized multi-state k-out-of-n:G systems. IEEE Trans. Reliab. 2000, 49, 105–111. [Google Scholar] [CrossRef]
- Kuo, W.; Zhang, W.; Zuo, M. A consecutive-k-out-of-n:G system: The mirror image of a consecutive-k-out-of-n:F system. IEEE Trans. Reliab. 1990, 39, 244–253. [Google Scholar] [CrossRef]
- Eryilmaz, S.; Tutuncu, G.Y. Reliability evaluation of linear consecutive-weighted-k-out-of-n:f system. Asia-Pac. J. Oper. Res. 2009, 26, 805–816. [Google Scholar] [CrossRef]
- Zhao, X.; Cui, L. Reliability evaluation of generalised multi-statek-out-of-nsystems based on FMCI approach. Int. J. Syst. Sci. 2010, 41, 1437–1443. [Google Scholar] [CrossRef]
- Tan, C.M.; Raghavan, N. A framework to practical predictive maintenance modeling for multi-state systems. Reliab. Eng. Syst. Saf. 2008, 93, 1138–1150. [Google Scholar] [CrossRef]
- Amari, S.; McLaughlin, L.; Pham, H. Cost-effective condition-based maintenance using markov decision processes. In Proceedings of the RAMS’06, Annual Reliability and Maintainability Symposium, Newport Beach, CA, USA, 23–26 January 2006; pp. 464–469. [Google Scholar]
- Chan, G.; Asgarpoor, S. Optimum maintenance policy with Markov processes. Electr. Power Syst. Res. 2006, 76, 452–456. [Google Scholar] [CrossRef]
- Nguyen, N.; Nguyen, D. Hidden Markov Model for Stock Selection. Risks 2015, 3, 455–473. [Google Scholar] [CrossRef] [Green Version]
- Wang, C.; Wei, L.; Wang, Z.; Song, M.; Mahmoudian, N. Reinforcement Learning-Based Multi-AUV Adaptive Trajectory Planning for Under-Ice Field Estimation. Sensors 2018, 18, 3859. [Google Scholar] [CrossRef] [Green Version]
- Kim, S.; Lim, H. Reinforcement Learning Based Energy Management Algorithm for Smart Energy Buildings. Energies 2018, 11, 2010. [Google Scholar] [CrossRef] [Green Version]
- Reibman, A.; Smith, R.; Trivedi, K. Markov and Markov reward model transient analysis: An overview of numerical approaches. Eur. J. Oper. Res. 1989, 40, 257–267. [Google Scholar] [CrossRef]
- Dao, C.; Zuo, M.J. Selective maintenance of multi-state systems with structural dependence. Reliab. Eng. Syst. Saf. 2017, 159, 184–195. [Google Scholar] [CrossRef]
- Dao, C.D.; Zuo, M.J.; Pandey, M. Selective maintenance for multi-state series–parallel systems under economic dependence. Reliab. Eng. Syst. Saf. 2014, 121, 240–249. [Google Scholar] [CrossRef]
- Barron, Y.; Frostig, E.; Levikson, B. Analysis of R out of N systems with several repairmen, exponential life times and phase type repair times: An algorithmic approach. Eur. J. Oper. Res. 2006, 169, 202–225. [Google Scholar] [CrossRef]
- Kim, K.; Park, K. Phased-mission system reliability under Markov environment. IEEE Trans. Reliab. 1994, 43, 301–309. [Google Scholar] [CrossRef]
- Smotherman, M.; Zemoudeh, K. A non-homogeneous Markov model for phased-mission reliability analysis. IEEE Trans. Reliab. 1989, 38, 585–590. [Google Scholar] [CrossRef]
- Haidong, L.; Mei, S.; Hongqin, P.; ZHANG, Z.; Hailong, X. Braking performances of urban rail trains. J. Transp. Syst. Eng. Inf. Technol. 2011, 11, 93–97. [Google Scholar]
- Yue, H. Modeling and Analysis on Electrical Braking Energy of Urban Railway Vehicle; Shanghai University of Engineering Science: Shanghai, China, 2012. [Google Scholar]
Figure 1.
Electric braking systems with brake motors.

Figure 2.
Results obtained from 10,000 simulations.

Figure 3.
Braking distance verified in one overhaul interval.

Figure 4.
Variation of daily maintenance rate and overhaul interval with the same average safety index.
Figure 4.
Variation of daily maintenance rate and overhaul interval with the same average safety index.

Figure 5.
Braking distance under different loads during an overhaul interval.

Figure 6.
Average braking distance in one overhaul interval verified with the different parameters of motors: (a) braking distance verified with λ; (b) braking distance verified with λ.
Figure 6.
Average braking distance in one overhaul interval verified with the different parameters of motors: (a) braking distance verified with λ; (b) braking distance verified with λ.

Figure 7.
Braking distance verified with different number of motors.

Figure 8.
Safety index comparison under different failure rates and different daily maintenance rates: (a) safety index in μ = 0.03 and λ = 0.003; (b) safety index in μ = 0.04 and λ = 0.003; (c) safety index in μ = 0.05 and λ = 0.003; (d) safety index in μ = 0.05 and λ = 0.002; (e) safety index in μ = 0.05 and λ = 0.004; and (f) safety index in μ = 0.05 and λ = 0.006.

Figure 9.
The average safety index with different overhaul interval.


Table 1.
Parameters of the case.
| Load at the full seat | 240.496 t |
| Full load | 333.46 t |
| Overload | 370.06 t |
| Single motor output force | 61.67 MN |
| Number of motors | 6 |
| Minimum number of motors for system operation | 2 |
| Maximum operating speed | 80 km/h |
| Utilization ratio of the braking force | 1 |
| Per mileage of equivalent gradient in the braking area | 1 |
| Daytime operating hours | 16 h |
| Nighttime maintenance hours | 8 h |
| Safe braking distance | 400 m |
| Failure rate of the brake motor | |
| Maintenance rate of the brake motor | |
| Overhaul interval | 720 h |
Table 2.
Calculation environment.
| Operating System | Windows 10 |
| RAM | 16 GB |
| CPU | Inter core 7700HQ |
| GPU | Nvidia GTX1070 8G |
| Load at the full seat | 240.496 t |
Publisher’s Note: MDPI stays neutral with regard to jurisdictional claims in published maps and institutional affiliations. |
© 2022 by the authors. Licensee MDPI, Basel, Switzerland. This article is an open access article distributed under the terms and conditions of the Creative Commons Attribution (CC BY) license (https://creativecommons.org/licenses/by/4.0/).
Share and Cite
MDPI and ACS Style
Zhang, L.; Guo, L.; Li, R.; Wang, Y. A Method for Safety Evaluation of Train Braking System Considering Multiple Types of Preventive Maintenance Cycles. Appl. Sci. 2022, 12, 4799. https://0-doi-org.brum.beds.ac.uk/10.3390/app12094799
AMA Style
Zhang L, Guo L, Li R, Wang Y. A Method for Safety Evaluation of Train Braking System Considering Multiple Types of Preventive Maintenance Cycles. Applied Sciences. 2022; 12(9):4799. https://0-doi-org.brum.beds.ac.uk/10.3390/app12094799
Chicago/Turabian StyleZhang, Lilei, Linhan Guo, Ruiyang Li, and Yu Wang. 2022. "A Method for Safety Evaluation of Train Braking System Considering Multiple Types of Preventive Maintenance Cycles" Applied Sciences 12, no. 9: 4799. https://0-doi-org.brum.beds.ac.uk/10.3390/app12094799
Note that from the first issue of 2016, this journal uses article numbers instead of page numbers. See further details here.