Article

Error Correction and Reanalysis of the Vibration Analysis of a Piezoelectric Ultrasonic Atomizer to Control Atomization Rate

School of Mechanical and Electrical Engineering, Guangzhou University, Guangzhou 510006, China
*
Authors to whom correspondence should be addressed.
Submission received: 16 March 2023 / Revised: 14 May 2023 / Accepted: 17 May 2023 / Published: 21 May 2023
(This article belongs to the Collection Progress in Liquid Atomization and Spray Systems)

Abstract

:
Dynamic mesh atomizers have been widely used in various fields because of their compact structure, low energy consumption, and low production costs. The finite element method is an important technique to analyze the factors affecting the atomization performance of dynamic mesh atomizers. However, at present, there is a lack of decisive solutions to the basic problems of boundary setting in terms of the simulation and vibration displacement characteristics of atomizers under different vibration modes. In this paper, two errors were found in the Vibration Analysis of a Piezoelectric Ultrasonic Atomizer to Control Atomization Rate paper written by Esteban Guerra-Bravo et al. in 2021. First, in the finite element analysis, the boundary condition of the atomizing sheet was set to be fixed, which is inconsistent with the actual support situation and seriously affects the vibration of the atomizing sheet. Second, in the simulation result, from the first mode to the third mode, the growth rate of the maximum displacement at the center of the atomizing sheet was as high as 77.12%, even up to 221.05%, which is inconsistent with the existing vibration theory. In view of these errors, in this paper, the working principle of dynamic mesh atomizers is analyzed and the vibration equation of the atomizing sheet under peripheral simple support is derived. Through comparison with the literature, it was proven that the boundary setting and vibration displacement of the atomizing sheet in the original paper are unreasonable. By measuring the atomizing rate of the atomizing sheet under different boundary conditions, it was proven that the peripheral freedom of the atomizing sheet should be greater than or equal to 1, namely, peripheral freedom or peripheral simply supported. The vibration displacement theory was used for the simulation, and the relationship between the vibration displacement and resonant frequency of the atomizing sheet under peripheral simple support was measured. It was found that with the increase in the resonance frequency, the maximum displacement of vibration modes with only nodal circles was larger than that of the other vibration modes, and the maximum displacement increased slightly with the increase in the number of nodal circles by about 0.98%.

1. Introduction

Microporous piezoelectric ultrasonic atomization is a new type of ultrasonic atomization method, which is the process of using the high-frequency vibration of piezoelectric ceramics to force the continuous fluid to disperse into two-phase flow and further disperse into droplets through micropores. Microporous piezoelectric ultrasonic atomizers can be divided into static and dynamic mesh atomizers according to whether the microporous plate vibrates [1,2]. These types of atomizers have their own advantages and disadvantages, but compared with static mesh atomizers, dynamic mesh atomizers do not need a liquid cavity with variable volume, greatly simplifying the structure and effectively solving the problems of the low energy utilization rate and large droplet size. In addition, given its advantages, such as low cost, low energy consumption, and uniform atomizing particle size, dynamic mesh atomizers have been widely used in air humidification, spray cooling, biomedicine, aromatherapy, atomizing inhalation therapy, and other fields [3,4,5,6,7,8,9,10].
In recent years, in order to explore the factors affecting the atomization effect of dynamic mesh atomizers, researchers in different application fields have adopted theoretical analysis, simulation, experimental research, and other methods. Maehara et al. proposed a dynamic mesh atomizer and found through experiments that the atomization quantity of the atomizer is proportional to the number of pinholes, and the atomization quantity at the second-order resonant frequency is larger than that at the first-order frequency [11]. Micro-tapered apertures were first used instead of pinholes by Toda et al., and the water supply structure of the atomizer was also eliminated to reduce the volume of the device [12,13]. Percin et al. used the finite element method to optimize the design of atomizing sheet and thus developed the technology of using the atomizer to deposit ink, organic polymers, and solid particles [14,15,16,17,18]. Shen et al. studied an atomizing device with a cymbal-type high power driver to realize the atomization of lavender oil, proving that the atomizer can realize the atomization of high viscosity liquid (cP > 3.5) [19]. Jiang et al. found through experiments on the influence of the change in the cone angle in the vibration of the atomizing sheet on the atomization performance and thus proposed the theory of the dynamic cone angle for the first time [20]. Later, Cai et al. studied the influence of the vibration characteristics of the atomizing sheet on the atomization performance at different resonant frequencies through simulation, further proving the existence of the pumping effect of the dynamic cone angle [21]. Yan et al. [22,23] and Zhang et al. [24] found the mode shapes of the atomizing sheet under different resonances through simulation and found that the factors affecting the atomization rate were the driving voltage, the driving frequency and cone-hole-related parameters through experiments. Based on the analytical model of the stepped plate, Pascal Fossat et al. studied and discussed the influence of the geometric shape parameters and mechanical properties of the piezoelectric element, vibration plate, and perforation, so as to achieve the best atomization efficiency of the atomizing sheet [25]. Pallavi Sharma et al. proved through finite element analysis and experiments that the velocity of the metal film on the atomizing sheet and the slope of film displacement across the film length are key parameters affecting the atomization ability, which can be used to improve the velocity and atomization of high viscosity liquid [26].
To sum up, the finite element method is indispensable in simulating the vibration of atomizers when analyzing the factors affecting the atomization performance of dynamic mesh atomizers. However, at present, there is no definite conclusion on the boundary setting of atomizing sheets in simulations and the vibration displacement characteristics of the atomizing sheet under different vibration modes. In 2021, Esteban Gura-Bravo et al., conducted a vibration analysis of an atomizing sheet in order to improve the performance of soft-driven robots by controlling the atomizing rate [27]. However, there are some obvious errors when they use the finite element method to analyze the atomization theory. First, in the simulation setting, the boundary condition of the thin plate adopted the peripheral fixation support, which violates the real support condition of the atomizing sheet. Second, in the simulation results of the vibration displacement, with the increase in the number of nodal circles, the maximum displacement increased at a rate of 77.12%, and even reached 221.05%, which is inconsistent with the existing theory.
The arguments for the above errors were established, and theoretical and experimental research was conducted in this paper. Section 2 presents the structure of the dynamic mesh atomizer with a multi-tapered hole metal sheet and introduces the theoretical analysis model of the atomizer. In Section 3 and Section 4, the errors in the paper Vibration Analysis of a Piezoelectric Ultrasonic Atomizer to Control Atomization Rate and the experimental data in the existing literature and the experimental results of the research team are presented, respectively. Finally, the boundary conditions consistent with the actual support condition and the change in the vibration displacement at the center of the atomizing sheet with the resonant frequency are determined. The flow chart of this work is shown in Figure 1.

2. Structure of the Dynamic Mesh Atomizer and the Theoretical Model of the Atomizing Sheet
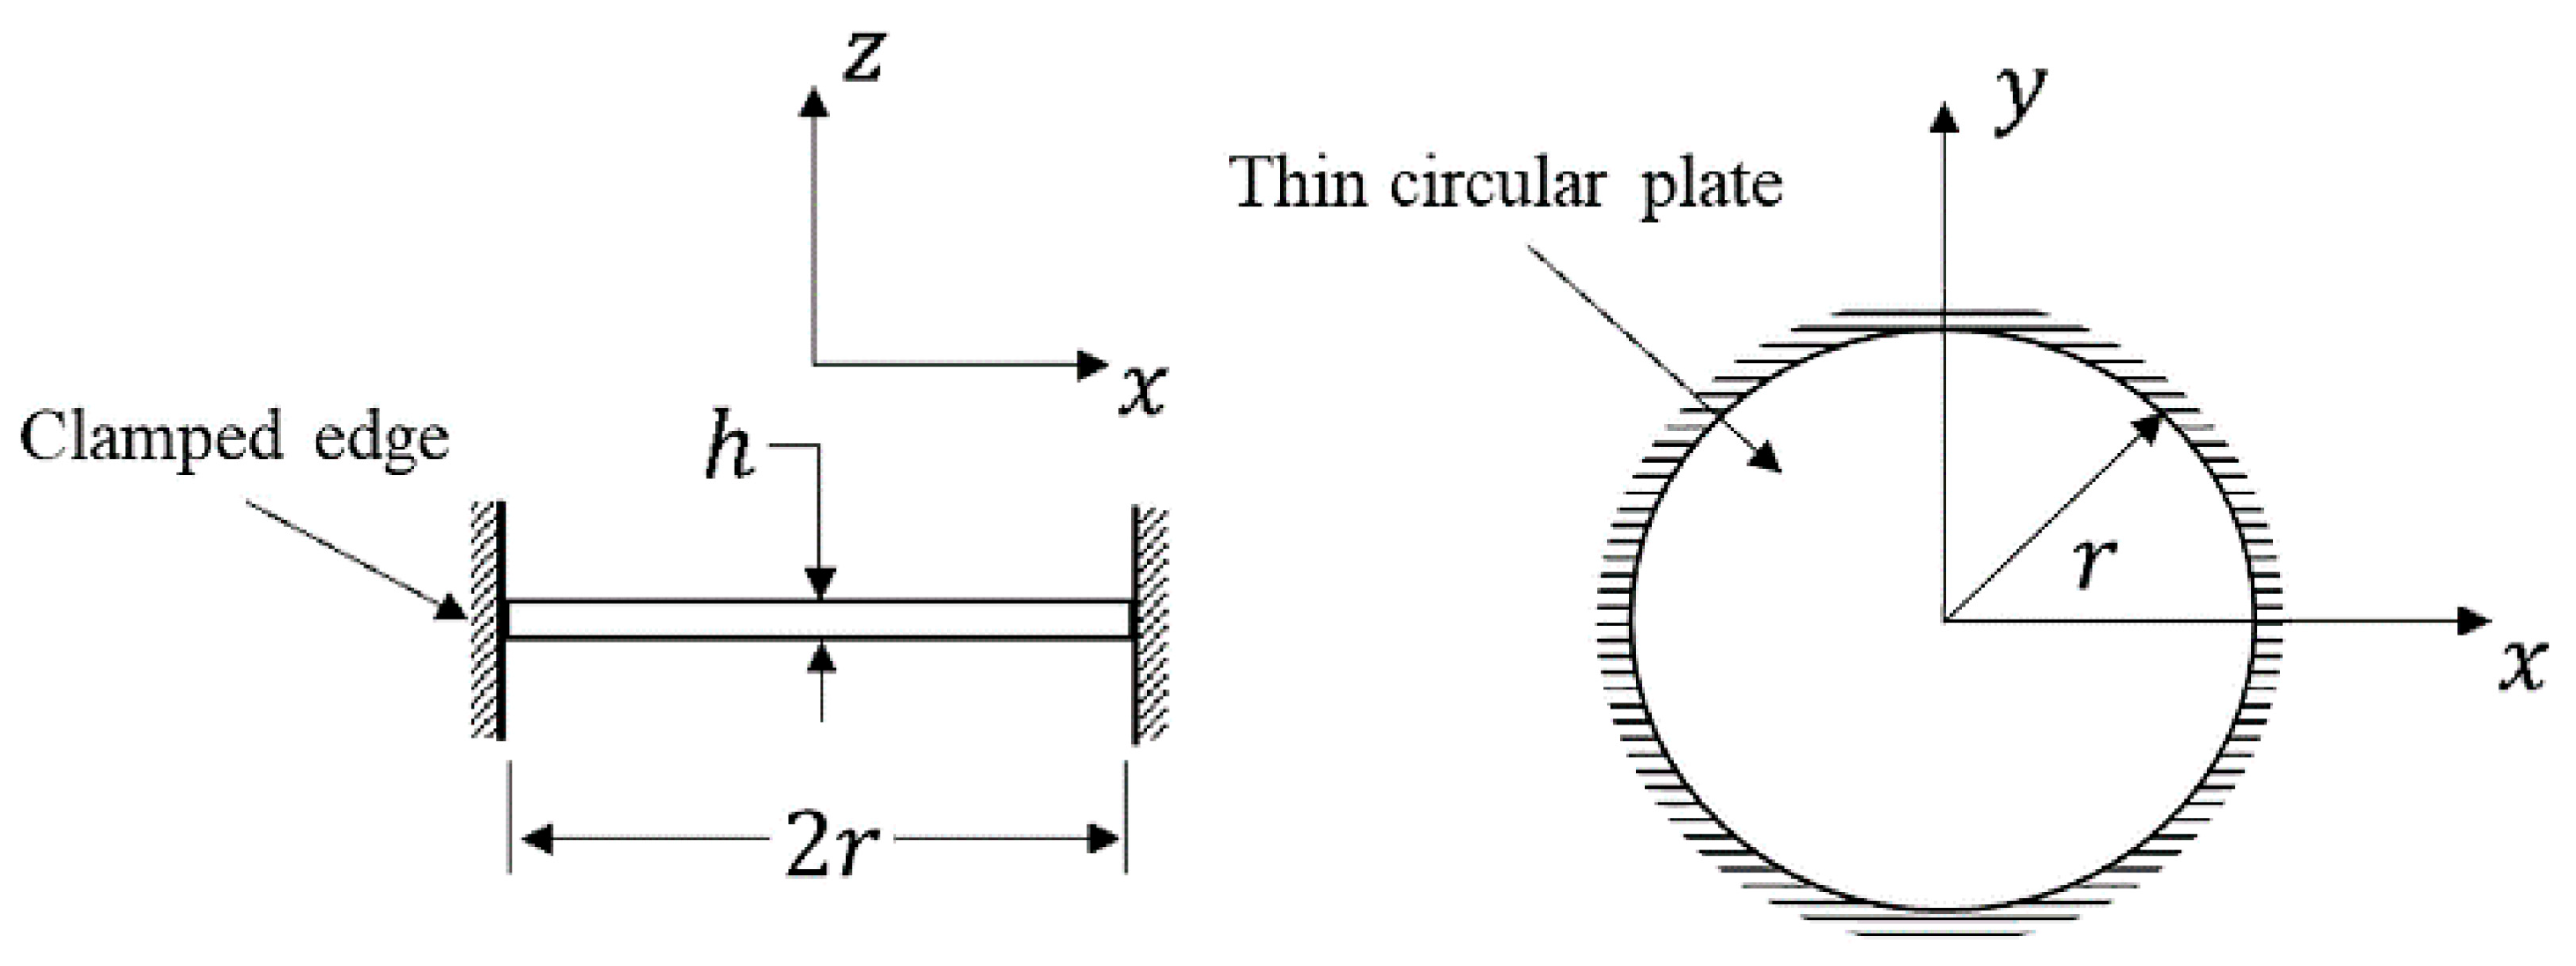
The micro-tapered aperture of the dynamic mesh atomizer is machined in the middle of the metal sheet. In addition, piezoelectric ceramics are required to be machined into a circular ring. In this section, the structure of the dynamic mesh atomizer is given, and the theoretical model of the atomizing sheet is established.

2.1. Structure

Figure 2 shows the typical structure of a dynamic mesh atomizer, which is mainly composed of an atomizing sheet, an end cap, and a liquid container. The atomizing sheet comprises the concentric adhesion of a tapered aperture metal sheet and a lead zirconate titanate (PZT) transducer ring. The vibration of the atomizing sheet is the key to realizing liquid atomization and is the core component of the whole atomizer.

2.2. Theoretical Model of the Atomizing Sheet

In the current research on the atomization mechanism of the dynamic mesh atomizer, the theory of the dynamic cone angle is reasonable. In this subsection, the dynamic cone angle is explained by a theory, and the vibration of the atomizing sheet is analyzed.

2.2.1. Atomization Theory of the Dynamic Cone Angle

During atomization, an alternating current voltage is applied to the atomizing sheet, and the PZT is stimulated by the alternating current signal to drive the metal substrate to move up and down in a reciprocating motion periodically. The angle of the tapered aperture also changes with the vibration of the atomizing sheet, and the periodic change in the angle of the tapered aperture is defined as the dynamic cone angle [28]. Taking the vibration of the atomizing sheet with a single tapered aperture in B00 mode as an example, the shape change of the tapered aperture is shown in Figure 3.
The whole vibration process is cyclic from t 1 to t 4 , and the angle of the tapered aperture α i ( i = 1 ~ 4 ) is cyclic from α 1 to α 4 . The points on the neutral surface do not move; thus, when the atomizing sheet vibrates, the points above and below the neutral surface will produce opposite changes in tension and compression. As a result, the change in the aperture of the upper and lower surfaces of the tapered aperture is the opposite. Periodic changes in the volume of the micro-tapered aperture, coupled with the difference between the forward and backward flow resistance, create a pumping effect that results in one-way flow of the liquid, resulting in atomization.

2.2.2. Vibration Analysis of the Atomizing Sheet

The structure of the tapered aperture metal sheet is a type of thin plate structure. Thus, the vibration of the atomizing sheet is used to study the forced vibration displacement response of the uniform thin plate with a small deflection under the PZT excitation.
  • Natural vibration of the circular thin plate
To better analyze the forced response of the thin plate, the natural vibration of the circular thin plate is initially analyzed. The coordinate system on the neutral surface of the plate is O x y z , and the polar coordinate system ( r , θ ) is established, as shown in Figure 4, where the displacement along the z axis is ω .
Suppose the thickness of the thin plate is h , the material density is ρ , the elastic modulus is E , and the Poisson’s ratio is μ . According to the small deflection bending theory of the elastic thin plate and based on Kirchhoff’s hypothesis, the free vibration differential equation of the thin plate is as follows [29]:
2 w t 2 + D ρ h 4 w = 0
where 4 = 2 2 = ( 2 r 2 + 1 r r + 1 r 2 2 θ 2 ) 2 is the Laplace operator and D = E h 3 12 ( 1 μ 2 ) is the bending stiffness of the plate.
Given the symmetry of the circular thin plate, Equation (1) can be written as:
w ( r , θ , t ) = R ( r ) ( S sin n θ + C cos n θ ) e i ω t
where n = 0 , 1 , 2 , represents the number of nodal diameters in the mode shape and S , C are determined by the initial conditions. Substituting Equation (2) into Equation (1) yields
( d 2 d r 2 + 1 r d d r n 2 r 2 ) R ( r ) k 4 R ( r ) = 0
where k 4 = ω 2 ρ h / D .
The general solution of Equation (3) can be obtained as
R ( r ) = A n J n ( k r ) + B n Y n ( k r ) + C n I n ( k r ) + D n K n ( k r )
where J n ( k r ) is the first-type nth-order Bessel function; Y n ( k r ) is the second-type nth-order Bessel function; I n ( k r ) is the first-type nth-order corrected Bessel function; K n ( k r ) is the second-type nth-order corrected Bessel function; and A n , B n , C n , and D n are constants to be determined.
For a circular and solid plate, B n and D n must be 0 because w and w / r at the center ( r = 0 ) must have a limited value. For a circular thin plate simply supported by its periphery, two boundary conditions exist as follows:
{ R ( a ) = 0 M r | r = a = [ d 2 R dr 2 + μ ( 1 r d R d r n 2 r 2 R ) ] | r = a = 0
where M r is the bending moment acting on the circular thin plate. By substituting Equation (5) and the condition that B n and D n are equal to zero into Equation (4), we can obtain:
{ A n J n ( k a ) + C n I n ( k a ) = 0 A n L n + C n Q n = 0
where
L n ( k a ) = [ ( 1 μ ) 2 n 2 + ( μ 1 ) n k 2 a 2 a 2 J n ( k a ) μ k a J n + 1 ( k a ) ] Q n ( k a ) = [ ( 1 μ ) 2 n 2 + ( μ 1 ) n k 2 a 2 a 2 I n ( k a ) + μ k a I n + 1 ( k a ) ]
Equation (6) is a linear system of equations concerning A n and C n . If the equation has a non-zero solution, then the determinant of its coefficients must be 0. Thus
| J n ( k a ) I n ( k a ) L n ( k a ) Q n ( k a ) | = 0
For each n , this equation has an infinite number of roots of k a = λ m n s . By substituting k a = λ m n s into k 4 = ω 2 ρ h / D , the natural frequency of the circular thin plate under the simply supported state can be obtained as follows:
ω m n s = λ m n s 2 a 2 D ρ h
where m = 0 , 1 , 2 , represents the number of the nodal circles in the mode shape, s represents the boundary conditions of the peripheral simply supported, and λ m n s is the constant of the natural frequency.
By substituting λ m n s back to the above formula, the mode shape of the circular thin plate corresponding to natural frequency ω m n s can be obtained as:
ϕ m n s ( r , θ ) = A n [ J n ( k r ) + ( J n + 1 ( λ m n s ) / I n + 1 ( λ m n s ) ) I n ( k r ) ] ( S sin n θ + C cos n θ )
  • Forced vibration displacement response of the circular thin plate
The problem of the forced vibration displacement response of the uniform plate with a small deflection under PZT excitation is analyzed. The displacement response of small deflection forced vibration w m n s ( r , θ , t ) is expressed by the normalized displacement modes of the thin plate, as shown as follows:
w m n s ( r , θ , t ) = m = 1 n = 1 ϕ m n s ( r , θ ) q m n s ( t )
where q m n s ( t ) is the generalized coordinates of ϕ m n s ( r , θ ) . ϕ m n s ( r , θ ) satisfies the orthogonal condition of the thin plate mode, shown as follows:
G ρ h ϕ m i n i s ( r , θ ) ϕ m j n j s ( r , θ ) d r d θ = { M m i n i s , i = j 0 , i j i , j = 1 , 2 , ,
where M m i n i s is the modal mass of the plate. The integral area G covers the entire board.
When the thin plate is forced to vibrate, the effective damping force on a unit area perpendicular to the surface of the thin plate is proportional to the vibration velocity. A distributed exciting force f ( r , θ , t ) = F ( r , θ ) e i ω t with frequency ω m n s is applied to the uniform plate. Then the differential equation that the generalized coordinate q m n s ( t ) should satisfy is:
M m n s q ¨ m n s + C m n s q ˙ m n s + K m n s q m n s = F m n s e i ω t
where M m n s , C m n s , K m n s , and F m n s are the modal mass, modal damping, modal stiffness and modal force, respectively.
According to Equation (12), the steady-state forced response of the uniform thin plate under PZT element excitation is:
w m n s ( r , θ , t ) = m = 1 n = 1 F m n s ϕ m n s ( r , θ ) e i ( ω t φ m n s ) / [ K m n s ( 1 ϖ m n s 2 ) 2 + ( 2 ζ m n s ϖ m n s ) 2 ]
where ϖ m n s = ω / ω m n s is the frequency ratio, which is the ratio of the excitation frequency ω to the system natural frequency ω m n s , ζ m n s = C / 2 M m n s ω m n s is the relative damping coefficient of the system, and φ m n s = arctan ( 2 ζ m n s ϖ m n s ) / ( 1 ϖ m n s 2 ) is the steady-state displacement response hysteretic phase angle of the excitation force.
According to Reference [29], the functions ω m n f and w m n f ( r , θ , t ) under the condition of peripheral fixed support are consistent with those under the peripheral simply supported, as shown in Equation (9) and Equation (13), respectively, except for the mode function ϕ m n f ( r , θ ) , which is:
ϕ m n f ( r , θ ) = A n [ J n ( k r ) ( J n ( λ m n f ) / I n ( λ m n f ) ) I n ( k r ) ] ( S sin n θ + C cos n θ )
where the subscript f represents the boundary conditions of the peripheral fixed support.

3. Setting of the Boundary Conditions

3.1. Boundary Setting in the Original Paper

In Reference [27], the first error is that the boundary conditions were set as peripheral fixed support when FE simulation was performed on the atomizing sheet.
Figure 5 (Figure 3 in the original paper [27]) shows the setting of the boundary conditions during the FE analysis of the circular thin plate in the original paper. From the figure, the degree of freedom of the circular thin plate is 0, and it cannot move in the x , y , and z directions, which belongs to the support mode of peripheral fixation.
In addition, Figure 6 is a screenshot of Table 1 in Appendix A of the original paper [27]. It clearly indicates that in the FE analysis, the boundary constraint conditions for the thin plates were set as u x = u y = u z = 0 , confirming that the atomizing sheet model was fixed in the peripheral support.
However, the support mode of the peripheral support is inconsistent with the actual situation. In practical applications, the edge of the atomizing sheet is adhered to the piezoelectric ceramic ring, and they are placed together in the elastic rubber ring. Finally, the atomizing sheet, rubber ring, and piezoelectric ceramic are fixed by the clamping device, as shown in Figure 7. Figure 7a,b shows the schematic and photo of the actual support mode of the atomizing sheet, respectively.
Given the peripheral fixation in Reference [27], the edge of the atomizing sheet should have zero degrees of freedom. However, in the actual situation, it can move in the x , y , and z directions because it is placed in an elastic rubber ring. The atomizing sheet is an important part of the vibration transmission. When the degree of freedom is 0, the vibration cannot be transmitted and the whole device cannot operate. Therefore, the boundary conditions set as the peripheral fixed support in the simulation setting by Esteban Guerra-Bravo et al. are inappropriate.

3.2. The Boundary Setting in the Actual Support Mode

The actual support mode of the atomizing sheet is set to be peripheral simply supported in this paper. To demonstrate the rationality, the boundary setting situations from the existing literature are determined, and the atomization experiments under the peripheral simply supported and the peripheral fixed support are implemented.

3.2.1. Boundary Conditions in the Literature

In the research on piezoelectric atomization mechanisms, the boundary conditions of the atomizing sheet are set as follows:
  • Jiang et al. set the boundary as the free boundary condition when conducting the FE analysis of the atomizing sheet [30];
  • Yan et al. set the boundary condition as free movement in a certain space range along the x -axis when analyzing the vibration of the piezoelectric atomizing sheet [31].
According to the data provided in the Reference [31], the supporting mode of the atomizing sheet was drawn, as shown in Figure 8. Figure 8a–c represents the peripheral simply supported (without sealant), peripheral simply supported (with sealant), and elastic support, respectively, and the three support modes have 2, 1, and 4 degrees of freedom, respectively. The supporting mode in Figure 8b is waterproof glue wrapped on the atomizing sheet, which not only ensures the tightness but also conforms to the actual situation. Finally, the supporting mode in Figure 8b was selected by Yan et al.
According to the above literature, the boundary conditions of the atomizing sheet should be set as freedom greater than or equal to 1. In other words, it should be set as free boundary or peripheral simply supported, and the latter is more suitable for the actual situation. Therefore, Esteban Guerra-Bravo et al.’s setting of the boundary condition of the atomizing sheet as fixed support is inappropriate and inconsistent with the actual situation.

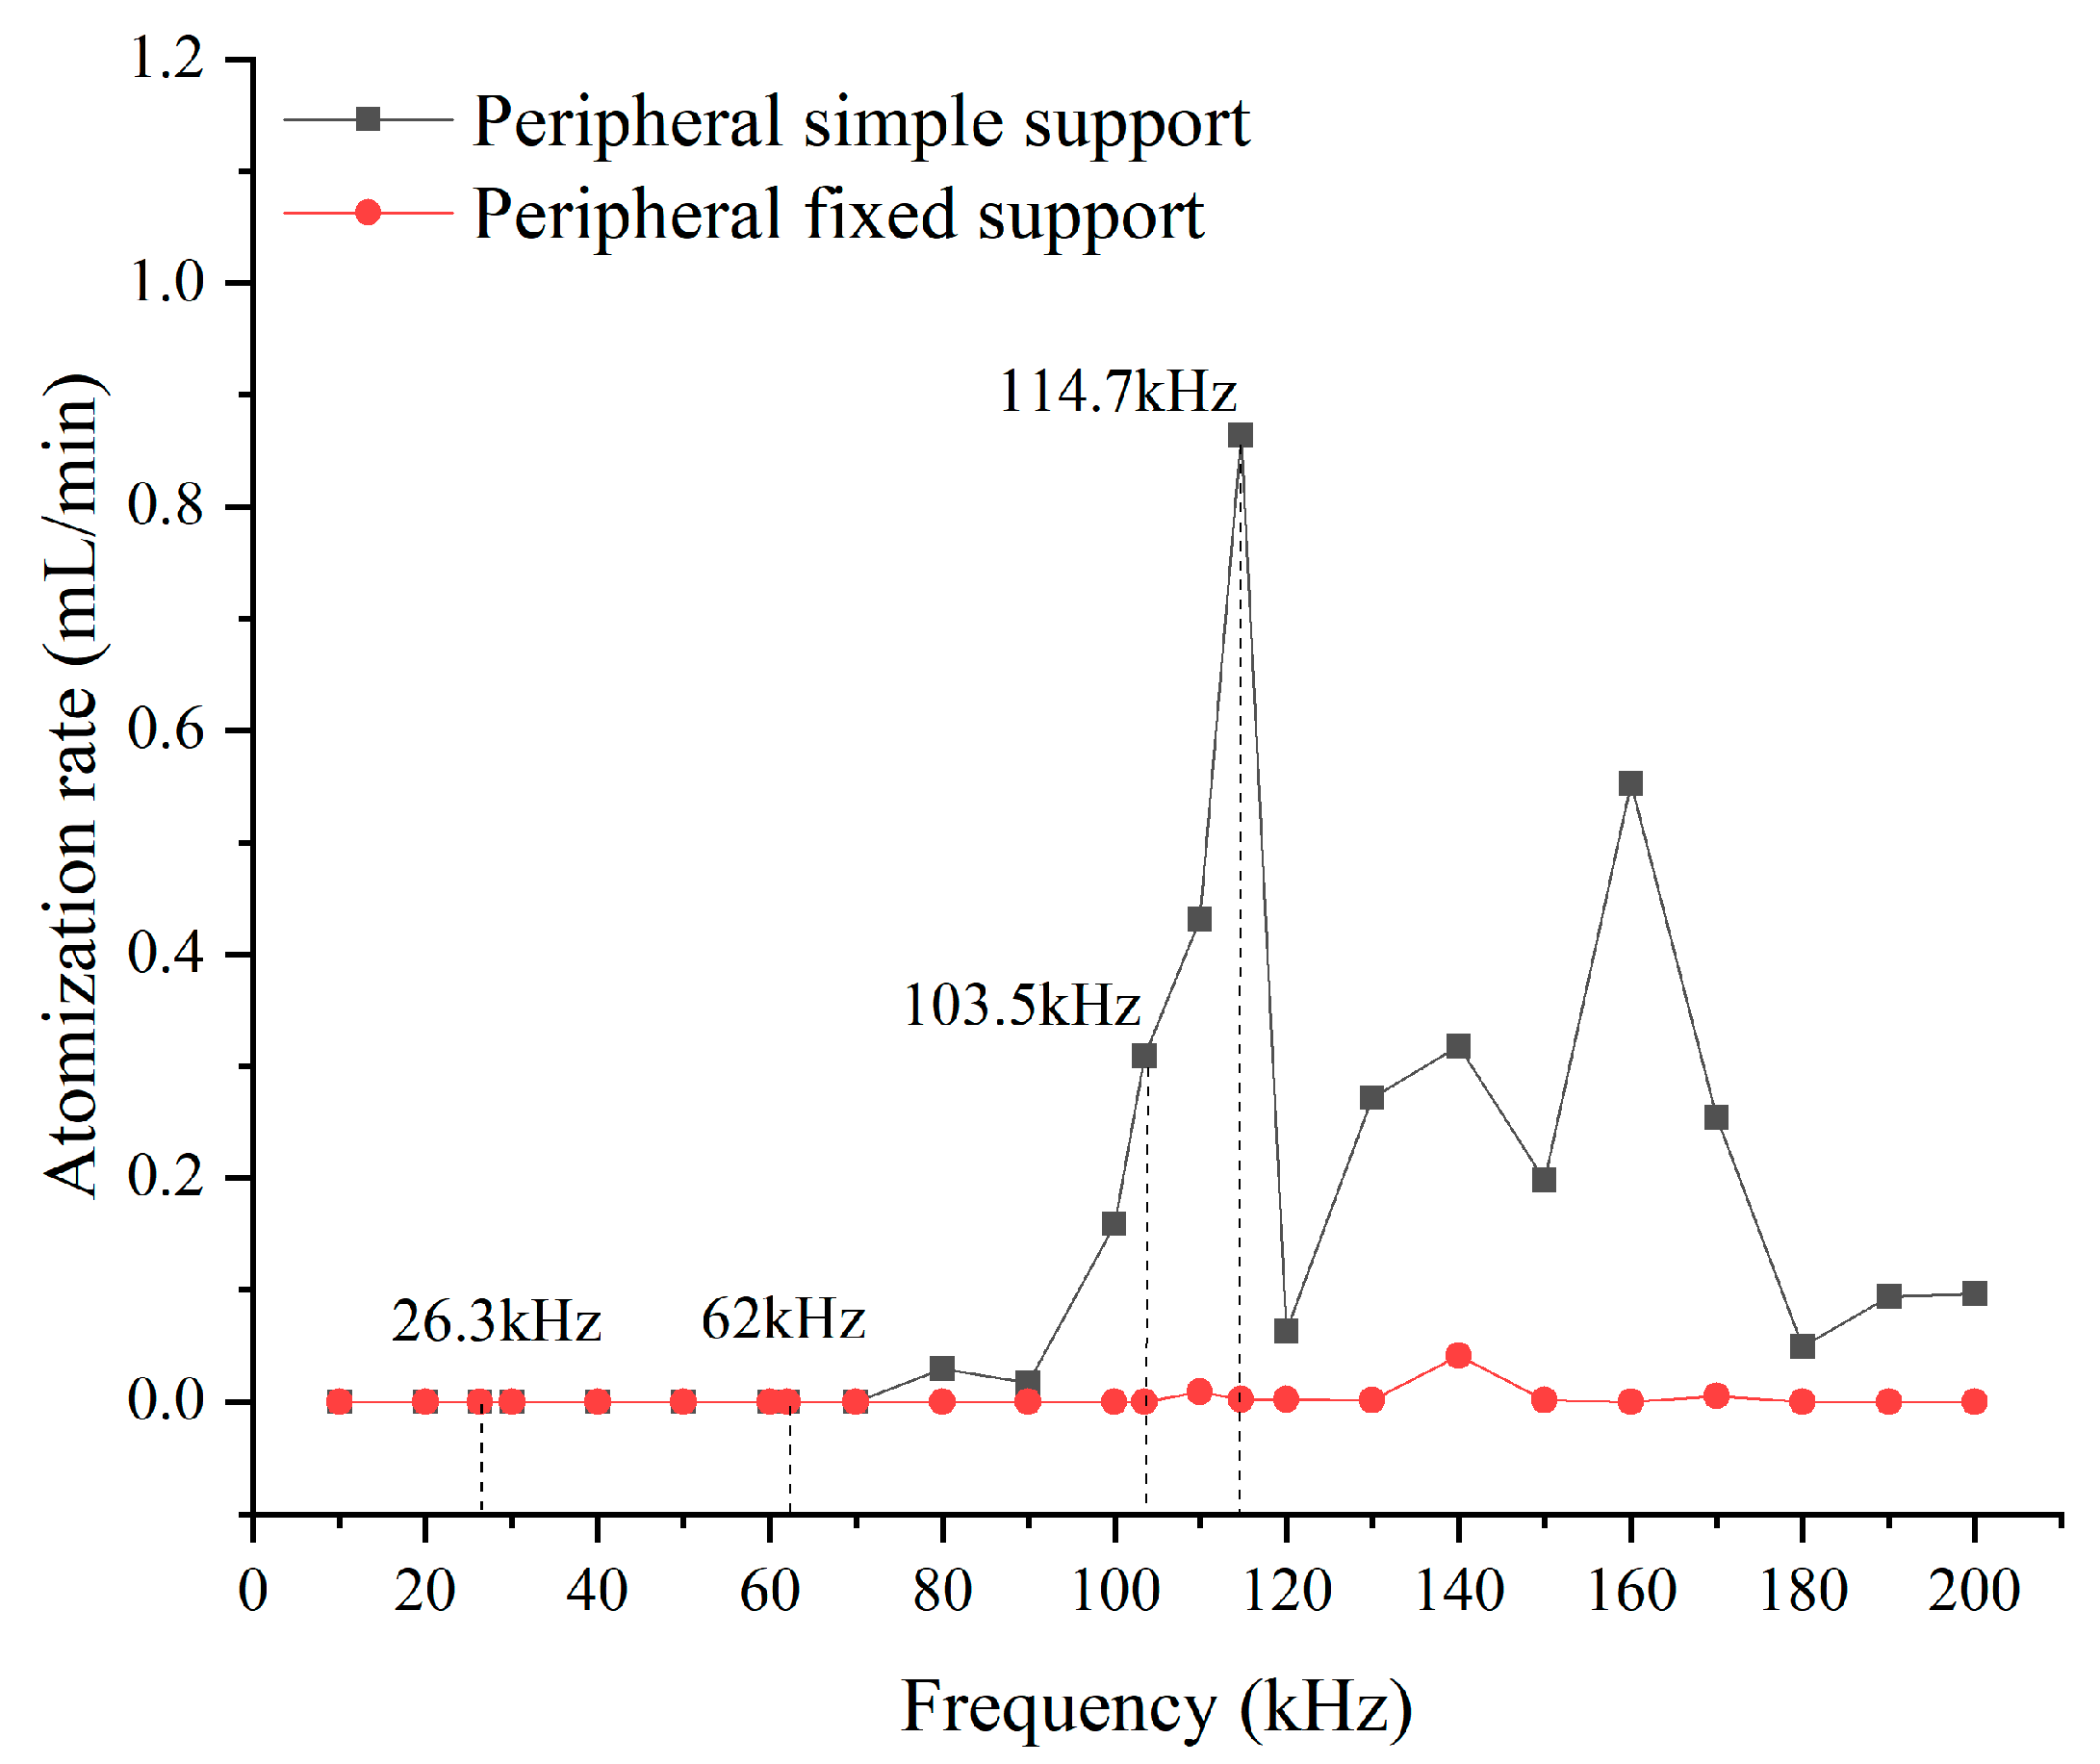
3.2.2. Atomization Experiments of Different Boundary Conditions

To further verify that the degree of freedom at the boundary of the atomizing sheet must be greater than or equal to 1, the atomization rate of the atomizing sheet under different resonant frequencies is measured under peripheral fixed support and peripheral simply supported. In this paper, the peripheral fixed support mode is simulated by using the epoxy adhesive to fix the atomizing sheet onto the clamping device. The peripheral simply supported mode is simulated by using the rubber ring and the atomizing sheet coated with waterproof glue to install it on the clamping device.
The frequency sweep experiment of the atomizing sheet mounted on the clamping device is implemented by the precision impedance analyzer (LCR Meter 6630, MICROTEST, New Taipei City, Taiwan) to determine each resonant frequency. The frequency range is 10–200 kHz, and the experimental setup is shown in Figure 9.
As shown in Figure 9, the resonant frequencies of the first several orders of the atomizing sheet are 22.5, 62, 110.5, and 160 kHz under peripheral simply supported. Under peripheral fixed support, the first several resonant frequencies are 26.3, 62, 103.5, and 114.7 kHz. In this paper, to verify whether the atomizer can atomize when the degree of freedom is 0, the resonant frequencies obtained by the sweeping frequency in the peripheral fixed support mode are used for the atomization experiments. The setup of the atomization rate experiment system is shown in Figure 10.
During the experiment, the driving frequency is swept from 10 kHz to 200 kHz, with an interval of 10 kHz, and the effective value of the driving voltage is set to be 80 V at different driving frequencies. The atomization rates of the atomizing sheet with peripheral fixed support and peripheral simply supported are shown as the red and black curves in Figure 11, respectively.
As shown in Figure 11, by using the peripheral simply supported condition to fabricate the atomizing sheet, the atomization rate can achieve two peaks of 0.862 mL/min and 0.553 mL/min at 114.7 kHz and 160 kHz, respectively. However, the atomization rate is almost 0 at each driving frequency under the peripheral fixed support condition. Only at 140 kHz will the atomization rate be 0.04 mL/min, accounting for 4.6% of the peripheral simply supported.
The experimental results show that the atomization rate under peripheral simply supported is consistent with the actual application. This finding further proves that the degree of freedom of the atomizing sheet boundary should not be 0. Therefore, the boundary conditions of the thin plate in the FE analysis of the atomizing sheet, set by Esteban Guerra-Bravo et al., is inappropriate, which violates the actual support situation and leads to the corresponding unreasonable simulation results.

4. Vibration Displacement of the Atomizing Sheet

4.1. Vibration Displacement of the Atomizing Sheet in the Original Paper

The second error in the original paper is that the maximum positive displacement at the center of the atomizing sheet increased with the resonant frequency when the vibration mode of the atomizing sheet only had nodal circles.
The FE analysis results of the atomizing sheet adhesive with a PZT ring driving by the sweep frequencies with 80 V was published, as shown in Figure 12 (Table 3 in Section 3 in the original paper [27]). The first five vibration modes are listed in the original table, where the subscript s indicates that the mode was identified as axisymmetric, that is, the atomizing sheet vibration modes only have nodal circles.
As shown in Figure 12, the maximum positive displacement increases with the modes. The growth rate of the displacement varies with the modes, as shown in Figure 13. The growth rate of the displacement is expressed as ( Q i Q i 1 ) / Q i 1 × 100 % , where i = 2 , 3 , 4 represents the symmetric modes. The growth rate of the displacement is 77.12% ( i = 2 ), 221.05% ( i = 3 ), 15.65% ( i = 4 ), and 209.28% ( i = 5 ). From the first mode to the third mode, the growth rate of the maximum displacement is as high as 77.12%, even up to 221.05%. However, the simulation results are not consistent with the existing theories. According to the existing theory, with the increase in the resonant frequency, the maximum positive displacement of the atomizing sheet center gradually decreases [23,30,32].

4.2. Vibration Displacement of the Atomizing Sheet in the Existing Theory

To further verify the error in the simulation conclusions in the original paper, this section compares the existing research data of other scholars, and the vibration theory of the atomizing sheet is used to draw vibration displacement diagrams at different resonant frequencies for analysis and demonstration. Vibration displacement measurement experiments are also implemented.

4.2.1. Conclusions in the Literature

In the literature on piezoelectric atomization mechanisms, the vibration displacement at the center of the atomizing sheet is analyzed as follows:
1.
The harmonic response at the center point of the atomizing sheet was analyzed by Jiang et al. using FE software [30]. According to the data provided in Reference [30], the harmonic response curves of the center point within the range of four resonant frequencies are drawn, as shown in Figure 14. The peak frequencies of curves corresponding to Figure 14a–d are 29.5, 70.8, 118.4, and 152.2 kHz and the amplitudes correspond to 145, 87, 39, and 12 μm, respectively. The amplitude decreases as the frequency increases.
2.
The vibration characteristics of the atomizer were measured by Cai et al. using a POLYTEC PSV-300F laser vibrator [32]. According to the data provided in Reference [32], the vibration velocity of the atomizing sheet at 5–200 kHz was plotted. The vibration modes at different resonance points were marked in the figure, as shown in Figure 15. From the figure, with the increase in the resonant frequency, the vibration modes of the atomizing sheet become increasingly complex, whereas the vibration velocity decreases gradually at first, increases gradually after 50 kHz, and decreases gradually after 100 kHz. The change in the vibration amplitude is basically consistent with the vibration velocity. In this paper, the irregular fluctuation in the atomizing sheet amplitude was due to the presence of the nodal diameter in the vibration mode.
3.
The velocity and amplitude curves of the atomizing sheet were obtained by Yan et al. using a Polytech PSV-300F-B laser vibrometer [23]. The frequency sweep curves of vibration velocity and vibration amplitude, the vibration modes of the resonance points, and the atomization rates at the resonance points are shown in Figure 16. The amplitude can achieve peaks at all resonant frequencies, especially the maximum amplitude at 15.9 kHz, but it then decreases with the increase in the frequency.
According to the above literature, the maximum value of the vibration displacement at the center of the atomizing sheet gradually decreases with the increase in the resonant frequency. However, the conclusions of the original paper are inconsistent with these experimental results.

4.2.2. Vibration Theory of the Atomizing Sheet

According to the research content in Section 3, the first several modes of resonant frequency (including the node diameter) are theoretically analyzed in this section when two boundary conditions are set.
According to Reference [29], when the frequency ratio is ϖ m n = 1 , the circular thin plate enters the nth-order resonance state. In period T, when t = T / 4 , the vibration displacement of each point on the circular thin plate reaches the maximum value, which is:
w m n ( r , θ , T / 4 ) = m = 1 n = 1 F m n ϕ m n ( r , θ ) / [ K m n ( 1 ϖ m n 2 ) 2 + ( 2 ζ m n ϖ m n ) 2 ]
Equation (15) can be applied to peripheral fixed support and peripheral simply supported.
The relevant parameters of the atomizing sheet studied in this paper are shown in Table 1. The natural frequency constants, parameters, and mode functions of the circular thin plates under different boundary conditions are substituted into Equation (15). Then, r = 0 : 0.1 : a and θ = ( 0 : 0.02 : 2 ) × π are set, and the maximum vibration displacement of the atomizing sheet w m n max ( r , θ , T / 4 ) under this vibration mode is obtained using MATLAB software for numerical calculation, as shown in Figure 17. The maximum vibration displacement of the first several-order vibration modes when the atomizing sheet with peripheral fixed support and peripheral simply supported are shown as the red and black solid lines, respectively. When the vibration mode only has nodal circles, the vibration displacement is marked with dotted lines. The resonant frequency corresponds to the vibration mode one by one. The vibration mode is from B00 to B15, and the resonant frequency also increases. The specific value can be obtained from Equation (8), which is: ω m n s = λ m n s 2 a 2 D ρ h .
As shown in Figure 17, the maximum vibration displacement of the atomizing sheet fluctuates with the increase in the resonant frequency under any boundary conditions. When the vibration mode only has the nodal circle, with the increase in the resonant frequency, the maximum vibration displacement is only 0.98%, which is a slight increase under the condition of peripheral simply supported, and only 0.27% under the condition of peripheral fixed support. However, the maximum positive displacement in the original paper increases by 77.12% and even reaches 221.05%, which is unreasonable.

4.2.3. Vibration Displacement Experiment on the Atomizing Sheet

The vibration displacement and vibration modes of the atomizing sheet at different driving frequencies were measured using a three-dimensional Doppler laser vibrator (LV-FS01, SOPTOP, Hangzhou, China). The experimental setup is shown in Figure 18. The entire disc is divided into 41 concentric circles, represented by r k , where k = 1 , 2 , , 41 . Each concentric circle is evenly divided into six sectors, and the polar angle is denoted by θ l , where l = 1 , 2 , , 6 . Measurements are mainly made at the intersection of the concentric circles and sector radius (denoted by P k , l ) and at the central position O. Therefore, the vibration displacement at these 247 locations was measured experimentally. The driving frequency of each position was swept from 0 kHz to 200 kHz, and the effective value of voltage was set to 80 V.
When only the nodal circle exists in the vibration mode, the maximum value of vibration displacement of the thin plate is located at its center position O. What is studied in Reference [27] is the variation in the maximum vibration displacement of the thin plate with the resonant frequencies when the vibration modes only have nodal circles. Therefore, the vibration displacement measurement results at point O under different driving frequencies are shown for comparison in Figure 19.
As shown in Figure 19, the vibration displacement achieves peaks at 20, 56.6, 103.5, and 170 kHz, as indicated by the blue circles. To explore the vibration modes of the atomizing sheet at these resonant frequencies, the distribution of the vibration displacement of the atomizing sheet was measured.
When the driving frequency is 20 kHz, the vibration displacement of the atomizing sheet at point O reaches the maximum, which is 3.7903 μm, as shown in Figure 20. Figure 20 shows only the vibration displacement at point O and several scanning points at the 30th concentric circle.
The vibration displacement at other resonant frequencies is also measured. The distribution of vibration displacement corresponding to different resonant frequencies is shown in Figure 21.
According to the displacement distribution, the atomizing sheet has B00, B10, B12, B20, and B30 vibration modes at 20, 26.3, 56.6, 103.5, and 170 kHz, respectively.
On the basis of the analysis in Figure 19 and Figure 21, the maximum displacement of the atomizing sheet initially decreases and then increases slowly with the increase in the number of nodal circles. This finding is consistent with the simulation results obtained using MATLAB software.

5. Conclusions

In this study, two errors were found in the Vibration Analysis of a Piezoelectric Ultrasonic Atomizer to Control Atomization Rate:
  • In the simulation of the vibration displacement of the micro-porous piezoelectric atomizing sheet, the support mode of the atomizing sheet was set as peripheral fixed support.
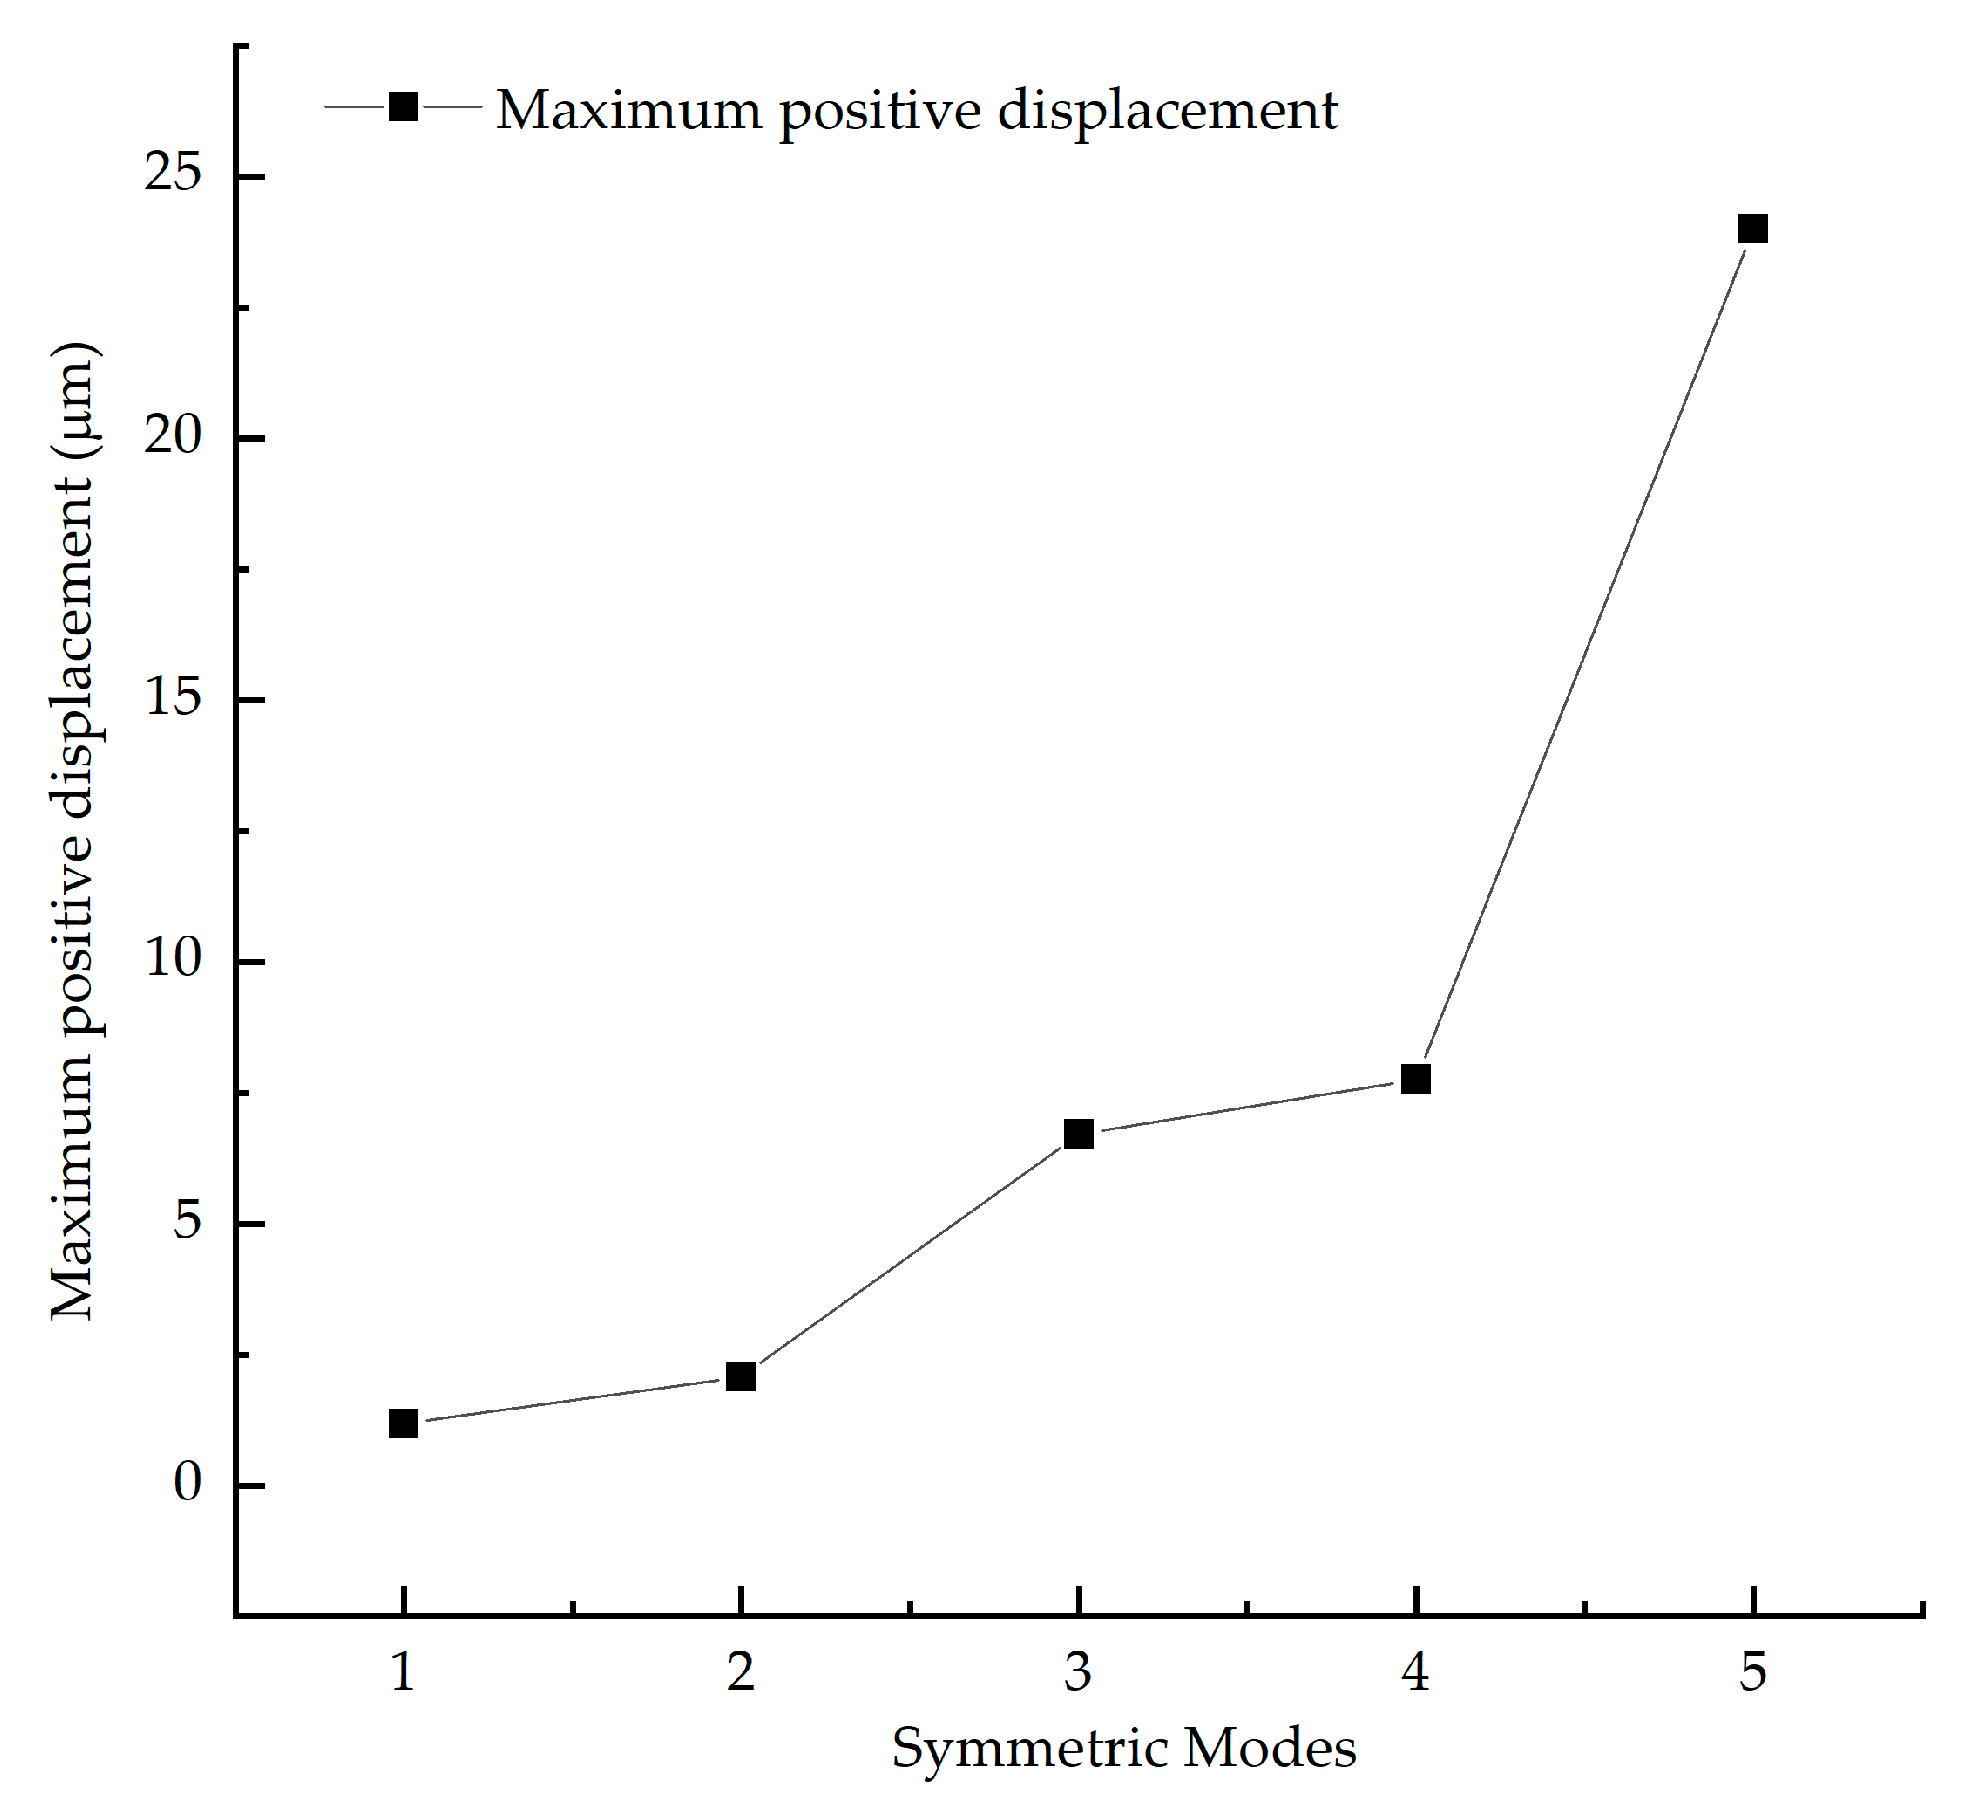
  • In the simulation results of the vibration displacement, with the increase in the number of nodal circles, the maximum displacement increased at a rate of 77.12%, and even reached 221.05%.
In view of these errors, this paper conducted a theoretical analysis and experimental verification and proposes the following:
  • In the simulation, the support mode of the piezoelectric micro-tapered aperture atomizing sheet should ensure that the degree of freedom is greater than or equal to 1, namely, peripheral freedom or peripheral simply supported, and the latter is more consistent with the actual situation.
  • The vibration displacement of the atomizing sheet is related to the mode. When the mode only has the nodal circle, the maximum displacement is larger than the other modes. Moreover, with the increase in the number of nodal circles, the maximum displacement has a small increase, about 0.27% under the condition of peripheral fixed support and about 0.98% under the condition of peripheral simply supported.
Through theoretical analysis and experimental verification, the boundary conditions that are consistent between the simulation and practice of the atomizing sheet are determined, and the vibration displacement characteristics of the atomizing sheet under different vibration modes are explored. The determination of these basic problems ensures the correlation between the FE analysis and the experimental results and provides a reliable basis for the subsequent research on the influence of the vibration characteristics of the atomizing sheet on the atomizing performance. In practical application, the research results contribute to exploring the driving voltage, driving frequency, and structure parameters of micro-tapered apertures and other factors that affect the atomization performance and further optimizing the dynamic mesh atomizer.

Author Contributions

F.Z.: analysis, validation, and writing—original draft preparation; B.-C.C.: data curation; Z.-Z.G.: writing—review and editing; J.-H.Z.: conceptualization, resources, and supervision; X.H., J.-L.L. and Y.-H.Z.: software; T.T., T.X., Y.-X.W. and J.-L.W.: investigation. All authors have read and agreed to the published version of the manuscript.

Funding

This research was funded by the National Natural Science Foundation of China (NSFC), grant number 51705093; the Guangdong Basic and Applied Basic Research Foundation, grant number 2019B1515120017; Guangdong Basic and Applied Basic Research, grant number 2020A1515110619; the Science and Technology Program of Guangzhou, grant number 202201020158; the Graduate-Ability-Promotion Plan of Guangzhou University, grant number 2022GDJC-M22; and the Graduate-Ability-Promotion Plan of Guangzhou University, grant number 2022GDJC-M21.

Institutional Review Board Statement

Not applicable.

Informed Consent Statement

Not applicable.

Data Availability Statement

Not applicable.

Conflicts of Interest

The authors declare no conflict of interest.

Nomenclature

w Displacement
h Thickness
ρ Density
E Elastic modulus
μ Poisson’s ratio
K Modal stiffness
ω Excitation frequency
φ Phase angle
S , T Initial conditions
A n , B n , C n , D n Constants
f , F Exciting force
C Modal damping
M Bending moment
λ Natural frequency constant
ω m n The natural frequencies of different modes
ϕ ( r , θ ) Mode function
( r , θ ) Polar coordinates
D Bending stiffness
a Radius
r Radius
R Radius
m Mass
k k 4 = ω 2 ρ h / D
ζ Relative damping coefficient
ϕ ( r , θ ) Mode function
( r , θ ) Polar coordinates
J ( k r ) , Y ( k r ) , I ( k r ) , K ( k r ) Bessel function
Subscript
n Number of node diameters
m Number of node circles
k Concentric circles
l Sector

References

  1. Ghazanfari, T.; Elhissi, A.M.A.; Ding, Z.; Taylor, K.M.G. The influence of fluid physicochemical properties on vibrating-mesh nebulization. Int. J. Pharm. 2007, 339, 103–111. [Google Scholar] [CrossRef]
  2. Pan, C.T.; Shiea, J.; Shen, S.C. Fabrication of an integrated piezo-electric micro-nebulizer for biochemical sample analysis. J. MicroMech. MicroEng. 2007, 17, 659–669. [Google Scholar] [CrossRef]
  3. Ari, A.; Atalay, O.T.; Harwood, R.; Sheard, M.M.; Aljamhan, E.A.; Fink, J.B. Influence of Nebulizer Type, Position, and Bias Flow on Aerosol Drug Delivery in Simulated Pediatric and Adult Lung Models during Mechanical Ventilation. Respir. Care 2010, 55, 845–851. [Google Scholar]
  4. Pritchard, J.N.; Hatley, R.H.M.; Denyer, J.; von Hollen, D. Mesh nebulizers have become the first choice for new nebulized pharmaceutical drug developments. Ther. Deliv. 2018, 9, 121–136. [Google Scholar] [CrossRef]
  5. Ari, A.; Harwood, R.; Sheard, M.; Alquaimi, M.M.; Alhamad, B.; Fink, J.B. Quantifying Aerosol Delivery in Simulated Spontaneously Breathing Patients with Tracheostomy Using Different Humidification Systems with or without Exhaled Humidity. Respir. Care 2016, 61, 600–606. [Google Scholar] [CrossRef]
  6. Chen, H.; Cheng, W.L.; Peng, Y.H.; Zhang, W.W.; Jiang, L.J. Experimental study on optimal spray parameters of piezoelectric atomizer based spray cooling. Int. J. Heat Mass Transf. 2016, 103, 57–65. [Google Scholar] [CrossRef]
  7. He, W.; Luo, Z.B.; Deng, X.; Xia, Z.X. A novel spray cooling device based on a dual synthetic jet actuator integrated with a piezoelectric atomizer. Heat Mass Transf. 2020, 56, 1551–1563. [Google Scholar] [CrossRef]
  8. Law, J.; Kong, K.W.; Chan, H.Y.; Sun, W.; Li, W.J.; Chau, E.B.F.; Chan, G.K.M. Atomization of High-Viscosity Fluids for Aromatherapy Using Micro-heaters for Heterogeneous Bubble Nucleation. Sci. Rep. 2017, 7, 40289. [Google Scholar] [CrossRef]
  9. Waghule, T.; Singhvi, G.; Dubey, S.K.; Pandey, M.M.; Gupta, G.; Singh, M.; Dua, K. Microneedles: A smart approach and increasing potential for transdermal drug delivery system. Biomed. Pharmacother. 2019, 109, 1249–1258. [Google Scholar] [CrossRef]
  10. Olszewski, O.Z.; MacLoughlin, R.; Blake, A.; O’Neill, M.; Mathewson, A.; Jackson, N. A silicon-based MEMS vibrating mesh nebulizer for inhaled drug delivery. Procedia Eng. 2016, 168, 1521–1524. [Google Scholar] [CrossRef]
  11. Maehara, N.; Ueha, S.; Mori, E. Influence of the vibrating system of a multipinhole-plate ultrasonic nebulizer on its performance. Rev. Sci. Instrum. 1986, 57, 2870–2876. [Google Scholar] [CrossRef]
  12. Toda, K.; Akimura, Y. An ultrasonic atomizing device using coupled-mode vibration. Rev. Sci. Instrum. 1994, 65, 3276–3278. [Google Scholar] [CrossRef]
  13. Toda, K.; Ishii, J. Operation performance of self-oscillation ultrasonic vibrating device for liquid atomization. Jpn. J. Appl. Phys. 1995, 34, 5332–5334. [Google Scholar] [CrossRef]
  14. Percin, G.; Khuri-Yakub, B.T. Piezoelectrically actuated flextensional micromachined ultrasound droplet ejectors. IEEE Trans. Ultrason. Ferroelectr. Freq. Control 2002, 49, 756–766. [Google Scholar] [CrossRef]
  15. Percin, G.; Khuri-Yakub, B.T. Micromachined droplet ejector arrays for controlled ink-jet printing and deposition. Rev. Sci. Instrum. 2002, 73, 2193–2196. [Google Scholar] [CrossRef]
  16. Percin, G.; Khuri-Yakub, B.T. Piezoelectric droplet ejector for ink-jet printing of fluids and solid particles. Rev. Sci. Instrum. 2003, 74, 1120–1127. [Google Scholar] [CrossRef]
  17. Percin, G.; Levin, L.; KhuriYakub, B.T. Piezoelectrically actuated transducer and droplet ejector. In Proceedings of the IEEE Ultrasonic Symposium, San Antonio, TX, USA, 3–6 November 1996. [Google Scholar]
  18. Percin, G.; Lundgren, T.S.; Khuri-Yakub, B.T. Controlled ink-jet printing and deposition of organic polymers and solid particles. Appl. Phys. Lett. 1999, 74, 1498. [Google Scholar] [CrossRef]
  19. Shen, S.C. A new cymbal-shaped high power microactuator for nebulizer application. Microelectron. Eng. 2010, 87, 89–97. [Google Scholar] [CrossRef]
  20. Jiang, F.; Zhang, J.-H. Experimental research on ultrasonic atomization performance. In Proceedings of the Symposium on Piezoelectricity, Acoustic Waves, and Device Applications (SPAWDA), Beijing, China, 30 October–2 November 2014; pp. 150–153. [Google Scholar]
  21. Cai, Y.; Zhang, J.; Zhu, C.; Huang, J.; Jiang, F. Theoretical Calculations and Experimental Verification for the Pumping Effect Caused by the Dynamic Micro-tapered Angle. Chin. J. Mech. Eng. 2016, 29, 615–623. [Google Scholar] [CrossRef]
  22. Yan, Q.; Sun, W.; Zhang, J. Study on the Influencing Factors of the Atomization Rate in a Piezoceramic Vibrating Mesh Atomizer. Appl. Sci. Basel 2020, 10, 2422. [Google Scholar] [CrossRef]
  23. Yan, Q.; Zhang, J.; Huang, J.; Wang, Y. The Effect of Vibration Characteristics on the Atomization Rate in a Micro-Tapered Aperture Atomizer. Sensors 2018, 18, 934. [Google Scholar] [CrossRef]
  24. Zhang, J.; Yan, Q.; Huang, J.; Wu, C. Experimental Verification of the Pumping Effect Caused by the Micro-Tapered Hole in a Piezoelectric Atomizer. Sensors 2018, 18, 2311. [Google Scholar] [CrossRef]
  25. Fossat, P.; Ichchou, M.; Bareille, O. Analytical model of the dynamic behavior of a vibrating mesh nebulizer for optimal atomization efficiency. Sens. Actuators A-Phys. 2022, 343, 113646. [Google Scholar] [CrossRef]
  26. Sharma, P.; Jackson, N. Vibration analysis of MEMS vibrating mesh atomizer. J. MicroMech. MicroEng. 2022, 32, 065007. [Google Scholar] [CrossRef]
  27. Guerra-Bravo, E.; Lee, H.-J.; Baltazar, A.; Loh, K.J. Vibration Analysis of a Piezoelectric Ultrasonic Atomizer to Control Atomization Rate. Appl. Sci. 2021, 11, 8350. [Google Scholar] [CrossRef]
  28. Zhang, J.-H.; Yan, Q.; Sun, W. Advances in Piezoelectric Atomizers. Trans. Nanjing Univ. Aeronaut. Astronaut. 2020, 37, 54–69. [Google Scholar]
  29. Zhao, C. Fundamentals of Vibration for Ultrasonic Motors. In Ultrasonic Motors: Technologies and Applications; Springer: Berlin/Heidelberg, Germany, 2010; pp. 76–117. [Google Scholar] [CrossRef]
  30. Jiang, F. Research on the Piezoelectric Ultrasonic Nebulizer. Master’s Thesis, Nanjing University of Aeronautics and Astronautics, Nanjing, China, 2014. [Google Scholar]
  31. Yan, Q. Research on Atomization Mechanism and Influencing Factors of Piezoelectric Micro-tapered Apertures. Ph.D. Thesis, Nanjing University of Aeronautics and Astronautics, Nanjing, China, 2019. [Google Scholar]
  32. Cai, Y. The Principle and Cooling Application of the Atomizer with Vibrating Micro Tapered Apertures. Ph.D. Thesis, Nanjing University of Aeronautics and Astronautics, Nanjing, China, 2015. [Google Scholar]
Figure 1. The working flow chart of the paper.
Applsci 13 06293 g001
Figure 2. Structural diagram of the dynamic mesh atomizer.
Applsci 13 06293 g002
Figure 3. Change process of the micro-tapered aperture in the atomizer.
Applsci 13 06293 g003
Figure 4. Atomizing sheet model and coordinate system.
Applsci 13 06293 g004
Figure 5. Clamped circular plate used in the FE method study in the original paper [27].
Applsci 13 06293 g005
Figure 6. Screenshot of the FE analysis steps in Appendix A of the original paper [27].
Applsci 13 06293 g006
Figure 7. (a) Schematic of the actual support mode of the atomizing sheet; (b) Photo of the actual support mode of the atomizing sheet.
Applsci 13 06293 g007
Figure 8. Modes of support proposed by Yan et al. [31]: (a) Peripheral simply supported (without waterproof sealant); (b) Peripheral simply supported (with waterproof sealant); and (c) Elastic support.
Applsci 13 06293 g008
Figure 9. Experimental system and measurement curves of the atomizer.
Applsci 13 06293 g009
Figure 10. Experiment setup of atomization rate measurement.
Applsci 13 06293 g010
Figure 11. Atomizing rate of the atomizing sheet under different driving frequencies and boundary conditions.
Applsci 13 06293 g011
Figure 12. Screenshot of Table 3 in Reference [27].
Applsci 13 06293 g012
Figure 13. Change in the maximum positive displacement with the modes in Reference [27].
Applsci 13 06293 g013
Figure 14. The harmonic response curves of the center points in the four resonant frequency ranges: (a) 29.5; (b) 70.8; (c) 118.4; (d) 152.2 kHz [30].
Applsci 13 06293 g014
Figure 15. Measurement results of vibration mode and atomization quantity with the atomizing sheet by Cai et al. [32].
Applsci 13 06293 g015
Figure 16. Frequency sweep curve of the atomizing sheet by Yan et al. [23].
Applsci 13 06293 g016
Figure 17. Maximum vibration displacement of the atomizing sheet under different vibration modes.
Applsci 13 06293 g017
Figure 18. Experimental setup of the vibration displacement measurement: (a) Experiment setup main view; (b) Top view of the atomizer; (c) The location distribution of the scanning points of atomizing sheet.
Applsci 13 06293 g018
Figure 19. Vibrational displacement of pole O at different driving frequencies.
Applsci 13 06293 g019
Figure 20. Vibration displacement of some scanning points at 20 kHz.
Applsci 13 06293 g020
Figure 21. Constant frequency vibration displacement diagram of the atomizing sheet: (a) 20 kHz; (b) 26.3 kHz; (c) 56.6 kHz; (d) 103.5 kHz; and (e) 170 kHz.
Applsci 13 06293 g021
Table 1. Parameters of the atomizing sheet.
Radius
a (mm)
Thickness
h (mm)
Density
ρ (kg/m3)
Young’s
Modulus
Poisson’s
Ratio μ
8.140.05 8 × 10 3 2.35 × 10 11 0.3
Disclaimer/Publisher’s Note: The statements, opinions and data contained in all publications are solely those of the individual author(s) and contributor(s) and not of MDPI and/or the editor(s). MDPI and/or the editor(s) disclaim responsibility for any injury to people or property resulting from any ideas, methods, instructions or products referred to in the content.

