1. Introduction
Seeds, being the foundational elements for crop growth and development, bear significant influence on agricultural production. The optimization of crop yield and quality depends on a variety of techniques and measures, among which, the provision of high-quality seeds holds notable significance, contributing to an improvement range of 30–40% [
1,
2,
3]. The rapeseed plant (
Brassica rapa or
Brassica campestris L.), appreciated for its unique flavor and nutrient-dense profile, is a valued leafy vegetable and ranks among the world’s top four oilseed crops, showcasing an oil content of 37% to 46%. Consequently, the rapeseed plant commands a distinguished status within the realm of agricultural production [
4,
5,
6].
Traditional methods for testing germination rates rely heavily on germination tests conducted under meticulously controlled conditions—temperature, humidity, and light, to name a few—as stipulated by seed germination techniques. However, these tests come with their own set of challenges, including stringent experimental conditions, lengthy durations (spanning 7–15 days), potential seed damage, and non-reusability [
7]. These shortcomings underscore the urgency for a rapid, non-destructive, and precise method for detecting germination rates, aimed at minimizing costs while enhancing detection speed and accuracy. Near-infrared spectroscopy (NIR) technology, capable of providing characteristic information about substances, enables efficient and economical sample analysis without causing sample destruction, thereby presenting itself as a viable tool for detecting germination rates in seed batches [
8,
9].
In the realm of crop seed germination rate detection (i.e., vitality), Kandpal et al. (2016) [
10] employed infrared spectroscopy to evaluate the vitality of melon seeds. They subjected seeds to artificial aging, collected near-infrared spectral data, and established discriminant models for differing vitality levels using Partial Least Squares Discriminant Analysis (PLS-DA). The research yielded an impressive 94.6% accuracy rate in identifying the vitality of melon seeds through the combined use of SR variable selection and PLS-DA. In another study, Baek et al. (2019). Ref. [
11] used PLS-DA to analyze data derived from NIR-HSI of soybean seeds, achieving classification accuracies exceeding 95%. Meanwhile, Wu et al. (2017). Ref. [
12] developed a prediction model for wheat seed germination rate using Si-cPLS, with the average correlation coefficients of PLS, cPLS, and Si-cPLS models achieving 0.935, 0.949, and 0.967, respectively, thus underscoring the efficacy of multiple-model consensus in bolstering prediction performance. Hui et al. (2022). Ref. [
13] gathered near-infrared spectra of 100 Medicago sativa seed samples from different provinces and formulated a support vector machine prediction model. The application of first-order derivatives for spectral preprocessing with a penalty factor c = 2.896 and a kernel function g = 0.5 led to an impressive 96.67% accuracy rate in the detection set. Overall, the advancement in current research indicates the potential applicability of NIR for the rapid and non-destructive detection of seed germination rates. However, the majority of these studies primarily focus on vitality classification, germination capacity identification, and seed germination rate prediction in large-grain crops, leaving the research on rapid non-destructive detection of germination rates in multi-variety, small-grain seeds such as the rapeseed plant somewhat underexplored. The diversity of rapeseed varieties encompasses a variety of seed attributes such as color and shape, which can differ significantly. These variances in physical characteristics can influence the quality of the collected spectral sample, thereby escalating the complexity associated with accurately predicting the germination rate across differing seed types. This study seeks to address the gaps associated with the detection of rapeseed plant germination rates and introduces a rapid and non-destructive detection method underpinned by NIR.
This study entails the collection of near-infrared diffuse reflectance spectra data from rapeseed plant seeds of varied varieties and aging levels. The reference values for the average germination rate of rapeseed plant seed batches were ascertained using the standard method for testing the rapeseed plant seed germination rate. A support vector machine regression (SVR) prediction model was subsequently developed to predict the germination rates of mixed-variety rapeseed plant seeds.
2. Materials and Methods
2.1. Materials
This study incorporated a collection of 24 distinct rapeseed plant seed varieties sourced from various regions. The majority of the seeds were procured from Qinghai Academy of Agriculture and Forestry Sciences at Qinghai University (Xining, Qinghai, China) and Jingyan Yinong (Beijing) Seed Sci-TechCo., Ltd. (Beijing, China), effectively representing the primary rapeseed plant production zones in China. The chosen varieties were intended to create a comprehensive sample.
Table 1 illustrates the characteristics of the differing seed varieties.
2.2. Preparation of Artificially Aged Rapeseed Plant Seed Samples
Artificial aging was applied to an array of rapeseed plant seed varieties to augment the range of germination rates within the rapeseed plant seed sample set, thereby enhancing the near-infrared model’s generalization ability for rapeseed plant seed germination rates. The duration of aging was controlled to induce varying degrees of aging, thus resulting in seeds displaying diverse germination rates.
The process began by documenting the initial moisture content of the seed batches. Seeds were then placed in a sealed container with water added at the bottom, careful to prevent any direct contact with the seeds. The container was then covered to sustain a specific level of humidity. Following this, the container was set in a drying oven calibrated to a temperature of 40 °C, with an error margin of ±1 °C in the actual temperature inside the oven [
14]. The maximum aging duration was limited to 6 days, and at 12 h intervals, the aging seeds were extracted from the container, air-dried, and weighed. The moisture content of the seeds was rigorously controlled to return it to its initial state prior to the experiment. This procedure enabled the procurement of rapeseed plant seeds with variable germination rates, which formed the dataset for subsequent modeling exercises.
2.3. Spectral Acquisition and Determination of Germination Rate Reference Values
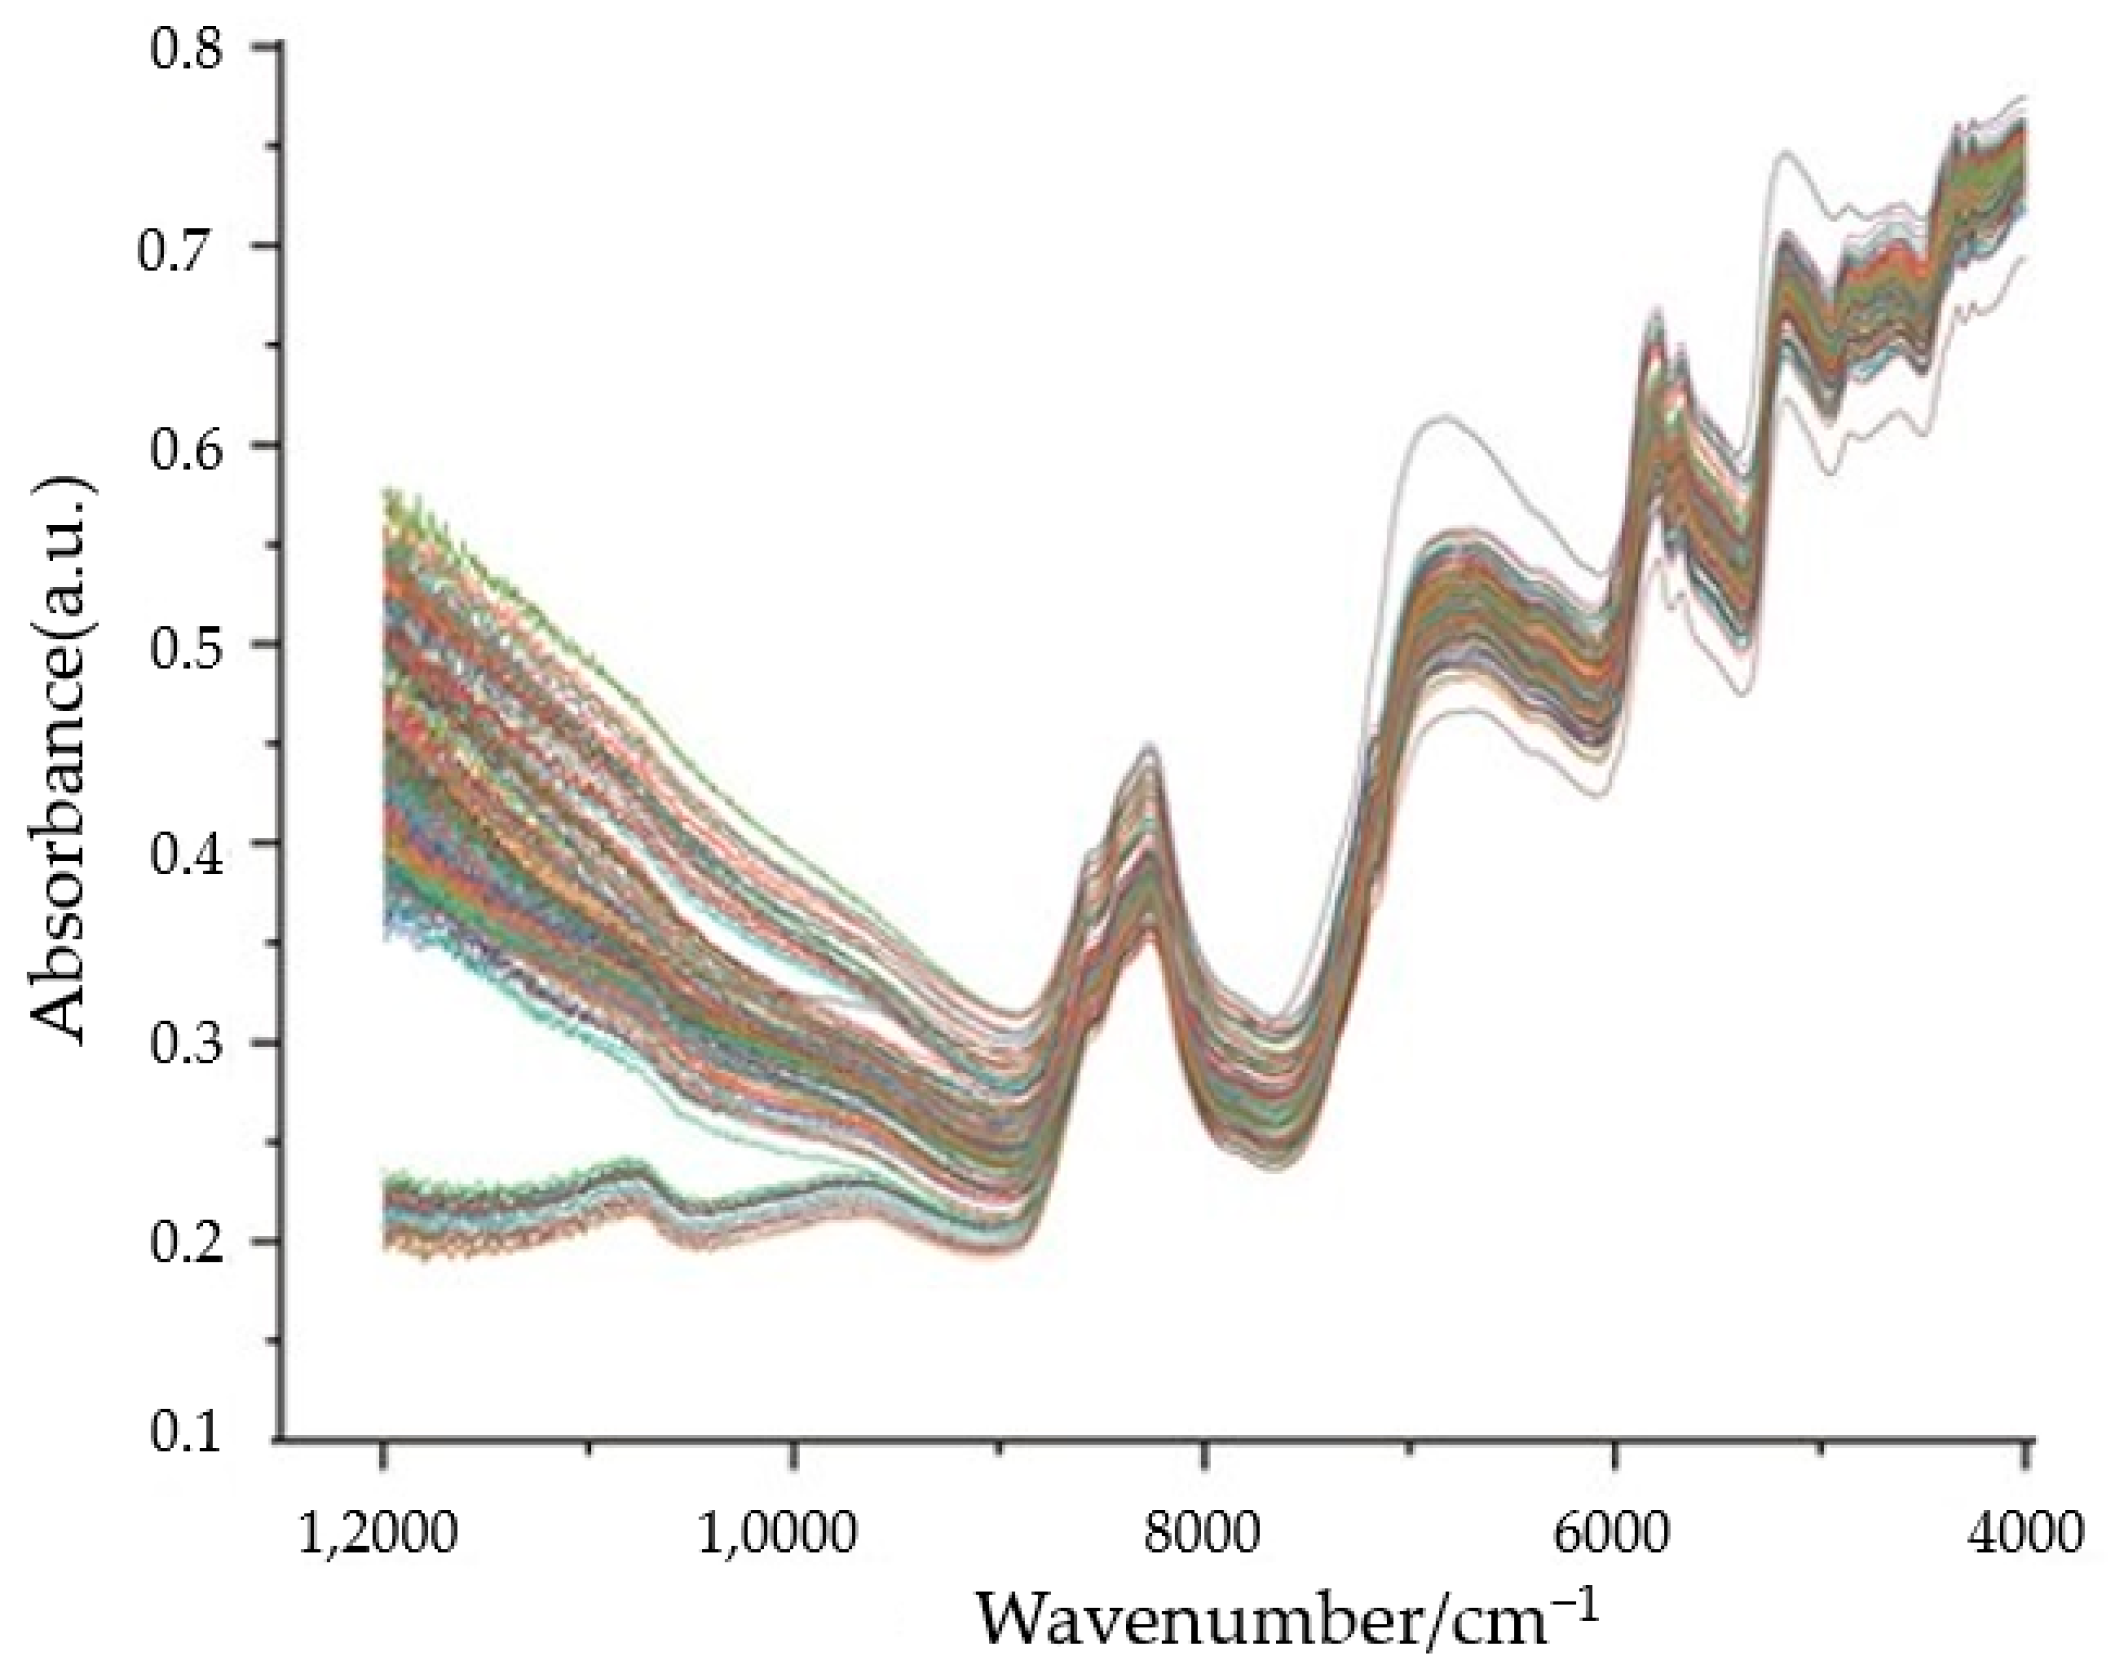
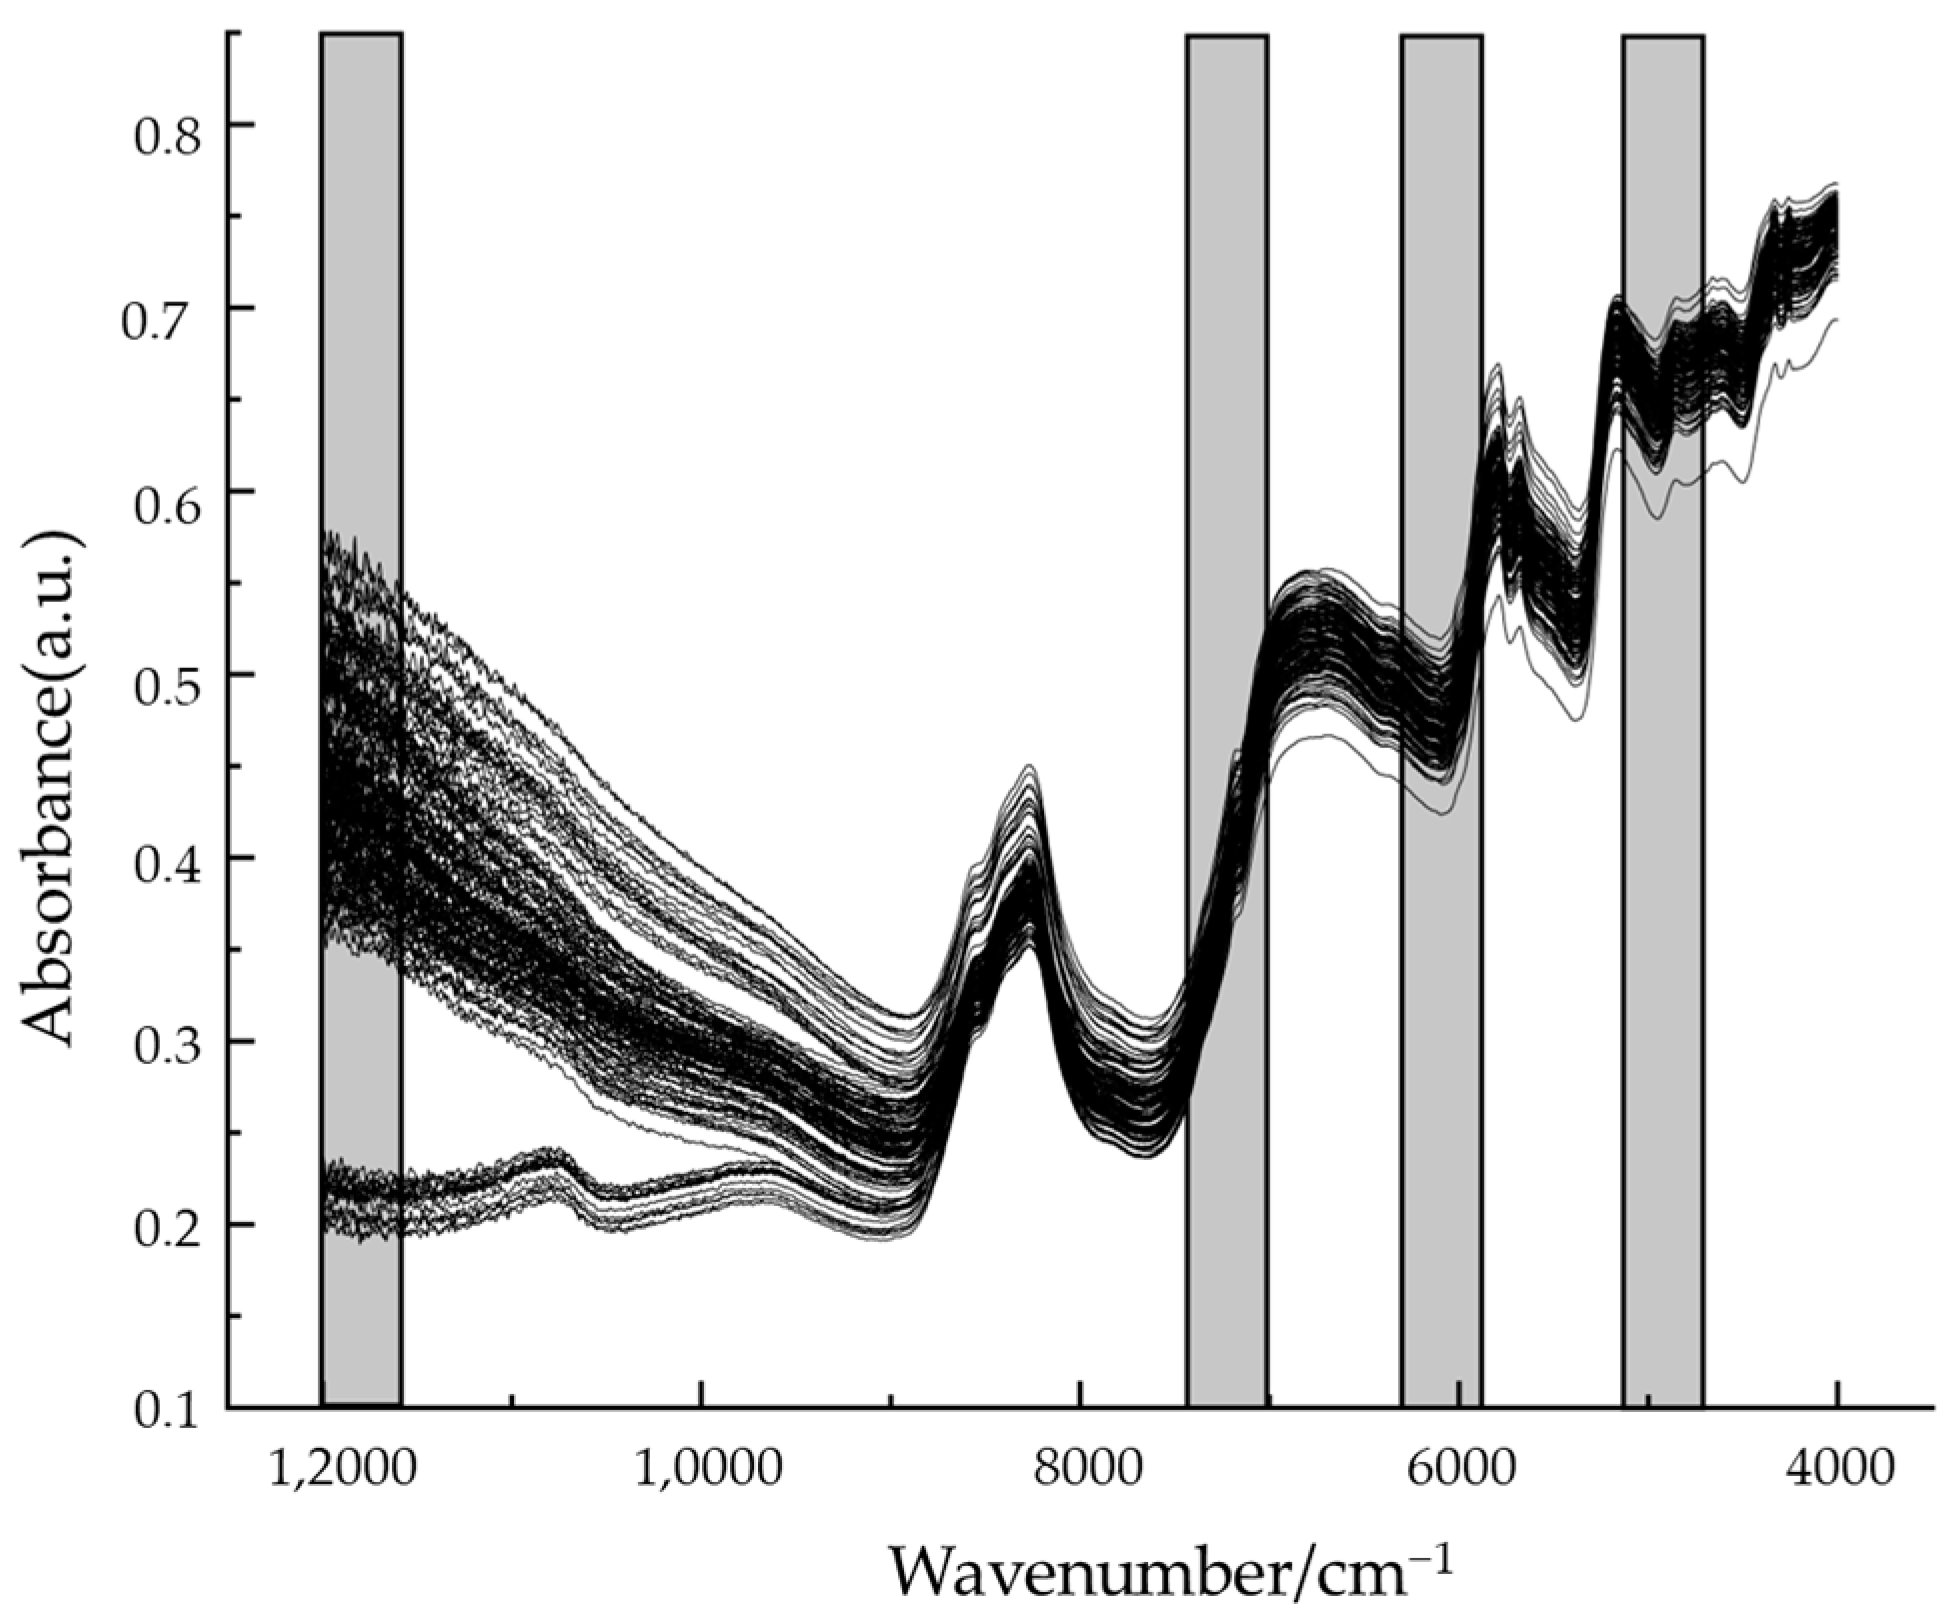
A VERTEX 70 Fourier-transform infrared spectrometer (BRUKER, Karlsruhe, Germany) was employed to acquire the near-infrared spectra of the rapeseed plant seed samples. The sampling procedure involved the use of a large sample cup in rotation mode to guarantee representative measurements. Prior to loading the samples, a thorough inspection was conducted to exclude any impurities or empty grains. The instrument parameters were set as follows: a wavenumber range of 4000 cm
−1 to 12,500 cm
−1, a resolution of 8 cm
−1, 64 scans, and 2074 data points. The near-infrared spectra derived from the collected rapeseed plant seed samples are depicted in
Figure 1.
The germination experiment followed the standard method, preparing germination beds using the paper-on-paper (TP) method. For each trial, 100–150 rapeseed plant seeds were selected at random and arranged evenly on a Petri dish lined with three layers of sterilized, moist filter paper [
15]. The environment was controlled with a temperature of 20 ± 1 °C, relative humidity of 90%, and continuous exposure to light for 24 h. Each sample was subjected to three replicate trials. After a span of 7 days since the inception of the experiment, germinated seeds were tallied, and the average germination rate for the 7-day period was calculated for each batch of rapeseed plant seeds of different varieties and aging levels. The statistical outcomes of the germination rates for the samples are displayed in
Table 2.
2.4. Data Processing and Model Development
2.4.1. Spectral Preprocessing
Various environmental factors, instrument conditions, noise, and scattering due to disparities in size, shape, and surface color of distinct rapeseed plant seed types can impact the quality of spectral data acquisition. To enhance the differences between spectral samples and eliminate noise, spectral preprocessing techniques are utilized. The Unscrambler X 10.4 software was employed to compare the efficacy of diverse preprocessing methods, including Mean Centering (MC), First Derivative (FD), Standard Normal Variate (SNV), Multiplicative Scatter Correction (MSC), and Savitzky–Golay smoothing filter (SG), applied to the near-infrared spectra of rapeseed plant seed samples. The results informed the selection of the optimal preprocessing method.
2.4.2. Feature Wavelength Selection
The goal of feature wavelength selection, which employs variable selection algorithms, is to identify the primary influencing factors of seed germination rate in NIR quantitative prediction model from a chemometric perspective. This procedure minimizes the effect of interfering variables on the model and heightens its predictive ability and stability. MATLAB2020a software was leveraged for feature wavelength selection and modeling. A comprehensive comparison was undertaken amongst an assortment of variable selection algorithms to identify the most effective method. This suite of algorithms included Synergy Interval Partial Least Squares (SiPLS), Backward Interval Partial Least Squares (BiPLS), Iteratively Retains Informative Variables, (IRIV) (IRIV), Variable Combination Population Analysis (VCPA), Competitive Adaptive Reweighted Sampling (CARS), Random Frog (RF), and combinations of these. Each was meticulously assessed to determine the optimal selection approach.
2.4.3. Model Development
Model development and evaluation were conducted utilizing MATLAB2020a software. A Support Vector Regression (SVR) model was created to predict the germination rate of rapeseed plant seeds. SVR, a supervised learning model extensively used in regression analysis, provides advantages in situations characterized by limited sample size, high-dimensional data space, and nonlinear quantitative analysis. The sample set was partitioned into a calibration set (training set) and a prediction set (testing set) at a 4:1 ratio using the Sample set Partitioning based on joint x-y distance (SPXY) method. Grid search was conducted to optimize the SVR penalty parameter (c) and the kernel function parameter (g). Model performance was assessed using determination coefficients (R2c and R2p) for the training and prediction sets, along with the Root Mean Square Error of Calibration (RMSEC) and Prediction (RMSEP).
3. Results
3.1. Preprocessing of Original Spectra
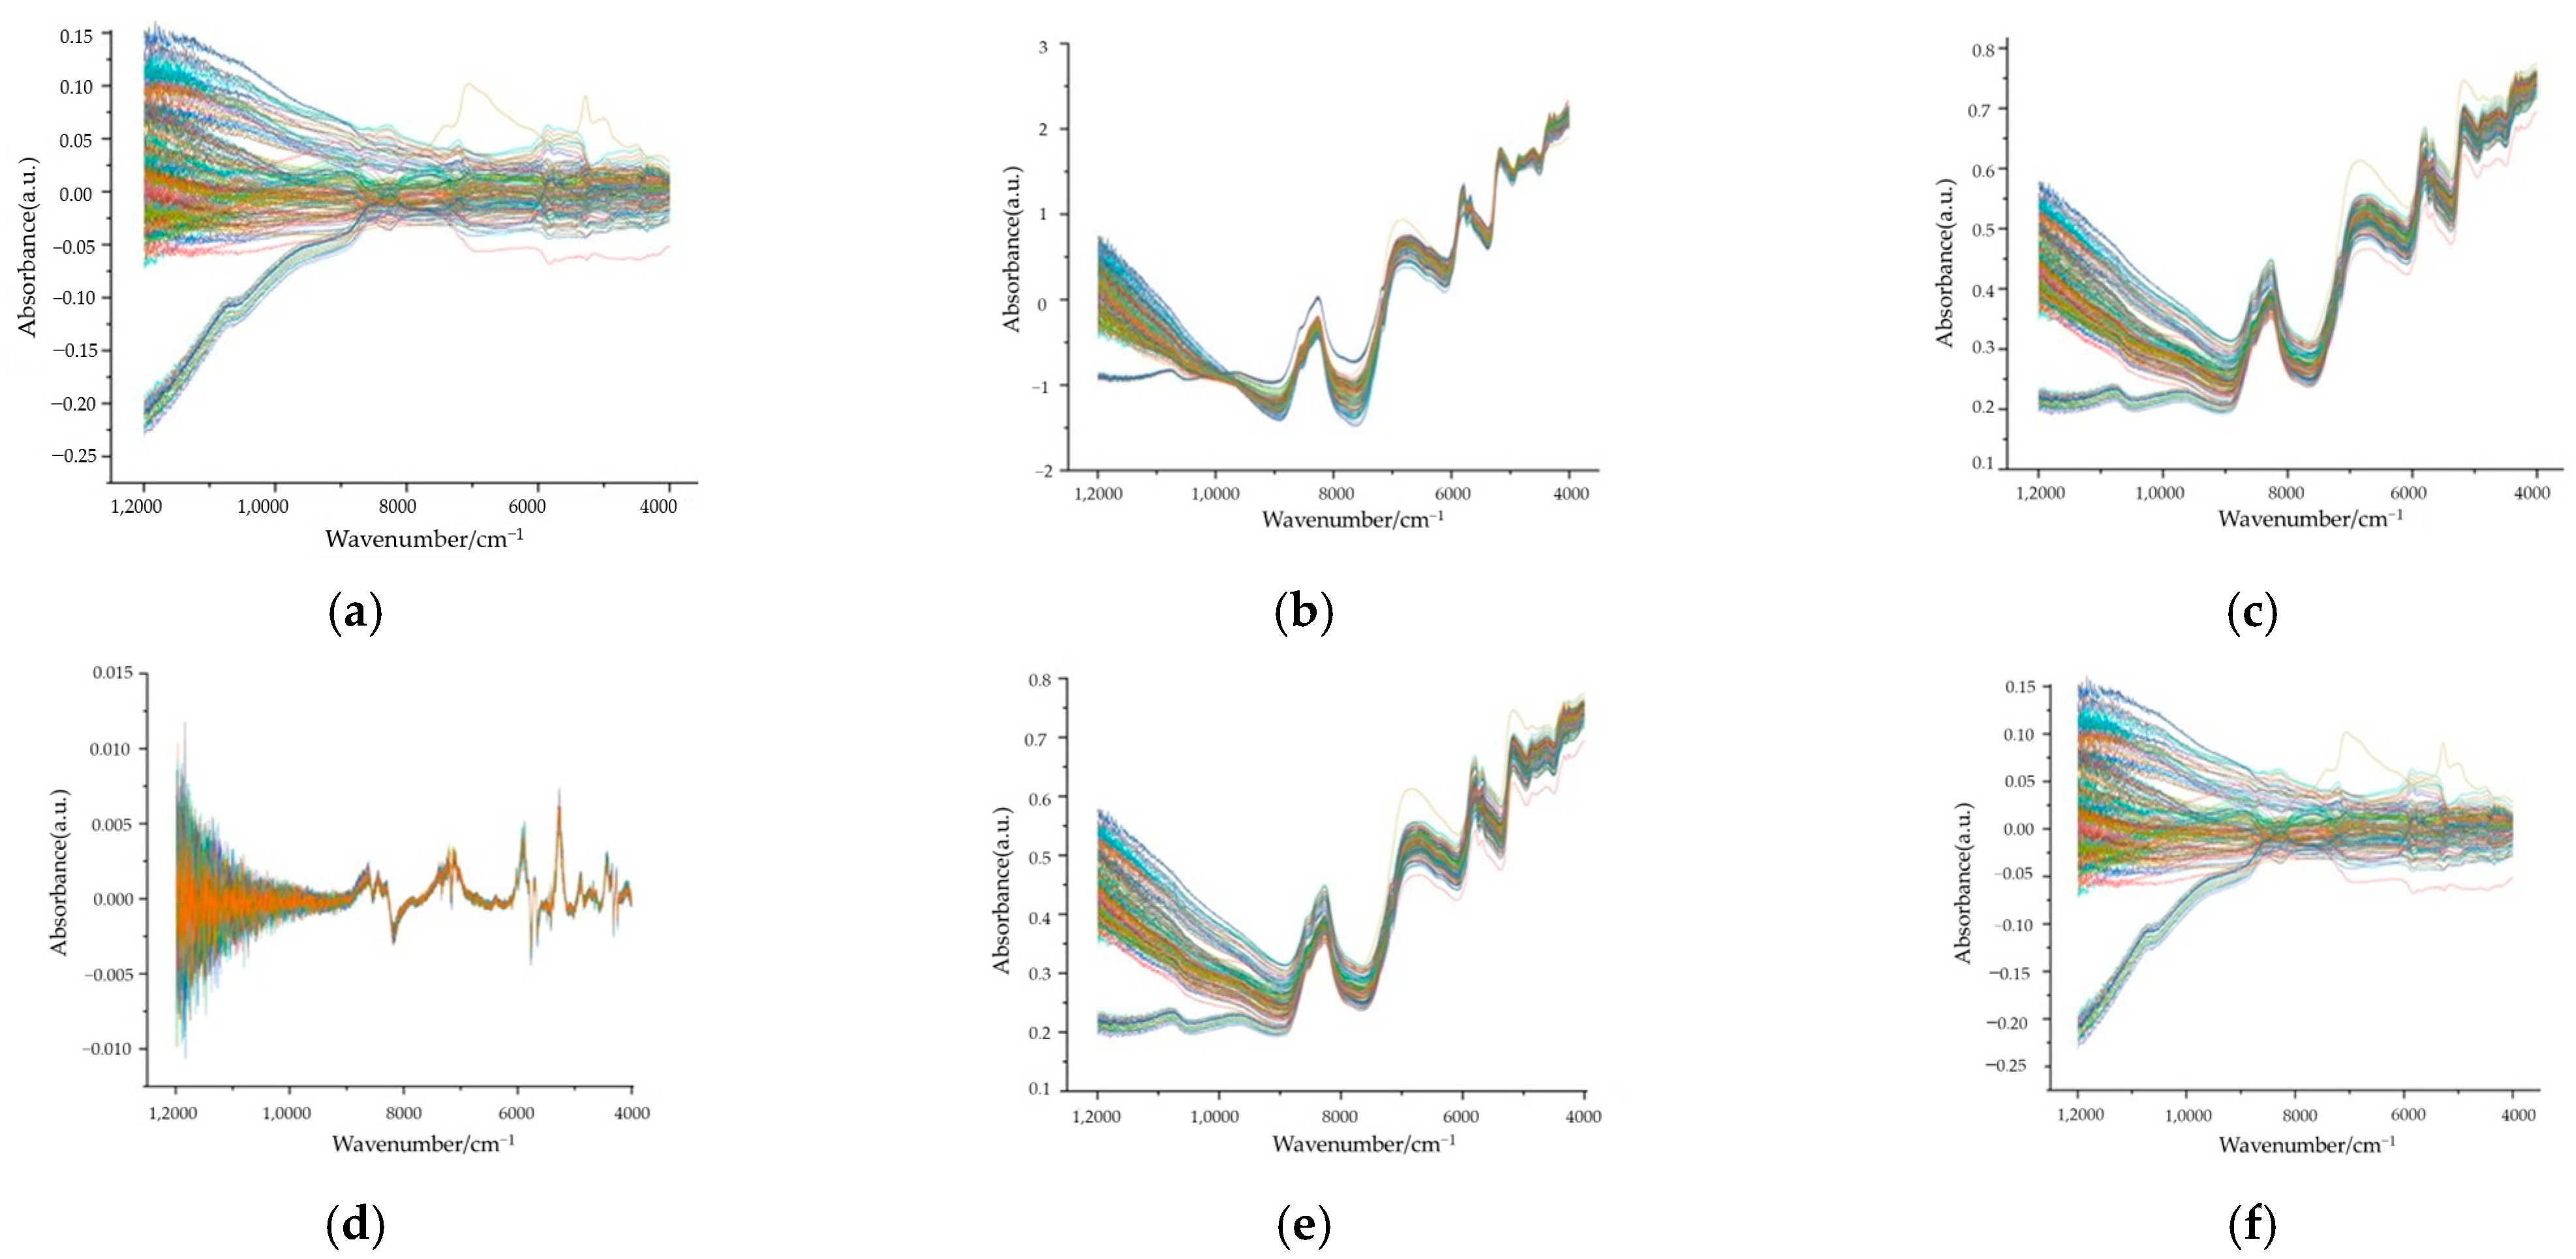
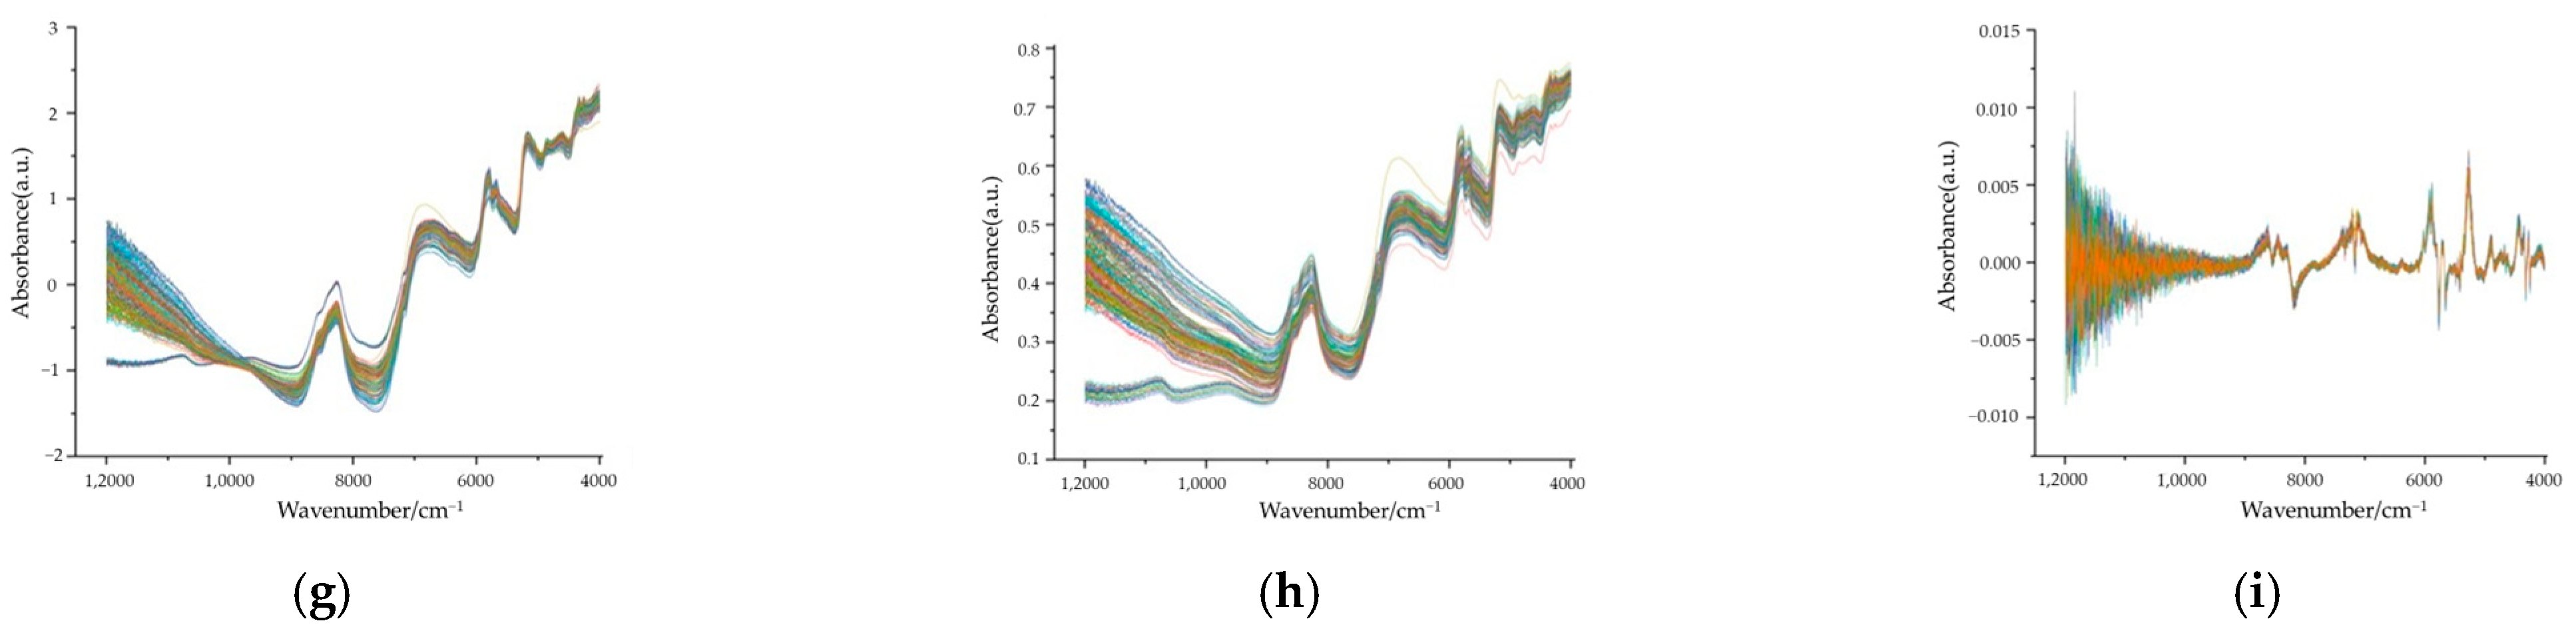
The near-infrared spectra data of rapeseed plant seed samples underwent various preprocessing methods, encompassing MC, FD, SNV, MSC, SG, and combined SG smoothing. Subsequently, SVR prediction models for seed germination rate were established using the preprocessed spectra data.
Figure 2 showcases the spectra data after application of distinct preprocessing methods, whereas
Table 3 depicts the outcomes of the SVR modeling.
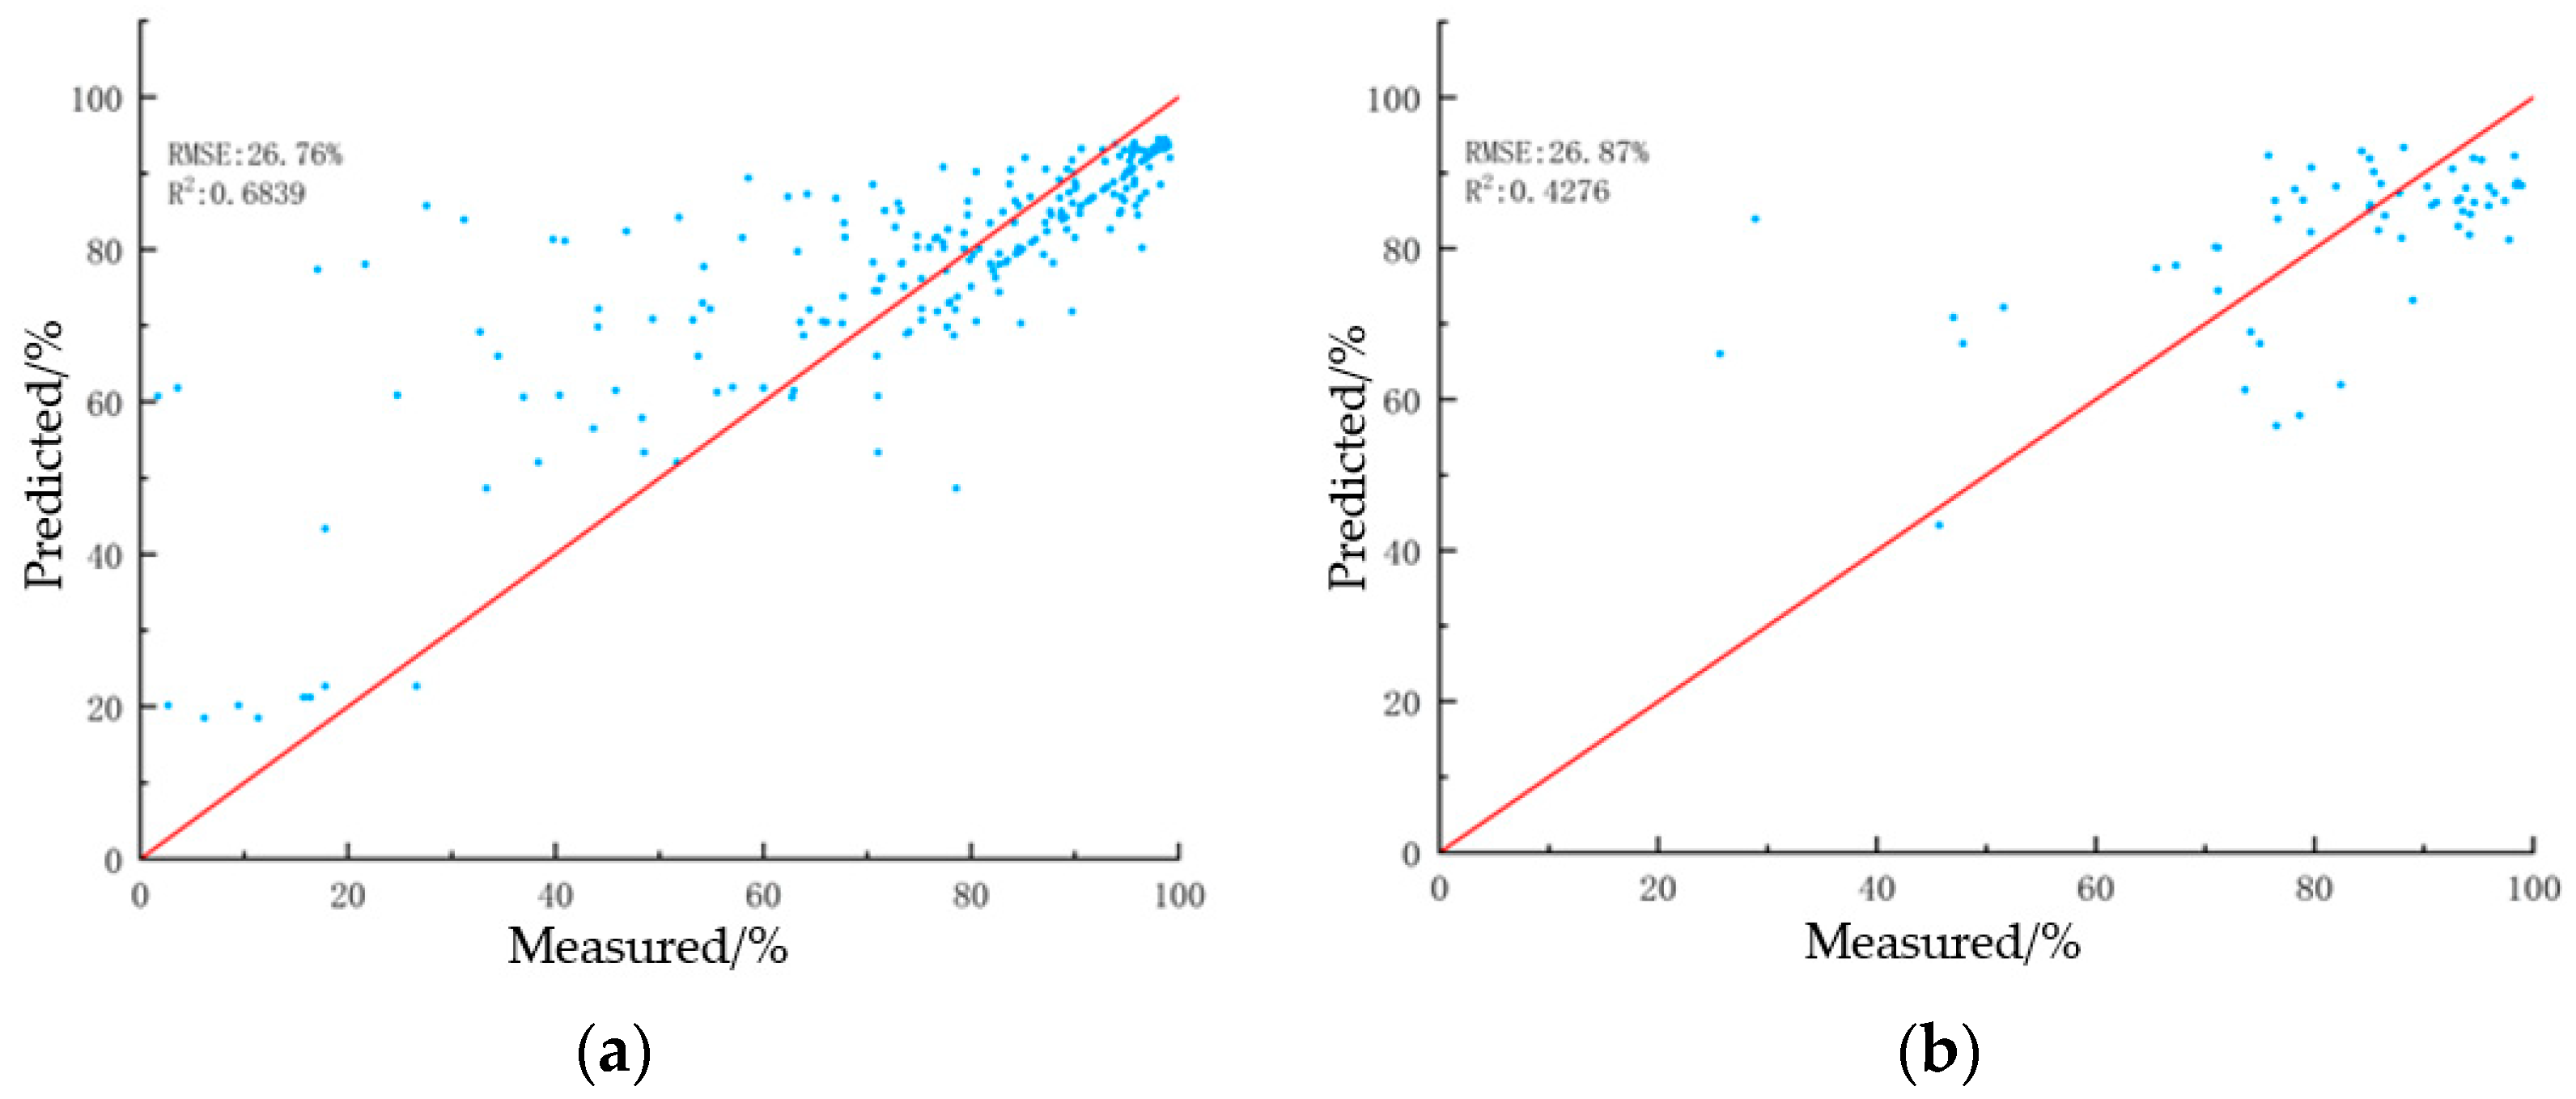
Upon examining the outcomes of diverse preprocessing models, it was evident that the SG convolution smoothing method facilitated improved modeling results compared to the no-preprocessing strategy. The determination coefficients (R
2c and R
2p) for the training and prediction sets were more pronounced, suggesting a superior fit of the model to the data. Moreover, the RMSEC diminished post the application of SG smoothing, signaling a reduction in the discrepancy between the predicted and factual values. The closer values of RMSEC and RMSEP indicated augmented model stability and refined prediction accuracy. Based on these observations, the SG convolution smoothing method was chosen as the preprocessing method for the SVR modeling of rapeseed plant seed germination rates. The prediction outcomes employing this preprocessing method are demonstrated in
Figure 3, where the predicted values show a closer alignment with the actual values. Nonetheless, despite the enhancements in data quality and model performance via preprocessing, the modeling outcomes still did not fully satisfy the sought-after prediction requirements. Consequently, SG convolution smoothing was utilized as input for subsequent data processing techniques to further enhance the model’s performance.
3.2. Feature Wavelength Selection
Feature wavelength selection is pivotal in diminishing model complexity and enhancing model performance for NIR spectra data from rapeseed plant seeds. A rigorous comparative analysis was undertaken across six distinct wavelength selection algorithms, including SiPLS, BiPLS, RF, IRIV, VCPA, and CARS, as well as their combinations. The intent was to screen the characteristic wavelengths inherent to the modeling data. Subsequently, the modeling outcomes produced via different variable selection methodologies were contrasted and evaluated.
3.2.1. Methodology for Feature Wavelength Interval Screening
- (1)
Feature interval selection based on SiPLS
The SiPLS algorithm was applied to the preprocessed standard sample dataset for feature wavelength selection. The joint interval numbers were set to 2, 3, and 4, and for each joint interval, optimal PLS models were established using a subset of subinterval principal component numbers that ranged from 6 to 30. The results of this analysis are consolidated in
Table 4, and the optimal feature interval combinations selected by the SiPLS method are visualized in
Figure 4.
The modeling outcomes indicate that the optimal model performance is attained with a joint interval number of 4, a partition interval number of 21, a modeling interval combination of [1, 13, 16, 19], and nine principal components. The model displays an R2c value of 0.6003, a Root Mean Square Error of Cross-Validation (RMSECV) of 9.21%, an R2p of 0.7465, and an RMSEP of 9.13%. The selected feature wavelength intervals are 11,617 cm−1 to 12,000 cm−1, 7035 cm−1 to 7413 cm−1, 5889 cm−1 to 6267 cm−1, and 4755 cm−1 to 5129 cm−1.
- (2)
Feature interval selection based on BiPLS
Feature interval selection using the BiPLS algorithm divided the preprocessed standard sample dataset into intervals that ranged from 3 to 30, with models compared accordingly. The optimal model performance was realized with a partition interval number of 415 and a modeling interval combination of [1, 3, 4, 5]. The selected spectral regions are depicted in
Figure 5a, and the variation of RMSECV with the number of principal components is demonstrated in
Figure 5b. The model displays an R
2c value of 0.5769, an RMSECV of 9.43%, an R
2p of 0.7280, and an RMSEP of 9.48%. The selected feature wavelength intervals are 4000 cm
−1 to 5600 cm
−1 and 7200 cm
−1 to 12,000 cm
−1.
3.2.2. Methodology for Feature Wavelength Point Screening
- (1)
Selection of Feature Points Based on IRIV
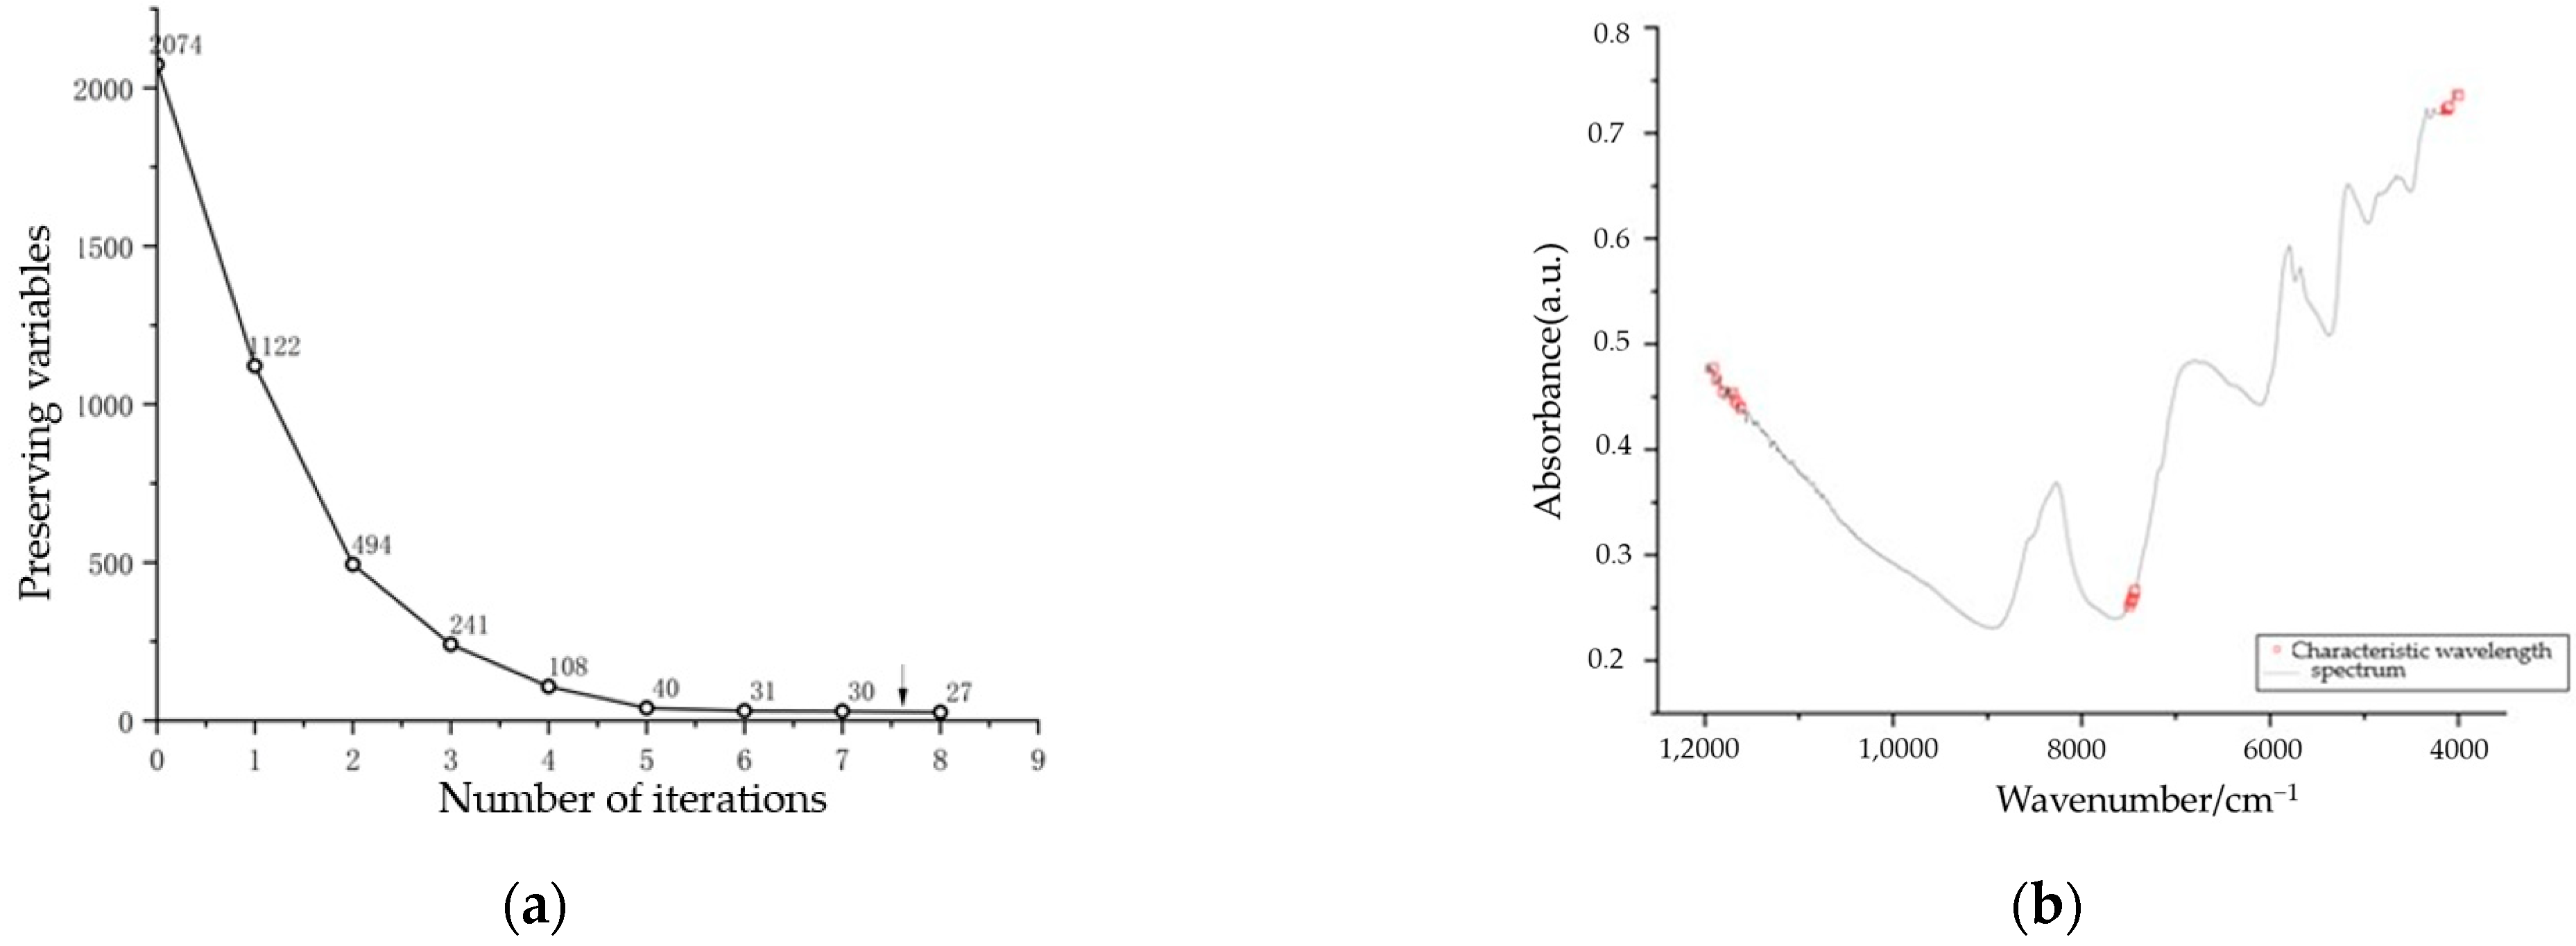
The IRIV algorithm was utilized for feature wavelength point selection on the full spectrum region. The selection process incorporated establishing a PLS prediction model using 5-fold cross-validation and using RMSECV as the evaluation metric to classify informative variables. During each iteration, uninformative and interfering variables were eliminated, while the relevant feature variables were retained. The analysis of the selection process revealed a substantial reduction in the number of variables: from 2074 to 241 after three iterations. By the fifth iteration, uninformative and interfering variables were successfully eradicated, leading to the final retention of 27 feature variables through backward selection. The variable selection process is demonstrated in
Figure 6a, and the chosen feature wavelengths are presented in
Figure 6b.
- (2)
Selection of Feature Points Based on VCPA
Feature interval selection was accomplished using the VCP algorithm, configured with a Decreasing Exponential Function (EDF) for the VCPA feature variable selection index. This process entailed 50 iterations of Binary Matrix Sampling (BMS) with a mean of 100 samples for each iteration. An optimal subset ratio was established at 10%, yielding 100 remaining variables following the execution of EDF. A PLS model was constructed using 5-fold cross-validation, with RMSECV serving as the evaluation metric to gauge the modeling performance of randomly partitioned subsets and choose the optimal subset. Throughout the 50 iterations, the EDF process purged variables with minimal contribution rates. The RMSECV was calculated for all variable combinations among the remaining variables, and the variable combination with the lowest RMSECV was chosen as the optimal subset. Ultimately, 12 feature wavelength points were selected. The variable selection process and the dispersion of feature wavelength points for VCPA are portrayed in
Figure 7.
- (3)
Selection of Feature Points Based on RF
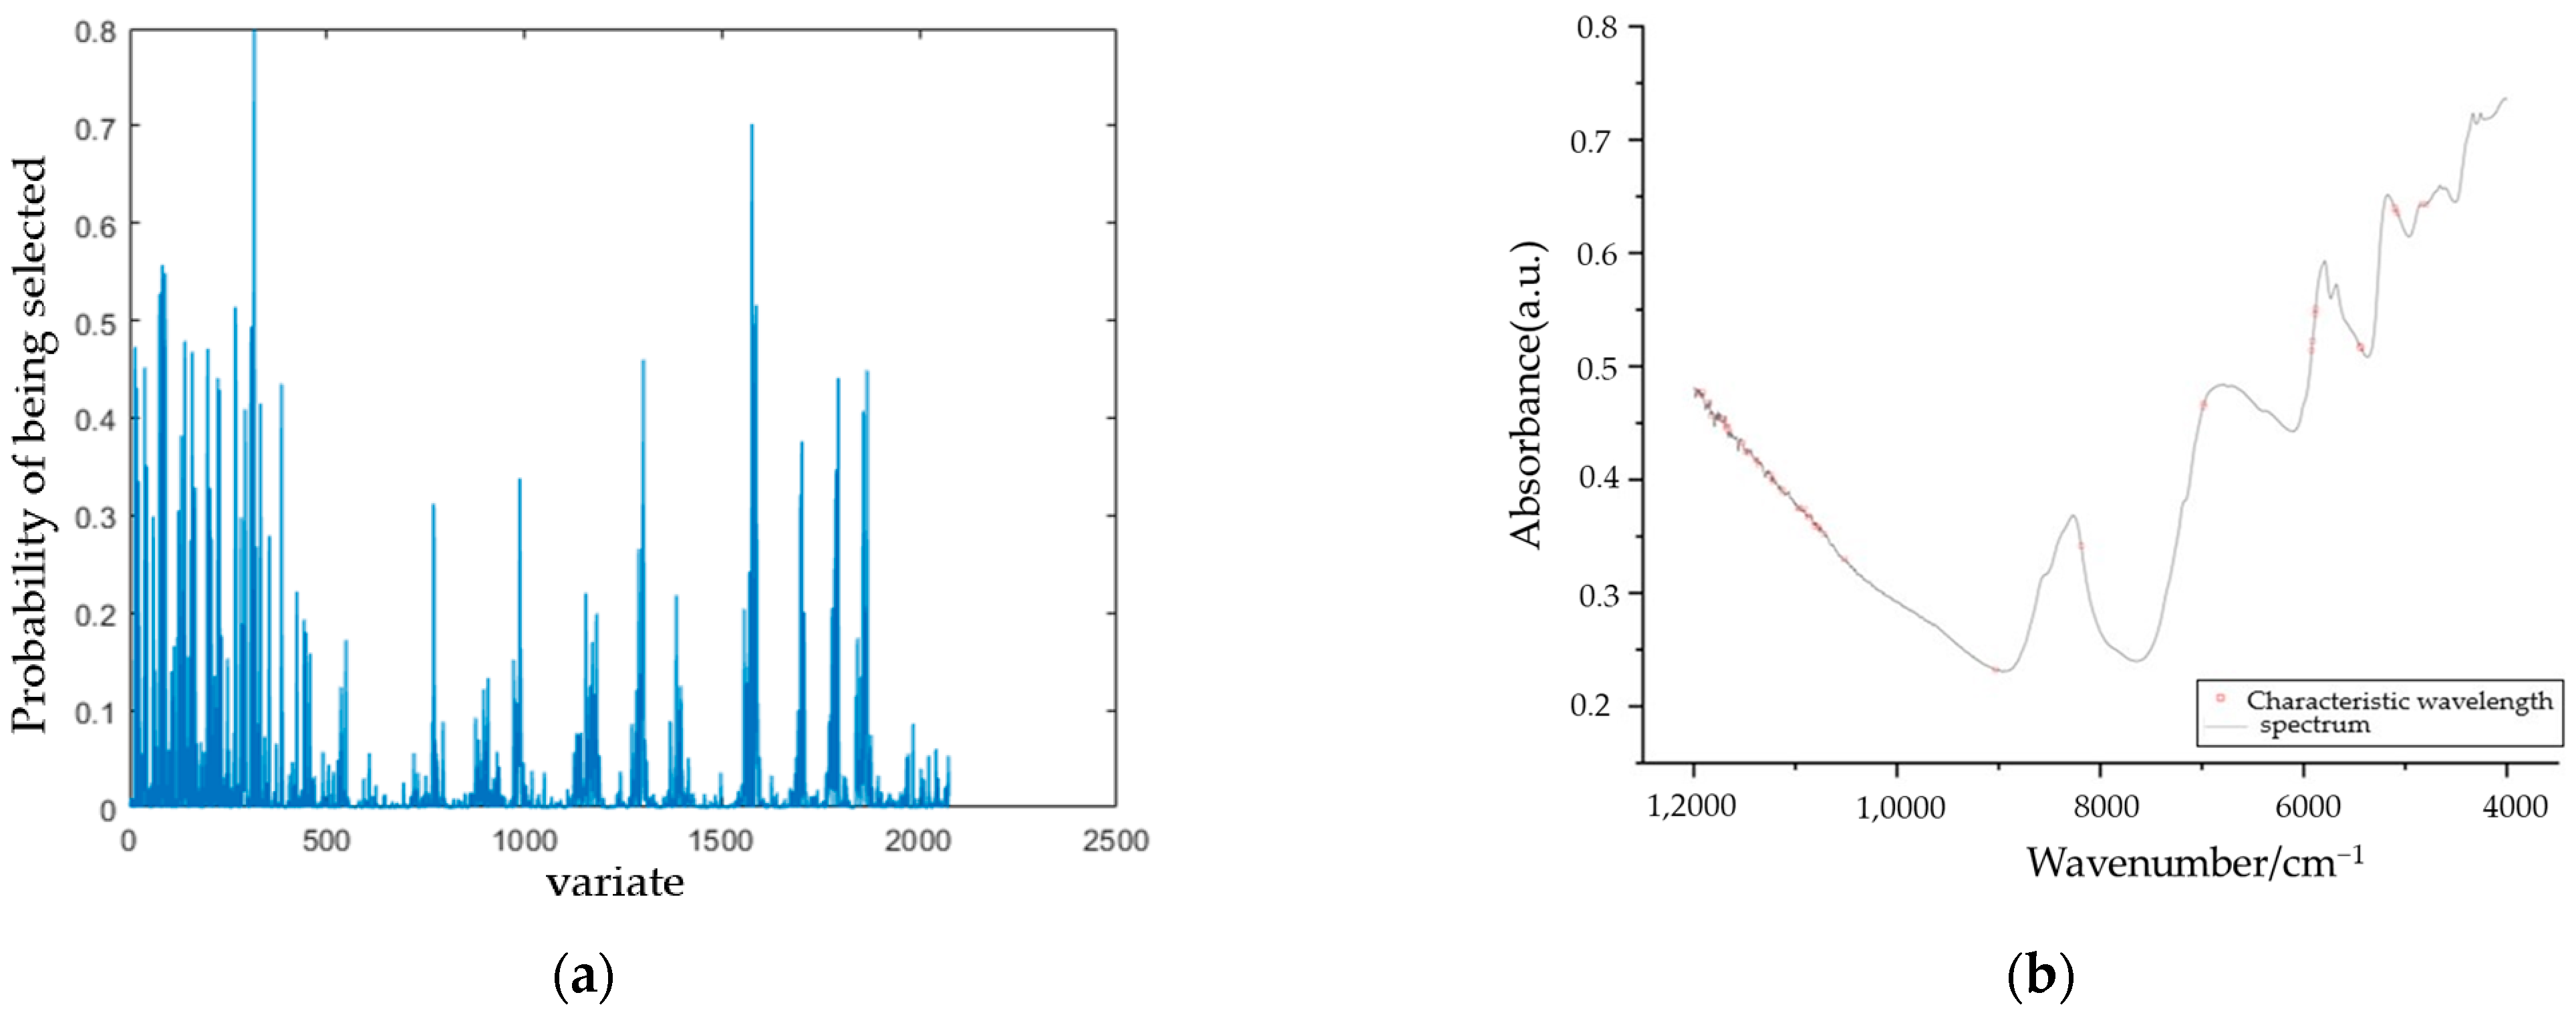
The initialization parameters of RF were configured, setting the algorithm iteration count at 1000 and the number of variables encompassed within the initial subset of random frog-leaping to five. Through this process, the selection probability for each wavelength was calculated. Wavelengths demonstrating a lower likelihood of selection during the iteration were indicative of interfering or redundant information within the full spectral data. After 604 iterations, the error was found to be at its minimal point. Adopting the principle that higher selection probability equates to greater variable importance, all variables were ranked according to their respective probabilities. Subsequently, RF concluded with the screening of 50 feature variables.
Figure 8 illustrates the variable screening process via the RF algorithm and the dispersion of characteristic wavelength points.
- (4)
Feature point selection based on CARS
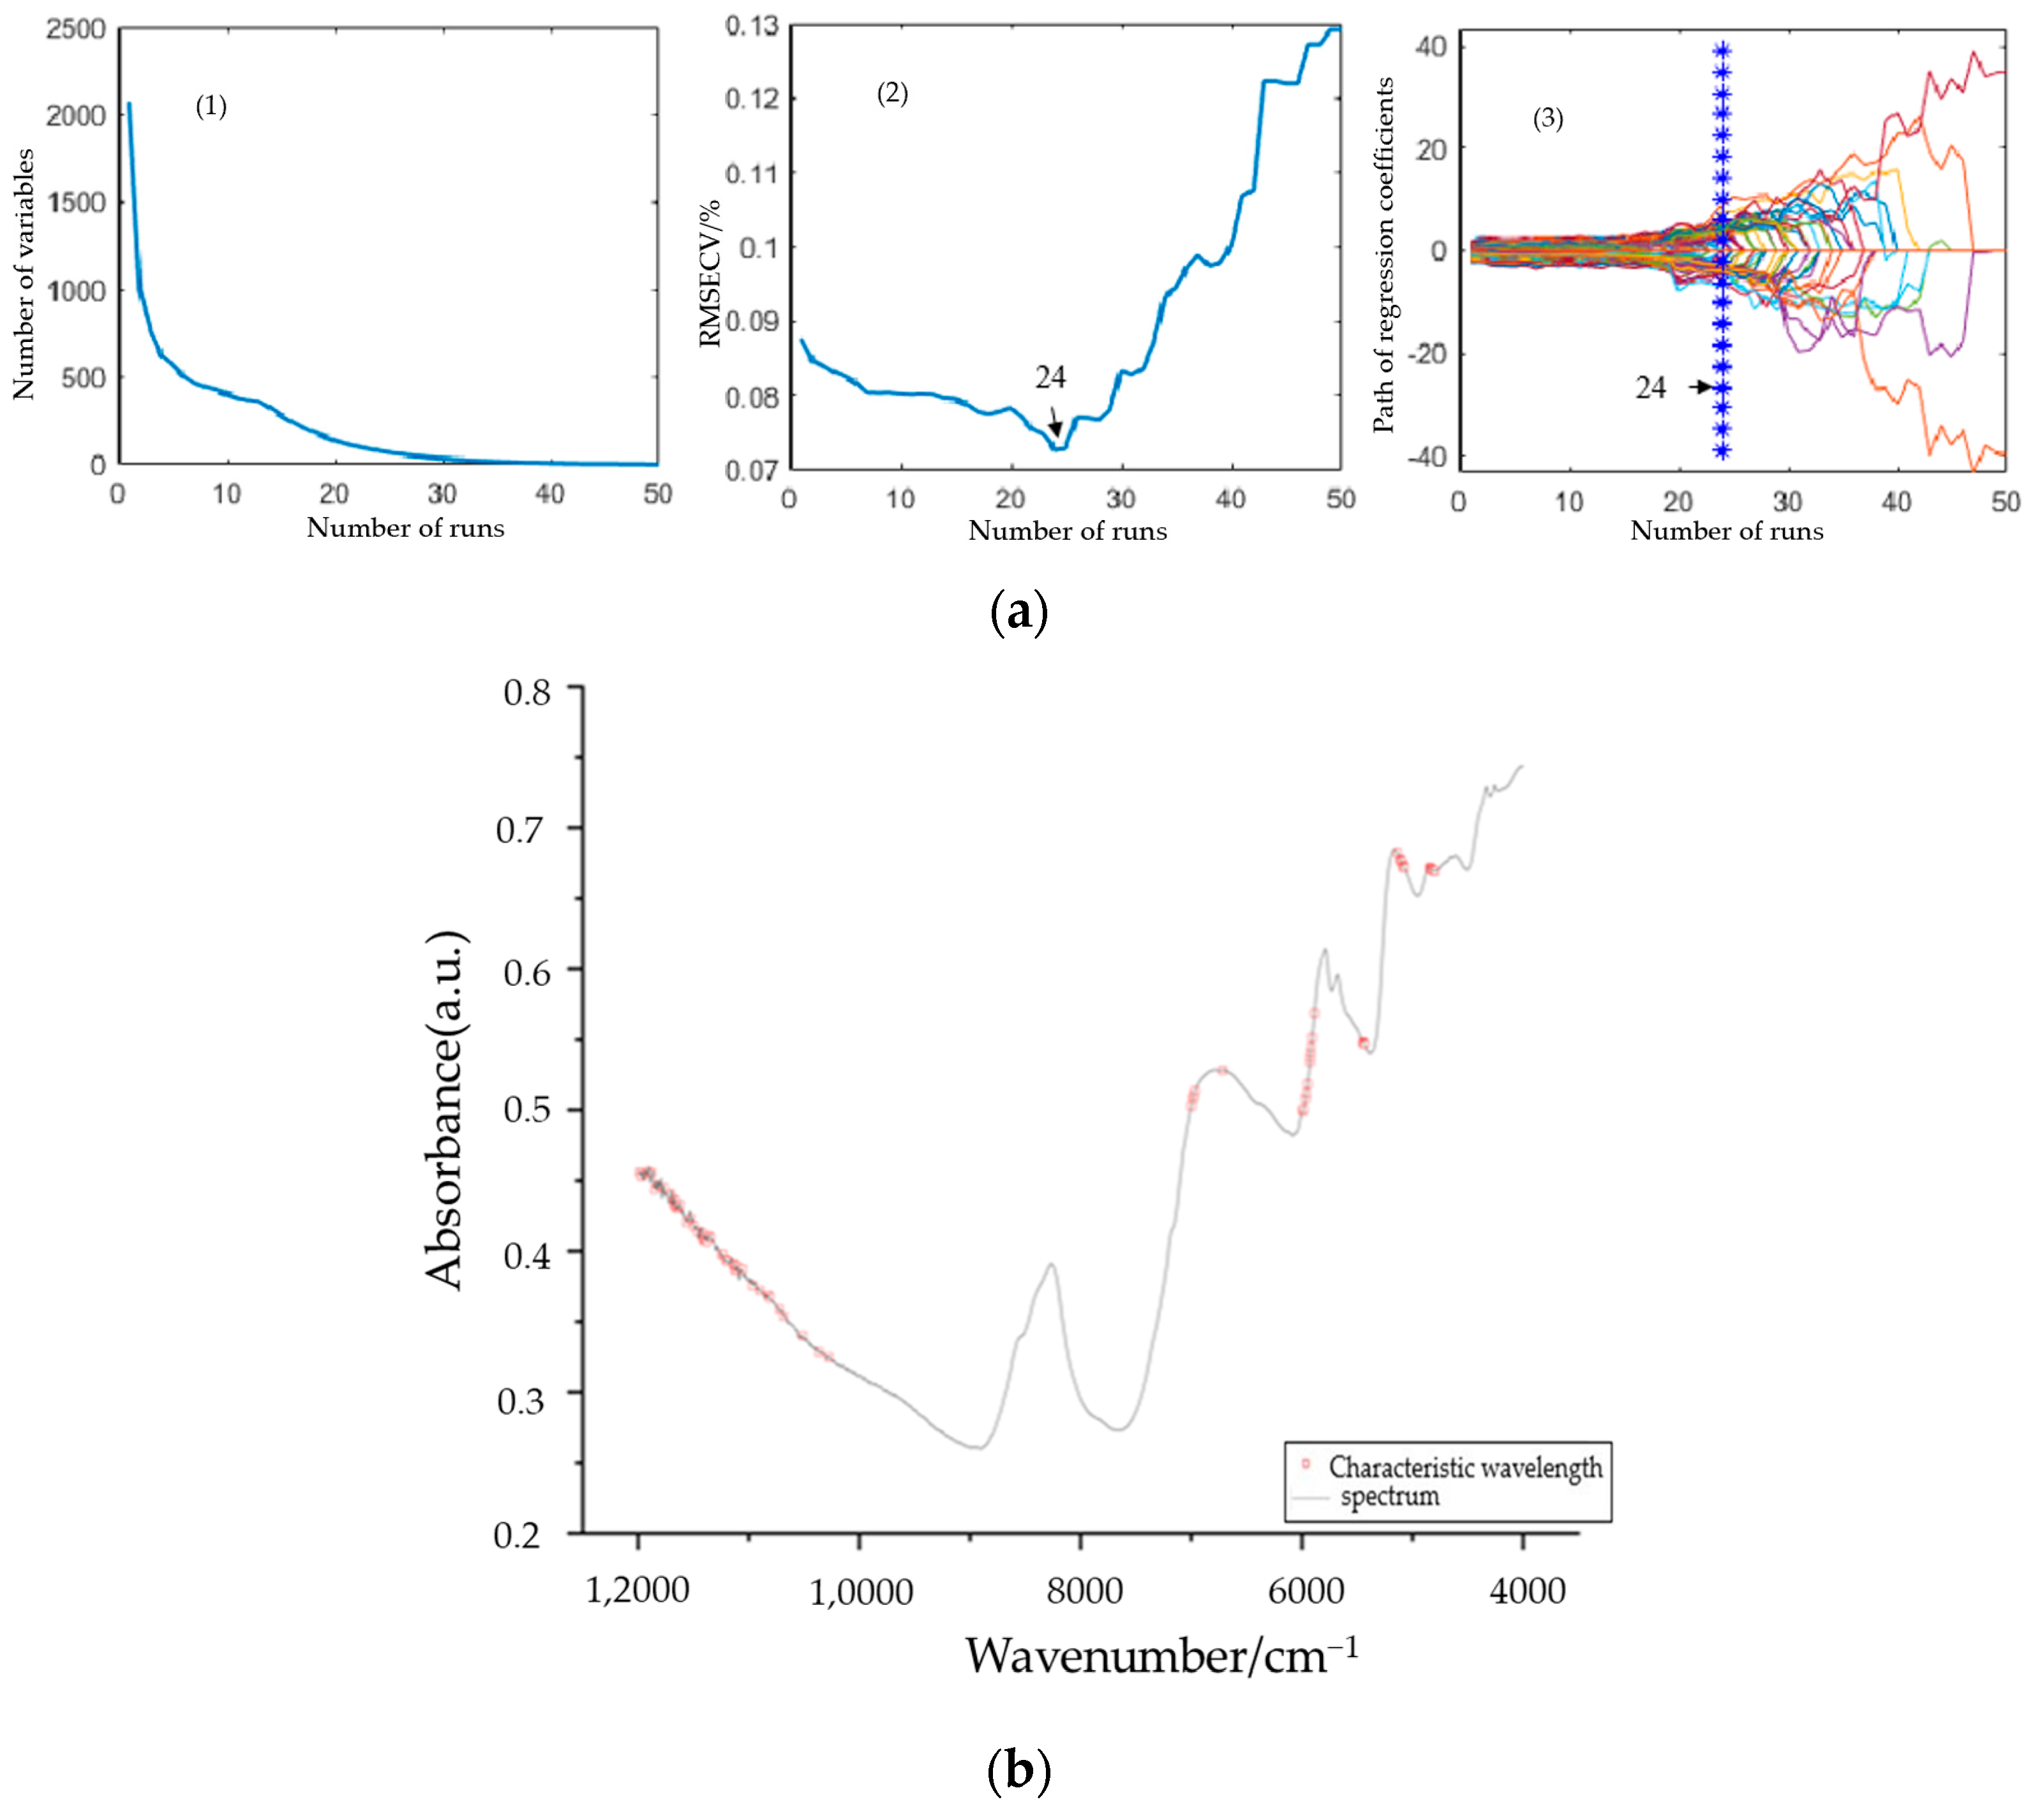
The feature interval selection process and distribution employing the CARS algorithm are depicted in
Figure 9. The quantity of selected variables declines as the number of Monte Carlo samples escalates. Initially, with an increase in sample size, the quantity of variables diminishes rapidly, but the rate of variable elimination gradually slackens over time, as shown in
Figure 9(a1), demonstrating the trend of variable selection count. During the sampling process, cross-validation is carried out on each variable subset, and RMSECV is computed to identify the subset with the lowest RMSECV. Irrelevant variables are systematically eliminated as the sample size increases, causing a slow decline in RMSECV. However, if critical variables are removed, RMSECV spikes significantly, signaling a substantial deterioration in model performance. Based on the RMSECV trend portrayed in
Figure 9(a2), the sample size corresponding to the minimum RMSECV value is chosen. In this instance, a sample size of 24 delivered the smallest RMSECV value, and the variable subset attained at this sample size is designated as the final variable combination. The variation of regression coefficients for each wavelength variable across different sample sizes is presented in
Figure 9(a3) as the regression coefficient path. These paths represent the regression coefficients for all wavelength variables and provide insights into the correlation between different wavelength variable subsets and their regression coefficients. Variables with higher regression coefficients contribute more significantly to the model. The vertical dashed line indicated by a blue asterisk represents the position where the minimum RMSECV is achieved, signifying the optimal sample size and variable subset. Across 24 sampling iterations, the CARS algorithm selected a total of 80 variables. The distribution of the selected feature wavelengths is portrayed in
Figure 9b.
The germination rate SVR prediction model was constructed utilizing Near Infrared (NIR) spectral data from rapeseed plant seeds, undergoing SG convolution smoothing preprocessing and feature variable selection.
Table 5 summarizes SVR modeling outcomes obtained via different variable selection algorithms. Notably, the SVR model, built with 80 selected feature wavelength points using the CARS algorithm, exhibited superior performance. It registered a training set RMSEC of 14.57% and a determination coefficient R
2c of 0.8266. The testing set RMSEP was 19.10%, accompanied by a determination coefficient R
2p of 0.8149. Comparison of the modeling results, using the selected data and the original spectra, revealed significant improvements. R
2p increased from 0.4196 to 0.8149, while RMSEP decreased from 26.63% to 19.10%. This data signifies a substantial improvement in the predictive capability of the germination rate model, with a 94.21% improvement in R
2p and a 28.28% reduction in RMSEP. The training set and testing set prediction results for the optimal model are visually represented in
Figure 10.
3.2.3. Joint-Feature Variable Screening Method
Based on the test findings from
Section 3.2.1 and
Section 3.2.2, it is apparent that different variable screening algorithms optimize the modeling of characteristic wavelengths, thereby enhancing detection performance. Notably, the SVR modeling performance of the SiPLS and CARS methods proves superior. In a bid to further enhance data quality and improve the model’s detection performance, a refined approach incorporating SiPLS and CARS has been introduced. A comparative analysis was conducted on the SVR modeling results from diverse feature variable screening algorithms to identify sensitive variables, simplify model complexity, and bolster detection performance. The modeling outcomes are displayed in
Table 6.
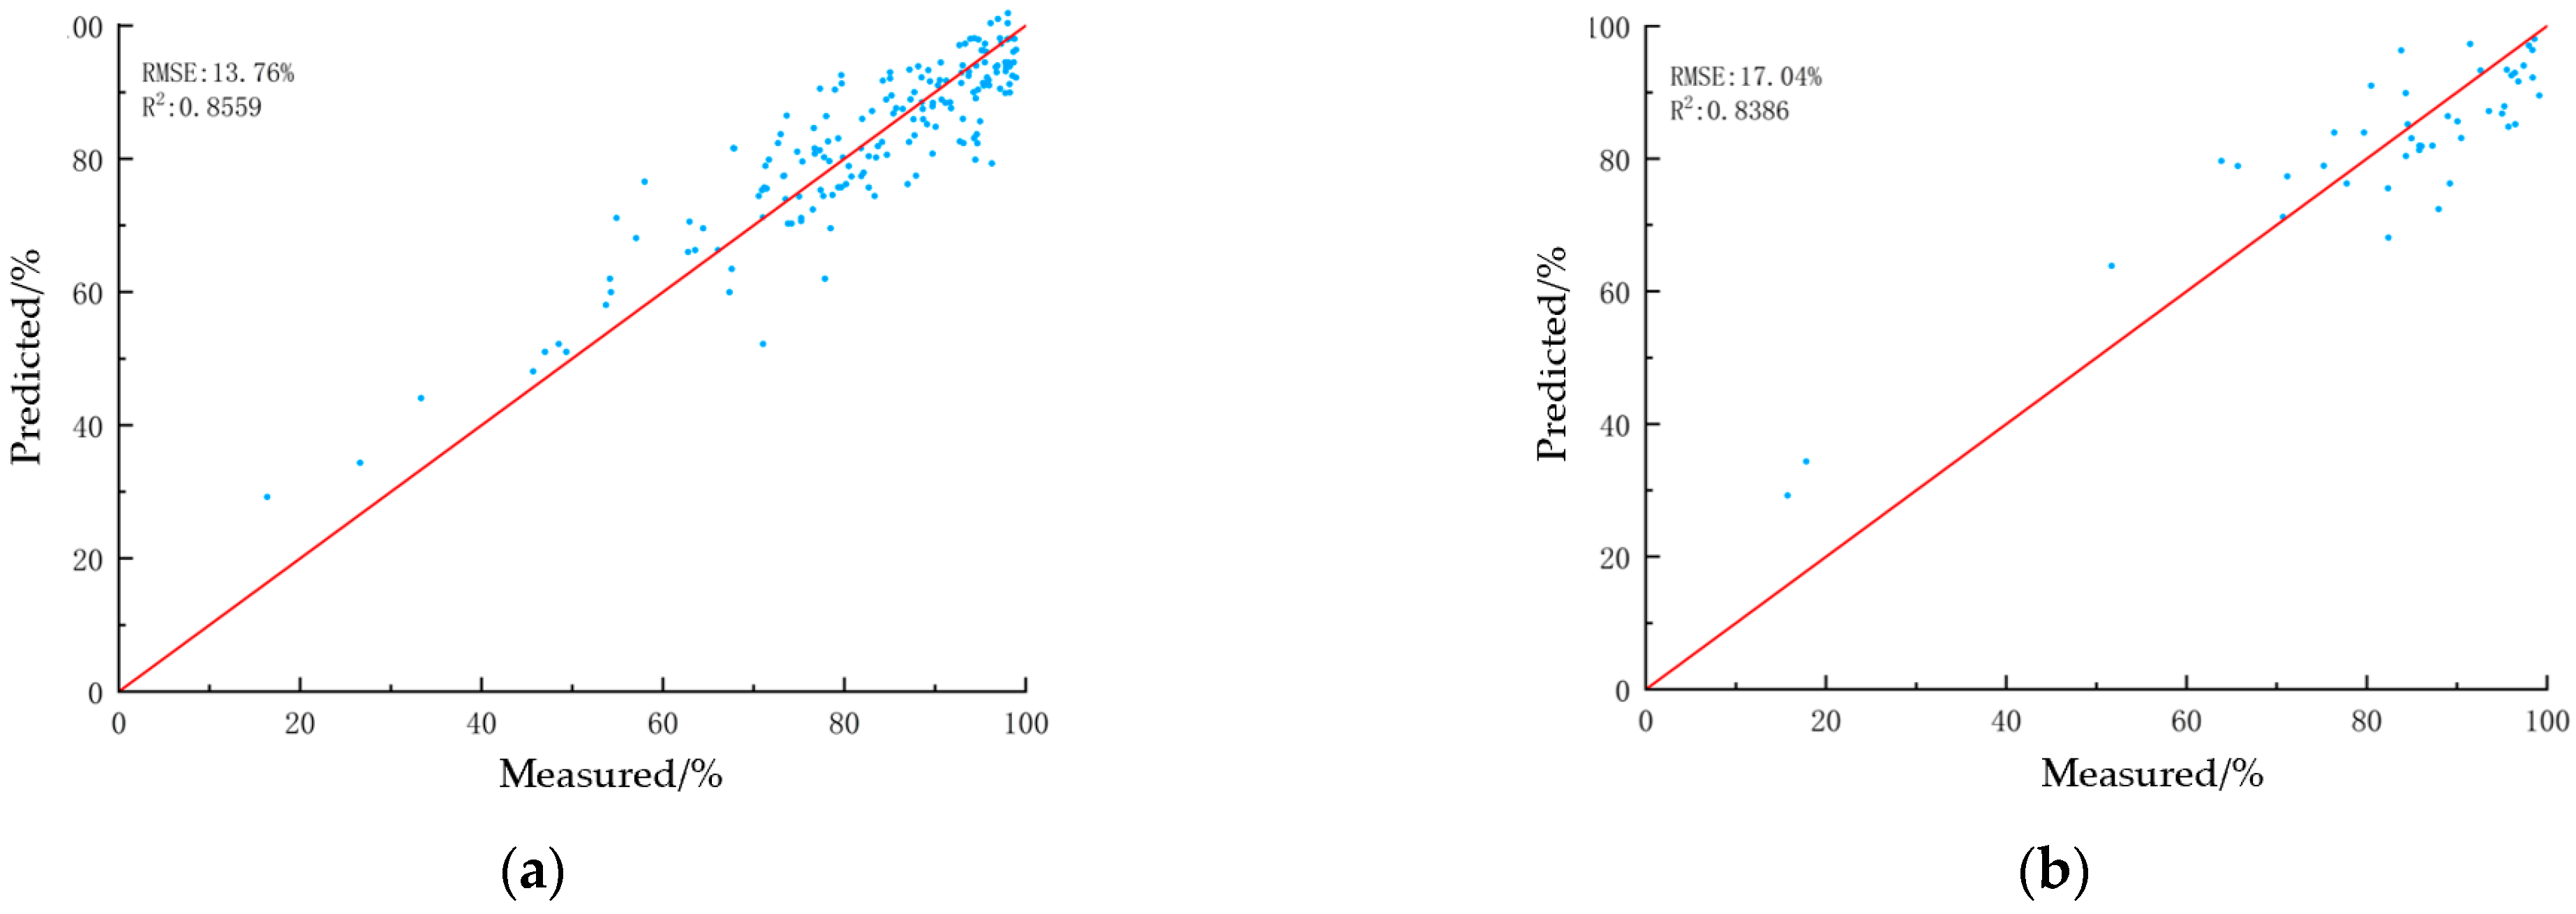
The comparative results indicate that the combination of SiPLS with the RF algorithm (SIPLS–RF) for feature variable screening results in the most effective SVR modeling detection. The modeling incorporates 50 feature wavelength points, representing a compression of wavelengths to 2.41% of the full spectrum. The Root Mean Square Error (RMSEC) of the training set stands at 13.76%, with a determination coefficient (R2c) of 0.8559. The Root Mean Square Error (RMSEP) for the test set registers at 17.04%, with a determination coefficient (R2p) of 0.8386.
When compared to full-spectrum data modeling, the Root Mean Square Error of the test set decreases by 36.01%, and the coefficient of determination increases by 99.86%. This marks a significant improvement in the model’s detection performance. The SVR modeling results derived from the SiPLS–RF feature variable screening are illustrated in
Figure 11.
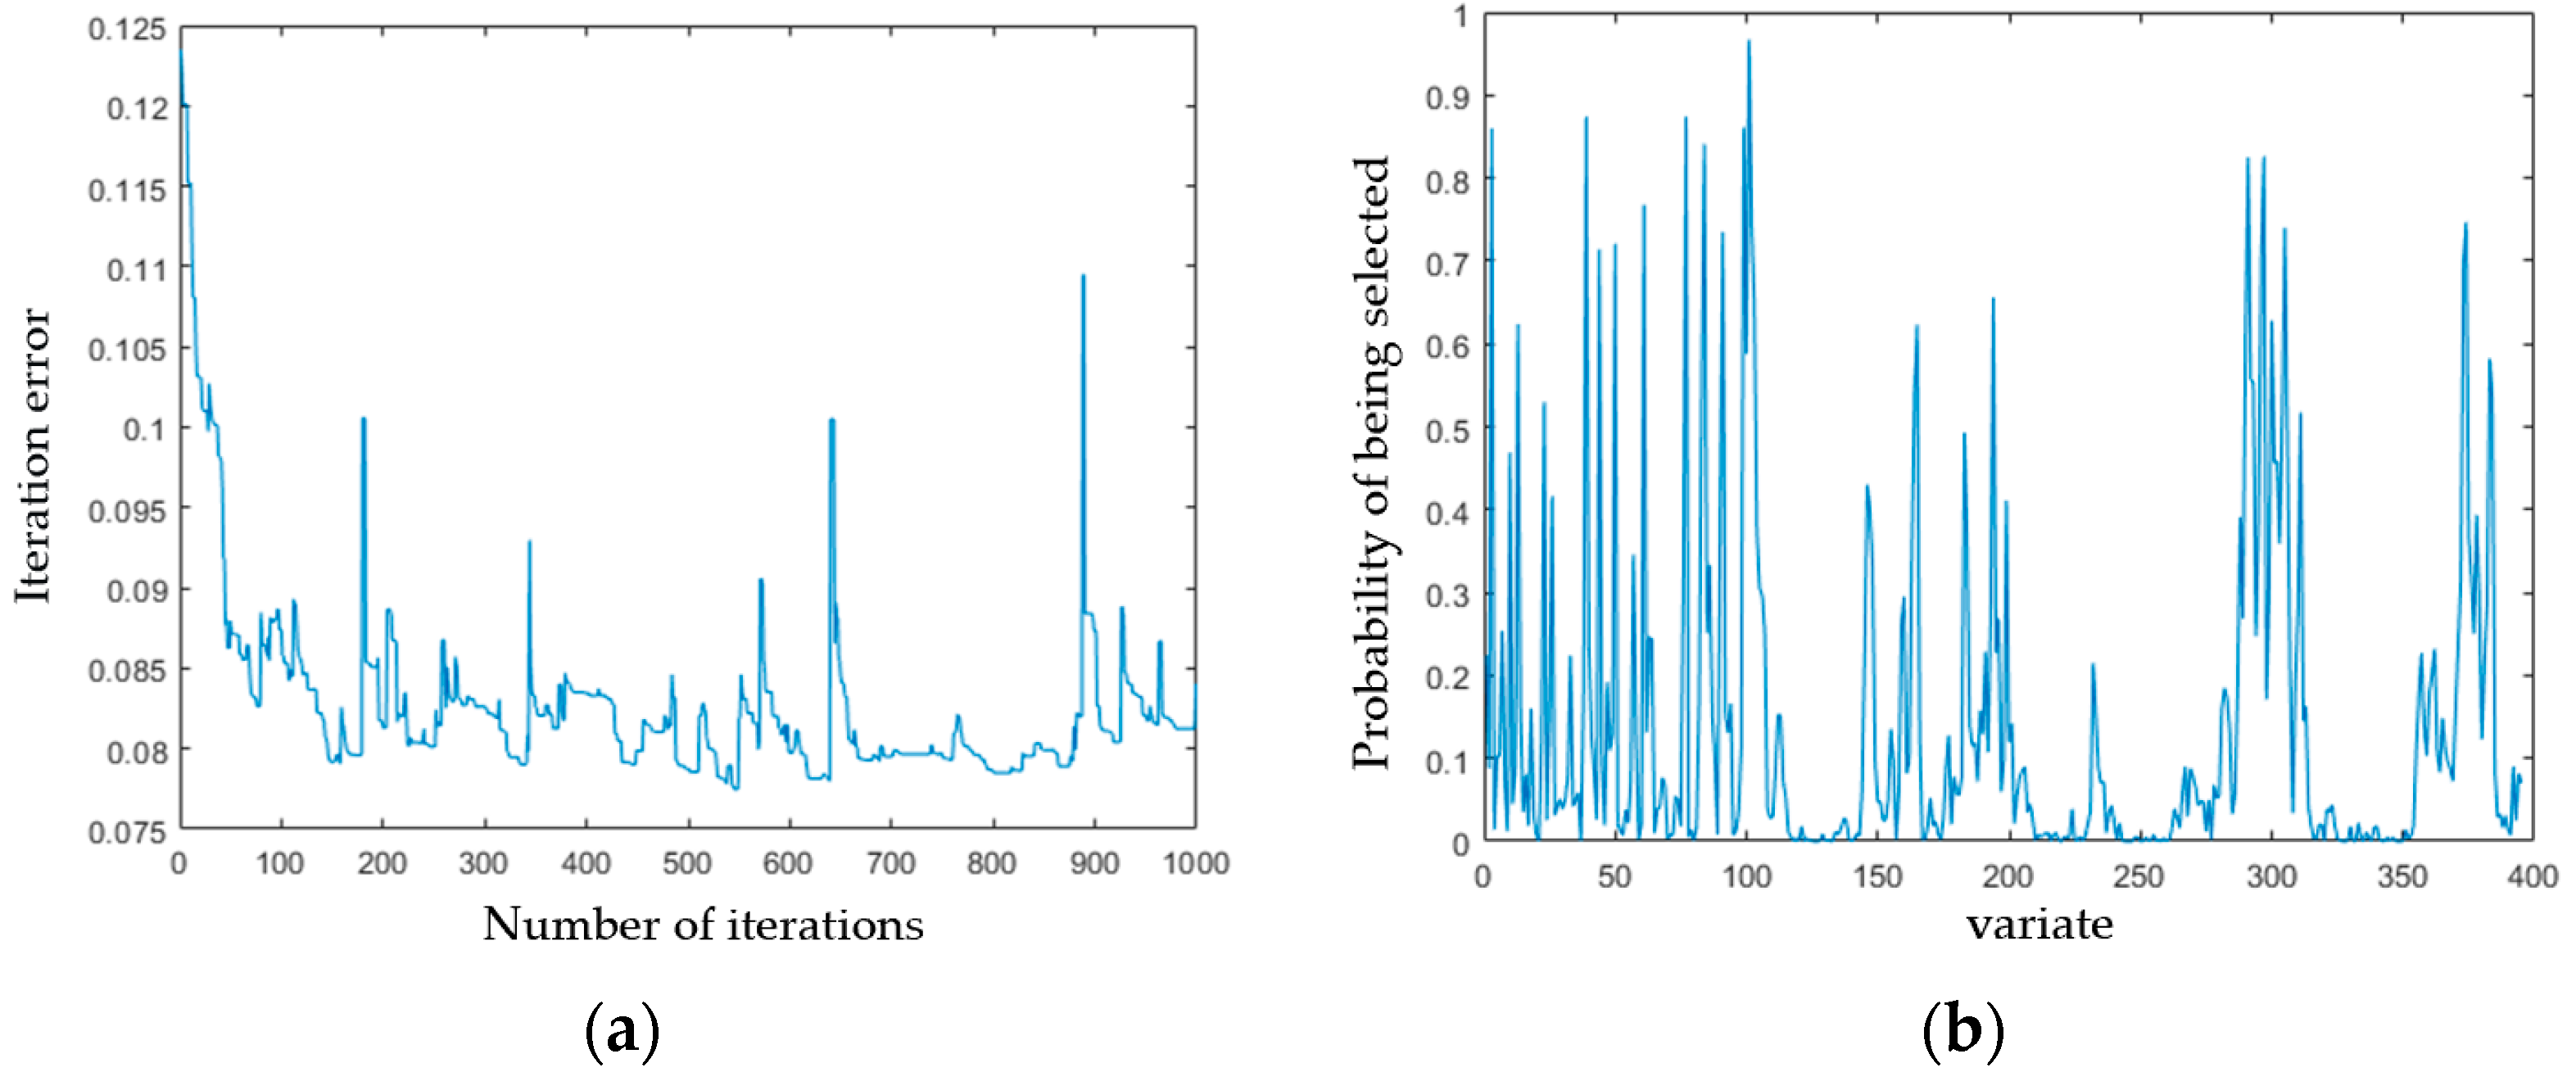
By examining the joint-variable screening process of the SIPLS–RF algorithm, we observed that RF optimization was performed on the 395 feature variables identified via SiPLS. The variation of the SIPLS–RF iteration error is depicted in
Figure 12a, with the smallest error registered when the iteration count is at 545. The selection probabilities of different variables are displayed in
Figure 12b, with the 395 variables ordered in descending sequence based on their likelihood of selection. A selection probability of 0.35 serves as the threshold, with variables surpassing this threshold retained as key variables for modeling. At this juncture, 50 characteristic wavelengths were chosen, their dispersion is depicted in
Figure 13.
3.3. Analysis of Feature Wavelengths
The near-infrared spectra of seeds yielded a mixed spectrum that reflects their internal composition. Within this spectrum, specific wavelength ranges are where the seeds display spectral peaks. The positions and variations of these peaks correlate with internal physiological and chemical indicators of the seeds [
16,
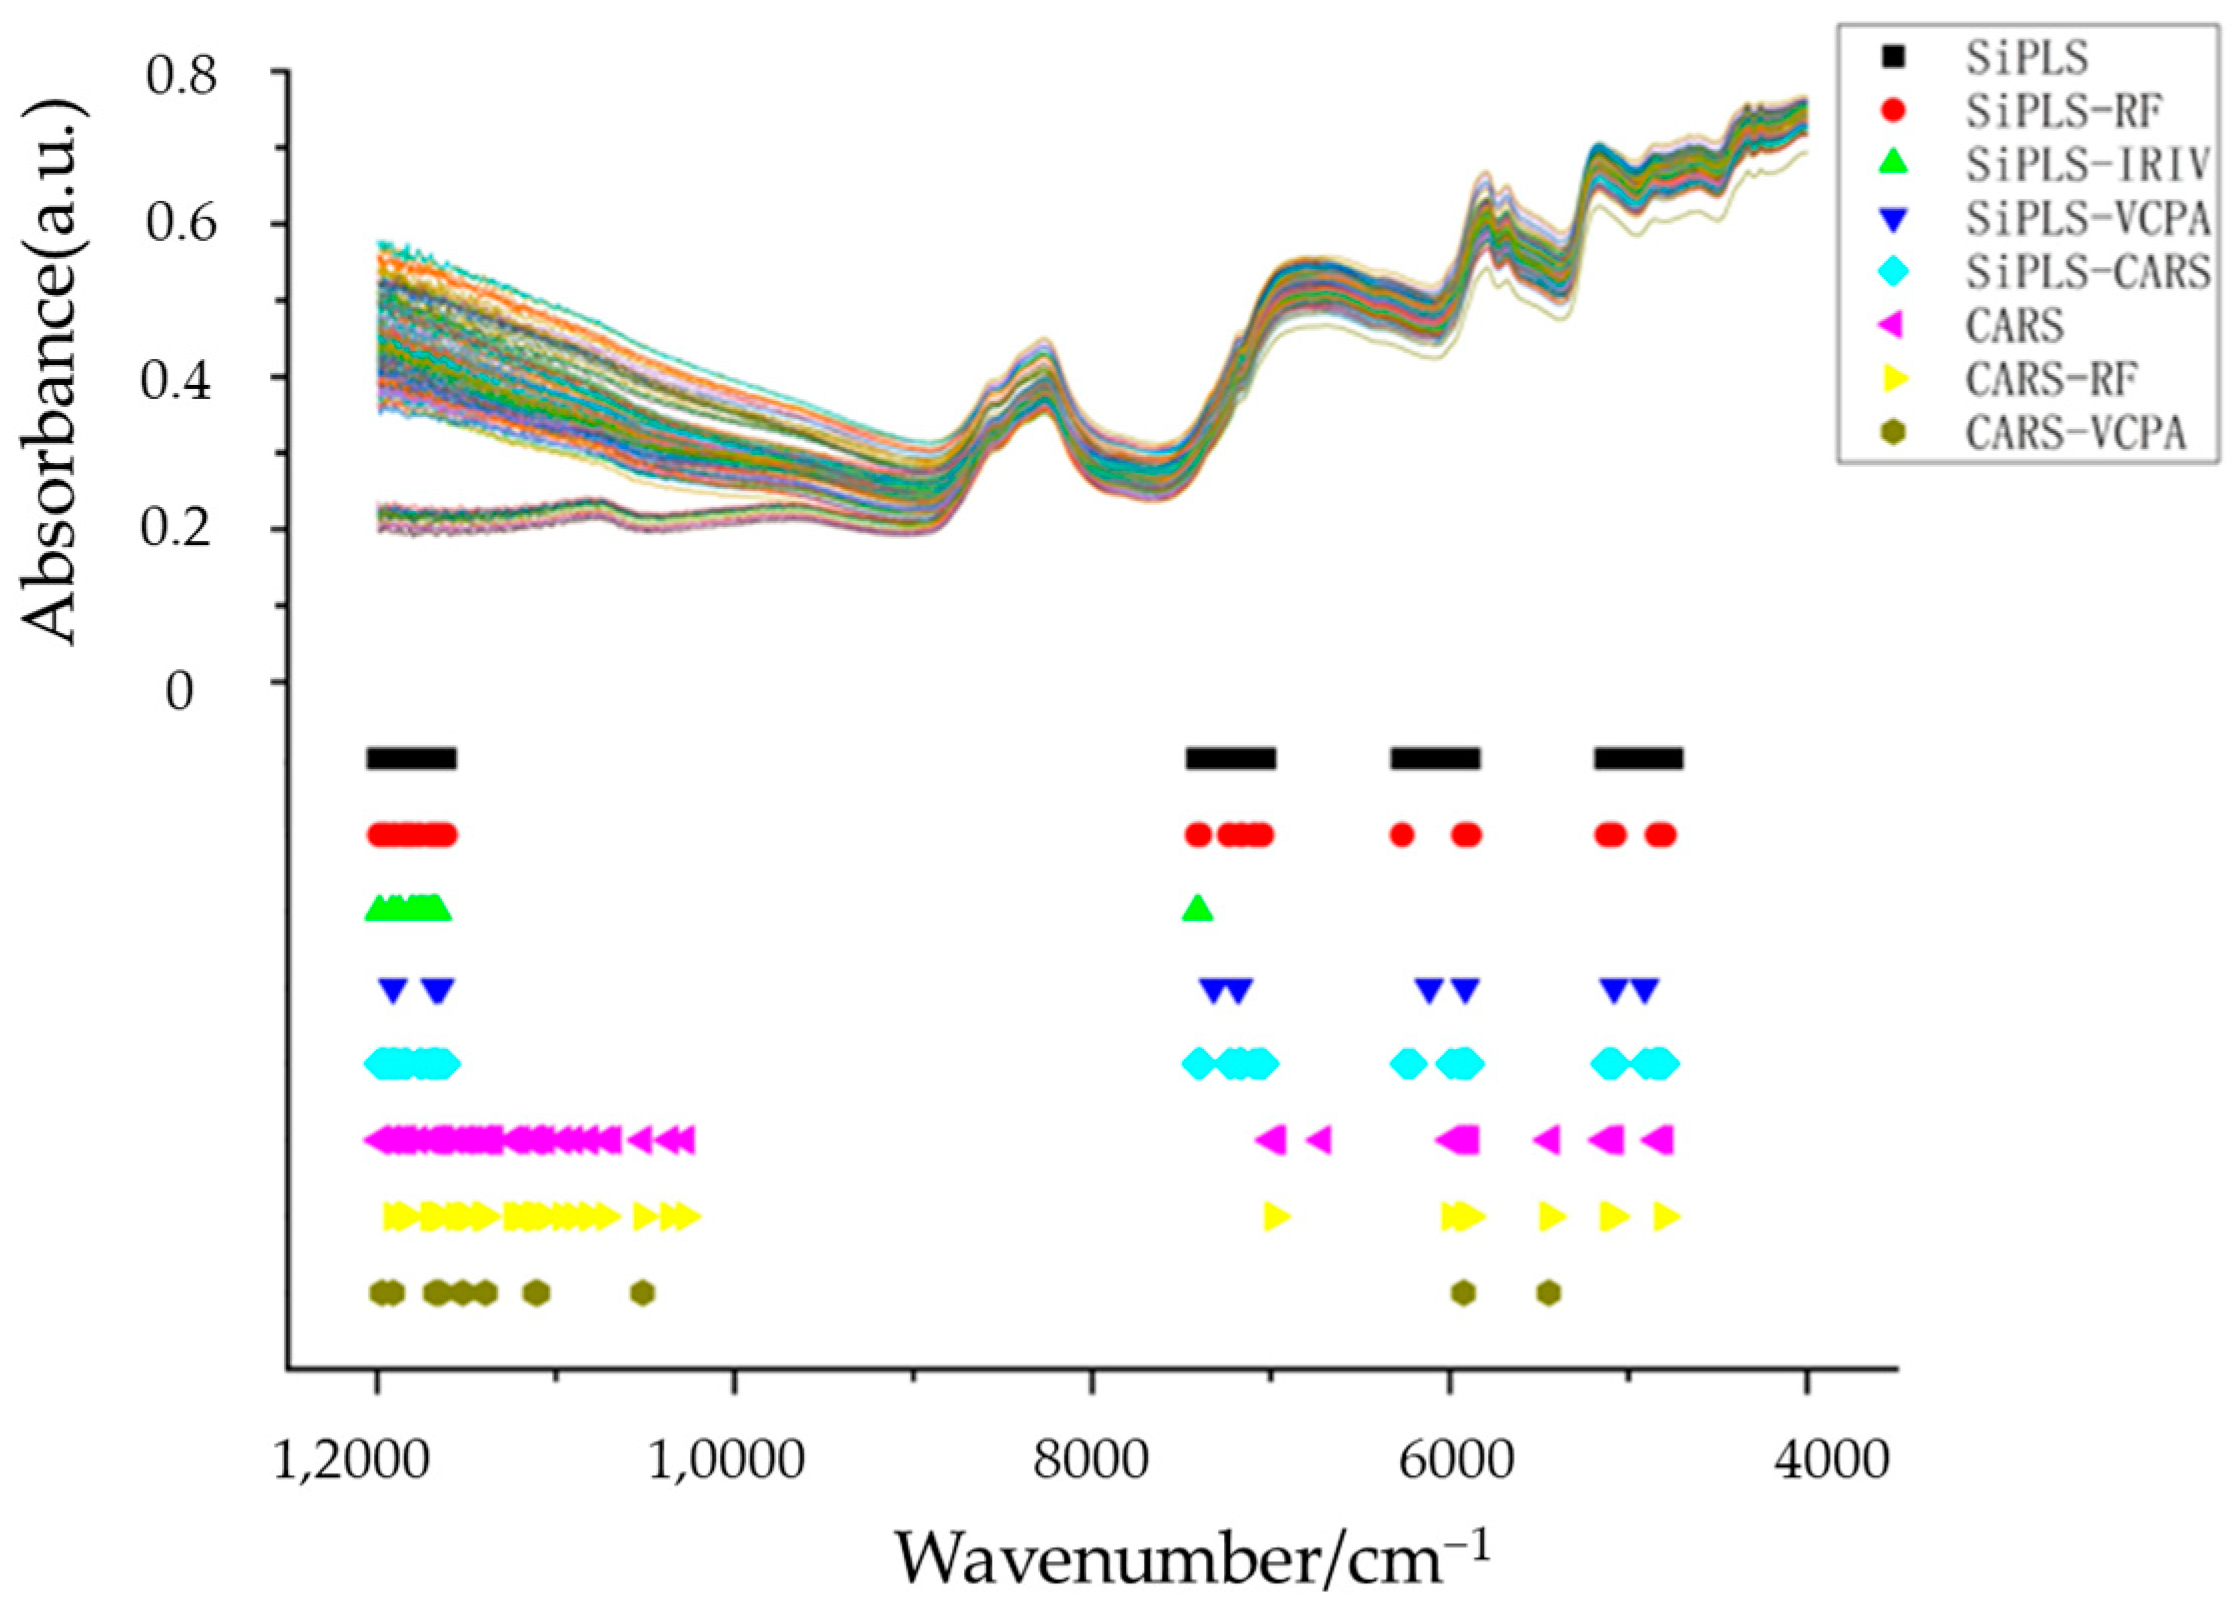
17]. Different feature variable selection methods employed in model development identify certain common spectral regions.
Figure 14 portrays the feature wavelengths chosen via different variable selection algorithms.
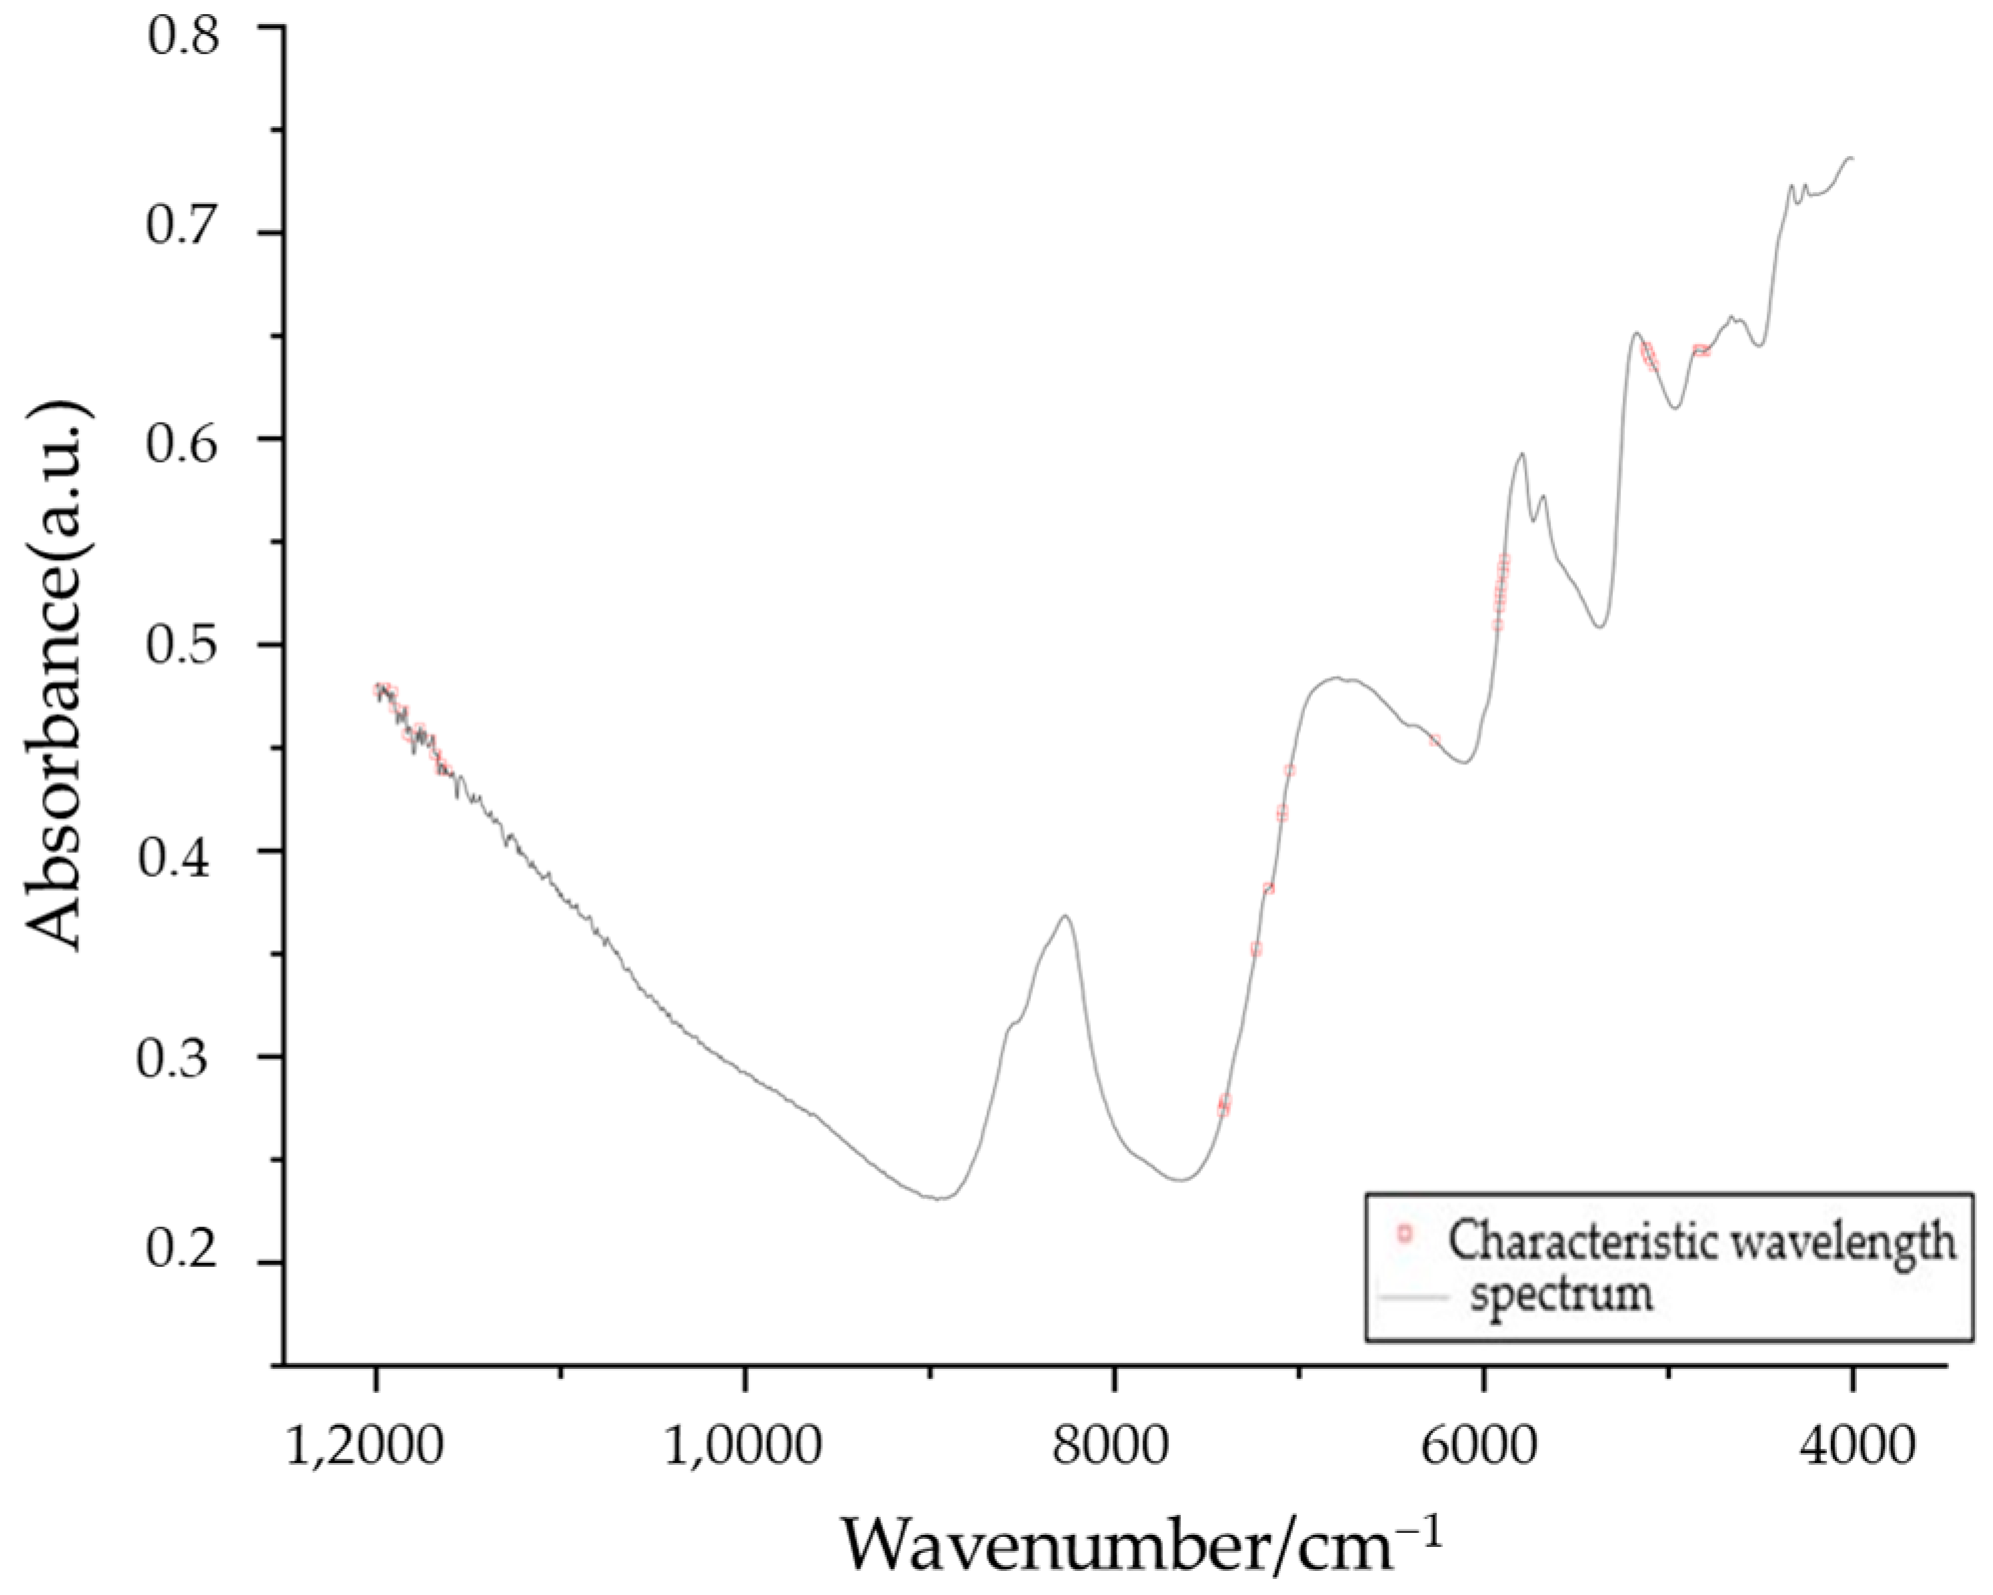
The feature variables selected via the SiPLS–RF algorithm for SVR modeling yielded the most accurate prediction results. The traceability analysis of the chosen variables revealed the wavelength points to be primarily concentrated around 5150 cm−1, 4800 cm−1, 4950 cm−1, and 6920 cm−1. The pronounced absorption peak at 5150 cm−1 corresponds to the combined spectrum band of water’s (H2O) anti-symmetric stretching and bending vibration, indicating its relation to the H2O content within the seed. This water activates the enzymes that control seed germination and is involved in the germination process itself.
The points at 4800 cm
−1, 4950 cm
−1, and 6920 cm
−1 originate from the -OH in the carboxyl group (-COOH), and the combination frequency of -OH stretching vibration and -CH bending vibration at 4800 cm
−1 and 4950 cm
−1. At 6920 cm
−1, the carboxylic acid monomer features non-bonded or free -OH stretching vibration doubled, and -COOH was the functional group of oleic acid. Research has shown that under identical stress conditions, rapeseed seeds with high oleic acid content exhibit a lower germination rate than those with low or normal oleic acid content, thereby affecting seed vigor [
18].
The characteristic bands identified via the SiPLS–RF variable selection method mirror the information related to germination rate within the seed and reflect the relationship between relevant substances and changes in the germination rate. This provides preliminary insight into the mechanism for detecting germination rates in rapeseed seeds using NIR.
4. Discussion
The near-infrared (i.e., NIR) spectra of seeds impart crucial insights into the constitution of internal substances. Nevertheless, hurdles such as low absorption intensity and severe peak overlapping in the spectra, along with variations instigated by sample morphology, environmental factors, and spectrometer conditions, can inject noise into the spectral acquisition process. Furthermore, the modeling dataset frequently incorporates a vast number of variables relative to the number of samples, engendering redundancy and subpar modeling performance. Consequently, preprocessing methods and feature variable selection techniques were deployed to scrutinize the key elements influencing NIR quantitative models of seed germination rates from a chemometrics standpoint. By mitigating noise and non-linear variables and curtailing the impact of interfering variables on the modeling process, the complexity of the models was diminished, culminating in enhanced prediction accuracy and stability [
19,
20].
The integration of the SiPLS and RF algorithm is based on a synergistic principle. The RF algorithm initiates a random selection for the variable set, which can lead to uncertainty in variable information. During the variable selection process, the RF algorithm may incorporate variables devoid of information or those that present interference information, leading to suboptimal detection performance.
SiPLS, on the other hand, offers an initial filtering process for the characteristic wavelength interval, generating variables that carry sensitive information related to the germination rate. This process curtails the influence of other uninformative or weakly associated variables on the modeling performance.
As such, we initially employed the SiPLS feature interval of the full spectrum for preliminary screening, followed by using these pre-screened variables as the initial variable set for the RF algorithm. The goal is to select feature variables of higher importance. Consequently, the initial variable set consists of information wavelengths with strong pertinence, which effectively enhances detection accuracy and operational efficiency. This results in a significant improvement in the model’s detection performance.
Compared to SiPLS alone, the SIPLS–RF screening process reduces the number of feature variables to only 12.66%. This reduction results in a decrease of the Root Mean Square Error for the SVR modeling performance test set of 19.05%, while the determination coefficient increases by 8.03%. This highlights the beneficial impact of this integrative approach on the model’s performance.
In this investigation, an SVR model predicated on SiPLS–RF preprocessing was constructed to forecast the average germination rate of rapeseed plant seed batches. The model evinced commendable performance in predicting germination rates for seeds hailing from different varieties and artificially aged seed batches. However, it is noteworthy that discrepancies may exist between seeds aged artificially and those aged naturally, and ensuing research could incorporate samples from disparate years to bolster the practicality and stability of NIR analysis and prediction models.
5. Conclusions
This research proposes an innovative method for the accurate and automatic detection of rapeseed seed germination rates. The SVR model established by the SG convolution smoothing preprocessing method combined with the SiPLS-RF variable screening method was used to construct a robust and reliable rape seed germination rate detection model.
A comparative analysis and optimization of the spectral preprocessing method, SG convolution smoothing, was performed. Additionally, feature wavelength screening algorithms such as BiPLS, SiPLS, IRIV, VCPA, CARS, and RF, along with their combinations, were evaluated.
The SIPLS–RF algorithm facilitated the optimization of 50 wavelengths, identified as critical modeling variables. The key variable wavelengths predominantly originated from the combined spectrum band of water’s (H2O) anti-symmetric stretching and bending vibrations, the combination frequency of -OH stretching vibration and -CH bending vibration in carboxyl groups (-COOH), and the double frequency of unbonded or free -OH stretching vibration in carboxylic acid monomers. These wavelengths correlate with water and oleic acid, among other substances that influence the germination rate.
This study also presented an analysis of the mechanism underlying seed germination rate detection using near-infrared spectroscopy. We established an SVR germination rate detection model for the rapeseed seed near-infrared spectrum based on SG convolution smoothing. The determination coefficient and Root Mean Square Error of the test set were 0.8386 and 17.04%, respectively, outperforming the full spectrum model by 99.86% and 36.01%.
Ultimately, this methodology enables the accurate detection of germination rates for different varieties of rapeseed and seeds with varying degrees of aging. It effectively addresses the shortcomings of traditional methods, such as insufficient prediction accuracy and stability issues arising from complex sample properties or limited calibration sample sizes. This methodology provides substantial technical support for the development of NIR prediction models for rapeseed plant seed germination rates, particularly for small-sized seeds and a diverse range of varieties.
Author Contributions
Conceptualization, S.Z. and C.L.; methodology, C.C.; software, J.W. (Jizhong Wang).; validation, J.W. (Jingzhu Wu), W.M. and S.Z.; formal analysis, C.L.; investigation, C.C.; resources, W.M.; data curation, S.Z.; writing—original draft preparation, S.Z.; writing—review and editing, J.W. (Jingzhu Wu); visualization, J.W. (Jizhong Wang); supervision, W.M.; project administration, S.Z.; funding acquisition, W.M. All authors have read and agreed to the published version of the manuscript.
Funding
This research was funded by National Key Research and Development Program of China (No. 2021YFD2100601).
Informed Consent Statement
Not applicable.
Data Availability Statement
Not applicable.
Conflicts of Interest
The authors declare no conflict of interest.
References
- Atique, U.R.; Ali, H.; Fatima, Z.; Ahmad, S. Fundamentals of Seed Production and Processing of Agronomic Crops; Springer: Berlin/Heidelberg, Germany, 2019. [Google Scholar]
- Yang, G.C.; Zhou, L.; Chen, Z.J.; You, A.Q. Review of Rice Breeding Based on Commercial Breeding. J. Anhui Agric. Sci. 2017, 45, 228–229,232. [Google Scholar]
- Zhu, M.; Chen, H.J.; Li, Y.L. Investigation and Development Analysis of Seed Industry Mechanization in China. Trans. Chin. Soc. Agric. Eng. (Trans. CSAE) 2015, 31, 1–7. [Google Scholar]
- He, W.; Li, J.; Wang, X.M.; Lin, Q.; Yang, X. Current Status of Global Rapeseed Industry and Problems Countermeasures of Rapeseed Industry in China. China Oils Fats 2022, 47, 1–7. [Google Scholar]
- Wan, Q.S.; Liao, Q.X.; Liao, Y.T.; Ding, Y.; Zhang, Q.; Huang, H.; Chen, H.; Zhu, L. Situation and Prospect of Key Technology and Equipment in Mechanization and Intelligentization of Rapeseed Whole Industry Chain. J. Huazhong Agric. Univ. 2021, 40, 24–44. [Google Scholar]
- Jin, M.; Wu, C.Y.; Tang, Q. Effects of Different Harvest Periods and Methods on the Oil and Protein Contents of Rapeseed. J. China Agric. Univ. 2016, 21, 29–36. [Google Scholar]
- Zhang, H.X. Research on Vigor, Viability Testing Methods of Rice Seed and Computer Vision Application; Zhejiang University: Hangzhou, China, 2007. [Google Scholar]
- Yang, Z.L.; Tao, L.I.; Ren, B.Z. Progress Development on Near Infrared Spectroscopic in Food Safety Inspection. Food Mach. 2013, 29, 237–240. [Google Scholar]
- Chu, X.L.; Chen, P.; Li, J.Y.; Liu, D.; Xu, Y.P. Progresses and Perspectives of Near Infrared Spectroscopy Analytical Technology. J. Instrum. Anal. 2020, 39, 1181–1188. [Google Scholar]
- Kandpal, L.M.; Lohumi, S.; Kim, M.S.; Kang, J.S.; Cho, B.K. Near-infrared Hyperspectral Imaging System Coupled with Multivariate Methods to Predict Viability and Vigor in Muskmelon Seeds. Sens. Actuators B. Chem. 2016, 229, 534–544. [Google Scholar] [CrossRef]
- Baek, I.; Kusumaningrum, D.; Kandpal, L.; Lohumi, S.; Mo, C.; Kim, M.S.; Cho, B.K. Rapid Measurement of Soybean Seed Viability Using Kernel-Based Multispectral Image Analysis. Sensors 2019, 19, 271. [Google Scholar] [CrossRef] [PubMed]
- Wu, J.Z.; Dong, W.F.; Dong, J.J.; Chen, Y.; Mao, W.H.; Liu, C.L. Research on Optimization of Wheat Seed Germination Rate NIR Model Based on Si-cPLS. Spectrosc. Spectr. Anal. 2017, 37, 1114–1117. [Google Scholar]
- Hui, Y.T.; Wang, D.C.; Tang, X.; Peng, Y.Q.; Wang, H.D.; Zhang, H.F.; You, Y. Detection of Sorghum-Sudan Grass Seed Germination Rate Based on Near Infrared Spectroscopy. Spectrosc. Spectr. Anal. 2022, 42, 423–427. [Google Scholar]
- Zhang, Q.Q.; Qian, F.; Xie, L.; Wang, G.; Alateng, B.; Jiang, P.A.; Ma, H. Research on Optimization of Artificial Accelerated Aging Test and Low Temperature Germination Test. Seed 2022, 41, 1–6. [Google Scholar]
- GB/T 3543.4-1995; Testing Procedures for Crop Seeds Germination Test. Ministry of Agriculture of the People’s Republic of China: Beijing, China, 18 August 1995.
- Jerry, W.; Roiss, W. Practical Guide to Interpretive Near-Infrared Spectroscopy; CRC Press: Boca Raton, FL, USA, 2009. [Google Scholar]
- Huck, C.W.; Bec, K.B.; Grabska, J. The Use of Vibrational Spectroscopy in Medicinal Plant Analysis: Current and Future Directions. In Proceedings of the 67th International Congress and Annual Meeting of the Society for Medicinal Plant and Natural Product Research (GA) in Cooperation with the French Society of Pharmacognosy AFERP, Innsbruck, Austria, 1–5 September 2019. [Google Scholar]
- Pasquini, C. Near Infrared Spectroscopy: A Mature Analytical Technique with New Perspectives—A Review. Anal. Chim. Acta 2018, 1026, 8–36. [Google Scholar] [CrossRef] [PubMed]
- Li, H.D.; Xu, Q.S.; Liang, Y.Z. Random Frog: An Efficient Reversible Jump Markov Chain Monte Carlo-like Approach for Variable Selection with Applications to Gene Selection and Disease Classification. Anal. Chim. Acta 2012, 740, 20–26. [Google Scholar] [CrossRef] [PubMed]
- Zhao, J.; Shen, M.S.; Pu, Y.G.; Chen, A.; Li, H. Out-of-warehouse Evaluation and Prediction Model of Apple Based on Near-infrared Spectroscopy Combined with Multiple Quality Indexes. Trans. Chin. Soc. Agric. Mach. 2023, 54, 386–395. [Google Scholar]
Figure 1.
Near-infrared spectra of rapeseed plant seeds.
Figure 1.
Near-infrared spectra of rapeseed plant seeds.
Figure 2.
Preprocessing of near-infrared spectra for rapeseed plant seeds. (a) MC. (b) SNV. (c) MSC. (d) FD. (e) SG convolutional smoothing. (f) SG convolutional smoothing + MC. (g) SG convolutional smoothing + SNV. (h) SG convolutional smoothing + MSC. (i) SG convolutional smoothing + MC.
Figure 2.
Preprocessing of near-infrared spectra for rapeseed plant seeds. (a) MC. (b) SNV. (c) MSC. (d) FD. (e) SG convolutional smoothing. (f) SG convolutional smoothing + MC. (g) SG convolutional smoothing + SNV. (h) SG convolutional smoothing + MSC. (i) SG convolutional smoothing + MC.
Figure 3.
SVR model predictions of rapeseed plant seed germination rates after SG convolution smoothing preprocessing. (a) Training set. (b) Testing set.
Figure 3.
SVR model predictions of rapeseed plant seed germination rates after SG convolution smoothing preprocessing. (a) Training set. (b) Testing set.
Figure 4.
Feature wavelength selection using SiPLS algorithm with joint intervals 4.
Figure 4.
Feature wavelength selection using SiPLS algorithm with joint intervals 4.
Figure 5.
Feature wavelength selection using BiPLS algorithm. (a) Screening feature interval. (b) RMSECV as a function of the number of principal Components.
Figure 5.
Feature wavelength selection using BiPLS algorithm. (a) Screening feature interval. (b) RMSECV as a function of the number of principal Components.
Figure 6.
Feature wavelength selection process and distribution using IRIV algorithm. (a) Selection process. (b) Distribution of feature wavelengths.
Figure 6.
Feature wavelength selection process and distribution using IRIV algorithm. (a) Selection process. (b) Distribution of feature wavelengths.
Figure 7.
Feature wavelength selection process and distribution using VCPA algorithm. (a) Selection process. (b) Distribution of feature wavelength.
Figure 7.
Feature wavelength selection process and distribution using VCPA algorithm. (a) Selection process. (b) Distribution of feature wavelength.
Figure 8.
The process and dispersion of feature wavelength selection employing the RF algorithm. (a) Process of variable selection. (b) Selection of feature variables via RF.
Figure 8.
The process and dispersion of feature wavelength selection employing the RF algorithm. (a) Process of variable selection. (b) Selection of feature variables via RF.
Figure 9.
Feature wavelength selection process and distribution using CARS algorithm. (a) Variable selection process. (b) CARS feature variable selection.
Figure 9.
Feature wavelength selection process and distribution using CARS algorithm. (a) Variable selection process. (b) CARS feature variable selection.
Figure 10.
CARS algorithm optimized feature variable SVR modeling detection results (a) Training set. (b) Testing set.
Figure 10.
CARS algorithm optimized feature variable SVR modeling detection results (a) Training set. (b) Testing set.
Figure 11.
Detection results of SVR modeling with optimized feature variables via SiPLS–RF algorithm. (a) Training set. (b) Testing set.
Figure 11.
Detection results of SVR modeling with optimized feature variables via SiPLS–RF algorithm. (a) Training set. (b) Testing set.
Figure 12.
Process of optimizing feature variables in SiPLS–RF algorithm. (a) Iteration error variation. (b) Variable selection probability.
Figure 12.
Process of optimizing feature variables in SiPLS–RF algorithm. (a) Iteration error variation. (b) Variable selection probability.
Figure 13.
Distribution of SiPLS–RF filtering feature variables.
Figure 13.
Distribution of SiPLS–RF filtering feature variables.
Figure 14.
Variable selection results using different algorithms.
Figure 14.
Variable selection results using different algorithms.
Table 1.
Characteristics of seed samples.
Table 1.
Characteristics of seed samples.
| Variety | Type | Planting Date | Color | Particle Size/(mm) | Shape | Quantity |
|---|
| Milky white | Milky white type | Year-round | Gray and white | 1.86~2.10 | Subspherical | 8 |
| Jing Green and spring oil | Late green stem type | Autumn and winter | Brownish yellow | 1.25~1.40 | Irregular diamond | 4 |
| Hua oil | Late draw green stem type | Autumn and winter | Yellow | 1.10~1.36 | Oval | 2 |
| Jing Guan and Jing Green | Xia Qiu green stalk type | Summer and Autumn | Brown | 1.74~2.00 | Oval | 4 |
| Kyoyan Black Leaf | Black leaf type | Year-round | Black | 1.55~1.80 | Subsphere | 6 |
| Total | 24 |
Table 2.
Statistical results of germination rates of samples.
Table 2.
Statistical results of germination rates of samples.
| Item | Sample Number | Minimum/(%) | Maximum Value/(%) | Average Value/(%) | Standard Deviation |
|---|
| Average germination rate | 228 | 15.73 | 99.13 | 83.46 | 15.09 |
Table 3.
SVR modeling results with different preprocessing methods.
Table 3.
SVR modeling results with different preprocessing methods.
| Spectral Preprocessing Method | Modeling Parameters | Training Set | Test Set |
|---|
| c | g | RMSEC/(%) | R2c | RMSEP/(%) | R2p |
|---|
| MC | 181.0193 | 0.0009765 | 27.13 | 0.6760 | 26.99 | 0.4188 |
| SNV | 11.3137 | 0.0027621 | 28.29 | 0.6491 | 28.96 | 0.3232 |
| MSC | 4 | 0.0039063 | 29.35 | 0.6212 | 29.29 | 0.2837 |
| FD | 1.4142 | 0.0009765 | 24.81 | 0.7452 | 27.71 | 0.3777 |
| SG Convolutional smoothing | 256 | 0.0009765 | 26.76 | 0.6839 | 26.87 | 0.4276 |
| SG Convolutional smoothing + MC | 181.0193 | 0.0009765 | 27.17 | 0.6750 | 26.98 | 0.4187 |
| SG Convolutional smoothing + SNV | 0.35355 | 0.03125 | 29.35 | 0.6479 | 29.43 | 0.2457 |
| SG Convolutional smoothing + MSC | 4 | 0.0039063 | 29.39 | 0.6199 | 29.29 | 0.2835 |
| SG Convolution Smooth + FD | 1.4142 | 0.0009765 | 24.92 | 0.7423 | 27.67 | 0.3745 |
Table 4.
Optimal SiPLS model results with different joint interval numbers.
Table 4.
Optimal SiPLS model results with different joint interval numbers.
| Number of Joint Intervals | Number of Intervals | Interval Combinations | Spectral Range/(cm−1) | n | R2c | RMSECV/(%) | R2p | RMSEP/(%) |
|---|
| 2 | 28 | 14 28 | 8280–7990
4280–4000 | 6 | 0.4490 | 10.76 | 0.6495 | 11.19 |
| 3 | 11 | 1 9 10 | 12,000–11,270
6170–4725 | 8 | 0.5185 | 10.15 | 0.7329 | 9.27 |
| 4 | 21 | 1 13 16 19 | 12,000–11,617
7413–7035
6267–5889
5129–4755 | 9 | 0.6003 | 9.21 | 0.7465 | 9.13 |
Table 5.
SVR modeling outcomes of feature variables utilizing various wavelength point screening algorithms.
Table 5.
SVR modeling outcomes of feature variables utilizing various wavelength point screening algorithms.
| Variable Selection Method | Number of Variables | SVR Modeling Parameters | Training Set | Test Set |
|---|
| c | g | RMSEC/(%) | R2c | RMSEP/(%) | R2p |
|---|
| There is no | 2074 | 128 | 0.0009765 | 27.88 | 0.6595 | 26.63 | 0.4196 |
| IRIV | 27 | 1024 | 0.0625 | 15.02 | 0.8144 | 26.44 | 0.6189 |
| VCPA | 12 | 181.02 | 0.1767766 | 15.38 | 0.8063 | 22.49 | 0.7320 |
| RF | 50 | 181.02 | 0.0027621 | 14.66 | 0.8275 | 21.35 | 0.7668 |
| CARS | 80 | 1024 | 0.0055242 | 14.57 | 0.8266 | 19.10 | 0.8149 |
Table 6.
Comparison of SVR modeling results using different variable selection methods.
Table 6.
Comparison of SVR modeling results using different variable selection methods.
| Variable Selection Method | Number of Variables | SVR Modeling Parameters | Training Set | Test Set |
|---|
| c | g | RMSEC/(%) | R2c | RMSEP/(%) | R2p |
|---|
| There is no | 2074 | 128 | 0.0009765 | 27.88 | 0.6595 | 26.63 | 0.4196 |
| SiPLS | 395 | 1024 | 0.0027621 | 13.20 | 0.8568 | 21.05 | 0.7763 |
| SiPLS–RF | 50 | 32,768 | 0.0013811 | 13.76 | 0.8559 | 17.04 | 0.8386 |
| SiPLS–IRIV | 16 | 8192 | 0.03125 | 18.57 | 0.7155 | 25.98 | 0.6344 |
| SiPLS–VCPA | 10 | 32,768 | 0.0110485 | 17.74 | 0.7418 | 23.94 | 0.6956 |
| SiPLS–CARS | 68 | 23,170.475 | 0.0019531 | 13.97 | 0.8392 | 19.51 | 0.8067 |
| CARS | 80 | 1024 | 0.0055242 | 14.57 | 0.8266 | 19.10 | 0.8149 |
| CARS-RF | 50 | 16,384 | 0.0009765 | 15.36 | 0.8073 | 21.99 | 0.7564 |
| CARS-VCPA | 10 | 256 | 0.125 | 18.27 | 0.7310 | 25.39 | 0.6703 |
| Disclaimer/Publisher’s Note: The statements, opinions and data contained in all publications are solely those of the individual author(s) and contributor(s) and not of MDPI and/or the editor(s). MDPI and/or the editor(s) disclaim responsibility for any injury to people or property resulting from any ideas, methods, instructions or products referred to in the content. |
© 2023 by the authors. Licensee MDPI, Basel, Switzerland. This article is an open access article distributed under the terms and conditions of the Creative Commons Attribution (CC BY) license (https://creativecommons.org/licenses/by/4.0/).


