
Spectra Prediction for WLEDs with High TLCI

Suzhou Institute of Biomedical Engineering and Technology, Chinese Academy of Sciences, Suzhou 215163, China
*
Author to whom correspondence should be addressed.
Appl. Sci. 2023, 13(14), 8487; https://0-doi-org.brum.beds.ac.uk/10.3390/app13148487
Submission received: 13 June 2023
/
Revised: 14 July 2023
/
Accepted: 20 July 2023
/
Published: 22 July 2023
(This article belongs to the Collection Optical Design and Engineering)
Abstract
:White light-emitting diodes (WLEDs) with a high television lighting consistency index (TLCI) are becoming popular in stadium, studio, and stage lighting, but they are hard to empirically manufacture because they exploit the response of a camera rather than that of the human eye. In this study, blue chips with green and red phosphors were used to build high-TLCI WLEDs, and a spectral prediction model for WLEDs used for calculating the TLCI was established. The model considers the reabsorption and re-emission of phosphors and spectral shift. To validate the model, WLEDs with a TLCI greater than 90, from 3000 K to 7000 K, were predicted and packaged. The maximum difference in the TLCI between the measured and predicted model values is approximately 1.93%. The spectral prediction model proposed in this study is expected to provide a helpful guideline for building high-TLCI WLEDs.
1. Introduction
In recent years, white light-emitting diodes (WLEDs) have been increasingly used in lighting environments to shoot films and television due to them having a long service time, good reliability, vibration resistance, environmental protection, small size, bright color, fast response, etc. [1,2,3,4,5]. One of the essential properties of a light source is color rendering. There are various metrics to quantify the color rendering performance of light sources, such as the color rendering index (CRI) [6], color quality scale (CQS) [7], fidelity index (Rf), gamut index (Rg) [8], etc. However, even if the measured values are very good, the abovementioned evaluation system cannot fully reflect the true colors of image materials due to the mismatch between the spectral component and the color characteristics of the camera’s photosensitive chip when one is evaluating the color rendering of light sources used to shoot films and television. The minimum requirements for the color rendering of light sources to shoot films and television are that the grey scale must appear grey, and the actors’ skin color must be reproduced correctly. In addition, consistency is also important [9]. Although color rendering deviations can be moderately corrected through post-grading, it usually consumes a lot of time and money, and the results are often unsatisfactory. To this end, many scholars have studied whether the light source can accurately reproduce color in films and television [10,11], and they aim to constantly improve the color rendering index calculation.
In November 2011, Mr. Alan Roberts, an engineer and optical expert of the British Broadcasting Corporation (BBC) and the European Broadcasting Union (EBU), proposed the television lighting consistency index (TLCI) [12]. The TLCI cannot only correctly represent the human eye’s perception of light color but also the camera’s reception of light color and color restoration [13]. The TLCI mimics a television camera and display using specific features that affect color performance [13], with the only input condition being the spectral power distribution of the luminaire. Therefore, accurately predicting the spectrum is crucial for designing WLEDs with a high TLCI, and until recently, no general design method other than trial and error has been used.
Traditional phosphor-converted LEDs use yellow phosphors to convert the blue light emitted by the chip into yellow light to obtain white light. White light with various correlated color temperatures (CCTs) can be obtained by adjusting the proportion of phosphor [14,15,16,17]. However, these packages have a poor CRI and have subsequently been improved upon by using a variety of phosphors with different emission spectra [18,19,20], which makes the prediction of the LED spectrum more difficult. Xu et al. [21] experimentally measured the excitation spectra of seven red phosphors and the emission spectra of two green phosphors and selected two green phosphors and one red phosphor with less resorption than that of the two phosphors. Then, the LEDs were optimized by measuring the luminescence spectra of LED chips coated with different mass ratios of phosphors, reducing the trade-off between luminous efficiency and the color rendering index. Although experiments can achieve satisfactory results, the experiments often require a lot of time and effort, and environmental interference cannot be eliminated. Sun et al. [22] proposed different models to predict the spectrum of a WLED with multiple phosphors, but Lo et al. [23] considered that the excitation spectrum of one phosphor overlaps with the emission spectra of other phosphors in LEDs with multiple phosphors, and the final spectrum could not be estimated by superimposing the emission spectra of phosphors. They successfully predicted the emission spectrum of WLEDs with multiple phosphors by considering the mixing weight ratio of the phosphors, reabsorption, and re-emission. However, the mathematical model proposed did not consider the problem of spectral shift caused by the increase in the driving current. Ying et al. [24] also neglected this. Due to the fact that the emission spectrum of the phosphor varies, the deviation of the final predicted color coordinates is relatively high.
In this paper, to obtain WLEDs with a high TLCI, a spectral prediction model for dual-phosphor WLEDs was proposed to predict the emission spectrum. The model has considered the reabsorption and re-emission of phosphors and the spectral shift with the driving current. To validate the model, WLEDs were packaged by mixing red and green phosphors. The spectra were measured and compared with the predicted results. The result demonstrates that the proposed model can predict the emission spectra of WLEDs with a high degree of accuracy. We packaged high-TLCI WLEDs with a target color temperature that was achieved by adjusting the ratio of the phosphor. This paper is expected to provide a method for quickly packing high-TLCI WLEDs.
2. Materials and Methods
2.1. Experimental Materials and Laboratory Equipment
A blue LED chip (GaN, 453.5 nm) was obtained from San’an Optoelectronics Technology Co., Ltd. (Xiamen, China); green phosphor GY525-LH (Y3(Ga,Al)5O12:Ce3+) was obtained from Raypower Optoelectronics (Suzhou) Co., Ltd. (Suzhou, China); red phosphor NRL655D (Ca(Sr)AlSiN3:Eu2+) was obtained from Raypower Optoelectronics (Suzhou) Co., Ltd.; A glue and B glue were obtained from Dow Corning Company (Midland, MI, USA); an integrating sphere (SSP6612 Photometric Colorimetric Electric Tester for LEDs) was obtained from HangZhou Starspec Optoelectronic Technology Co., Ltd. (Hangzhou, China); DC power supply HSPY-30-10 was obtained from Beijing Hansheng Puyuan Technology Co., Ltd. (Beijing, China); a thermistor was obtained from Songtian Electronics Co., Ltd. (Shantou, China); silicone grease ARCTIC MX-4 was obtained from ARCTIC Inc.
2.2. Experimental Methods
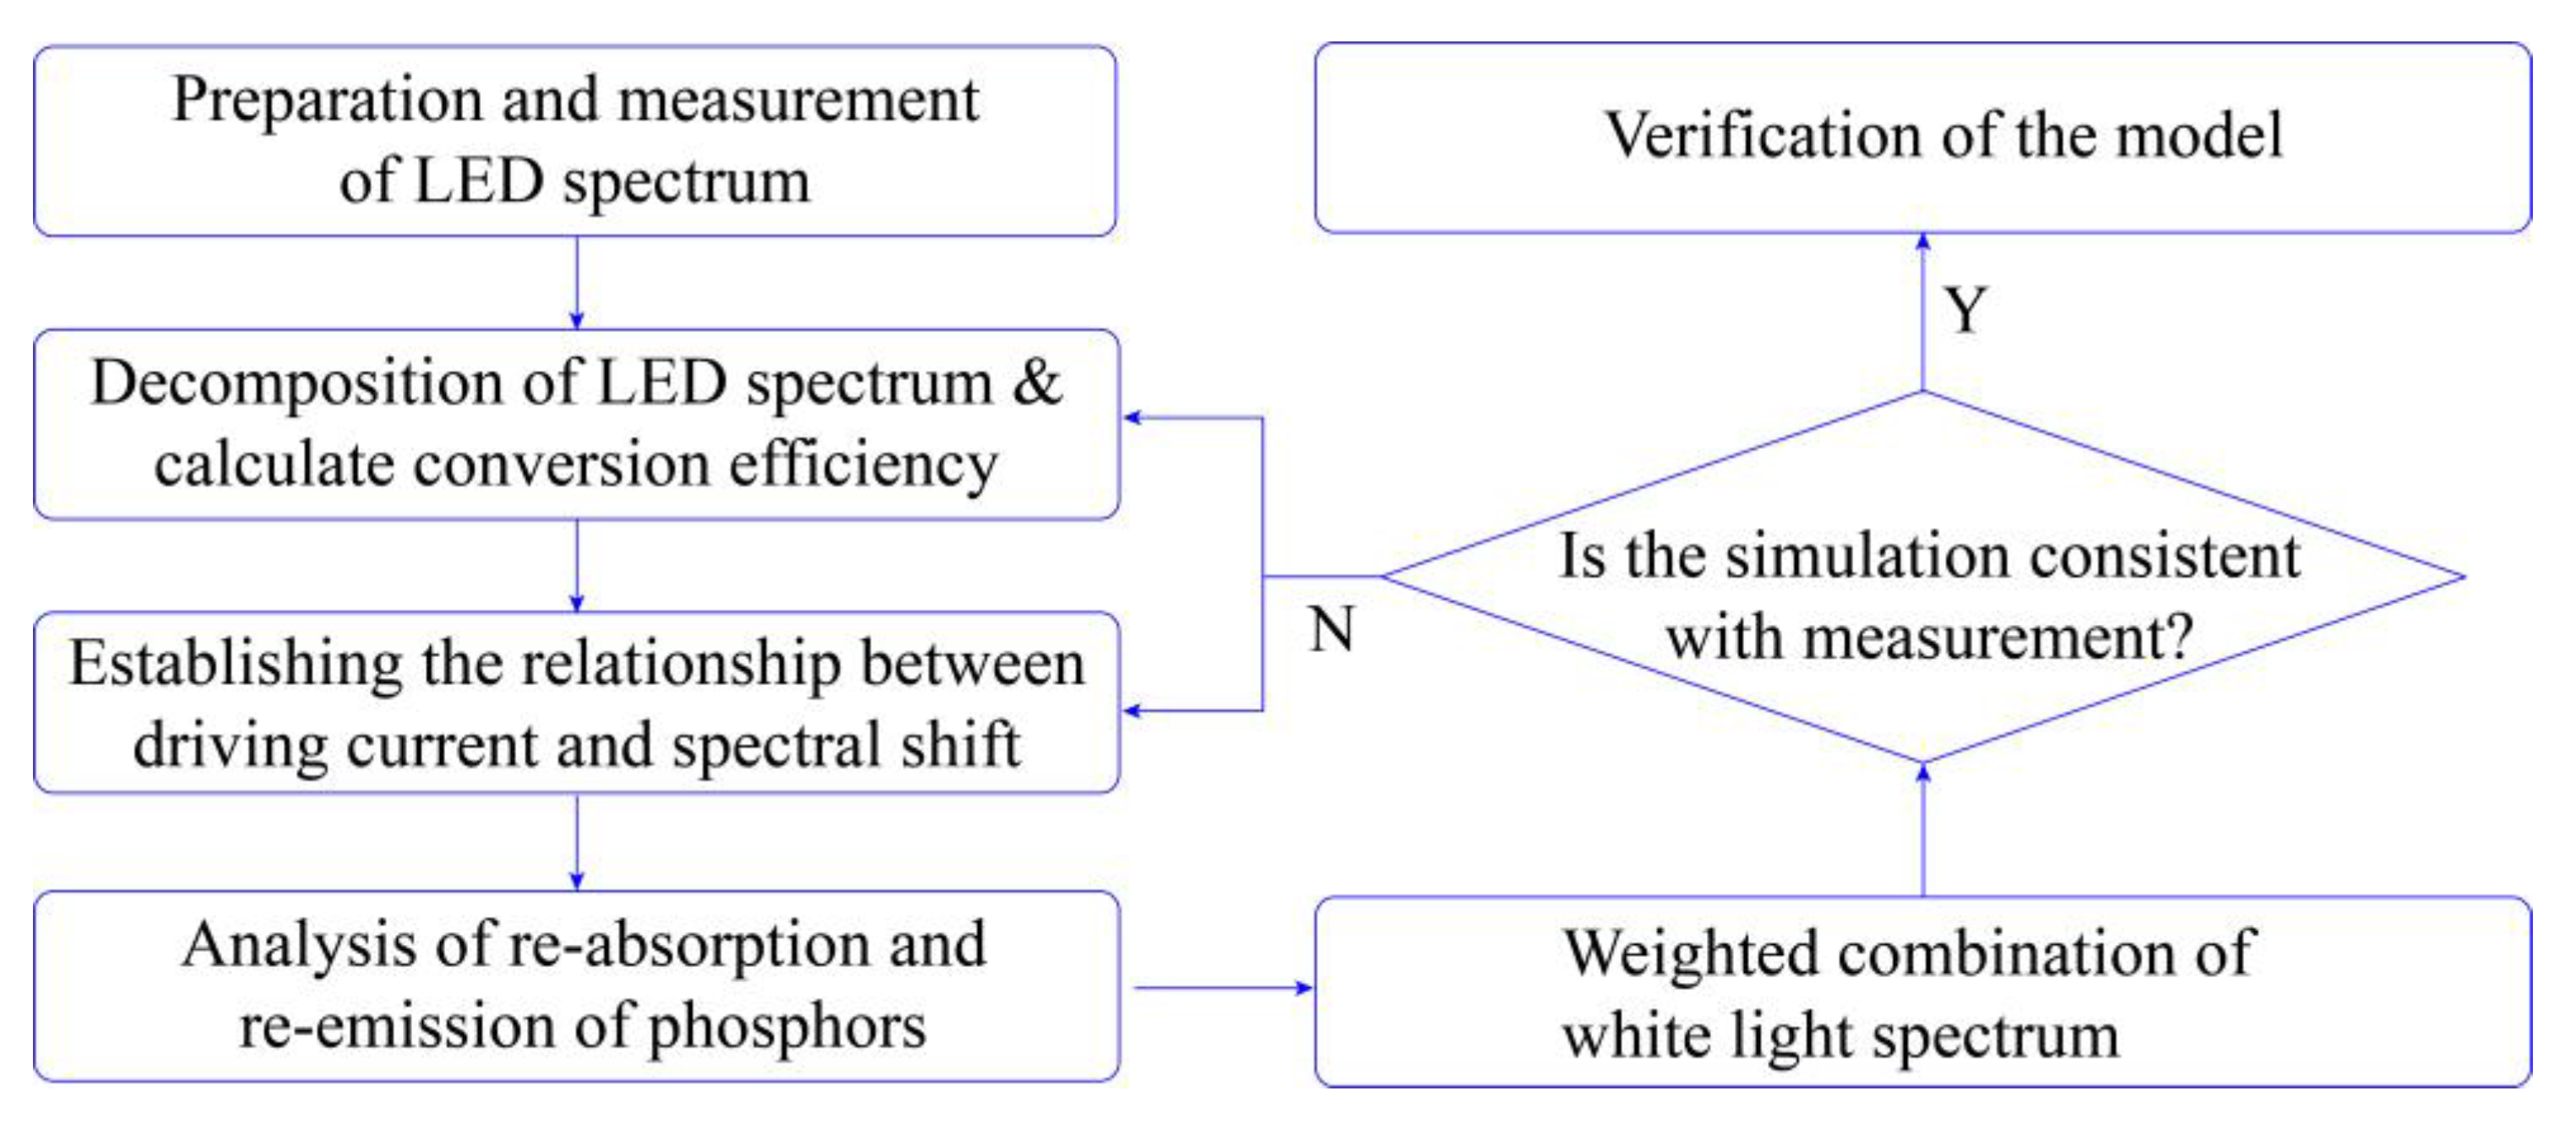
To study the spectral prediction model of dual-phosphor WLEDs, the authors of this study performed the steps illustrated in the flowchart in Figure 1.
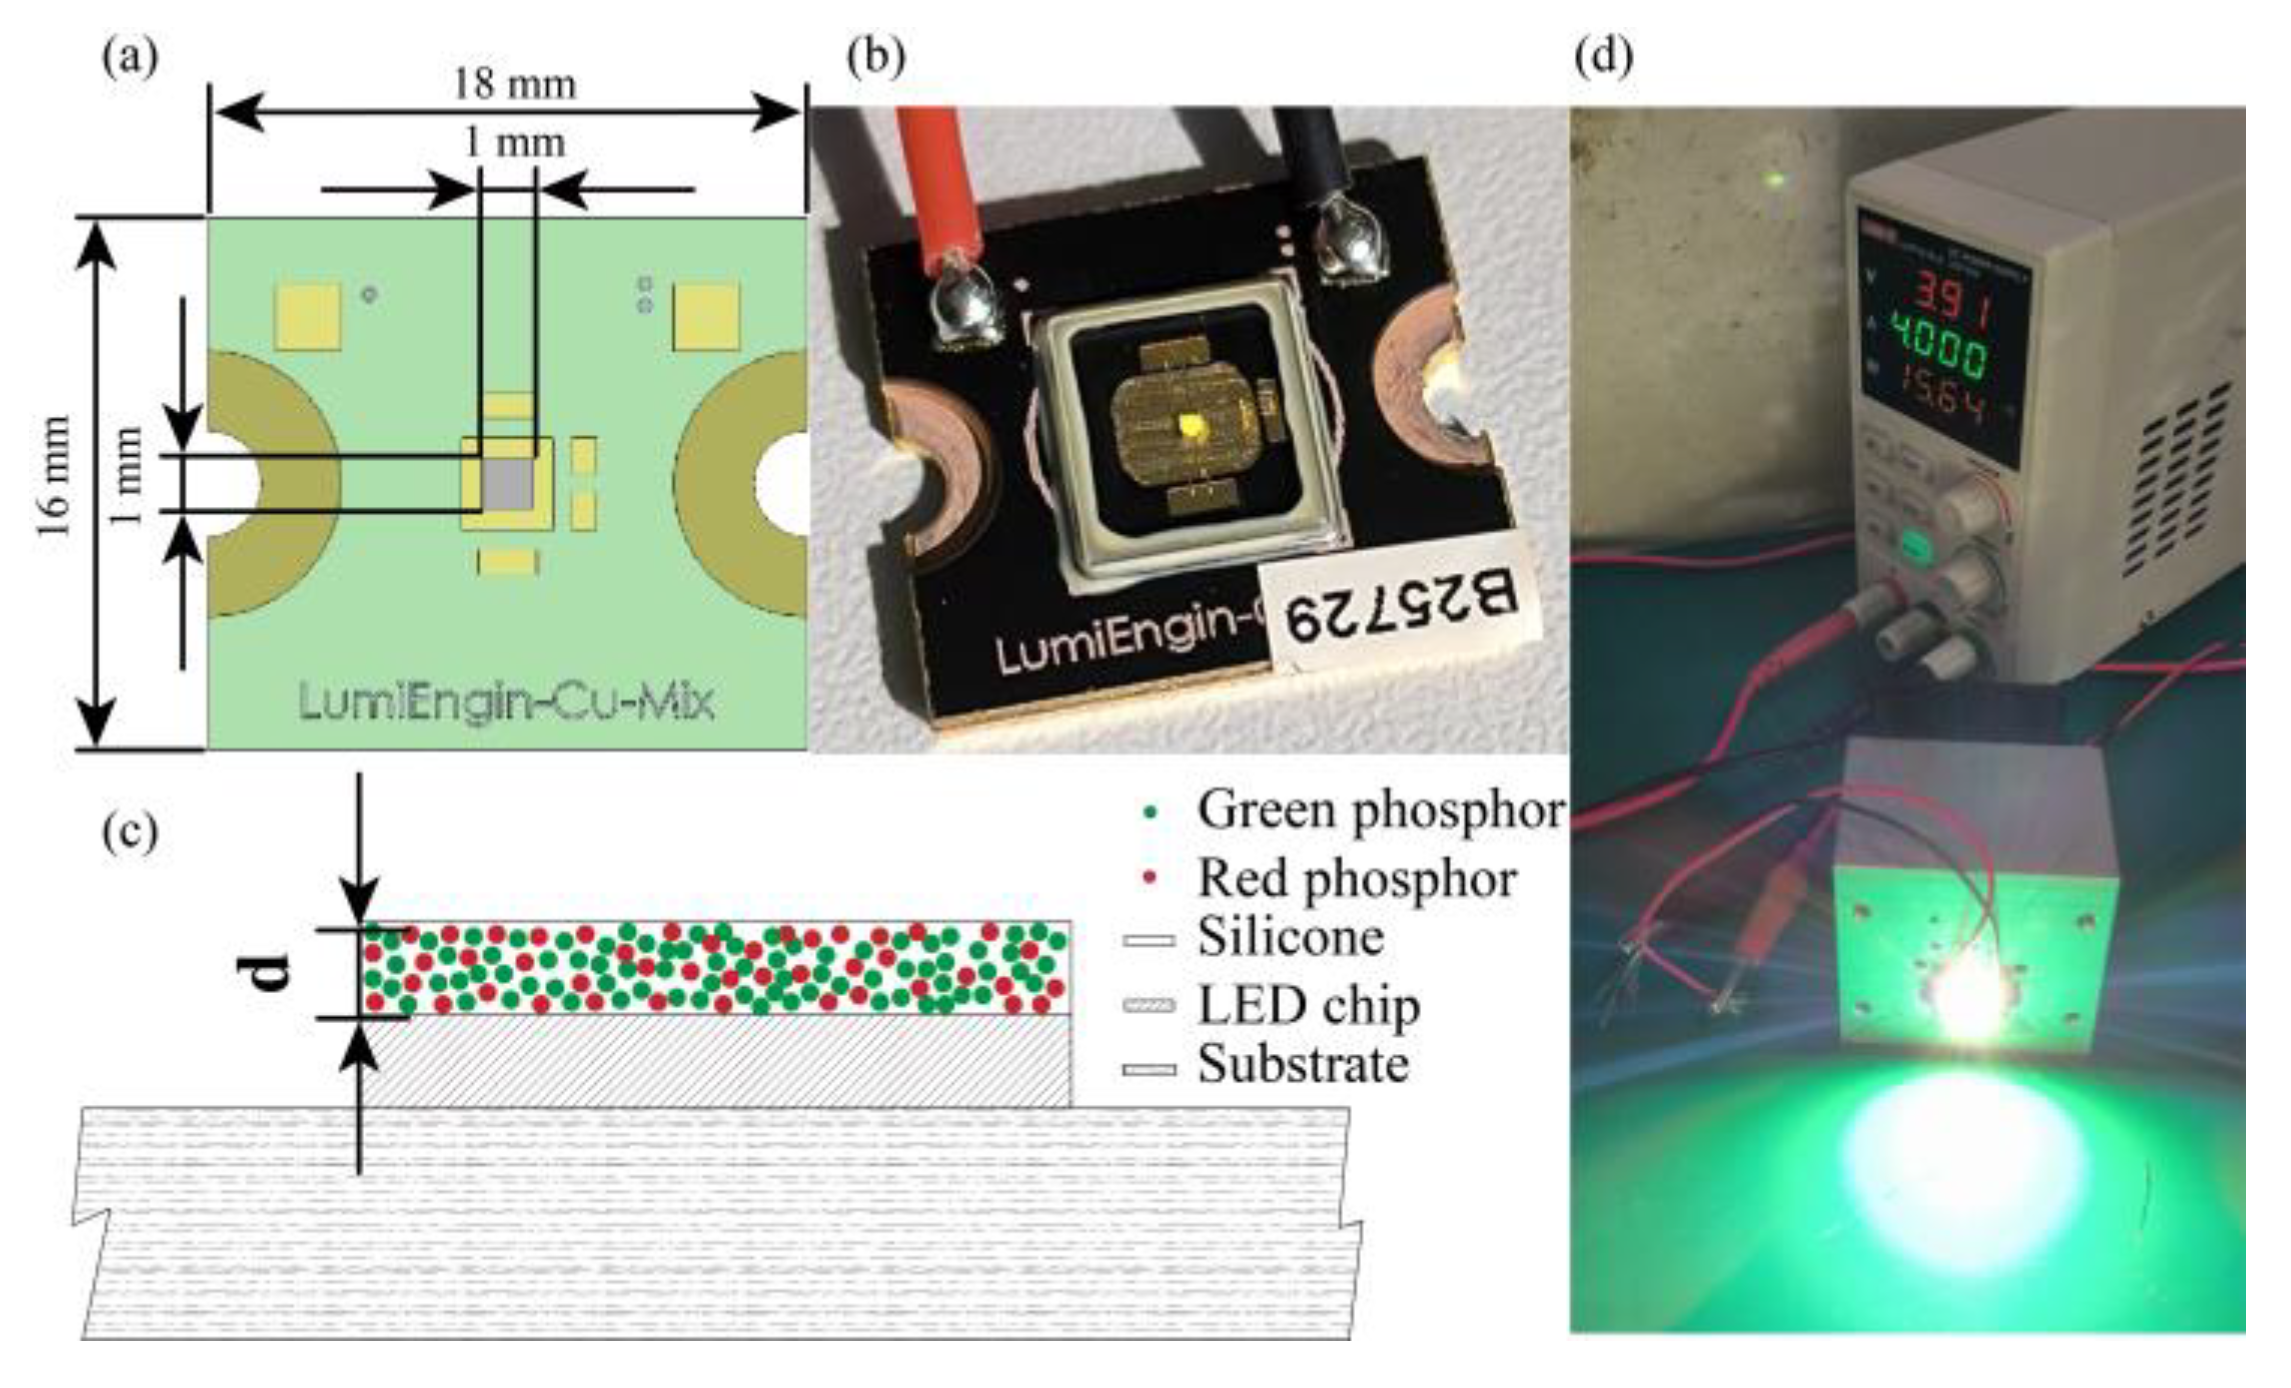
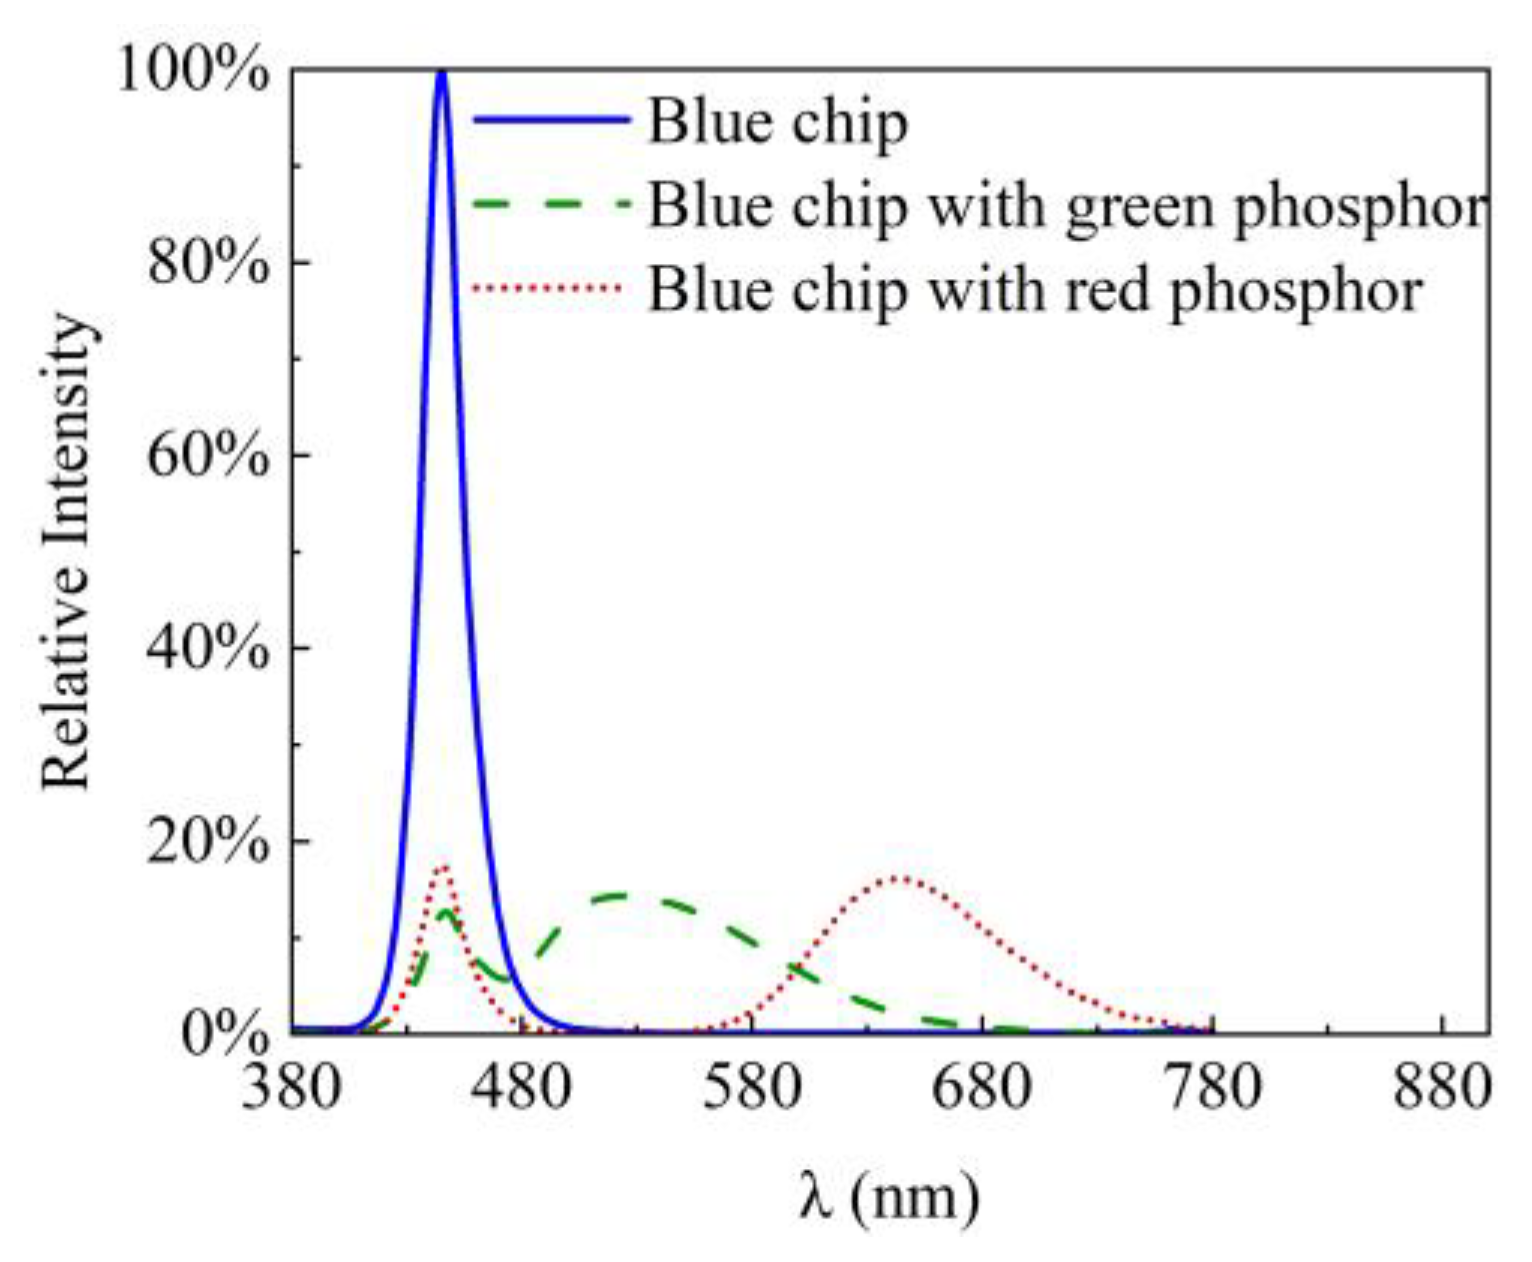
Currently, the Gaussian function is widely used to simulate the spectral power distribution (SPD) of monochrome LEDs [25,26,27]. However, in order to more accurately obtain the spectra of chips and phosphors, the following methods were used in this paper. Firstly, single-phosphor LED samples (packaged with green or red phosphor) were fabricated on a ceramic substrate (Figure 2). Silicone resin-containing phosphor was encapsulated on a chip, and the LEDs were sealed for the phosphor packages. The LED samples were fixed on an aluminum fin heat sink to dissipate heat, and silicone grease was applied between the module and the heat sink. The thermal conductivity of silicone grease is 8.5 W/(m·K). The aluminum fin heat sink was cooled with a fan; see Figure 2. The dimensions of the aluminum fin heat sink are 50 × 50 × 10 mm. The air flow of the fan is 49 CFM, the air pressure is 1.43 mmH2O, and the rated speed is 2500 rpm ± 10%. The integrating sphere was employed to measure the output of the LEDs. The LEDs were driven using a DC power supply with driving currents of 1A, 2A, 3A, and 4A, respectively. The ambient temperature was 20 °C. A thermistor was used to measure the temperature of the LED modules. The spectrum is shown in Figure 3. Without changing the phosphor concentration, increasing the thickness of the phosphor can allow it to absorb more blue light. However, this will cause a serious increase in the junction temperature of the LED modules, which is not realistic. We adopted the method of subtracting the blue light spectrum from the mixed spectrum to obtain the phosphor emission spectrum. Therefore, we packaged LEDs with a single phosphor and made the peak intensity of the phosphor powder roughly equal to the peak intensity of blue light. The output spectrum, formed by blue light exciting the phosphor, can be expressed as:
where is the mixed spectrum, is the conversion efficiency of phosphor, and is the proportion of blue light absorbed by the phosphor, which is related to the concentration and thickness of the phosphor. means that the LED is not packaged with phosphor. and jointly determine the color temperature of the WLED. and are the emission spectra of the chip and phosphor, respectively.
Clearly, different chips and phosphors have different emission spectra. The light emission spectrum is determined by the energy band gap of the material [23]. At the same junction temperature, the normalized blue light spectrum is not affected by the presence or absence of phosphor. That is, the shape of the spectrum remains the same. As shown in Figure 3, it is evident that the emission spectrum of phosphor can be obtained by subtracting the blue light spectrum from the mixed spectrum. The ratio of the blue light peak intensity of mixed spectra to the peak intensity of the chip is the proportion of blue light absorbed by the phosphor. The integration of spectral power distribution is energy. The conversion efficiency of the phosphor can be determined by calculating the energy of the emission spectrum of the phosphor and the energy absorbed by it:
where is the energy emitted by the phosphor, and is the energy absorbed by the phosphor.
In this study, for simplicity, the phosphor conversion efficiency is assumed to be constant, and the phosphor light intensity is linearly converted from the blue LED light intensity [24]. Thus, we can obtain the emission spectra of chips and phosphors as well as the conversion rate of phosphors.
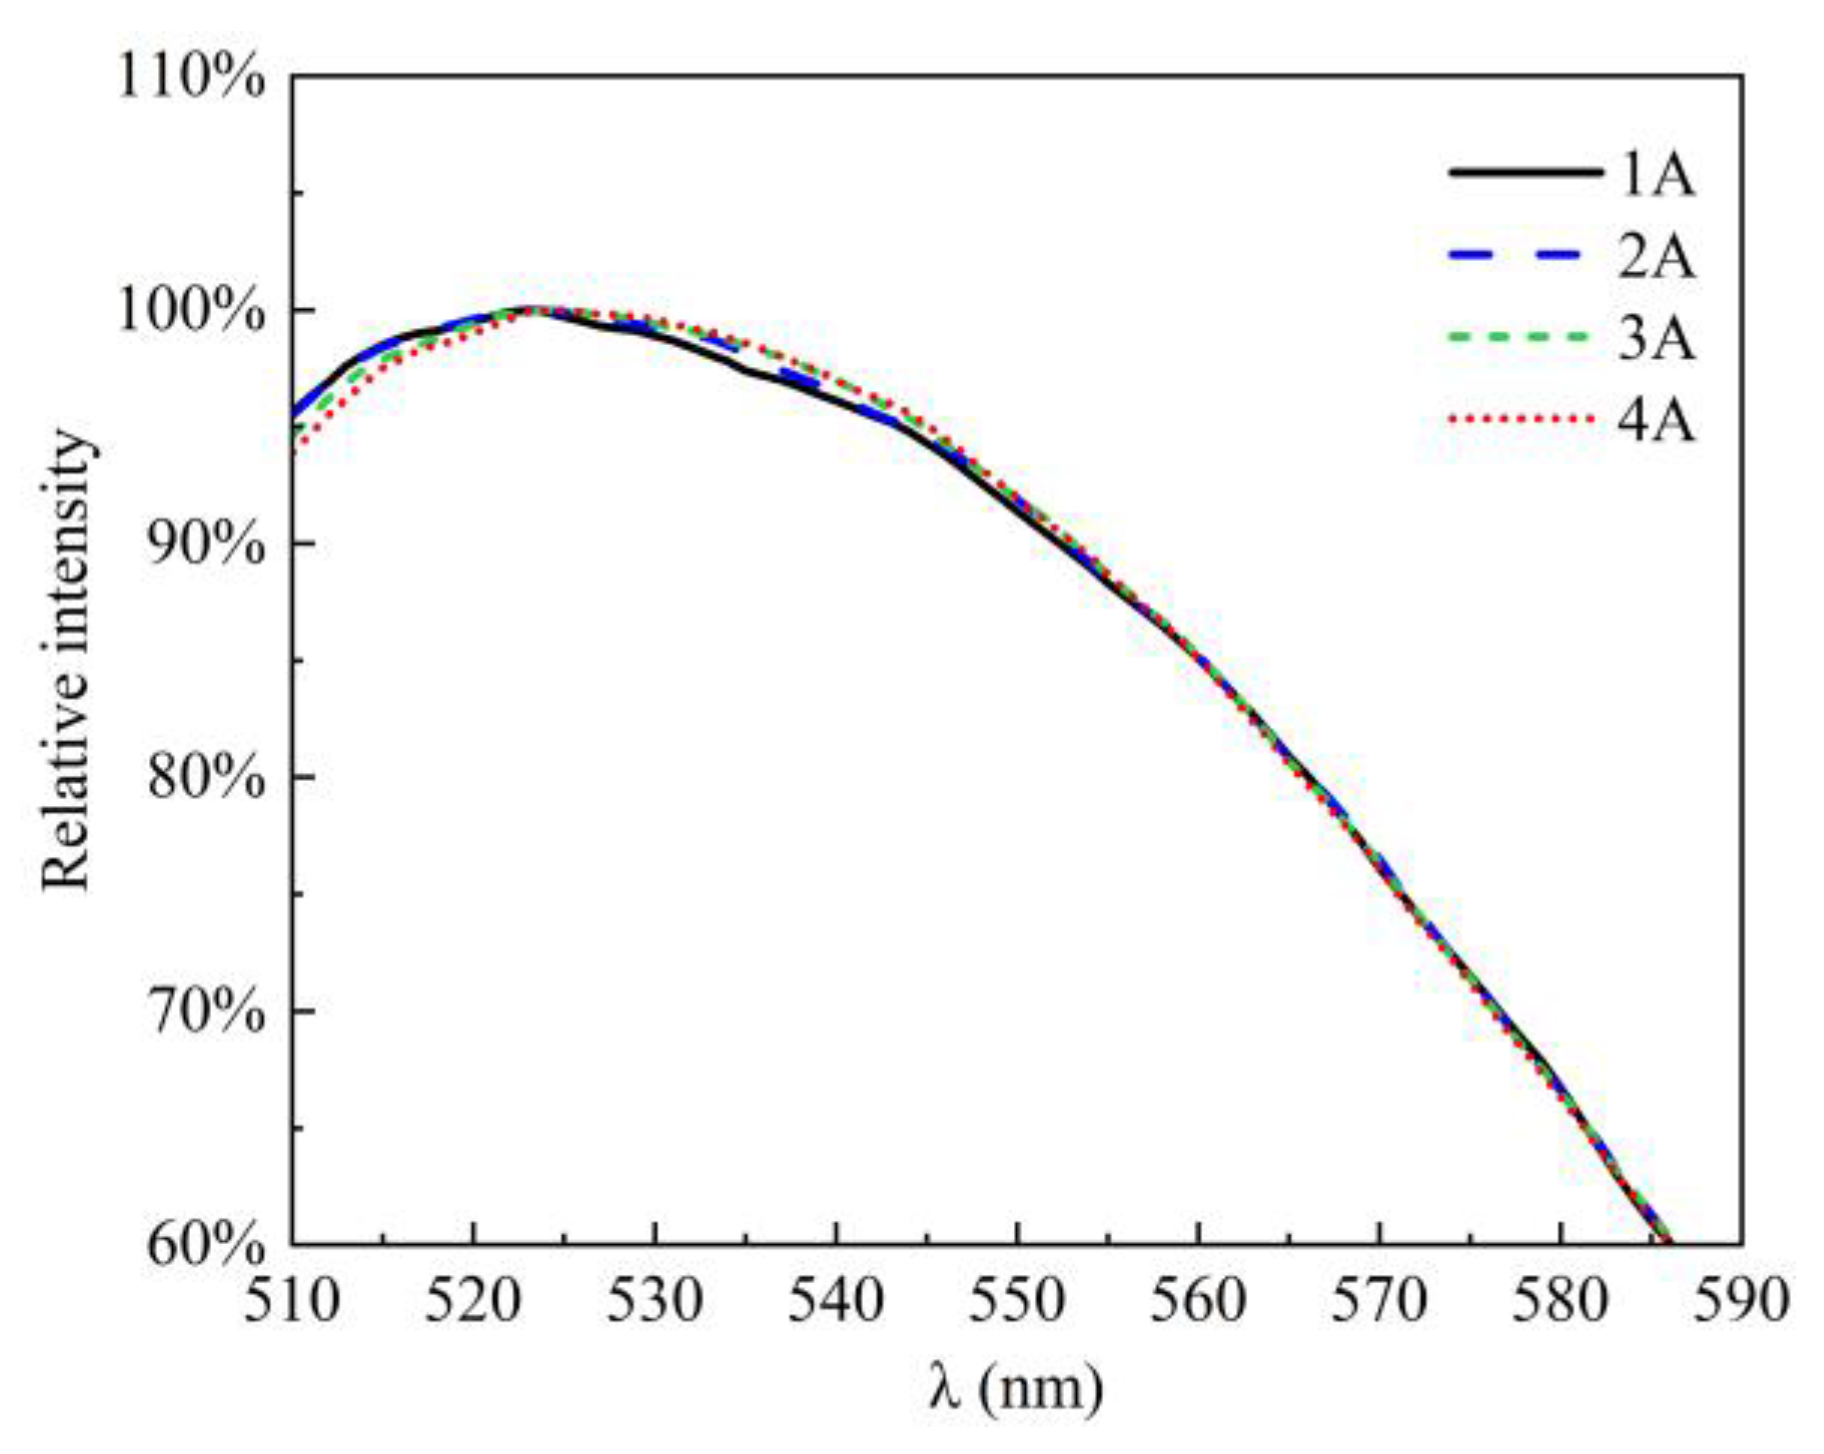
Another issue that needs to be addressed is that the peak wavelength of the emission spectrum of the phosphor changes with increasing temperature, i.e., spectral shift. Figure 4 shows the red shift of the emission spectrum of the green phosphor used in this paper. If we assume that the normalized spectral shape remains the same under different driving currents, the relationship between the shift value and driving current can be established by fitting the peak wavelength:
and the shifted emission spectrum is . In this study, we assume that the peak wavelength shift is linearly related to match the driving current, ; and are coefficients.
If the absorption of green light by the red phosphor is ignored, the final emission spectrum can be estimated using the weighted average method:
where is the mixed spectrum. and are the conversion efficiencies of green and red phosphors, respectively. and are the proportion of blue light absorbed by green and red phosphors, respectively. , , and are the emission spectra of the chip, green phosphor, and red phosphor, respectively.
Equation (4) assumes that green and red phosphors have the same particle size distribution, are uniformly mixed, and have constant conversion efficiencies [23].
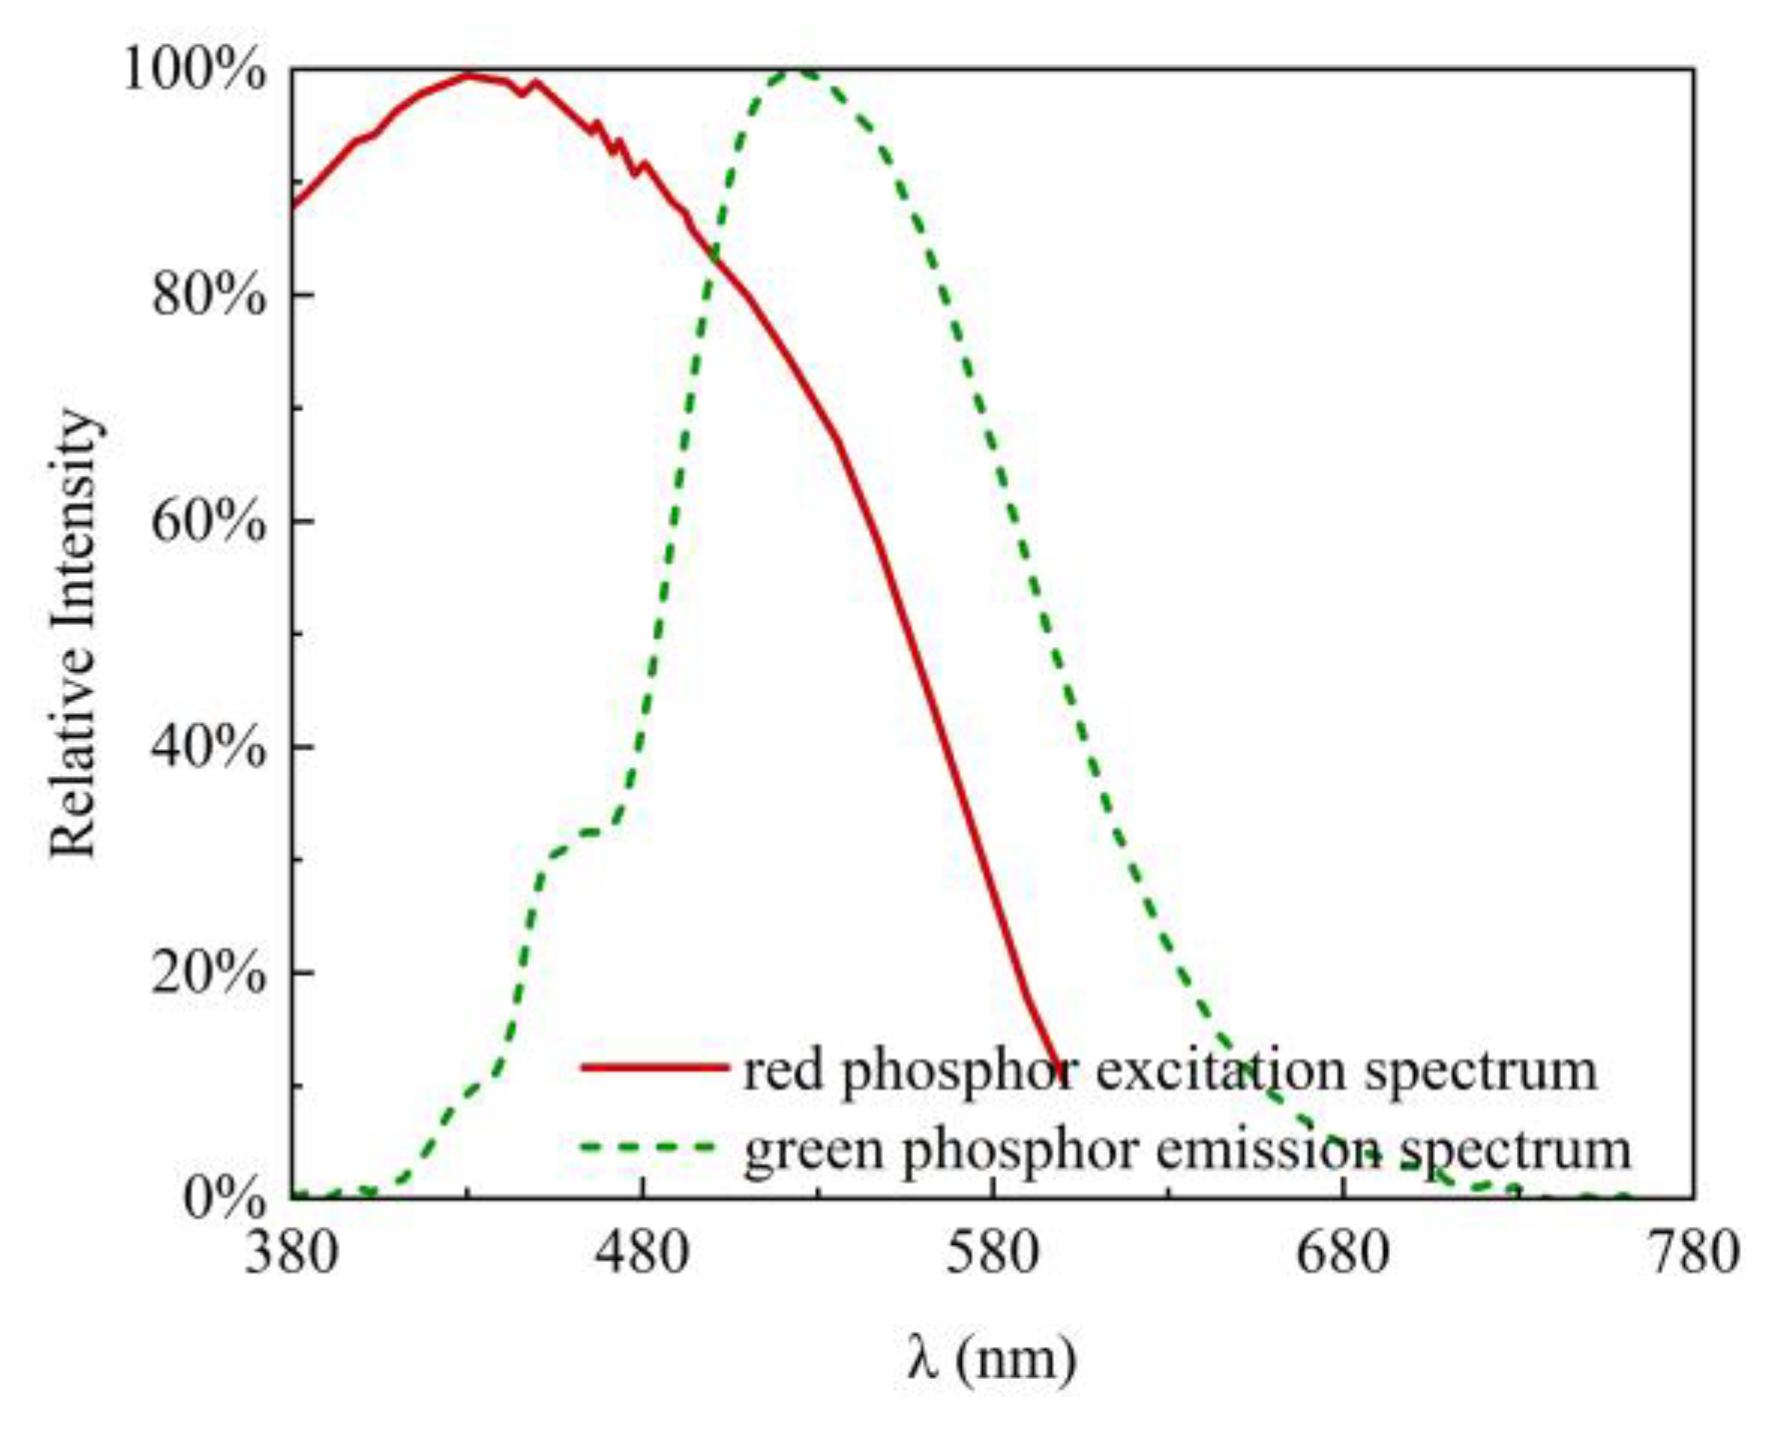
In Equation (4), both green and red phosphors are excited by the blue light from the LED chip. However, there may be an overlap between the red phosphor excitation spectrum and the green phosphor emission spectrum. It can be seen from Figure 5 that the excitation spectrum of the red phosphor and the emission spectrum of the green phosphor used in this study overlaps in the range of 400 nm to 600 nm. This indicates that the red phosphor absorbs a considerable amount of the light emitted by the green phosphor. The reabsorbed light is converted to red light by the red phosphor subsequently. The final emission spectrum would be written as follows:
where is the mixed spectrum, and and are the conversion efficiency of green and red phosphor, respectively. and are the proportion of blue light absorbed by green and red phosphors, respectively. , , and are the emission spectra of the chip, green phosphor, and red phosphor, respectively. is the proportion of reabsorbed green light by red phosphor, which is related to the concentration ratio of green phosphor and red phosphor. is the re-emission conversion efficiency of red phosphor.
It can be seen from Equation (5) that represents that no green light is absorbed by the red phosphor. A higher means more green light is absorbed by the red phosphor and converted to red light. The actual value depends on the absorption characteristics of the red phosphor, the mixing ratio of the phosphor, the volume of the phosphor paste, and the packaging structure [23]. indicates the conversion efficiency of the emission spectrum of the green phosphor to excite the red phosphor. A higher means a higher conversion efficiency of the green light to the red light. means that all the green light absorbed by the red phosphor is absorbed, and no red light is excited.
According to Equation (5), by fitting the spectrum of the WLED with dual phosphors, we can obtain the proportion of red phosphors reabsorbing green light. For simplicity, the reabsorption proportion is assumed to be constant. Then, we have obtained the prediction model for calculating the spectrum of WLEDs with any proportion of phosphor powder.
Finally, colorimetric analysis was carried out on the spectrum, and the TLCI was calculated. In this study, we followed the TLCI-2012 standard. The calculation steps have been explained in detail in this reference [13], with a brief explanation as follows: Firstly, determine the signals, , , and , generated by the sensors for each color from the spectrum. This is followed by balancing. Then, optimize the color performance using a linear matrix and deliver RGB signals. This is followed by gamma correction. Derive CIE tristimulus values XYZ for each color, as seen on the display via colorimetric analysis, and then calculate the color difference, (CIEDE2000). The TLCI is derived from the color difference, :
The highest level of TLCI is 100, and the higher the value is, the higher the degree of color restoration will be and the better the color rendering effect will be. Film-style production and live multi-camera production typically use a as a minimum starting point to provide cinematographers and gaffers with a quick and accurate way to quantify the light quality, thereby avoiding extensive testing and minimizing during post-processing.
Based on the predicted results of the model, high-TLCI WLED samples can be fabricated. The simulated and experimental measurement results were compared to verify the model.
3. Results and Discussion
In this study, a blue LED chip, green phosphor, and red phosphor were used. Firstly, three LEDs packaged with green phosphor and three LEDs packaged with red phosphor were fabricated, and we measured the spectrum of the single-phosphor LEDs. Three WLEDs were fabricated to reduce the errors and average the temperature rise. The measured spectra are shown in Figure 3. From Section 2, using Equation (2), the conversion efficiencies of the green phosphor and red phosphor were 0.79 and 0.44, respectively, which are and .
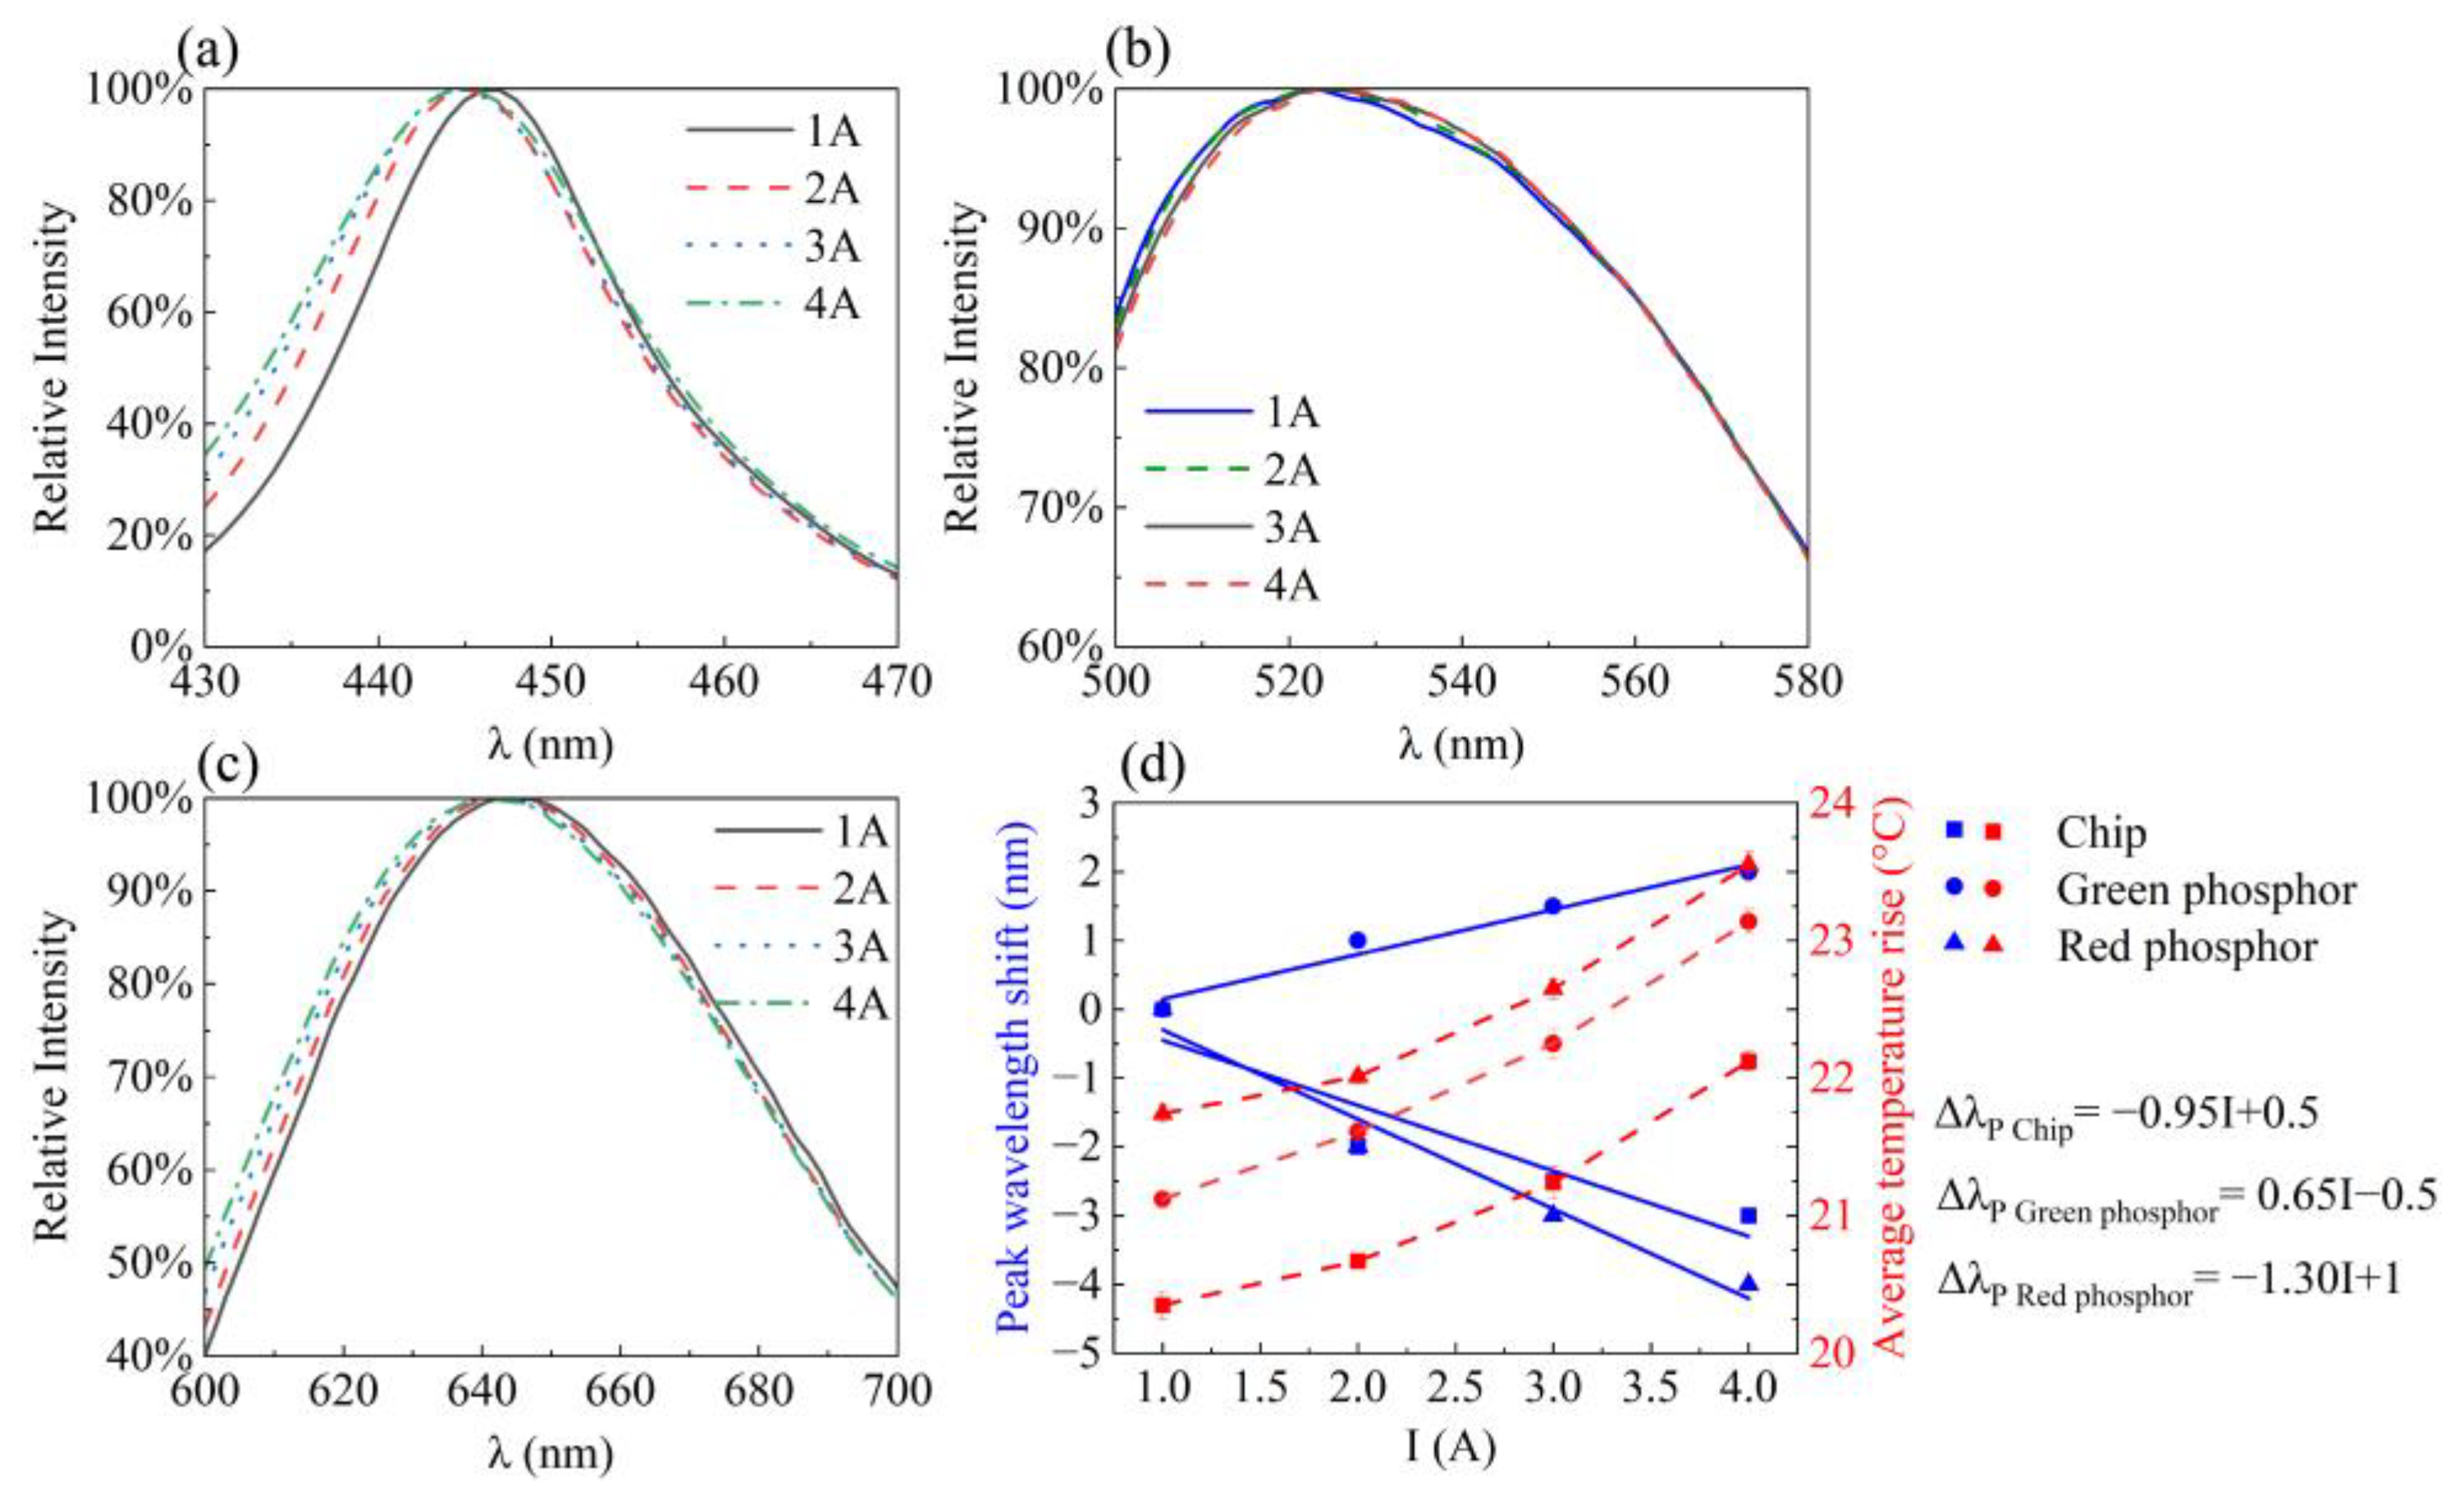
Then, we measured the spectra of two kinds of LEDs mentioned earlier under different currents, and the peak wavelength of the emission spectrum changed with the driving current, as shown in Figure 6. Figure 6a shows the change in the emission spectrum of the blue chip with the driving current; the driving current increases from 1A to 4A, and the peak wavelength decreases from 447 nm to 445 nm. Figure 6b shows the change in the green phosphor emission spectrum with the drive current, which increases from 1A to 4A, and the peak wavelength increases from 523 nm to 525 nm. Figure 6c shows the change in the emission spectrum of red phosphor with the drive current, which increases from 1A to 4A, and the peak wavelength decreases from 645 nm to 640 nm. Figure 6d shows the results with a linear fit. The average temperature rise of the LED packaged with green phosphor at 1A, 2A, 3A, and 4A was 21.12 °C, 21.61 °C, 22.25 °C, and 23.14 °C, respectively. As we all know, as the drive current increases, the LED modules’ temperature also increases. The average temperature rise of the LED packaged with red phosphor at 1A, 2A, 3A, and 4A was 21.74 °C, 22.01 °C, 22.65 °C, and 23.55 °C, respectively. This is due to the lower conversion efficiency of red phosphorescent powders. In order to make the peak intensity of the phosphor roughly equal to the peak intensity of blue light, red phosphor was more thickly applied. Fitting the peak wavelength shift reveals that is −0.95, 0.65, −1.30, and is 0.5, −0.5, and 1, respectively. As shown in Figure 6, as the driving current increases, it is interesting that blue and red light undergoes a blue shift, which is related to the material, while green light undergoes a red shift, which is related to the material, too. The reason for the peak wavelength blue shift of the LED chip is the strong polarization effect of the multi-quantum-well region [28], but the causes of the peak wavelength shift of the phosphors are related to charge distribution and crystal field changes [29].
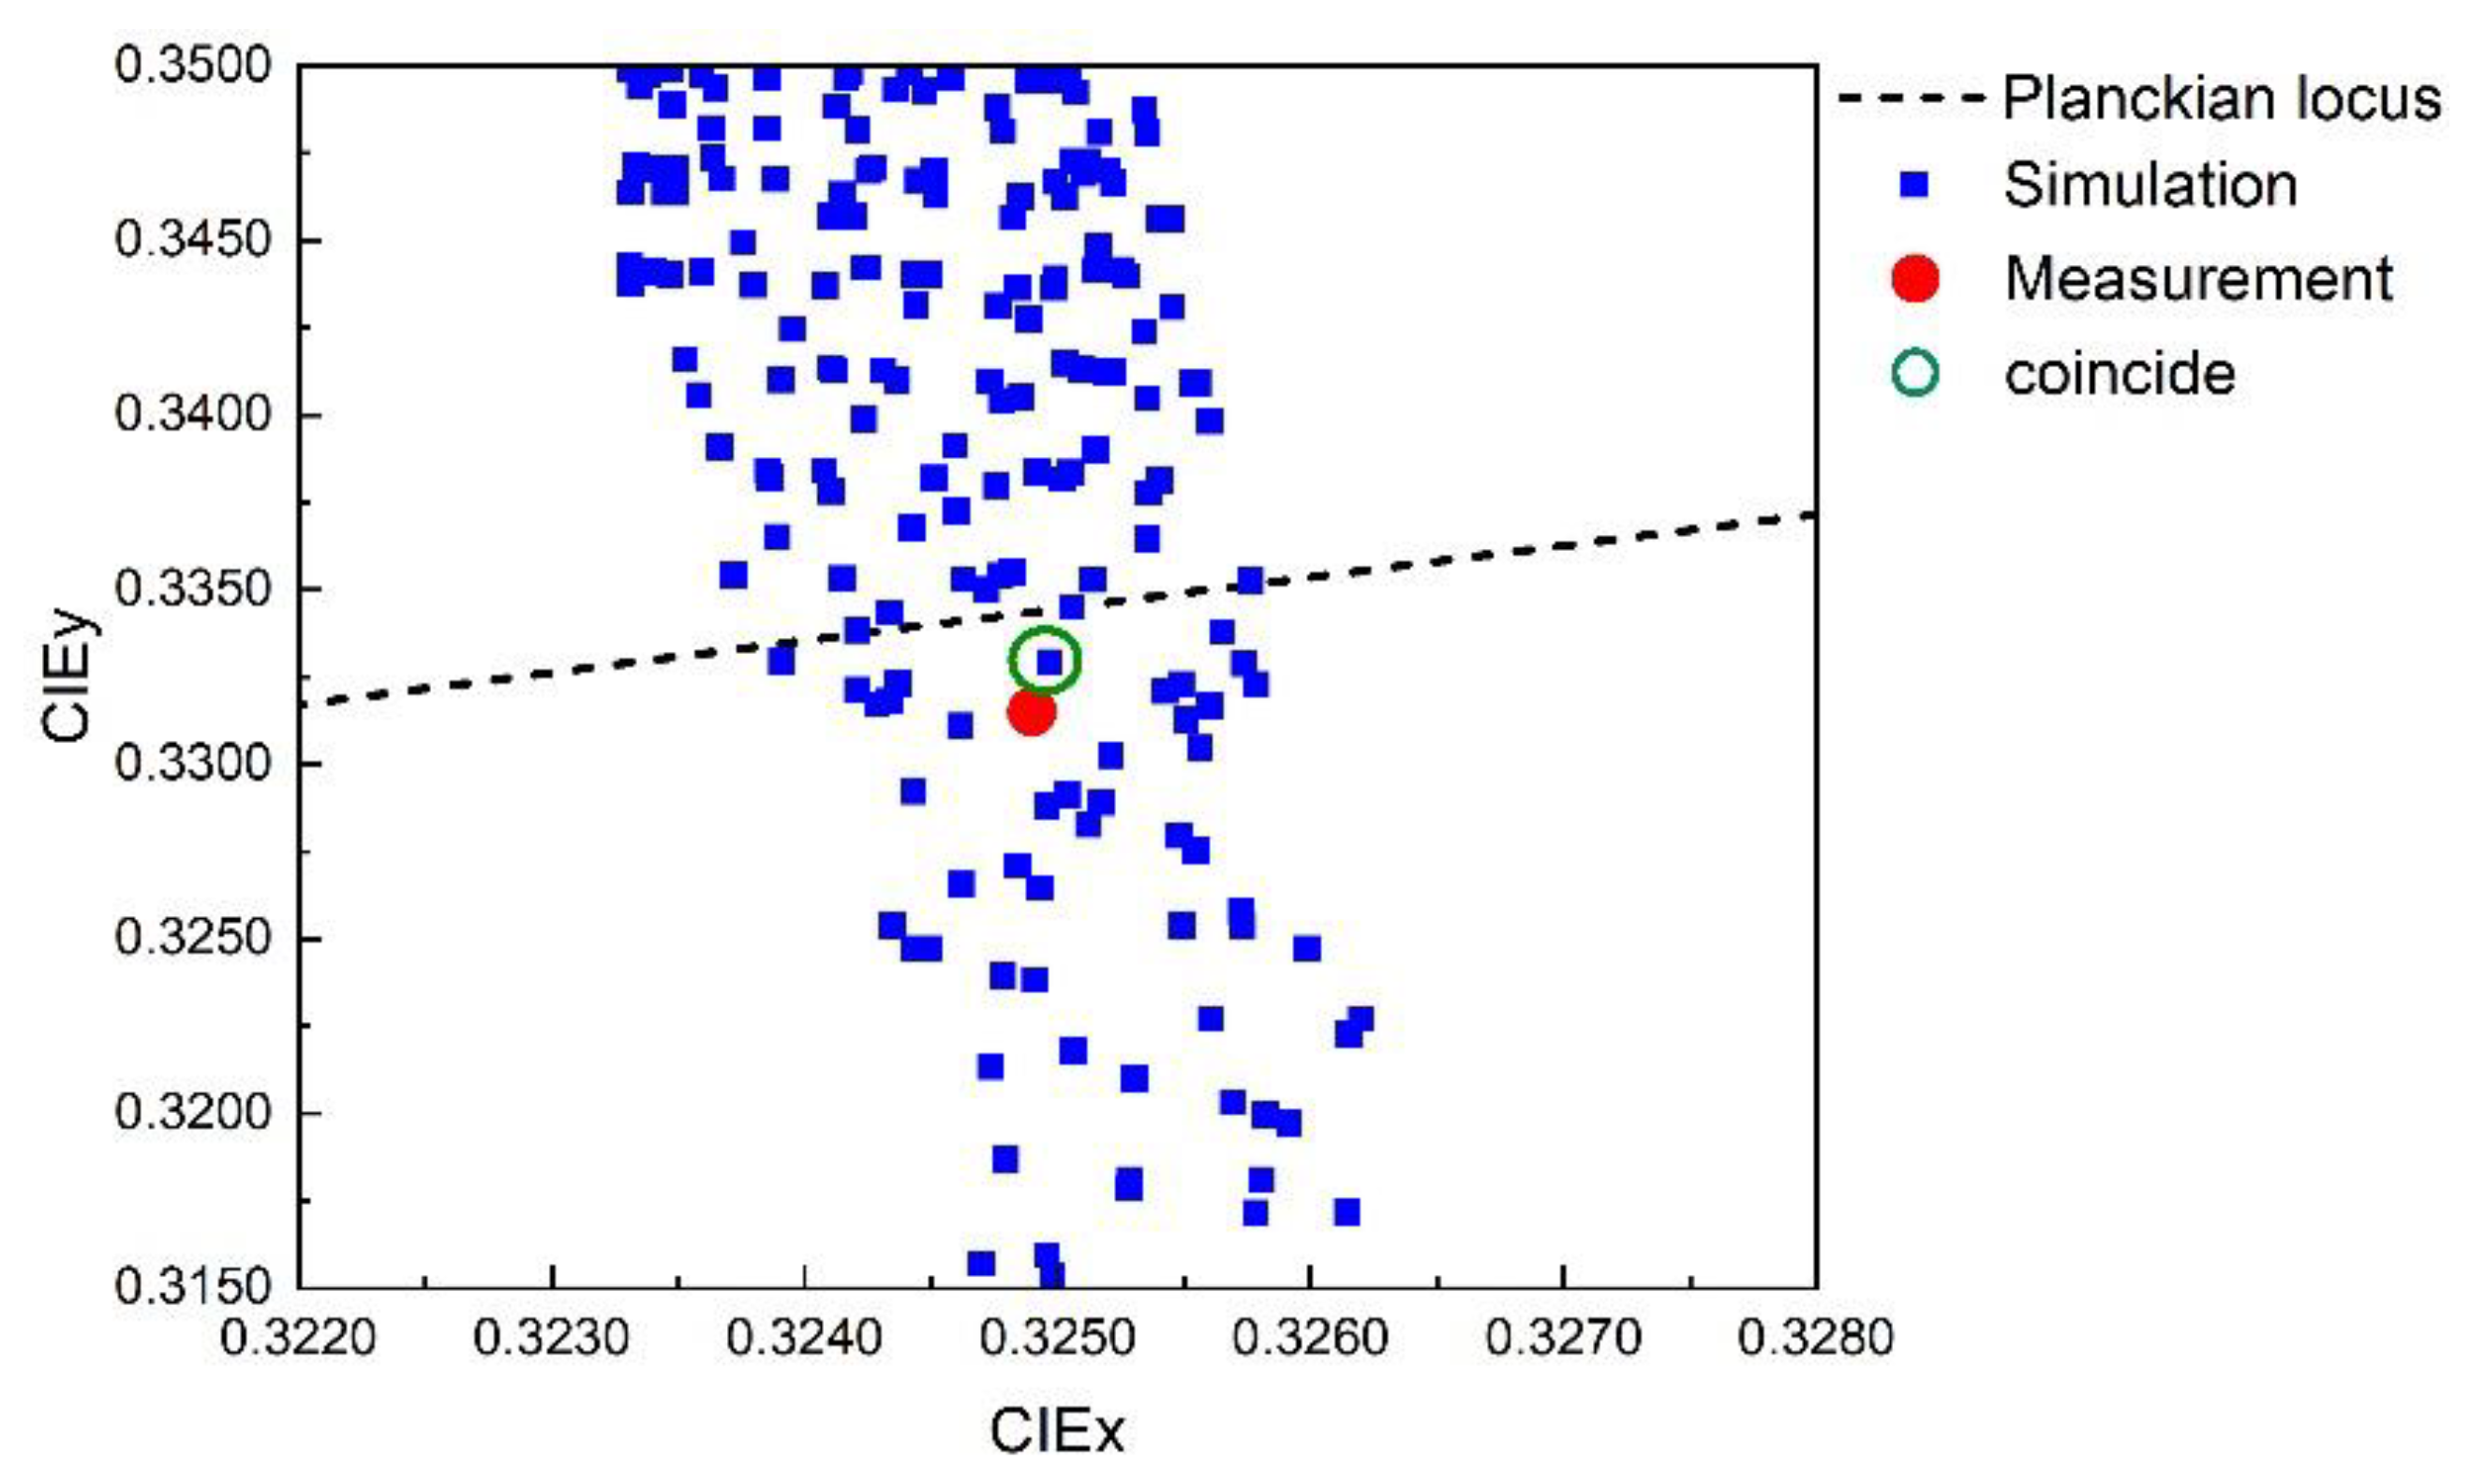
Subsequently, we packaged three dual-phosphor WLEDs (green phosphor: 0.20 g; red phosphor: 0.03 g; A glue: 0.025 g; B glue: 0.025 g) at a CCT of 5860 K. The weight percent (wt%) of green phosphor is 74.43%, and the weight percent of red phosphor is 10.71%. We measured the spectrum of the WLEDs and fitted the spectrum to calculate the proportion of green light reabsorbed by red phosphor under the currents of 1A, 2A, 3A, and 4A, respectively. The average temperature rise of the WLEDs at 1A, 2A, 3A, and 4A was 22.48 °C, 22.95 °C, 23.66 °C, and 24.55 °C, respectively. The results of the spectral fit are shown in Figure 7. Figure 7a–d show the fitted spectrum for different and values at driving currents of 1A, 2A, 3A, and 4A, respectively. Obviously, the value range for and is 0–1. The result shows that , , , and present the best matches (Figure 7) within all the tested current ranges. and indicate that about 72% and 11% of the blue light was converted to green and red light, respectively, which is consistent with the proportion of phosphors used. and indicate that about 38% of the green light was converted to red light, with a conversion efficiency of about 44%. In order to indicate the correctness of the fitting results more accurately, we calculated the color coordinates corresponding to the spectrum in Figure 7. The results of the color coordinate fitting when the driving current is 2A are shown in Figure 8. Similarly, the results for , , and present the best match.
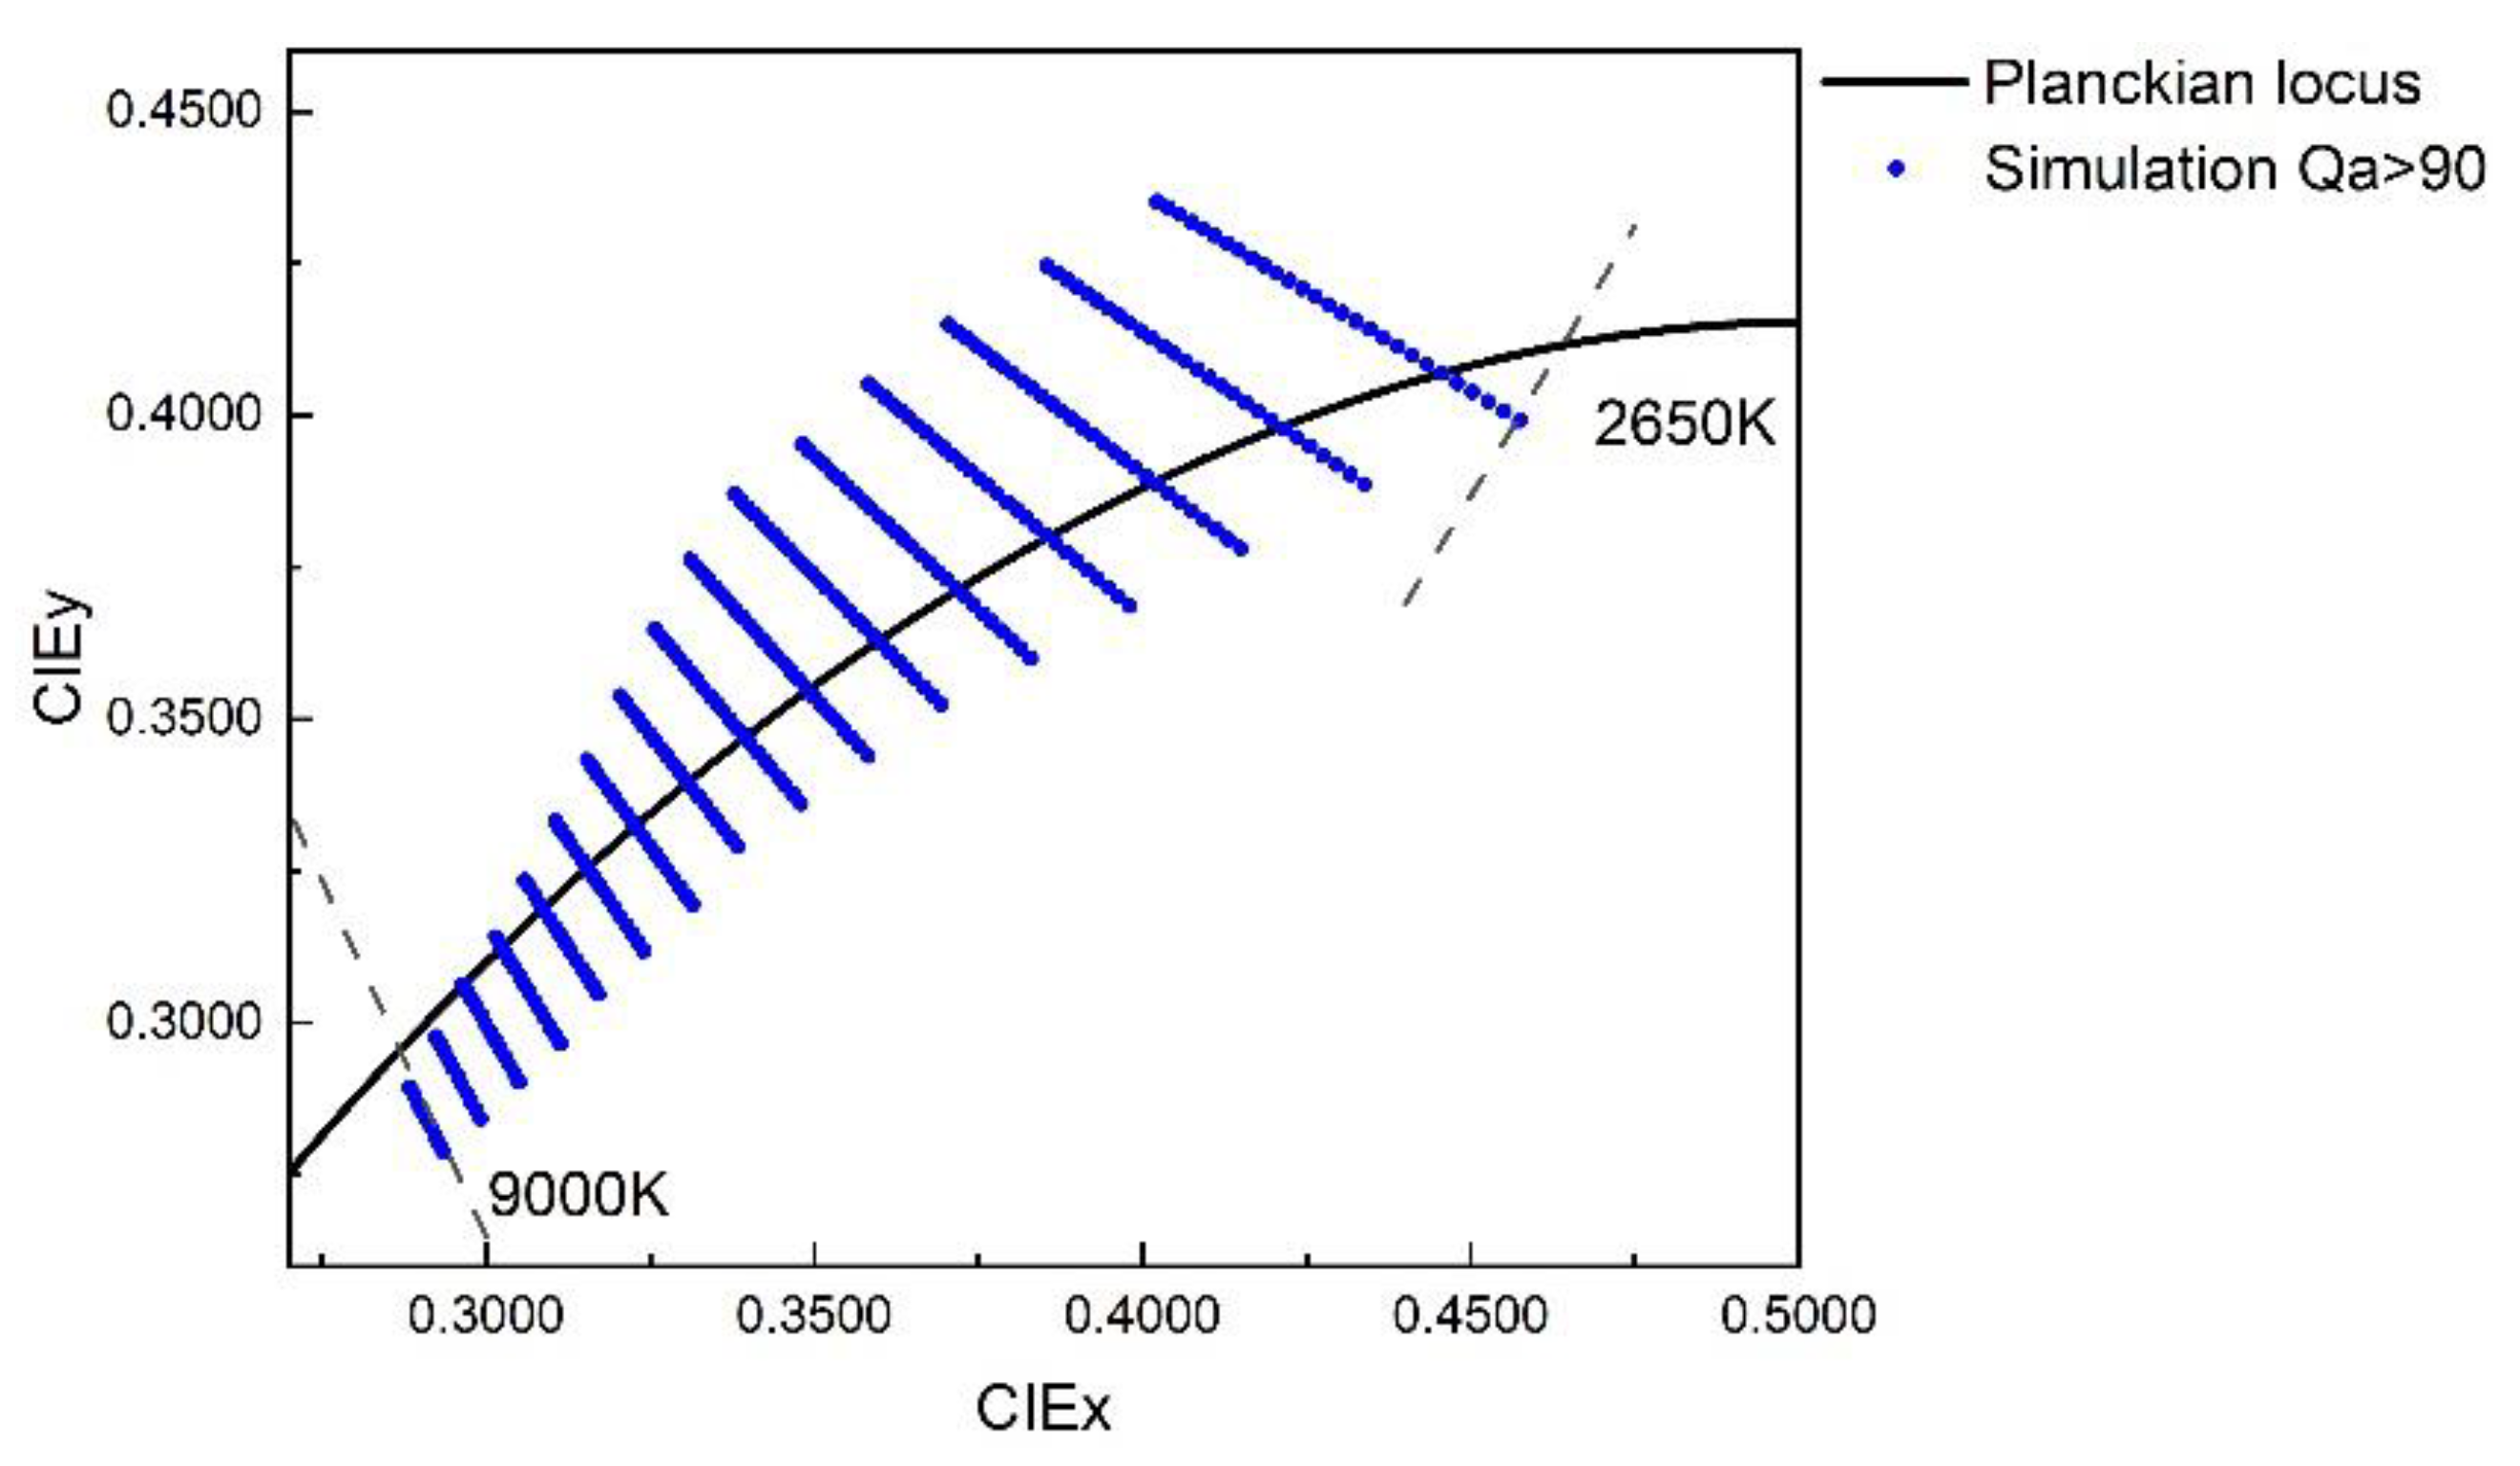
Then, according to Equation (5), we simulated the spectrum under different CCTs by varying the ratio of green and red phosphors. It is well known that we could fix the ratio of green and red phosphors and obtain the spectra of different CCTs by adjusting the thickness of the phosphor layer. However, changes in the thickness would seriously alter the temperature of the chip, thus affecting the light efficiency of the LED. Therefore, it is better to change the ratio of green and red phosphors to obtain the spectra of different CCTs. We calculated the TLCI of the spectrum according to the method in this reference [13]. When the drive current is 2A, the color coordinates of LEDs with a TLCI greater than 90 are shown in Figure 9. Admittedly, the correlated color temperature lacks color adaptation considerations [30,31]. Therefore, we chose as another indicator to limit the distance from the color coordinates to the Planckian locus. The results show that the chip and phosphors used in this study can package WLEDs with a from 2650 K to 9000 K.
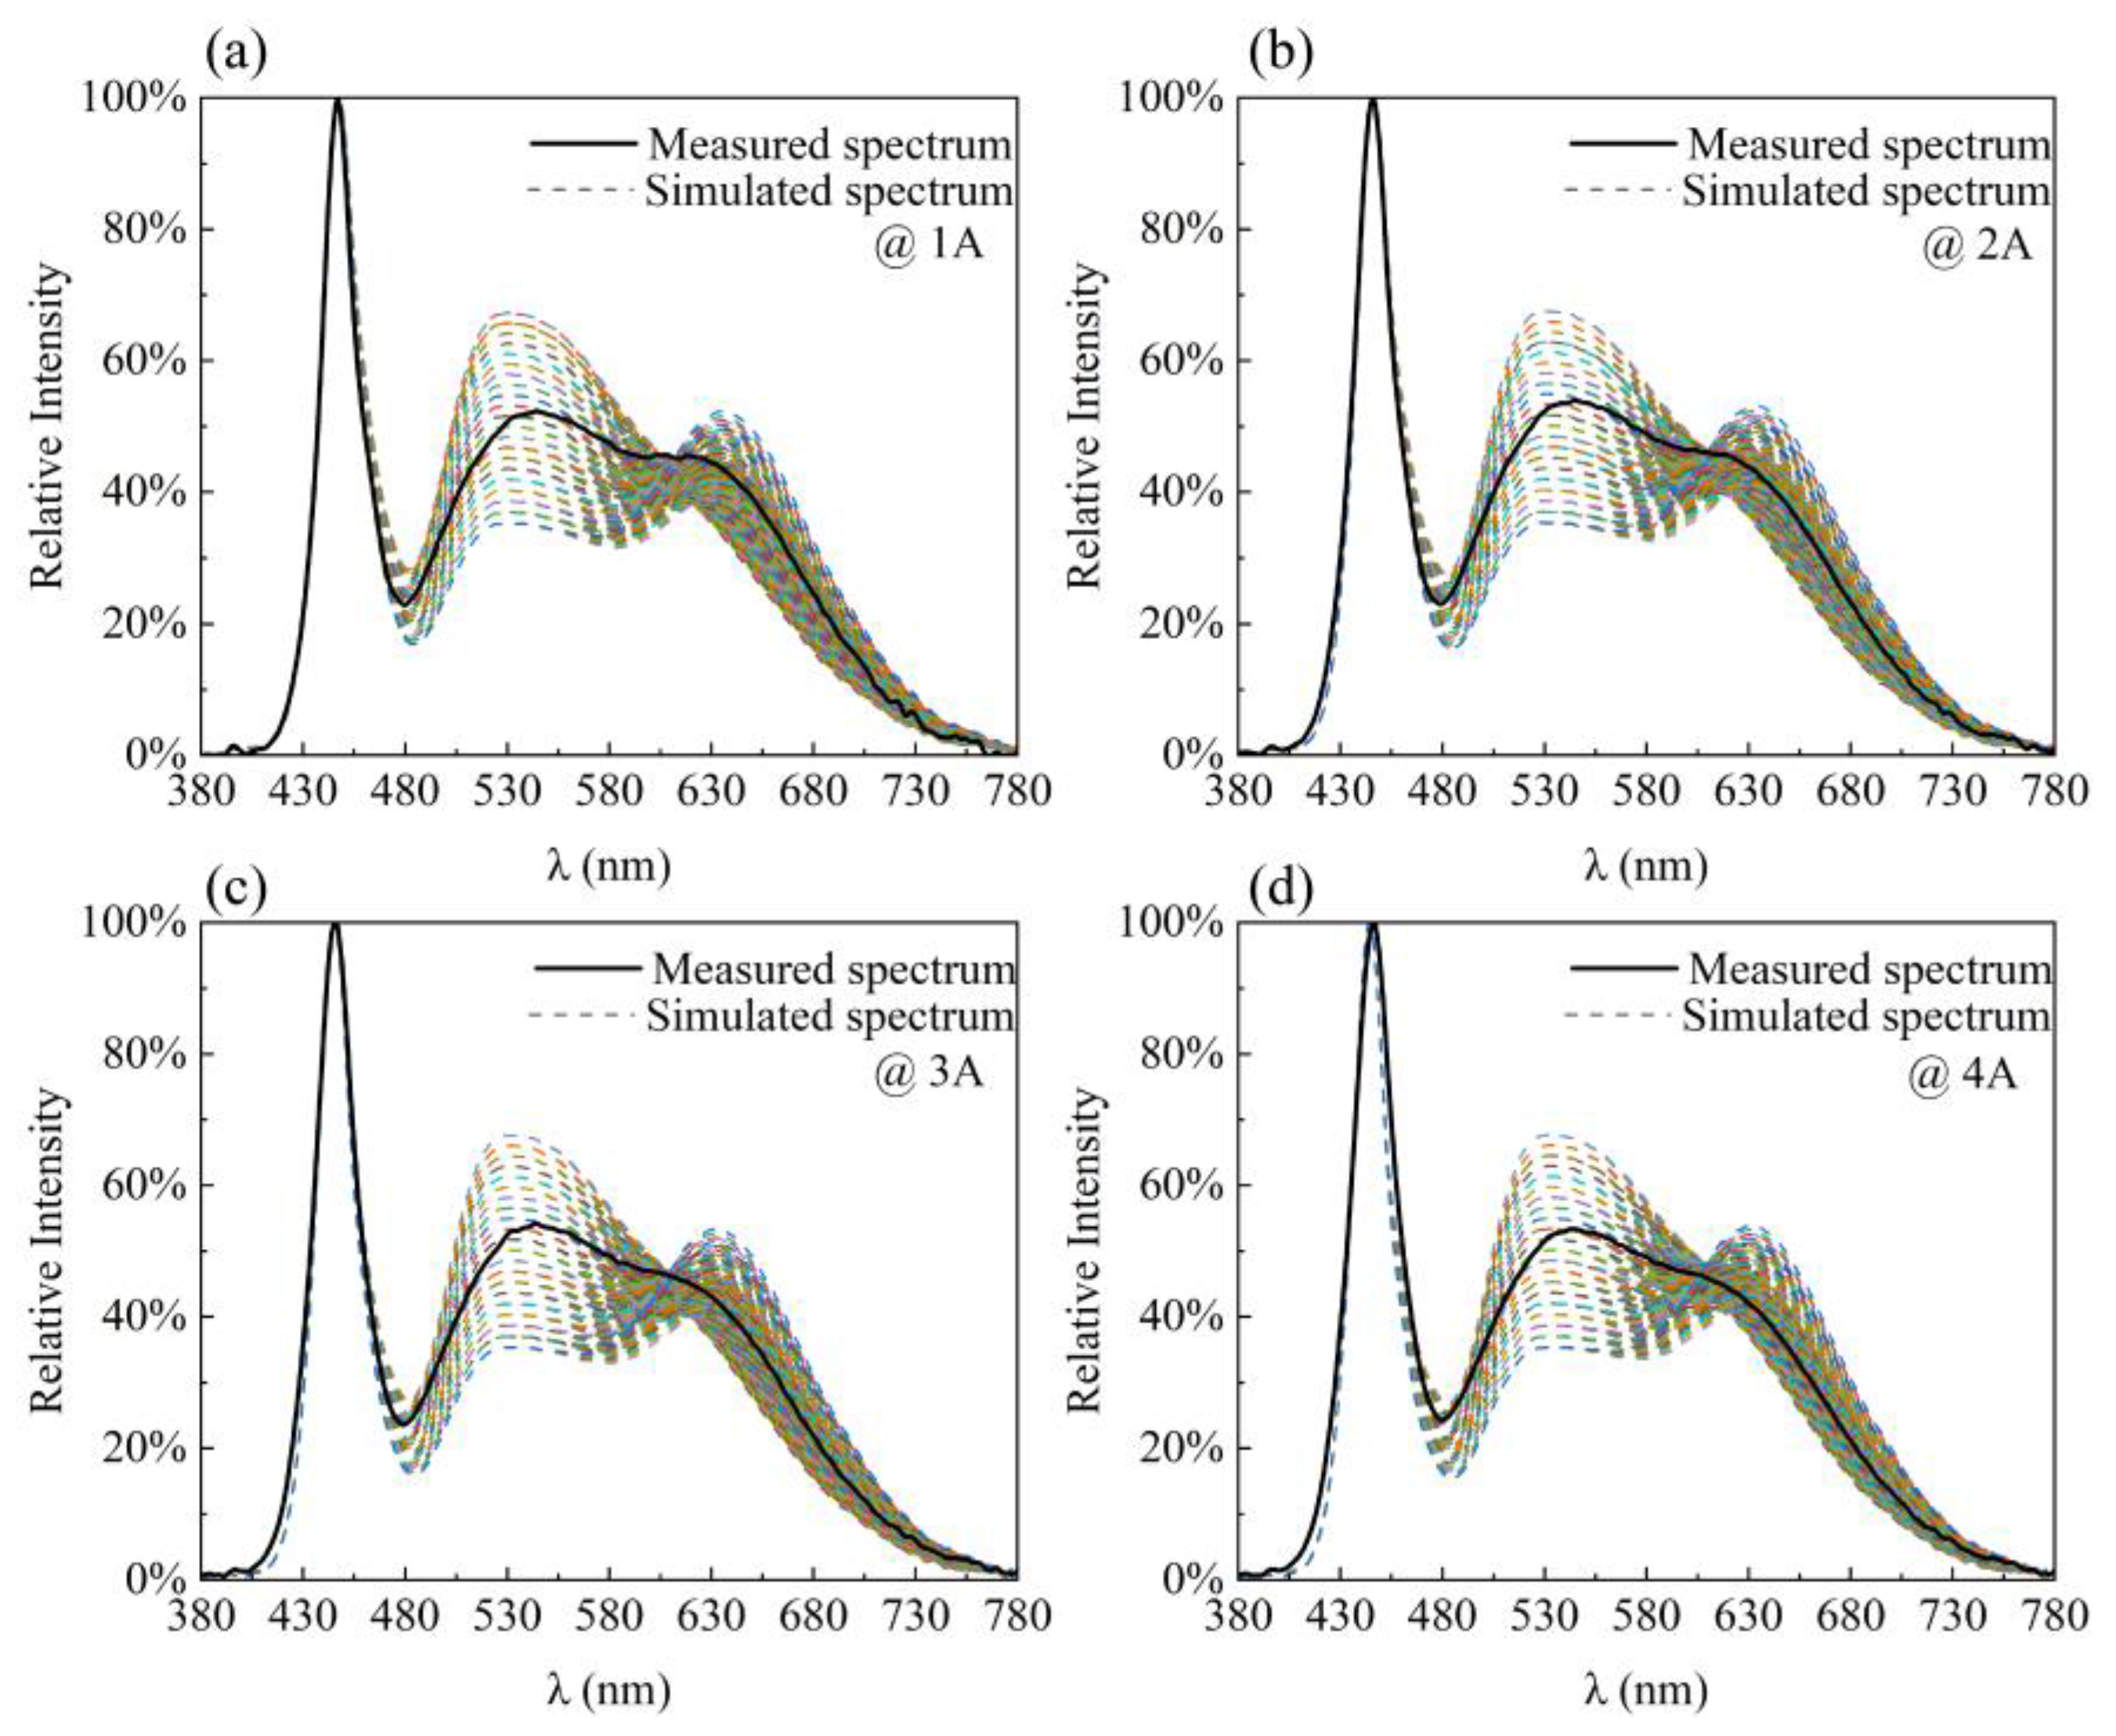
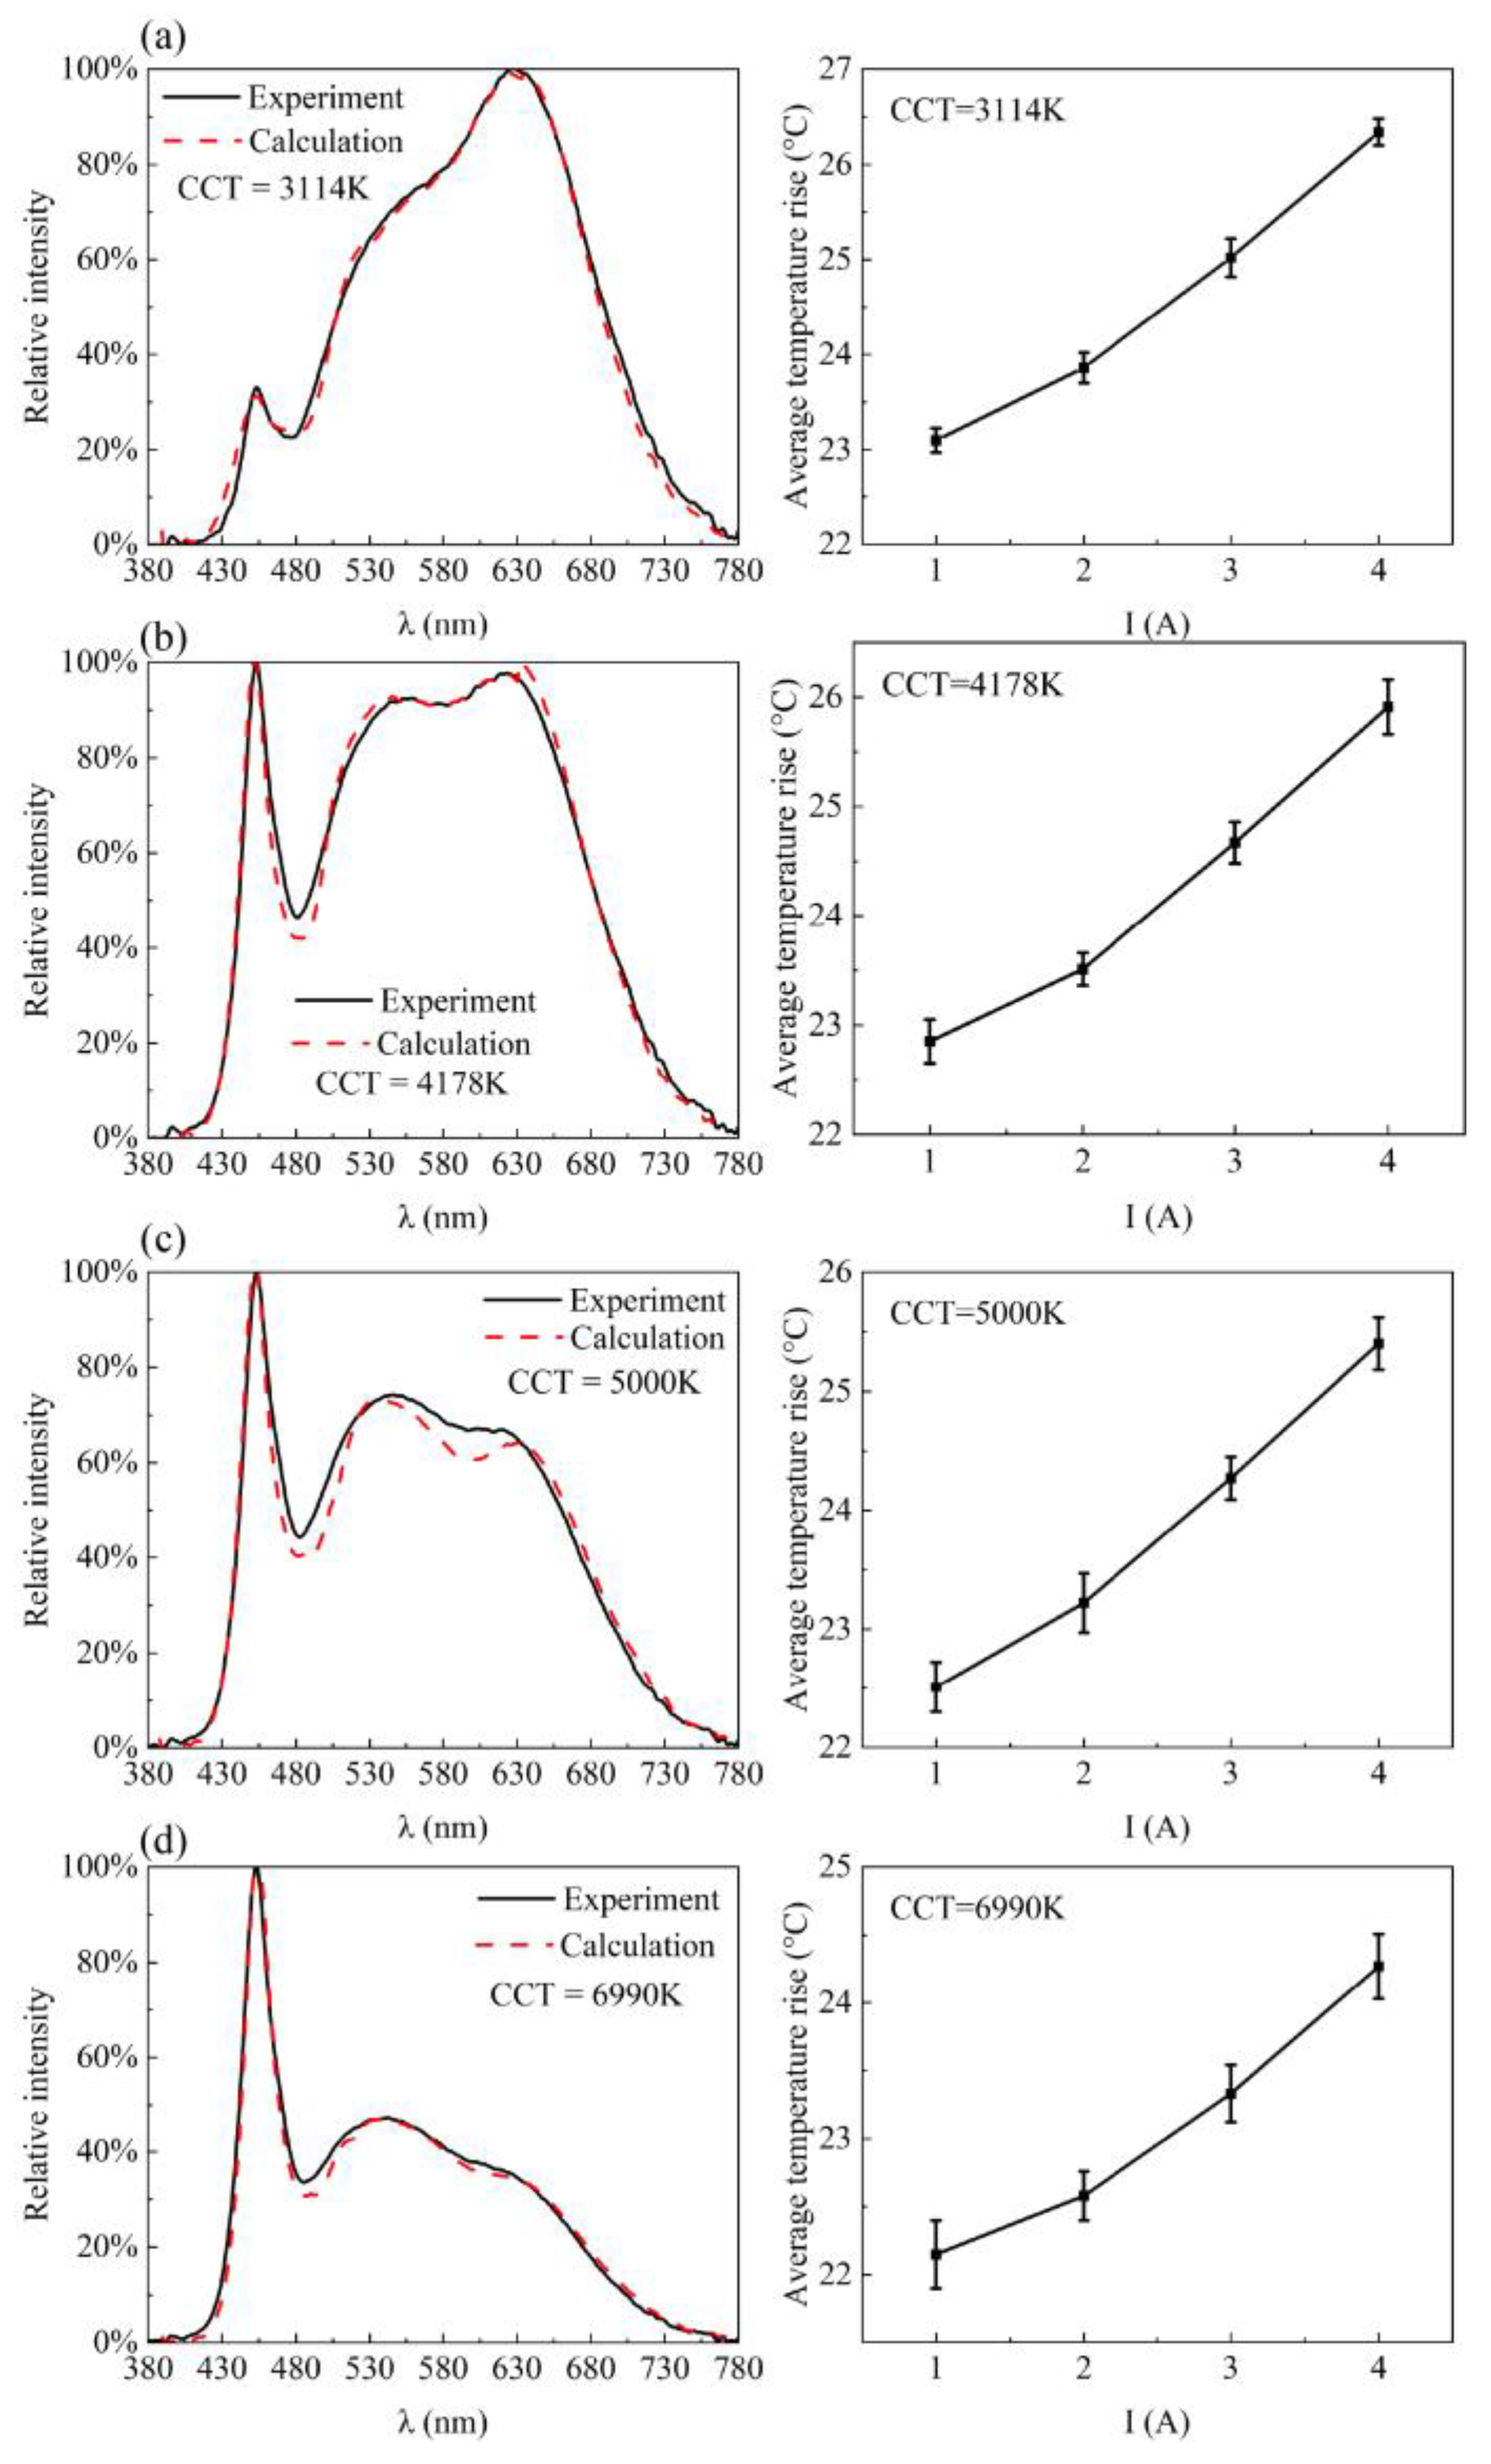
Finally, to verify the model, we packaged four other kinds of WLEDs for other CCTs. Each one has three WLEDs with a similar CCT. Figure 10 shows the spectra of the experimental measurements and simulation results at 2A. The measurement results show that the CCTs of the WLEDs are 3114 ± 27 K, 4178 ± 34 K, 5000 ± 55 K, and 6990 ± 37 K, respectively. Figure 10a shows the predicted and experimental spectra and temperature rise at 3114 K, Figure 10b shows the predicted and experimental spectra and temperature rise at 4178 K, Figure 10c shows the predicted and experimental spectra and temperature rise at 5000 K, and Figure 10d shows the predicted and experimental spectra and temperature rise at 6990 K. We conducted a correlation analysis to evaluate the similarity between the predicted and experimental spectra, aiming to test the spectral resemblance. The results revealed strong positive correlations between the predicted and experimental spectra, as indicated by high Pearson correlation coefficients of 0.99511, 0.96875, 0.9476, and 0.91305 (p < 0.0001). The Spearman correlation coefficients were also significant at 0.99277, 0.94436, 0.93312, and 0.95551 (p < 0.0001), respectively. These findings confirm that the predicted spectrum bears substantial similarity to the experimental spectrum in terms of their spectral characteristics. Furthermore, the consistent trend of spectral line variations implies a high level of agreement between the two datasets. As shown in Figure 10, despite differences in the details, the simulated spectra still represent the experimental spectra well. The lower the CCT is, the smaller the concentration of the red phosphor is. Since the conversion efficiency of red phosphors is lower than that of green phosphors, the temperature rise of the WLEDs increases slightly with the decrease in the CCT. However, in this study, the temperature rise of the dual-phosphor WLEDs is basically maintained at the same level, and the spectral shift is small.
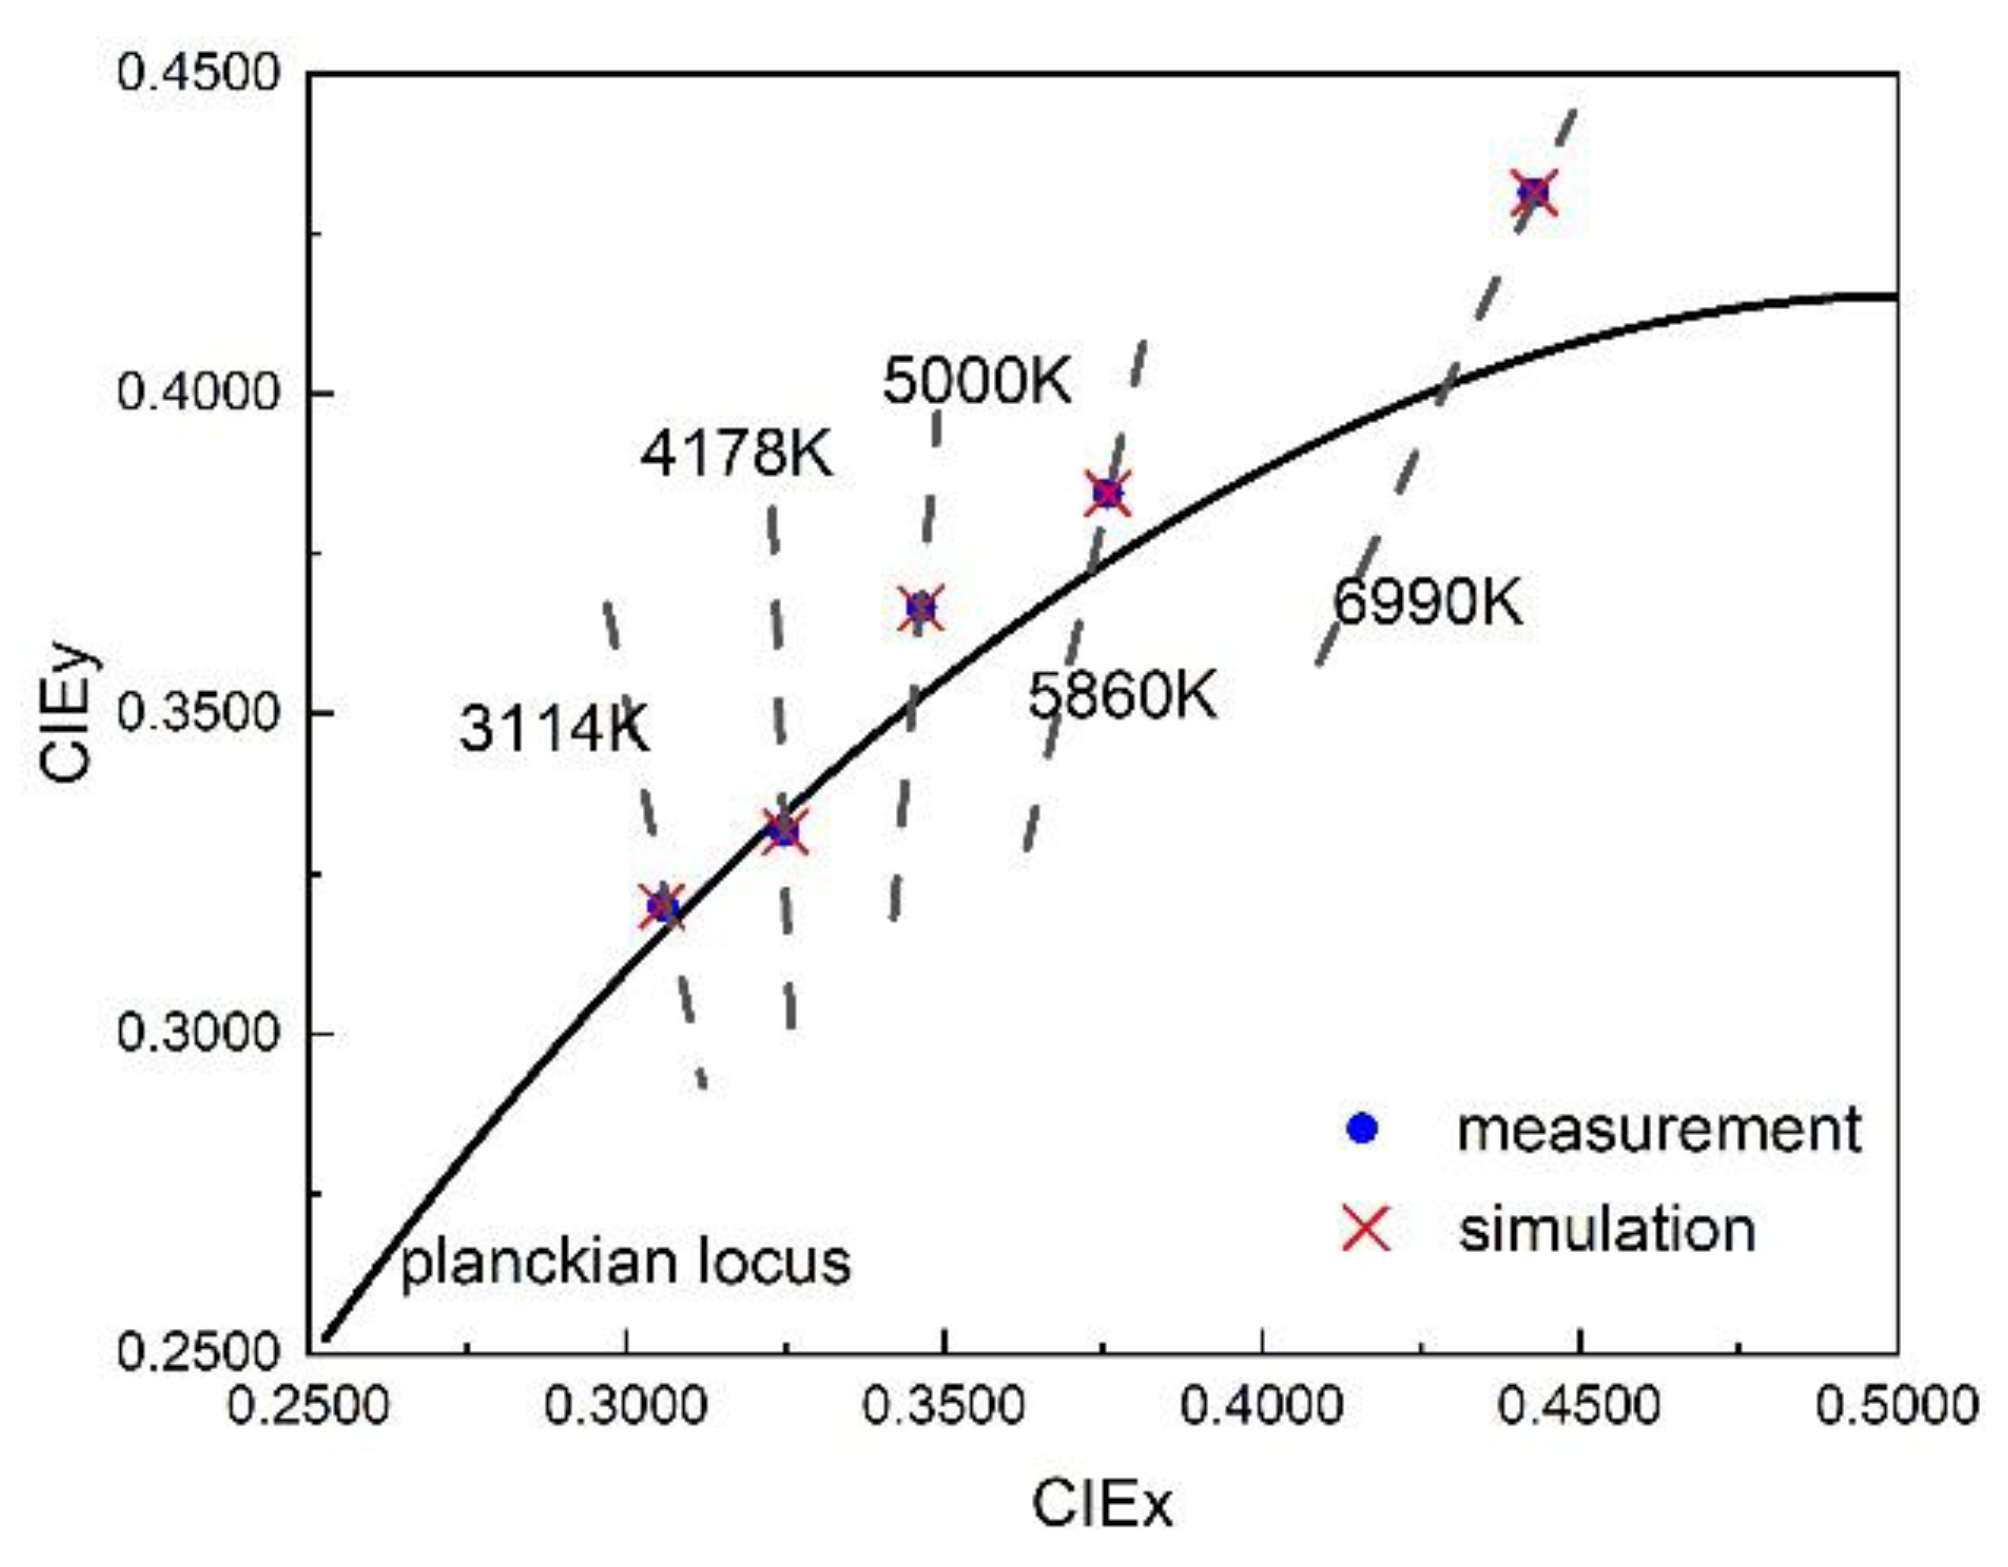
The detailed results are listed in Table 1. The results demonstrate that the simulation results provide rather good predictions, and the maximum difference of the TLCI between the measurements and the model is approximately 1.93%. To show the difference between the predicted and experimental spectra more clearly, we calculated the color coordinates of each spectrum. The color coordinates are shown in Figure 11. As shown in Figure 11, in addition to the color coordinates at 5860 K used for fitting, the color coordinates of the predicted spectrum at other color temperatures also agree well with the experimental values. The predicted spectral color coordinates almost overlap with the experimental measured spectral color coordinates, indicating that the model could predict the spectrum of dual-phosphor LEDs well.
It is interesting to note that, in Figure 9, the color coordinates with a are mainly on the left side of the Planckian locus (the green side). This is due to the poor responsivities of the green sensor defined by the TLCI [13], which means that the light source should increase the green light energy to compensate for the sensor’s response. It should be noted that the emission spectrum of the LED chip may drift or degrade over time due to prolonged usage. The interaction between the chip and phosphor can also be affected, leading to spectral variations in the emitted light. Further investigations are required to delve deeper into this. Another thing worth noting is that the model prediction without considering the absorption of blue light by silicone may deviate from the experimental values [24]. Since the color temperature of WLEDs can be changed by changing the phosphor’s thickness or the concentration ratio of the phosphors, variations in the phosphor’s thickness at different color temperatures may affect the proportion of green light reabsorbed by the red phosphor, and the red phosphor may consume different amounts of green light under different phosphor concentration ratios, which indicates the need for future studies. In this study, to reposition the CIE1931 color coordinates to be as close as possible to the Planckian locus, both green and red phosphors are required, and the proportion of reabsorbed green light by the red phosphor is assumed to be constant for simplicity. Nevertheless, high-TLCI WLEDs are successfully packaged using the model in this paper.
4. Conclusions
The spectra of most WLEDs are synthesized using chip and phosphor emission spectra, and the quality of color rendering in films and television is poor. Dual phosphors are commonly applied in WLEDs to enhance the color rendering performance, making it difficult to accurately predict the emission spectrum. In this study, a more accurate phosphor emission spectrum was obtained by subtracting the blue light spectrum from the mixed spectrum. The spectral shift under different driving currents was studied; the functional relationship between the driving current and the spectral shift was established. Then, a spectral prediction model for the WLEDs was established, and we considered reabsorption and re-emission in order to quickly model the target spectrum. In order to verify the model, dual-phosphor WLEDs with multiple CCTs were fabricated, and the experimental results were compared with the prediction results. The results show that the prediction results match the experimental results perfectly, and WLEDs with a TLCI greater than 90 at 3114 K, 4178 K, 5000 K, 5860 K, and 6990 K were successfully obtained. The maximum error of the predicted TLCI was only 1.93%. The proposed model was established and can be easily applied.
Author Contributions
Conceptualization, D.X.; data curation, H.W. and Y.S.; formal analysis, Y.S.; funding acquisition, D.X.; investigation, H.W.; methodology, H.W.; project administration, D.X.; resources, D.X.; software, H.W.; supervision, Z.J.; validation, P.W. and Z.J.; visualization, H.W.; writing—original draft, H.W. and Y.S.; writing—review and editing, P.W. All authors have read and agreed to the published version of the manuscript.
Funding
This research received no external funding.
Institutional Review Board Statement
Not applicable.
Informed Consent Statement
Not applicable.
Data Availability Statement
Data sharing is not applicable. The code is available from the corresponding author upon reasonable request.
Acknowledgments
Haiyang Wang thanks Linjie Wang for correcting this manuscript.
Conflicts of Interest
The authors declare no conflict of interest.
References
- Wang, S.; Wang, K.; Chen, F.; Liu, S. Design of primary optics for LED chip array in road lighting application. Opt. Express 2011, 19, A716–A724. [Google Scholar] [CrossRef] [PubMed]
- Lee, X.H.; Moreno, I.; Sun, C.C. High-performance LED street lighting using microlens arrays. Opt. Express 2013, 21, 10612–10621. [Google Scholar] [CrossRef] [PubMed]
- Lee, X.H.; Chang, Y.Y.; Sun, C.C. Highly energy-efficient agricultural lighting by B+ R LEDs with beam shaping using micro-lens diffuser. Opt. Commun. 2013, 291, 7–14. [Google Scholar] [CrossRef]
- Jafrancesco, D.; Mercatelli, L.; Sansoni, P.; Fontani, D.; Sani, E.; Coraggia, S.; Meucci, M.; Francini, F. Optical design of a light-emitting diode lamp for a maritime lighthouse. Appl. Opt. 2015, 54, 3252–3262. [Google Scholar] [CrossRef]
- Lee, X.H.; Yang, J.T.; Chang, J.H.; Chien, W.T.; Lo, Y.C.; Lin, C.C.; Sun, C.C. An LED-based luminaire for badminton court illumination. Light. Res. Technol. 2017, 49, 396–406. [Google Scholar] [CrossRef]
- Commission Internationale de l’Eclairage. Method of Measuring and Specifying Colour Rendering Properties of Light Sources; Technical Report CIE 13.3-1995; CIE: Vienna, Austria, 1995. [Google Scholar]
- Davis, W.; Ohno, Y. Color quality scale. Opt. Eng. 2010, 49, 033602. [Google Scholar] [CrossRef] [Green Version]
- Illuminating Engineering Society on North America. Method for Evaluating Light Source Color Rendition; IES TM-30-20; Illuminating Engineering Society: New York, NY, USA, 2020. [Google Scholar]
- DeMarsh, L.E. Color rendition in television. IEEE Trans. Consum. Electron. 1977, CE-23, 149–157. [Google Scholar] [CrossRef]
- Karaimer, H.C.; Brown, M.S. Improving color reproduction accuracy on cameras. In Proceedings of the IEEE Conference on Computer Vision and Pattern Recognition, Salt Lake City, UT, USA, 18–23 June 2018; pp. 6440–6449. [Google Scholar]
- LeGendre, C.; Lepicovsky, L.; Debevec, P. Jointly Optimizing Color Rendition and In-Camera Backgrounds in an RGB Virtual Production Stage. In The Digital Production Symposium; Association for Computing Machinery: New York, NY, USA, 2022; pp. 1–12. [Google Scholar]
- Wood, M. Television Lighting Consistency Index–TLCI. In Out of the Wood; Audible Studios: Newark, NJ, USA, 2013. [Google Scholar]
- Gardner, L. Index C. Method for the Assessment of the Cororimetric Properties of Luminaires; EBU: Geneva, Switzerland, 2012. [Google Scholar]
- Liu, H.; Lo, C.C.; Lee, S.W.R.; Zhao, H. LED Wafer Level Packaging with a Heimisphrical Waffle Pack Remote Phosphor Layer. In Proceedings of the 14th International Conference on Electronic Materials and Packaging (EMAP), Hong Kong, China, 13–16 December 2012. [Google Scholar]
- Lee, S.W.R.; Guo, X.; Niu, D.; Lo, J.C.C. Quasi-conformal phosphor dispensing on LED for white light illumination. In Proceedings of the IEEE 63rd Electronic Components and Technology Conference, Las Vegas, NV, USA, 28–31 May 2013; pp. 563–567. [Google Scholar]
- Lo, J.C.C.; Liu, H.; Lee, S.W.R.; Guo, X.; Zhao, H. Remote phosphor deposition on LED arrays with pre-encapsulated silicone lens. In Proceedings of the 2013 14th International Conference on Thermal, Mechanical and Multi-Physics Simulation and Experiments in Microelectronics and Microsystems (EuroSimE), Wroclaw, Poland, 14–17 April 2013; pp. 1–5. [Google Scholar]
- Tain, Z.; Lo, J.C.C.; Lee, S.W.R.; Yun, F.; Sun, R. Investigation of the influence of Ag reflective layer on the Correlated Color Temperature and the Angular Color Uniformity of LED with conformal phosphor coating. In Proceedings of the 16th International Conference on Electronic Packaging Technology (ICEPT), Changsha, China, 11–14 August 2015; pp. 830–834. [Google Scholar]
- Kimura, N.; Sakuma, K.; Hirafune, S.; Asano, K.; Hirosaki, N.; Xie, R.J. Extrahigh color rendering white light-emitting diode lamps using oxynitride and nitride phosphors excited by blue light-emitting diode. Appl. Phys. Lett. 2007, 90, 051109. [Google Scholar] [CrossRef]
- Wu, H.; Zhang, X.; Guo, C.; Xu, J.; Wu, M.; Su, Q. Three-band white light from InGaN-based blue LED chip precoated with green/red phosphors. IEEE Photonics Technol. Lett. 2005, 17, 1160–1162. [Google Scholar] [CrossRef]
- Chen, L.; Chu, C.I.; Liu, R.S. Improvement of emission efficiency and color rendering of high-power LED by controlling size of phosphor particles and utilization of different phosphors. Microelectron. Reliab. 2012, 52, 900–904. [Google Scholar] [CrossRef]
- Xu, J.; Chen, G. Realizing white LEDs with high luminous efficiency and high color rendering index by using double green phosphors. Results Phys. 2019, 15, 102648. [Google Scholar] [CrossRef]
- Sun, C.C.; Chen, C.Y.; Chang, J.H.; Yang, T.H.; Ji, W.S.; Jeng, Y.S.; Wu, H.M. Linear calculation model for prediction of color rendering index performance associated with correlated color temperature of white light-emitting diodes with two phosphors. Opt. Eng. 2012, 51, 054003. [Google Scholar] [CrossRef]
- Lo, J.C.C.; Lee, S.W.R.; Guo, X.; Zhao, H. Numerical prediction and experimental validation of multiple phosphor white LED spectrum. Trans. Jpn. Inst. Electron. Packag. 2016, 9, E16-005. [Google Scholar] [CrossRef]
- Ying, S.P.; Fu, H.K.; Hsieh, H.H.; Hsieh, K.Y. Color design model of high color rendering index white-light LED module. Appl. Opt. 2017, 56, 4045–4051. [Google Scholar] [CrossRef]
- He, G.; Tang, J. Spectral optimization of phosphor-coated white LEDs for color rendering and luminous efficacy. IEEE Photonics Technol. Lett. 2014, 26, 1450–1453. [Google Scholar] [CrossRef]
- He, G.; Tang, J. Spectral optimization of color temperature tunable white LEDs with excellent color rendering and luminous efficacy. Opt. Lett. 2014, 39, 5570–5573. [Google Scholar] [CrossRef]
- Zhang, F.; Xu, H.; Wang, Z. Optimizing spectral compositions of multichannel LED light sources by IES color fidelity index and luminous efficacy of radiation. Appl. Opt. 2017, 56, 1962–1971. [Google Scholar] [CrossRef] [PubMed]
- Yamada, M.; Narukawa, Y.; Mukai, T. Phosphor Free High-Luminous-Efficiency White Light-Emitting Diodes Composed of InGaN Multi-Quantum Well: Optics and Quantum Electronics. Jpn. J. Appl. Physics. 2002, 41, L246. [Google Scholar] [CrossRef]
- Hao, H.; Zhou, H.; Liang, J.; Liu, X.; Xu, B. Blue light conversion material of white LED luminous characteristics study. Spectrosc. Spectr. Anal. 2007, 27, 240–243. (In Chinese) [Google Scholar]
- Ohno, Y. Practical use and calculation of CCT and Duv. Leukos 2014, 10, 47–55. [Google Scholar] [CrossRef]
- Durmus, D. Correlated color temperature: Use and limitations. Light. Res. Technol. 2022, 54, 363–375. [Google Scholar] [CrossRef]
Figure 1.
The flowchart for establishing the model.

Figure 2.
LED ceramic substrate package. (a) The size of the LED package in dimensions of mm. (b) The LED package without phosphors. (c) Schematic diagram of LED package, where d represents the thickness of the phosphor. (d) Diagram of the experimental setup.
Figure 2.
LED ceramic substrate package. (a) The size of the LED package in dimensions of mm. (b) The LED package without phosphors. (c) Schematic diagram of LED package, where d represents the thickness of the phosphor. (d) Diagram of the experimental setup.

Figure 3.
Relative power spectrum of LED modules.

Figure 4.
Spectral shift of green phosphor spectrum in this study.

Figure 5.
Overlapping between red phosphor excitation spectrum and green phosphor emission spectrum. (Excitation spectrum is provided by Raypower Optoelectronics (Suzhou) Co., Ltd., Suzhou, China).
Figure 5.
Overlapping between red phosphor excitation spectrum and green phosphor emission spectrum. (Excitation spectrum is provided by Raypower Optoelectronics (Suzhou) Co., Ltd., Suzhou, China).

Figure 6.
Spectrum under different driving currents. (a) Spectrum of the chip. (b) Spectrum of green phosphor. (c) Spectrum of red phosphor. (d) Fitting result of the spectral shift.
Figure 6.
Spectrum under different driving currents. (a) Spectrum of the chip. (b) Spectrum of green phosphor. (c) Spectrum of red phosphor. (d) Fitting result of the spectral shift.

Figure 7.
Fitting spectra of WLEDs under different and values. (a) 1A, (b) 2A, (c) 3A, and (d) 4A.

Figure 8.
CIE1931 color coordinates under different and values.

Figure 9.
Prediction of chromatic coordinates of WLEDs with

Figure 10.
Experimental and simulated spectra and temperature rise of WLEDs. (a) 3114 K, (b) 4178 K, (c) 5000 K, and (d) for 6990 K. All spectra were measured at 2A.
Figure 10.
Experimental and simulated spectra and temperature rise of WLEDs. (a) 3114 K, (b) 4178 K, (c) 5000 K, and (d) for 6990 K. All spectra were measured at 2A.

Figure 11.
Chromatic coordinates of WLEDs in measurement and simulation experiments, where dotted lines represent isotherms of corresponding color temperatures.
Figure 11.
Chromatic coordinates of WLEDs in measurement and simulation experiments, where dotted lines represent isotherms of corresponding color temperatures.


Table 1.
Experimental and simulated results of WLEDs.
| CCT (K) | wt%g | wt%r | Exp. CIE x | Exp. CIE y | duv | Sim. CIE x | Sim. CIE y | Exp. TLCI | Sim. TLCI | TLCI Error |
|---|---|---|---|---|---|---|---|---|---|---|
| 3114 | 65.36% | 18.30% | 0.4428 | 0.4314 | 0.0097 | 0.4335 | 0.4208 | 96.76 | 95.72 | 1.07% |
| 4178 | 68.97% | 13.79% | 0.3758 | 0.3844 | 0.0049 | 0.3728 | 0.3792 | 96.91 | 96.69 | 0.23% |
| 5000 | 70.18% | 12.28% | 0.3464 | 0.3665 | 0.0068 | 0.3391 | 0.3563 | 96.30 | 95.28 | 1.06% |
| 6990 | 74.19 | 9.68% | 0.3058 | 0.3199 | 0.0021 | 0.3009 | 0.3094 | 95.49 | 93.65 | 1.93% |
Disclaimer/Publisher’s Note: The statements, opinions and data contained in all publications are solely those of the individual author(s) and contributor(s) and not of MDPI and/or the editor(s). MDPI and/or the editor(s) disclaim responsibility for any injury to people or property resulting from any ideas, methods, instructions or products referred to in the content. |
© 2023 by the authors. Licensee MDPI, Basel, Switzerland. This article is an open access article distributed under the terms and conditions of the Creative Commons Attribution (CC BY) license (https://creativecommons.org/licenses/by/4.0/).
Share and Cite
MDPI and ACS Style
Wang, H.; Wang, P.; Jin, Z.; Song, Y.; Xiong, D. Spectra Prediction for WLEDs with High TLCI. Appl. Sci. 2023, 13, 8487. https://0-doi-org.brum.beds.ac.uk/10.3390/app13148487
AMA Style
Wang H, Wang P, Jin Z, Song Y, Xiong D. Spectra Prediction for WLEDs with High TLCI. Applied Sciences. 2023; 13(14):8487. https://0-doi-org.brum.beds.ac.uk/10.3390/app13148487
Chicago/Turabian StyleWang, Haiyang, Peipei Wang, Zhiliang Jin, Yang Song, and Daxi Xiong. 2023. "Spectra Prediction for WLEDs with High TLCI" Applied Sciences 13, no. 14: 8487. https://0-doi-org.brum.beds.ac.uk/10.3390/app13148487
Note that from the first issue of 2016, this journal uses article numbers instead of page numbers. See further details here.