Article

Experimental and Numerical Study on Stress Distribution Characteristics of Traveling Wave Resonance of High-Speed Bevel Gear in Aero-Engine

1
Key Laboratory of Advanced Measurement and Test Technique for Aviation, Propulsion System, Liaoning Province, Shenyang Aerospace University, Shenyang 110136, China
2
College of Power and Energy Engineering, Harbin Engineering University, Harbin 150001, China
3
Yantai Research Institute and Graduate School of Harbin Engineering University, Yantai 264006, China
*
Author to whom correspondence should be addressed.
Submission received: 19 December 2022 / Revised: 25 January 2023 / Accepted: 26 January 2023 / Published: 31 January 2023

Abstract

:
Gear failure caused by traveling wave resonance (TWR) generally occurs quite suddenly and causes catastrophic results in aero-engines. In this study, the TWR characteristics and stress distribution characteristics of a high-speed bevel gear in an aero-engine are analyzed in detail by means of experiments and simulations. Based on the acoustic waveguide system and dynamic stress test system, the TWR fatigue failure monitoring experiment of the central drive bevel gear in an aero-engine is carried out, and the TWR frequency, dangerous speed, dynamic stress and fatigue fracture characteristics of a driven bevel gear are obtained. Based on the transient dynamic analysis method and Hertz contact theory, the stress distribution characteristics of the driven bevel gear, which cannot be obtained in the test under the condition of TWR, are analyzed. The influence of the changes in the working temperature and the thickness of the spoke on the TWR characteristics and the stress distribution characteristics are discussed. The simulation and test results show that the gear has the problem of stress concentration at the root of the tooth and the back of the spoke plate under the 4th node-diameter (ND) TWR, and the stress distribution form is consistent with the fracture form of the test gear, covering 12 teeth. The relationship between the stress at the test monitoring point and the maximum stress at the tooth root is obtained, and the generality of the relationship is verified. Based on this relationship, the maximum stress of tooth root, which is difficult to monitor in the test, is predicted to be 1271.7 MPa. An accurate and convenient means to obtain the maximum stress at the tooth root of the central transmission bevel gear under TWR is obtained so as to provide a basis for failure cause analysis and central transmission bevel gear design and lay the foundation for future research focusing on the propagation of the gear under TWR conditions.

1. Introduction

In the rotor mechanism of an aero-engine, gear drive plays an important role as its main transmission mode. The motion and power between any two axes in the space are transferred by the direct contact of the tooth profile, which has the advantages of large transmission power, stable and reliable transmission, high efficiency and long service life in the gear mechanism [1]. Due to the advantages discussed above, gear drive is widely used in the transmission systems of aero-engines. However, because of the harsh working environment of high-speed, high temperature and high alternating load, the central bevel gear has a tendency to fail due to fatigue [2,3,4]. The forms of gear failure usually include pitting erosion, tooth-breaking, plastic deformation, etc. [5,6,7,8], among which aviation bevel-gear whole-tooth fracture and block drop fault caused by the propagation of the fatigue source at the tooth root due to strong vibrational impacts caused by TWR lead to oil cut off, power cut off, surge stop and even plane crash accidents, which usually occur suddenly and have disastrous consequences. Therefore, it is the response of the gear under TWV conditions that should be studied. However, it is difficult to obtain the dynamic response of the fatigue source at the tooth root due to the working environment and the structure of the bevel gear. Therefore, in view of the above reasons, it is particularly significant and necessary to analyze the characteristics of the bevel gear in aero-engine TWR and stress distribution accurately through the combination of experiments and simulations so as to provide a theoretical basis and fault diagnosis of such accidents in aero-engine gear systems.
Some progress has been made in the theoretical research and gear dynamics in relation to gears in aero-engine TWR. Sun et al. [9] studied the vibration characteristics of rotating, cylindrical thin shells under different boundary conditions by using Fourier series expansion, taking into account the effects of centrifugal force, Coriolis force and toroidal tensor caused by rotation, and finally derived the exact frequency expression of any type of rotating thin cylinders with classical boundary conditions. Cooley et al. [10] studied the vibration mode and frequency of spur planetary gears in the single vibration mode in a rotating reference frame and a stationary reference frame. They found that the frequency content of motion was different between the rotating carrier and the base, which is helpful when analyzing the experimental measurement results of planetary gears. Wang et al. [11] used thin shell theory to analyze the frequency response of six different forms of mode expansion. He proposed a more concise and accurate mode for the expansion method of TWV and compared the results of the analytical method and numerical method to prove the reliability of the method. Hu et al. [12] studied the self-excited vibration of spur gears based on the energy method, proposed a theoretical method for predicting the occurrence of the self-excited vibration of thin spur gears and described the conditions and loads of the occurrence of the self-excited vibrations. Kaharaman et al. [13] established a three-degree-of-freedom dynamic model for a gear-rotor-bearing system, taking into account the effects of the nonlinearities associated with radial clearances in the radial rolling element bearings and backlash between a spur gear pair. Afterward, they verified this approximate bearing model by comparing the steady-state frequency spectra, a criterion used to classify the steady-state solutions was presented, and the conditions for chaotic, quasi-periodic and subharmonic steady-state solutions were determined. Raghothama et al. [14] used the incremental harmonic balance (IHB) method to investigate the periodic motions of a nonlinear geared rotor-bearing system. The periodic solutions and subharmonic solutions obtained through the use of the IHB method compared very well with those obtained through numerical integration. Parker et al. [15] considered more influencing factors, such as a series of nonlinear factors: component manufacturing error, comprehensive transmission error, wear error and tooth side clearance, to establish a spur planetary transmission dynamics model, and studied the natural vibration characteristics of a multistage planetary gear system based on the established model. Kimme Simon et al. [16] used simulation technology to undertake a detailed analysis of gear production and processing processes and studied the influence of gear meshing acoustics during gear processing. Özgüven et al. [17] established a six-degree-of-freedom nonlinear semidefinite model with time-varying mesh stiffness, which was developed for the dynamic analysis of spur gears. In the nonlinear model developed, several factors such as time-varying mesh stiffness and damping, separation of teeth, backlash, single- and double-sided impacts, various gear errors and profile modifications were considered. Numerical examples are given in order to demonstrate the effect of the shaft and bearing dynamics on the gear dynamics. Li et al. [18] proposed a new dynamic model considering the influence of time-varying mesh stiffness (TVMS), and the new model was applicable to the gear system. The result demonstrated that the amplitudes of vibration and the dynamic mesh force of the proposed model are greater than that of the traditional model.
In the experimental aspect of aero-engine gear resonance, Luan et al. [19] conducted TWR monitoring tests and fatigue performance tests on bevel gears and analyzed the dangerous speed range and sound-pressure energy of the vibration. These tests found that the harmonic frequency, forward-traveling wave (FTW) frequency, backward-traveling wave (BTW) frequency and their combination frequency appeared alternately in the noise spectrum before the gears experienced fatigue fractures. D.P. Jena et al. [20] designed active noise-cancellation technology using the least mean square (LMS) adaptive filter based on finite impulse response (FIR). They verified that acoustic signal analysis could be used as a suitable non-contact method for the precise identification of gear defects and gear health monitoring. Chen et al. [21] studied the influence of tooth-root cracks on the dynamic response of TWR. They found that the amplitude of the dynamic response in both the frequency domain and the time domain increased with crack expansion, which provided a possibility for them to be used as indicators of state monitoring and fault diagnosis in planetary gear systems. Ma et al. [22] studied the influence of the crack propagation path on time-varying meshing stiffness and vibration response. They found that at the same crack level, the influence of a rim crack on the vibration response was greater than that of a tooth surface crack. The vibration level increases with increasing crack depth. Fung et al. [23] conducted TWV tests on a large hollow shaft of a gas turbine and obtained the fourth meridian FTW frequency of the shaft through strain gauge signal analysis and inductive distance detector confidence analysis. Macke et al. [24] carried out two types of correlation analysis on the TWV of the stationary and rotating cylinder shells of a gas turbine. For stator shells surrounding rotating blades, the minimum wall-thickness criterion was proposed, and for rotor shells, the relationship between FTW and BTW was compared with the corresponding known relationship of the disk. Hu et al. [25] proposed two test methods, a noise test and a strain gauge test, to obtain the vibration characteristics of bevel gears, and the feasibility of these methods was verified. Luan et al. [26] used the derived acoustic measurement method to measure the TWV frequency and speed of the central bevel gear and verified the accuracy of the acoustic measurement method. Through their tests, they reached the conclusion that the speed of the 4th ND traveling wave is more dangerous and should be kept away from the dangerous speed of the 4th ND TWR. Xu et al. [27] conducted the TWR failure test on the central bevel gear transmission and used tests to verify the accuracy of the mode solution of plate type bevel gear considering the damping effect derived by using elastic theory. They drew the conclusion that the traveling wave resonance response curve is obtained for the row, and its amplitude and wave on the modal damping ratio, and there are multiple resonance points in the gear’s working speed range, so the resonance point of k ≤ 4 should be avoided in the gear’s regular working range.
In terms of simulation, the rotating disk was first studied [28,29,30,31,32], and Tian et al. [28] proposed an artificial damping method, which can be effectively used to identify the modal parameters of large structures and other rotating systems with relatively low excitation energy. Tobias et al. [29] studied the vibration of the rotating disk, especially vibrations in the form of standing waves. The results showed that there might be nonlinear standing waves in the rotating disk in a wide speed range, depending on the force applied. As its velocity increases, the wave eventually collapses and, in the process, becomes a traveling wave, slowly accelerating in the direction of the disk’s rotation as its amplitude drops. Southwell et al. [31] calculated the natural frequency of a disk of uniform thickness, and the study showed that when the disk rotates around its axis at any given speed, the natural frequency will increase. Honda et al. [32] analyzed the steady-state response of a stationary disk to the uniform motion of a concentrated harmonic force on a concentric circle path. The damping response of the structure in the form of a series of characteristic functions is obtained. The effect of the axisymmetric defect on modal response was discussed in detail, especially the vibration mode. The results showed that the defect has a great effect on the response near resonance but little effect on the response outside of resonance. Uppaluri et al. [33] proposed a FEM to separate TWR frequencies within the working speed range from a large number of natural frequencies of gears and analyzed the influence of centrifugal curing and structural damping on dynamic responses. Liu et al. [34] calculated the time-varying mesh stiffness (TVMS) by using the loaded tooth-contact analysis method (LTCA) and simulating the flexible gear foundation using a shell element and a Timoshenko beam element. The consequences of which demonstrate that during the operation of a spur gear system, angular misalignment produces axial excitation, which excites the nodal diameter vibration of gear foundations, and the traveling wave resonance phenomenon appears at nodal diameter vibration resonance speed. Huangfu et al. [35] established a dynamic model for a rigid–flexible coupling helical gear rotor system and analyzed the influence of centrifugal stiffening, rotational softening and the gyro effect on the dynamic characteristics of a thin-rim helical gear rotor system. Wang et al. [36] developed a dynamic analytical model by considering the sun, carrier, and planets as rigid bodies, which are coupled to an elastic continuum ring that has bending, extensional and shear deformations. Carmignani et al. [37] established a three-dimensional finite element model for bevel gears, numerically simulated the TWV characteristics of bevel gears, obtained the natural frequency mode of gears and stress distribution during TWR and evaluated the reliability of the gear structure. Talbert et al. [38] studied the influence of TWR on the load modulation of helical gear tooth surfaces and obtained the FTW resonance frequency of the gear’s 3rd ND accurately using a strain test. Feng et al. [39] used FEM to analyze the contact stress of spiral bevel gears under two different operating conditions: with and without cracks. The simulated results showed that cracks accelerate the variation in the contact stress of the meshing process of spiral bevel gears, showing that it is practicable to diagnose structural damage in spiral bevel gears according to the variation in contact stress. Although a great deal of research work has been carried out on gear dynamic responses by many scholars, the stress distribution on the tooth root at traveling wave resonant rotational speed, whose variation is caused by different factors, has not been studied yet. Sha et al. [40] studied the 4th TWR of the central bevel gear in the aero-engine by the method of combination of simulation and experiment. And the stress concentration at the root of the gear has been discovered.
In this paper, based on the traveling wave resonance response law of the central transmission bevel gear of an aero-engine, by adopting a combination of numerical simulation calculation and test analysis, the traveling wave resonance characteristics of a driven bevel gear and the stress distribution were evaluated. (I) It is the maximum stress at the tooth root that cannot be measured accurately, which was predicted after the reliability of the simulation model was verified. (II) The effects of the working temperature and web thickness on the traveling wave resonance of the central transmission bevel gear are analyzed. (III) The reason for the block-dropping fault is revealed by using the simulation results.

2. Theoretical Formulation

2.1. Modal Analysis

A multi-degree-of-freedom system vibrates at a certain natural frequency during free vibration, similar to a single-degree-of-freedom system. Unlike a single-degree-of-freedom system, a multi-degree-of-freedom system has multiple natural frequencies. Under this premise, a method is sought to decompose the free vibration into the superposition of several simple harmonic vibrations. Its kinetic equation is as follows in Equation (1) [26]:
M x ¨ t + C x ˙ t + K x t = 0
where M is the mass matrix ,   C is the damping matrix ,   K is the stiffness matrix ,   x ¨ t is the node acceleration vector ,   x ˙ t is the node velocity and x t is the node displacement vector.
At any given moment t , the equation can be regarded as a series of statics equilibrium equations taking inertial forces [ M ] x ¨ ( t ) and damping forces [ C ] x ˙ ( t ) into account. The equation of its physical meaning is as follows in Equation (2) [26]:
m × a + c × v + k × x = F t
Its derivative form is shown as follows in Equation (3) [26]:
m × d 2 x d t 2 + c × d x d t + k × x = F t
For the equation of a second-order inhomogeneous differential equation, the first step in solving this equation is to assume that F ( t ) = 0 and convert them into homogeneous second-order differential equation, whose eigenvalue and eigenvector can be solved. The eigenvalues obtained are arranged in order from small to large, which is the natural frequency of each order, and the eigenvector corresponding to the eigenvalues is the vibration mode of each order. From the solution process, it is shown that there can be no external load in the modal calculation.

2.2. Hertz Contact Theory

German physicist Heinrich Rudolf Hertz proposed the basic equations between contacts based on elasticity and derived the famous Hertz formula in 1882 [41,42]. The four assumptions of Hertz contact theory are as follows:
  • The contact area is a linear elastomer, which meets Hooke’s law.
  • The contact area is homogeneous and completely smooth, regardless of the friction between the two objects.
  • The geometrical dimension of the contact area is much smaller than the radius of curvature of the contact surface.
  • The contact surface has only vertical contact force with distributed action.
Any contact that meets the above assumptions is called a Hertz contact. When the contour of the surface near the contact surface is approximately a quadratic parabola, and the size of the contact surface is much smaller than the size of the object and the radius of the relative curvature of the surface, the results are consistent with the actual results obtained by Hertz’s theory. In the Hertz contact problem, because the deformation near the contact area is strongly constrained by the surrounding medium, each point is in a state of triaxial stress, and the distribution of contact stress is highly local and decreases rapidly with increasing distance from the contact surface. In addition, the contact stress is nonlinear to the applied pressure and is related to the elastic modulus and Poisson’s ratio of the material.
For gear meshing, the spur gear is usually in the meshing area of a single pair of teeth near the node, and the force on the teeth is large; thus, the pitting corrosion first appears near the node. Therefore, the contact fatigue strength of the node is usually calculated. For example, the contact diagram of two cylinders represents the contact of a pair of involutes spur cylindrical gears at the node. In order to simplify the calculation, it is replaced by a pair of cylinders with parallel axes. The radii ρ1 and ρ2 of the two cylinders are equal to the curvature radii of the tooth profiles at the joints, respectively. According to elasticity, when a pair of cylinders with parallel axes contact each other and are subjected to pressure, the line contact will change into a plane contact. The contact surface, where the contact stress is generated, is a long and narrow rectangle, with the maximum contact stress located on the middle line of the contact area. The equation of contact stress is shown as follows in Equation (4) [41]. The Hertz contact model is shown in Figure 1.
σ H = F n 1 ρ 1 + ¯ 1 ρ 2 π L 1 μ 1 2 E 1 + ¯ 1 μ 2 2 E 1 = Z E E n L ρ ϵ  
where σ H is the contact stress, F n is the normal force, L is the length of the contact line, ρ E is the comprehensive radius of curvature, μ 1 and μ 2 are the Poisson’s ratios of the two contact objects.

2.3. Principle of Traveling Wave Resonance

There are usually three modes of vibration for a wheel structure with a central axis and no rotation: node-circle (NC), ND and composite, as shown in Figure 2. Additionally, bevel gears are prone to ND vibrations. The ND vibration is superimposed by two cosine waves with the same shape. The one that rotates along the gear is called the forward wave, and the one that rotates against the gear is called BTW. During the propagation of ND vibration, the periodic fluctuation of each point on the wheel as the wave passes by is called TWR [3].
After any point on the spoke plate of the gear rotates θ Angle, the corresponding point phase angle on the mode expansion line of the joint diameter m rotates . Then, the vibration displacement of the corresponding point on the expansion line perpendicular to the direction of the spoke plate can be expressed as follows [19]:
y = B r cos m θ cos ω t
where y is the transverse vibration displacement of the spoke plate of the gear, in mm; B ( r ) is a function of the transverse amplitude of the gear on the radius r of the gear indexing circle, in mm. When the gear rotates relative to the coordinate system, it can be expanded in an exponential form and a triangular form, respectively, as in Equation (6) [19]:
y = 1 2 B r cos m θ e j ω t + cos m θ e j ω t y = 1 2 B r cos m θ ω t + cos m θ + ω t
t can be seen from the above formula that the nodal vibration displacement of the gear spoke plate can be decomposed into two vibrations with equal amplitude and opposite rotations. The resonant frequencies of the forward and BTWs correspond to their m-diameters, as follows [19]:
f F = f d + m n F 60 f B = f d m n B 60
where f F is the FTW resonance frequency, in Hz, f B is the BTW resonance frequency, in Hz, f D is the dynamic frequency, in Hz, of the gear pitch diameter type resonance, n F is the FTW resonant rotational speed, as r /min, and n B is the BTW resonant rotational speed, as r /min.
During the modeling of the FEM model, it is necessary to set the TWR rotational speed N of the driven bevel gear and the torque T of the gear shaft since the frequency of the excitation force is equal to the vibration frequency of the FTW and BTW of the gear. By transforming Equation (6), the expression of the rotational speed of the driving gear when the driven gear experiences TWR is as follows [19]:
  N 2 = 60 f d i × z 2 ±   m
where the FTW signal is “−”; The BTW signal is “+”; z 2 is the number of teeth of driven bevel gears; m is the number of pitch diameters; N 2 is driven bevel gear speed; i is the gear ratio; f d is the dynamic frequency of the driven bevel gear. A static frequency is used instead of a dynamic frequency in the calculation.
The formula for calculating the torque T of a driven bevel gear is as follows [19]:
T 1 = 9.55 × 10 6 P N 1
where P is the output power of the rotating shaft, in kW, which is 200 kW, and N 1 is the speed of the driving gear, as r/min.

3. Fatigue Test of High-Speed Bevel Gear in Aero-Engine

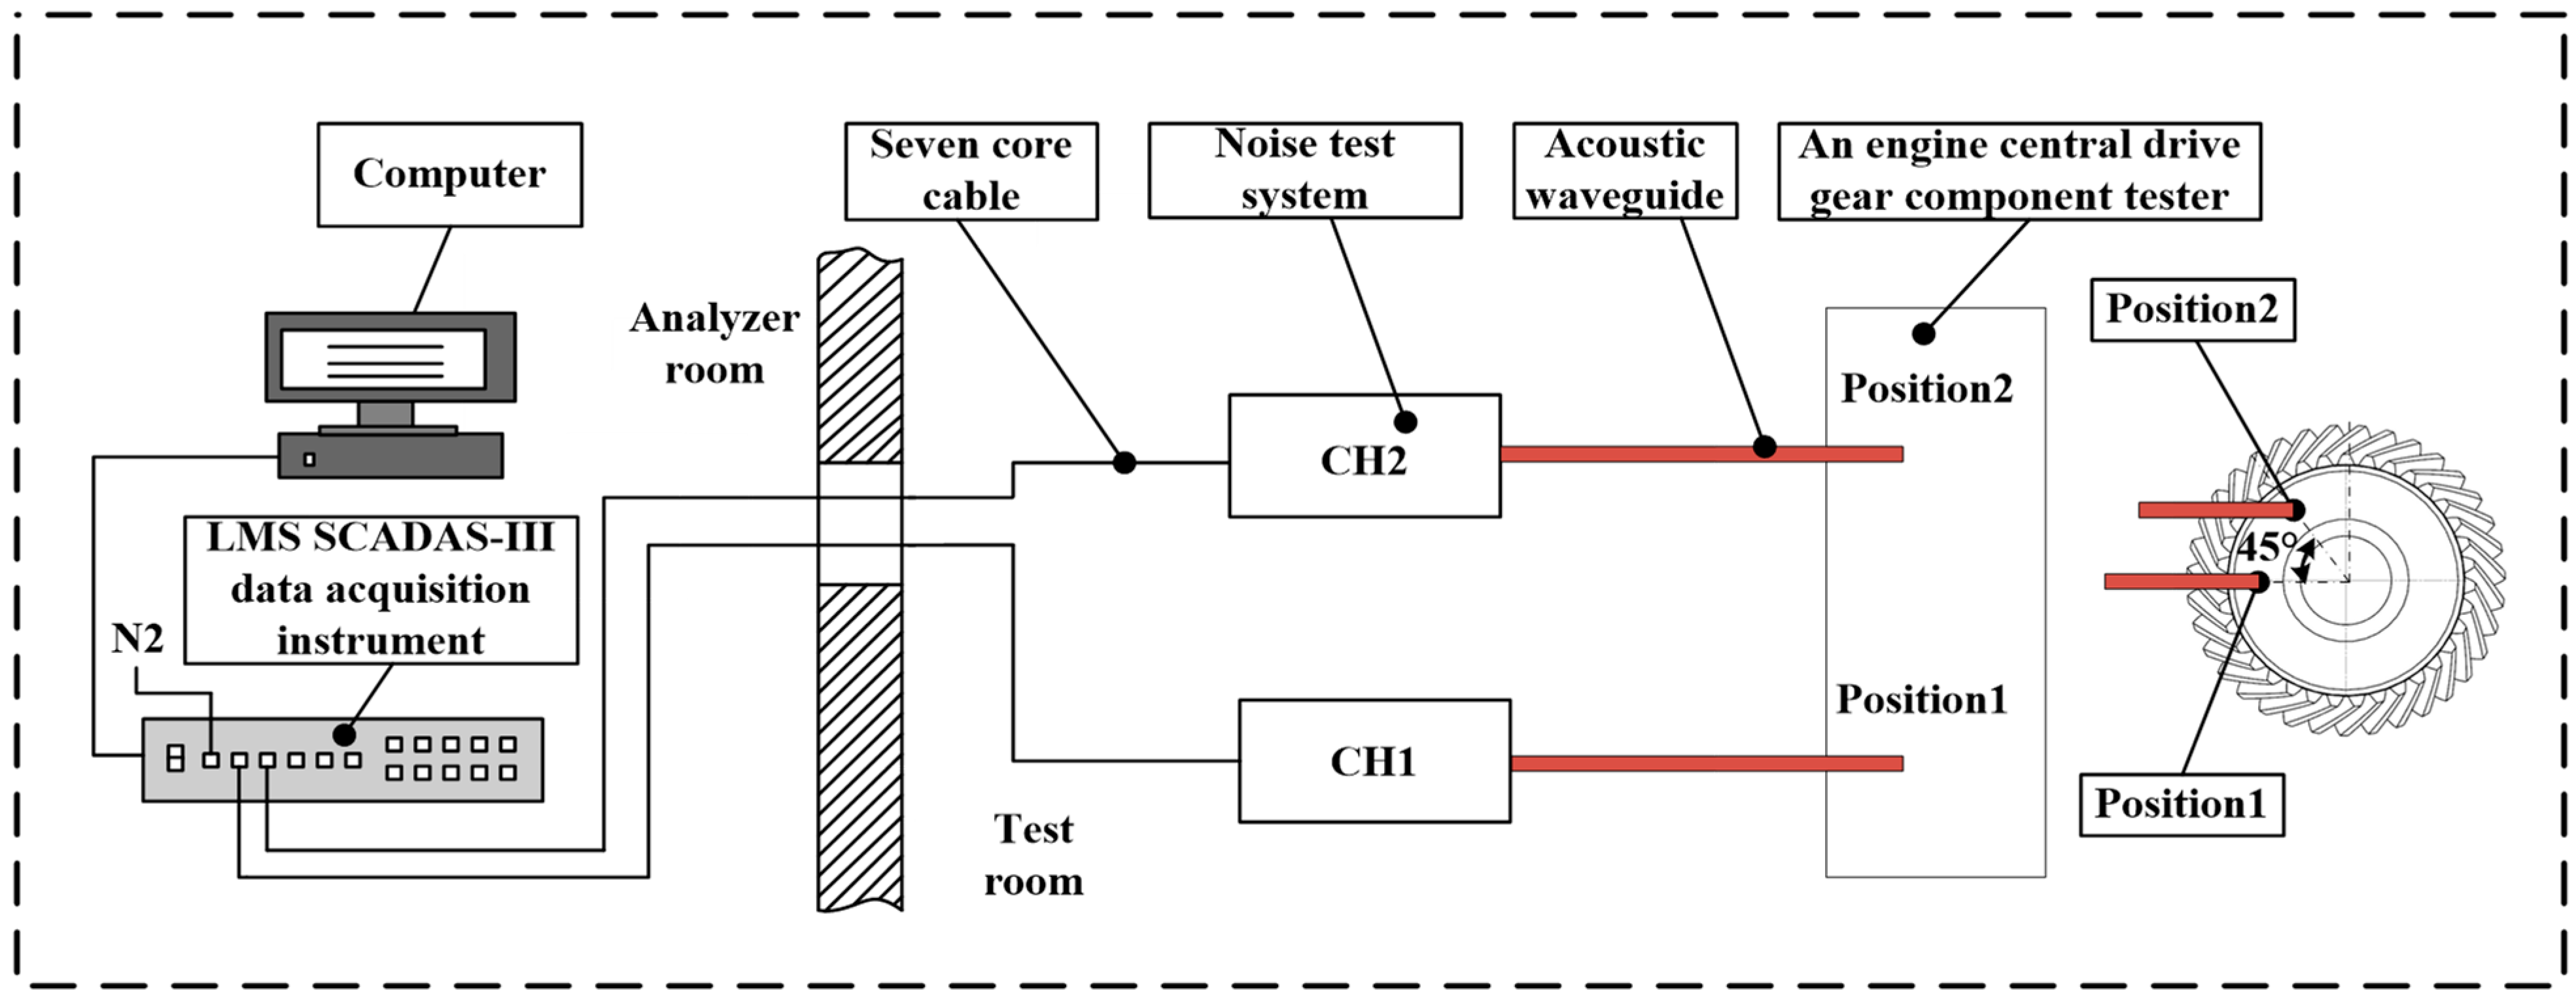
In order to reproduce the failure of a gear falling out during aero-engine use on the component tester and analyze the cause of its fracture, prefabricated defective gear C and normal gear B were selected in the test, and fatigue tests were carried out on the two kinds of gears, respectively, at the speed of 4th ND TWV to study the fatigue fracture state of the two kinds of gears. The test was divided into two processes. The first process was to observe the change of excitation frequency when the 4th ND TWV resonated near the speed of the 4th ND traveling wave pushed from the slow train. In process 2, the failure recurrence test of the gear dropped block was carried out by staying near the resonant speed of the 4th ND for a long time. The stress data, noise signal and speed signal during the test were recorded. The noise signal test system is shown in Figure 3.
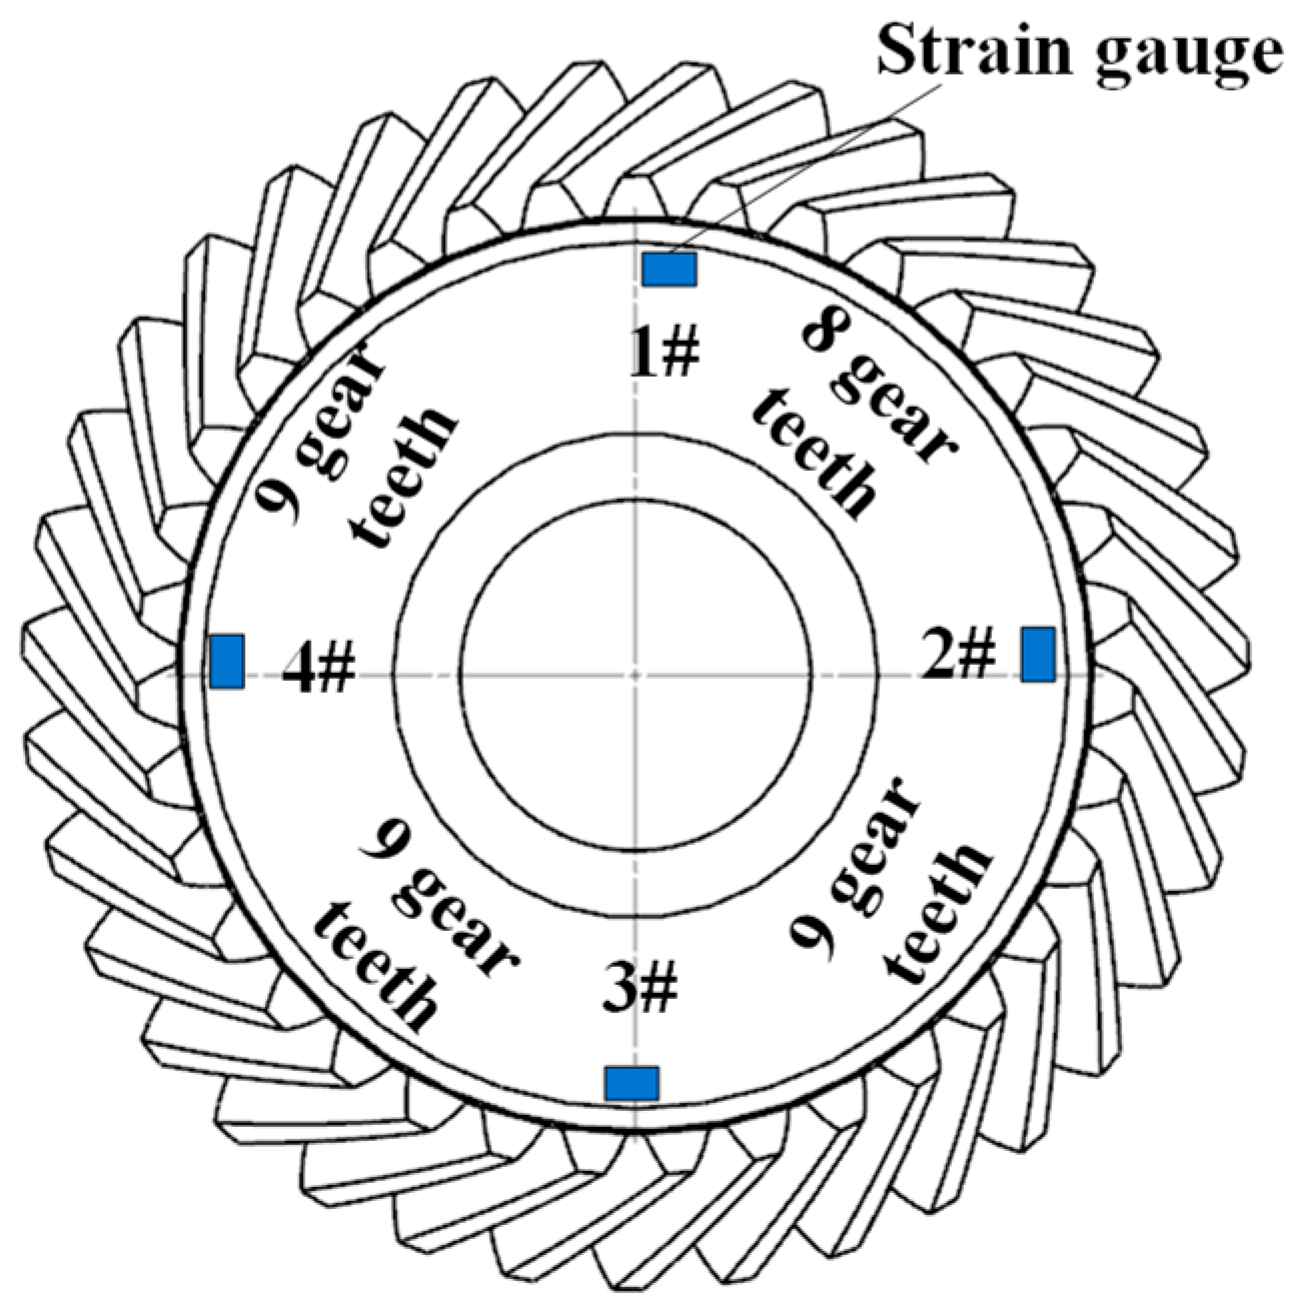
In the test, strain gauges are pasted on the surface of the small end spoke plate of the driven bevel gear close to the tooth root, and the number of strain gauges is four, numbered 1#, 2#, 3#, and 4#. Among them, there are eight teeth between measuring points 1# and 2# and nine teeth between other measuring points. The strain gauges are one centimeter from the root of the tooth. The layout of measuring points is shown in Figure 4.
To reproduce the failure of a gear falling out during engine use on a component tester and analyze the cause of its fracture, the test selected the two states of gear, one is the prefabricated defective gear, which is the defective indentation wheel of the hardness tester (an indentation pit with a diameter of about 1 mm is pressed by the hardness tester at the fillet of the tooth root at the pinion end face), and the other is the perfect normal gear without defects. The fatigue tests of the two gears were carried out, respectively, under the vibration speed of the 4th ND to study the fatigue and fracture state of the two gear wheels. The test is divided into two stages: the first stage is to push on the slow train to near the 4th ND resonant rotational speed; the second stage is to stay near the 4th ND resonant rotational speed for a long time until the tooth-breaking fault occurs, which will make a loud noise. The stress measurement system connection diagram is presented in Figure 5. The Photographic image of the test bench is shown in Figure 6.
The time-speed-sound pressure diagram of the fracture process of the prefabricated defective gear is shown in Figure 7.
The results of the fatigue test are as follows: It is shown in 
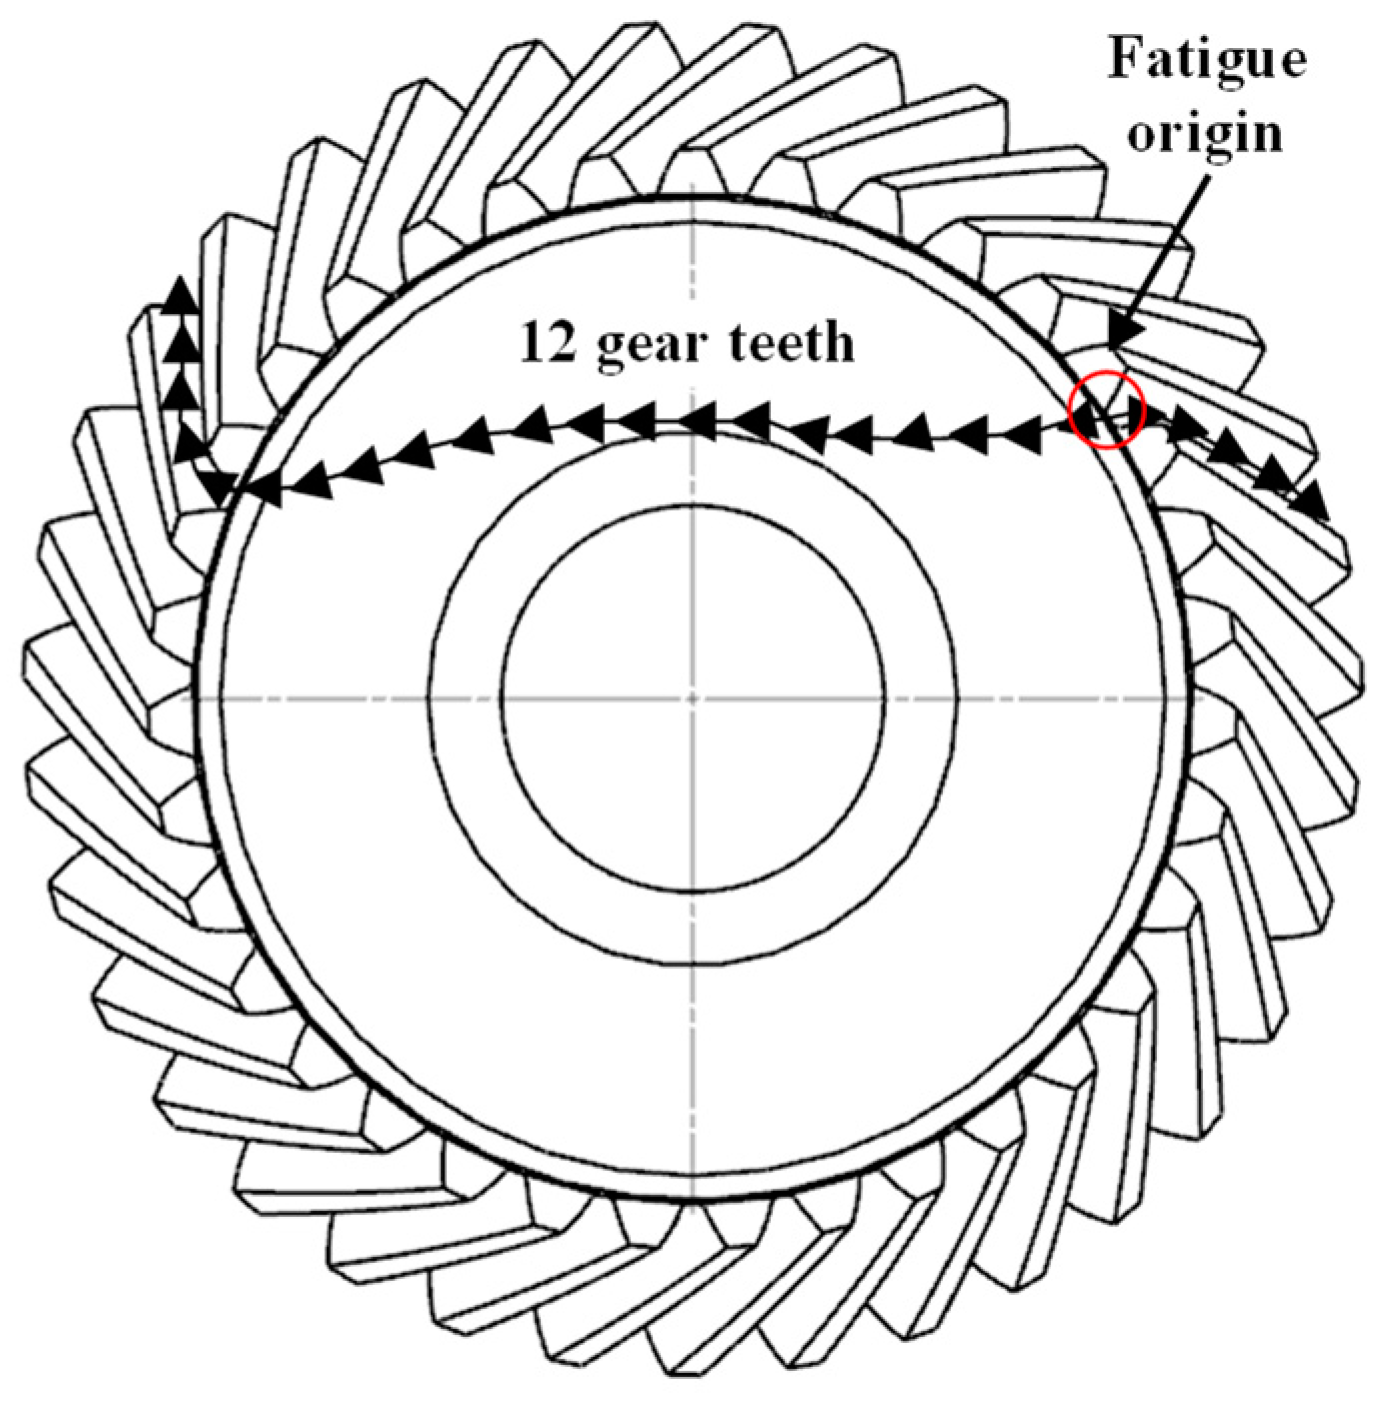
Figure 6 that when the time is 374.5 s, noise sound pressure reaches its maximum, the gear is in the 4th ND TWR, and then the resonance speed is placed under pressure, first slowly, due to the cracks in the gear at this time, so the gear stiffness decreased, leading to the 4th ND of the resonance frequency and the rotation speed change, and then the speed is reduced to find the resonance point of the 4th ND. When running for 934 s in the 4th ND resonance, the gearbox made explosive sounds, marking the occurrence of gear fatigue fracture as the pressure dropped suddenly. After the test stopped, it was found that 12 whole teeth of the driven bevel gear, one of them connected to the spoke plate, had broken. The schematic diagram of the fractured fault is shown in Figure 6. However, the new and intact gear was tested using a 4th ND TWR fatigue test, and the number of vibration fatigue cycles was over 108, and the gear was still intact. It shows that the new refined gear will not break even if it works in the resonant rotational speed range of BTW of the 4th ND, but if the gear has an initial defect and works in the resonant rotational speed range of BTW of the 4th ND, the gear will break.
The noise spectrums are shown in Figure 8. The noise spectrum of the FTW resonance of the 3rd ND is depicted in Figure 8a, the noise spectrum of the FTW resonance of the 3rd ND is shown in Figure 8b, f F 3 is the frequency of the FTW resonance of the 3rd, f B 4 is the frequency of the BTW resonance of the 4th. It is clearly demonstrated that the resonant rotational speed range of the FTW of the 3rd ND is wide, and f F 3 = 8715 Hz, N 2 = 11,126 r/min, P = 169.6 Pa, while the BTW of the 4th ND is narrow, f B 4 = 8715 Hz, N 2 = 11,126 r/min, P = 169.6 Pa.

4. Modal Analysis of Driven Gear

4.1. Establishment of 3D Model of Driven Gear

The gear material was carburized gear steel, as used in aero-engines, and its main physical parameters of driving and driven bevel gears are shown in Table 1. The parameters of the driving and driven bevel gears are shown in Table 2, and the dimension drawing of the active bevel gear and driven bevel gear is shown in Figure 9.
According to the geometric size of the gear, the engagement model of the active bevel gear and driven bevel gear was established using UG software, as shown in Figure 10.

4.2. Modal Analysis and Result Verification of Driven Teeth

Modal analysis of gears is a process of describing the dynamic characteristics of gears according to the inherent characteristics of the gear structure. Due to the fact that the driven spoke plate is prone to block-falling and fracturing in the test, research into driven bevel gears is carried out.
Modal analysis was conducted using the ANSYS Workbench, and the constraints were set as fixed constraints on the shaft, including constraints on the rolling bearings and the keys on the gears. A hexahedral mesh was divided using the mesh-division method, and the overall mesh of the driving gear model was refined to 1 mm. The number of grids obtained is 332,324, and the quality of grids is 0.8023, among which 60,432 are SOLID186 high-order units and 271,892 are SOLID187 high-order units. The FEM model is shown in Figure 11, and the constraint settings of the driven bevel gear are shown in Figure 12. A fixed constraint was applied to surface A, B, C and D.
The ambient temperature was set to 20 °C, and the first 18 modes were extracted, from which the modes of the 1st NC, 2nd ND, 3rd ND and 4th ND were selected. The static frequency of the 1st NC to the 4th ND obtained by simulation are shown in Table 3, and the mode diagram of vibration is shown in Figure 13.
From the point of view of the vibration mode, the simulation results are in accordance with the general form of the vibration mode, and the results are reliable.
The simulation values are compared with the static frequency values of the 3rd ND and 4th ND modes obtained by the test. The comparison between the simulation results and the experimental results is shown in Table 4.
The table shows that the deviation between the experimental value and the simulation value is 0.2–4.7%, indicating that the simulation analysis is reliable.

4.3. Analysis of Influencing Factors of Inherent Characteristics

In the actual process, the inherent characteristics of gears are affected by the working environment and their own structure. By changing the working temperature and spoke thickness, the driven bevel gear is simulated and analyzed.

4.3.1. Analysis of the Effect of Working Temperature on Traveling Wave Resonance

Different working temperatures were used to obtain the static frequency values of the vibration modes at 0 °C, 50 °C, 100 °C, 150 °C and 200 °C, as shown in Table 5. According to the data in the table, the static frequency variation curve of the 1st NC, 2nd ND, 3rd ND and 4th ND with temperature is drawn as shown in Figure 14.
Figure 11 shows that the static frequency value decreases with the increase in temperature, and the higher the ND number, the more obvious the change. When the temperature changes from 0 °C to 200 °C, the frequency of the 1st NC vibration mode of the gear decreases by 9 Hz, with the frequency of the 2nd ND decreasing by 43.5 Hz, the 3rd ND decreases by 123.7 Hz and the 4th ND decreases by 198 Hz, respectively.
Under actual working conditions, the gear has a 3rd ND or 4th ND of traveling wave resonance, so it is necessary to predict the resonance speed to avoid working for a long time under the resonance speed. Since there is little difference between the static frequency and the dynamic frequency, the static frequency is used instead of the dynamic frequency to predict the resonant frequency of the forward wave, the resonant frequency of the BTW and the resonant speed of the traveling wave, and the influence of the temperature on the prediction results are studied. The spoke plate thickness of 10.28 mm was taken as an example when the operating temperature is 0 °C, 50 °C, 100 °C, 150 °C and 200 °C, respectively, the predicted speed and frequency of the 3rd ND vibration mode are shown in Table 6, and the predicted speed and frequencies of the 4th ND vibration mode are shown in Table 7.

4.3.2. Effect of Spoke Plate Thickness on Travelling Wave Resonance Characteristics

In order to reduce weight and save materials, spoke plate structures are commonly used in aviation gears. The initial thickness of the spoke plate of the driven bevel gear is 17.28 mm. Because the back of the wheel is slotted, the thickness of the spoke plate of the gear model is 10.28 mm, and the fixed temperature is 20 °C. The thickness of the spoke plate was changed to 6.28 mm, 7.28 mm, 8.28 mm, 9.28 mm, 10.28 mm, 11.28 mm and 12.28 mm, which were divided by the initial thickness of the spoke plate of the driven bevel gear to obtain a dimensionless thickness and observe the influence of spoke plate thickness on the static frequency simulation value. The results are shown in Table 8. Additionally, the trend of the static frequency changing with the spoke plate thickness is shown in Figure 15.
It can be seen that as the thickness of the spoke plate increases, the static frequency of each vibration mode increases, and the higher the pitch diameter number is, the more obvious the static frequency value increases. At 20 °C, when the spoke plate thickness changes from 6.28 mm to 12.28 mm, the frequency of the 1st NC vibration mode of the gear increases by 776.3 Hz, that of the 2nd NC vibration mode of the gear increases by 1213.1 Hz, that of the 3rd NC vibration mode of the gear increases by 1079.3 Hz and that of the 4th NC vibration mode of the gear increases by 1934.5 Hz.
The working temperature was set at 20 °C, the thickness of the gear structure was 17.28 mm, and the thickness of the original model spoke plate was 10.28 mm, accounting for 59% of the total thickness of the gear structure; the spoke plate thickness was changed to 6.28 mm, 7.28 mm, 8.28 mm, 9.28 mm, 10.28 mm, 11.28 mm and 12.28 mm, respectively. The dynamic frequency is approximately equal to the static frequency, and the resonant rotational speed and resonant frequency of the BTW and FTW of the 3rd NC and 4th ND are predicted. The results are shown in Table 9 and Table 10.
Table 9 shows that when the ratio of the spoke plate thickness to the total thickness increases from 36.3% to 65.3% at a working temperature of 20 °C, the resonance frequency of the 3rd ND changes from 6885.1 Hz to 8115.5 Hz, increasing by 1127.4 Hz, and the FTW of the 3rd ND increases from 7221.6 Hz to 8452 Hz. With an increase of 1230.4 Hz, the frequency of the BTW of the 3rd ND increases from 6548.6 Hz to 7779 Hz, with an increase of 1230.4 Hz. The FTW resonant rotational speed of the 3rd ND increases from 9613.5 r/min to 11,331.5 r/min, an increase of 1722 r/min. The frequency of the BTW resonance of the 3rd ND increases from 8095.6 r/min to 9542.3 r/min, an increase of 1446.7 r/min.
As for the influence of the change in the thickness of the spoke plate on the resonance characteristics of the 4th ND shown in Table 10, when the ratio of the thickness of the spoke plate to the total thickness increases from 36.3% to 65.3%, the frequency of the FTW resonance of the 4th ND changes from 11,359.5 Hz to 13,294 Hz, an increase of 1934.5 Hz, and the frequency of the BTW resonance of the 4th ND increases from 11,696 Hz to 13,630.5 Hz. Increasing 1934.5 Hz, the static frequency of the 4th ND increases from 11,023 Hz to 12,958 Hz, increasing 1935 Hz; The resonant rotational speed of the FTW of the 4th ND increases from 16,372.6 r/min to 19,160.9 r/min and increased by 2788.23 r/min. The resonant rotational speed of the FTW of the 4th ND increases from 13,014.2 r/min to 15,230.4 r/min after four nodes, increasing by 2216.28 r/min.
From the variation of the inherent characteristics of traveling wave resonance with the thickness of the spoke plate, it can be concluded that by adjusting the thickness of the spoke plate, the resonant rotational speed of the FTW and the BTW of the 4th ND can avoid the working speed, and the working gear can avoid the resonant rotational speed of the vibration of the 4th ND.

5. Transient Dynamics Analysis of Driven Bevel Gears

5.1. Setting of FEM Model and Simulation Reliability Verification

In the Ansys Workbench transient analysis module, the tetrahedral meshing method is adopted, and the gear root and gear teeth are refined by 2 mm and the gear root teeth are refined by 1.5 mm, so that the mesh quality is above 0.7 to ensure the accuracy of the calculation results and the convergence of the results. When two separate surfaces touch and shear each other, they are said to be in contact. The surfaces in a contact state have the following characteristics: (1) they do not penetrate each other. (2) they can transmit normal pressure and tangential friction. (3) Normally, no normal tension is transferred. The above characteristics of contact allow contact surfaces to be freely separated and separated. Contact is highly nonlinear, and it is challenging to calculate convergence for dynamics problems, such as gear meshing, where stiffness changes with time. Therefore, for the augmented Lagrange method with good convergence, the friction coefficient is set as 0.05 [26]. The flow chart of the simulation calculation is shown in Figure 16.

5.1.1. Stress Comparison between Test and Simulation

Using FEM to reproduce the working state of the driven bevel gear to verify the reliability of the transient dynamic model. The thickness of the gear speak plate is 10.28 mm, the gear speed at the moment of the driven bevel gear’s 4th ND is calculated by the formula, and the torque of the driving wheel is 101.6 kN∙m. When the experimental gear is working, its surface lubricating oil temperature can reach 200 °C. It is assumed that the gear temperature is equal to the oil temperature, so the environmental temperature is set as 200 °C. The model was verified using transient dynamic analysis. The stress at the position monitored in the test was extracted from the calculation results, as shown in Figure 17. The amplitude of the equivalent stress at the position monitored in the test at the resonance rotational speed of the BTW of the 4th ND obtained from the simulations and tests is shown in Table 11.
As can be seen from the data in Table 11, the error between the simulation results and the experimental results is 1.75–7.5%. The simulation results are reliable and meet the precision requirements for engineering.

5.1.2. The Verification of the Contact Stress of Tooth Surface

In gear meshing, the stress produced includes compressive stress, bending stress, contact stress and so on. Among them, contact stress is a significant part of gear stress, which is related to gear load, tooth surface relative curvature, friction coefficient and lubrication state, so the contact stress changes with the change of meshing state and is a time-varying stress. The gear contact stress distribution obtained by FEM is analyzed to verify the reliability of FEM.
Through simulation analysis, the distribution form of contact stress on the bevel gear tooth surface at the resonant rotational speed of the BTW of the 4th ND, which is obtained by FEM, is shown in Figure 18. It is shown that the distribution of contact stress on the tooth surface of the bevel gear is elliptical, decreasing from the center to all sides, with the maximum value in the center of the ellipse, and the distribution of contact stress is the same as that in reference [41].
It is shown in Figure 18 that the gear meshing contact stress obtained using the simulation shows an elliptic distribution and has a maximum value at the geometric center of the ellipse. The distribution form of contact stress is consistent with that of tooth surface contact stress obtained in reference [41]. Therefore, FEM can obtain reliable stress distribution of driven bevel gears.

5.1.3. Gear Simulation Stress Analysis

Through simulation analysis of the stress distributions of the position monitored in the test, the stress concentration positions on the back of the spoke and the stress concentration position at the tooth root were studied. The temperature was set to 200 °C, the rotational speed was 14,399 r/min, and the resistance moment of 101.6 N∙m was calculated using Formulas (8) and (9). The gear stress distribution at the 4th ND resonant rotational speed is shown in Figure 19. The stress distribution at the 4th ND resonant rotational speed is shown in Table 12.
As can be seen from Table 12, the stress value at the position monitored in the test is 218.6 MPa at the resonant rotational speed of the BTW of the 4th ND, and the stress at the stress concentration position on the back of the spoke reaches the maximum stress of 437.4 MPa. The stress at the stress concentration position at the tooth root of the gear reaches the maximum stress of 1179.6 MPa.
In the test, the whole gear and spoke plate fracture occurred at the speed of the 4th ND; the schematic diagram of the fatigue fracture of the gear at the 4th ND resonant rotational speed is shown in Figure 20.
It can be seen from Figure 20 that the failure mode of the gear is that 12 complete teeth are connected with a block of spoke plate in order to break. The reason for the failure is inferred to be the failure mode of the bevel gear is the fatigue crack propagation of a tooth root defect under alternating load.
It can be seen from Figure 17 and Figure 19a,b that there are stress concentrations at the tooth root and the interface between the spoke plate and the axle on the back of the gear spoke plate at the speed of the 4th ND, the area of the stress distribution consists of 12 complete teeth, which is consistent with the fracture form. Therefore, it is judged that the initial root defect and stress concentration on the back of the gear spoke plate are the main causes of fatigue fracture.

5.2. The Prediction of the Max Stress at the Tooth Root

In gear meshing, the tooth root is subjected to alternating stress; therefore, crack propagation occurs at the defect of the tooth root, leading to fatigue failure. On the premise of verifying the reliability of the transient dynamics simulation results, the stress at the tooth root at the resonant rotational speed in the tests was predicted. Simulation analysis was conducted on the equivalent stress distribution of gear meshing under the resonance of the 4th ND in the test.
In actual use processes, the teeth of the bevel gear in an aero-engine are often broken due to TWR. However, it is difficult to stick the strain gauge due to the arc at the tooth root in the test, and there is a large stress gradient at the junction of the spoke plate and tooth root, so it is difficult to accurately measure the stress data at the tooth root. Through simulation analysis, it was found that the maximum stress at the tooth root is far larger than that at the position monitored in the test, and the stress gradient at the junction of the tooth root and spoke, which caused the inaccuracy of the stress at the tooth root by test. Therefore, simulation analysis can further forecast the value of the maximum stress of the tooth root in the tests.
Through the simulation analysis, it can be found that there is a certain relationship between the maximum stress at the tooth root and that at the monitoring position. The stress value at the tooth root is about 5.4 times that of the position in the test. Based on this, the maximum stress at the tooth root can be predicted. The comparison of the stress between the simulation and predication is shown in Table 13.
It can be seen from the simulation results that in the case of root defects, such as cracks and pits, crack propagation may occur at the 4th ND resonant rotational speed, resulting in tooth-breakage failure because of large root stress.

5.3. Analysis of Influencing Factors of Stress Distribution

5.3.1. Influence Analysis of Temperature Change

A gear with a spoke plate thickness of 10.28 mm and a ratio of 59.5% was selected, and the ambient temperature was set at 0 °C, 50 °C, 100 °C, 150 °C and 200 °C, respectively. The simulation analysis of the 4th ND TWV of the driven bevel gear was carried out, and the stress at the monitoring position and the stress concentration position at the tooth root was extracted. In addition, the max stress at the tooth root predicted by the stress at the monitoring position is compared with the simulation result, as shown in Table 14. The stress at the monitoring position and the maximum stress at the tooth root change with temperature; the max stress at the tooth root predicted by the stress at the monitoring position is compared with the simulation result, as shown in Figure 21.
As can be seen from Figure 18, with the increase in temperature, the maximum stress at the monitoring position and the tooth root decreased slightly, and the amplitude was not significant. As can be seen from Table 13, when the working temperature rises from 0 °C to 200 °C, the stress at the monitoring position decreases by 7.6 MPa and the max stress at the tooth root by 42.3 MPa, and the relationship between the stress at the monitoring position and that at the tooth root is still valid.

5.3.2. Analysis of Influence of Spoke Plate Thickness Change

At the working temperature of 200 °C, the thickness of the spoke plate was changed to 6.28 mm, 7.28 mm, 8.28 mm, 9.28 mm, 10.28 mm, 11.28 mm, 12.28 mm, which were divided by the initial thickness of the spoke plate of the driven bevel gear to obtain the dimensionless thickness to observe the influence of the spoke plate thickness on the stress distribution at the 4th ND resonant rotational speed. The stress at the monitoring position and the tooth root varies with the ratio of the thickness of the spoke plate and the prediction of stress at the tooth root, as shown in Figure 22.
The stress values at the monitoring position and the tooth root under different ratios of spoke plate thickness are shown in Table 15, and the max stress at the tooth root predicted by the stress at the monitoring position is compared with the simulation result.
It can be seen from Figure 19 that with the decrease in the spoke plate thickness, the stress in all parts of the gear increases. The maximum stress at the tooth root increased greater than the stress at the position monitored in the test.
As can be seen from Table 15, when the thickness of the spoke plate decreases from 12.28 mm to 6.28 mm at 200 °C, the ratio decreases from 71.1% to 36.9%, and the stress at the monitoring position increases by 109.9 MPa and the stress at the tooth root by 589.9 MPa, and the relation between the stress at the monitoring position and that at the tooth root is still valid.
It can be seen that when the spoke plate thickness is thinner, the stress concentration is more serious, and it is more likely to lead to tooth-breaking accidents. Therefore, it is necessary to consider the structural strength when changing the thickness of the spoke to avoid TWR.

6. Conclusions

In this paper, a TWR test on a bevel gear is analyzed by combining tests and simulations, and the stress distribution of the central bevel gear is predicted based on the simulation analysis, and the stress concentration problem of the tooth root and the back of the spoke caused by TWR is further expounded.
  • The fatigue test of the driven gear is performed. The time-speed-sound pressure diagram of the prefabricated gear fracture process and the max stress at the position monitored in the test and the resonance speed are obtained. The results show that the new refined gear will not break even if it works in the resonant rotational speed range of BTW of the 4th ND, but if the gear has an initial defect and works in the resonant rotational speed range of the BTW of the 4th ND, the gear will break.
  • The modal analysis of driven bevel gears is performed; in view of the TWR theory, the influence of spoke plate thickness and working temperature on the TWR characteristics of the gears are studied. Compared with the measurement results, the error between the test value and the simulation value is 0.2–4.7%. According to the results, it is verified that the characteristics of TWR are sensitive to the spoke plate thickness, and with reduced spoke plate thickness, TWR speed shows a downward trend.
  • The transient dynamic analysis of the 3rd ND and 4th ND TWR are carried out, the error between the test value and the value achieved when using the transient dynamic finite element analysis model is 1.75–7.06%. The distribution form of contact stress obtained by simulation is in accordance with the law, which verifies the accuracy of the simulation calculation.
  • Based on the simulation analysis, the maximum stress at the tooth root at the 4th ND resonant rotational speed in the test was predicted, and it was believed that the tooth root was prone to crack propagation under the action of alternating stress from the fatigue source when there was a defect in the tooth root, which was the cause of the broken tooth of the defective gear at the 4th ND resonant rotational speed in the test. The stress distribution on the tooth surface of the bevel gear at the 4th ND resonant rotational speed is obtained. It is found that there is stress concentration at the tooth root and on the back of the spoke, where the maximum stress is less than the allowable value.
  • It is found that the equivalent stress at the tooth root is 5.4 times that at the monitoring position. The distribution and change of gear stress in the resonance state under the influence of factors such as the thickness of the spoke plate and the working temperature are studied. As the working temperature increase, the stress at all position decrease. As the thickness of the spoke plate increases, the stress at the tooth root reduces, and under the above variations, the relationship between the stress at the test monitoring point and the maximum stress at the tooth root is still satisfactory.

Author Contributions

Conceptualization, X.L. and Y.G.; methodology, X.L.; software, Y.G.; validation, X.L., Y.G., Z.Z. and Y.S.; formal analysis, Y.G.; investigation, X.L.; resources, G.L.; data curation, X.L. and Y.S.; writing—original draft preparation, X.L. and Y.G.; writing—review and editing, X.L.; visualization, Z.Z.; supervision, Y.S.; project administration, G.L.; funding acquisition, G.L. All authors have read and agreed to the published version of the manuscript.

Funding

This research was funded by National Natural Science Foundation of China (NSFC), grant number 51579051; and Scientific Research Fund of the Liaoning Education Department, grant number JYT2020010.

Institutional Review Board Statement

Not applicable.

Informed Consent Statement

Informed consent was obtained from all subjects involved in the study.

Data Availability Statement

Not applicable.

Acknowledgments

The authors would like to acknowledge the financial support of the Scientific Research Fund of the Liaoning Education Department (Grant No. JYT2020010); National Natural Science Foundation of China (NSFC) (Grant No. 51579051).

Conflicts of Interest

The authors declare no conflict of interest. Funders are mainly responsible for the collection and summary of research literature.

Nomenclature

FTWForward Traveling Wave
BTWbackward-traveling wave
TWVtraveling wave vibration
TWRtraveling wave resonance
NCnode-circle
NDnode-diameter
[ M ] the mass matrix of the node
[ C ] the damping matrix of the node
[ K ] the stiffness matrix of the node
x ( t ) the displacement of the node
F ( t ) exciting force
σ H contact stress
F n normal force acting on contact surface
ρ 1 curvature radius of contacted body
ρ 2 curvature radius of contacted body
L length of contact line
μ 1 Poisson’s ratio of contacted body
μ 2 Poisson’s ratio of contacted body
Z E the elastic coefficient
ρ E comprehensive radius of curvature
y lateral displacement
B ( r ) amplitude at radius r
ω angular frequency of sector vibrations
t time
m the ND number
f d dynamic frequency of the gear
f F FTW frequency of the gear
f B BTW frequency of the gear
i the gear ratio
N 1 rotational speed of the driving gear
N 2 rotational speed of the driven gear
z 1 teeth number of the driving gear
z 2 teeth number of the driven gear
T 1 active torque acting on the driving gear
P output power of the rotating shaft
SPLsound pressure level
f 1 static frequency of the gear of the 1NC
f 2 static frequency of the gear of the 2nd ND
f 3 static frequency of the gear of the 3rd ND
f 4 static frequency of the gear of the 4th ND
f 3 F frequency of FTW resonance of the 3rd ND
f 3 B frequency of BTW resonance of the 3rd ND
f 4 F frequency of FTW resonance of the 4th ND
f 4 B frequency of BTW resonance of the 4th ND
n 3 F rotational speed of driven gear when the FTW of the 3rd ND resonance occur
n 3 B rotational speed of driven gear when the BTW of the 3rd ND resonance occur
n 4 F rotational speed of driven gear when the FTW of the 4th ND resonance occur
n 4 B rotational speed of driven gear when the BTW of the 4th ND resonance occur
σ stress

References

  1. Drago, R.J.; Brown, F.W. The Analytical and Experimental Evaluation of Resonant Response in High-Speed, Lightweight, Highly Loaded Gearing. J. Mech. Des. 1981, 103, 346–356. [Google Scholar] [CrossRef]
  2. El Yousfi, B.; Soualhi, A.; Medjaher, K.; Guillet, F. Electromechanical modeling of a motor–gearbox system for local gear tooth faults detection. Mech. Syst. Signal Process. 2022, 166, 108435. [Google Scholar] [CrossRef]
  3. Zhao, Z.; Han, H.; Wang, P.; Ma, H.; Zhang, S.; Yang, Y. An improved model for meshing characteristics analysis of spur gears considering fractal surface contact and friction. Mech. Mach. Theory 2021, 158, 104219. [Google Scholar] [CrossRef]
  4. Joshi, H.D.; Kothari, K.D. Mode and cause of failure of a bevel gear-a review. Int. J. Adv. Eng. Res. Dev. 2014, 1, 2348–4470. [Google Scholar]
  5. Fernandes, P. Tooth bending fatigue failures in gears. Eng. Fail. Anal. 1996, 3, 219–225. [Google Scholar] [CrossRef]
  6. Siddiqui, N.A.; Deen, K.; Khan, M.Z.; Ahmad, R. Investigating the failure of bevel gears in an aircraft engine. Case Stud. Eng. Fail. Anal. 2013, 1, 24–31. [Google Scholar] [CrossRef] [Green Version]
  7. Wu, X.; Luo, Y.; Li, Q.; Shi, J. A new analytical model for evaluating the time-varying mesh stiffness of helical gears in healthy and spalling cases. Eng. Fail. Anal. 2022, 131, 105842. [Google Scholar] [CrossRef]
  8. Huangfu, Y.; Dong, X.; Chen, K.; Tu, G.; Long, X.; Peng, Z. A tribo-dynamic based pitting evolution model of planetary gear sets: A topographical updating approach. Int. J. Mech. Sci. 2022, 220, 107157. [Google Scholar] [CrossRef]
  9. Sun, S.; Chu, S.; Cao, D. Vibration characteristics of thin rotating cylindrical shells with various boundary conditions. J. Sound Vib. 2012, 331, 4170–4186. [Google Scholar] [CrossRef]
  10. Cooley, C.G.; Parker, R.G. The geometry and frequency content of planetary gear single-mode vibration. Mech. Syst. Signal Process. 2013, 40, 91–104. [Google Scholar] [CrossRef]
  11. Wang, Y.; Guo, X.; Li, Y.; Li, J. Nonlinear traveling wave vibration of a circular cylindrical shell subjected to a moving concentrated harmonic force. J. Sound Vib. 2010, 329, 338–352. [Google Scholar] [CrossRef]
  12. Hu, G.A.; He, L.H.; Wu, G.J.; Wu, C.Y.; Liu, C. Self-excited vibration prediction of thin spur gear based on energy method. J. Aerosp. Power 2016, 31, 241–248. [Google Scholar] [CrossRef]
  13. Kahraman, A.; Singh, R. Non-linear dynamics of a geared rotor-bearing system with multiple clearances. J. Sound Vib. 1991, 144, 469–506. [Google Scholar] [CrossRef]
  14. Raghothama, A.; Narayanan, S. Bifurcation and chaos in geared rotor bearing system by incremental harmonic balance method. J. Sound Vib. 1999, 226, 469–492. [Google Scholar] [CrossRef]
  15. Parker, R.G.; Vijayakar, S.M.; Imajo, T. Non-linear dynamic response of a spur gear pair: Modelling and experimental comparisons. J. Sound Vib. 2000, 237, 435–455. [Google Scholar] [CrossRef] [Green Version]
  16. Kimme, S.; Bauer, R.; Drossel, W.-G.; Putz, M. Simulation of Error-Prone Continuous Generating Production Processes of Helical Gears and the Influence on the Vibration Excitation in Gear Mesh. Procedia CIRP 2017, 62, 256–261. [Google Scholar] [CrossRef]
  17. Özgüven, H. A non-linear mathematical model for dynamic analysis of spur gears including shaft and bearing dynamics. J. Sound Vib. 1991, 145, 239–260. [Google Scholar] [CrossRef]
  18. Li, H.; Chen, S.; Tang, J.; Sun, Z.; Hu, Y. Nonlinear dynamic modeling and analysis of spur gear based on gear compatibility conditions. Mech. Mach. Theory 2022, 171, 104767. [Google Scholar] [CrossRef]
  19. Luan, X.; Liu, G.; Sha, Y.; He, H.; Guo, X. Experiment study on traveling wave resonance of fatigue fracture of high-speed bevel gear in aero-engine based on acoustic measurement method. J. Sound Vib. 2021, 511, 116345. [Google Scholar] [CrossRef]
  20. Jena, D.; Sahoo, S.; Panigrahi, S. Gear fault diagnosis using active noise cancellation and adaptive wavelet transform. Measurement 2014, 47, 356–372. [Google Scholar] [CrossRef]
  21. Chen, Z.; Shao, Y. Dynamic simulation of planetary gear with tooth root crack in ring gear. Eng. Fail. Anal. 2013, 31, 8–18. [Google Scholar] [CrossRef]
  22. Ma, H.; Pang, X.; Zeng, J.; Wang, Q.; Wen, B. Effects of gear crack propagation paths on vibration responses of the perforated gear system. Mech. Syst. Signal Process. 2015, 62–63, 113–128. [Google Scholar] [CrossRef]
  23. Fung, Y.C.; Sechler, E.E.; Kaplan, A. On the vibration of thin cylindrical shells under internal pressure. J. Aeronaut. Sci. 1957, 24, 650–660. [Google Scholar] [CrossRef]
  24. Macke, H.J. Traveling-Wave Vibration of Gas-Turbine Engine Shells. J. Eng. Power 1966, 88, 179–187. [Google Scholar] [CrossRef]
  25. Hu, G.-A.; He, L.-H.; Wu, G.-J.; Wu, C.-Y.; Liu, C. Acoustic noise and dynamic stress experimental study on travelling wave vibration of high-speed bevel gear in aero-engine. J. Propuls. Technol. 2019, 40, 166–174. [Google Scholar] [CrossRef]
  26. Luan, X.C.; Liu, G.M.; Sha, Y.D.; Guo, X.P. Experimental study on accurate identification of traveling wave resonance characteristics of central transmission bevel gear. J. Propuls. Technol. 2020, 41, 2840–2847. [Google Scholar] [CrossRef]
  27. Xu, E.J.; Liang, S.C.; Chang, C.J.; Shen, B.Y. Experimental study on resonance failure of central transmission bevel gear. J. Aerosp. Power 1998, 3, 193–198. [Google Scholar] [CrossRef]
  28. Tian, J.; Hutton, S.G. Traveling-Wave Modal Identification Based on Forced or Self-Excited Resonance for Rotating Discs. J. Vib. Control. 2001, 7, 3–18. [Google Scholar] [CrossRef]
  29. Tobias, S.A.; Arnold, R.N. The Influence of Dynamical Imperfection on the Vibration of Rotating Disks. Proc. Inst. Mech. Eng. 1957, 171, 669–690. [Google Scholar] [CrossRef]
  30. Radcliffe, C.J.; Mote, C.D. Identification and Control of Rotating Disk Vibration. J. Dyn. Syst. Meas. Control. 1983, 105, 39–45. [Google Scholar] [CrossRef]
  31. Southwell, R.V. On the free transverse vibrations of a uniform circular disc clamped at its centre; and on the effects of rotation. Proc. R. Soc. A 1922, 101, 133–153. [Google Scholar] [CrossRef]
  32. Honda, Y.; Matsuhisa, H.; Sato, S. Modal response of a disk to a moving concentrated harmonic force. J. Sound Vib. 1985, 102, 457–472. [Google Scholar] [CrossRef]
  33. Uppaluri, B.; Douglass, B. A validated finite element frequency response criterion for resonant-free gear design of the V-22 tiltrotor aircraft. In Proceedings of the 27th Joint Propulsion Conference, Sacramento, CA, USA, 24–26 June 1991. [Google Scholar] [CrossRef]
  34. Liu, Z.; Huangfu, Y.; Ma, H.; Peng, Z.; Zhu, J.; Wang, H.; Li, Z. Traveling wave resonance analysis of flexible spur gear system with angular misalignment. Int. J. Mech. Sci. 2022, 232, 107617. [Google Scholar] [CrossRef]
  35. Huangfu, Y.; Zeng, J.; Ma, H.; Dong, X.; Han, H.; Zhao, Z. A flexible-helical-geared rotor dynamic model based on hybrid beam-shell elements. J. Sound Vib. 2021, 511, 116361. [Google Scholar] [CrossRef]
  36. Wang, C.; Parker, R.G. Dynamic modeling and mesh phasing-based spectral analysis of quasi-static deformations of spinning planetary gears with a deformable ring. Mech. Syst. Signal Process. 2020, 136, 106497. [Google Scholar] [CrossRef]
  37. Carmignani, C.; Forte, P.; Melani, G.; Di Carlo, G. Numerical Investigation on Traveling Wave Vibration of Bevel Gears. In Proceedings of the 10th International Power Transmission and Gearing Conference, Las Vegas, NV, USA, 4–7 September 2007. [Google Scholar] [CrossRef]
  38. Talbert, P.B.; Gockel, R.R. Modulation of Gear Tooth Loading Due to Traveling Wave Vibration. In Proceedings of the ASME 2003 International Design Engineering Technical Conferences and Computers and Information in Engineering Conference, Chicago, IL, USA, 2–6 September 2003; pp. 223–230. [Google Scholar] [CrossRef]
  39. Feng, G.; Li, Y.B.; Gao, H.N.; Duan, Z.W. Research on the effect of crack on contact stress of spiral bevel gears. J. Mech. Strength 2014, 36, 631–635. [Google Scholar] [CrossRef]
  40. Luan, X.C.; Sha, Y.D.; Guo, X.P.; Liao, Y.N.; Zhao, F.T.; Liu, X. Transient dynamics analysis and experimental research of high-speed bevel gear in aero-engine. J. Propuls. Technol. 2019, 40, 2806–2815. [Google Scholar] [CrossRef]
  41. Zhou, C.; Li, Z.; Hu, B.; Zhan, H.; Han, X. Analytical solution to bending and contact strength of spiral bevel gears in consideration of friction. Int. J. Mech. Sci. 2017, 128–129, 475–485. [Google Scholar] [CrossRef]
  42. Vivet, M.; Mundo, D.; Tamarozzi, T.; Desmet, W. An analytical model for accurate and numerically efficient tooth contact analysis under load, applied to face-milled spiral bevel gears. Mech. Mach. Theory 2018, 130, 137–156. [Google Scholar] [CrossRef]
Figure 1. Hertz contact model.
Applsci 13 01814 g001
Figure 2. Vibration modes of disc structure: (a) 1st NC; (b) 2nd ND; (c) 1st NC and 3rd ND.
Applsci 13 01814 g002
Figure 3. Connection diagram of acoustic waveguide system.
Applsci 13 01814 g003
Figure 4. Diagram of strain gauge patch position.
Applsci 13 01814 g004
Figure 5. Stress measuring point layout and measurement system.
Applsci 13 01814 g005
Figure 6. Photographic image of the test bench.
Applsci 13 01814 g006
Figure 7. Time-speed-sound pressure diagram of prefabricated gear fracture process.
Applsci 13 01814 g007
Figure 8. Noise spectrum of traveling wave resonance: (a) FTW of the 3rd ND; (b) BTW of the 4th ND.
Applsci 13 01814 g008
Figure 9. Two-dimensional model of gear mesh. (a) driven gear; (b) driving gear.
Applsci 13 01814 g009
Figure 10. Geometric model of gear mesh.
Applsci 13 01814 g010
Figure 11. FEM model of bevel gear.
Applsci 13 01814 g011
Figure 12. Constraint setting of driven bevel gear. (a) constraint diagram; (b) constraints in FEM model.
Applsci 13 01814 g012
Figure 13. Vibration mode of bevel driven gear: (a) 1st; (b) 2nd; (c) 3rd; (d) 4th.
Applsci 13 01814 g013
Figure 14. TWR characteristics of gears with different vibration mode at different temperatures.
Applsci 13 01814 g014
Figure 15. TWR characteristics of gears with different vibration mode at different thickness of spoke plate.
Applsci 13 01814 g015
Figure 16. Technical process of gear dynamics simulation.
Applsci 13 01814 g016
Figure 17. Equivalent stress at the position monitored in the test at 4th ND rotational speed.
Applsci 13 01814 g017
Figure 18. Contact stress of the surface of driven bevel gear at 4th ND rotation speed.
Applsci 13 01814 g018
Figure 19. Spoke equivalent stress of driven bevel gear at the 4th ND resonant rotational speed: (a) The stress concentration position on the back of the spoke plate; (b) The stress concentration position at the tooth root.
Applsci 13 01814 g019
Figure 20. Schematic diagram of rupture failure of driven bevel gear.
Applsci 13 01814 g020
Figure 21. The influence of temperature changes on gear stress.
Applsci 13 01814 g021
Figure 22. The influence of thickness of spoke plate changes on gear stress.
Applsci 13 01814 g022
Table 1. Physical parameters of gears.
T/°CE/GPa μ ρ/(kg/m3)
202150.387.86 × 103
1002130.39
2002100.41
Table 2. Geometric parameters of gears.
ParametersDrivingDriven
Teeth3547
Reference circle/mm135.625182.175
Tooth thickness/mm21.06420.940
Module3.875
Addendum coefficient0.85
Top clearance coefficient0.188
Normal angle/(°)20
Spiral angle/(°)35
Table 3. Static frequency of vibration mode.
Vibration ModeFirstSecondThirdFourth
Frequency/Hz34744509798612,783
Table 4. Comparison of static frequency simulation and test results.
Vibration ModeFrequency Test Results/HzSimulation Results/HzRelative Error/%
Third796479860.2
Fourth13,42012,7834.7
Table 5. Static frequency of vibration mode in different temperatures.
T f 1 / H z f 2 / H z f 3 / H z f 4 / H z
03473 4509 7995 12,766
503471 4501 7977 12,738
1003467 4488 7948 12,690
1503466 4471 7909 12,629
2003464 4456 7872 12,568
Table 6. TWR speed and frequencies of 3rd predicted by static frequency in different temperatures.
T/°C f 3 f / H z f 3 b / H z f 3 / H z n 3 F / r / m i n   n 3 B / r / m i n  
079958332765911,1649401
5079778314764111,1399380
10079488284761111,0979345
15079098246757311,0449300
20078728208753510,9919255
Table 7. TWR speed and frequencies of 4th predicted by static frequency in different temperatures.
T/°C f 4 f / H z f 4 b / H z f 4 / H z n 4 F / r / m i n n 4 B / r / m i n
012,76615,44512,32518,40014,626
5012,73815,41712,29718,35914,593
10012,69015,36912,24918,29014,539
15012,62915,30812,18818,20214,469
20012,56815,24712,12718,11514,399
Table 8. TWR characteristics of gears with different vibration at different thickness of spoke plate.
Thickness/% f 1 / H z f 2 / H z f 3 / H z f 4 / H z
36.3%27473565688511,360
42.1%28923767697011,599
47.9%30333972716811,866
53.7%31674176736612,165
59.5%32934378782712,500
65.3%34124580811612,876
71.1%35234779796413,294
Table 9. The change of 3rd ND TWR speed at different thickness of spoke plate.
Thickness/% f 3 f / H z f 3 b / H z f 3 / H z n 3 F / r / m i n   n 3 B / r / m i n  
36.3%68857222654996148096
42.1%69707307663497328195
47.9%71687504683110,0088428
53.7%73667703703010,2858661
59.5%78278163749010,9289203
65.3%79648301762811,1209364
71.1%81168452777911,3329542
Table 10. The change of the 4th ND TWR speed at different thickness of spoke plate.
Thickness/% f 4 f / H z f 4 b / H z f 4 / H z n 4 F / r / m i n n 4 B / r / m i n
36.3%11,36011,69611,02316,37313,014
42.1%11,59911,93611,26316,71813,289
47.9%11,86612,20311,53017,10313,594
53.7%12,16512,50211,82917,53413,937
59.5%12,50012,83712,16418,01714,321
65.3%12,87613,21312,54018,55814,752
71.1%13,29413,63112,95819,16115,230
Table 11. Comparison of stress simulation and test results.
Vibration ModeSimulation Results/MPaTest Results/MPaRelative Error/%
4th218.6235.57.5
214.11.75
Table 12. Different positions equivalent stress of driven bevel gear at the 4th ND resonant rotational speed.
Vibration ModePositionSimulation Results/MPa
4thmonitoring position218.6
back of the spoke437.4
tooth root1179.6
Table 13. Comparison of stress simulation and test results.
PositionTest Results/MPaSimulation Results/MPa
monitoring position235.5218.6
tooth root1271.7 (predict)1179.6
Table 14. Stress at the monitoring position and the tooth root at 4th ND resonant rotational speed at different temperatures.
T/°CMax Stress at Monitoring Position/MPaMax Stress at the Tooth Root (Simulation)/MPaMax Stress at the Tooth Root (Predict)/MPa
0226.21221.71221.5
50221.31194.51195.2
100220.41189.41190.2
150219.31184.41184.2
200218.61179.41180.4
Table 15. Max stress at the monitoring position and the back of the spoke at 4th ND resonant rotational speed at different thickness of spoke plate.
Thickness/%Max Stress at Monitoring Position/MPaMax Stress at the Tooth Root (Simulation)/MPaMax Stress at the Tooth Root (Predict)/MPa
36.3%293.21582.21583
42.1%274.51481.41482.4
47.9%255.51379.31379.6
53.7%237.71280.21283.7
59.5%218.61179.51180.4
65.3%200.41081.61082.2
71.1%183.3992.3990.2
Disclaimer/Publisher’s Note: The statements, opinions and data contained in all publications are solely those of the individual author(s) and contributor(s) and not of MDPI and/or the editor(s). MDPI and/or the editor(s) disclaim responsibility for any injury to people or property resulting from any ideas, methods, instructions or products referred to in the content.

